Abstract
Soil moisture and temperature are both significant factors for crop growth and development. They are also the main influencing factors of regional climate change. In the context of climate change, the relationship between soil moisture and soil temperature is not only important for explaining the mechanism of moisture and temperature interaction, but also provides scientific suggestions for agricultural production. Since the accurate measurement of soil moisture and temperature is difficult, their relationship remains poorly understood. Here, based on real-time field observation in a potato field in Wuchuan County, Inner Mongolia, China, the change characteristics of soil moisture and temperature under different water level treatments were analyzed, and their relationships were disclosed. The results show that there was an inverse proportional relationship between soil moisture and temperature. With an increase of soil moisture, soil temperature decreased. The basic relation between soil moisture and temperature took the form of reciprocal functions (Q = 4.2 × 103 V × (0.2 + W) × ΔT). The decline of soil moisture in the farmland will increase the soil temperature and has a negative impact on land–atmosphere interactions. The results can provide important insight into regional climate change mechanisms.
1. Introduction
Soil moisture and temperature are the two most important variables for crop growth, development and yield formation, and their properties directly influence the relationship between soil and plant and determine the hydrological and biogeochemical processes occurring in soils [1,2]. The effects of soil moisture and temperature on farmland ecosystems are important parts of research related to farmland microclimate [3,4], surface material migration [5,6,7] and energy conversion [8]. Soil temperature directly affects the maintenance and movement of water and gas [9] in soil and has a regular correspondence with crop growth functions such as root function and photosynthesis [10]. Soil temperature anomalies will seriously affect crop growth and development. While soil moisture is not only a determinant of vegetation and ecosystem zonal, but also an important part of water cycles in terrestrial ecosystems and the basis for terrestrial plant survival.
Soil–climate interaction is a significant issue, especially in the context of climate change. The variation of soil moisture and temperature is an important factor leading to the amplification or attenuation of climate change. Therefore, many scholars pay close attention to the relationship between water and heat in soil and soil-atmosphere [11,12,13,14]. Soil moisture can drive surface temperature change by influencing the partitioning of the available surface net radiation into the latent heat flux and sensible heat flux [8]. Given sufficient soil moisture, latent heat is limited by radiation; on the contrary, latent heat is limited by the soil moisture availability under drought conditions. In this case, soil moisture deficit tends to decrease latent heat and hence increase sensible heat and consequently increase surface air temperature [8]. Indications are that the drying trends of soil may lead to changes in temperature [2,11,15] and precipitation [16,17,18], thereby aggravating soil drought and causing heat wave. Amani et al. [2] believed that in general, as soil moisture decrease and the land surface temperature increases, the dryness will be more severe. And some studies have suggested that an important contributor to the formation of heat waves is land–atmosphere feedback, which is dependent on the soil moisture (e.g., [19]), and the feedback of soil moisture to the atmosphere [20]. For example, Fischer et al. [21] pointed out that spring soil moisture is an important parameter for the evolution of European heat waves in 2003, without soil moisture anomalies the summer heat anomalies could have been reduced by around 40% in some regions.
The research above described the phenomena that the interactions exits between soil moisture and temperature, but did not reveal the quantitative relationship between them. Because there are various factors influencing the soil moisture and temperature, the accurate measurement of soil moisture and temperature is difficult [22], the relationship between soil moisture and temperature has not been well studied so far. The IPCC (Intergovernmental Panel on Climate Change) indicated that each of the last three decades has been successively warmer at the earth’s surface than any preceding decade since 1850 [23]. Therefore, the interaction between soil moisture and temperature is a scientific issue to be answered to explore the mechanisms of regional climate change. In recent research, many scholars have studied the effects of soil moisture on soil–climate interactions and climate change [11,13,24,25,26], however, the studies quantifying the effects of soil moisture on soil temperature and calculating their relationships are relatively lacking. Moreover, the interaction mechanisms between soil moisture and temperature in land–atmosphere remain poorly understood. Therefore, the research on soil hydrothermal processes is significant for climate change and can provide useful insight for sustainable agricultural development.
Based on the in situ soil moisture and temperature data measured in Wuchuan County, Inner Mongolia, China, this study aims to analyze the change characteristics of soil moisture and temperature, disclose the interaction between them, and evaluate the effects of soil water content change on soil temperature, agricultural production and climate change.
2. Materials and Methods
2.1. Study Area
Wuchuan County (40°47′ N–41°23′ N, 110°31′ E–111°53′ E) lies in the middle of Inner Mongolia, China (Figure 1), where the average annual mean temperature and precipitation are about 3.1 °C and 344 mm, respectively. The annual accumulative temperature above 0 °C is about 2578 °C·day, and the average number of frost-free days is about 124 [27]. The soil type is mainly chestnut with high sediment concentrations in the arable layer [28]. The rain-fed farming with a single mature season per year is the main farming practice [27] and potato is the major staple crop planted in this area.
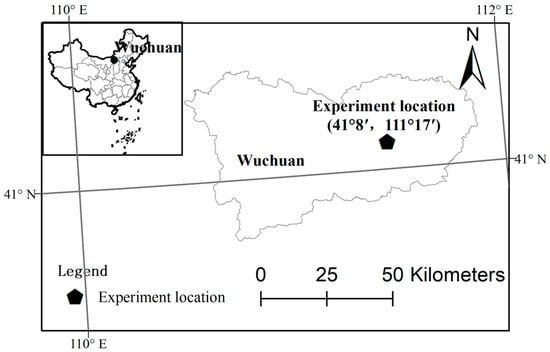
Figure 1.
Study region.
2.2. Study Data and Experimental Design
A field experiment was designed to investigate the coupling effect between soil moisture and temperature. The experiment was conducted from May to September in 2017. The selected crop was potato, with five treatments of an area of 30 m2 (7.5 × 4 m) each (Figure 2). The optimized fertilization amount of N–P2O5–KCl was 18–12–9 g/m2 [29]. The level of irrigation was divided into five levels: 0, 1, 2, 3 and 4, and the specific irrigation amounts were 0, 90, 180, 360 and 720 mm and their irrigation time were shown in Table 1. W0 referred to no irrigation, W1 referred to a supplementary irrigation with 90 mm, which was not enough to meet the crop water consumption during the growing period, W2 referred to the optimized irrigation with 180 mm, and the sum of the local average annual precipitation and the amount of irrigation under this treatment was the crop water demand, W3 was an excessive irrigation with 360 mm, W4 was an over excessive irrigation with 720 mm. The drip irrigation was adopted.
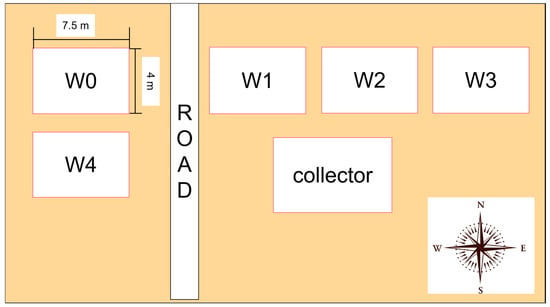
Figure 2.
Experimental plot structure diagram. W0, W1, W2, W3 and W4 indicate different water level treatments of 0, 1, 2, 3 and 4. Collector indicates place of the position of the collector.

Table 1.
Irrigation and precipitation (mm) during the growth period in 2017.
The data of soil moisture (volumetric water content) and soil temperature at different depths, leaf area index and yield in five plots were measured. The field temperature and soil moisture were measured by Stevens Hydra Probe II and collected by CR-800 sensor. The probe placement positions were 10 cm, 30 cm and 50 cm, respectively. It was measured every 10 min and the average data were saved every half hour. The data collection period was from the end of May to the potato harvest.
2.3. Methodology
Here, the original time series of the soil moisture, soil temperature and precipitation from late May to September in 2017 were measured and calculated to get daily means and diurnal variations at different depths.
After emergence of potato, sampling was carried out according to the growth period, about once every 15 days, selecting 3–5 representative plants in each plot, separating the organs and measuring the fresh weight. After that, the sample was first dried at 105 °C for 30 min, and then dried at 80 °C to constant weight to determine the dry weight.
The leaf area was measured with a portable leaf area meter LI-3000, and all the leaves (excluding the yellowed leaves) of the sample plants at each growth stage were unfolded and tiled onto the leaf area meter to measure the total leaf area and converted into the leaf area index.
When potatoes were harvested, the middle 2 ridges were picked in each plot to measure the number and fresh weight of potatoes.
The Pearson correlation analysis was employed to examine the relationship between soil moisture and temperature. After visually deriving their temporal trends, the correlation coefficients at different periods were calculated. Regression analysis (nonlinear curve fit) was applied to explore the possible physical processes associated with the link between soil moisture and temperature, soil moisture is the dependent variable, and soil temperature is the independent variable. In addition, the equations of soil moisture and temperature at different periods were simulated, and based on these equations, the trend and rate of change of soil temperature with soil moisture were analyzed. The process of graphing in the article and all the analyses mentioned above are conducted in Origin (version of 8.5) (https://www.originlab.com), Origin is a data analysis and publication-quality graphing software, which can customize and automate data import, analysis and graphing.
3. Results
3.1. Temporal Variations of Soil Moisture and Temperature
3.1.1. Daily Variation Characteristics of Soil Temperature
The daily variation of soil temperature showed a sinusoidal pattern, and the soil temperature decreased with the increase of irrigation amount and soil depth during the growing season (i.e., May to September). The order of the measured soil temperatures from high to low is: TW0 > TW1 > TW2 > TW3 > TW4 and T0 cm > T10 cm > T30 cm > T50 cm, where TWi represents the daily average soil temperature at the i irrigation level and Tj cm represents the daily average soil temperature at the j-cm depth below the land surface. Both the daily average and the maximum soil temperature decreased as soil moisture increased, but the daily minimum soil temperature showed an opposite trend (Figure 3).
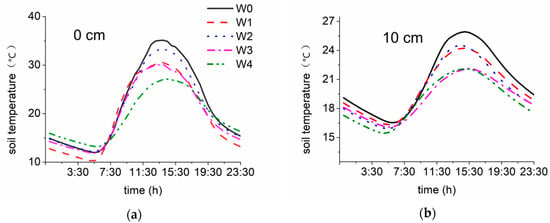
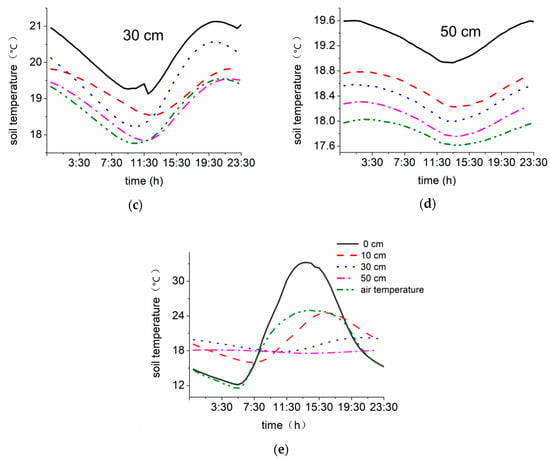
Figure 3.
The diurnal variation of soil temperature (a) on the soil surface, (b) at the depth of 10 cm, (c) at the depth of 30 cm, (d) at the depth of 50 cm, (e) at different depths.
The maximum deep soil temperature significantly lagged behind the maximum air temperature compared to that in the shallow layer (Figure 3e). The daily maximum air temperature and daily maximum soil temperature at the depths of 0,10, 30 and 50 cm occurred at 14:00, 13:30, 16:00, 20:00 and 23:00, respectively. The amplitude of the diurnal variation of soil temperature decreased as the soil depth increased and as the soil depth approached to 50 cm, the amplitude of the soil temperature variation approached to zero. The amplitude of the daily air temperature variation was significantly higher than that of the soil temperature.
3.1.2. Periodical Change Characteristics of Soil Temperature
The average soil temperature is an important indicator to describe the thermal state of the soil. The change of soil temperature is a continuous process, so the average temperature can reflect the thermal status comprehensively during a specific period [30]. With the increase of irrigation amount, the daily average soil temperature showed a decrease trend (Figure 4a). For an example, at 10 cm depth, the average temperatures of W0, W1, W2, W3 and W4 treatments were 20.9 °C, 20.2 °C, 19.9 °C, 19.1 °C and 18.8 °C, respectively. However, during the early growth period, the temperature of W0 treatment was lower than other irrigation treatments. The change trends of average temperatures under different treatments were basically the same, and the average monthly temperature of each treatment reached its peak in July and the valley in late May and early September.
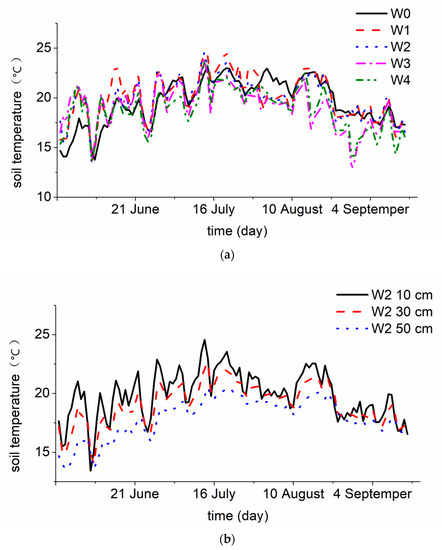
Figure 4.
The variation of soil daily average temperature under (a) different treatments, and (b) different depths.
Taking W2 treatment as an example, at different depths (Figure 4b), it was also apparent that the average temperature at 50-cm depth was lower than the temperature at 30 and 10 cm, T10 cm (19.9 °C) > T30 cm (19.2 °C) > T50 cm (18 °C). The variations of soil temperature under irrigation or precipitation decreased as the depth increased. Moreover, it could be seen from Figure 4b that during the growth period of potato, the peak temperature of the deep soil temperature and the daily average temperature were also significantly delayed compared to the shallow layer.
3.1.3. Temporal Variation of Soil Moisture
The soil moisture varied between 10% and 28% during the growing season. For example, at the 10 cm depth, the average daily soil moisture contents of W0, W1, W2, W3 and W4 treatments were 12.5%, 16.8%, 17.2%, 17.5%, 18%, respectively. An increase in soil moisture corresponded to an irrigation or precipitation event (Table 1, Figure 5a). Under natural conditions, when there is no ground infiltration replenishment, the surface moisture decreases with the occurrence of evaporation [31]. Since the W0 treatment had no irrigation during other periods and consumed gradually the water reserved in the soil before, the soil moisture tended to decrease steadily and slightly during the period from early July to early September. In addition, it can be found that there was a significant lag between the time the soil moisture peaked, and the rainfall process occurred.
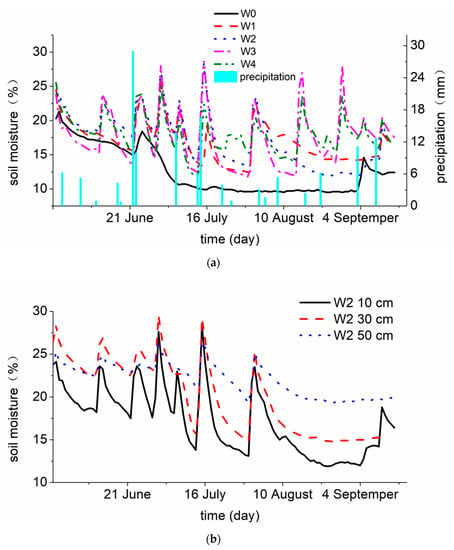
Figure 5.
The change characteristics of the average soil moisture under (a) different treatments, and (b) different depths.
At different depths of the same treatment (Figure 5b), soil moisture content at depths of 10 cm, 30 cm and 50 cm showed the same trend, W50 cm > W30 cm > W10 cm. The change in soil moisture caused by precipitation or irrigation had the largest change at depths of 10 cm and the smallest change in 50 cm. However, it could be found that the soil moisture content at 30 cm was higher than the moisture at 50 cm after the irrigation.
3.1.4. Effects of Potato Growth on Soil Moisture under Different Irrigation Levels
The leaf area index and the dry matter accumulation of the potato plants showed a single-peak curve. At the end of July, the leaf area index reached the maximum, and the dry matter accumulation reached the peak stage in late August. With the increase of irrigation amount, potato leaf area index and dry matter accumulation showed an increasing trend. The dry matter accumulation curve and leaf area index curve were similar under different water treatments (Figure 6a,b). The amount of water supply and consumption affected potato yield (Figure 6c).
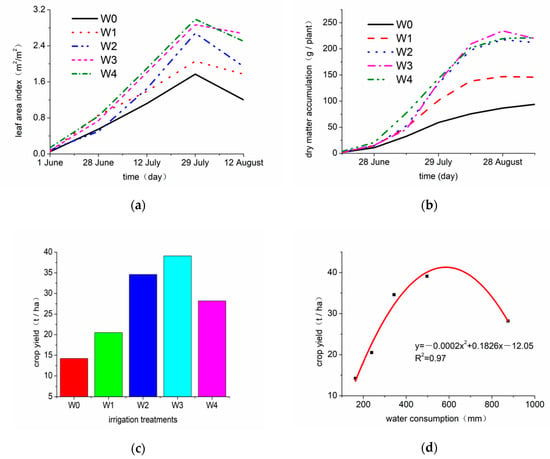
Figure 6.
Changes in (a) leaf area index, (b) dry matter accumulation, (c) potato total yield under different irrigation quotas and (d) the relationship between potato yield and soil water consumption.
Generally, the field water balance equation can be expressed as:
where P is the amount of precipitation, I is the amount of irrigation, ETa is the amount of soil water consumption, and ΔW is the amount of water storage change in the specific soil layer. There was a significant quadratic curve relationship between potato yield and soil water consumption (y = −0.0002x2 + 0.1826x − 12.05, p < 0.05) and with the increase of soil water consumption, the potato yield was significantly improved, but there was a decline after the limit. Based on the analysis above, it was found that the potato plants with high irrigation had strong growth and development, high water consumption and high yield, and there was a clear correlation between them. These meant that the potatoes growing better consumed more water leading soil water decreasing more rapidly.
P + I = Eta + ΔW
3.2. Correlations between Soil Moisture and Temperature
3.2.1. The Relationship between Soil Moisture and Temperature during the Growth Period
The correlations between the soil moisture and temperature were analyzed with that at 10-cm depth in 2017 under the W2 treatment as an example (Figure 7). The results showed that the change trend of soil moisture and temperature were in opposite direction, and the peak value of soil temperature corresponded to the valley value of soil moisture, and on the contrary, the valley value of soil temperature corresponded to the peak value of soil moisture. With increase of depth, the variation of soil temperature in the deep soil layer became not obvious.
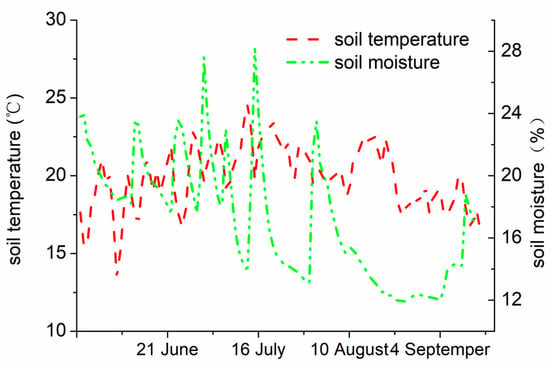
Figure 7.
Relationship between soil moisture and temperature during potato growth period at 10-cm depths in 2017 under W2 treatment.
3.2.2. Correlations of Soil Moisture and Soil Temperature in Different Periods
Assuming that the solar radiation is nearly the same in a few consecutive sunny days [32], we selected the observed data of soil moisture and temperature of seven consecutive sunny days at 10 cm from June to September 2017 to calculate the correlations between soil moisture and temperature in different periods. Figure 8 showed the relationship between soil moisture and temperature under all water treatments (green line) and the rate of soil temperature change with moisture (red line). It could be found that the variations of soil moisture and temperature were much the same at different periods. The equation for the relation between soil moisture (W) and temperature (T) under different periods presented as T = (aW + b)−1, (a and b as coefficients, p < 0.05). The soil temperature was inversely proportional to the soil moisture and as the soil moisture increased, the soil temperature gradually decreased.
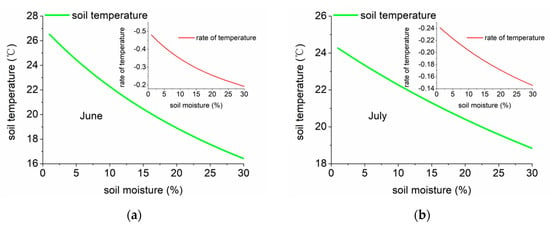
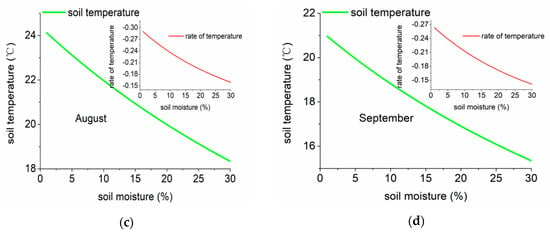
Figure 8.
Relationship between soil moisture (W) and temperature (T) and the rates of soil temperature change with soil moisture at different periods. (a), (b), (c) and (d) represent June, July, August and September, respectively.
4. Discussion
4.1. Mechanism of Soil Moisture Affecting Soil Temperature
It was found that there was an inverse proportional relationship between soil moisture and temperature (Figure 7 and Figure 8), and the results here were consistent with the studies by Zhang and Zuo [18] and Yi et al. [33]. Soil moisture is closely related to evaporation and thus to the partitioning of the sensible and latent heat fluxes at the surface, it has a significant impact on the surface water and energy balance [34]. When the soil gains or loses a certain amount of heat, the soil temperature rise or fall depends on the heat capacity of the soil. In the soil components, the amount of solids generally does not change much, while the air and moisture changes frequently, so the specific heat capacity of the soil depends mainly on the water and air content [35]. For a certain volume (V) of soil, when the temperature changes from the initial value to the final value, the required heat (Q) is the product of specific heat capacity (CV), soil volume (V) and temperature change (ΔT). Therefore, under the precondition that the heat (Q) obtained by the soil is certain, the soil heat capacity (CV) is proportional to the soil moisture (W). The heat capacity of the soil varies depending on its composition. The specific heat capacity of most mineral soils and water is about 0.84 × 10³ J/(kg·K) and 4.2 × 10³ J/(kg·K) [26]. The specific heat capacity of soil is composed of the specific heat capacities of water and solid components. Therefore, the soil specific heat capacity (CV) equals to ρb × (0.84 × 10³ + 4.2 × 10³ W) J/(kg·K), namely 4.2 × 10³ × ρb × (0.2 + W) J/(kg·K), ρb is the soil density. And the soil moisture is inversely proportional to the soil temperature change (ΔT), that is, the soil moisture (W) is inversely proportional to the soil temperature (T) (Q = 4.2 × 103 V × (0.2 + W) × ΔT). Our results (Figure 8) also show that if the solar radiation is almost the same for several days, the soil temperature is inversely proportional to the soil moisture. Since the heat capacity of water is much higher than that of soil, the regulation of soil moisture on soil temperature is very obvious. For example, many scholars have found that the decrease of soil moisture has a significant warming effect on the local climate [13,21,36,37] and these conclusions also confirm our results.
4.2. Sensitivity of Soil Temperature to Soil Moisture
Many scholars have simulated the relationship between soil moisture and air temperature and found that low soil moisture is a driving factor for heat waves and temperature anomalies around the world [13,15,37,38,39]. Here, the rate of soil temperature change with moisture. When the soil moisture is low, the change of soil temperature is more obvious than when the soil moisture is high. The results are consistent with the conclusions of other scholars that mentioned above, but how to determine the parameter values of the equations about soil moisture and temperature would be the research focus in the next step.
4.3. Impact of Crop Growth on Soil Moisture and Temperature
The results above showed that the higher the yield, the leaf area index and the dry matter accumulation, the higher the crop water consumption (Figure 6d). The results here are consistent with the studies by Gaiser et al. [40]. With the improvement of agricultural technology, the adjustment of cropping system and the optimization of crop varieties, the crop yield was significantly improved, but the soil moisture is also continuously decreasing. For example, when the fertilizer is applied, the crops will grow more vigorously and will consume more soil water [41]. On the other hand, different crop roots have different micro-environment and organic matter content, which has an impact on soil water holding capacity [42].
Based on the results obtained in Section 3.2.2 and Section 4.1, it can be concluded that the change in soil temperature is determined by the soil moisture, soil heat capacity and heat source. When the soil water content is lower, the soil heat capacity is smaller, and the soil temperature change is larger. Crop growth consumes a lot of soil water, so when the net radiation received on the ground is strong, this will cause dramatic changes in soil temperature, especially when the crop is growing vigorously. For example, in the context of climate change, the temperature increase in China’s semi-arid regions is higher than the global average [29].
Climate change may lead to higher temperature and change in potential evapotranspiration and crop water demand, decreasing soil moisture and aggravating soil drought [43,44]. Moreover, regional climate also exhibits both warming and drying trends [23,45]. Human activities are the main cause of climate change, the rapid decline of soil moisture caused by the large amount of water consumed by agriculture is the key factor of local and global land–atmosphere interaction imbalance [46].
5. Conclusions
Based on the data from the field observations in Wuchuan County in 2017, the change characteristics of soil moisture and temperature and their interactions were analyzed. There was an inverse proportional relationship between soil moisture and temperature and soil heat capacity plays a key role in the relationship between soil moisture and temperature. The soil temperature decreases with the increase of soil moisture. When the soil moisture is low, the change of soil temperature is more obvious than when the soil moisture is high. Since soil water consumption will greatly reduce soil moisture, strong crop growth will promote soil temperature increase and this will have adverse effects on local and global climate change.
Author Contributions
Conceptualization, Z.Z. and Z.P.; data curation, Z.Z. and J.Z.; funding acquisition, Z.P.; investigation, Z.Z., J.Z., G.H., N.H., J.W., Y.P., Z.W. and R.P.; methodology, Z.Z. and Z.P.; project administration, Z.Z. and Z.P.; resources, Z.P. and J.Z.; supervision, Z.P. and F.P.; writing—original draft, Z.Z.; writing—review & editing, Z.Z., Z.P., F.P., G.H., N.H., J.W., Y.P., Z.W. and R.P. All authors have read and agreed to the published version of the manuscript.
Funding
This study was supported by the National Key R&D Program of China (2018YFA0606303) and The key R&D program of Inner Mongolia, China (2019GG016).
Conflicts of Interest
The authors declare no conflict of interest.
References
- Al-Kayssi, A.W.; Al-Karaghouli, A.A.; Hasson, A.M.; Beker, S.A. Influence of soil moisture content on soil temperature and heat storage under greenhouse conditions. J. Agric. Eng. Res. 1990, 45, 241–252. [Google Scholar] [CrossRef]
- Amani, M.; Salehi, B.; Mahdavi, S.; Masjedi, A.; Dehnavi, S. Temperature-vegetation-soil moisture dryness index (tvmdi). Remote Sens. Environ. 2017, 197, 1–14. [Google Scholar] [CrossRef]
- Mueller, E.C.; Day, T.A. The effect of urban ground cover on microclimate, growth and leaf gas exchange of oleander in phoenix, arizona. Int. J. Biometeorol 2005, 49, 244–255. [Google Scholar] [CrossRef]
- Leaf, J.S.; Erell, E. A model of the ground surface temperature for micrometeorological analysis. Appl. Clim. 2018, 133, 697–710. [Google Scholar] [CrossRef]
- Rahmati, M.; Mallants, D.; Zacharias, S.; Rezaei, M.; Looy, K.V. Development and analysis of soil water infiltration global database. Earth Syst. Ence Data 2018. [Google Scholar] [CrossRef]
- Campbell, G.S. Soil Physics with BASIC: Transport Models for Soil-Plant Systems; Elsevier: Amsterdam, The Netherlands, 1985. [Google Scholar]
- Sadeghi, S.H.; Ghaffari, G.A.; Rangavar, A.; Hazbavi, Z.; Singh, V.P. Spatiotemporal distribution of soil moisture in gully facies. Int. Soil Water Conserv. Res. 2020, 8, 15–25. [Google Scholar] [CrossRef]
- Hauser, M.; Orth, R.; Seneviratne, S.I. Role of soil moisture versus recent climate change for the 2010 heat wave in western Russia. Geophys. Res. Lett. 2016, 43, 2819–2826. [Google Scholar] [CrossRef]
- Richard, G.; Cellier, P. Effect of tillage on bare soil energy balance and thermal regime: An experimental study. Agronomie 1998, 18, 163–181. [Google Scholar] [CrossRef]
- Mastalerz, J.W. The Greenhouse Environment; John Wiley and Sons: New York, NY, USA, 1977. [Google Scholar]
- Jie, Z.; Zhen, L.Y.; Li, C. Reduced Soil Moisture Contributes to More Intense and More Frequent Heat Waves in Northern China. Adv. Atmos. Sci. 2015, 9, 27–37. [Google Scholar]
- Yang, K.; Zhang, J. Spatiotemporal characteristics of soil temperature memory in China from observation. Appl. Clim. 2015, 126, 1–11. [Google Scholar] [CrossRef]
- Zeng, X.M.; Wang, B.; Zhang, Y.; Song, S.; Huang, X.; Zheng, Y.; Chen, C.; Wang, G. Sensitivity of high-temperature weather to initial soil moisture: A case study using the WRF model. Atmos. Chem. Phys. 2014, 14, 9623–9639. [Google Scholar] [CrossRef]
- Qian, B.; Gregorich, E.G.; Gameda, S.; Hopkins, D.W.; Wang, X.L. Observed soil temperature trends associated with climate change in Canada. J. Geophys. Res. Atmos. 2011, 116, D02106. [Google Scholar] [CrossRef]
- Wu, R.; Kinter, J.L. Analysis of the Relationship of U.S. Droughts with SST and Soil Moisture: Distinguishing the Time Scale of Droughts. J. Clim. 2009, 22, 4520–4538. [Google Scholar] [CrossRef]
- Wu, W.; Geller, M.A.; Dickinson, R.E. The Response of Soil Moisture to Long-Term Variability of Precipitation. J. Hydrometeorol. 2002, 3, 604–613. [Google Scholar] [CrossRef]
- Zhang, J.; Wang, W.C.; Wei, J. Assessing land-atmosphere coupling using soil moisture from the Global Land Data Assimilation System and observational precipitation. J. Geophys. Res. Atmos. 2008, 113, D17119. [Google Scholar] [CrossRef]
- Zhang, R.; Zuo, Z. Impact of Spring Soil Moisture on Surface Energy Balance and Summer Monsoon Circulation over East Asia and Precipitation in East China. J. Clim. 2011, 24, 3309–3322. [Google Scholar] [CrossRef]
- Seneviratne, S.I.; Davin, E.; Hirschi, M. Soil Moisture-Ecosystem-Climate Interactions in a Changing Climate. In Proceedings of the AGU Fall Meeting, San Francisco, CA, USA, 5–9 December 2011. [Google Scholar]
- Koster, R.D.; Suarez, M.J. Soil Moisture Memory in Climate Models. J. Hydrometeorol. 2000, 2, 558–570. [Google Scholar] [CrossRef]
- Fischer, E.M.; Seneviratne, S.I.; Vidale, P.L.; Luthi, D.; Schar, C. Soil Moisture Atmosphere Interactions during the 2003 European Summer Heat Wave. J. Clim. 2007, 20, 5081–5099. [Google Scholar] [CrossRef]
- Holmes, T.R.H.; Owe, M.; Jeu, R.A.M.D.; Kooi, H. Estimating the soil temperature profile from a single depth observation: A simple empirical heatflow solution. Water Resour. Res. 2008, 440, 103–112. [Google Scholar] [CrossRef]
- IPCC Approved Summary for Policymakers. Climate Change 2013: The Physical Science Basis Summary for Policymakers. In Contribution of Working Group I to the Fifth Assessment Report of the Intergovernmental Panel on Climate Change; Alexander, L., Allen, S., Bindoff, N.L., Eds.; Cambridge University Press: Cambridge, UK, 2013. [Google Scholar]
- Hervé, D. Relative contribution of soil moisture and snow mass to seasonal climate predictability: A pilot study. Clim. Dyn. 2010, 34, 797–818. [Google Scholar]
- Khodayar, S.; Sehlinger, A.; Feldmann, H.; Kottmeier, C. Sensitivity of soil moisture initialization for decadal predictions under different regional climatic conditions in Europe. Int. J. Clim. 2015, 35, 1899–1915. [Google Scholar] [CrossRef]
- Subin, Z.M.; Koven, C.D.; Riley, W.J.; Torn, M.S.; Lawrence, D.M.; Swenson, S.C. Effects of Soil Moisture on the Responses of Soil Temperatures to Climate Change in Cold Regions*. J. Clim. 2013, 26, 3139–3158. [Google Scholar] [CrossRef]
- Dong, Z.Q.; Pan, Z.H.; An, P.L.; Zhang, J.T.; Zhang, J.; Pan, Y.Y.; Huang, L.; Zhao, H.; Han, G.L.; Wu, D.; et al. A quantitative method for risk assessment of agriculture due to climate change. Appl. Clim. 2016, 131, 653–659. [Google Scholar] [CrossRef]
- Zhang, J.T.; An, P.L.; Pan, Z.H.; Hao, B.Z.; Wang, L.W.; Dong, Z.Q.; Pan, X.B.; Xue, Q.W. Adaptation to a warming-drying trend through cropping system adjustment over three decades: A case study in the northern agro-pastural ecotone of China. J. Meteorol. Res. 2015, 29, 496–514. [Google Scholar] [CrossRef]
- Zhang, J.; Zhao, P.Y.; Pan, Z.H.; Duan, Y.; Li, H.C.; Wang, B.; Jing, Y.P.; Dong, Z.Q. Determination of input threshold of nitrogen fertilizer based on environment-friendly agriculture and maize yield. Trans. Chin. Soc. Agric. Eng. 2016, 32, 136–143. (In Chinese) [Google Scholar]
- Di, B.; Zhang, Y.L.; Chen, Z. Effects of Different Irrigation Methods on Soil Temperature in Protected Fields. Water Sav. Irrig. 2009, 8, 29–32. (In Chinese) [Google Scholar]
- Xia, Z.Q.; Jiang, H.G.; Li, Q.F. Effects of plastic film mulching on soil temperature and moisture and water saving benefits. J. Hohai Univ. 1997, 2, 39–45. (In Chinese) [Google Scholar]
- Liu, B.Y.H. The interrelationship and characteristic distribution of direct, diffuse and total solar radiation. Sol. Energy 1960, 4, 1–19. [Google Scholar] [CrossRef]
- Yi, Y.L.; Liang, Y.J.; Zhang, D.G. Effects of Different Water and Fertilizer Treatments on Soil Temperature and CO2 Content in Pepper Protected Fields. Chin. J. Soil Sci. 2006, 37, 875–880. (In Chinese) [Google Scholar]
- Henderson-Sellers, A. Soil moisture: A critical focus for global change studies. Glob. Planet. Chang. 1996, 13, 3–9. [Google Scholar] [CrossRef]
- Li, H.X.; Xia, Z.Q.; Ma, G.H. Study on the Influence of moisture Change on Soil Temperature and Water Exchange. J. Hohai Univ. 2007, 35, 172–175. (In Chinese) [Google Scholar]
- Kang, S.; Eltahir, E.A.B. Impact of Irrigation on Regional Climate over Eastern China. Geophys. Res. Lett. 2019, 46, 5499–5505. [Google Scholar] [CrossRef]
- Hirschi, M.; Seneviratne, S.I.; Alexandrov, V.; Boberg, F.; Boroneant, C.; Christensen, O.B.; Formayer, H.; Orlowsky, B.; Stepanek, P. Observational evidence for soil-moisture impact on hot extremes in southeastern Europe. Nat. Geosci. 2010, 4, 7–21. [Google Scholar] [CrossRef]
- Lau, W.K.M.; Kim, K.M. The 2010 Pakistan Flood and Russian Heat Wave: Teleconnection of Hydrometeorological Extremes. J. Hydrometeorol. 2012, 13, 392–403. [Google Scholar] [CrossRef]
- Zhang, J.Y.; Wu, L.Y. Land-atmosphere coupling amplifies hot extremes over China. Chin. Sci. Bull. 2011, 56, 3328–3332. [Google Scholar] [CrossRef]
- Gaiser, T.; Barros, I.D.; Lange, F.M.; Williams, J.R. Water use efficiency of a maize/cowpea intercrop on a highly acidic tropical soil as affected by liming and fertilizer application. Plant Soil 2004, 263, 165–171. [Google Scholar] [CrossRef]
- Zhang, J.T.; Yang, J.; An, P.L.; Ren, W.; Pan, Z.H.; Dong, Z.Q.; Han, G.L.; Pan, Y.Y.; Pan, S.F.; Tian, H.Q. Enhancing soil drought induced by climate change and agricultural practices: Observational and experimental evidence from the semiarid area of northern China. Agric. Meteorol. 2017, 243, 74–83. [Google Scholar] [CrossRef]
- Özkan, U.; Gökbulak, F. Effect of vegetation change from forest to herbaceous vegetation cover on soil moisture and temperature regimes and soil water chemistry. Catena 2017, 149, 158–166. [Google Scholar] [CrossRef]
- Piao, S.L.; Ciais, P.; Huang, Y.; Shen, Z.H.; Peng, S.S.; Li, J.S.; Zhou, L.P.; Liu, H.Y.; Ma, Y.C.; Ding, Y.H.; et al. The impacts of climate change on water resources and agriculture in China. Nature 2010, 467, 43–51. [Google Scholar] [CrossRef]
- Chen, G.S.; Tian, H.Q.; Zhang, C.; Liu, M.L.; Ren, W.; Zhu, W.Q.; Chappelka, A.H.; Prior, S.A.; Lockaby, G.B. Drought in the Southern United States over the 20th century: Variability and its impacts on terrestrial ecosystem productivity and carbon storage. Clim. Chang. 2012, 114, 379–397. [Google Scholar] [CrossRef]
- Dong, Z.Q.; Pan, Z.H.; An, P.L.; Wang, J.L.; Zhang, J.T.; Zhang, J.; Pan, Y.Y.; Huang, L.; Zhao, H.; Han, G.L.; et al. A quantitative method for determining the impact threshold of climate change for agriculture. Appl. Clim. 2019, 135, 425–431. [Google Scholar] [CrossRef]
- Trenberth, K.E.; Dai, A.G.; Gerard, V.D.S.; Jones, P.D.; Barichivich, J.; Briffa, K.R.; Sheffield, J. Global warming and changes in drought. Nat. Clim. Chang. 2013, 4, 17–22. [Google Scholar] [CrossRef]
© 2020 by the authors. Licensee MDPI, Basel, Switzerland. This article is an open access article distributed under the terms and conditions of the Creative Commons Attribution (CC BY) license (http://creativecommons.org/licenses/by/4.0/).