Article

The Implication of Different Sets of Climate Variables on Regional Maize Yield Simulations

1
Institute of Crop Science and Resource Conservation, University of Bonn, Katzenburgweg 5, D-53115 Bonn, Germany
2
Joint Research Centre, European Commission, Via Enrico Fermi 2749, 21027 Ispra, Italy
3
State Key Laboratory of Water Resources and Hydropower Engineering Science, Wuhan University, Wuhan 430072, China
*
Author to whom correspondence should be addressed.
Atmosphere 2020, 11(2), 180; https://doi.org/10.3390/atmos11020180
Submission received: 31 December 2019 / Revised: 31 January 2020 / Accepted: 4 February 2020 / Published: 9 February 2020
(This article belongs to the Special Issue Climate-Water-Food Nexus)

Abstract

:
High-resolution and consistent grid-based climate data are important for model-based agricultural planning and farm risk assessment. However, the application of models at the regional scale is constrained by the lack of required high-quality weather data, which may be retrieved from different sources. This can potentially introduce large uncertainties into the crop simulation results. Therefore, in this study, we examined the impacts of grid-based time series of weather variables assembled from the same data source (Approach 1, consistent dataset) and from different sources (Approach 2, combined dataset) on regional scale crop yield simulations in Ghana, Ethiopia and Nigeria. There was less variability in the simulated yield under Approach 1, ranging to 58.2%, 45.6% and 8.2% in Ethiopia, Nigeria and Ghana, respectively, compared to those simulated using datasets retrieved under Approach 2. The two sources of climate data evaluated here were capable of producing both good and poor estimates of average maize yields ranging from lowest RMSE = 0.31 Mg/ha in Nigeria to highest RMSE = 0.78 Mg/ha under Approach 1 in Ghana, whereas, under Approach 2, the RMSE ranged from the lowest value of 0.51 Mg/ha in Nigeria to the highest of 0.72 Mg/ha in Ethiopia under Approach 2. The obtained results suggest that Approach 1 introduces less uncertainty to the yield estimates in large-scale regional simulations, and physical consistency between meteorological input variables is a relevant factor to consider for crop yield simulations under rain-fed conditions.

1. Introduction

Weather conditions are one of the important driving factors for analyzing the biophysical processes. Their influence on these processes are non-linear [1,2], and is dependent on the covariance structure between weather variables [3]. Process-based crop models have extensively been used in the impact assessment of climate change on crop production on regional to the global scale, as they consider the interaction between weather variables and crop management [4]. The quality of crop simulation is frequently constrained by the lack of the required quality of weather data, which varies depending on the source, introducing an additional source of uncertainty in crop simulation results [5,6,7]. Utmost importance should, therefore, be given to choosing the data source, which otherwise could lead to incorrect estimations that lead to incorrect policy recommendations.
Availability of weather data to run crop simulation models at regional scale applications covering several thousands of square kilometers. In this case, models rely on secondary weather products (spatialized weather variables) where weather variables are measured only at a few sites [8]. The measured weather variables can be interpolated (generally each variable separately), which is subsequently used to run the crop model under observed climate conditions. Gridded observational weather data is often used also to adjust bias in regional climate model simulations, which serve as a key tool for climate change impact assessment. However, there are several uncertainties with observed weather data. Many observation stations, particularly in Sub-Saharan Africa, are not equipped to measure certain weather variables (wind speed, relative humidity, open pan evaporation, etc.). Thus, these variables are estimated from measured ones based on equations that have been validated in other regions of the world or at the global scale. The climate data measurement networks, in general, are not compatible, due to differences in instrumentation, sensor height and data logging [9]. In the absence of site-specific data, the following data sources can be identified for spatialized crop yield simulation:
(a)
Nearest alternative weather stations;
(b)
Modelled data from the measurements done on the site (i.e., computing solar radiation values from the sunshine hours or the air temperature);
(c)
Spatially interpolated data from the automated weather station networks;
(d)
Artificial weather data estimated from the stochastic weather generator (for example, LARS-WG weather generator);
(e)
Climate forcing datasets (i.e., reanalysis datasets for the past period and global climate model simulations based on the assumption of future emission scenarios).
Several studies have been done addressing the importance of the quality of point-based and gridded weather data [10,11] and evaluated the uncertainty introduced in the crop model estimates by on-site observed data versus partially modelled data and substitute data from nearby sites [7]. Additionally, satellite-derived meteorological products have also been evaluated against model-derived weather data for maize yield [12,13,14].
However, to our knowledge, there is no published study estimating the error that might be introduced in regional yield simulations using weather variables compiled from multiple sources, as opposed to weather variables from a unique source. Weather variables compiled from multiple sources are likely to compound errors inherent to each of the data sources. While it is important to properly characterize errors in order to estimate the uncertainty in crop models, it is difficult to prescribe a unique distribution for crop model errors when weather variables are compiled from multiple sources.
Therefore, our aim in this study was to analyze the uncertainty introduced to the simulated crop yields in large-scale regional crop yield simulations when using weather variables from different sources. We examined the impacts on yield estimates by using weather variables obtained from the same data source and assembled from different sources (called Approach 1 and 2, respectively, hereafter, refer to Section 2.2.1 for details).

2. Methods

2.1. Study Regions

This study was carried out in three sub-Saharan countries, namely Ghana, Ethiopia and Nigeria. The test regions in Ghana was central Ghana (comprises of two regions, namely Ashanti and Brong-Ahafo), Oromia region in Ethiopia and Ogun, and Kwara and Edo states in Nigeria.
The Ashanti Region is characterized by an average annual rainfall of 1270 mm with an annual mean temperature of 27 °C. The Brong-Ahafo Region has an annual mean temperature of 23.9 °C and the rainfall ranges from an average of 1000 mm in the northern parts to 1400 mm in the southern parts [15].
In Ethiopia, the study area covers the Jimma and Bako Zones of Oromia State in Ethiopia, stretching from west to central Ethiopia. The rationale for choosing these two zones was based on their representativeness of the west and central major maize producing areas of the country. Jimma experiences an annual average rainfall of 1000 mm for 8–10 months. The temperature of Jimma zone varies from 8–28 °C. The annual average temperature is 20 °C [16]. Bako administrative zone has a mean annual rainfall of 1217 mm. The temperature ranges 14.1 °C–28.3 °C [16].
In Nigeria, the study region encompasses Ogun, Kwara and Edo states, located in the southwestern, western, and southern part, respectively. Ogun is located in the humid tropical zone with the growing season starting in April and ending in November, followed by a 4 months’ dry season (December to March). The average annual rainfall is 1517 mm. The average temperature spans from 23 °C in July to 32 °C in February. Kwara is situated in the tropical savannah zone of Nigeria, with a mean annual rainfall of 1231 mm and an annual mean temperature of 28 °C. Edo has two distinct climate seasons, the rainy and the dry season. The rainy season extends from April to October with a two-week break in August. The average rainfall varies from 1500 mm in the far north to the 2500 mm in the south. The average temperature ranges between 25 °C in the rainy season and 28 °C in the dry season.

2.2. Climate and Soil Data

2.2.1. Climate Dataset

Grid-based climate data sets for the three regions were compiled according to two approaches (Table 1).
(a) Approach 1 (Single-sourced weather dataset): The climate data used is from Princeton University [17]. The dataset was made by the combination of global observation-based datasets and the NCEP/NCAR reanalysis dataset. As this dataset is the result of simulation runs with a physically based, deterministic climate model, the bias-corrected output variables constitute a physically consistent set of weather data. The dataset is available at 10 km2 resolution at daily time step [18] (Table 1).
(b) Approach 2 (Multi-sourced weather dataset): The data et in Approach 2 is a combination of datasets derived from different independent global datasets and is, therefore, less consistent than the set of weather data in Approach 1. Precipitation data was derived from the Africa Rainfall Climatology Version 2 (ARC2) daily rainfall product [22] at a resolution of 0.1 degrees [19]. Solar radiation data are derived from the SRB dataset. National Centre for Environmental Prediction’s Climate Forecast System Reanalysis (CFSR) was used [20,23] (Table 1) for the minimum and maximum temperature, and the wind speed data, available at ~38 km resolution.

2.2.2. Soil Data

Soil related parameters values (sand, silt, clay, organic carbon and bulk density) were derived from the soil maps of Sub-Sahara Africa at a 1 km × 1 km resolution [24]. Soil water was given at field capacity, wilting point and saturation were estimated using equations given [25].

2.3. Crop Yield and Management Data

Sixteen years (1992–2007) of maize yield (Mg/ha) data for the two regions (Ashanti and Brong-Ahafo) in Ghana have been collected from the Agriculture Statistics & Census Division, Ministry of Agriculture, Ghana. Obatanpa (a long cycle variety, 110 days) was used in the study regions [26,27]. A total of 4.0 kg/ha nitrogen and no irrigation was applied in the simulations for estimating the actual farmers’ yields [15]. The sowing period (i.e., from onset to the end of sowing) of maize for major sowing seasons were extracted from crop calendar provided by [28] database. For Ethiopia, maize yields (Mg/ha) over 11 years (1996–2008) for the simulated regions have been collected from the Central Statistical Agency (CSA), Ethiopia. BH660 (a long cycle variety, 150 days) was used in the study, as it is one of the most popular and widely grown maize varieties in the country [29]. A total of 20 kg ha−1 nitrogen and no irrigation was assumed in the simulations [30]. The sowing period (i.e., from onset to the end of sowing) of maize for major sowing seasons were extracted from the crop calendar provided by [28] database. For Nigeria, maize yields (Mg/ha) over 17 years (1994–2010) for the simulated regions have been collected from the Agricultural Production Survey (APS), Nigeria [31,32]. A long cycle variety, 120 days, was used in the study, as it is one of the most popular and widely grown maize varieties in the country in general, in major maize producing areas like Kwara, Edo and Ogun in particular, with a low fertilizer application rate of 60, 40.4 and 21 kg/ha, respectively, with an NPK ratio of 15:15:15 [33] and no irrigation, as practiced by local farmers, was applied to estimate actual farmers yields. The sowing period (i.e., from onset to the end of sowing) of maize for major sowing seasons were extracted from [28] database.

2.4. Model Calibration and Evaluation

Crop yields were simulated using the LINTUL5 [34] crop model within the SIMPLACE (Scientific Impact Assessment and Modelling Platform for Advanced Crop and Ecosystem Management) modelling framework [35]. The applied LINTUL5 version has extensively been used for cropping systems analysis in Sub-Saharan Africa [36,37,38,39,40]. Simulation of biomass production is based on intercepted radiation, according to Lambert–Beer’s law and light use efficiency. Water stress occurs when the available soil water is between a defined critical point and wilting point or higher than the field capacity (waterlogging). The critical point is a crop-specific value which is calculated according to [41] and depends on crop development, soil water tension, and potential transpiration. Water, nutrients (NPK), temperature, and radiation stresses restrict the daily accumulation of biomass, root growth, and yield. In this study, ‘Obatanpa’, a maize variety was calibrated against the measurements collected from field trials and meteorological station data in Northern Ghana. The crop parameters used are given in Table 2. The data was collected from a field experiment conducted at two locations in the Tolon/Kumbungu district in northern Ghana. The area lies within the interior northern savanna agro-ecological zone (i.e., Guinea and Sudan savannah zones) of Ghana at latitude 9.4° N, longitude 1.06° W and an average elevation of 183 m above mean sea level. The sites were the experimental field of the Savanna Agricultural Research Institute (SARI) of the Council for Scientific and Industrial Research (CSIR) at Akukayili and a farmer’s field at Cheshegu (for details, see [15]). The observed and simulated day of anthesis and day of maturity under fertilized and control (unfertilized) production treatments agreed well, with the exception of Cheshegu, where the model underestimates the day of maturity by 8 days under both fertilized and control production treatments (Table 3). The simulated yield was overestimated by 20%–30% under fertilized conditions, whereas the model did not capture the grain yield under the control condition, as observed harvest indices were low. The comparison of simulated and observed Leaf Area Index is also plotted for both sites under fertilized and control (unfertilized) conditions (Figure 1).
For maize yield simulations in Nigeria, we used the crop parameters from [33]. For maize yield simulations in Ethiopia, a local variety, ‘BH660’, was calibrated using field experiment data from Jimma and Bako, and meteorological station data. The simulated anthesis and maturity dates matched well with the observed values, and simulated yields were overestimated at both the sites in the range 4%–5.4% (for details, see [16]; Table 4). Observed and simulated maize yield (variety BH660) in (Mg/ha) at two experimental sites, Bako (a) and Jimma (b), in Ethiopia under fertilized conditions, are plotted with an RMSE of 1.1 Mg/ha and 3.1 Mg/ha, respectively (Figure 2).
As a measure of accuracy for the model calibration, the observed and simulated yields were compared using the following objective function [42]:
a. Mean relative error MR as
M R = 1 n i = 1 n ( y i x i ) x i
b. Mean residual error ME as
M E = 1 n i = 1 n y i x i
where n is the sample size, x is the observed, and y is the simulated yield value. A value of 0 of mean residual error (ME) indicates no systematic bias between simulated and measured yield values. The mean relative error (MR) gives an indication of the mean magnitude of the error in relation to the observed value. Root Mean Square Error as
R M S E = 1 n i = 1 n ( s i o i ) 2
where:
Si = simulated yield;
Oi = Observed yield.

2.5. Definition and Statistical Analysis of Spatial and Temporal Variability

(a) Aggregation of model outputs:
The yield from all the simulation units (Figure 3) in each country was averaged to obtain a representative value for a specific year.
(b) Statistical Analysis:
In this study, we used ‘Modified Mielke approach’ (Equation (4)), a permutation-based index, to evaluate the agreement between the two continuous datasets (in our case, namely Approach 1 and 2) proposed by [43]. We used this approach to quantify how close the datasets in Approach 1 and 2 are to each other as this not only measures the degree of dependence between the two data series but also estimates how similar in magnitude these series’ values are.
λ = 1 n 1 i = 1 n ( X i Y i ) 2 σ x 2 + σ γ 2 + ( X ¯ Y ¯ ) 2 + κ
κ = 0 , if r ≥ 0,
κ = 2 | i = 1 n ( X i X ¯ ) ( Y i Y ¯ ) | r<0,
Where, n is the number of observations, X ¯ and Y ¯ are the mean values of datasets Approach 1 (X) and Approach 2 (Y), and σX and σY are the standard deviations. λ is dimensionless and varies between −1 and 1. A value of zero indicates there is no linear dependence between the two variables, while a value of 1 or −1 indicates a linear dependence.

3. Results and Discussion

3.1. Comparison of Seasonal Weather Variables under Approach 1 and 2

The Modified Mielke index (λ), which was estimated for the crop growth period in the regions of Ghana, Ethiopia and Nigeria, quantified the agreement of the weather variables in datasets obtained under Approach 1 and 2. The highest agreement was estimated in the cumulated radiation values given very high λ values of 0.99 in Ghana, whereas, the least agreement was in cumulated precipitation values (λ = 0.15) (Table 5). In Ethiopia, the highest agreement was estimated in the cumulated precipitation values (λ = 0.98), whereas, the wind speed was not in agreement in the dataset under Approach 1 and 2 (λ = 0.04) (Table 5). In Nigeria, the highest disagreement was estimated in precipitation (λ = 0.29) followed by wind speed, global radiation, maximum temperature and minimum temperature, with λ values of 0.46, 0.47, 0.54 and 0.57 respectively (Table 5). Since the Mielke index estimates not only measure the degree of dependence between the data series from different data sources, but also estimates how similar in the magnitude the series values are. This suggests that, in Ethiopia, as the precipitation and values have highest positive agreement between Approach 1 and 2, both sources of data could be used interchangeably for the assessment of production system under rain-fed conditions. Similarly, In Ghana, the radiation values can be used interchangeably, whereas, in the case of Nigeria, none of the climate variables in both approaches are similar enough in magnitude that they can be used interchangeably under data-scarce conditions.

3.2. Comparison of Simulated Yields based on Approach Land 2

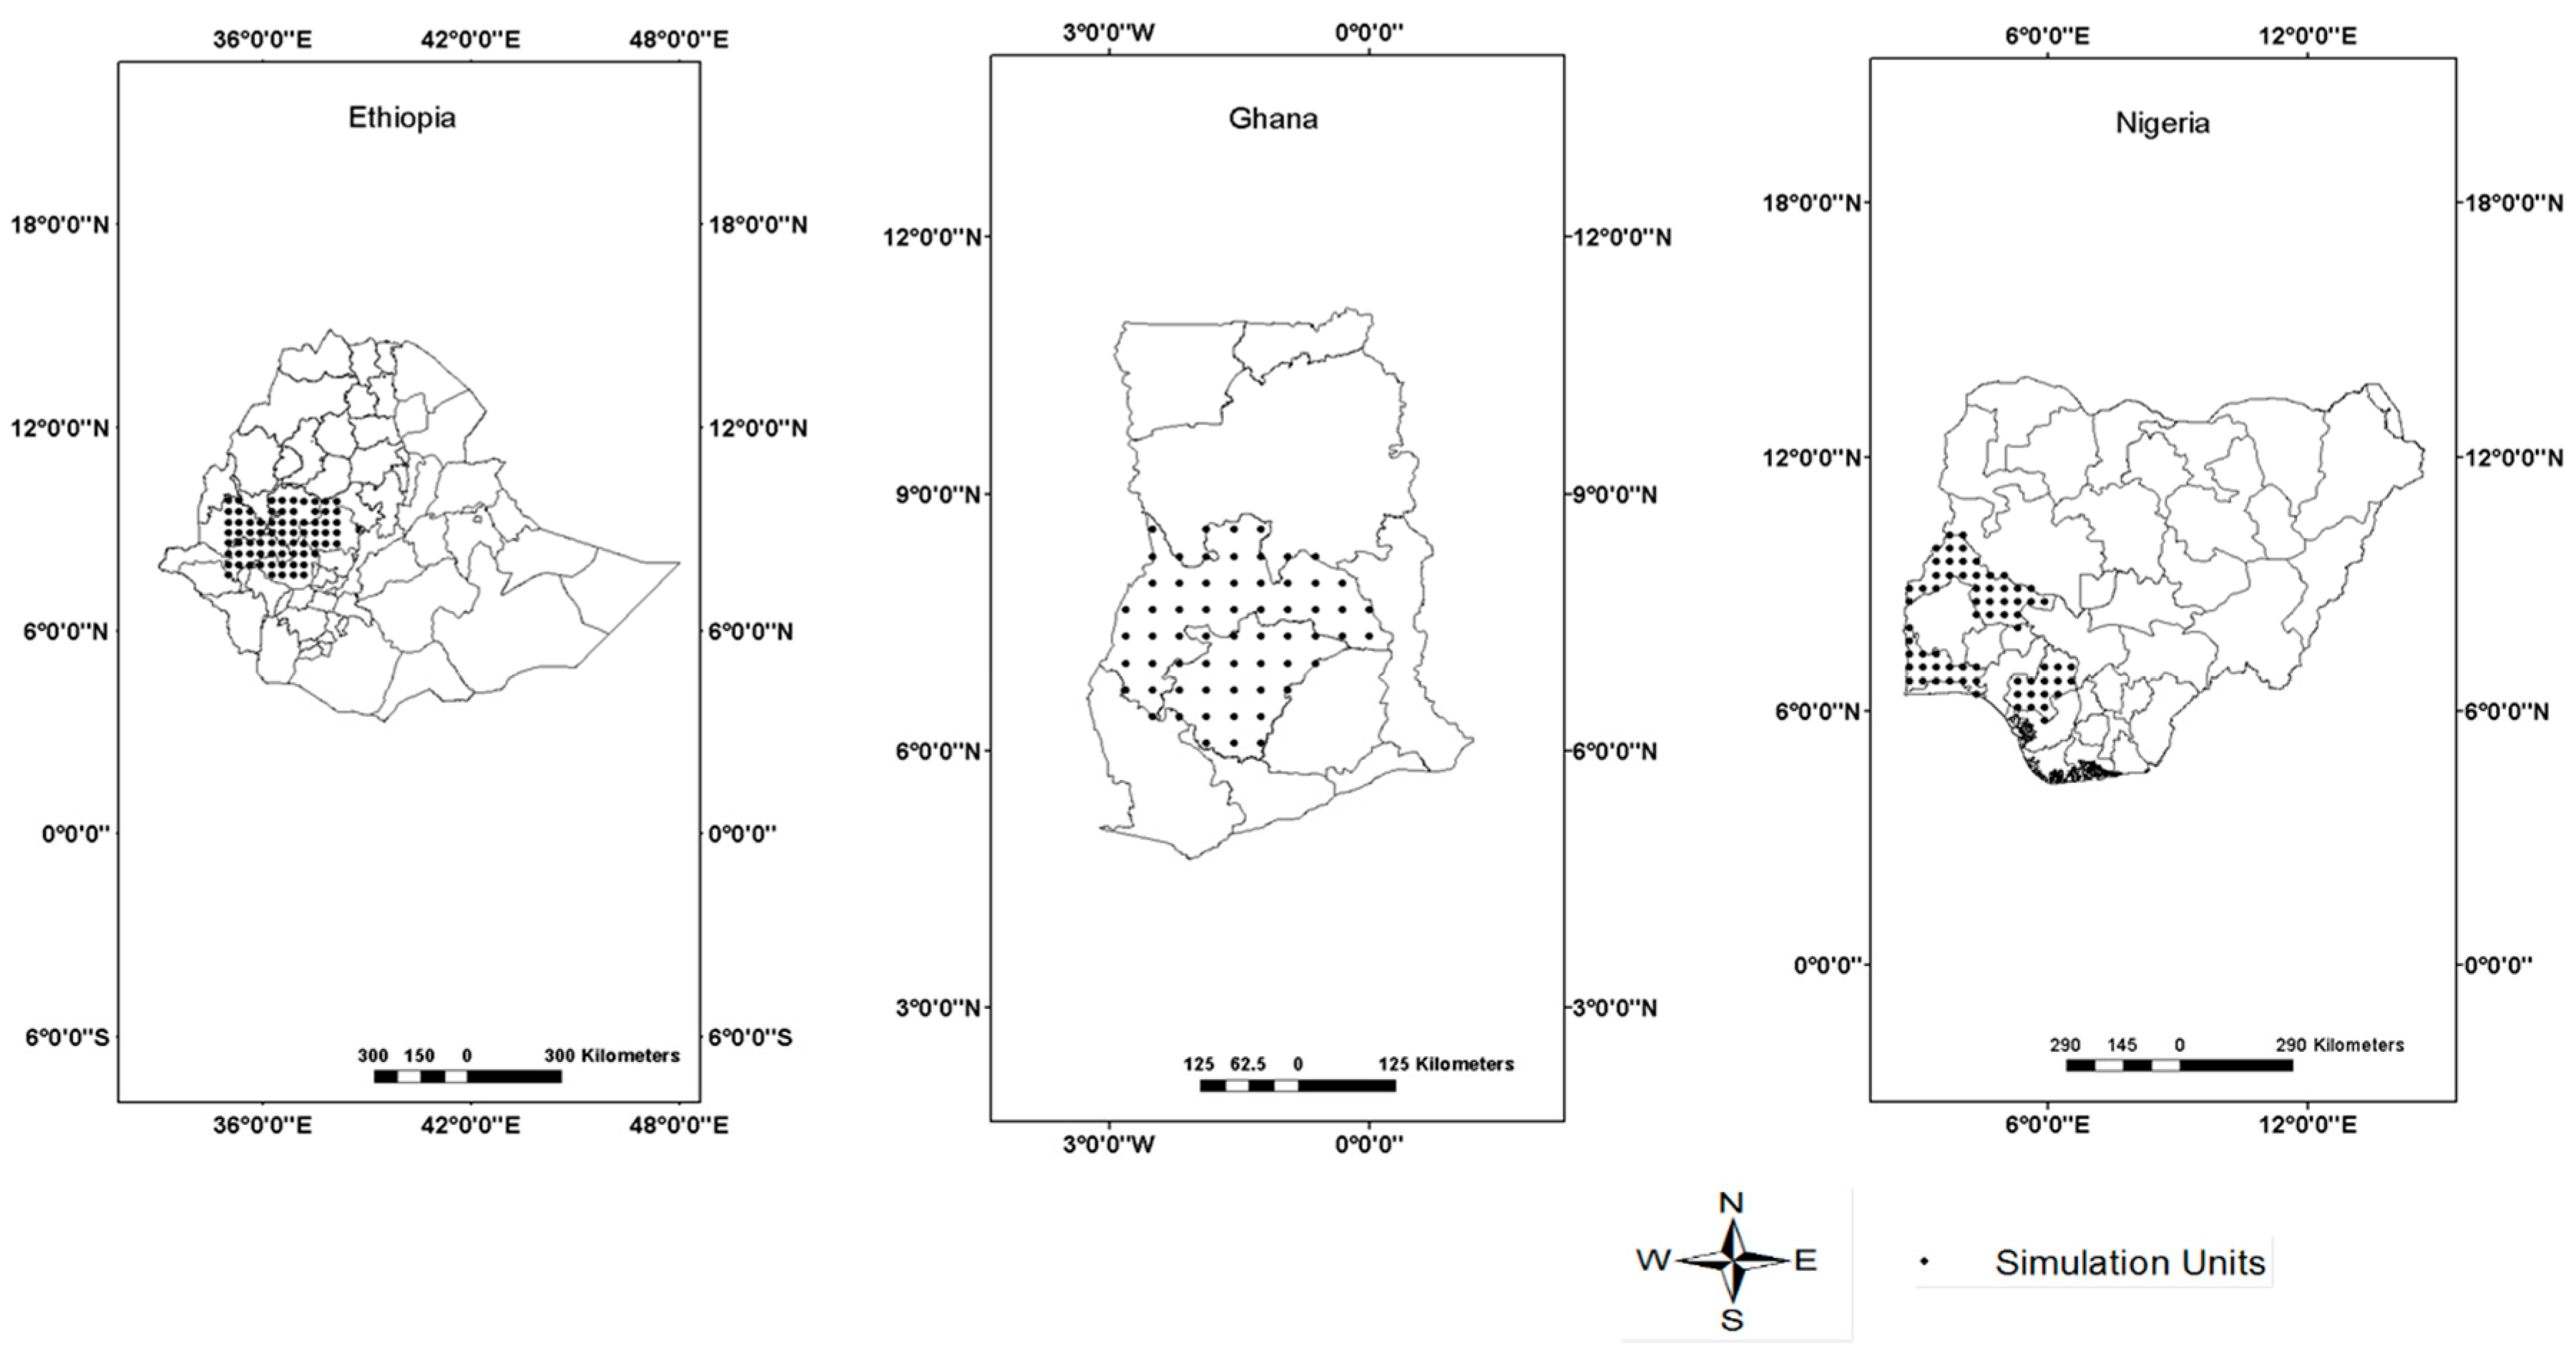
Crop yield is a result of the integration of many biophysical processes. Among others, the yield is driven by five meteorological variables acting in conjunction with each other. Separate simulations of maize phenology and final yield were carried out using the two sources of weather data (namely Approach 1 and 2). The effect of using different weather data sources for simulating grain yield is shown in Figure 2, Figure 3 and Figure 4, whereas the effect on length of vegetative and reproductive phase is shown in 
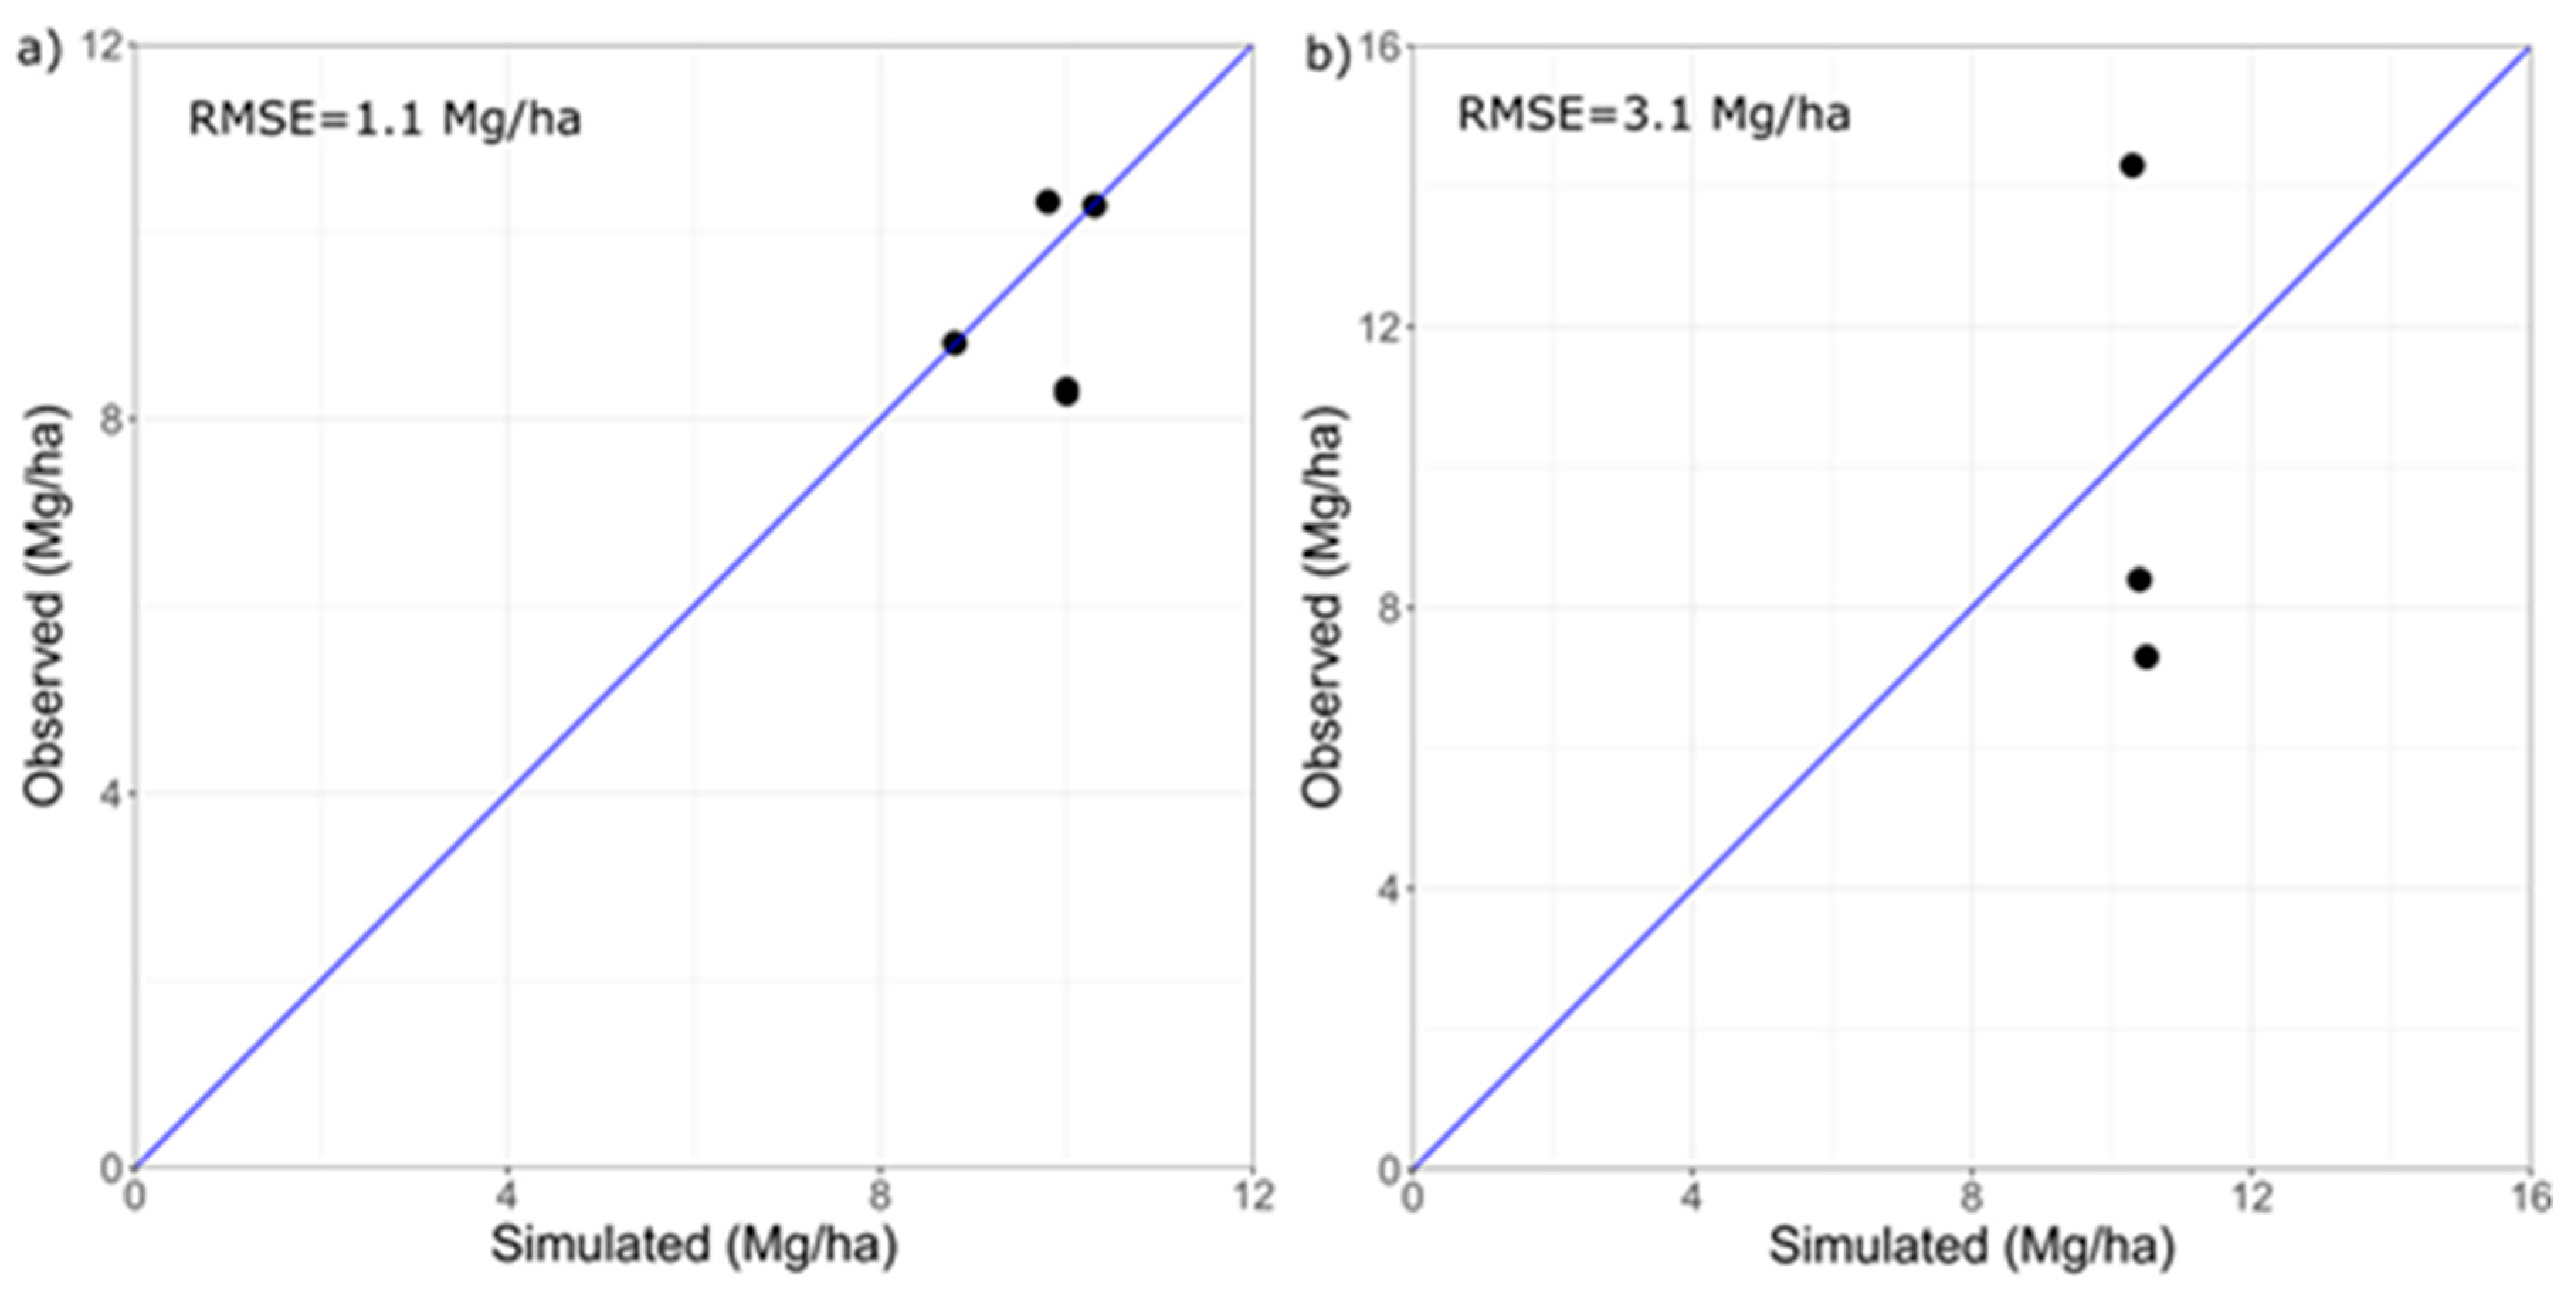
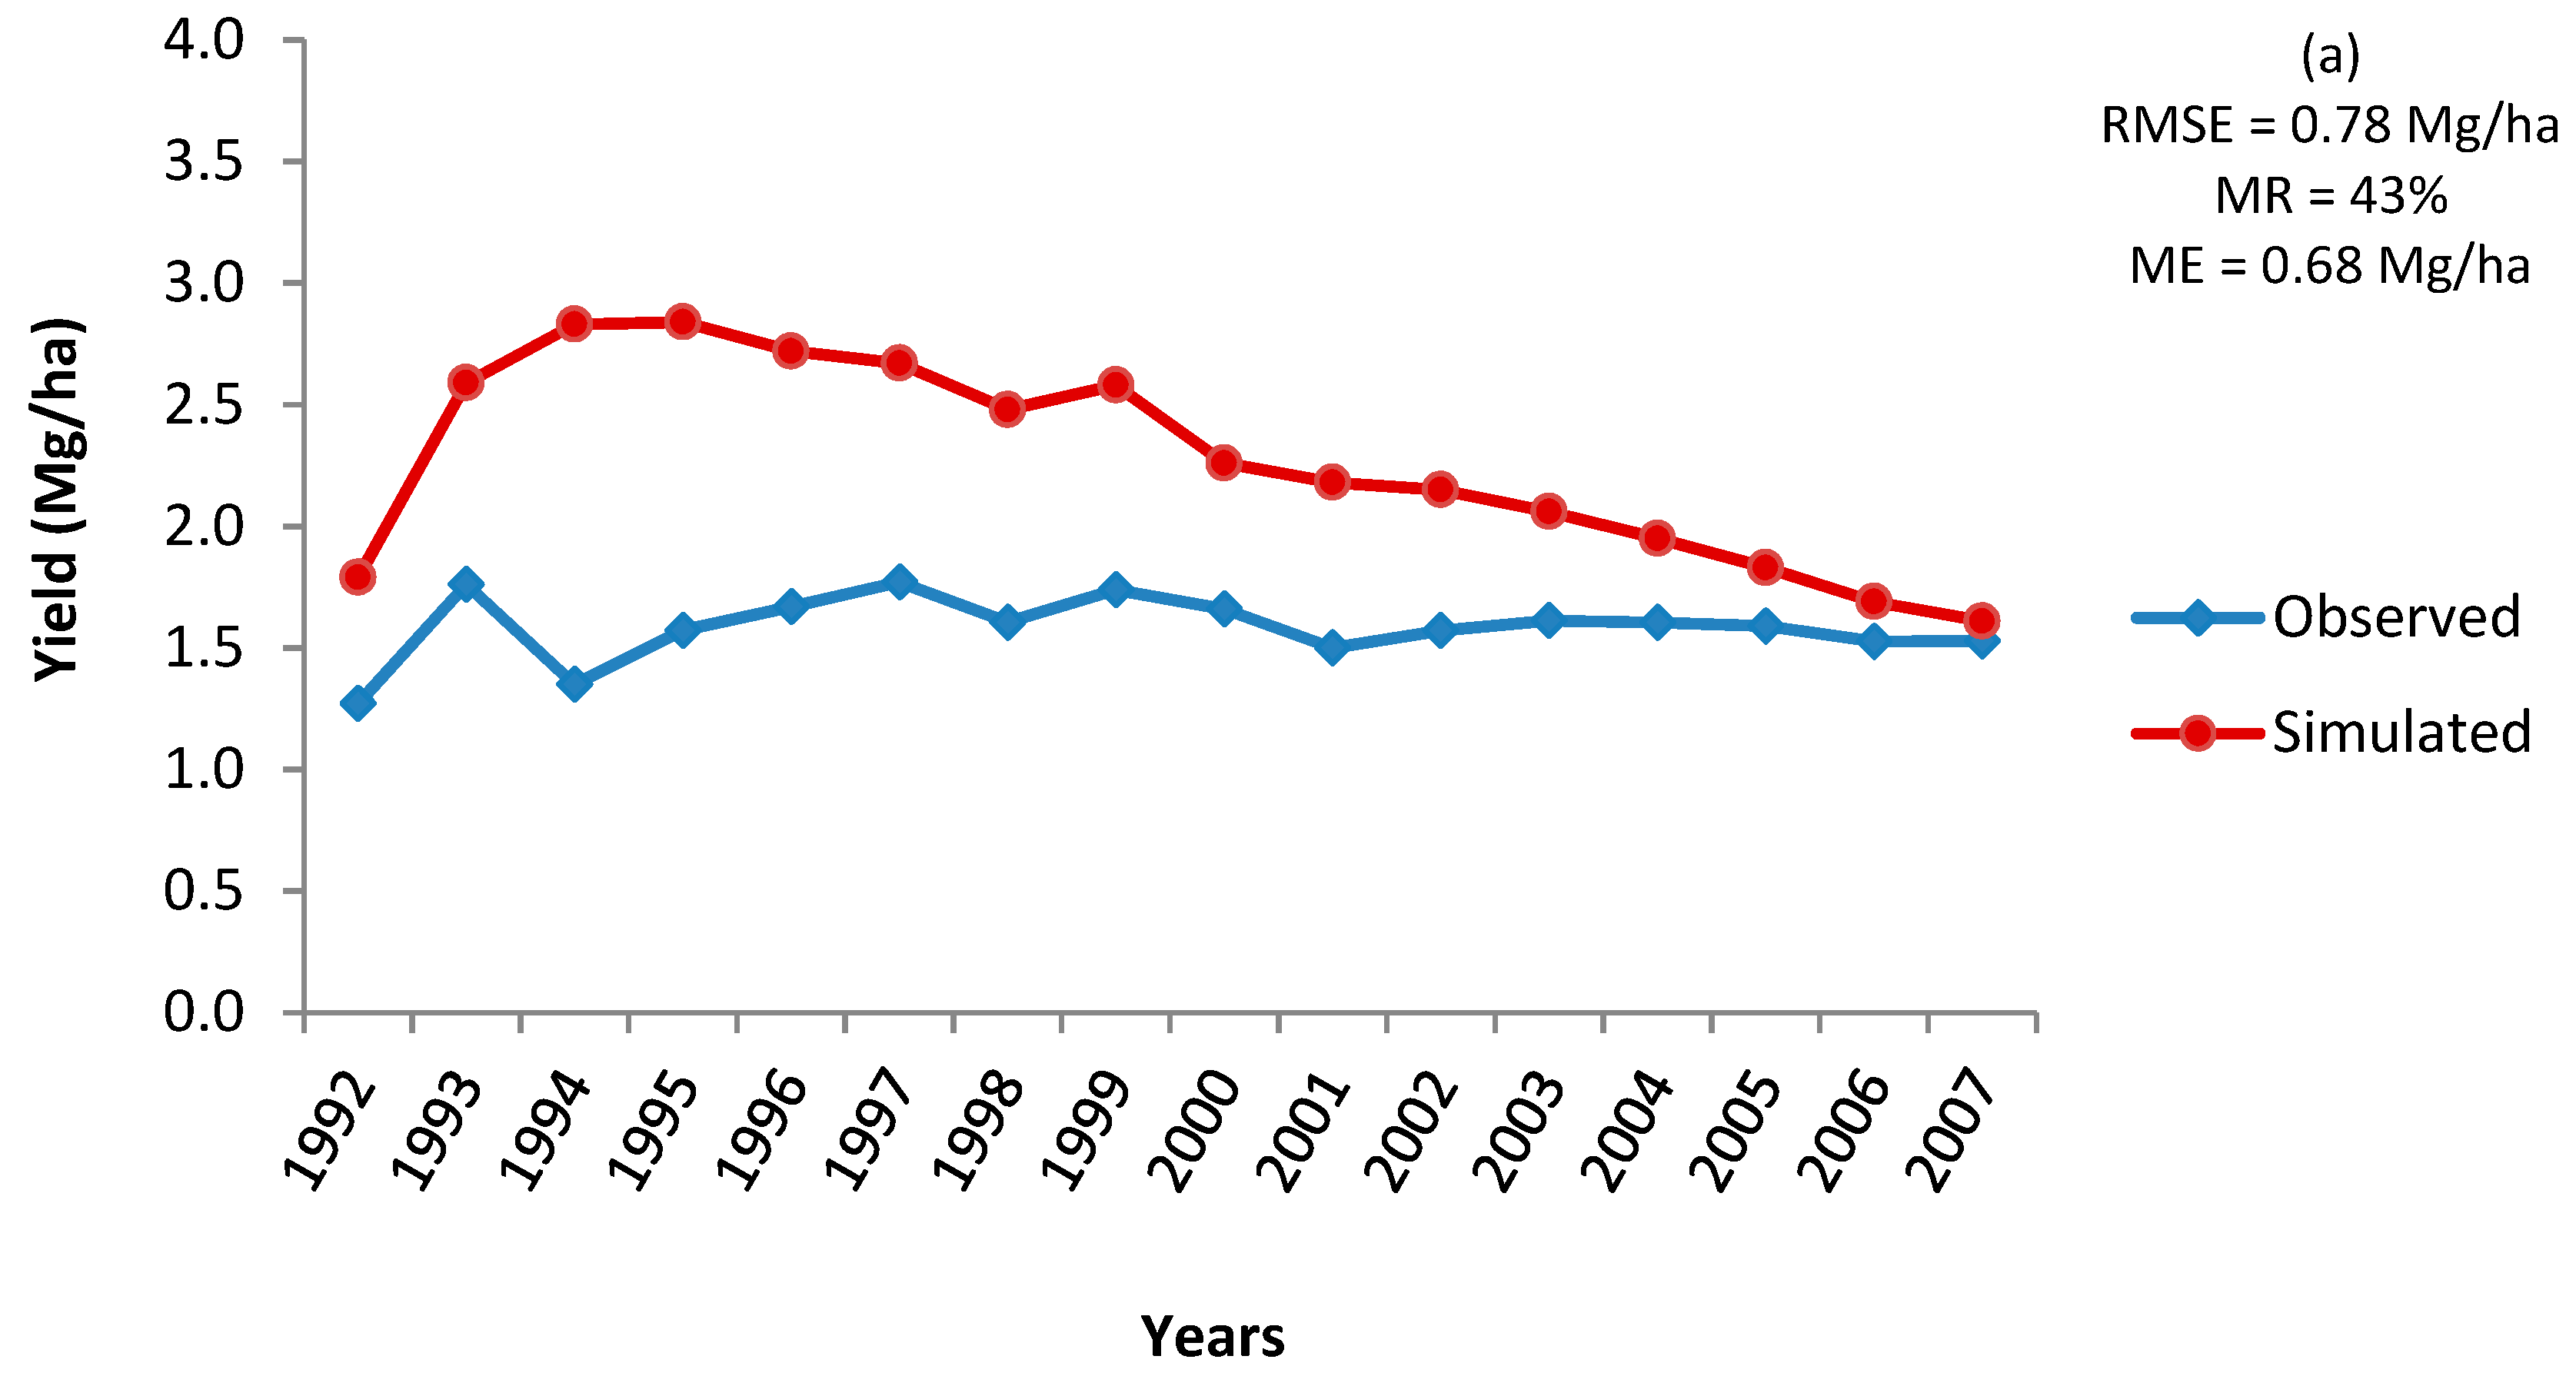
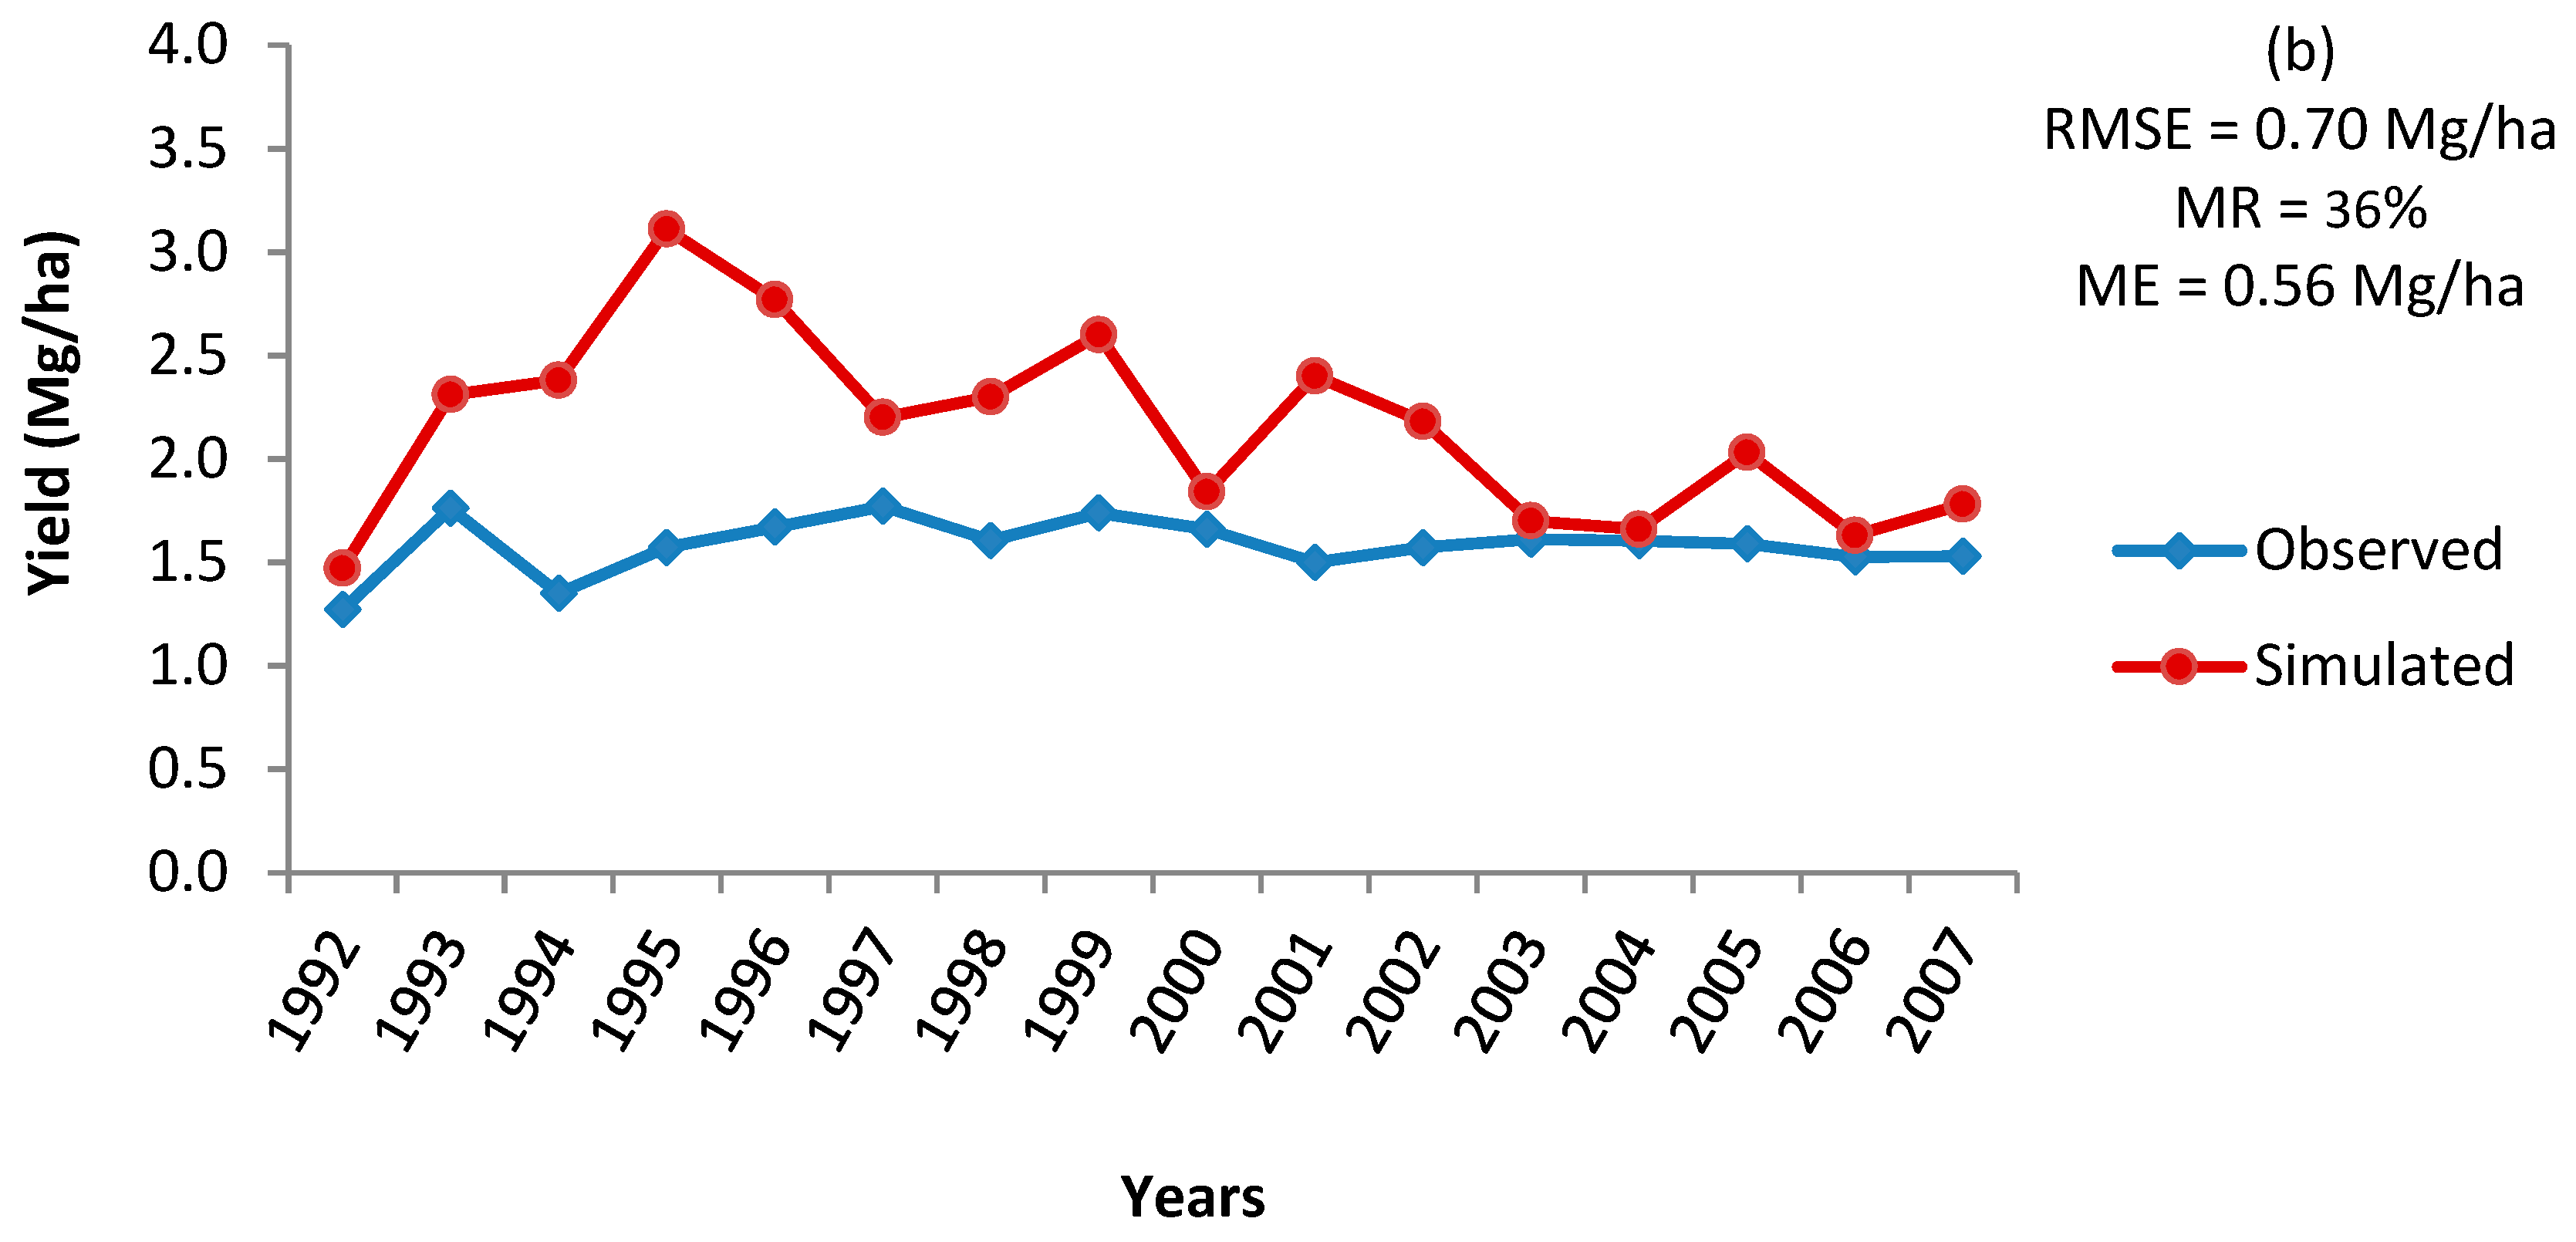
Table 5 for Ghana, Ethiopia and Nigeria. In Ghana, the RMSE of 0.78 Mg/ha was estimated between observed and simulated maize grain yield under Approach 1, whereas it was 0.70 Mg/ha under Approach 2 (
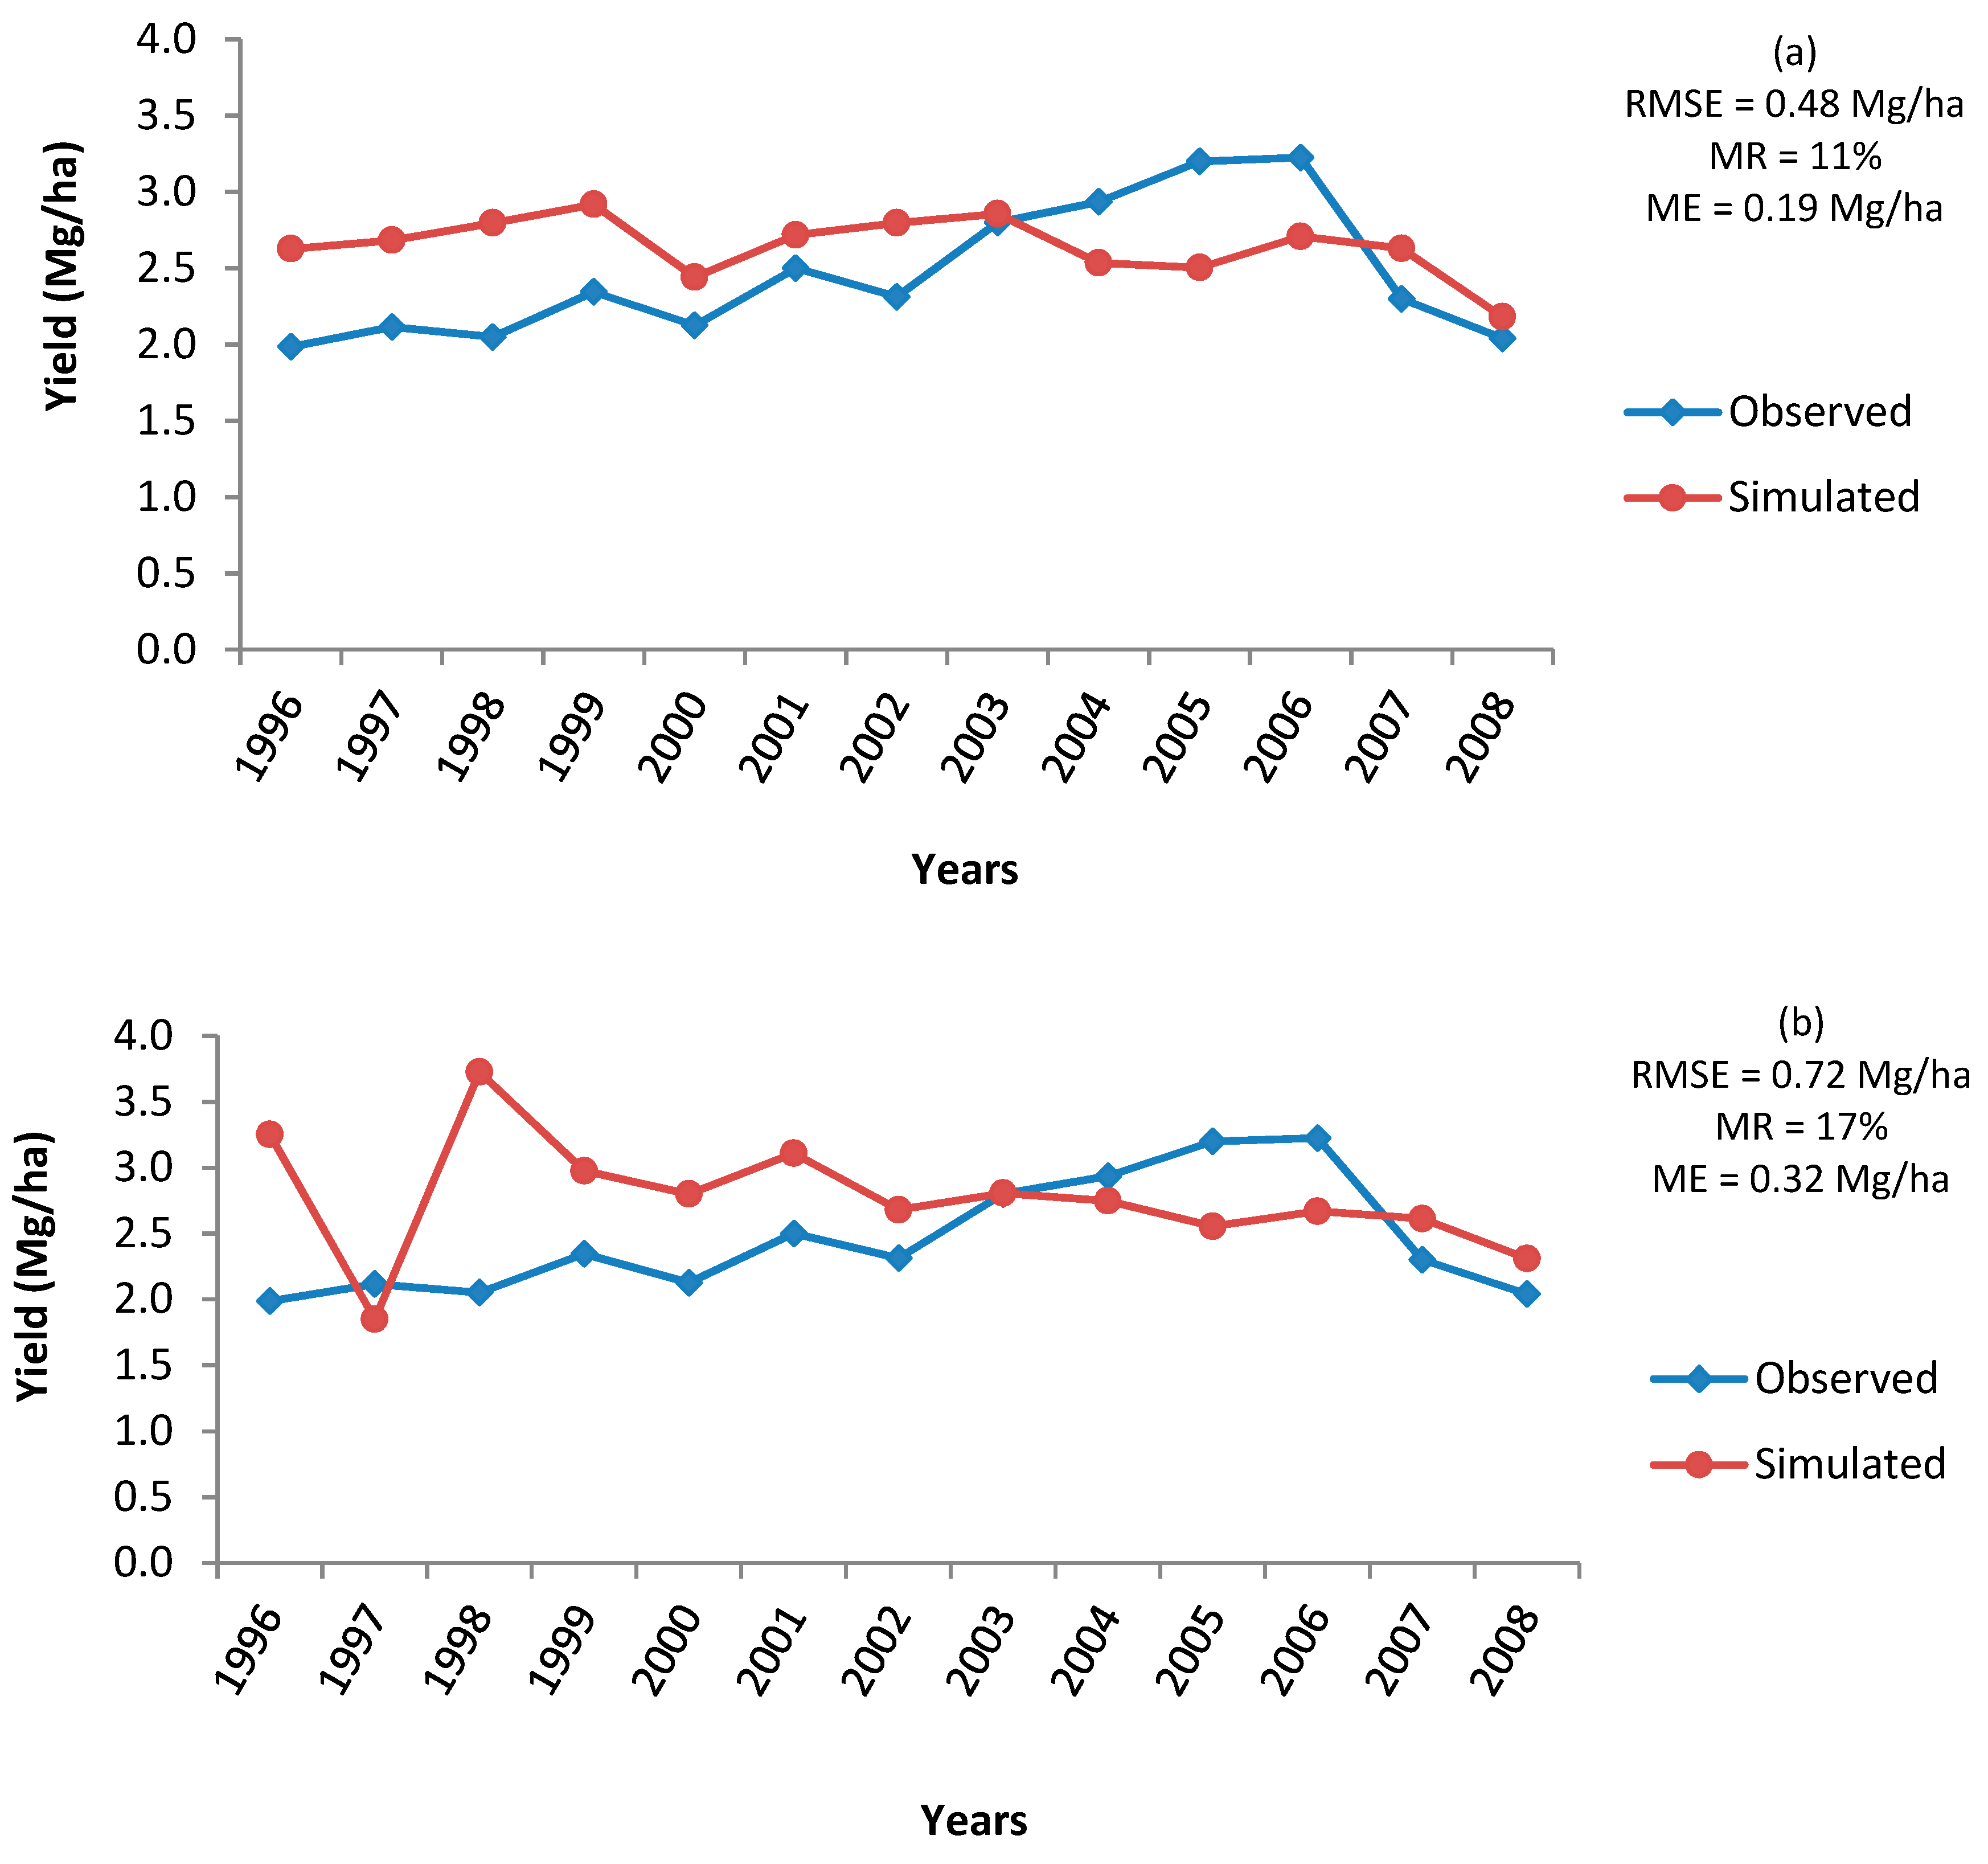
Figure 4). However, in Ethiopia, an RMSE of 0.48 Mg/ha and 0.72 Mg/ha was estimated under Approach 1 and 2 respectively (
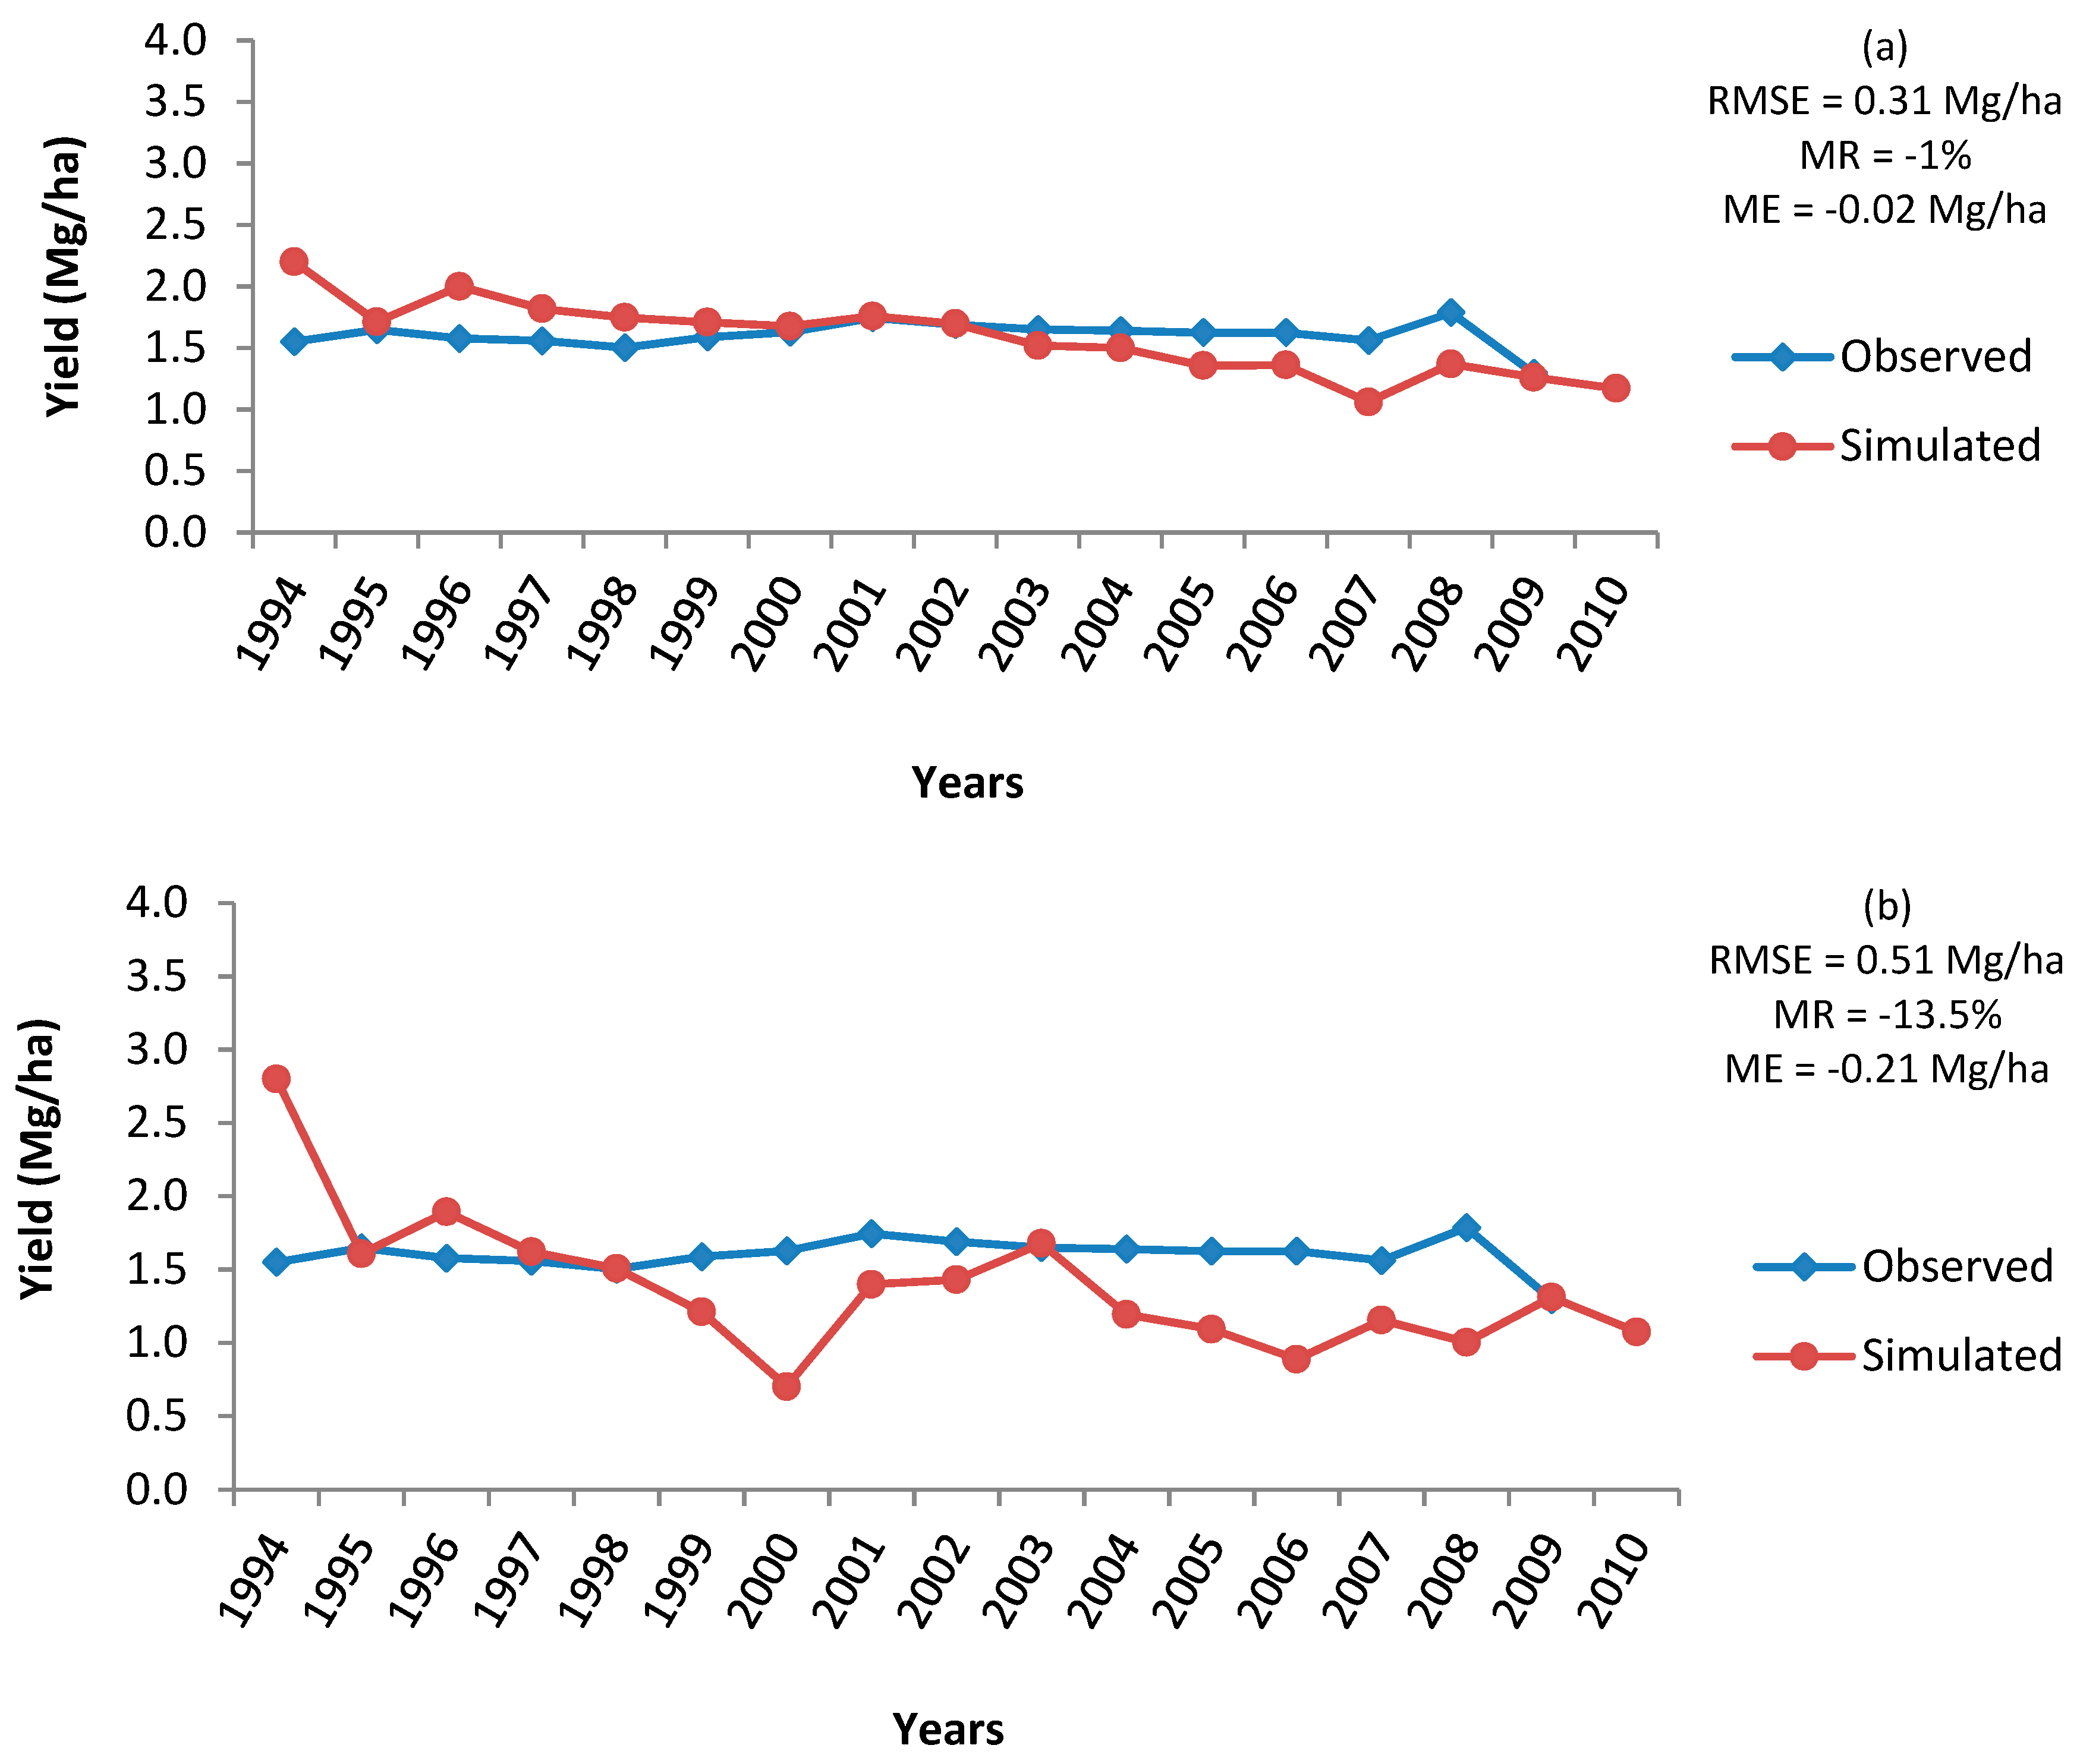
Figure 5), while, in Nigeria, the estimated RMSE under Approach 1 and 2 was 0.31 Mg/ha and 0.51 Mg/ha, respectively (Figure 6). [44] also reported the lower RMSE 0.70 Mg/ha for soybean yield simulations using the weather data from a single source (in this case, data were obtained from the interpolation of several ground-based station data), compared to the RMSE of 0.86 Mg/ha using the weather dataset compiled from different sources of data (in this case, data were obtained from a reanalysis of satellite and observed weather data).
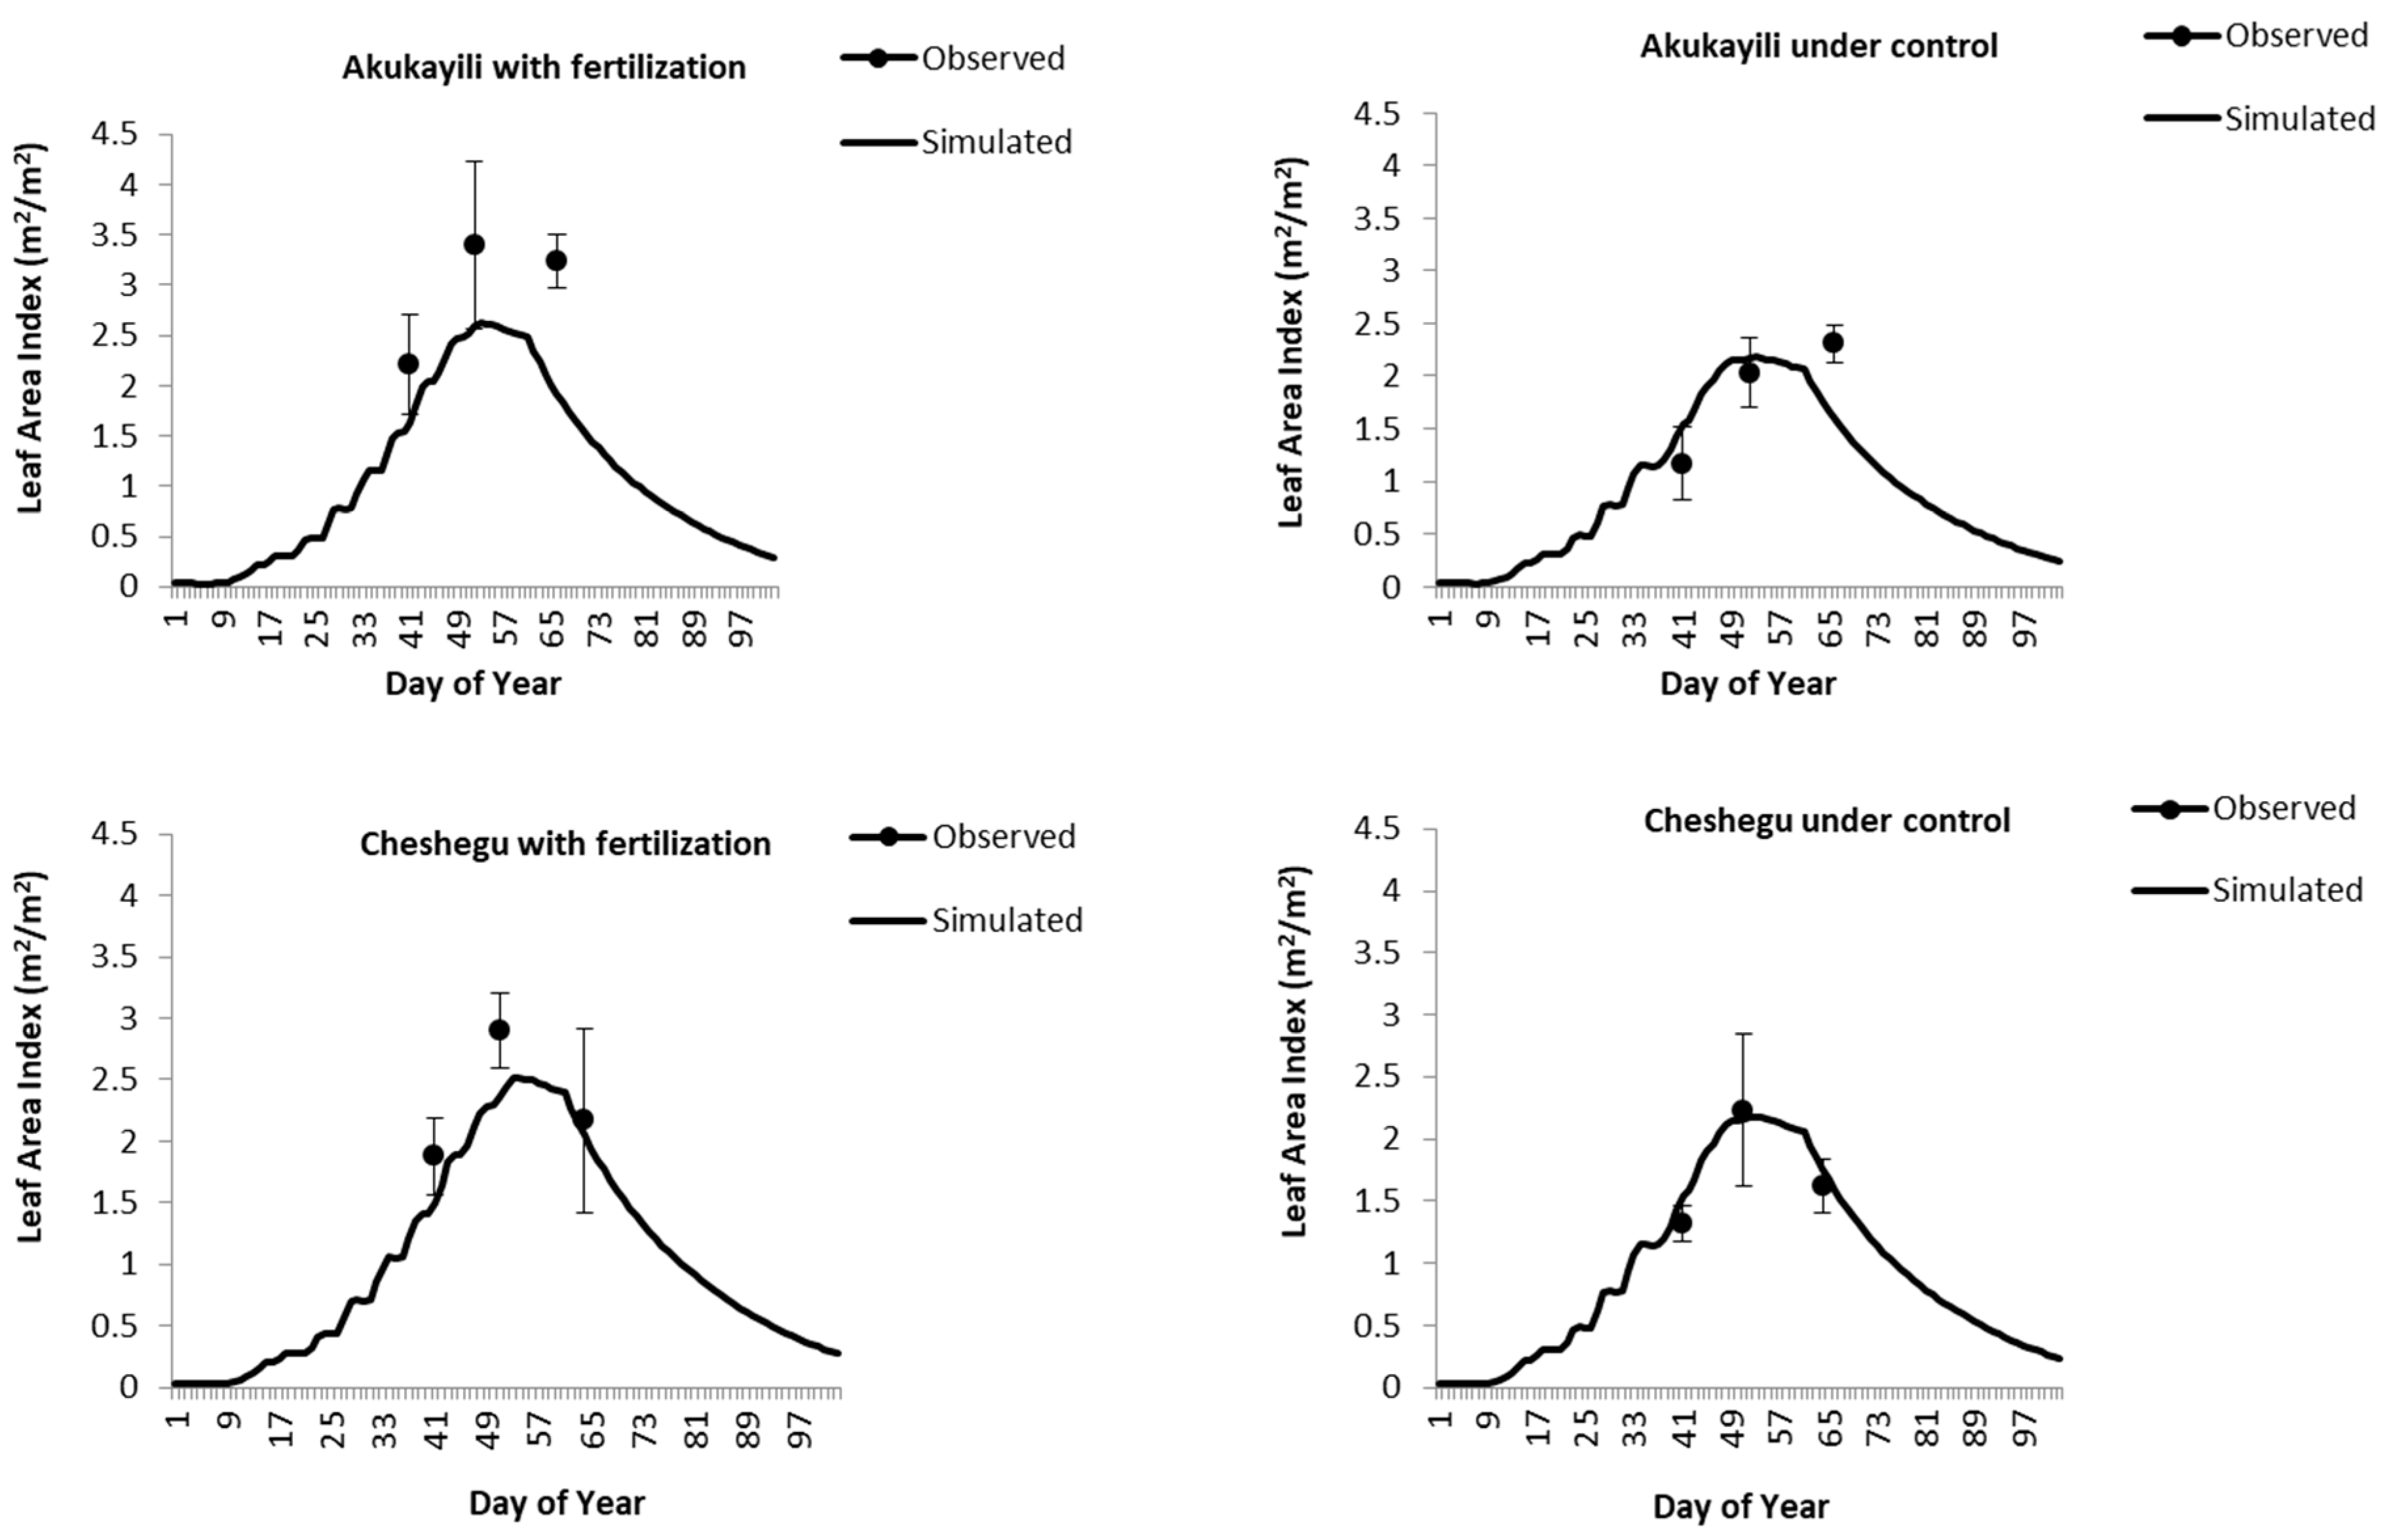
The correct estimation of crop phenological events is very important for reliable estimates for crop yield by crop models, since they also affect photosynthesis rate and crop sensitivity to water deficit [45]. There was a close agreement in the duration of simulated vegetative and reproductive phases between the two weather data sources in Ghana and Nigeria, as indicated by the associated low absolute errors (Table 6). However, in the case of Ethiopia, simulated vegetative and reproductive phases using Approach 2 weather dataset were longer by 8 and 11 days, respectively, with respect to the simulations using the Approach 1 dataset. This could be attributed to the lower mean temperature during the crop growth season under the Approach 2 dataset (Table 7). These results are in accordance with those observed in the U.S Corn Belt for different gridded weather data (error from 3 to 7 days) [46]. As the duration of vegetative and reproductive periods is defined by air temperature and photoperiod [47], the differences in the datasets for these variables were not big enough to cause statistically significant differences in crop phenology estimation.
The impacts of climate variables on crop growth and final yields are interactive; therefore, we used two major factors of crop growth under rain-fed conditions, i.e., radiation and precipitation, and compared the accumulation of solar radiation and precipitation during the crop growth period in the simulations. In Ghana, the accumulated radiation during the crop growth period was 1.9% higher in Approach 2 compared to the Approach 1 dataset, whereas accumulated precipitation was 24.5% higher in Approach 1 compared to that in the Approach 2 dataset (Table 7). In Ethiopia, the accumulated radiation and precipitation in the crop growth period was higher in the Approach 2 dataset by 12.3% and 9.9%, respectively, compared to the Approach 1 dataset. The same pattern was also estimated in Nigeria, but at a lower magnitude, whereas the accumulated radiation and precipitation in the crop growth period was higher in the Approach 2 dataset by 6.2% and 8.4%, respectively, compared to the Approach 1 dataset (Table 7).
The inter-annual variability of simulated crop yields can be more important than the mean. Therefore, besides average grain yield over the simulation period, standard deviations of grain yields were estimated from the inter-annual simulations using both weather datasets. The standard deviation in the observed maize yield in Ethiopia was 0.4 Mg/ha, whereas the standard deviations in the simulated yield with Approach 1 and Approach 2 datasets were 0.19 Mg/ha and 0.45 Mg/ha, respectively. The associated variability in the simulated maize yield was, therefore, 58.2% less under Approach 1 compared to those in the Approach 2 dataset, whereas, in Ghana, the standard deviation in the observed maize yield was 0.13 Mg/ha. The standard deviation in the simulated maize yields using the Approach 1 and Approach 2 datasets were 0.42 Mg/ha and 0.45 Mg/ha, respectively, resulting in approximately 8.2% higher variability in the simulated maize yields under the Approach 2 dataset compared to the Approach 1. The same pattern was estimated in Nigeria also, where the standard deviation in the observed maize yield was 0.11 Mg/ha, whereas, the standard deviations in the simulated yield with Approach 1 and Approach 2 datasets were 0.26 Mg/ha and 0.48 Mg/ha, respectively. The associated variability in the simulated maize yield was, therefore, less by 45.6% under Approach 1 compared to those in the Approach 2 dataset. Consequently, it can be inferred that the source of variability in simulated crop yields using Approach 1 and Approach 2 datasets relies on the accuracy of the cumulative precipitation data during the rain-fed growing season of the crop (Table 7), corroborating the findings of [12] which suggests that, in rain-fed cropping systems, accurate cumulative precipitation and correct temporal distribution are necessary. Recently, [48] reported the wheat grain and protein yields are expected to be lower and more variable in most-low-rainfall regions using consistent reanalysis weather dataset highlighting the importance of quality of climate dataset for climate impact assessment studies. [49] pointed out that the inconsistencies described in the reliability of precipitation data limit the capability of the products for climate monitoring, attribution, and model validation.
The findings of [50] also highlight the importance of weather dataset consistency. Variability in the wheat and rice yields predictions were in the range of −3 to +4% and −6 to +8%, respectively, using alternative combinations of different input precipitation and temperature datasets.

4. Conclusions

The results show the variability in the model estimates that arise as a result of the input climate data source. The two sources of climate data tested here were capable of producing both good and poor estimates of maize yields, ranging from the lowest RMSE = 0.31 Mg/ha in Nigeria to the highest RMSE = 0.78 Mg/ha in Ghana under Approach 1, whereas, under Approach 2, the RMSE ranges from the lowest value of 0.51 Mg/ha in Nigeria to the highest of 0.72 Mg/ha in Ethiopia. The estimated variability in the simulated maize yield was low under the Approach 1 dataset (in the magnitude of 58.2%, 8.2%, and 45.6% in Ethiopia, Ghana and Nigeria, respectively) compared to the yields simulated under the Approach 2 dataset. Our results indicate that the physical consistency between meteorological input variables is a relevant factor to consider in crop yield simulations under rain-fed conditions.

Author Contributions

Conceptualization, A.S. and T.G.; methodology; formal analysis, A.S.; writing-original draft preparation, A.S. and T.G; writing-review and editing, A.C., W.Z., C.M., F.E; All authors have read and agreed to the published version of the manuscript.

Funding

The work was done under the project BiomassWeb-GlobeE funded by the Federal Ministry of Education and Research (BMBF): FKZ031A258B.

Conflicts of Interest

The authors declare no conflict of interest. The funders had no role in the design of the study; in the collection, analyses, or interpretation of data; in the writing of the manuscript, or in the decision to publish the results.

References

  1. Nonhebel, S. Inaccuracies in weather data and their effects on crop growth simulation results. I. Potential production. Clim. Res. 1994, 4, 47–60. [Google Scholar]
  2. Porter, J.R.; Semenov, M.A. Crop responses to climatic variation. Philos. Trans. R. Soc. Lond. B. Biol. Sci. 2005, 360, 2021–2035. [Google Scholar] [CrossRef] [PubMed]
  3. Galmarini, S.; Cannon, A.J.; Ceglar, A.; Christensen, O.B.; de Noblet-Ducoudré, N.; Dentener, F.; Doblas-Reyes, F.J.; Dosio, A.; Gutierrez, J.M.; Iturbide, M.; et al. Adjusting climate model bias for agricultural impact assessment: How to cut the mustard. Clim. Serv. 2019, 13, 65–69. [Google Scholar] [CrossRef]
  4. Ullah, A.; Ahmad, A.; Khaliq, T.; Akhtar, J. Recognizing production options for pearl millet in Pakistan under changing climate scenarios. J. Integr. Agric. 2017, 16, 762–773. [Google Scholar] [CrossRef] [Green Version]
  5. Ceglar, A.; Kajfež-Bogataj, L. Simulation of maize yield in current and changed climatic conditions: Addressing modelling uncertainties and the importance of bias correction in climate model simulations. Eur. J. Agron. 2012, 37, 83–95. [Google Scholar] [CrossRef]
  6. Bai, J.; Chen, X.; Dobermann, A.; Yang, H.; Cassman, K.G.; Zhang, F. Evaluation of NASA Satellite – and Model-Derived Weather Data for Simulation of Maize Yield Potential in China. Agron. J. 2010, 102, 9–16. [Google Scholar] [CrossRef]
  7. Rivington, M.; Matthews, K.B.; Bellocchi, G.; Buchan, K. Evaluating uncertainty introduced to process-based simulation model estimates by alternative sources of meteorological data. Agric. Syst. 2006, 88, 451–471. [Google Scholar] [CrossRef]
  8. Hoogenboom, G. Contribution of agrometeorology to the simulation of crop production and its application. Agricul. For. Meterol. 2000, 103, 137–157. [Google Scholar] [CrossRef]
  9. Ley, T.W.; Elliot, R.L.; Bausch, W.C.; Brown, P.W.; Elwell, D.L.; Tanner, B.D. Review of ASAE Standards Project X505: Measurement and Reporting Practices for Automatic Aricultural Weather Stations; American Society of Agricutural Engineers: St. Joseph, MI, USA, 1994; pp. 94–2086. [Google Scholar]
  10. Lashkari, A.; Salehnia, N.; Asadi, S.; Paymard, P.; Zare, H.; Bannayan, M. Evaluation of different gridded rainfall datasets for rainfed wheat yield prdiction in an arid environment. Int. J. Biometeorol. 2018, 62, 1543–1556. [Google Scholar] [CrossRef]
  11. Aggarwal, P.K. Uncertainties in crop, soil, and weather inputs used in growth models -implications for simulated outputs and their applications. Agric. Syst. 1995, 48, 336–384. [Google Scholar] [CrossRef]
  12. Ramarohetra, J.; Sultan, B.; Baron, C.; Gaiser, T.; Gosset, M. How satellite rainfall estimate errors may impact rainfed cereal yield simulation in West Africa. Agricul. For. Meterol. 2013, 180, 118–131. [Google Scholar] [CrossRef]
  13. Qian, B.; De Jong, R.; Yang, J.; Wang, H.; Gameda, S. Comparing simulated crop yields with observed and synthetic weather data. Agricul. For. Meterol. 2011, 151, 1781–1791. [Google Scholar] [CrossRef]
  14. Thornton, P.K.; Bowen, W.T.; Ravelo, A.C.; Wilkens, P.W.; Farmer, G.; Brock, J.; Brink, J.E. Estimating millet production for famine early warning: an application of crop simulation modelling using satellite and ground-based data in Burkina Faso. Agricul. For. Meterol. 1997, 83, 95–112. [Google Scholar] [CrossRef]
  15. Srivastava, A.K.; Mboh, C.M.; Gaiser, T.; Webber, H.; Ewert, F. Effect of sowing date distributions on simulation of maize yields at regional scale – A case study in Central Ghana, West Africa. Agric. Syst. 2016, 147, 10–23. [Google Scholar] [CrossRef]
  16. Tola, G.A. The Effect of Rainfall Variability on Maize Production in Central and Western Ethiopia. Ph.D. Thesis, University of Bonn, North Rhine-Westphalia, Germany, 2015. [Google Scholar]
  17. Terrestrial Hydrology Research Group. Available online: http://hydrology.princeton.edu/data.php.gov (accessed on 8 February 2020).
  18. Sheffield, J.; Goteti, G.; Wood, E.F. Development of a 50-yr high-resolution global dataset of meteorological forcings for land surface modelling. J. Clim. 2006, 19, 3088–3111. [Google Scholar] [CrossRef] [Green Version]
  19. NASA GEWEX Surface Radiation Budget. Available online: http://gewex-srb.larc.nasa.gov (accessed on 8 February 2020).
  20. UCAR NCAR Climate Data Guide. Available online: https://climatedataguide.ucar.edu/gov (accessed on 8 February 2020).
  21. NOAA Data Discovery Portal. Available online: https://data.noaa.gov (accessed on 8 February 2020).
  22. Novella, N.S.; Thiaw, W.M. African Rainfall Climatology Version 2 for Famine Early Warning Systems. J. Appl. Meteorol. Clim. 2013, 52, 588–606. [Google Scholar] [CrossRef]
  23. Saha, S.; Moorthi, S.; Pan, H.L.; Wu, X.; Wang, J.; Nadiga, S.; Tripp, P.; Kistler, R.; Woollen, J.; Behringer, D.; et al. The NCEP Climate Forecast System Reanalysis. Bull. Am. Meteorol. Soc. 2010, 91, 1015–1057. [Google Scholar] [CrossRef]
  24. ISRIC World Soil Information. Available online: http://www.isric.org/data/soil-property-maps-africa-1-km (accessed on 8 February 2020).
  25. Rawls, W.J.; Ahuja, L.R.; Maidment, D.R. Handbook of Hydrology; McGraw-Hill: New York, NY, USA, 1993; p. 1442. [Google Scholar]
  26. Folberth, C.; Gaiser, T.; Abbaspour, K.C.; Schulin, R.; Yang, H. Regionalization of a large-scale crop growth model for sub-Saharan Africa: Model setup, evaluation, and estimation of maize yields. Agric. Ecosyst. Environ. 2012, 151, 21–33. [Google Scholar] [CrossRef]
  27. Sacks, W.J.; Deryng, D.; Foley, J.A.; Ramankutty, N. Crop planting dates: an analysis of global patterns. Glob. Ecol. Biogeogr. 2010, 19, 607–620. [Google Scholar] [CrossRef]
  28. FAO. FAOSTAT statistical database. Food and Agricultural Organization of the UN, Rome. 2010. Available online: http://faostat.fao.org (accessed on 5 February 2020).
  29. Jaleta, M.; Yirga, M.; Kassie, C.; de Groote, H.M.; Shiferaw, B. Knowledge, Adoption and Use Intensity of Improved Maize Technologies in Ethiopia. In Proceedings of the 4th International Conference of the African Association of Agricultural Economists, Hammamet, Tunisia, 22–25 September 2013; pp. 22–25. [Google Scholar]
  30. Kassie, B.T.; Asseng, S.; Rotter, R.P.; Hengsdijk, H.; Ruane, A.C.; van Ittersum, M.K. Exploring climate change impacts and adaptation options for maize production in the Central Rift Valley of Ethiopia using different climate change scenarios and crop models. Clim. Chang. 2015, 129, 145–158. [Google Scholar] [CrossRef]
  31. Available online: www.kwadp.org (accessed on 8 February 2020).
  32. Available online: www.kids.fao.org (accessed on 8 February 2020).
  33. Lopez, G.; Kolem, H.B.; Srivastava, A.K.; Gaiser, T.; Ewert, F. A Model-Based Estimation of Resource Use Efficiencies in Maize Production in Nigeria. Sustainability. 2019, 11, 5114. [Google Scholar] [CrossRef] [Green Version]
  34. Addiscott, T.M.; Whitmore, A.P. Simulation of solute leaching in soils with different permeabilities. Soil Use Manag. 1991, 7, 94–102. [Google Scholar] [CrossRef]
  35. Gaiser, T.; Perkons, U.; Kupper, P.M.; Kautz, T.; Puschmann, D.U.; Ewert, F.; Enders, A.; Krauss, G. Modeling biopore effects on root growth and biomass production on soils with pronounced sub-soil clay accumulation. Ecol. Model. 2013, 256, 6–15. [Google Scholar] [CrossRef]
  36. Srivastava, A.K.; Mboh, C.M.; Faye, B.; Gaiser, T.; Kuhn, A.; Ermias, E.; Ewert, F. Options for Sustainable Intensification of Maize Production in Ethiopia. Sustainability. 2019, 11, 1707. [Google Scholar] [CrossRef] [Green Version]
  37. Faye, B.; Webber, H.; Diop, M.; Mbaye, M.; Owusu-Sekyere, J.D.; Naab, J.B.; Gaiser, T. Potential impact of climate change on peanut yield in Senegal, West Africa. Field Crop. Res. 2018, 219, 148–159. [Google Scholar] [CrossRef]
  38. Srivastava, A.K.; Mboh, C.M.; Gaiser, T.; Ewert, F. Impact of climatic variables on the spatial and temporal variability of crop yield and biomass gap in Sub-Saharan Africa-a case study in Central Ghana. Field Crop. Res. 2017, 203, 33–46. [Google Scholar] [CrossRef]
  39. Trawally, D.; Webber, H.; Agyare, W.A.; Fosu, M.; Naab, J.; Gaiser, T. Effect of heat stress on two maize varieties under irrigation in Northern Region of Ghana. Int. J. Biol. Chem. Sci. 2015, 9, 1571–1587. [Google Scholar]
  40. Wolf, J. User guide for LINTUL5: Simple generic model for simulation of crop growth under potential, water limited and nitrogen, phosphorus and potassium limited conditions. Wageningen UR. 2012, 1–63. [Google Scholar]
  41. Allen, R.G.; Pereira, L.S.; Raes, D.; Smith, M. Crop Evapotranspiration: Guidelines for Computing Crop Water Requirements. Irrigation & Drainage Paper 56; FAO: Rome, Italy, 1998; Volume 300, p. 301. [Google Scholar]
  42. Papula, A. Mathematik fur Chemiker, 2nd ed.; Enke-Verlag: Stuttgart, Germany, 1982; p. 405. [Google Scholar]
  43. Duveiller, G.; Fasbender, D.; Meroni, M. Revisiting the concept of a symmetric index of agreement for continuous datasets. Sci. Rep. 2016, 6, 19401. [Google Scholar] [CrossRef]
  44. Battisti, R.; Bender, F.D.; Sentelhas, P.C. Assessment of different gridded weather data for soybean yield simulations in Brazil. Theor. Appl. Climatol. 2018, 135, 237–247. [Google Scholar] [CrossRef]
  45. Battisti, R.; Sentelhas, P.C. Drought tolerance of Brazilian soybean cultivars simulated by a simple agrometeorological yield model. Exp. Agric. 2015, 51, 285–298. [Google Scholar] [CrossRef]
  46. Mourtzinis, S.; Edreira, J.I.R.; Conley, S.P.; Grassini, P. From grid to field: assessing quality of gridded weather data for agricultural applications. Eur. J. Agron. 2017, 82, 163–172. [Google Scholar] [CrossRef] [Green Version]
  47. Boote, K.J.; Jones, J.W.; Batchelor, W.D.; Nafziger, E.D.; Myers, O. Genetic coefficients in the CROPGRO-Soybean model: link to field performance and genomics. Agron. J. 2003, 95, 32–51. [Google Scholar] [CrossRef]
  48. Asseng, S.; Martre, P.; Maiorano, A. Climate change impact and adaptation for wheat protein. Glob. Change Biol. 2019, 25, 155–173. [Google Scholar] [CrossRef] [PubMed] [Green Version]
  49. Sun, Q.; Miao, C.; Duan, Q.; Ashouri, H.; Sorooshian, S.; Hsu, K.L. A Review of Global Precipitation Data Sets: Data Sources, Estimation, and Intercomparisons. Rev. Geophys. 2018, 56, 79–107. [Google Scholar] [CrossRef] [Green Version]
  50. Parkes, B.; Higginbottom, T.P.; Hufkens, K.; Ceballos, F.; Kramer, B.; Foster, T. Weather dataset choice introduces uncertainty to estimates of crop yield responses to climate variability and change. Env. Res. Lett. 2019, 14, 124089. [Google Scholar] [CrossRef]
Figure 1. Observed and simulated Leaf Area Index (m2/m2) at two experimental sites Akukayili (upper row) and Cheshegu (lower row) in Ghana under fertilized and control conditions.
Atmosphere 11 00180 g001
Figure 2. Observed and simulated maize yield (variety BH660) in (Mg/ha) at two experimental sites, Bako (a) and Jimma (b), in Ethiopia under fertilized conditions.
Atmosphere 11 00180 g002
Figure 3. Map showing simulation units in Ethiopia, Ghana and Nigeria.
Atmosphere 11 00180 g003
Figure 4. Comparison of observed and simulated maize yield in central Ghana for 16 years (1992–2007) using weather data under Approach 1 (where data were obtained from a single source) (a) and Approach 2 (where data were obtained from different sources) (b).
Atmosphere 11 00180 g004aAtmosphere 11 00180 g004b
Figure 5. Comparison of observed and simulated maize yield in Oromia region in Ethiopia for 13 years (1996–2008) using weather data under Approach 1 (where data were obtained from a single source) (a), and Approach 2 (where data were obtained from different sources) (b).
Atmosphere 11 00180 g005
Figure 6. Comparison of observed and simulated maize yield in Nigeria for 17 years (1994–2010) using weather data under Approach 1(where data was obtained from a single source) (a), and Approach 2 (where data was obtained from different sources) (b).
Atmosphere 11 00180 g006
Table 1. Summary of variables in the dataset used in Approach 1 and 2. Source given in the bracket () is used for downscaling the NCEP-NCAR reanalysis coarse data to a finer scale.
Variable (and units)Source (Approach 1)Source (Approach 2)Reference
Solar Radiation (MJ/m2/day)NCEP-NCAR reanalysisSRB release 3.0[19]
Air temperature (°C)NCEP (CRU TS2.0)CFSR[20]
Precipitation (mm/day)GPCPARC2[21]
TRMM
Wind speed (m/s)NCEP-NCAR reanalysisCFSR[20]
Table 2. Crop parameters of LINTUL5 used in the study for maize variety ‘Obatanpa’ and ‘BH660’.
Crop parametersDescription Unit Value (Obatanpa/BH660)
TSUM1Temperature sum from emergence to anthesis°C day−11060/680
TSUM2Temperature sum from anthesis to maturity°C day−1990/760
TBASEMLower threshold temperature for emergence°C8.0
TEFFMXMaximum effective temperature for emergence°C30.0
TSUMEMTemperature sum from sowing to emergence°C56.0
RUE-0.0Radiation use efficiency at development stage 0g MJ−13.8/3.2
RUE-1.25Radiation use efficiency at development stage 1.25g MJ−13.8/2.5
RUE-1.50Radiation use efficiency at development stage 1.50g MJ−13.0/2.2
RUE-1.75Radiation use efficiency at development stage 1.75g MJ−12.0
RUE-2.0Radiation use efficiency at development stage 2.0g MJ−11.4
SLATB-0.0Specific leaf area at development stage 0m2 g−10.022/0.03
SLATB-0.9Specific leaf area at development stage 0.9m2 g−10.03/0.02
SLATB-1.0Specific leaf area at development stage 1.0m2 g−10.032/0.02
SLATB-2.0Specific leaf area at development stage 2.0m2 g−10.02
LAI critical Critical leaf area beyond which leaves die due to self-shadingm2 m−24
RGRLAIMaximum relative increase in LAIha ha−1 day−10.02
ROOTDIInitial rooting depthm0.1
ROOTDMMaximum rooting depth m1
RRDMAXMaximum rate of increase in rooting depthm0.012
TDWIInitial total crop dry weight kg ha−15
Table 3. Observed and simulated values of grain yield, Aboveground biomass (AGB), Day of Anthesis (DOA), Day of Maturity (DOM), mean residual error (ME), and mean absolute error (MR), N = number of replicates for the maize variety (Obatanpa) in two sites Akukayili and Cheshegu (Ghana).
VarietySite TreatmentNDOADOADOMDOMGrain YieldGrain YieldMEMR
ObservedSimulatedObservedSimulatedObserved (Mg/ha)Simulated (Mg/ha)Grain Yield (Mg/ha)Grain Yield
Akukayili
Control459561031030.31.00.72.3
Fertilized456561031032.63.50.90.3
Obatanpa
Cheshegu
Control460561111030.31.10.82.7
Fertilized456561111032.73.30.60.2
Table 4. Observed and simulated values of grain yield, Day of Anthesis (DOA), Day of Maturity (DOM), mean residual error (ME), and mean absolute error (MR), for the maize variety BH660 in the two sites Bako and Jimma (Ethiopia).
Variety Site Treatment DOADOADOMDOMGrain Yield Grain Yield MEMR
ObservedSimulatedObservedSimulatedObserved (Mg/ha)Simulated (Mg/ha) Grain Yield (Mg/ha) Grain Yield
Bako Fertilized81821581609.29.70.55.4
BH660
JimmaFertilized707416016110.010.40.44.0
Table 5. Mielke index for five weather variables (Precipitation, Radiation, Minimum Temperature, Maximum Temperature, and Windspeed) for Approach 1 and 2 in study areas in Ghana, Ethiopia, and Nigeria.
PrecipitationRadiation Min. Temp.Max. Temp.Windspeed
Ghana0.150.990.560.400.48
Ethiopia0.980.380.410.630.04
Nigeria0.290.470.570.540.46
Table 6. Simulated length of the vegetative and reproductive period (in days) with Approach 1 (A-1) and Approach 2 (A-2) and the associated differences [(A-1) – (A-2)] in Ghana, Ethiopia, and Nigeria.
Vegetative Period (in days) Reproductive Period (in days)
A-1A-2Difference [(A-1)-(A-2)]A-1A-2Difference [(A-1)-(A-2)]
Ghana4745246433
Ethiopia7078−87485−11
Nigeria4341238371
Table 7. Cumulative Radiation (in MJ), Precipitation (in mm) and Mean Temperature (in °C) values in crop growth period under Approach 1 (A-1) and Approach 2 (A-2) and the difference [(A-1) – (A-2)] (in %) in Ghana, Ethiopia, and Nigeria.
Radiation PrecipitationMean Temperature
A-1A-2% DifferenceA-1A-2% DifferenceA-1A-2% Difference
Ghana17581792.11.9489.8369.9−24.527.429.99.1
Ethiopia2743.43127.614.01072.81190.610.918.417.2−6.5
Nigeria1464.81561.76.6354.3386.99.228.629.73.8

