Article

Deaths Attributable to Air Pollution in Nordic Countries: Disparities in the Estimates

1
Finnish Institute for Health and Welfare (THL), Public health solutions, 00300 Helsinki, Finland
2
Faculty of Health Sciences, School of Pharmacy, University of Eastern Finland (UEF), 70701 Kuopio, Finland
3
Department of Environmental Science, Atmospheric Modelling Section, Aarhus University, 4000 Roskilde, Denmark
4
Interdisciplinary Center for Climate Change (iCLIMATE), Aarhus University, 4000 Roskilde, Denmark
5
Division for Infectious Diseases and Environmental Health, Norwegian Institute for Public Health, POB 222, Skøyen, N-0213 Oslo, Norway
6
IVL Swedish Environmental Research Institute, P.O. Box 53021, 40014 Göteborg, Sweden
7
Department of Environmental Science, Social Science and Geography section, Aarhus University, 4000 Roskilde, Denmark
*
Author to whom correspondence should be addressed.
Atmosphere 2020, 11(5), 467; https://doi.org/10.3390/atmos11050467
Submission received: 31 March 2020 / Revised: 29 April 2020 / Accepted: 1 May 2020 / Published: 5 May 2020
(This article belongs to the Special Issue Health Impact Assessment of Air Pollution)

Abstract

:
Particulate matter air pollution is widely considered as the leading environmental cause of premature mortality. However, there are substantial differences in the estimated health burden between the assessments. The aim of this work is to quantify the deaths attributable to ambient air pollution in Nordic countries applying selected assessment tools and approaches, and to identify the main disparities. We quantified and compared the estimated deaths from three health risk assessment tools and from a set of different concentration-response functions. A separate analysis was conducted for the impacts of spatial resolution of the exposure model on the estimated deaths. We found that the death rate (deaths per million) attributable to PM2.5 and O3 were the highest in Denmark and the lowest in Iceland. In the five Nordic countries, the results between the three tools ranged from 8500 to 11,400 for PM2.5 related deaths, and for ozone from 230 to 260 deaths in 2015. Substantially larger differences were found between five concentration-response functions. The shape of concentration-response functions, and applied theoretical thresholds led to substantial differences in the estimated deaths. Nordic countries are especially sensitive to theoretical thresholds due to low exposures. Sensitivity analysis demonstrated that when using spatial exposure assessment methods, high spatial resolution is necessary to avoid underestimation of exposures and health effects.

1. Introduction

Ambient air pollution, especially particulate matter, is among the biggest environmental health risks globally [1,2,3,4]. Exposure to air pollution is linked with non-communicable diseases such as cardiovascular and respiratory diseases, and cancers [5]. While different assessments recognize the importance of ambient air pollution as a health risk, there are substantial differences in the estimated deaths. For instance in the Global Burden of Disease (GBD) study [2] it was estimated that 2.9 million deaths were related to fine particle (PM2.5) exposure in 2017, while Burnett et al. (2018) estimated 8.9 million deaths in 2015 [2]. These disparities are mainly due to methodological differences [6].
A review by Papadogeorgou et al. (2019) [7] related to health effects of fine particles at low exposure levels report statistically significant associations between long-term fine particle exposure and total mortality as well as mortality due to cardiovascular diseases and respiratory diseases. In the Nordic countries, annual ambient air pollution levels are relatively low, and generally meet the EU guideline values. Regardless of the low exposures, ambient air pollution remains a significant environmental risk factor in Nordic countries. For instance, in Sweden and Finland, 7600 and 2000 premature deaths, respectively, were attributable to air pollution in 2015 [8,9]. Premature deaths attributable to air pollution are leading to considerable economic costs. In four Nordic countries (Denmark, Sweden, Finland and Norway), air pollution related deaths were estimated to lead to a total cost of 7 billion euros in 2015 [10].
In the burden of disease assessments, population exposures are often linked with health outcomes using relative risks (RR) from epidemiological studies. The relation between increase in exposure and associated increase in risk at low levels of air pollution has often been assumed to be linear [11]. However, over the past decade supra-linear shapes with steeper risk increase at lower exposure levels have been suggested [7,12,13,14]. Burnett et al. 2014 [14] presented integrated exposure-response (IER) functions which combine relative risks from different air pollution sources into non-linear functions. The IER functions include theoretical thresholds (Theoretical Minimum Risk Exposure Level, TMREL) which are assigned as “a uniform distribution with lower/ upper bounds given by the average of the minimum and 5th percentile of outdoor air pollution cohort studies exposure distributions conducted in North America” [15]. The IER functions have become the main concentration-response (C-R) functions used in the GBD studies for fine particle exposure.
Several tools are developed for estimation of air pollution related health burden. Anenberg et al. (2016) [16] conducted the first systematic survey of air pollution health risk assessment tools, where they reviewed 17 tools. They concluded that these tools had several common characteristics like similar sources for C-R functions, population data and baseline mortality rates. However, several important differences were reported e.g., related to exposure data sources, format and technical properties.
While Anenberg et al. (2016) [16] focused more on qualitative comparison of health risk assessment tools; Malmqvist et al. (2018) [17] also quantified disparities in different scenarios of air pollution levels (cut-off points), compared two different coefficients for mortality and looked at the impact of the study population on the results. The differences were remarkable, for instance, the use of the Beelen et al. (2014) [18] coefficient for natural-cause mortality (hazard ratio (HR) 1.14 per 10 µg/m3) instead of Pope et al. (2002) [19] coefficient for all-cause mortality (HR 1.06 per 10 µg/m3) doubled the mortality estimates.
In another follow-up study, Beelen et al. (2014) [18] results were analyzed for sub-regional differences in the C-R relationships between South European, Central and Nordic cohorts [20]. Even though not statistically significant, the results were consistent with the hypothesis that in the more northern climates buildings are tighter, better insulated, and protect occupants also partly from ambient air pollution.
Recent reports [21,22,23] have increasingly pointed to the need for reviewing the impacts of air pollution in the Nordic countries due to the large uncertainties in estimating the effects at low exposure levels. Currently there is no consensus on which shape of the concentration-response function should be applied and whether a threshold should be used.
The objective of this work is to quantify the disparities in air pollution-related death estimates. We concentrate on low exposure areas where the concentration-response models with thresholds raise questions of their suitability to these areas. The aim of the first part of the work is compare three existing health risk assessment tools to estimate premature deaths attributable to annual ambient PM2.5 and O3 concentrations in 2015 using the same exposure data source in the tools (part 1). The aim of the second part is to quantify the disparities in the attributable death estimates due to concentration-response functions (part 2). In the third part we evaluate the impact of spatial resolution on exposure modelling and further on the estimated deaths (part 3).

2. Materials and Methods

2.1. Health Risk Assessment Tools Included in this Study

Three tools were selected for the tool comparison. These tools have previously been applied in the Nordic region. Same exposure data was used for all comparisons to prevent any exposure-originating disparities. Tools were used to calculate premature deaths related air pollution exposure, referred also as attributable deaths. Short descriptions of the tools are given below.
The ALPHA RiskPoll (ARP) is developed by Ecometrics Research and Consulting (EMRC) and available via contract/license. It enables analysis of a wide range of chronic and acute health effects from exposure to fine particles, ozone and nitrogen dioxide [24,25,26]. As an input, the tool uses country-specific and scenario-specific population-weighted concentrations most often calculated with the integrated Greenhouse gas and Air pollution Interactions and Synergies (GAINS) model [27,28], or chemical transportation models (CTM) like the model of the European Monitoring and Evaluation Programme (EMEP) [29]. ARP is flexible with respect to the possibility to add and remove substances and C-R functions, as well as the update of populations and baseline incidence rates. In the default setting the results from the tool explicitly express uncertainty in the monetized value of statistical lives (VSL) and value of life years lost (VOLY) as is found in the literature. ARP and the version preceding ARP has been extensively used for assessing benefits from air pollution abatement measures and instruments in Europe—in particular during the work leading up to the European Commission proposal for a Clean Air Policy Package [30]. In this work version 3-01 of ARP is used.
The modelling tool Economic Valuation of Air Pollution (EVA) is an integrated model system developed in Denmark to quantify health impacts as well as health-related economic externalities of air pollution. The EVA modelling tool represents the entire impact pathway chain and is driven by concentration fields from atmospheric chemistry-transport models. The output is a gridded assessment of several morbidity endpoints and acute and chronic mortality due to PM2.5, O3, NO2 and SO2, and their related external costs. The EVA system has previously been used for quantification of health impacts of air pollution and related external costs in Europe and Denmark (e.g., [31,32]) and for investigations of the contribution from different sectors [33] as well as under future conditions [34]. A new version of the EVA modeling tool has been developed in 2018–2019, and used in the present study. This version is based on the WHO (2013) HRAPIE review [35] (later summarized in [36]) in terms of both health endpoints and concentration-response functions. The health impacts of NO2 have therefore been included. Acute deaths attributable to PM2.5 exposure are included separately to EVA because they are valued differently than chronic deaths. As WHO has specified C-R functions separately for acute mortality, the lost life years from mortality due to long-term exposure are accounted for net of acute mortality to avoid any double-counting. A life-table from Statistics Denmark is used for the conversion between lost life-years and acute deaths, respectively, chronic deaths (cf. [37]), as Denmark is close to the European and OECD average life-expectancy. EVA is in-house and the development is continuing.
The health impacts of air pollution (ISTE) tool, developed at the Finnish Institute for Health and Welfare (THL) has an extensible collection of available C-R functions [9] and is linked to baseline burden of disease data by WHO [38]. The ISTE tool allows for probabilistic modelling of exposure variability and calculates uncertainties using 95% CI for C-R functions and standard error for exposure when these are available. In this tool, it is possible to look at the health impacts for specific pollutants, age groups, gender, and disease groups. The ISTE tool is in-house at THL and the development is continuing.
The second part of the work was conducted using the freely available web-based AirQ+ tool developed by WHO/Europe to quantify health risks of air pollution [39]. AirQ+ includes pre-loaded datasets for C-R functions from the WHO’s HRAPIE expert panel [36] and three sets of IER functions. The user needs to input air pollution concentrations, population info and baseline health data. The user can also add C-R functions [40]. In this work AirQ+ tool is used in the comparison of C-R functions.
An overview of the used tools is presented in Table 1.

2.2. Baseline Heath Data, and Concentration-Response Funtions

The baseline mortality data used in the tools were compared to the national statistics (Table 2). All tools show a relatively good agreement with the available statistical data at national level. The biggest differences were observed in EVA for Norway (+23%) and in ARP for Denmark (+10%). In EVA the baseline deaths are estimated as a percentage of the total population in each grid cell. The percentage (0.97%) used for all countries is based on Danish mortality rate of the years 2006–2015. For the comparisons of the baseline deaths in EVA to the national statistics, Danish mortality rate was multiplied with the number of a total population in a country.
The three tools used in the tool comparison, ARP, EVA, and ISTE, apply C-R functions for air pollution related mortality from the HRAPIE project [35,36] (Table 3). The fourth tool, AirQ+, includes a broader set of C-R functions (Table 4). Note that these tables are not a comprehensive list of all functions in the tools, but only includes the mortality functions applied in this work.

2.3. Air Quality Modelling

Air quality was modelled for 2015 at high-spatial resolution (1 km × 1 km) using the DEHM-UBM model setup, which combines the Danish Eulerian Hemispheric Model (DEHM) [51,52] with the Urban Background Model (UBM) [53,54]. The geographic domain of DEHM covers the Northern hemisphere, while UBM covers a limited area of interest with a high spatial resolution (1 km × 1 km). Full non-linear chemistry is included in DEHM, while the NO-NO2-O3 chemistry is included in UBM. This combination makes it possible to describe the long-range atmospheric transport of pollutants into and within Europe, while still having a high spatial resolution in the output over e.g., populated areas.
In the current setup, a new high-resolution emission inventory for the Nordic region has been used as input to the UBM model, while the emissions applied in DEHM is based on the EMEP emission database [55]. The UBM model is part of the Danish THOR/AirGIS system, which has been evaluated in detail for Denmark (e.g., [53,56,57,58]). A comprehensive evaluation of the DEHM-UBM setup for the full Nordic region is in progress. The preliminary evaluation against observations as well as against the concentration estimated by EEA points towards a relatively good agreement for 2015.
The output of the DEHM-UBM setup provides the concentrations of the health-relevant air pollutants, which are then combined with gridded population data and information on age structure to calculate the exposure. An example of the underlying gridded exposure to PM2.5 is shown in Figure 1 as the annual PM2.5 concentration from UBM multiplied with the number of people in each grid cell. Clear spatial gradients are seen in the exposure, with highest values in the urban areas with both a high population density and high PM2.5 levels (Figure 1).
From the studied tools, the EVA model is the only tool, which applies calculations at gridded concentrations (1 km × 1 km grid resolution). The AirQ+, ARP and ISTE tools use population weighted annual mean concentrations as inputs for exposure (Table 5). These tools are dependent on the resolution of the chemical transport models feeding the tool with data on population-weighted concentrations. In the ISTE tool it is possible to take into account the exposure probability distribution when it is known or can be estimated.
Iceland is not yet included in the DEHM-UBM setup. For Iceland, the exposure values were obtained from EEA [59].

2.4. Assessment of the Impact of Spatial Resolution on Estimated Premature Deaths (Part 3)

The impact of spatial resolution was evaluated using the EVA modeling tool. The background for this investigation is the overall assumption that, in a health impact assessment, the spatial resolution of the modelled gridded concentration fields has a significant impact on the exposures and subsequently, to estimated deaths.
In the experimental setup, the UBM model [53,54] has been run for the Nordic domain with the 1 km × 1 km resolution for the year 2015. To evaluate the impact of spatial resolution on the number of attributable deaths, the air pollution data of PM2.5, NO2 and O3 have been resampled in the EVA system, calculating the total number of premature deaths as a function of the spatial resolution from 1 km × 1 km to 700 km × 700 km.
The numbers of deaths attributable to air pollution were estimated for the resolution change. In this part of the study we included NO2 to represent a locally variable species. The C-R function used for NO2 is based on the HRAPIE recommendation (RR: 1.0027 for short term exposure and RR: 1.055 for long-term exposure, applying a 20 µg/m3 lower limit value) [36]. By this, we are not testing the impact of using different types of air pollution models with different resolution, but the pure numerical effect of representing the air pollution concentrations on different resolutions giving artificial numerical diffusion and therefore giving lower air pollution levels (higher for ozone) in the highly densely populated areas, compared to the high resolution case.

3. Results

3.1. Comparison between the Tools (Part 1)

In the Nordic area the estimated annual deaths attributable to PM2.5 varied across the tools from 8500 to 11,400 and for O3 exposure from 230 to 260 (Table 6). Deaths attributable to air pollution per million inhabitants were highest in Denmark and lowest in Iceland (Figure 2). PM2.5 and O3 concentrations were the highest in Denmark and the lowest in Finland and Iceland which is reflected in the results. EVA had the highest estimates for PM2.5 attributable deaths for the four countries covered (not applied for Iceland). This is partly explained by the inclusion of acute deaths in addition to chronic deaths, which led to ca. 17% higher results in comparison to other tools. Baseline mortality data was another important source of differences between the tools. The tools utilized different data sources for baseline mortality (Table 2).

3.2. Comparison of Concentration-Response Functions (Part 2)

We found large differences between the deaths attributable to PM2.5 estimated with different C-R functions in the Nordic countries (Figure 3). These estimates varied from 1800 to 18,000 deaths in the Nordic area (Table 7). Use of the RR 1.14 [18] naturally more than doubled the deaths compared to those estimated with RR 1.06 recommended by the WHO expert panel [36]. Use of IER2016 resulted in estimates close to estimates calculated with the RR: 1.06. The previous IERs from GBD studies 2013 and 2015 substantially decreased the estimated attributable deaths. There were only a few estimated deaths for Finland and Iceland, when IER 2013 or 2015 were used (Table 7). In Denmark with the highest PM2.5 concentrations of the Nordic countries (9.2 µg/m3), differences between the IER functions were smaller as the mean PM2.5 concentration was not close to the theoretical thresholds.

3.3. Impacts of Spatial Resolution Used in the Exposure Model (Part 3)

The impact of spatial resolution on the deaths attributable to air pollution exposure is illustrated in Figure 4 for PM2.5, NO2, O3 and for the total number of attributable deaths in Nordic countries, relative to the total number of attributable deaths from the finest (1 km × 1 km) to the coarsest resolution (700 km × 700 km). The number of attributable deaths increases significantly with higher resolution, except for ozone. Moving from the coarsest to the finest resolution led to an increase of attributable deaths by 13% for PM2.5, 183% for NO2 and 20% for the total number of air pollution related deaths. For O3 the impact was inverse, O3 related deaths decreased by 25%.
The relative change is highest for NO2, which is heavily influenced by local emissions and chemistry. For PM2.5, the results are influenced by the fact that it consists of primary emitted particles as well as secondary formed particles (e.g., nitrate, sulfate and ammonium). In the first case, the spatial variability of the concentrations is highly dependent on local sources, whereas in the latter case, this is not the case. For O3, the impact was reversed; higher spatial resolution led to lower death estimates. This is due to the degradation of ozone in urban areas which is better taken into account when high resolution exposure modelling is used.
The impact of spatial resolution can be illustrated in the following way: assume that we have a smaller city covering an area of 1 km × 1 km surrounded by rural areas. If the air pollution concentrations are calculated with a high-resolution model with similar resolution, the resulting concentrations of the locally formed chemical species (e.g., primary particles, NO2) will be higher in the populated area and lower in the surrounding rural areas with lower population density. In the case where the air pollution concentrations are calculated on a coarser 50 km × 50 km resolution, the concentrations will be the same over this area and lower in the city, compared to the high-resolution case. In this relatively coarser resolution, the emissions from the city will immediately be spread out within the 50 km × 50 km grid cell due to numerical diffusion and therefore the mean concentration over the higher populated area (the city) will be lower compared to the case where the concentrations are calculated on a higher resolution. The result will be a lower number of premature deaths in the low-resolution case, compared to the high-resolution case over the same area, only due to artificial numerical diffusion and the question of representability of lower resolution results over areas with higher variability. For ozone, the case is actually the opposite, since ozone is lower in areas where NOx emissions are high.

4. Discussion

We identified substantial disparities between the attributable death estimates in the Nordic countries. The biggest differences were found in the comparison of five commonly used concentration-response functions, while smaller differences were found between the compared tools as these tools use the same source of concentration-response functions. Additionally, Malmqvist et al. (2018) [17] found that selection of exposure-response function was causing substantial differences between the nine health impact assessments included in their study.
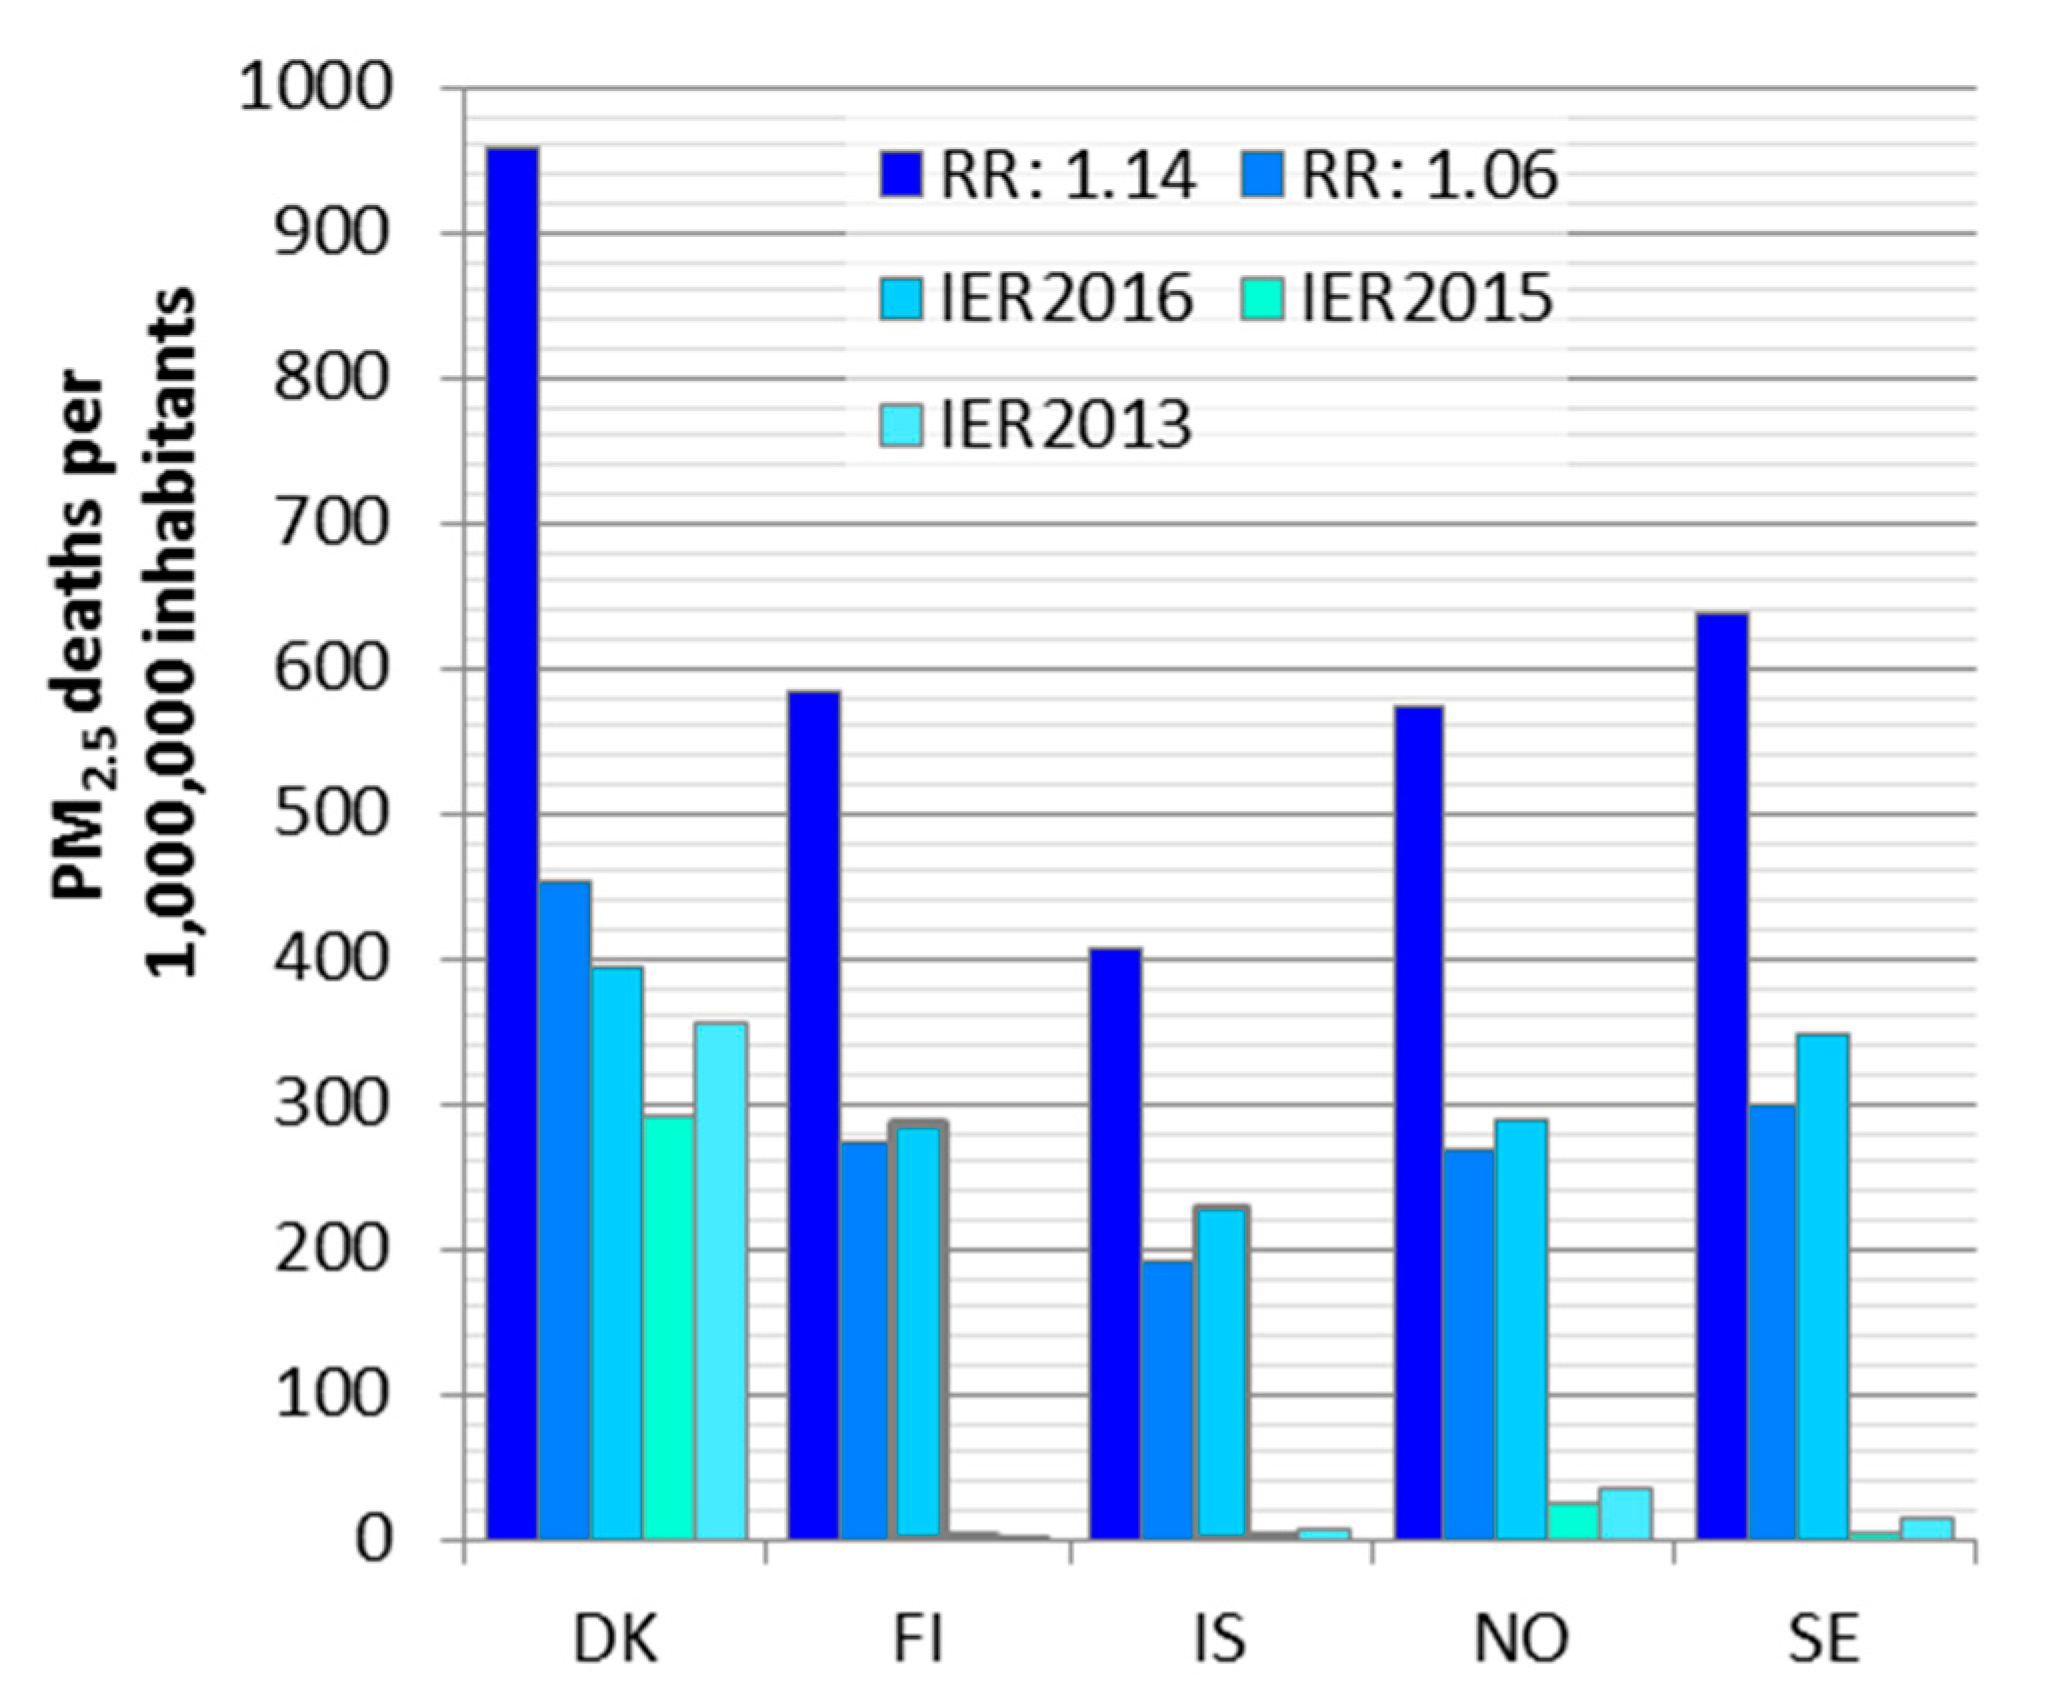
We compared two log-linear functions (RR:1.06 [47] and RR:1.14 [18]) and three sets of IER functions (GBD2013, GBD2015 and GBD2016 [48,49,50]). The log-linear functions had over twofold differences in the relative risks and consequently in the estimated deaths. The earlier IER versions seem to underestimate the health impacts in low exposure countries due to the high theoretical threshold. The closer to the theoretical threshold value the exposure is, the larger the differences between the IER versions are. The latest IER version (IER2016, [50]) included in this comparison led to attributable deaths close to the ones estimated, with a relative risk of 1.062 used in all the tools we compared in this work (ARP, EVA and ISTE). In this version the theoretical threshold was lower than in the previous IER versions.
One limitation of our study is that we used only a point value for population mean exposure without taking into account the exposure distribution in any other tools than EVA. While this might not lead to a significant difference for linear functions without threshold, it can cause remarkable underestimation when using supra-linear IER functions. This can be the case especially when the mean exposure is close to the threshold and exposure distribution is not taken into account.
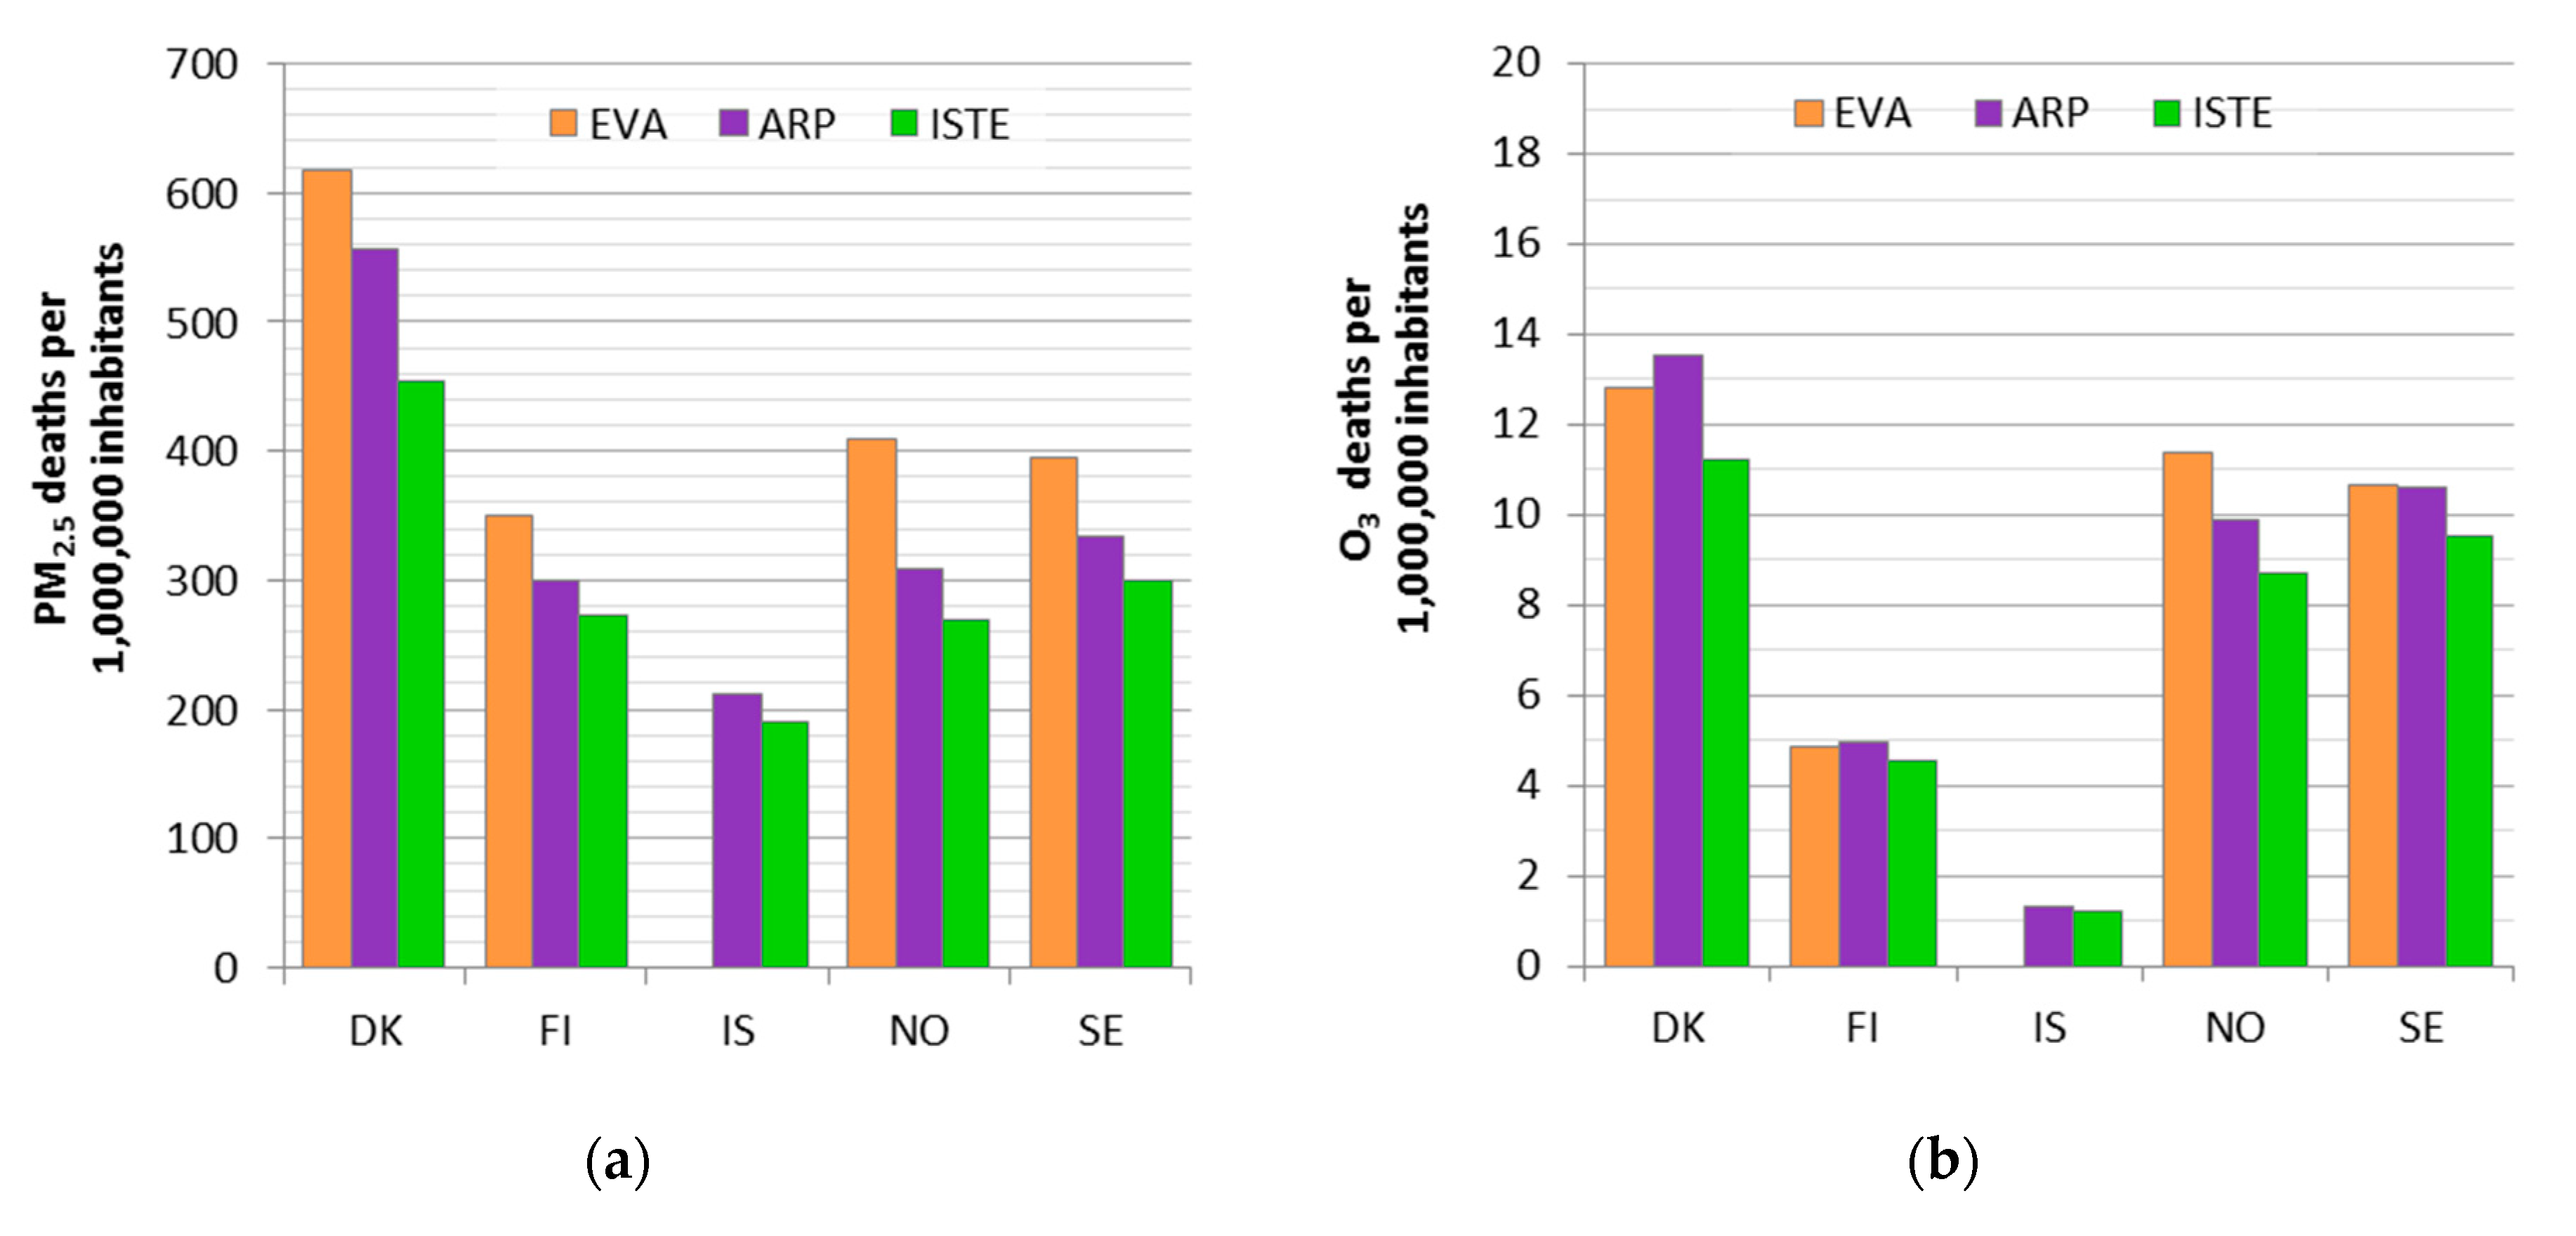
The differences in the estimated deaths for individual counties were up to 24% between the three tools when compared to tool averages. We identified that the main causes of the differences were baseline mortality data used in the tools. The disparities in the baseline mortality in comparison to national statistics were ranging from −6% to 23%. These differences reflected on the estimation of attributable deaths, and seemed to mostly explain the differences between ISTE and ARP. Another major cause for disparities among the tools was inclusion of acute deaths in addition to chronic ones in EVA. Double counting of chronic and acute mortality is avoided in EVA by subtracting years of life lost (YLL) due to acute deaths from the YLL due to chronic deaths. For PM2.5 EVA had the highest attributable death estimates for all countries, from which acute deaths comprise about 17%. In overall, ISTE had the lowest attributable death estimates as well as the lowest baseline mortality.
All the tools included in this work are suitable for estimating the health risks of air pollution at low exposure levels. EVA modelling tool has one advantage of being closely linked to air quality models and it has a high spatial resolution. In the ISTE tool it is possible to take into account exposure distributions. EVA and ARP tools enable estimation of economic costs in addition to health impacts. AirQ+ tool is readily available for the public and includes non-linear C-R functions in addition to linear ones. The results obtained in this work can be utilized in the tool updating.
The source of exposure data can greatly affect the health impact results, and therefore we aimed to control its impacts by using the same source of exposures for all tools. For example, surface concentrations from different air pollution models, even when they use the same input for the emissions, can lead to a difference in the mortality estimates of up to a factor of three [31]. This is due to the differences in the models themselves; in particular the representation of gas-phase chemistry and the aerosol schemes, as well as the native spatial resolutions of the models and the meteorological input they use to drive the chemistry. However, the validity of the air pollution models used for health impact assessments should be tested against measurements in order to quantify the uncertainty using the particular model.
The C-R functions applied refer to annual mean concentrations; however, the exposure period which is leading to the health outcomes can be even decades. We assume that the annual concentration reflects the long-term exposure. This approach, however, cannot take into account for instance moving history but the concentrations are based on the home addresses in 2015. In this work the population weighted concentrations apply to the total population and we did not consider different age groups separately. However, it can be assumed that some differences in concentrations between age groups are possible. Urbanization is one trend which can reflect on exposure of different age groups as older people tend to stay in the country-side, while younger move to urban areas. Personal exposure between age groups can also differ due to time activity patterns. However, in this work time activity patterns were not taken into account as the calculations are based on ambient concentrations.
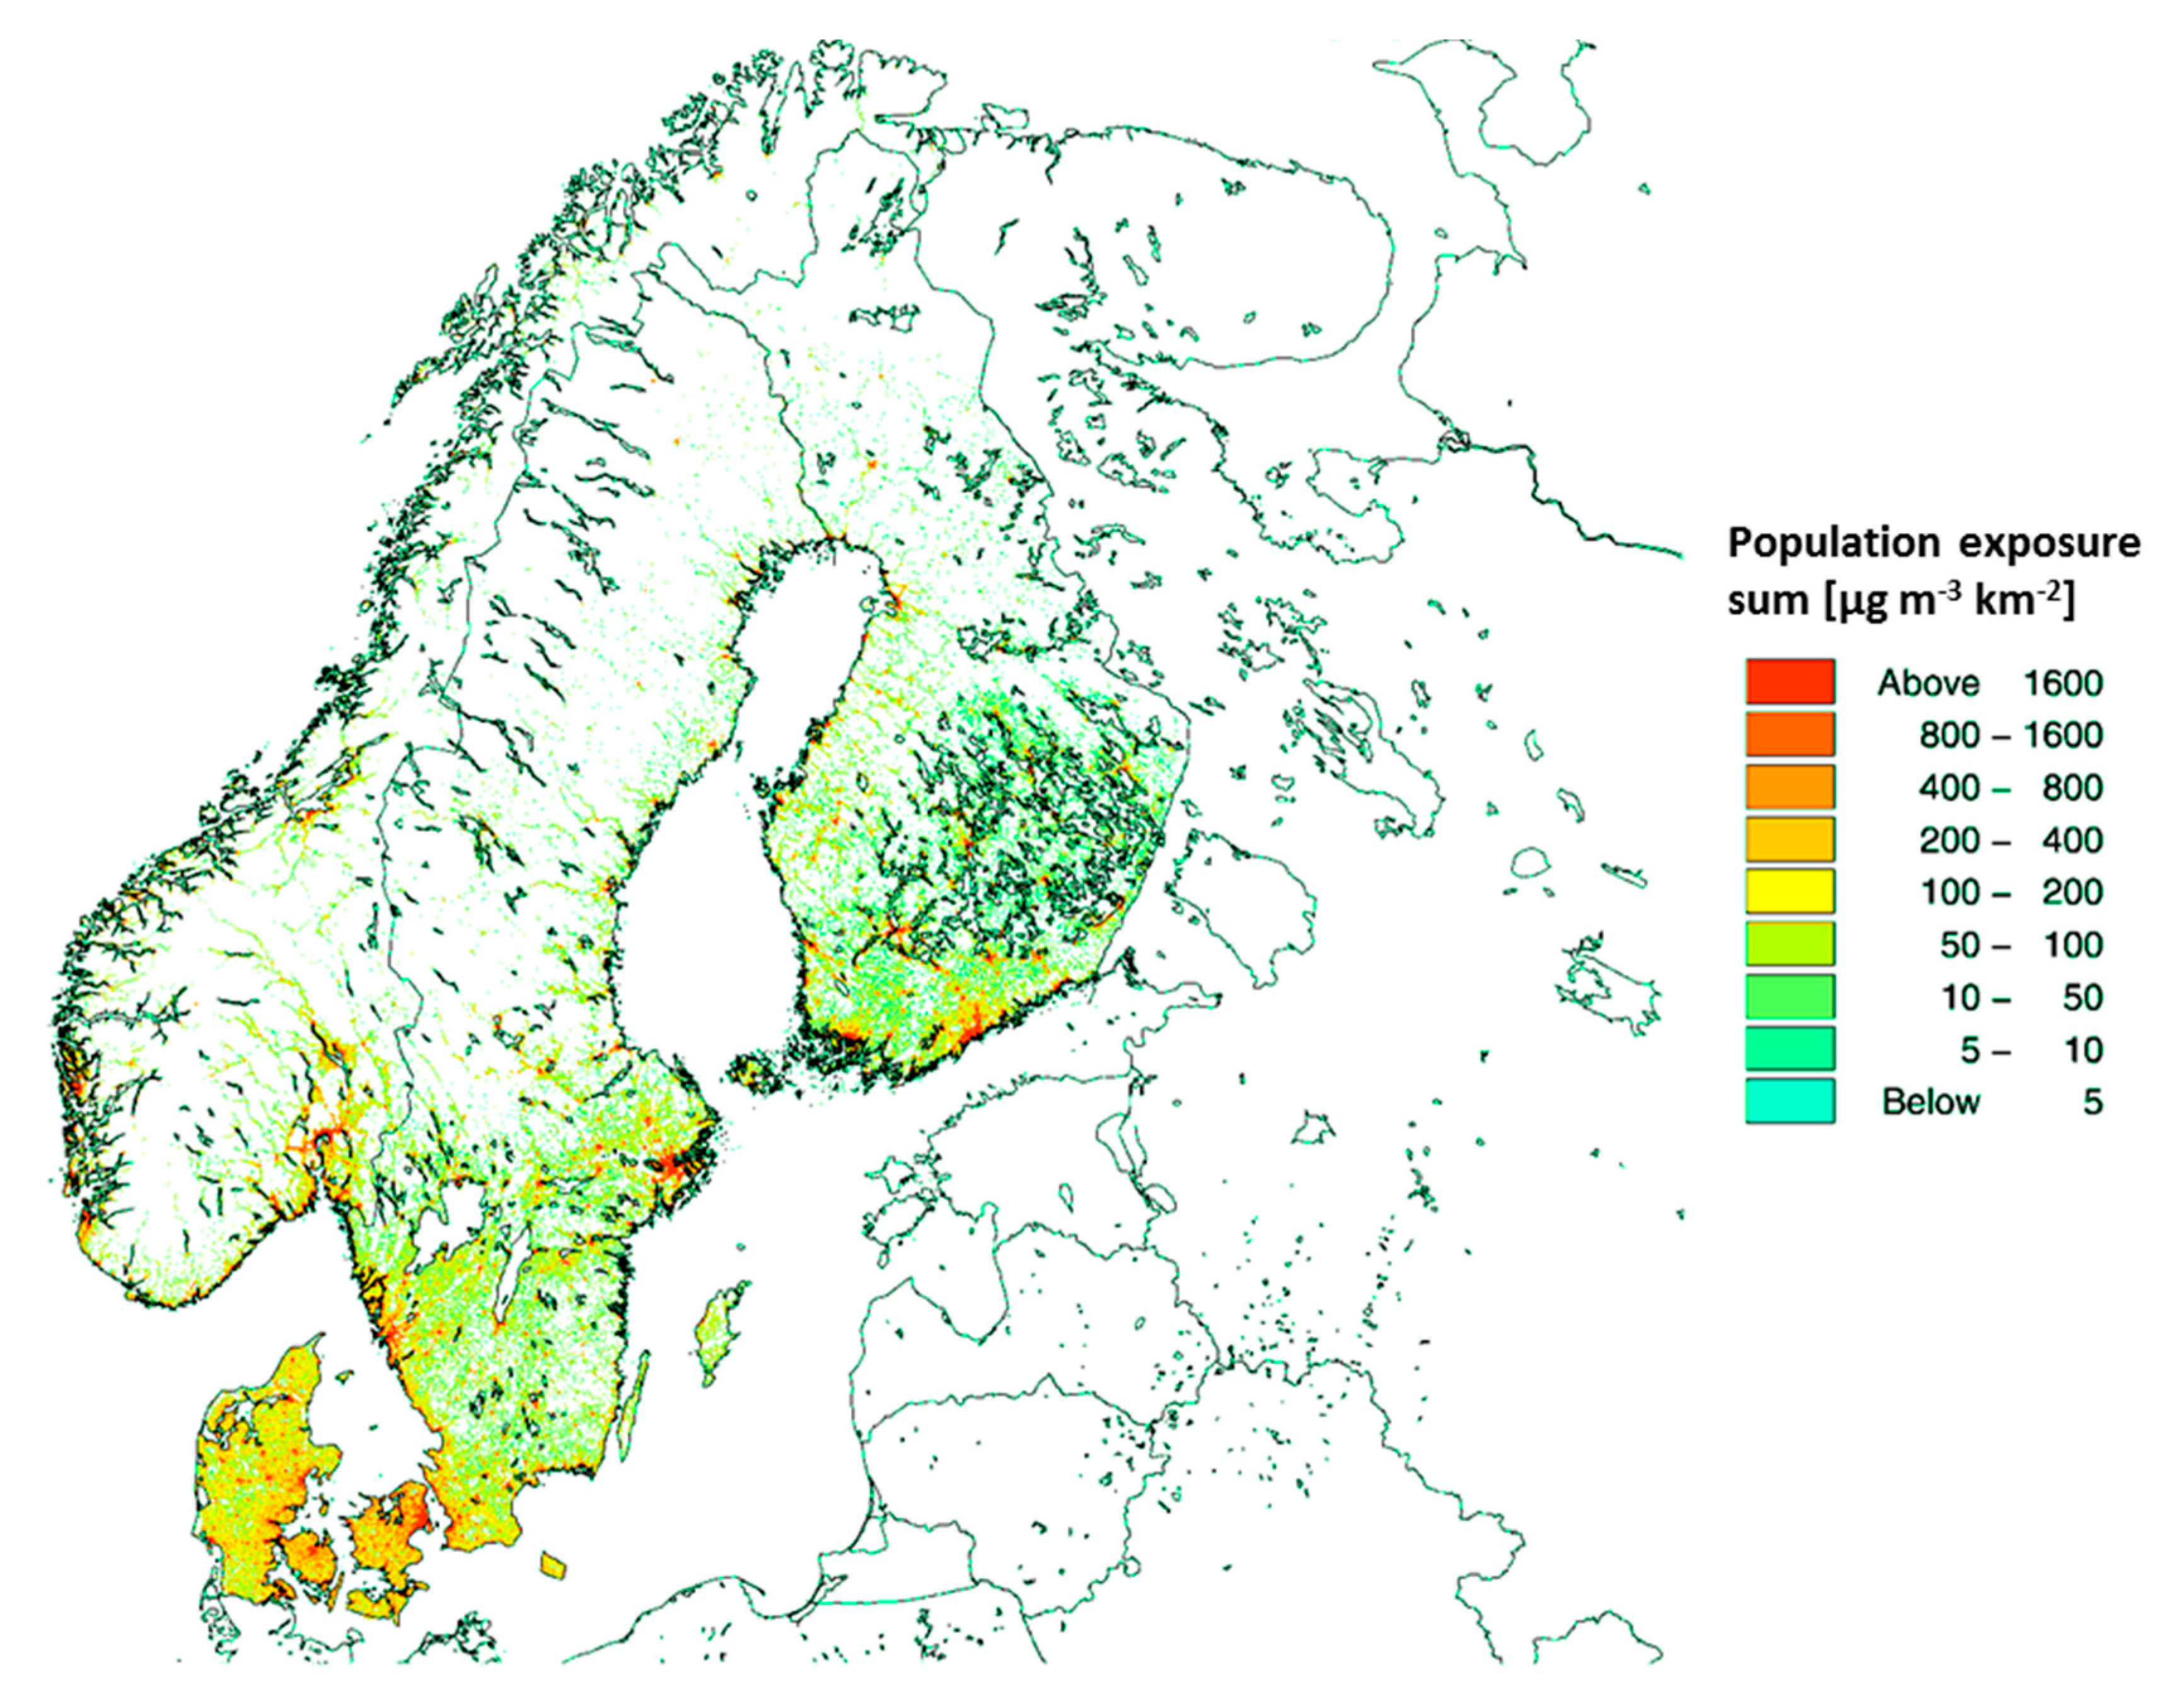
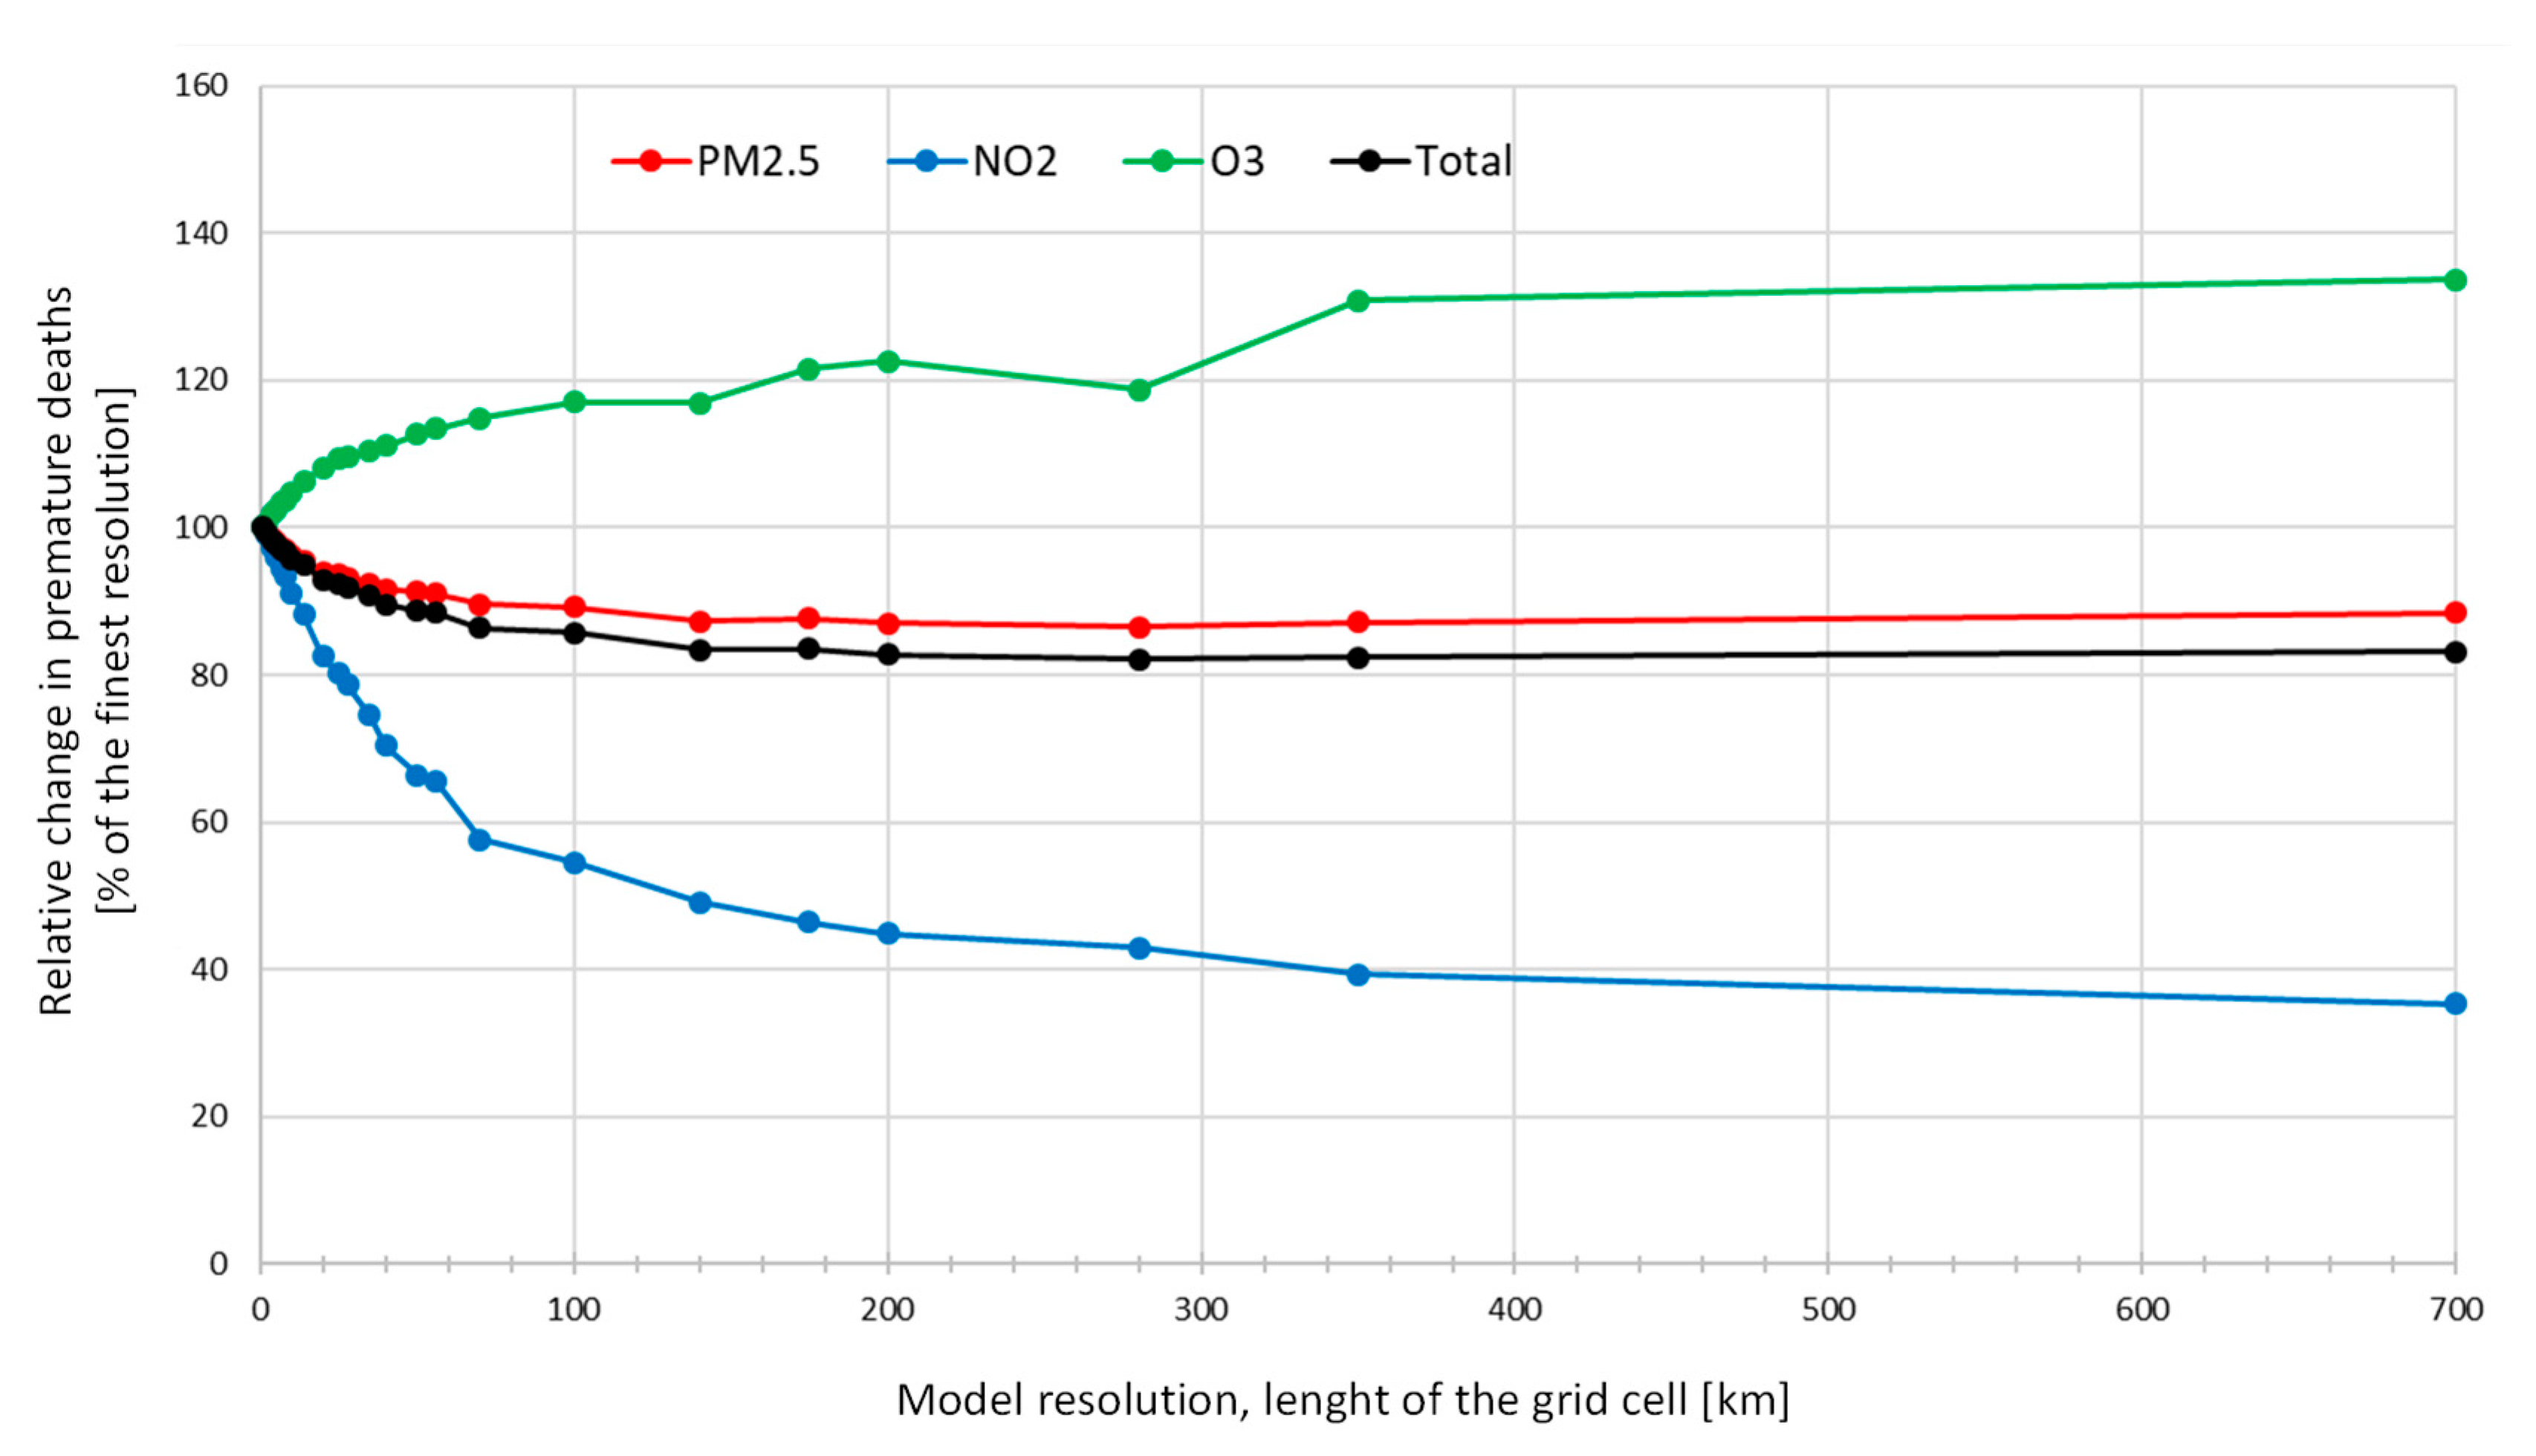
In the sensitivity analysis of exposure resolution, we found that lower spatial resolution leads to a substantial decrease in the estimated attributable deaths for PM2.5 and NO2. For O3 the impact was the reverse. A high spatial resolution is especially important for the locally emitted chemical species such as primary emitted particulate matter and for NO2 and O3 (reverse impact). These pollutants are controlled by relatively fast chemistry (e.g., compared to the chemistry of secondary formed particles) and therefore are characterized by higher local spatial variability. Typically, for these species, higher concentrations are found close to the more densely populated areas, since emissions are located close to the population. For example, particle and NOx emissions from traffic and particles from residential heating typically occur within the more densely populated areas.
Our experiment shows that the spatial resolution has a significant impact on the health impact assessment related to air pollution and that high-resolution modelling is especially important, when the results are used for policy development as an underestimation of 34% of the attributable deaths and related external costs can change political priorities.
Korhonen et al. (2019) [60] also studied the impacts of spatial resolution of exposure model on deaths attributable to PM2.5. They estimated the differences caused by spatial resolution on deaths attributable to PM2.5 exposure by averaging exposure from 1 km × 1 km to 50 km × 50 km resolution. They found that lowering the resolution from the highest to the coarsest led to a decrease in the attributable deaths by 14 % and nearly 90 % for log-linear and IER functions, respectively. Korhonen et al. (2019) applied the IER2013 functions [14] which have a theoretical threshold close to the Finnish exposure levels leading to large impacts for resolution changes.

5. Conclusions

We compared three available tools to estimate deaths attributable to PM2.5 and O3 exposures in five Nordic countries. Between the tools, the estimated deaths ranged from 8500 to 11,400 for PM2.5, and from 230 to 260 for O3 exposure in the Nordic area. Death rates per million inhabitants were the highest in Denmark and the lowest in Iceland. All the tools were based on concentration-response functions recommended by WHO working group. The variation among the tools was mainly due to differences in the baseline mortality inputs.
Substantially larger differences were found in the comparison of concentration-response functions. At maximum, a ten-fold difference was calculated for the whole Nordic region (1800–18,000 deaths). Differences between estimates for individual countries were even larger, likely due to concentration-response function shapes and in particular, the applied thresholds in combination with point value exposures. The Nordic area with low exposures is especially sensitive to thresholds.
When spatial exposure models are used, sufficiently high resolution is necessary to avoid underestimation of exposures and health effects. This is especially important for air pollutants which are strongly influenced by local emissions and atmospheric chemistry like NO2 and primary particulate matter. For O3 the impact of smaller resolution is reversed due to lower exposures at highly populated urban areas.
On-going epidemiological studies assessing the relationship between air pollution and health effects in the Nordic area will provide valuable inputs for the understanding of the health burden of air pollution in low exposure areas. Nevertheless, due to challenges in statistical power it is unlikely that definitive answers will be reached in the near future. Therefore, the methodological differences between assessments need to be addressed when interpreting results. When choosing tools, the user should be aware of the methodological choices and their possible impacts on the results.

Author Contributions

H.L. was the main author of the work. She conducted calculations with ISTE and AirQ+ tools and was responsible for the comparisons between the tools, C-R functions and baseline health data. M.S.A., C.G., J.B. and L.M.F. updated the EVA tool and performed the calculations for this paper. J.B., C.G. and U.I. set up the UBM model for the Nordic area, made the simulations, a preliminary evaluation and extraction of data for this study. S.R. participated in the supervision of the work. K.Y. and S.Å. estimated attributable deaths using ARP tool. O.H. coordinated the development of ISTE tool, envisioned the work and aims and he was the main supervisor of the work. All authors have contributed to the writing of the manuscript. All authors have read and agreed to the published version of the manuscript.

Funding

NordForsk under the Nordic Programme on Health and Welfare project #75007 (NordicWelfAir), Academy of Finland projects (BATMAN 285672, APPEAL 322150) and the participating institutes. SR acknowledges funding from the Norwegian Research Council (grant number 281904) and European Union’s Horizon 2020 research and innovation programme under grant agreement No 820655 (EXHAUSTION).

Acknowledgments

We thank Haben Tekie for his important inputs for the planning of the work and Mike Holland for clarifications regarding the ALPHA RiskPoll tool.

Conflicts of Interest

The authors declare no conflict of interest.

References

  1. Stanaway, J.D.; Afshin, A.; Gakidou, E.; Lim, S.S.; Abate, K.H.; Abbafati, C.; Abbasi, N.; Abd-Allah, F.; Abdela, J.; Abdelalim, A.; et al. Global, regional, and national comparative risk assessment of 84 behavioural, environmental and occupational, and metabolic risks or clusters of risks for 195 countries and territories, 1990–2017: A systematic analysis for the Global Burden of Disease Study 2017. Lancet 2018, 392, 1923–1994. [Google Scholar]
  2. Burnett, R.; Chen, H.; Szyszkowicz, M.; Fann, N.; Hubbel, B.; Pope, C.A., III; Apte, J.S.; Brauer, M.; Cohen, A.; Spadaro, J.V.; et al. Global estimates of mortality associated with long-term exposure to outdoor fine particulate matter. Proc. Natl. Acad. Sci. USA 2018, 115, 9592–9597. [Google Scholar] [CrossRef] [PubMed] [Green Version]
  3. WHO. Ambient Air Pollution: A Global Assessment of Exposure and Burden of Disease. World Health Organization. 2016. Available online: http://apps.who.int/iris/bitstream/10665/250141/1/9789241511353-eng.pdf?ua=1 (accessed on 13 November 2019).
  4. Hänninen, O.; Knol, A.B.; Jantunen, M.; Lim, T.A.; Conrad, A.; Rappolder, M.; Carrer, P.; Fanetti, A.-C.; Rokho, K.; Buekers, J.; et al. Environmental burden of disease in Europe: Assessing nine risk factors in six countries. Environ. Health Perspect. 2014, 122, 439–446. [Google Scholar] [CrossRef] [PubMed] [Green Version]
  5. Prüss-Ustün, A.; van Deventer, E.; Mudu, P.; Campbell-Lendrum, D.; Vickers, C.; Ivanov, I.; Forastiere, F.; Gumy, S.; Dora, C.; Adair-Rohani, H.; et al. Environmental risks and non-communicable diseases. BMJ 2019, 364, l265. [Google Scholar] [CrossRef] [PubMed] [Green Version]
  6. Lelieveld, J.; Klingmüller, K.; Pozzer, A.; Pöschl, U.; Fnais, M.; Daiber, A.; Münzel, T. Cardiovascular disease burden from ambient air pollution in Europe reassessed using novel hazard ratio functions. Eur. Heart J. 2019, 40, 1590–1596. [Google Scholar] [CrossRef] [Green Version]
  7. Papadogeorgou, G.; Kioumourtzoglou, M.A.; Braun, D.; Zanobetti, A. Low Levels of Air Pollution and Health: Effect Estimates, Methodological Challenges, and Future Directions. Curr. Environ. Health Rep. 2019, 6, 105–115. [Google Scholar] [CrossRef]
  8. Gustafsson, M.; Lindén, J.; Tang, L.; Forsberg, B.; Orru, H.; Åström, S.; Sjöberg, K. Quantification of Population Exposure to NO2, PM2.5 and PM10 and Estimated Health Impacts. IVL Report C317, 2018, 1–60. Available online: https://www.ivl.se/download/18.2aa26978160972788071cafe/1529073450199/C317%20Quantification%20of%20population%20exposure%202015.pdf (accessed on 22 November 2019).
  9. Lehtomäki, H.; Korhonen, A.; Asikainen, A.; Karvosenoja, N.; Kupiainen, K.; Paunu, V.; Savolahti, M.; Sofiev, M.; Palamarchuk, Y.; Karppinen, A.; et al. Health Impacts of Ambient Air Pollution in Finland. IJERPH 2018, 15, 736. [Google Scholar] [CrossRef] [Green Version]
  10. Im, U.; Christensen, J.H.; Nielsen, O.-K.; Sand, M.; Makkonen, R.; Geels, C.; Anderson, C.; Kukkonen, J.; Lopez-Aparicio, S.; Brandt, J. Contributions of Nordic anthropogenic emissions on air pollution and premature mortality over the Nordic region and the Arctic. Atmos. Chem. Phys. 2019, 19, 12975–12992. [Google Scholar] [CrossRef] [Green Version]
  11. Pope, C.A., III; Cropper, M.; Coggins, J.; Cohen, A. Health benefits of air pollution abatement policy: Role of the shape of the concentration–response function. J. Air Waste Manag. Assoc. 2015, 65, 516–522. [Google Scholar] [CrossRef] [Green Version]
  12. Vodonos, A.; Awad, Y.A.; Schwartz, J. The concentration-response between long-term PM2.5 exposure and mortality; A meta-regression approach. Environ. Res. 2018, 166, 677–689. [Google Scholar] [CrossRef]
  13. Hanigan, I.C.; Rolfe, M.I.; Knibbs, L.D.; Salimi, F.; Cowie, C.T.; Heyworth, J.; Marks, G.B.; Guo, Y.; Cope, M.; Bauman, A.; et al. All-cause mortality and long-term exposure to low level air pollution in the ‘45 and up study’cohort, Sydney, Australia, 2006–2015. Environ. Int. 2019, 126, 762–770. [Google Scholar] [CrossRef] [PubMed]
  14. Burnett, R.T.; Pope, C.A., III; Ezzati, M.; Olives, C.; Lim, S.S.; Mehta, S.; Shin, H.H.; Singh, G.; Hubbell, B.; Brauer, M.; et al. An integrated risk function for estimating the global burden of disease attributable to ambient fine particulate matter exposure. Environ. Health Perspect. 2014, 122, 397–403. [Google Scholar] [CrossRef] [PubMed]
  15. Cohen, A.J.; Brauer, M.; Burnett, R.; Anderson, H.R.; Frostad, J.; Estep, K.; Balakrishnan, K.; Brunekreef, B.; Dandona, L.; Dandona, R.; et al. Estimates and 25-year trends of the global burden of disease attributable to ambient air pollution: An analysis of data from the Global Burden of Diseases Study 2015. Lancet 2017, 389, 1907–1918. [Google Scholar] [CrossRef] [Green Version]
  16. Anenberg, S.C.; Belova, A.; Brandt, J.; Fann, N.; Greco, S.; Guttikunda, S.; Héroux, M.-E.; Hurley, F.; Krzyzanowaki, M.; Medina, S.; et al. Survey of Ambient Air Pollution Health Risk Assessment Tools. Risk Anal. 2016, 36, 1718–1736. [Google Scholar] [CrossRef] [PubMed]
  17. Malmqvist, E.; Oudin, A.; Pascal, M.; Medina, S. Choices Behind Numbers: A Review of the Major Air Pollution Health Impact Assessments in Europe. Curr. Environ. Health Rep. 2018, 5, 34–43. [Google Scholar] [CrossRef] [PubMed] [Green Version]
  18. Beelen, R.; Raaschou-Nielsen, O.; Stafoggia, M.; Andersen, Z.J.; Weinmayr, G.; Hoffmann, B.; Wolf, K.; Samoli, E.; Fischer, P.; Nieuwenhuijsen, M.; et al. Effects of long-term exposure to air pollution on natural-cause mortality: An analysis of 22 European cohorts within the multicentre ESCAPE project. Lancet 2014, 383, 785–795. [Google Scholar] [CrossRef]
  19. Pope, C.A., III; Burnett, R.T.; Thun, M.J.; Calle, E.E.; Krewski, D.; Ito, K.; Thurston, G.D. Lung cancer, cardiopulmonary mortality, and long-term exposure to fine particulate air pollution. JAMA 2002, 287, 1132–1141. [Google Scholar] [CrossRef] [Green Version]
  20. Hänninen, O.; Rumrich, I.; Asikainen, A. Challenges in estimating health effects of indoor exposures to outdoor particles: Considerations for regional differences. Sci. Tot. Environ. 2017, 589, 130–135. [Google Scholar] [CrossRef]
  21. De Hoogh, K.; Chen, J.; Gulliver, J.; Hoffmann, B.; Hertel, O.; Ketzel, M.; Bauwelinck, M.; van Donkelaar, A.; Hvidtfeldt, U.A.; Katsouyanni, K.; et al. Spatial PM2. 5, NO2, O3 and BC models for Western Europe–Evaluation of spatiotemporal stability. Environ. Int. 2018, 120, 81–92. [Google Scholar] [CrossRef]
  22. Nordforsk. Threats in the Air. Nordforsk Magazine. 2017. Available online: https://www.nordforsk.org/en/publications/publications_container/nordforsk-magazine-2017 (accessed on 13 June 2019).
  23. Bølling, A.K.; Aasvang, G.M.; Oftedal, B.; Låg, M.; Refsnes, M.; Øvrevik, J.; Schwarze, P. “Konsentrasjonsresponskurver for lave konsentrasjoner av fint svevestøv”. [Concentration-Response Curves for Low Concentrations of Fine Particulate Matter]; Rapport 2018; Folkehelseinstituttet: Oslo, Norway, 2018; Available online: https://www.fhi.no/globalassets/dokumenterfiler/rapporter/2018/konsentrasjons-responskurver-for-lave-konsentrasjoner-av-fint-svevestov-rapport-2018.pdf (accessed on 4 May 2020).
  24. Holland, M.; Pye, S.; Jones, G.; Hunt, A.; Markandya, A. The Alpha Benefit Assessment Model-EC4MACS Modelling Methodology. EMRC, AEA Energy and Environment, Metroeconomica. 2013. Available online: http://www.ec4macs.eu/content/report/EC4MACS_Publications/MR_Final%20in%20pdf/Alpha_Methodologies_Final.pdf (accessed on 4 May 2020).
  25. Schucht, S.; Colette, A.; Rao, S.; Holland, M.; Schöpp, W.; Kolp, P.; Klimont, Z.; Bessagnet, B.; Szopa, S.; Vautard, R.; et al. Moving towards ambitious climate policies: Monetised health benefits from improved air quality could offset mitigation costs in Europe. Environ. Sci. Policy 2015, 50, 252–269. [Google Scholar] [CrossRef]
  26. Åström, S.; Yaramenka, K.; Winnes, H.; Fridell, E.; Hollandd, M. The costs and benefits of a nitrogen emission control area in the Baltic and North Seas. Transp. Res. Part D: Transp. Environ. 2018, 59, 223–236. [Google Scholar] [CrossRef]
  27. Kiesewetter, G.; Schoepp, W.; Heyes, C.; Amann, M. Modelling PM2.5 impact indicators in Europe: Health effects and legal compliance. Environ. Model. Softw. 2015, 74, 201–211. [Google Scholar] [CrossRef] [Green Version]
  28. Amann, M.; Bertok, I.; Borken-Kleefeld, J.; Cofala, J.; Heyes, C.; Höglund-Isaksson, L.; Klimont, Z.; Nguyen, B.; Posch, M.; Rafaj, P.; et al. Cost-effective control of air quality and greenhouse gases in Europe: Modeling and policy applications. Environ. Model. Softw. 2011, 26, 1489–1501. [Google Scholar] [CrossRef]
  29. Simpson, D.; Benedictow, A.; Berge, H.; Bergström, R.; Emberson, L.; Fagerli, H.; Flechard, C.; Hayman, G.; Gauss, M.; Jonson, J.E.; et al. The EMEP MSC-W chemical transport model—Technical description. Atmos. Chem. Phys. 2012, 12, 7825–7865. [Google Scholar] [CrossRef] [Green Version]
  30. Holland, M. Cost–benefit Analysis of Final Policy Scenarios for the EU Clean Air Package, Version 2, Corresponding to IIASA TSAP Report #11, Version 1, EMRC, March 2014. Available online: http://ec.europa.eu/environment/air/pdf/TSAP%20CBA.pdf. (accessed on 4 September 2017).
  31. Im, U.; Brandt, J.; Geels, C.; Hansen, K.M.; Christensen, J.H.; Andersen, M.S.; Solazzo, E.; Kioutsioukis, I.; Alyuz, U.; Balzarini, A.; et al. Assessment and economic valuation of air pollution impacts on human health over Europe and the United States as calculated by a multi-model ensemble in the framework of AQMEII3. Atmos. Chem. Phys. 2018, 18, 5967–5989. [Google Scholar] [CrossRef] [Green Version]
  32. Brandt, J.; Silver, J.D.; Christensen, J.H.; Andersen, M.S.; Bonlokke, J.H.; Sigsgaard, T.; Geels, C.; Gross, A.; Hansen, A.B.; Hansen, K.M.; et al. Contribution from the ten major emission sectors in Europe and Denmark to the health-cost externalities of air pollution using the EVA model system—An integrated modelling approach. Atmos. Chem. Phys. 2013, 13, 7725–7746. [Google Scholar] [CrossRef] [Green Version]
  33. Brandt, J.; Silver, J.D.; Christensen, J.H.; Andersen, M.S.; Bonlokke, J.H.; Sigsgaard, T.; Geels, C.; Gross, A.; Hansen, A.B.; Hansen, K.M.; et al. Assessment of past, present and future health-cost externalities of air pollution in Europe and the contribution from international ship traffic using the EVA model system. Atmos. Chem. Phys. 2013, 13, 7747–7764. [Google Scholar] [CrossRef] [Green Version]
  34. Geels, C.; Andersson, C.; Hänninen, O.; Lansø, A.S.; Schwarze, P.; Ambelas Skjøth, C.; Brandt, J. Future Premature Mortality due to O3 and Secondary Inorganic Aerosols in Europe – Sensitivity to Changes in Climate, Anthropogenic Emissions, Population and Building Stock. Int. J. Environ. Res. Public. Health 2015, 12, 2837–2869. [Google Scholar] [CrossRef] [Green Version]
  35. WHO Regional Office for Europe. Health Risks of Air Pollution in Europe—HRAPIE Project: Recommendations for Concentration-Response Functions for Cost–Benefit Analysis of Particulate Matter, Ozone and Nitrogen Dioxide. Copenhagen, WHO Regional Office for Europe. Available online: http://www.euro.who.int/__data/assets/pdf_file/0006/238956/Health-risks-of-air-pollution-in-Europe-HRAPIE-project,-Recommendations-for-concentrationresponse-functions-for-costbenefit-analysis-of-particulate-matter,-ozone-and-nitrogen-dioxide.pdf (accessed on 30 March 2017).
  36. Héroux, M.E.; Anderson, H.R.; Atkinson, R.; Brunekreef, B.; Cohen, A.; Forastiere, F.; Hurley, F.; Katsouyanni, K.; Krewski, D.; Krzyzanowski, M.; et al. Quantifying the health impacts of ambient air pollutants: Recommendations of a WHO/Europe project. Int. J. Public Health 2015, 60, 619–627. [Google Scholar] [CrossRef] [Green Version]
  37. Andersen, M.S. Co-benefits of climate mitigation: Counting statistical lives or life-years? Ecol. Indic. 2017, 79, 11–18. [Google Scholar] [CrossRef]
  38. WHO. Disease Burden and Mortality Estimates: Cause Specific Mortality by Country. 2019. Available online: https://www.who.int/healthinfo/global_burden_disease/estimates/en/ (accessed on 15 November 2019).
  39. WHO: AirQ+: Software Tool for Health Risk Assessment of Air Pollution; World Health Organization: Copenhagen, Denmark, 2020; Available online: http://www.euro.who.int/en/health-topics/environment-and-health/air-quality/activities/airq-software-tool-for-health-risk-assessment-of-air-pollution (accessed on 19 March 2020).
  40. WHO: AirQ+: Key Features. Available online: http://www.euro.who.int/__data/assets/pdf_file/0003/371550/AirQ-Key_features_ENG.pdf?ua=1. (accessed on 21 March 2019).
  41. Statistics Denmark: Deaths: Documentation of Statistics. Available online: https://www.dst.dk/en/Statistik/emner/befolkning-og-valg/doedsfald-og-middellevetid/doedsfald (accessed on 18 November 2019).
  42. Statistics of Finland (OSF): Deaths [e-Publication]. ISSN=1798-2545. 2015, Appendix Table 1. Deaths by Month in 2005–2015. Helsinki: Statistics Finland. Available online: http://www.stat.fi/til/kuol/2015/kuol_2015_2016-04-14_tau_001_en.html (accessed on 18 November 2019).
  43. Statistics Iceland: Deaths and Crude Death Rate by Sex and Age 1841-2018. Available online: https://px.hagstofa.is/pxen/pxweb/en/Ibuar/Ibuar__Faeddirdanir__danir__danir/MAN05210.px (accessed on 18 November 2019).
  44. Statistics Norway: Deaths. 2015. Available online: https://www.ssb.no/en/befolkning/statistikker/dode/aar/2016-03-09 (accessed on 18 November 2019).
  45. Statistics Sweden: Deaths by Region, Age (during the Year) and Sex. Year 1968–2018. Available online: http://www.statistikdatabasen.scb.se/pxweb/en/ssd/START__BE__BE0101__BE0101I/DodaHandelseK/ (accessed on 18 November 2019).
  46. UN World Population Prospects, Mortality Data for 2013. Available online: https://population.un.org/wpp/Download/Standard/Mortality/ (accessed on 5 December 2019).
  47. Hoek, G.; Krishnan, R.M.; Beelen, R.; Peters, A.; Ostro, B.; Brunekreef, B.; Kaufman, J.D. Long-term air pollution exposure and cardio-respiratory mortality: A review. Environ. Health 2013, 12, 43. [Google Scholar] [CrossRef] [PubMed] [Green Version]
  48. Lim, S.S.; Vos, T.; Flaxman, A.D.; Danaei, G.; Shibuya, K.; Adair-Rohani, H.; AlMazroa, M.A.; Amann, M.; Anderson, H.R.; Andrews, K.G.; et al. A comparative risk assessment of burden of disease and injury attributable to 67 risk factors and risk factor clusters in 21 regions, 1990–2010: A systematic analysis for the Global Burden of Disease Study 2010. Lancet 2012, 380, 2224–2260. [Google Scholar] [CrossRef] [Green Version]
  49. Forouzanfar, M.H.; Alexander, L.; Anderson, H.R.; Bachman, V.F.; Biryukov, S.; Brauer, M.; Casey, D.; Coates, M.M.; Delwiche, K.; Estep, K.; et al. Global, regional, and national comparative risk assessment of 79 behavioural, environmental and occupational, and metabolic risks or clusters of risks in 188 countries, 1990–2013: A systematic analysis for the Global Burden of Disease Study 2013. Lancet 2015, 386, 2287–2323. [Google Scholar] [CrossRef] [Green Version]
  50. Forouzanfar, M.H.; Afshin, A.; Alexander, L.T.; Anderson, H.R.; Bhutta, Z.A.; Biryukov, S.; Brauer, M.; Burnett, R.; Cercy, K.; Charlson, F.J.; et al. Global, regional, and national comparative risk assessment of 79 behavioural, environmental and occupational, and metabolic risks or clusters of risks, 1990–2015: A systematic analysis for the Global Burden of Disease Study 2015. Lancet 2016, 388, 1659–1724. [Google Scholar] [CrossRef] [Green Version]
  51. Christensen, J.H. The Danish Eulerian hemispheric model—A three-dimensional air pollution model used for the Arctic. Atmos. Environ. 1997, 31, 4169–4191. [Google Scholar] [CrossRef]
  52. Brandt, J.; Silver, J.D.; Frohn, L.M.; Geels, C.; Gross, A.; Hansen, A.B.; Hansen, K.M.; Hedegaard, G.B.; Skjøth, C.A.; Villadsen, H.; et al. An integrated model study for Europe and North America using the Danish Eulerian Hemispheric Model with focus on intercontinental transport. Atmos. Environ. 2012, 53, 156–176. [Google Scholar] [CrossRef]
  53. Brandt, J.; Christensen, J.H.; Frohn, L.M.; Berkowicz, R. Air pollution forecasting from regional to urban street scale––Implementation and validation for two cities in Denmark. Phys. Chem. Earth Parts A/B/C 2003, 28, 335–344. [Google Scholar] [CrossRef]
  54. Brandt, J.; Christensen, J.H.; Frohn, L.M.; Palmgren, F.; Berkowicz, R.; Zlatev, Z. Operational air pollution forecasts from European to local scale. Atmos. Environ. 2001, 35, S91–S98. [Google Scholar] [CrossRef]
  55. Paunu, V.-V.; Karvosenoja, N.; Segersson, D.; Nielsen, O.-K.; Plejdrup, M.S.; Lopez-Aparicio, S.; Vo, D.T.; Thorsteinsson, T.; van der Gon, H.A.C.; Brandt, J.; et al. Air pollution emission inventory using national high-resolution spatial parameters for the Nordic countries. Atmos. Environ. 2020, unpublished; manuscript in preparation. [Google Scholar]
  56. Khan, J.; Kakosimos, K.; Raaschou-Nielsen, O.; Brandt, J.; Jensen, S.S.; Ellermann, T.; Ketzel, M. Development and performance evaluation of new AirGIS–A GIS based air pollution and human exposure modelling system. Atmos. Environ. 2019, 198, 102–121. [Google Scholar] [CrossRef]
  57. Brandt, J.; Christensen, J.H.; Frohn, L.M.; Berkowicz, R. Operational air pollution forecast from regional scale to urban street scale. Part 1: System description. Phys. Chem. Earth 2001, 26, 781–786. [Google Scholar] [CrossRef]
  58. Brandt, J.; Christensen, J.H.; Frohn, L.M.; Berkowicz, R. Operational air pollution forecast from regional scale to urban street scale. Part 2: Performance evaluation. Phys. Chem. Earth 2001, 26, 825–830. [Google Scholar] [CrossRef]
  59. EEA. Air quality in Europe—2018 Report, EEA Report No 12/2018, European Environment Agency. 2018. Available online: https://www.eea.europa.eu/publications/air-quality-in-europe-2018 (accessed on 13 November 2018).
  60. Korhonen, A.; Lehtomäki, H.; Rumrich, I.; Karvosenoja, N.; Paunu, V.-V.; Kupiainen, K.; Sofiev, M.; Palamarchuk, Y.; Kukkonen, J.; Kangas, L.; et al. Influence of spatial resolution on population PM2.5 exposure and health impacts. Air Qual Atmos Health 2019, 12, 705–718. [Google Scholar] [CrossRef] [Green Version]
Figure 1. The gridded 1 km × 1 km annual exposure to PM2.5 based on the simulated concentration from the Danish Eulerian Hemispheric Model (DEHM)/Urban Background Model (UBM) model multiplied with the population in each grid cell.
Atmosphere 11 00467 g001
Figure 2. Deaths attributable to (a) PM2.5 and (b) O3 exposures in the Nordic countries per million inhabitants. The results for Economic Valuation of Air Pollution (EVA) tool include acute deaths in addition to chronic deaths for PM2.5.
Atmosphere 11 00467 g002
Figure 3. Deaths attributable to PM2.5 mean exposure estimated with different concentration-response functions.
Atmosphere 11 00467 g003
Figure 4. Relative change in number of premature deaths attributable to air pollution exposure as function of spatial resolution in percentage from the highest (1 km × 1 km) to the of the coarsest resolution (700 km × 700 km), calculated by the UBM/EVA model system for PM2.5, NO2, O3 and total.
Atmosphere 11 00467 g004
Table 1. Summary of the properties of the tools included in this work.
CharacteristicsAirQ+ARPEVAISTE
Health metricsYLL, morbidity cases, deaths, RADs, hospital admissionsYLL, morbidity cases, deaths, RADs, hospital admissionsYLL, morbidity cases, deaths, RADs, hospital admissionsDALY, YLL, YLD, attributable deaths
Shape of the C-R functionLog-linear, linear-log, supra-linear (IER)LinearLinearLog-linear, linear, supra-linear (IER)
Exposure metricPWCPWCGridded exposurePWC + exposure distribution
Economical valuationn/aVSL, VOLYVSL, VOLYn/a
YLL: Years of Life Lost, RADs: Restricted activity days: DALY: Disability Adjusted Life Years, YLD: Years Lived with Disability, IER: Integrated exposure-response function, PWC: Population Weighed Concentration, VSL: Value of Statistical Life, VOLY: Value of Life Year lost.
Table 2. Baseline mortality in Nordic countries according to the national statistics in 2015 and the differences in the input values used in the tools.
CountryNational Statistics DeathsDifference in Tool Values (%)
ISTEARPEVA a
Denmark52,555−4.6%+10%+4.1%
Finland52,4920.18%+3.1%0.48%
Iceland2178−5.5%−1.7%n/a
Norway40,727−0.80%+6.4%+23%
Sweden90,907−0.18%+5.2%+5.8%
Ref.[41,42,43,44,45][38][46][41]
a EVA uses the Danish mortality rate (0.97%) based on years 2006–2015 for all regions.
Table 3. Concentration-response functions used in the tool comparison.
PollutantBaseline MortalityAge GroupRR per 10 µg/m3ThresholdIncluded in ToolsRef.
PM2.5All-cause (natural a) mortality>30 year1.062n/aARP, EVA b, ISTE[36,47]
PM2.5All-cause mortality (acute)all1.0123n/aEVA[36]
O3All-cause (natural a) mortalityall1.0029>35 ppbARP, EVA, ISTE[36]
n/a not applied, a excluding violent or accidental causes of deaths, b EVA uses chronic mortality after subtracting acute mortality to avoid double counting.
Table 4. Concentration-response (C-R) functions applied for PM2.5 in the C-R comparison.
C-R FunctionBaseline MortalityRR per 10 µg/m3Threshold µg/m3ShapeRef.
RR: 1.062All-cause (natural a) mortality1.062n/aLog-linear[47]
RR: 1.14All-cause (natural a) mortality1.14 bn/aLog-linear[18]
IER 2013ALRI, COPD, IHD, LC, StrokeFunctionc5.8–8.8Supra-linear[14,48]
IER 2015ALRI, COPD, IHD, LC, StrokeFunctionc5.9–8.7Supra-linear[49]
IER 2016ALRI, COPD, IHD, LC, StrokeFunctionc2.4–5.9Supra-linear[15,50]
a excluding violent or accidental causes of deaths; n/a not applied; b transformed from the reported 1.07 per 5 µg/m3; n/a not applied; c Relative risk (RR) depends on age group, ALRI: Acute lower respiratory infection, COPD: Chronic obstructive pulmonary disease, IHD: Ischemic heart disease, LC: lung cancer.
Table 5. Population-weighted concentrations for Nordic countries in 2015.
CountryPM2.5 (µg/m3)PM10 (µg/m3)NO2 (µg/m3)O3 a (µg/m3)
Denmark9.212.712.11660
Finland5.27.110.3628
Iceland5.59.711.9258
Norway6.29.16.91480
Sweden5.98.47.71380
a Calculated as the sum of daily maximum 8-h mean O3 over 35 ppb (SOMO35).
Table 6. Deaths attributable to PM2.5 and O3 exposures in Nordic countries in 2015.
CountryDeaths Attributable to PM2.5Deaths Attributable to O3
ARPEVA aISTEARPEVA aISTE
Denmark31003500 (580)2600767263
Finland16001900 (310)1500272625
Iceland69n/a630.0
Norway16002100 (360)1400515945
Sweden33003900 (650)300011011094
Nordic sum970011,4008500260260230
a EVA acute deaths presented separately in the brackets; n/a: not available.
Table 7. Deaths attributable to mean PM2.5 exposure in Nordic countries evaluated using different C-R functions.
CountryConcentration-Response Function
RR: 1.062 a [47]RR: 1.14 [18]IER2013 [14,48]IER2015 [49]IER2016 [15,50]
Denmark26005400200017002200
Finland150032001021600
Iceland631302175
Norway140030001901201500
Sweden30006300160363500
Nordic sum850018,000240018008800
a RR = 1.062 was used for chronic mortality by all tools in the tool comparison part.

