Article

Five Years of Dust Episodes at the Southern Italy GAW Regional Coastal Mediterranean Observatory: Multisensors and Modeling Analysis

by
Claudia Roberta Calidonna
1,*,†,
Elenio Avolio
1,†,
Daniel Gullì
1,†,
Ivano Ammoscato
1,†,
Mariafrancesca De Pino
1,†,
Antonio Donateo
2,† and
Teresa Lo Feudo
1,†
1
Institute of Climate and Atmospheric Sciences, National Research Council, Area Industriale Comp. 15, 88046 Lamezia Terme (CZ), Italy
2
Institute of Climate and Atmospheric Sciences, National Research Council, Zona Lecce Monteroni Km 1.2, 73100 Lecce, Italy
*
Author to whom correspondence should be addressed.
These authors contributed equally to this work.
Atmosphere 2020, 11(5), 456; https://doi.org/10.3390/atmos11050456
Submission received: 16 March 2020 / Revised: 21 April 2020 / Accepted: 27 April 2020 / Published: 30 April 2020
(This article belongs to the Special Issue Recent Advances of Air Pollution Studies in Italy)

Abstract

:
The Mediterranean area is a climate-change hotspot because of the natural and anthropogenic pollution pressure. The presence of natural aerosols, such as dust, influences solar radiation and contributes to the detection, in storm episodes, of significant concentrations of PM10 in Southern Italy, where generally fresh and clean air is due to local circulation, and particulate matter concentrations are very low. We present the results of medium-term observations (2015–2019) at Lamezia Terme GAW (Global Atmospheric Watch) Regional Observatory, with the purpose of identifying the dust incursion events by studying the aerosol properties in the site. To achieve this goal, the experimental data, collected by several instruments, have been also correlated with the large-scale atmospheric patterns derived by the ERA5 reanalysis dataset, in order to study the meteorological conditions that strongly influence dust outbreaks and their spatio-temporal behavior. An intense dust-outbreak episode, which occurred on 23–27 April 2019, was chosen as a case study; a detailed analysis was carried out considering surface and column optical properties, chemical properties, large-scale pattern circulation, air-quality modeling/satellite products, and back-trajectory analysis, to confirm the capability of the modeled large-scale atmospheric fields to correctly simulate the conditions mainly related to the desert dust-outbreak events.

1. Introduction

The contribution of desert dust emission in the troposphere to global atmospheric aerosols ( 1.5 × 10 9 tons/year) is due to arid regions [1,2]. The principal dust-producing regions on Earth are the Sahara Desert, the Middle East, Northwest China, Southwest Asia, central Australia, basins in southern Africa (in Namibia and Botswana), some areas in Bolivia, and the Great Basin (USA) [3,4].
In Europe, the main regions responsible for desert dust transport events are the northern African regions, in particular the northwestern part (Sahara Desert) and the northeast part (i.e., Egypt, Libya, Sudan, etc.) [5,6].
The most frequent trajectory patterns related to the transport of Saharan dust are four [7,8]. More than half (about 60 % ) of the dust loaded from Saharan sources remains in Africa (deposited in the sub-Saharan regions). Another substantial fraction (25%) is transported westward across the Atlantic Ocean [8,9,10], while a very small fraction (5%) is transported eastward, to the Middle East.
A significant fraction (10%) of transported Saharan dust amount goes through the Mediterranean Basin, reaching regions from southern to central Europe [6,11]. The transport is due to outbreak storms and it follows seasonal prevalent patterns [12,13]. In particular, for desert dust events, a major role is clearly played by the high proximity to the African regions, but the local circulation plays a strong role.
It is mainly in African regions that the deep convection, produced by strong surface heating, can uplift mineral desert dust particles for several kilometers into the free troposphere; this particulate matter, in a second phase, is advected over large distances (also intercontinental scales) [14,15] and subsequently detected even many kilometers away.
The most affected regions are in the middle of the Mediterranean Basin, where the orography is often represented by islands and peninsulas, and they are subject to atmospheric phenomena strongly influenced by local conditions. Several studies focusing on synoptic forcings and their impact on the Mediterranean Basin were carried out using different approaches and models [16,17,18,19].
From now on, we will use the word “dust” instead of the phrase “desert dust”.
Recent papers, such as [20,21], dealt with dust event, presenting heterogeneous characteristics that impact the Italian peninsula. In recent years, several papers have been published regarding dust-cycle dynamics, using various sensors such as satellite imaging [11,22,23,24], in situ measurements of concentrations and optical properties [6,25,26,27,28,29,30] and, more recently [31,32,33,34], LiDAR observations [35,36,37,38].
Modeling the mechanisms linked to the transport of dust is receiving great attention from the scientific community. Considering chemical transport, higher uncertainties are related to the heterogeneous characteristics of the emissions and to the high complexity of aerosol chemistry.
A detailed treatment of the aerosol dispersion mechanisms, through air-quality modeling, is beyond the scope of this paper.
An optimal forecast of the principal atmospheric fields, and a better knowledge of the modeled atmospheric conditions plausibly responsible for dust events, represents a great opportunity to improve the early-warning systems largely adopted worldwide; an accurate early-warning system could permit communication of not only a severe event occurrence, but also its estimated impact in terms of economic and health costs.
This study focuses on southern Italy, in which dust incursions are frequent and where it is interesting to study how air masses that are combined with local circulation are affected by the sea and the step orography, and where dust particles are mixed with local aerosol sources. These events are investigated through observed (heterogeneous) data and models and satellite tool output. With the proposed modeling approach, our main objective is to study the meteorological conditions that strongly influence dust outbreaks and their spatio-temporal behavior. This is possible through combining analysis of a mid-term comprehensive collected data on aerosols, by calculating derived and measured parameters thresholds in order at first to identify dust events, and testing model capability to correctly reproduce the atmospheric patterns associated with the dust events. The approach validation was tested on a dust-outbreak event that occurred in spring 2019.
The paper is organized as follows. After the introduction, in the Data and Methods the site, in situ instruments, and monitoring programs, available dataset, and modeling tools are described. Following that, in the Results and Discussion, a detailed statistical analysis on the entire dataset of aerosol optical surface properties is discussed together with meteorological area characterization. Furthermore, a detailed analysis of dust events, within available dataset, is here described determining optical properties and air masses circulation through modeling reconstruction. In the Case Study—the Dust Outbreak 23–27 April 2019—a specific case was studied to go deeper into detail in a more comprehensive analysis of a dust event occurrence by demonstrating the effectiveness of our approach in integrating measurement programs and a large-scale circulation analysis. Finally, conclusions and a research outlook close the paper.

2. Data and Methods

In this section, we describe a comprehensive dataset, involving several instruments, used for our study. Satellite and model used tools are also described together with the method adopted to identify dust events occurring at our experimental site.

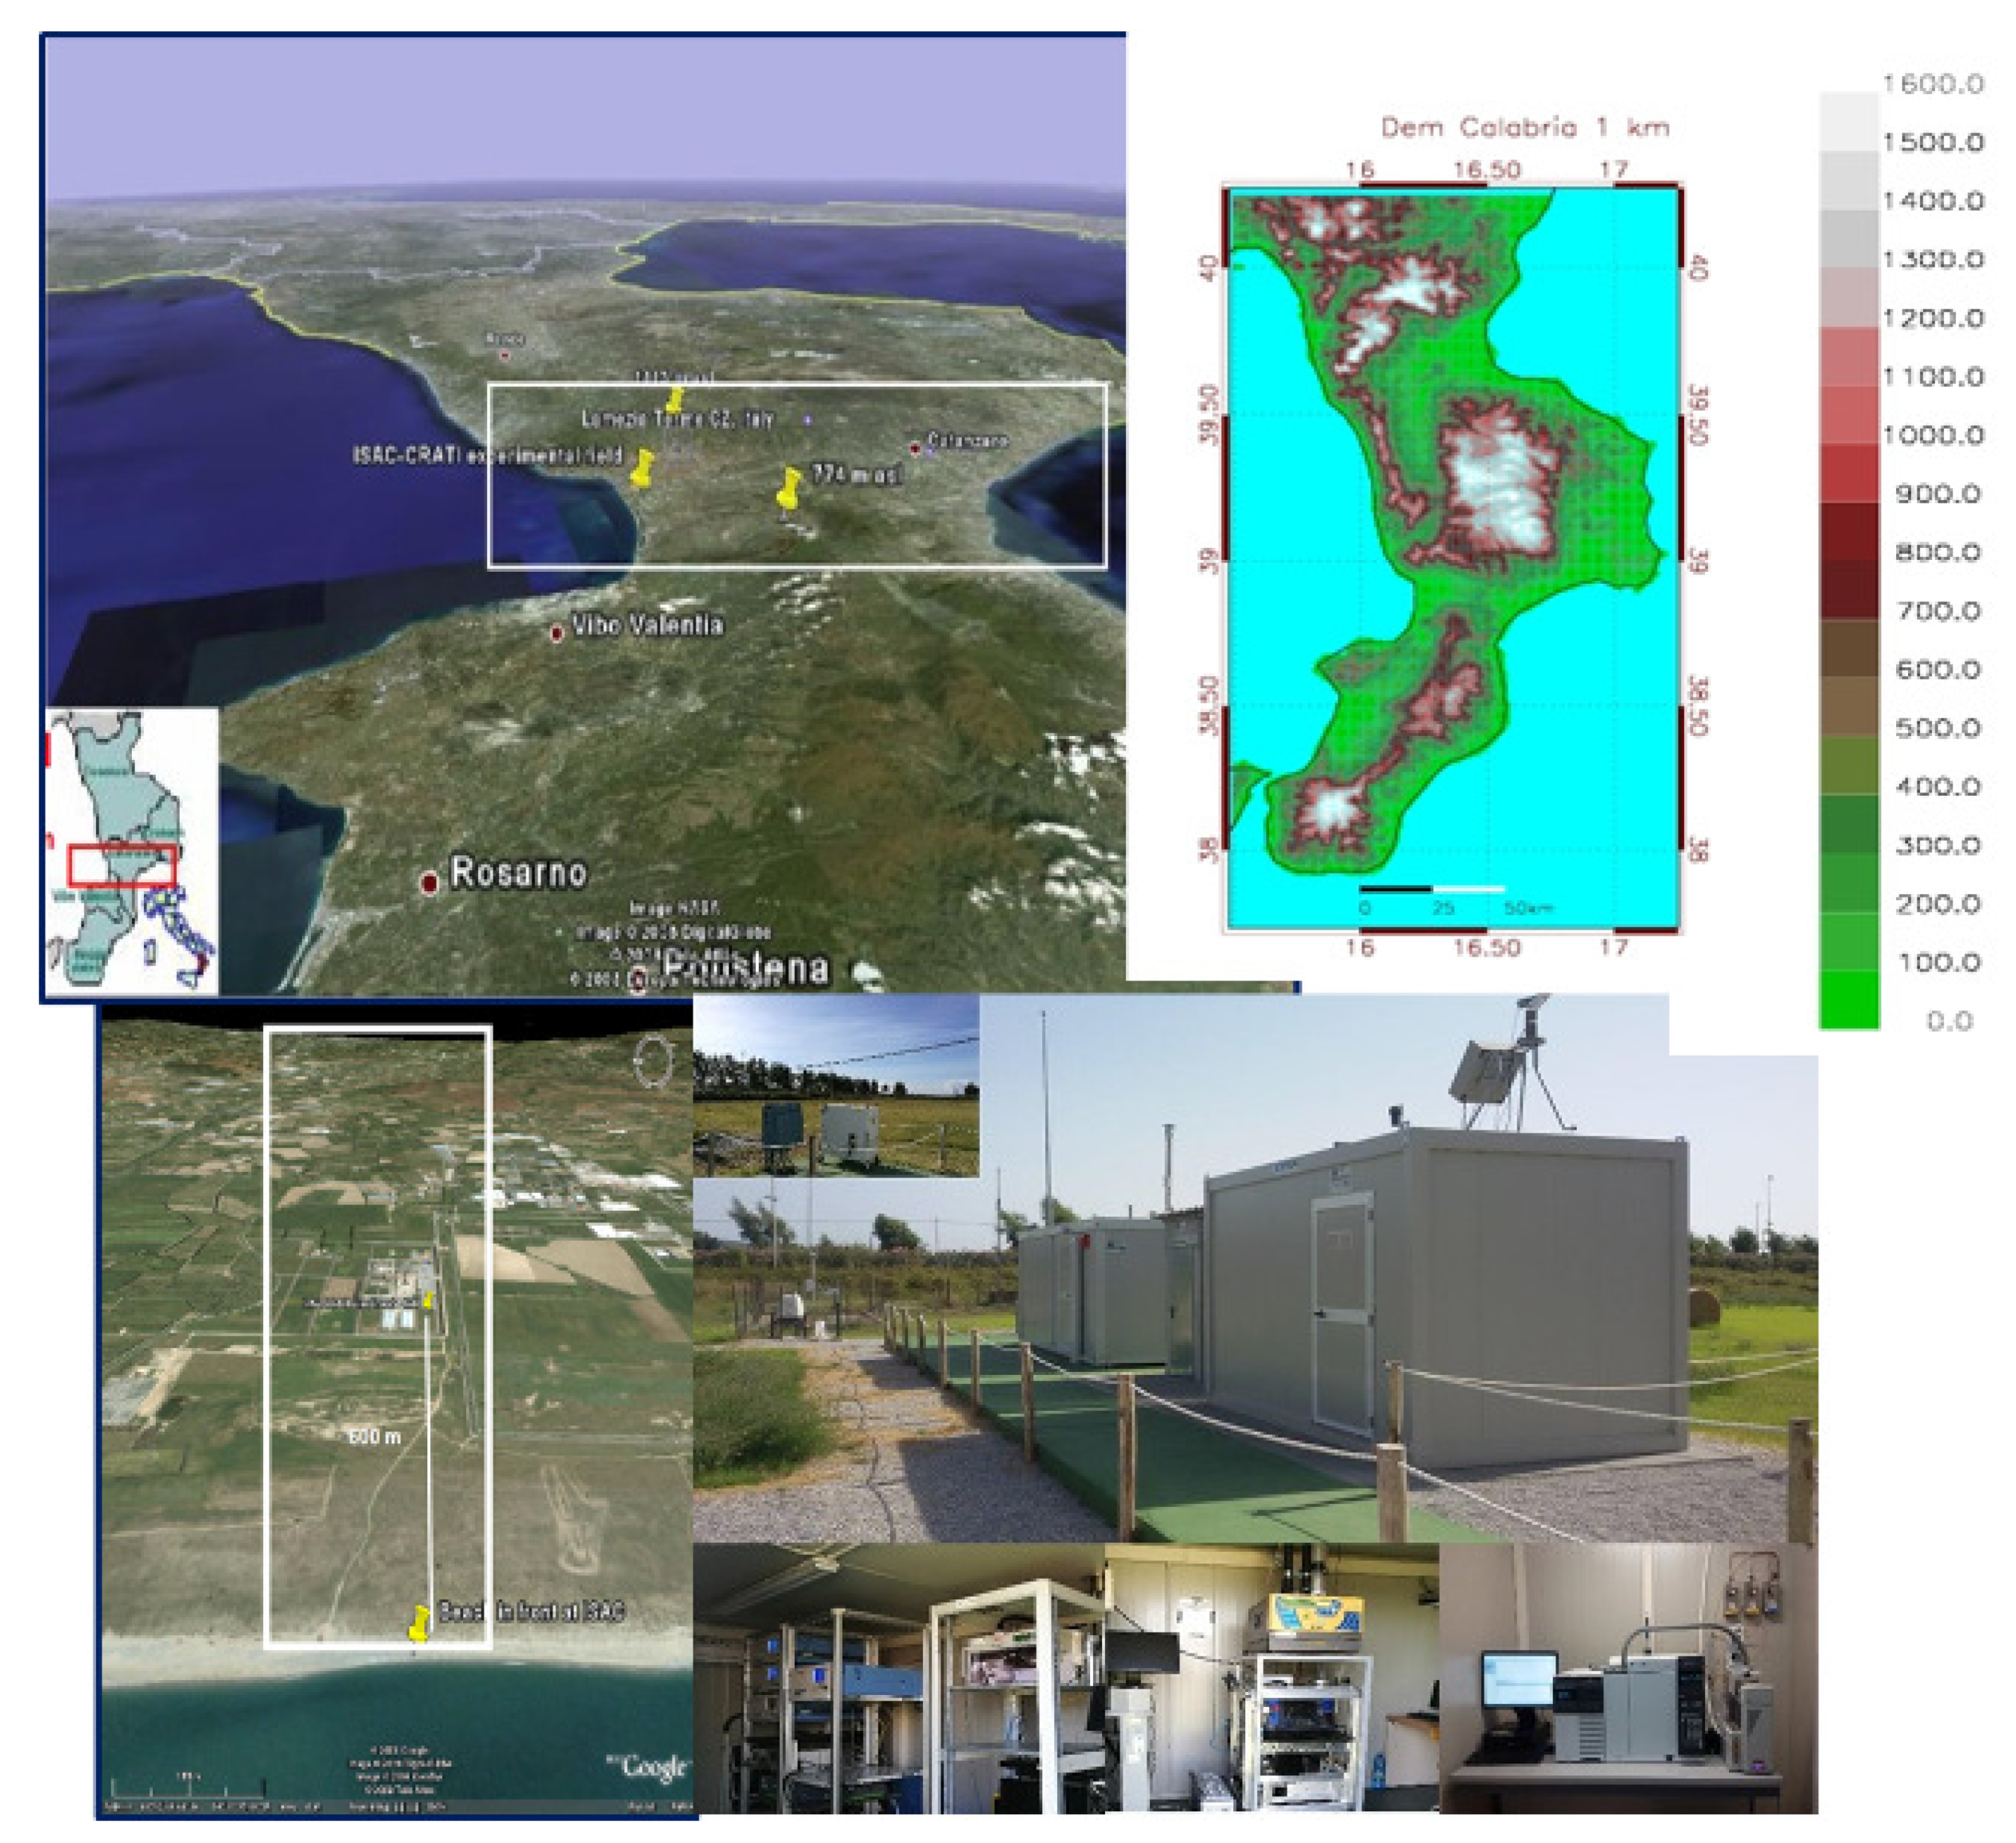
2.1. Site and Instruments

2.1.1. The Experimental Site

The CNR-ISAC observatory of Lamezia Terme is a Regional Global Atmospheric Watch of World Meteorological Organization (GAW-WMO) site (LMT, 38.88 N 16.23 E; 6 m.a.s.l.) is managed by the Institute of Atmospheric Science and Climate (ISAC) of the National Research Council (CNR). LMT is a coastal site located about 600 m inland from the Tyrrhenian coastline (west side; Figure 1). The area is characterized by anthropogenic pollution emissions related to transportation and agriculture due, in particular, to the presence of Lamezia Terme International Airport (north direction) (14,699 flights in 2015) and the city of Lamezia Terme (north-east direction). The highway (north-east direction) runs around the observatory location clockwise from N to S, and is located 7 km (northward) to 3.5 km (southward) from the observatory.
The area is characterized by moderate wind breezes, converging on Marcellinara gap between the Jonian and Thyrrenian Sea from the sea (NW–SW) (see Figure 1), which mainly develop during daytime, while NE gentle wind breezes from land mainly affecting the night-time period [39].

2.1.2. The Instrumental Setup

Several instruments within different monitoring programs have been active at LMT Observatory since 2015.
A unique pump is used for aerosol sampling, maintaining a uniform flow rate of 200 L/min pumped in the main inlet tube, at 4 m height, equipped with a PM 10 head (50%) transmission efficiency at 10 μ m aerodynamic diameter. The aerosol stream is split isokinetically into several instruments such as nephelometer, Multi-Angle Absorption Photometer (MAAP), Optical Particle Counter (OPC), Beta Attenuation Sampling and Measurement System (SWAM).
A nephelometer (model 3563, TSI Inc., St. Paul, MN, USA), operating at three wavelengths (450 nm, 550 nm, and 700 nm) for the measure of both total scattering ( σ s c ) and backscattering ( σ b s c ), was sampled at 1 min resolution time [32,40].
Regarding quality data checking, the following procedures were guaranteed:
  • raw data with relative humidity greater than 60% condition were rejected according to [31,32];
  • a periodical full nephelometer calibration was performed using CO2 as span gas;
  • a zero calibration was carried out once an hour using internally filtered particle-free air.
The MAAP (5012 Model Thermo Scientific™ (Franklin, MA, USA) operates by measuring black carbon and aerosol short-wave radiation absorption properties. The aerosol absorption (short-wave radiation) coefficient (sa) and continuous measurements of equivalent black carbon (eBC) concentrations are measured at 637 nm at 1 min resolution time [41].
The MAAP determines aerosol absorption by illuminating a particle-loaded filter and simultaneously measuring the radiation passing through the filter and the backscattered light at three different angles [42]. The sample flow provided by the internal pump was set to 16.7 L/min. A mass closure, for the black carbon mass concentration measured by MAAP, was verified by ensuring that the eBC mass concentration was lower than 50% of the PM 2.5 mass concentration.
Nephelometer and MAAP operate according to SOP GAW-WMO specification [43]
The OPC (Multichannel Monitor, FAI Instruments, Rome, Italy) [44] measures the number size distribution of particles in 22 size bins with diameters ranging from 0.28–10 μ m. OPC operates with a 1 L/min flow rate at 1 min temporal resolution and the relative humidity of its air samples is kept lower than 50% using dilution (1:2) (a clean dried air and a smart heater placed in the diluter along the mixing chamber is automatically activated only when needed). It ensures proper conditioning of the aerosol and it minimizes of the effects of the water vapor.
PM 10 and PM 2.5 mass concentration measurements are performed by β -ray attenuation method using a low volume (2.3 m 3 /h) FAI SWAM 5a-Dual Channel Monitor [45].
An automatic weather station (Vaisala WXT520, Finland) measures, at 10 m.a.s.l., the following meteorological parameters: temperature, relative humidity, wind speed and direction, pressure, and rain (10 averaged minutes).
A sun photometer (CIMEL CE-318, Paris, France) [46], operative within AErosol RObotic Network (AERONET) [47], is used for ground-based aerosol measurements and in particular atmospheric aerosol columnar properties. It is a multichannel, automatic sun-and-sky scanning radiometer measuring the direct solar irradiance and sky radiance at the Earth’s surface. The sun photometer allows the obtaining of, with direct sun measurements with a 1.2 ° full, the Aerosol Optical Depth (AOD) at 340, 380, 440, 500, 675, 870, 1020 and 1640 nm, along with the water vapor column content and the estimation of several optical and microphysical aerosol properties, such as the refractive index and the size distribution. The system is fully automatic and powered by a solar panel. The solar irradiances received by the photometer are inverted into the columnar aerosol optical and microphysical properties through the implementation of retrieval algorithms [48]. The used standardized methods concerning instrument maintenance, calibration, cloud screening and data processing allow aerosol monitoring and comparison between different study periods and areas [47]. The uncertainty in the retrieval of AOD under cloud-free conditions is ± 0.01 for wavelengths larger than 440 nm and ± 0.02 for shorter wavelengths [49]. Errors in aerosol size distribution retrievals depend on particle size, aerosol type, and actual values of the size distribution. For particles in the size range 0.1 < r < 7 μ m, retrieval is around 10%–35%, while for diameters/particle sizes lower than 1 μ m and higher than 7 μ m retrieval errors rise to 80%–100% [48,50]. For measurements under low aerosol load conditions (i.e., AOD (440 nm) < 0.2 ), the retrieval accuracy decreases significantly [48,50]. In this work, the AERONET level 2.0 data are used, in relation to the dust-outbreak case, including the AOD and inversion products derived, SAE at 440–675 nm. Moreover, the accuracy of the retrieved AOD by the CIMEL radiometer is spectrally dependent, being better (<0.01) for wavelengths longer than 440 nm and lower (<0.02) for the UV wavelengths [49].
A Scanning Electron Microscope (SEM) Zeiss EVO MA15, equipped with Energy Dispersive X-ray Analysis (EDX) Microanalysis, BRUKER Detector Xflash 6-10, located at Research Center of the National Institute for Insurance against Accidents at Work in Lamezia Terme IT, was used to analyze the filter samples collected with the SWAM. SEM is managed by “Smart SEM” software and the EDX microanalysis is managed by “Bruker Quantax” software. A lanthanum filament is used, and the instrument calibration is repeatedly checked by the operator using a copper standard. The filament current is adjusted to an energy voltage of 20 keV.
The analysis was carried out for dust particles collected on quartz filters by means of a SWAM 5a Dual Channel Beta Attenuation Sampling and Measurement Systems, using a PM 10 cut-off.
The portions of each filter are mounted on (12.5 mm diameter) aluminum stubs and metalized using gold. To proceed with recognition of individual particles, a portion of the blank filter acts as a reference. To minimize the recognition of false particles, the acquired images, of backscattered electrons (BSE), are compared with secondary electron (SE) ones. The SEM analysis technique, combined with the EDX Energy Dispersive X-ray Analysis, is frequently used to obtain geochemical and morphology information on single dust particles laid on filters. It is also possible to perform the morphology of dust particles and related chemical elemental analysis.

2.2. Data

2.2.1. Modeling Products

With the aim of studying the main large-scale atmospheric patterns linked to the revealed dust events, we analyzed the European Centre for Medium-Range Weather Forecasts (ECMWF) ERA5 (Copernicus Climate-Change Service (C3S) (2017)) [51]; ERA5 fields have a horizontal resolution of about 31 km and 137 vertical levels from the surface to 0.01 hPa.
The considered fields, in this work, are geopotential height at 500 hPa (Z500), mean sea level pressure (MSLP), and U and V wind component(s) at 925 hPa (in order to calculate wind speed and direction at this level; WIND925). These parameters are extracted at 00 UTC, for the whole 5-year period.
To confirm the occurrence of the dust events, to evaluate the location of the dust sources for the investigated cases and their simulated spatio-temporal propagation, we also analyzed (and plotted) some CAMS (Copernicus Atmosphere Monitoring Service) model products [52,53]. In particular, we used the CAMS Global archived analysis (6 hourly analysis, approximately 40km horizontal resolution, on 60 vertical levels from the surface up to 0.1 hPa). The main parameter taken into account is the Dust Aerosol Optical Depth, obtained from CAMS simulations vertically integrating the aerosol extinction coefficient at 550 nm.
For a single-event discussion, the back-trajectories computed with the HYSPLIT (Hybrid Single-Particle Lagrangian Integrated Trajectory) model [54] are considered and commented upon; the trajectories are obtained using the READY (Real-time Environmental Applications and Display sYstem) platform (https://www.ready.noaa.gov/index.php) [55].

2.2.2. Satellite Products

To search for further confirmation of the characteristics of the dust events, images from the Moderate Resolution Imaging Spectrometer (MODIS) on NASA’s Aqua and Terra satellite are also considered.
The parameter taken into account is the MODIS Near Real-Time NRT Level 3 value-added Aerosol Optical Depth (MCDAODHD) [56,57,58,59,60]; the sensor resolution is 0.5 degrees, the imagery resolution is 2 km, and the temporal resolution is daily.

2.2.3. Optical Properties

On the entire dataset, we analyzed the total scattering and backscattering coefficients data from nephelometer, for the entire period. The non-Lambertian and truncation error was applied at raw signal of σ s c and σ b s c by using the method in [38,61,62,63].
We averaged raw data at 5-minute intervals. For σ s c , we used detection limits values, signal-to-noise ratio of 2, of 0.44, 0.17, and 0.26 Mm 1 and for σ b s c the detection limits were 0.29, 0.11, and 0.21 Mm 1 both respectively at 450, 550, and 700 nm [40]. Based on σ s c and σ b s c coefficients, three intensive (independent of the amount of particles and dimensionless) properties were calculated: the hemispheric backscattering fraction (b), asymmetry parameter (g) and Angstrom coefficient SAE. Using Equation (1), b λ was calculated at the wavelength of λ 1 = 450 nm, λ 2 = 550 nm and λ 3 = 700 nm for the whole period:
b λ = σ ( b s c , λ ) σ ( s c , λ )
The b λ parameter is weakly dependent on concentration and it could be very useful for describing the aerosol-scattered radiation reaching the ground and it is very useful in radiative transfer models [64].
An analytic relationship by [65] is adopted in this manuscript (Equation (2)) to calculate g using b λ .
g = 7.143889 b λ 3 + 7.464439 b λ 2 3.96356 b λ + 0.9893
The asymmetry parameter ranges from −1 (entirely backscattered light) to 1 (entirely forward-scattered light) [64] and g is equal to zero value for symmetric (e.g., Rayleigh) scattering light. This parameter is one of the optical properties widely used to estimate aerosol forcing of climate. In this study, in the discussion of results, we used g at λ = 550 n m .
SAE was calculated for each pair of wavelengths: SAE 450 , 700 , SAE 550 , 700 , and SAE 450 , 550 by using Equation (3) from the corrected scattering data.
S A E λ 1 , λ 2 = log ( σ s c , λ 1 σ s c , λ 2 ) log ( λ 1 ) ( λ 2 )
A prevalence of coarse particles (dust, sea salt) occurs when the SAE values are small (SAE 450 , 700 < 0.5), while SAE 450 , 700 > 1.5 indicate a preponderance of small particles such as secondary sulphates, nitrate aerosols, and biomass burning particles [50]. Although this interpretation could be unclear if a mixture of fine and coarse mode is present in the sampled air [66,67]. In this work, SAE 450 , 700 will be used to discuss our results. The absorption coefficient (sa) was calculated at 637 nm [48] from MAAP measurements according to Equation (3).
s a , 637 = e B C × M A C
where eBC is the black carbon mass ( μ g/m 3 ) measured by MAAP and MAC = 6.6 m 2 / g is the Mass Absorption Coefficient (defined in [68]).

2.3. The Identification of Dust Events: The Method

African dust events were identified considering the aerosol optical properties at the surface, using an approach adopted in past studies [69,70]. The results were matched with available ground measurements of PM coarse fraction and PM coarse and fine fraction to find the number of days when dust events occurred. Also, advection of African dust and air mass back-trajectory analysis [71,72] was used to identify the specific period of dust events in the Mediterranean site. In our case study, we used such an approach to reconstruct the event, already selected by in situ observations, and identify the possible direction sources of sampled dust at LMT. Additional data based on the concentration of mineral elements (mainly Fe, Al, Si, Ti), typically contained in dust particles, are available for the chosen case study, using the SEM instruments. A characterization of the aerosol types, present at surface, can be based on measurements of σ s c and σ b s c , Ångström exponent (SAE).
SAE coefficient mainly depends on the particle size distribution (low values of SAE indicate a prevailing role of coarse particles). The combined use of SAE, with other optical parameters, allows the identification of different aerosol types at ground, including dust; usually, low values of SAE (<0.5) are typical of Saharan dust [71]. In [69] different kinds of particles, using surface optical properties, were identified and studied. The authors show that during dust events, the mean values of SAE 450 , 700 , g and SSA are respectively less than 0.7 ± 0.34 , 0.62 ± 0.05 and 0.86 are thresholds to characterize dust events at the Lamezia Terme site. Therefore, in this study, we selected dust events largely dominant at the surface, using threshold values for SAE 450 , 700 less than 0.7, and, with the application of this threshold, the number of total cases found is 143 days (with probably dust events). These 143 days matched the results of PM coarse fraction dataset (SWAM instruments). Regarding PM coarse fraction, a weighting daily mean was performed. To identify, with a high probability, a dust event occurrence, we adopted a threshold value. Such a threshold, for our site, according to the coarse fraction mean value, is the 95th percentile (19.9 μ g/m 3 ). This value is likely associated with a dust event considering PM 10 concentration. The initial 143 events that matched the 19.9 μ g/m 3 mass were then reduced to 62 days.
Continuous mixing with cleaner (marine) air masses, typical of the marine-coastal environments, activates a frequent lowering of eBC concentration [73] at LMT, with eBC values much lower (0.64 μ g/m 3 ) than the PM 10 (10.69 μ g/m 3 ), on the whole measured period. During the dust events, the concentration of PM 10 usually rose drastically with peaks of about 50–60 μ g/m 3 while the eBC concentration remained close to the mean values with peaks of about 1.6 μ g/m 3 . On the 62 dust events, we performed an additional check of the eBC concentration with the aim of excluding the events with high mean daily eBC mass concentration values, which contribute to the coarse fraction of the PM. This will allow us to study only cases of dust not affected by the presence of local pollutants due to the products of combustion, such as biomass burning and road traffic. From the 62 events, all those with a mean daily of eBC concentration values above the 90 percentile (1.01 μ g/m 3 ), as shown in Table 1, were therefore excluded from the analysis. With this further discrimination from 62 dust episodes, we pass to 52 in total, as in Table 2 within the initial identified 143 days with dust.
Using such an approach, we identified the events as reported in Table 2, their duration and the identification of the season in which they occurred. We divided cases occurring in the cold from the warm season by considering the respective following grouping of months: respectively for October, November, December, January, February and March (ONDJFM), and April, May, June, July, August, and September (AMJLAS).
In Table 3 the PM coarse fraction statistics in warm and cold season are shown. Regarding the mean values from warm and cold season, they are very similar, with differences of 2.51 μ g/m 3 , the maximum value is reached in cold season with a peak value of 60.04 μ g/m 3 .
To verify and confirm the dust events identified by the optical surface characteristics and PM deposition, in Table 2 and Table 3, we discussed above the synoptic conditions over the Mediterranean area, associating each of the 15 “dust events” with the large-scale ERA5 fields at 00 UTC on the first day of each case.
In summary, to use our approach, two main kinds of measure are necessary:
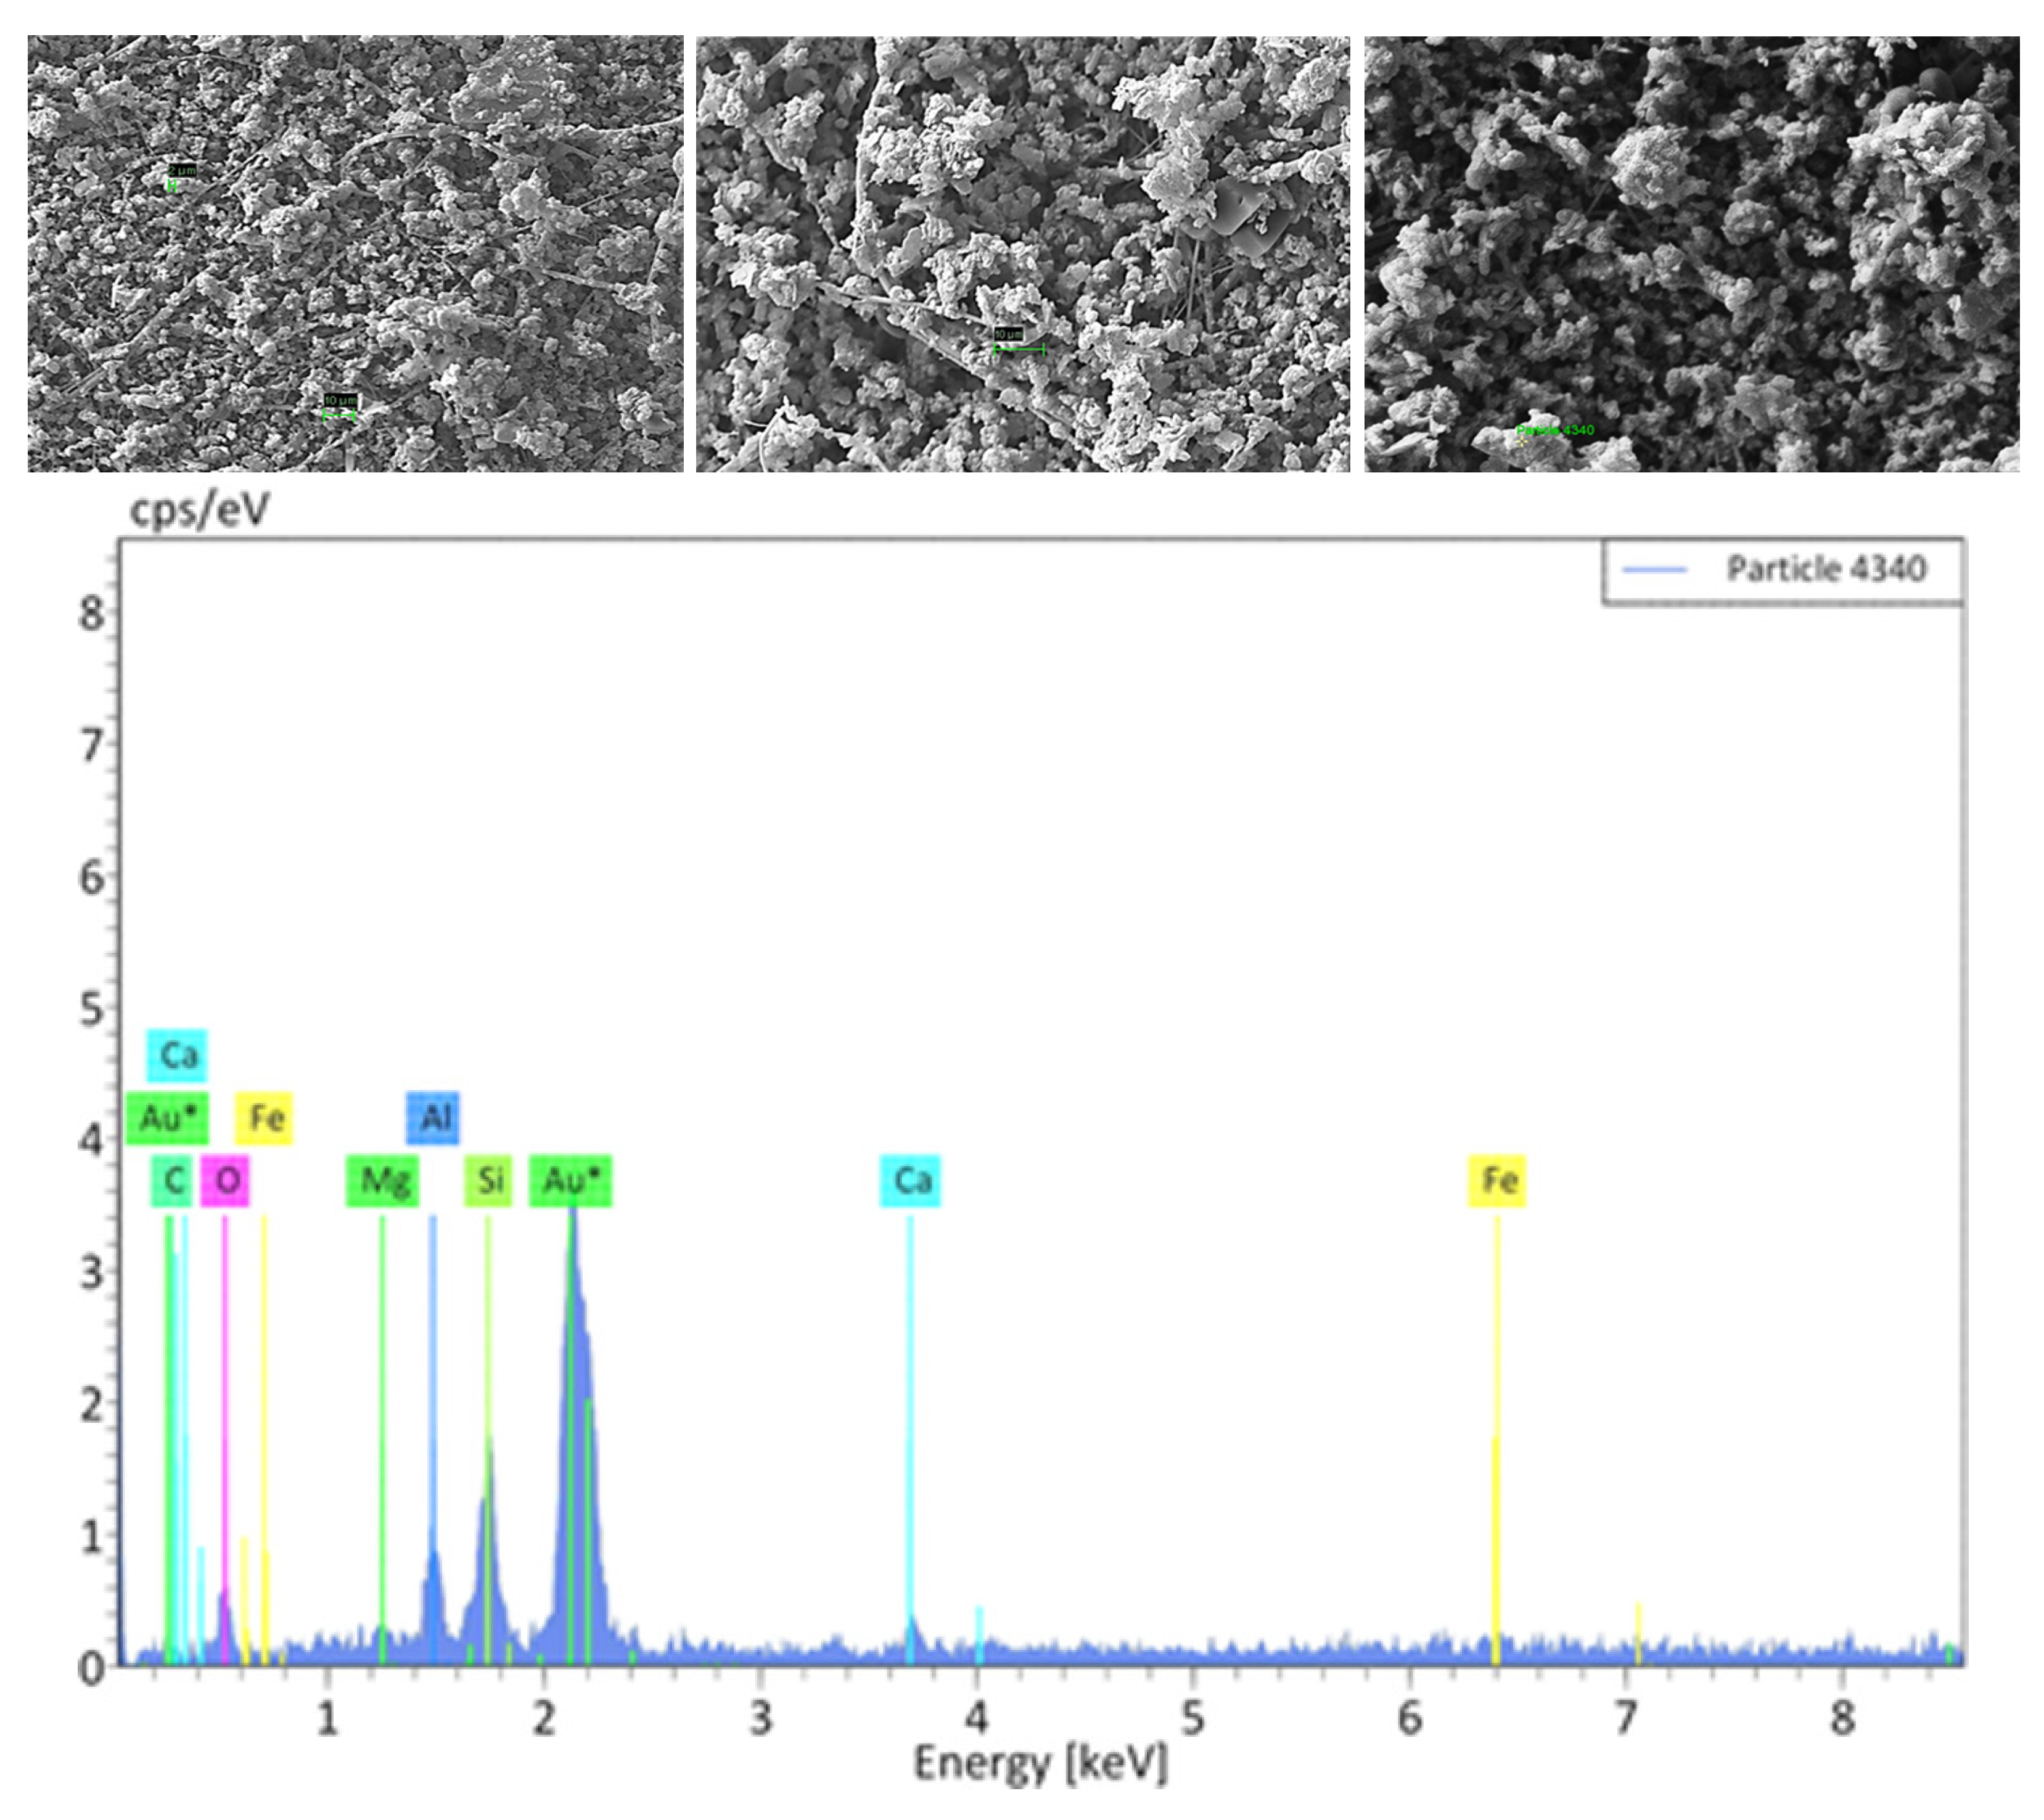
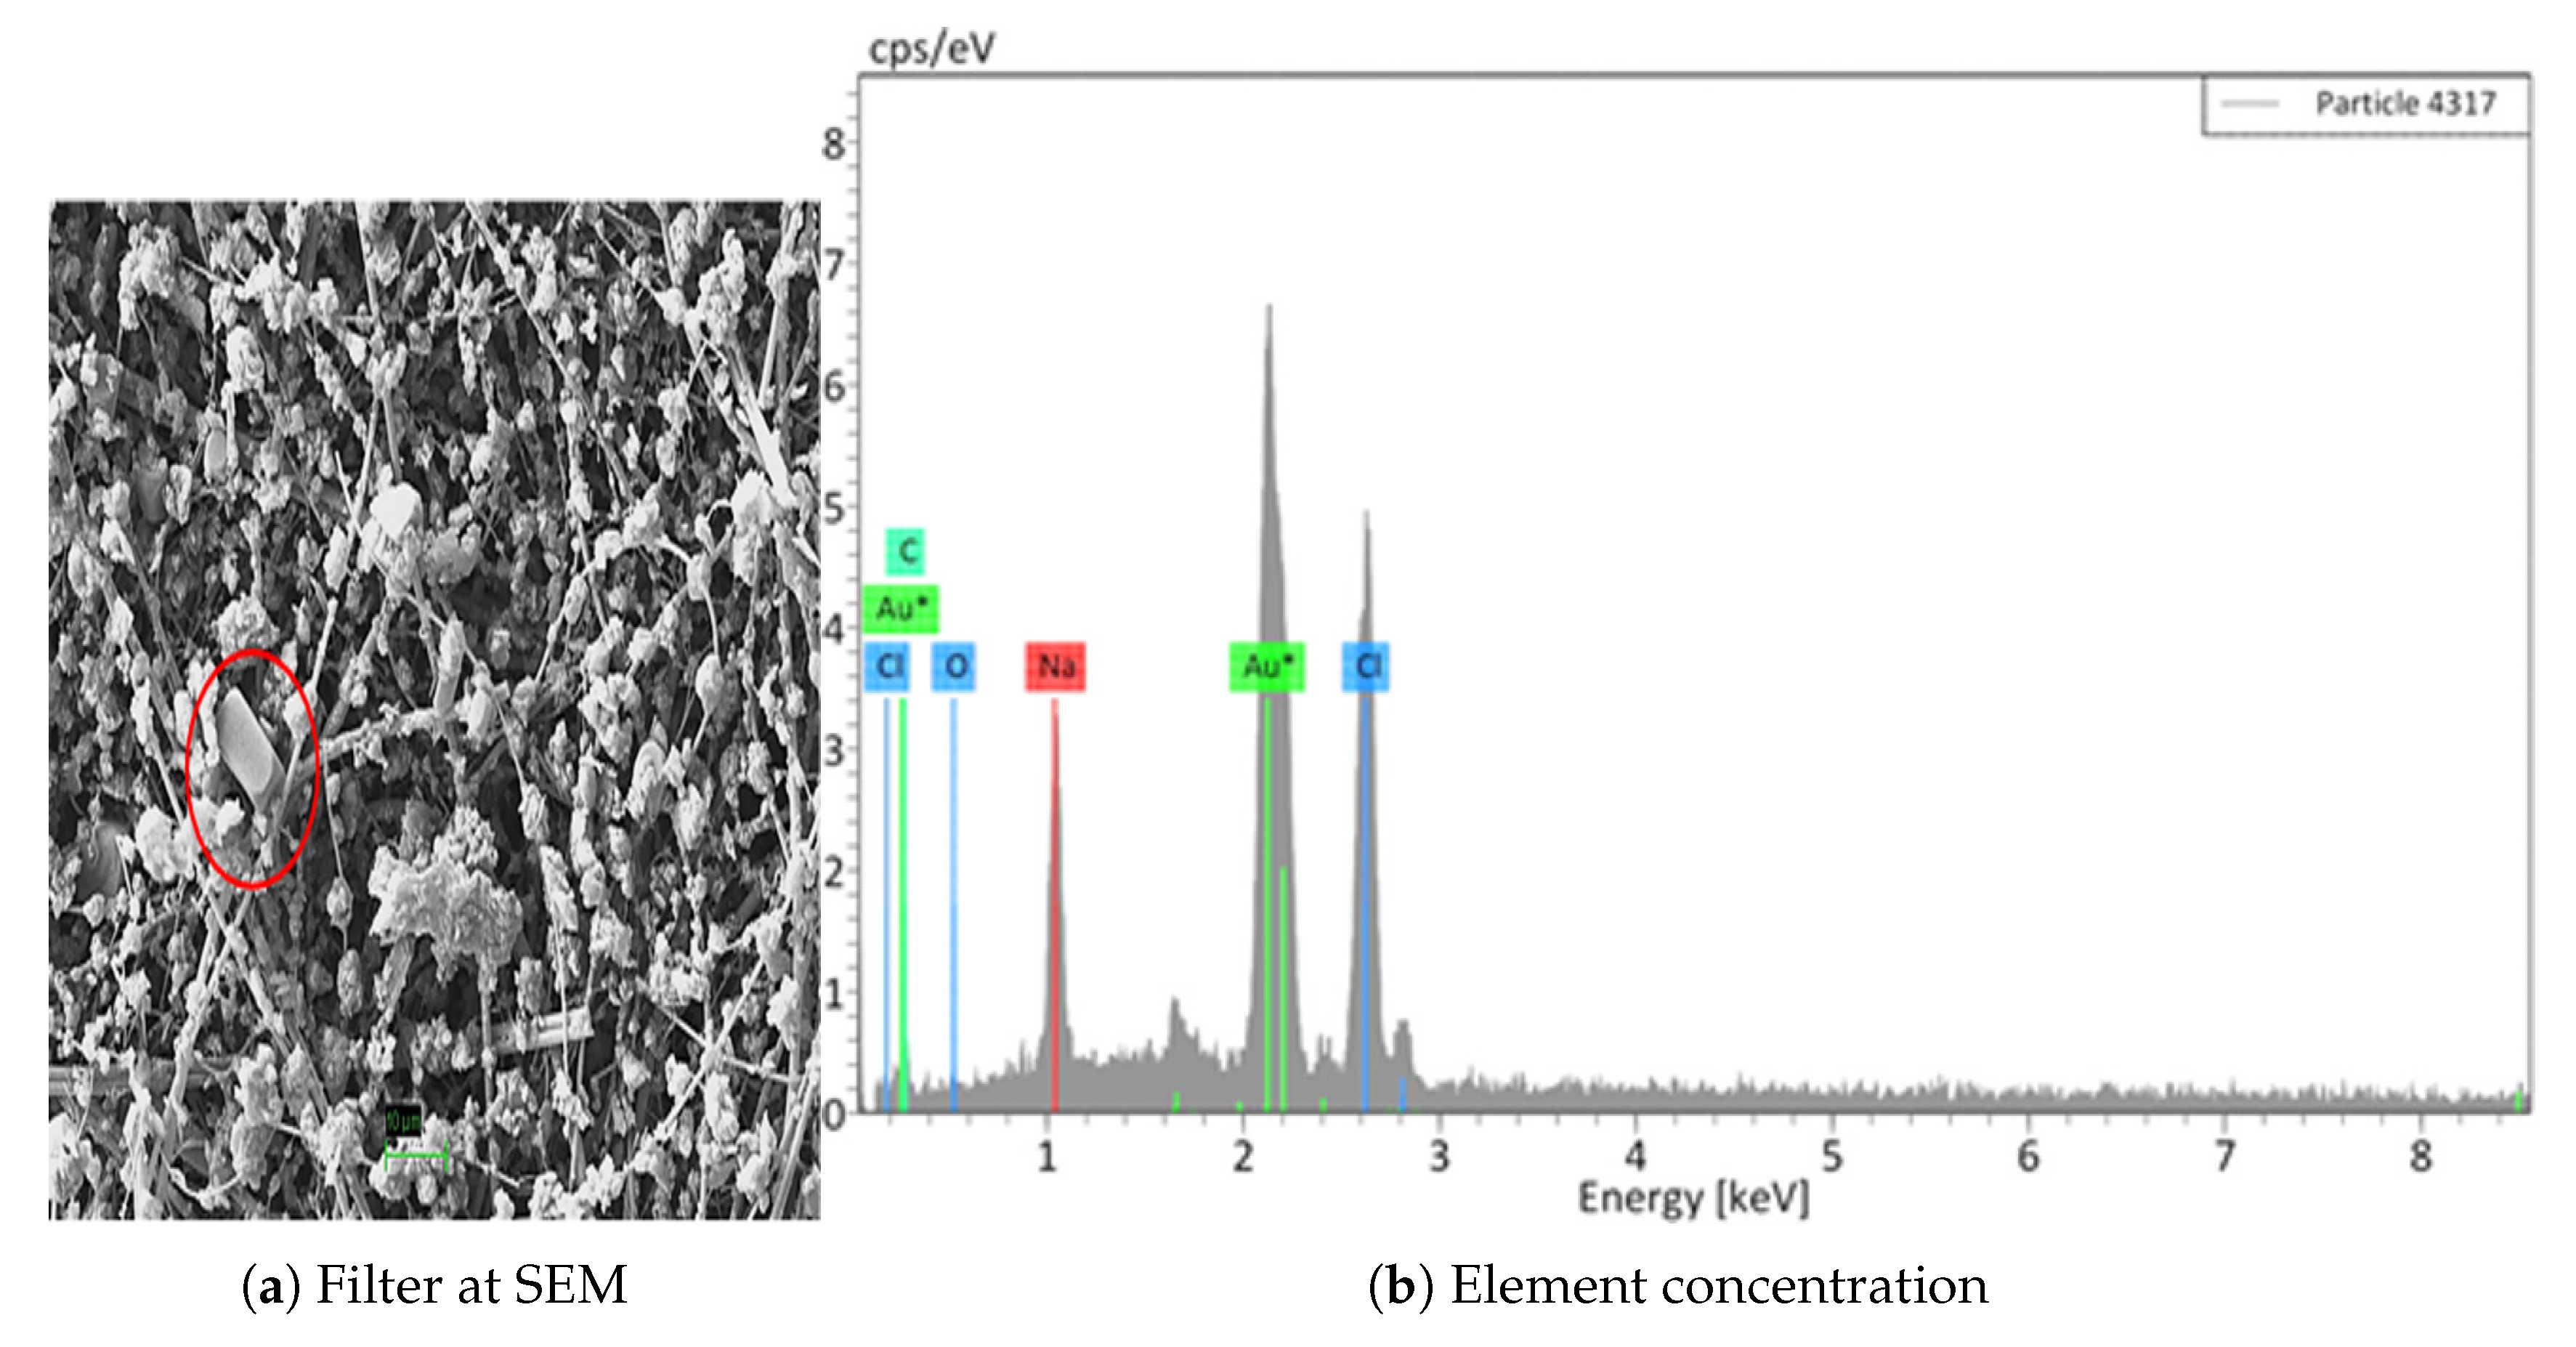
  • dust collection, through impactors or dry deposition with the opportunity to recognize by SEM the presence of dust particles; and
  • optical measurements to derive related properties regarding AOD and SAE.
The integrated use of available model output and satellite measurement allow completion the method here proposed.

3. Results and Discussion

In this section, we show results of statistics applied to selected cases by adopting the methodology defined in Section 3 according to seasonality and prevailing wind direction. Furthermore, analysis of large-scale patterns and the selected case of dust outbreaks is described in a detailed comprehensive analysis of measures and tools described in Section 2.

3.1. General Features

To apply our methodology to dust-outbreak case selection, we analyzed the statistical results on the entire 2015–2019 dataset considering SWAM OPC, MAAP and nephelometer and quality check of their measures as shown in Table 4.
Regarding nephelometer data, availability of the initial 87.48% was reduced to 49.35% as quality check of data about relative humidity caused a high percentage loss of data, as described in [32].
Statistics of aerosol optical properties, eBC mass concentrations and PM coarse fraction (mean, median, minimum and maximum values, 10th, 90th percentiles) over the whole measurement period (2015–2019), is presented in Table 5 for LMT Observatory. Table 5 shows the results of scattering and backscattering coefficient ( σ s c , σ b s c ), SAE, g at all wavelengths (450 nm, 550 nm and 700 nm), eBC, and PM coarse fraction (PM10). The mean value of scattering σ s c 550 is 44.44 Mm 1 and the median values measured is σ s c 550 (32.87 Mm 1 ), the mean and median values of σ b s c 550 are 4.41 Mm 1 and 3.40 Mm 1 respectively. This range of values is also reported in recent studies [31,32].
Over these five years of measurement, the highest median (1.94) with respect to the mean (1.84) values of SAE 450 , 700 were observed and the asymmetry factor g median values ranged between 0.49 g 700 and 0.54 g 550 . The observatory site shows high mean scattering values >40 Mm 1 and SAE values greater than one. The site, with a strategic position in the central Mediterranean Basin, depending on the local wind circulation and breeze system (west–east), is influenced by multiple sources with emissions of both coarse and fine fraction of aerosols. African dust events, sea spray intrusion, and episodic dust coming from Etna and Stromboli volcanic eruptions influence the area of study [74]. Furthermore, a large contribute of fine particles is evident ( S A E 450 , 700 > 1 ) due to the near city and airport area [69,74,75]. Similarly, we analyzed eBC parameters obtaining a mean value of 0.643 μ g/m 3 and a maximum value of 11.266 μ g/m 3 resulted as shown in Table 5. To quantify the actual amount of dust, and other solid particles, we used the SWAM instruments collecting PM coarse fraction at the surface. For sample collection by SWAM, a quartz filter is used for 24h sampling in spring and summer seasons (when events are most frequent) and a 72h sampled in other seasons. The material collected can also be used for further analysis including chemical ones. Regarding the PM coarse and fine fraction, to homogenize the dataset due to different sampling time intervals, we calculate the daily weighted mean of the samples. For the whole period, the mean values of PM coarse fraction results are 10.69 μ g/m 3 as in Table 5.

3.2. Climatology of Dust Events and Seasonality

In Table 6 we report the statistics of all dust events that occurred during the considered period (2015–2019). We note that the mean value of SAE coefficient is 0.614 ± 0.012 , lower than the average SAE value calculated for whole period, while the g values is about 0.596 ± 0.001 , and does not change much compared to the average calculated on 5 years according [28,50,64,69]. Regarding the σ s c mean value, it is higher than the average over 5 years, confirming a greater presence of coarse particles in the atmosphere during the dust event.
The contribution to the measured concentrations and the duration of the events are highly variable. Selected events present difference considering a seasonal analysis whose statistics are presented in Table 7 and Table 8. During the cold season, the mean values of σ s c , SAE and g in Table 7 are lower than the average on all dust events in Table 6.
Furthermore, analyzing the warm season in Table 8, an increase in SAE 450 , 700 , g and σ s c compared to the average values described in Table 6 is observed. These results suggest that during dust event occurrences, we should analyze deeper optical parameters that are influenced by the circulation of meteorological fields due to different possible sources hence to the presence of mixed aerosol. This result explains the highest SAE values, compared to the averaged values present in Table 6, when the dust is transported from the S-E. In this case, dust particles are mixed with continental source aerosols.
Often, the synoptic configurations drive the air masses to flow together from SW and SE (see next section), generating a single convergent trajectory over LMT. During such an event, transported dust particles are mixed from the two opposite directions and the information regarding their source is lost.
In Table 9 we show the mean values of aerosol optical properties at surface. Here, 6 events with dust in the SW sector and 9 events in the SE sector are evident. The mean values of SAE (0.4) and g (0.570), considering only the SW sector, are in agreement with several other works [64,76,77].
Analyzing the dust events from the SE sectors, the SAE and g values increase to confirm change in the shape and size of dust particles according to [69].

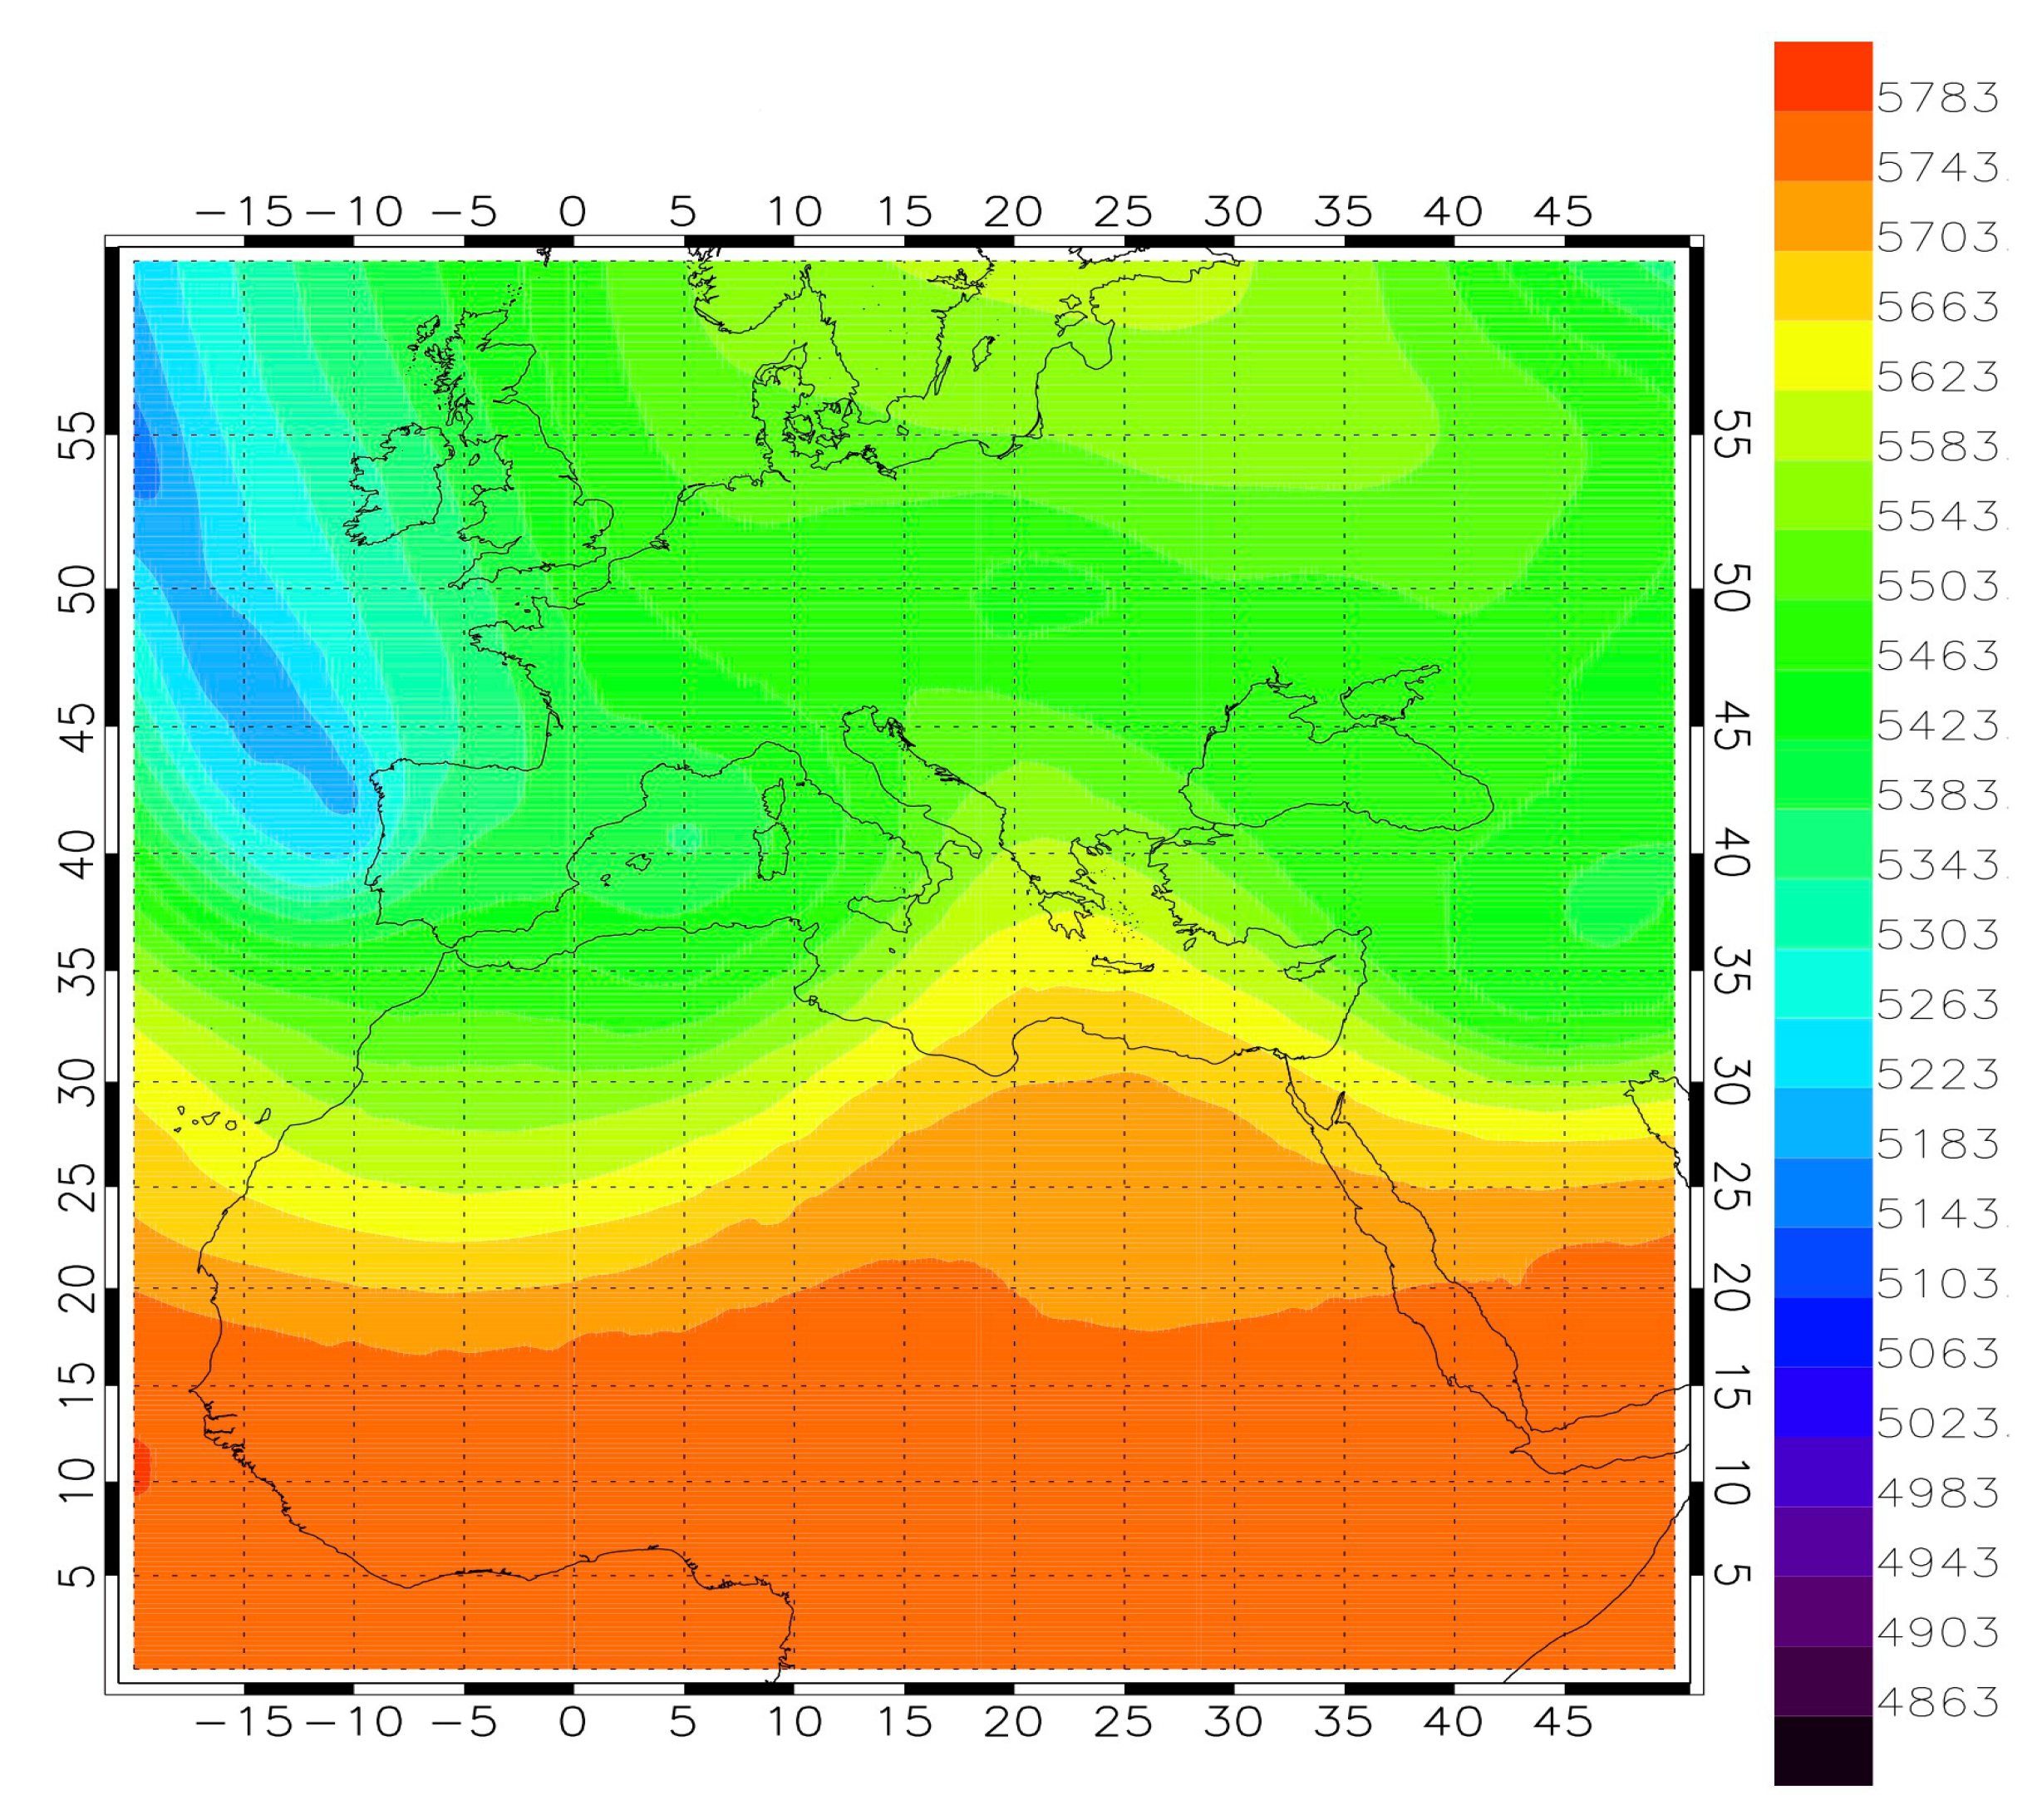
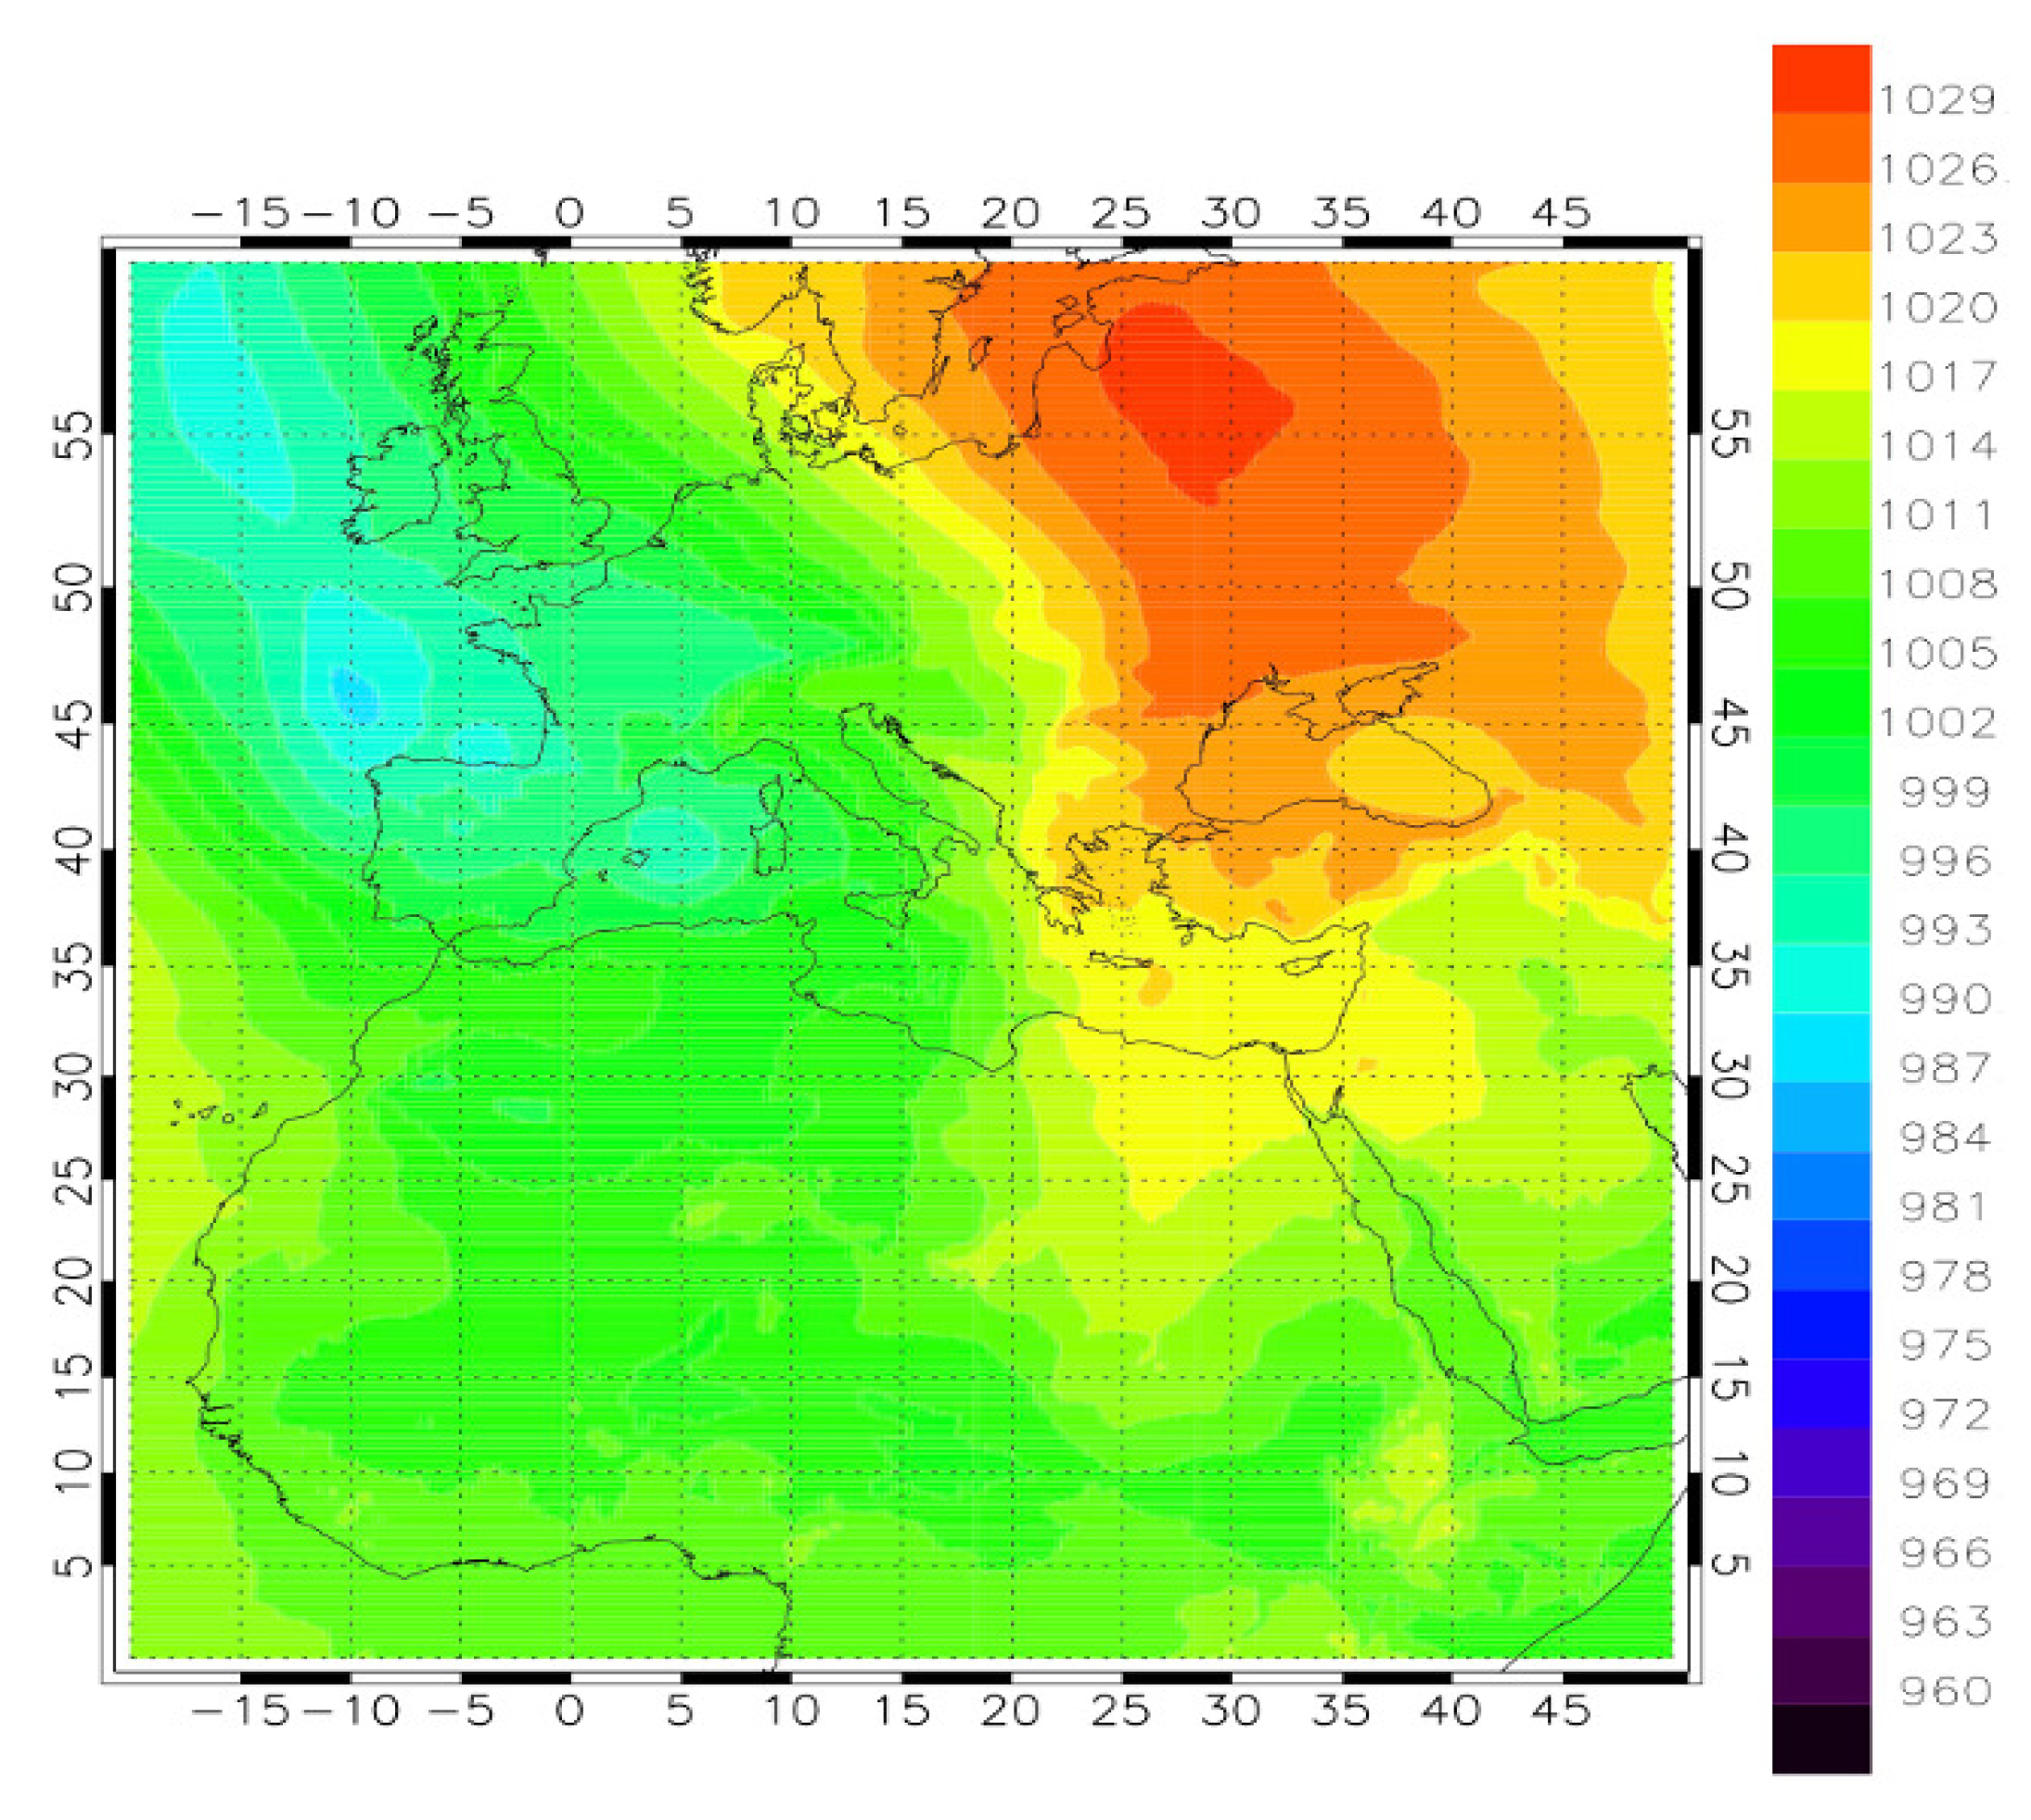
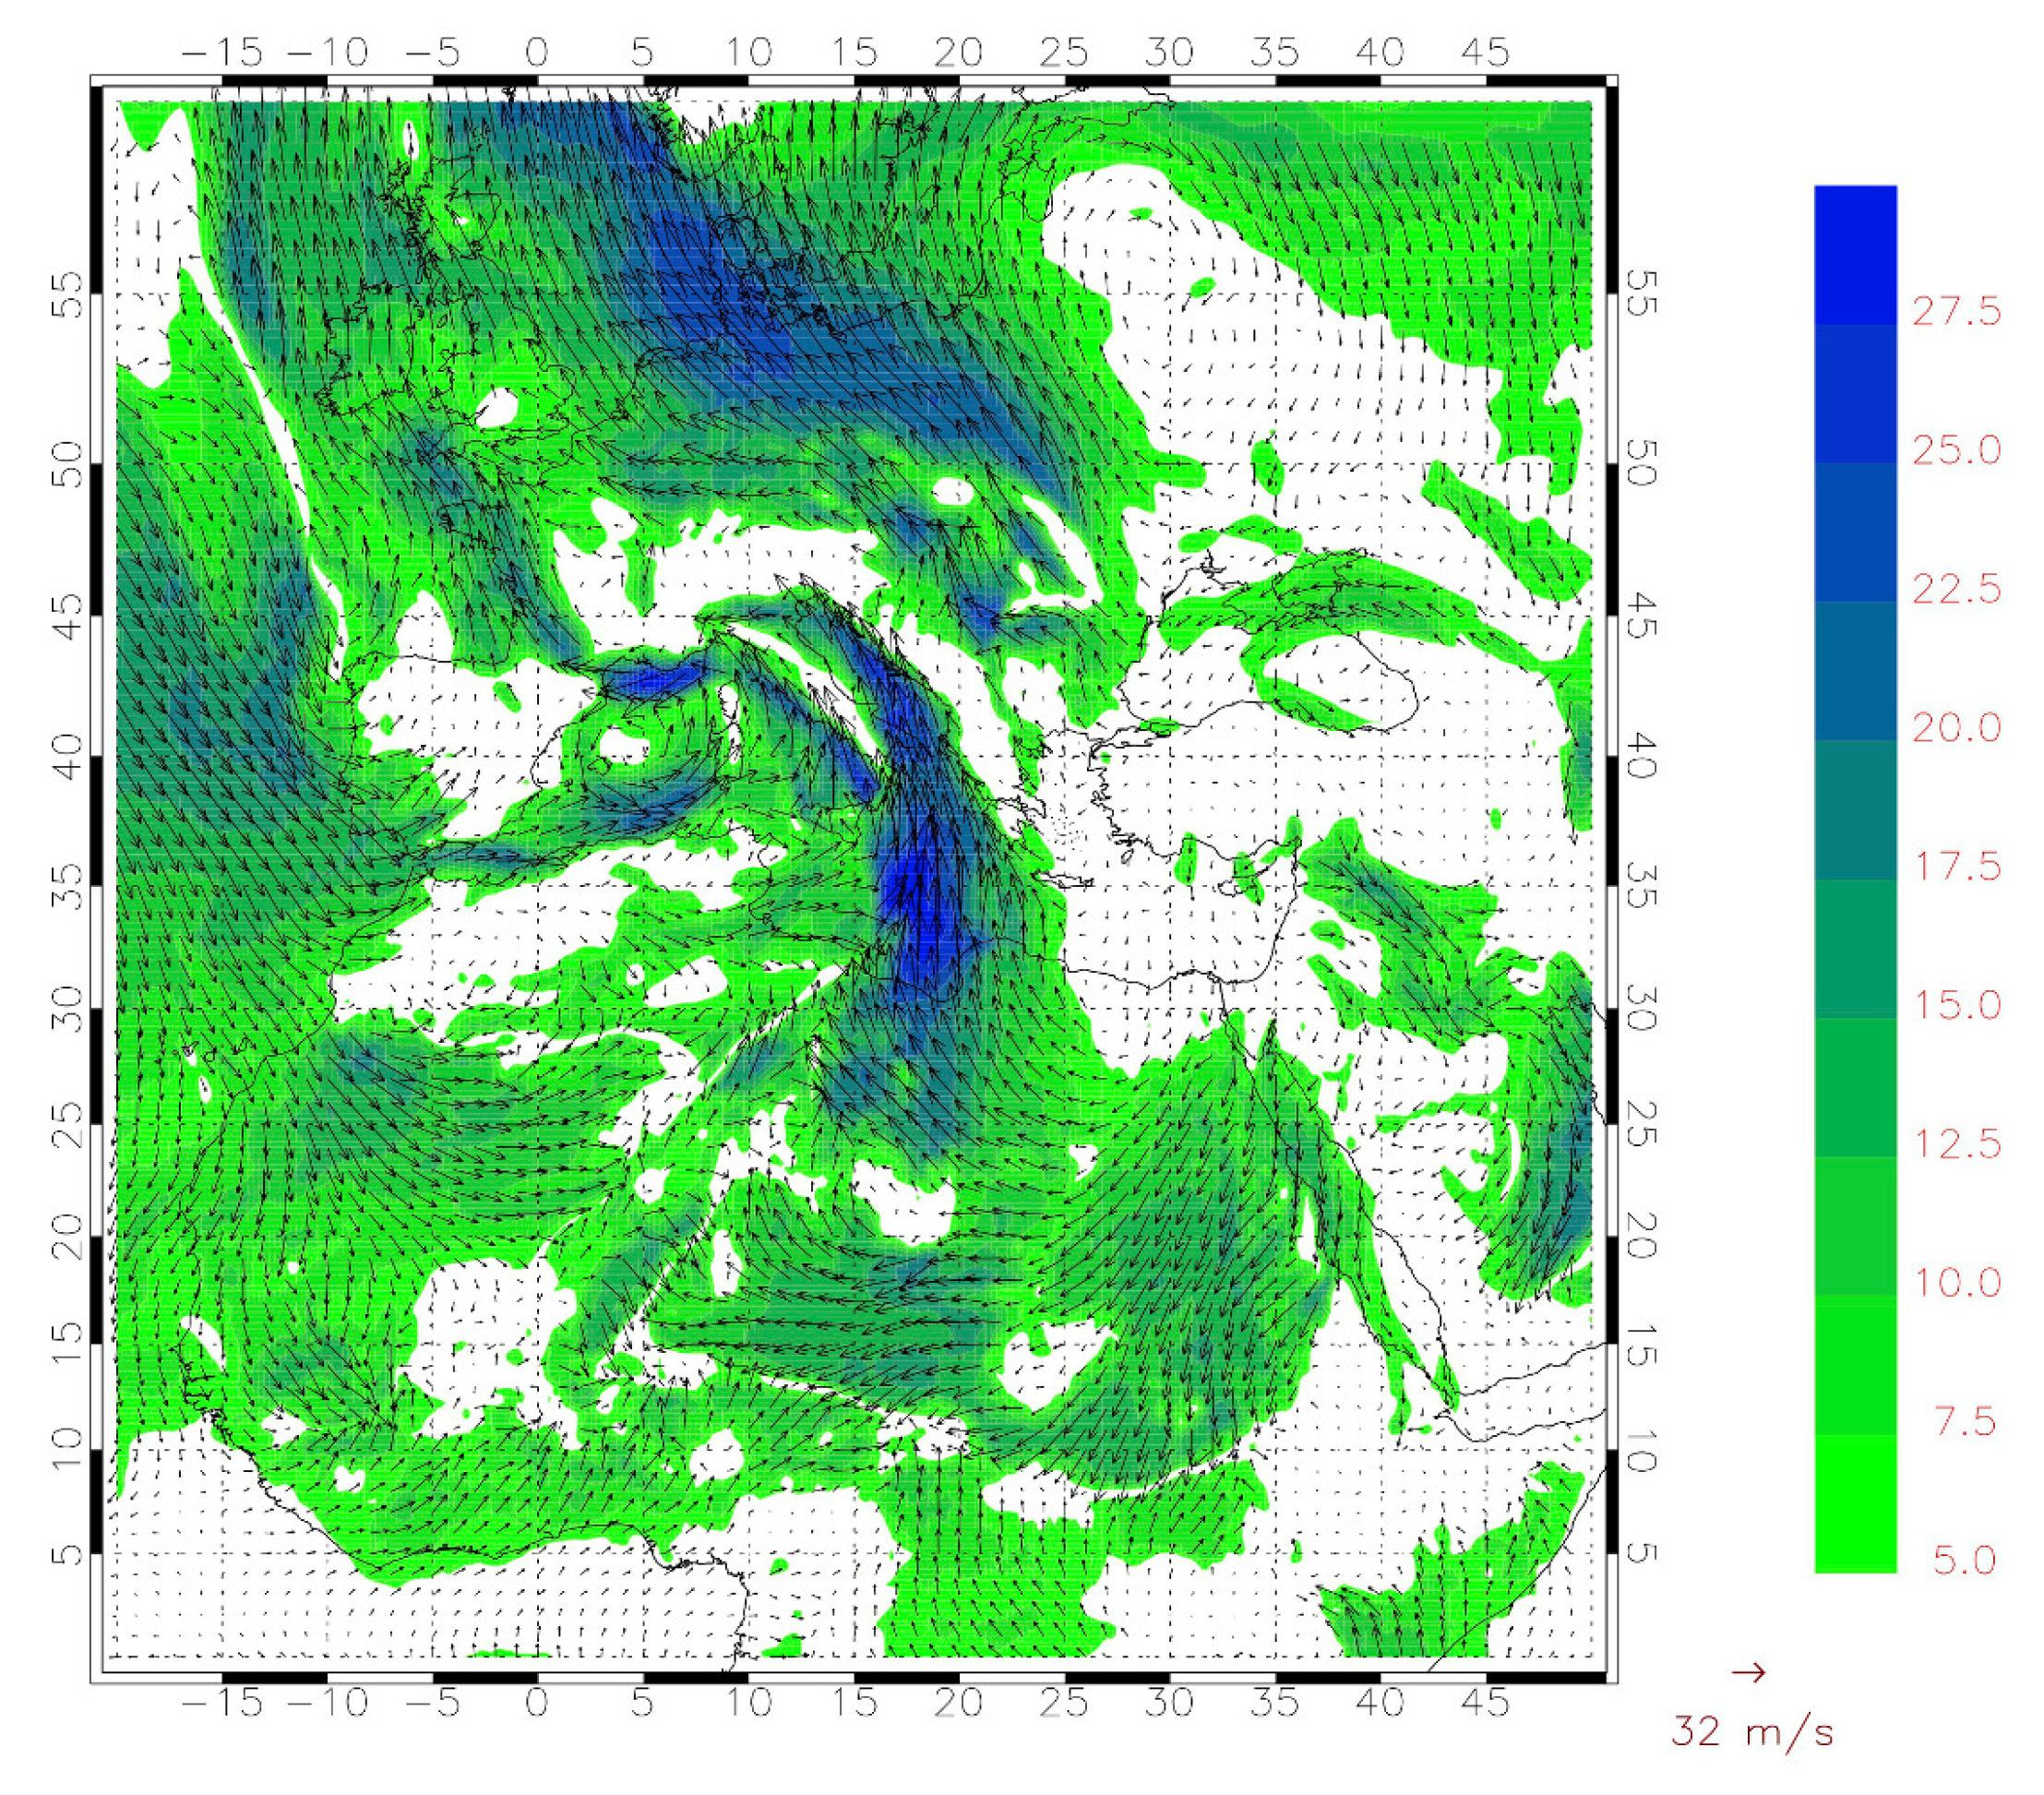
3.3. Large-Scale Atmospheric Patterns

A detailed analysis was carried out on the single identified event, producing and analyzing the upper-level and surface maps of the main atmospheric fields derived from the ERA5 reanalysis.
From an atmospheric point of view, wanting to analyze the synoptic forcing, we started considering 15 “dust events”. As previously seen, these cases led to multiple and contiguous daily and 3-day dust events. To confirm that the 15 “cases” are, really, representative of all the 52 days (over 5 years), all daily maps were subjectively analyzed (not shown for brevity). After this first check, we confirmed the validity of our methodology and the mean values of the large-scale patterns were calculated and analyzed for the 15 “dust events”.
We associated each of the 15 “dust events” with the large-scale ERA5 fields at 00 UTC on the first day of the considered period (see Table 2 for the dates). The analyzed parameters are geopotential height at 500 hPa (Z500), mean sea level pressure (MSLP), and U and V wind component ad 925 hPa (in order to calculate wind speed and direction at this level; WIND925). Once the single parameters were considered, we performed a spatial average for the all “dust events” (15 cases, 00 UTC; see Table 2 for the dates considered for the average), over a sufficiently large domain (see Figure 2, Figure 3 and Figure 4) that can be considered representative of dust phenomena in southern Italy.
After this first check, we confirmed the validity of our methodology and the mean values of the large-scale patterns were calculated and analyzed for the 15 “dust events”; to do this, we performed a spatial average of the atmospheric parameters for all cases (fields at 00 UTC; see tab 2 for the dates considered for the average), over a sufficiently large domain (–20W 50E 0N 60N) that can be considered representative of dust phenomena in southern Italy.
In Figure 2, Figure 3 and Figure 4 we show the averaged Z500, MSLP, and WIND925 (speed and direction), respectively.
The averaged geopotential height at 500 hPa is shown in Figure 2. The domain appears sharply divided into two distinct parts, with opposite baric values. The demarcation is denoted by the zone of latitude between 20° and 35°. Only in this area are the contour lines are relatively dense, demonstrating the occurrence of intense upper-level winds. Elsewhere, upper-level leveled pressure fields and consequent weak winds prevail.
Upper-level winds in southern Italy and, thus, over Calabria, are guided by a pronounced high-pressure ridge over Greece/southeastern Europe. Following this configuration, the currents come from the Sahara Desert area towards our site of interest (from south-west to north-east).
The averaged mean sea level pressure is shown in Figure 3. During the period taken into account, the mean transport pathway of the individuated African dust events towards southern Italy is mainly determined by a low-pressure system over the central Mediterranean Basin, which directly affects the Italian peninsula, and by two high-pressure systems over southeastern Europe (most importantly) and in the Atlantic. The surface circulation driven by these configurations facilitates the coming of southerly winds from North Africa toward southern Italy. In particular, the counter-clockwise circulation of winds around shows how the currents mostly flow from the main source of African dust, the Sahara Desert. At the same time, the high pressure over southeastern Europe facilitates the flowing of winds from north-eastern African regions.
An obvious condition for the existence of a dust source is the availability of fine-grained material, which can be lifted from the ground when the surface wind speed exceeds a certain threshold. In the literature it is found to vary from about 6 to 9 m/s; (e.g., [78]). In our case, the winds reached values higher than this threshold (Figure 4), further confirming that these were clear dust events.
The averaged wind field at 925 hPa (Figure 4), which is directly connected to the dust emission and transport, reveals an important occurrence for our study cases and a specific peculiarity of the dust events in southern Italy. The currents follow, on average, two different (but confluent) prevalent directions. The first one is the prevalent mechanism responsible for the detected (at Lamezia Terme site) Saharan dust events, with currents directed from SW to NE. Another important contribution is represented by currents directed from south-east to north/north-west towards the Lamezia Terme site. These individuated pathways are in clear agreement with the mean sea level pressure fields shown in Figure 3. It is interesting to note the merging of these two pathways in the southern Mediterranean, and the subsequent flow together in southern Italy. This, considering the averaged values, makes the dust coming from the Sahara Desert indistinguishable from the dust coming from north-eastern African regions.
The desert dust events individuated in this work are mainly characterized by the synoptic patterns described above. Following these forcings, dust plumes were transported northward, resulting in intense dust events over the Mediterranean and Southern Italy.
Analyzing air mass circulation, it arises that most of the dust transported to our site, during the hot season, is associated with wind fields from the south-east direction, while in the cold season the prevalence of dust intrusions occurs in S-W air masses incursion. To confirm our results, we identified all the events according to which the wind fields at 925 h P a flows exclusively from the south-west sector. In such a case, Saharan contribution we observe at LMT is evident, and, when the wind flows from the SE sector mixing particle occurrence is more evident.

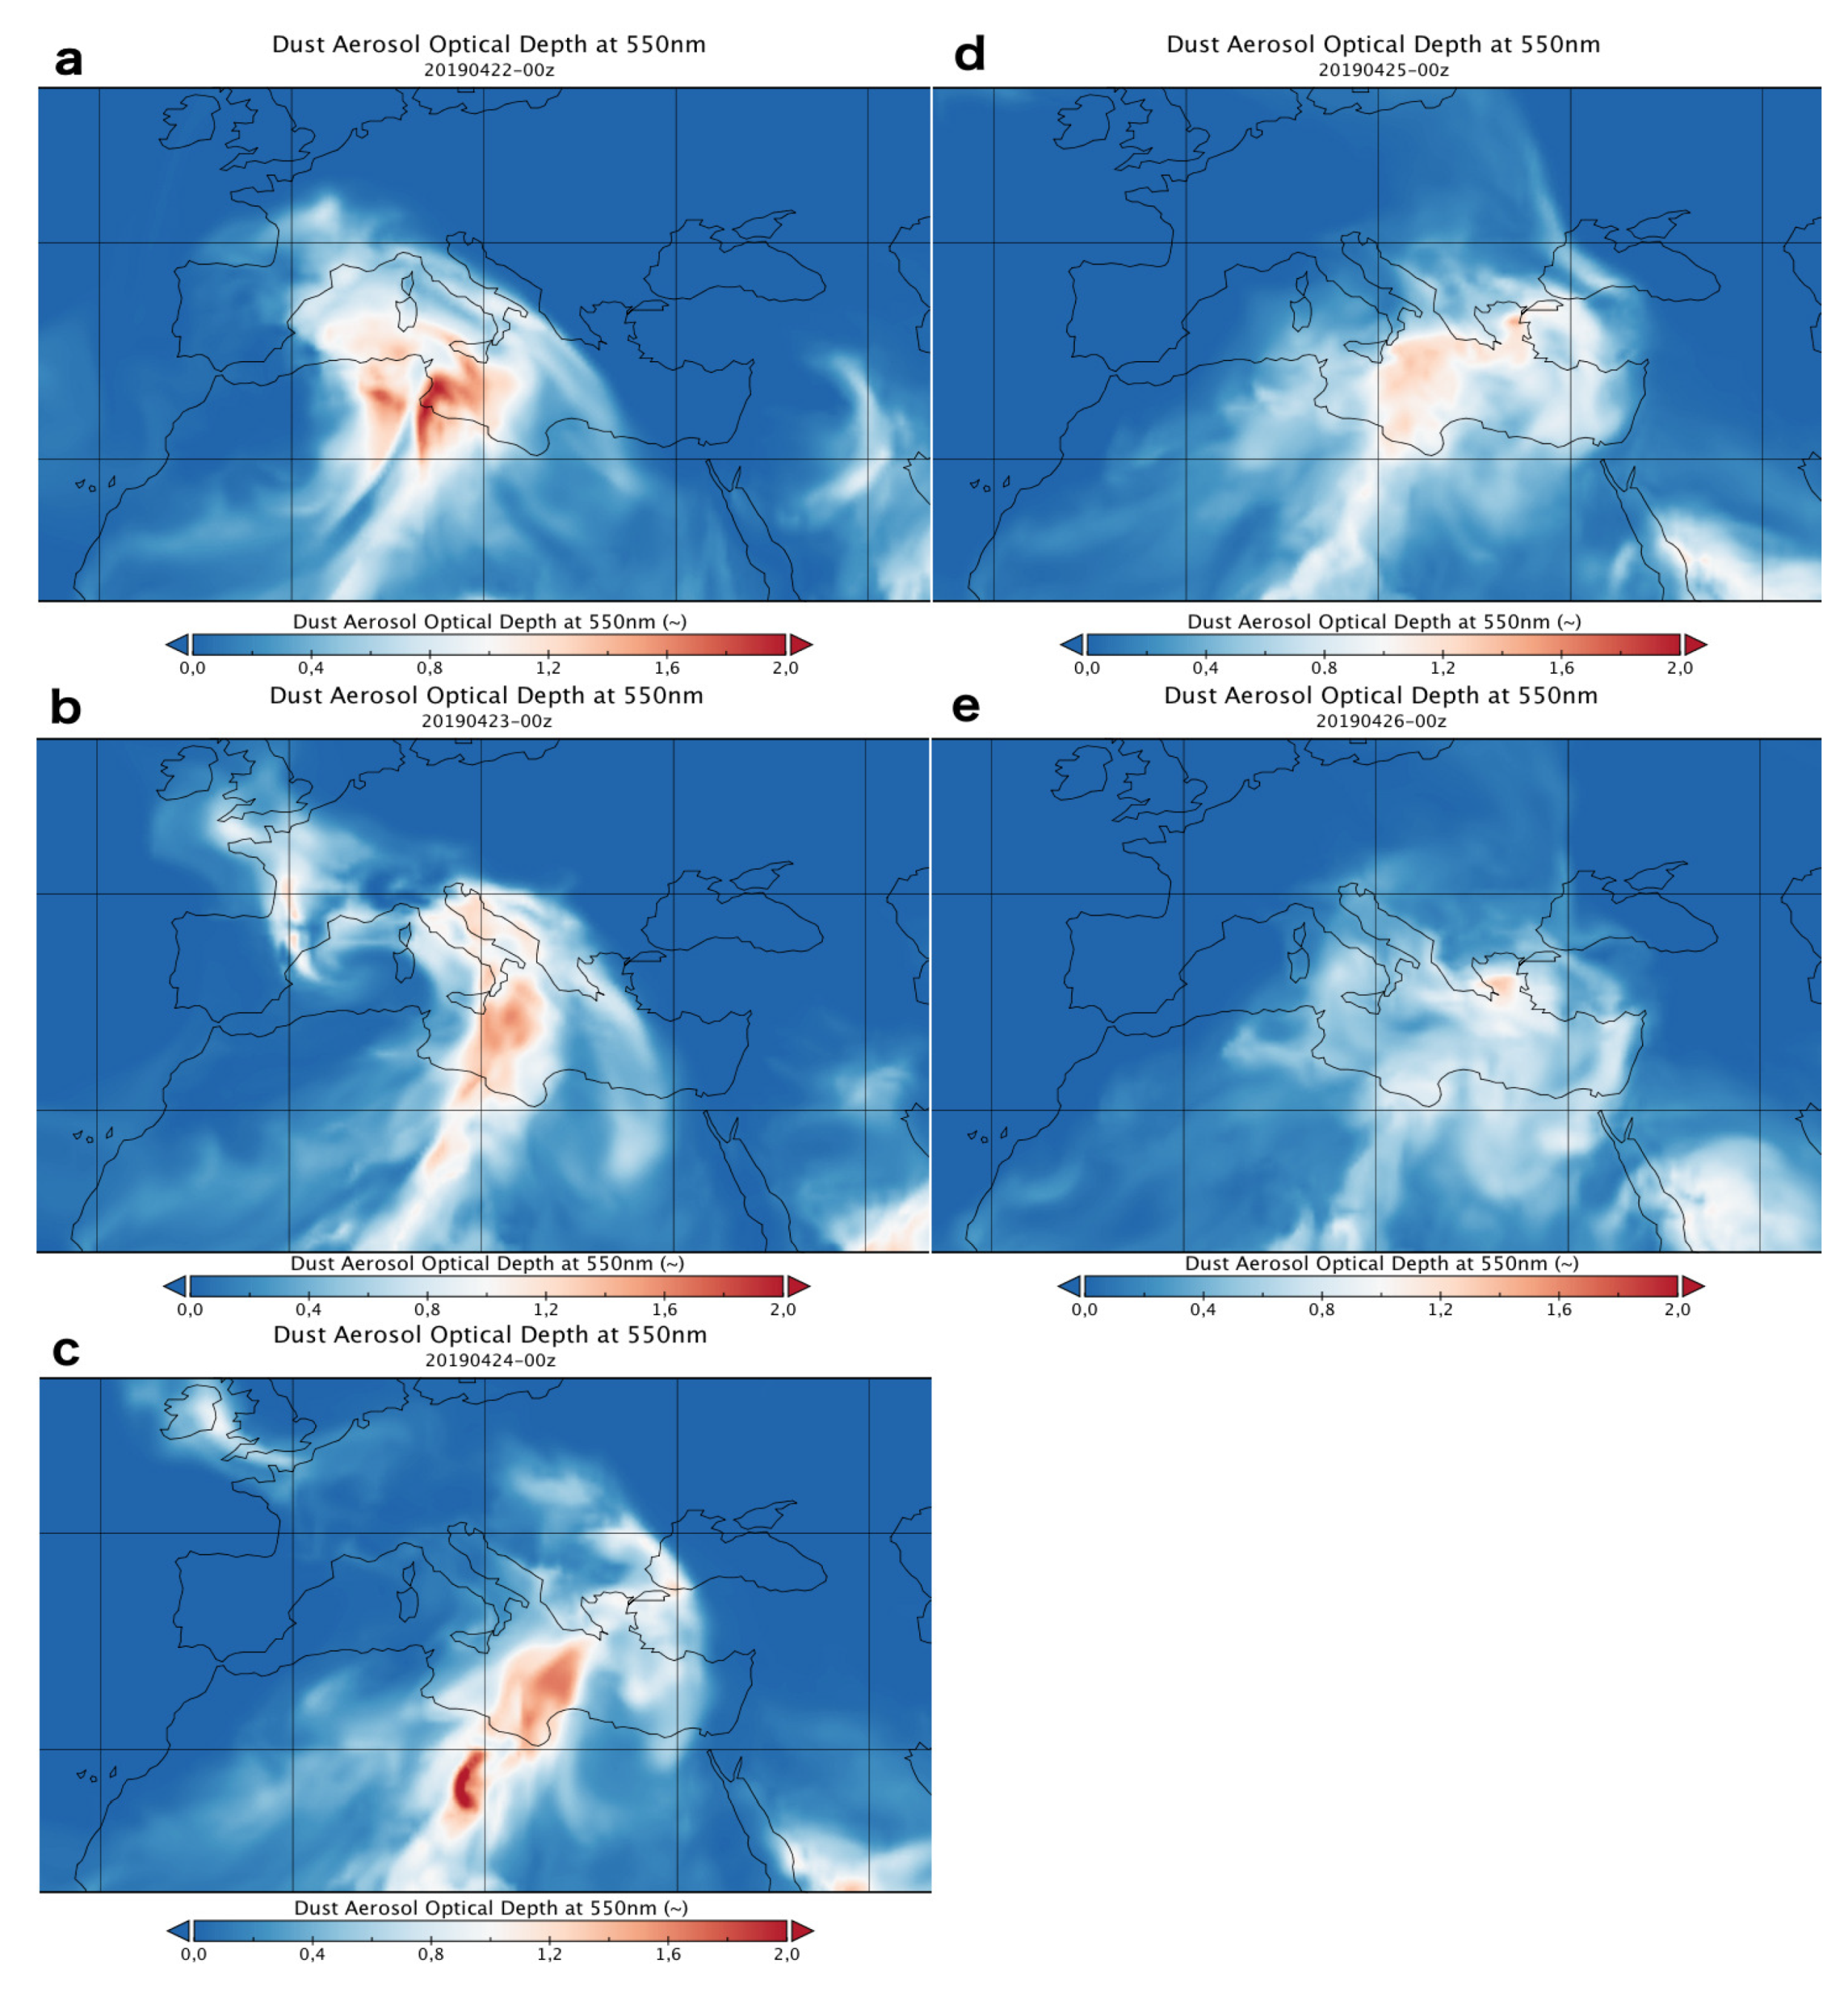
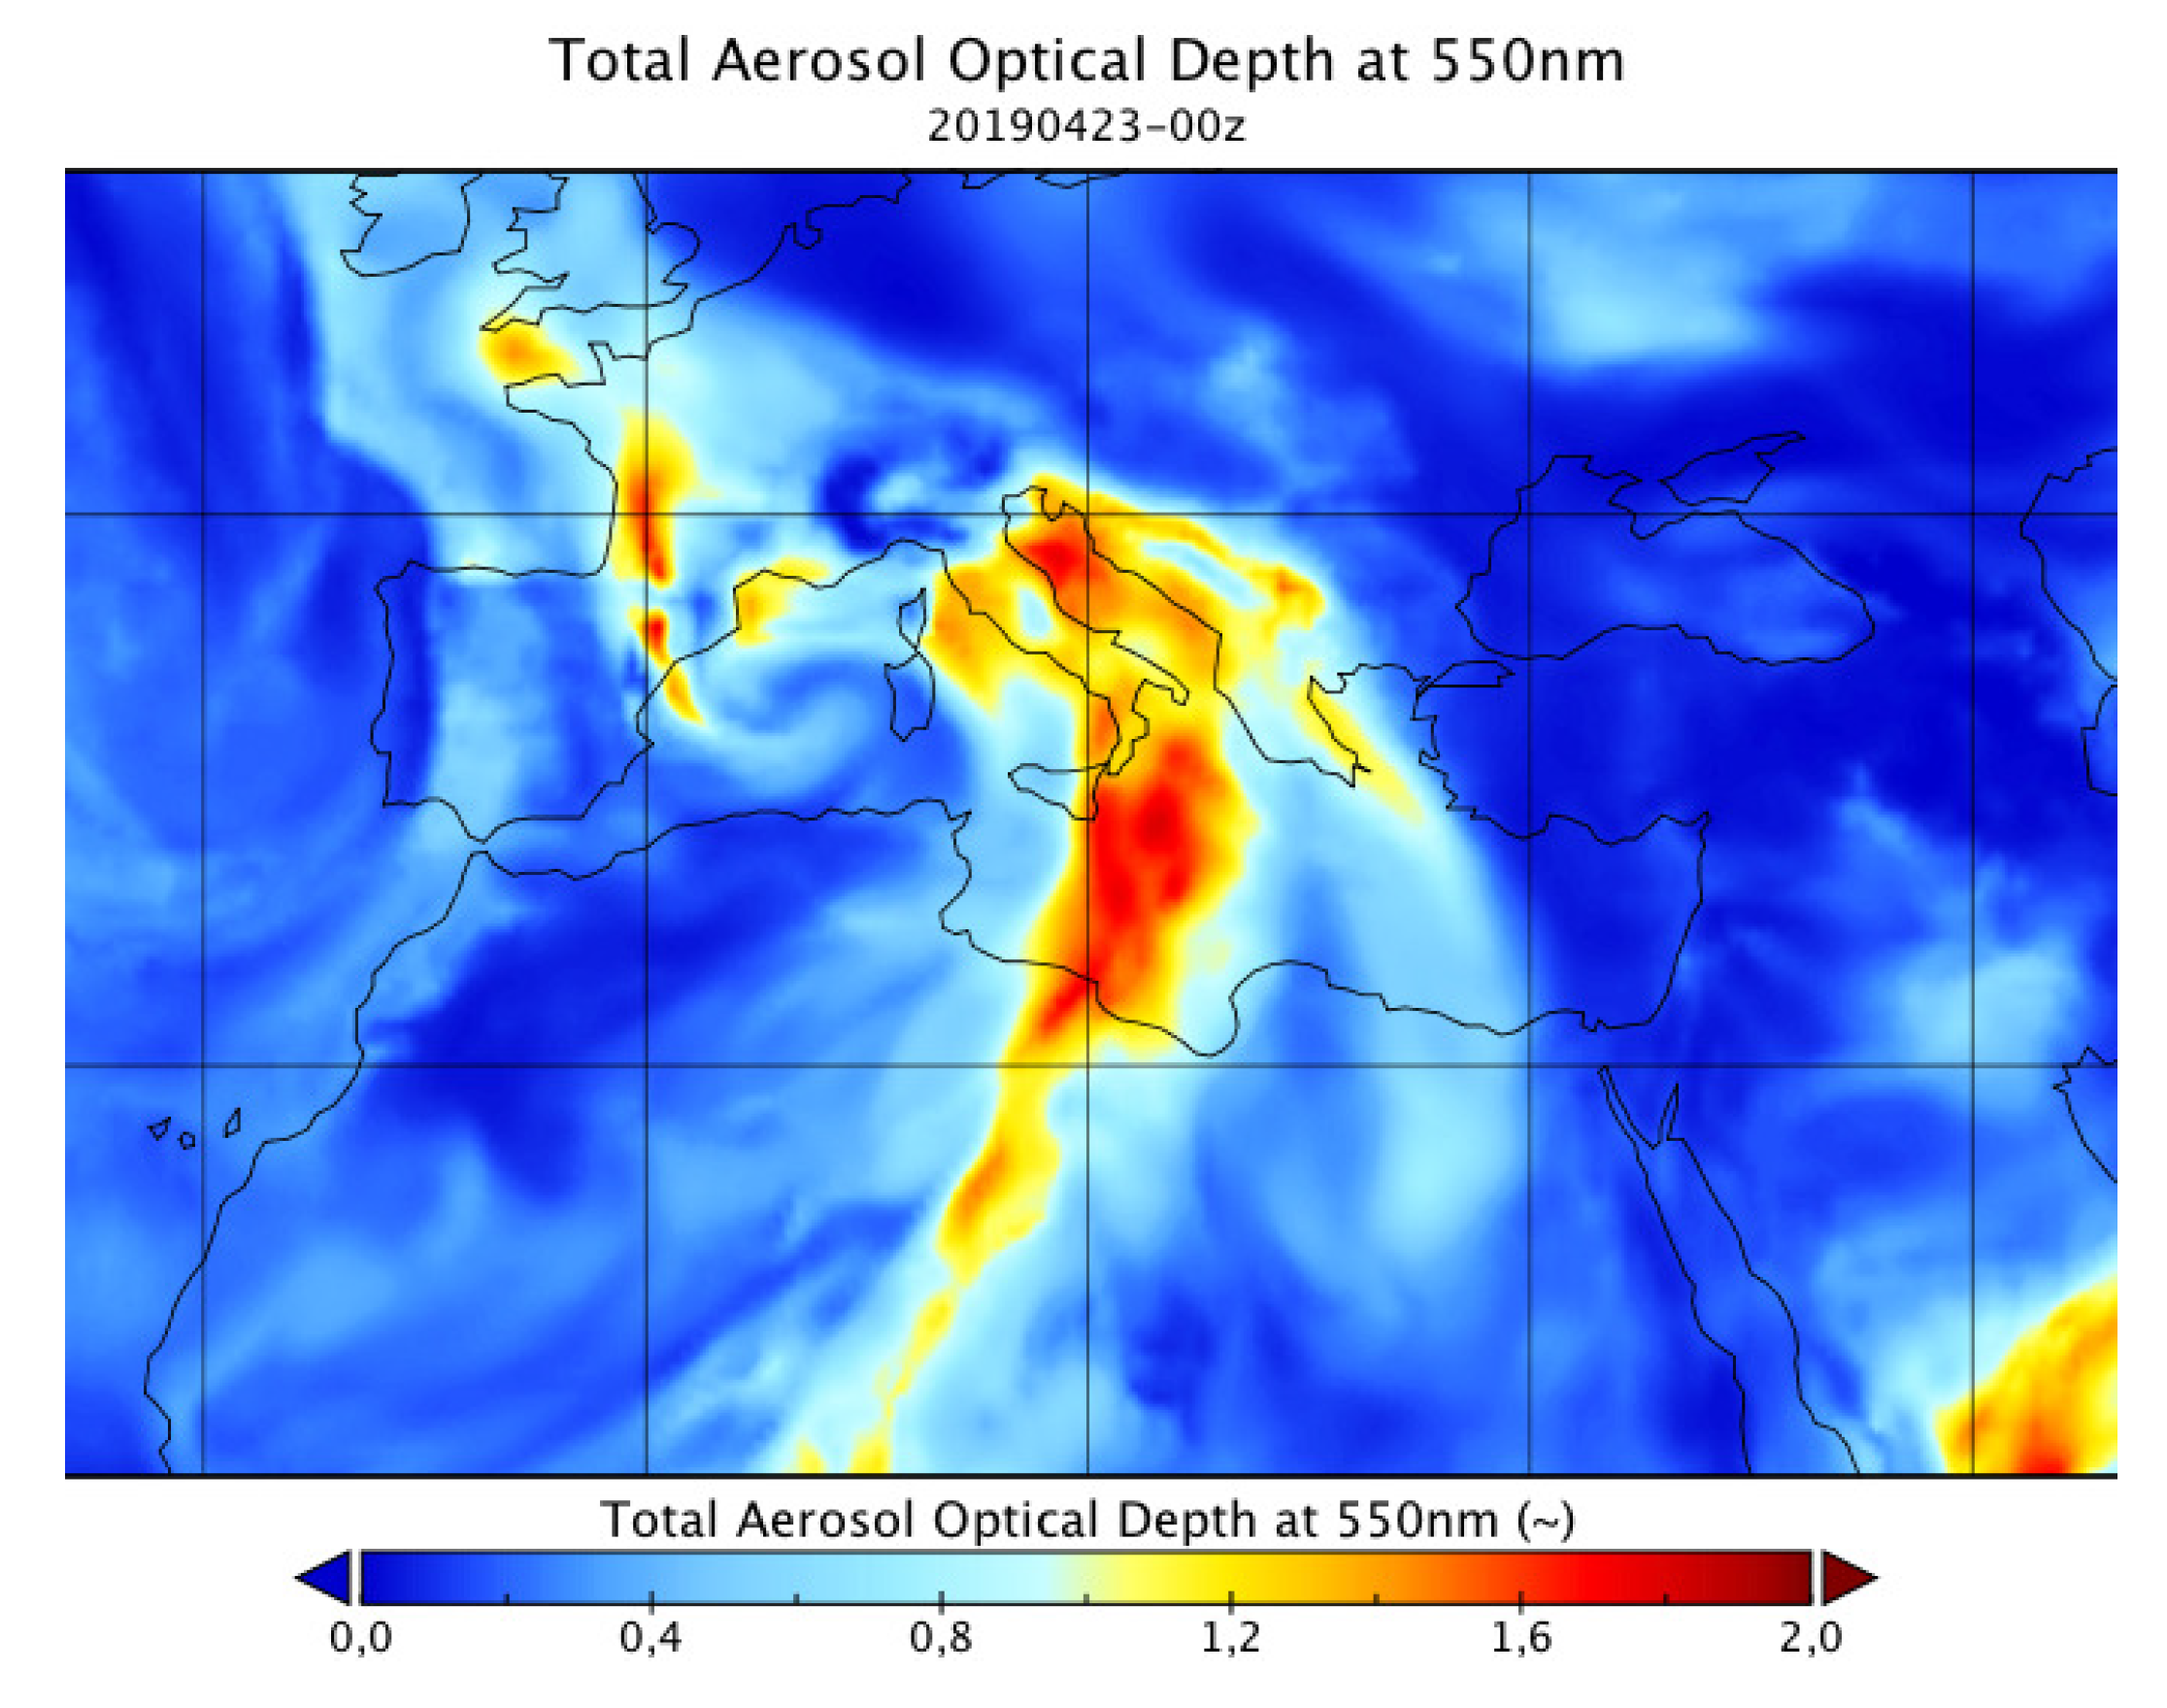
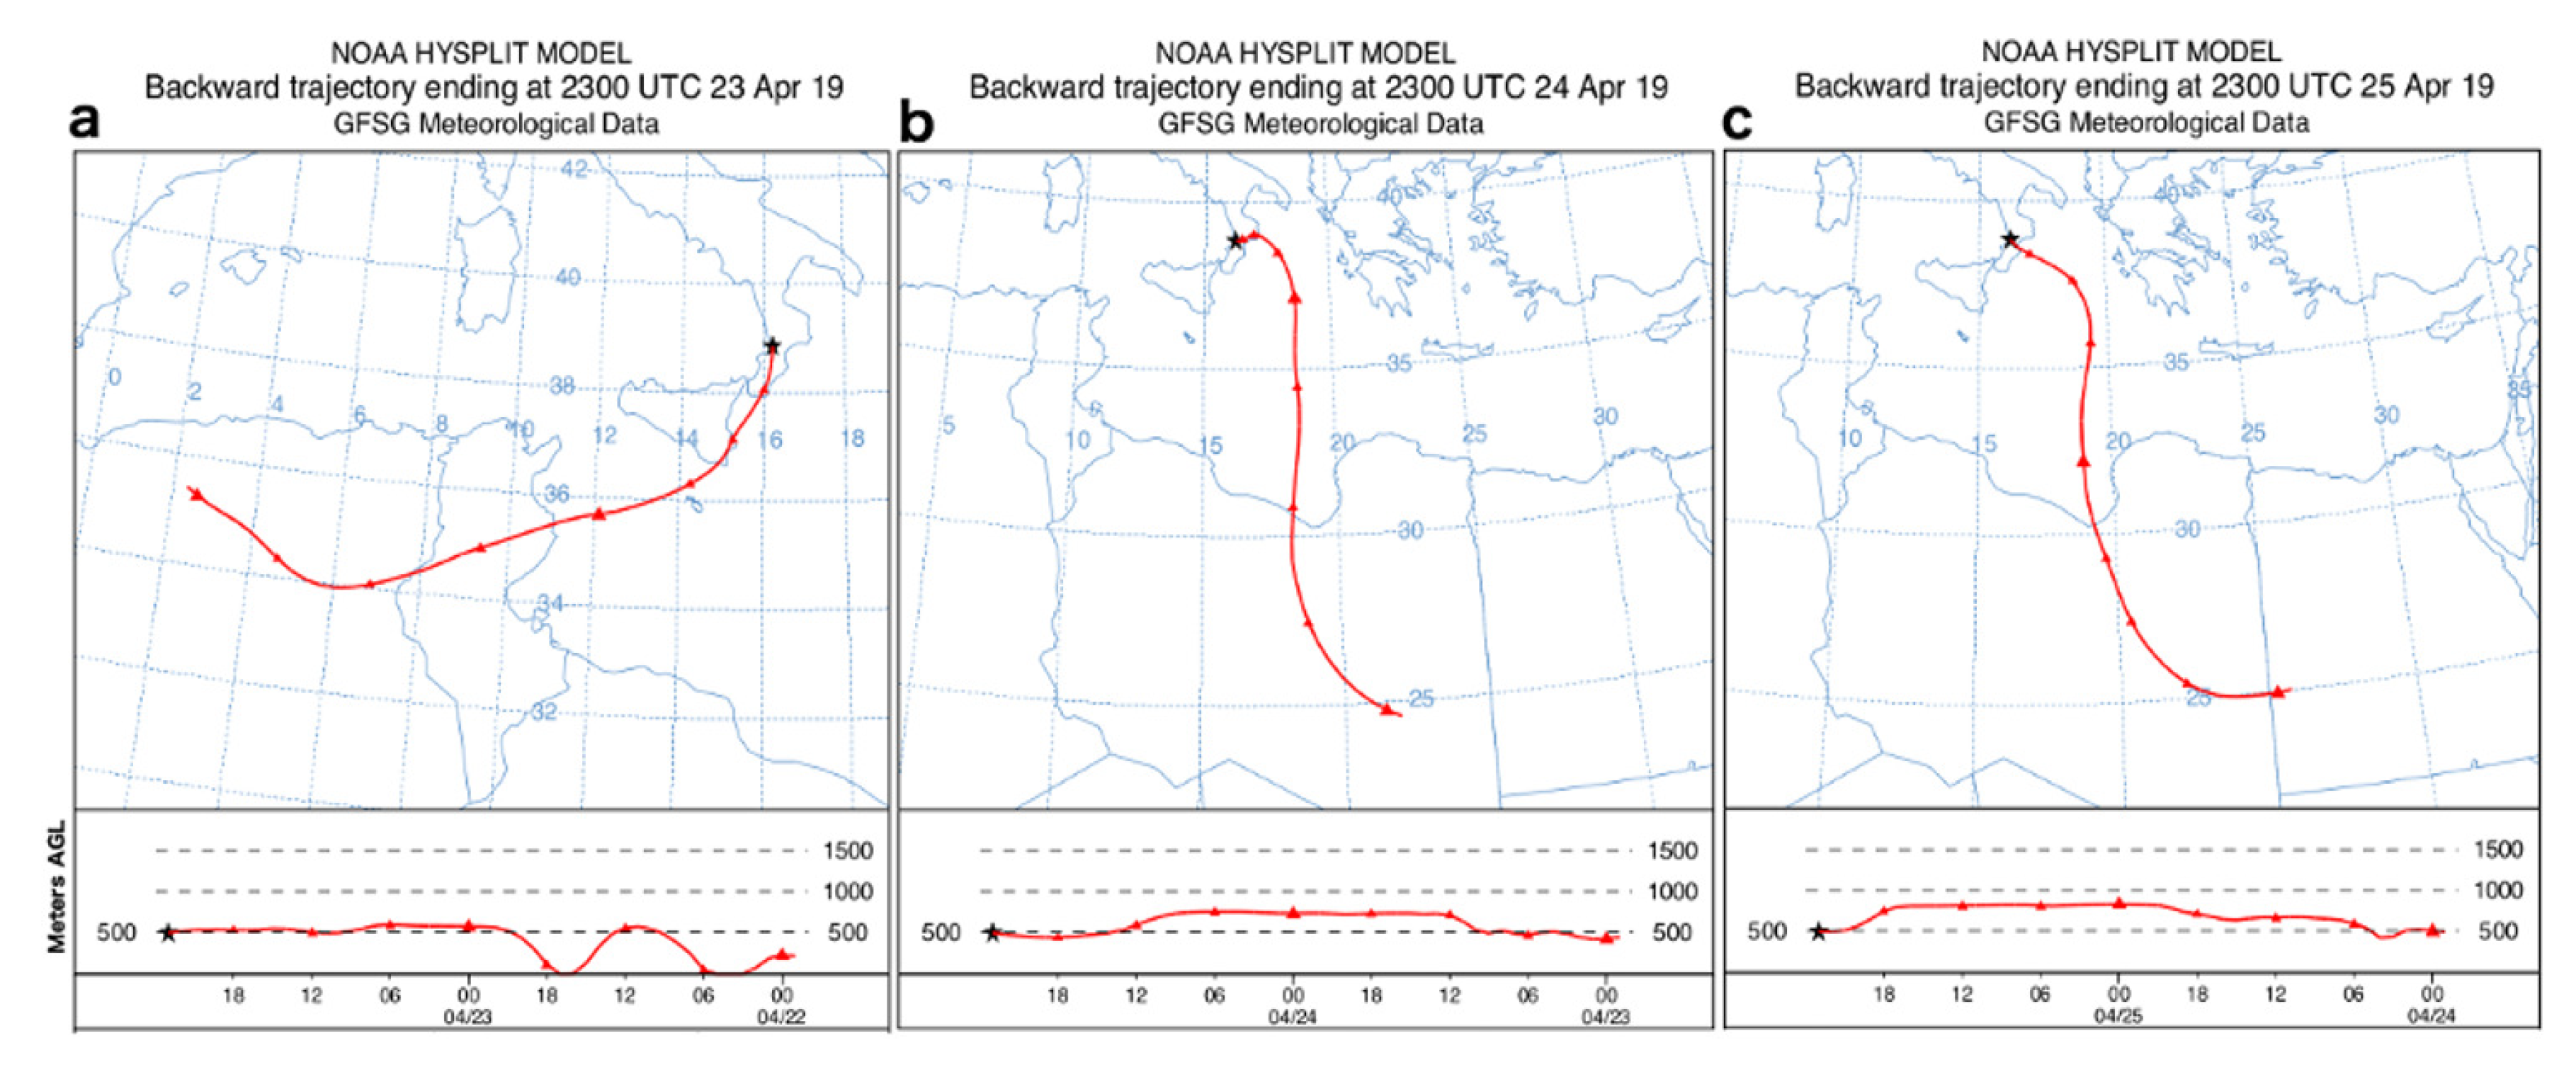
4. Case Study: The Dust Outbreak 23–27 April 2019

In this section, we present a selected dust-outbreak case that is the most significant that occurred at LMT. The case selection and the related methodology was presented in Section 2.3. Here we show results of a detailed analysis in which all described instruments were operating simultaneously and filtered SEM analysis was available for one of the most high values of PM 10 registered at the site. Model and satellite output and images were also available for the period.

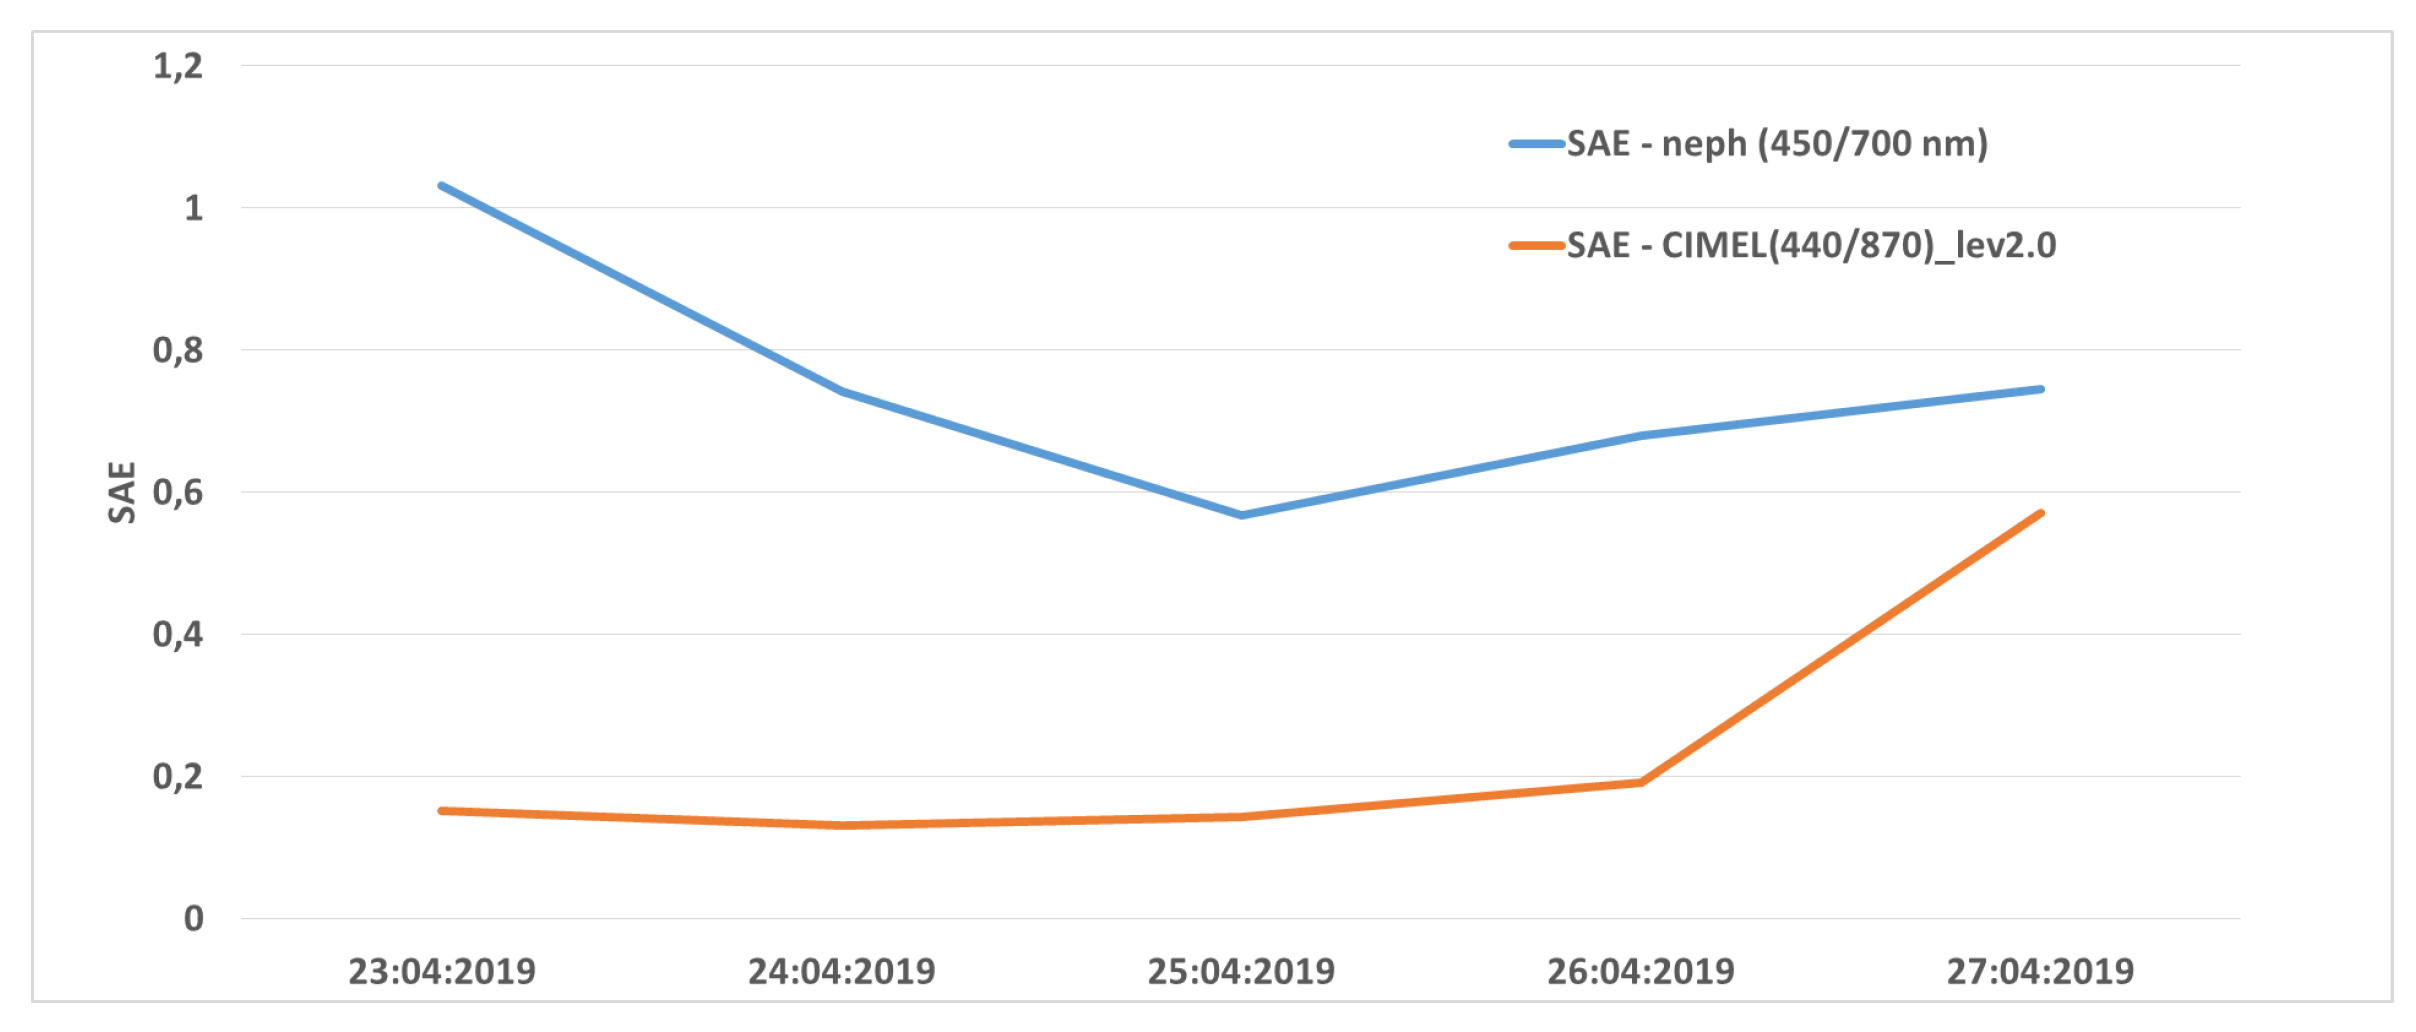
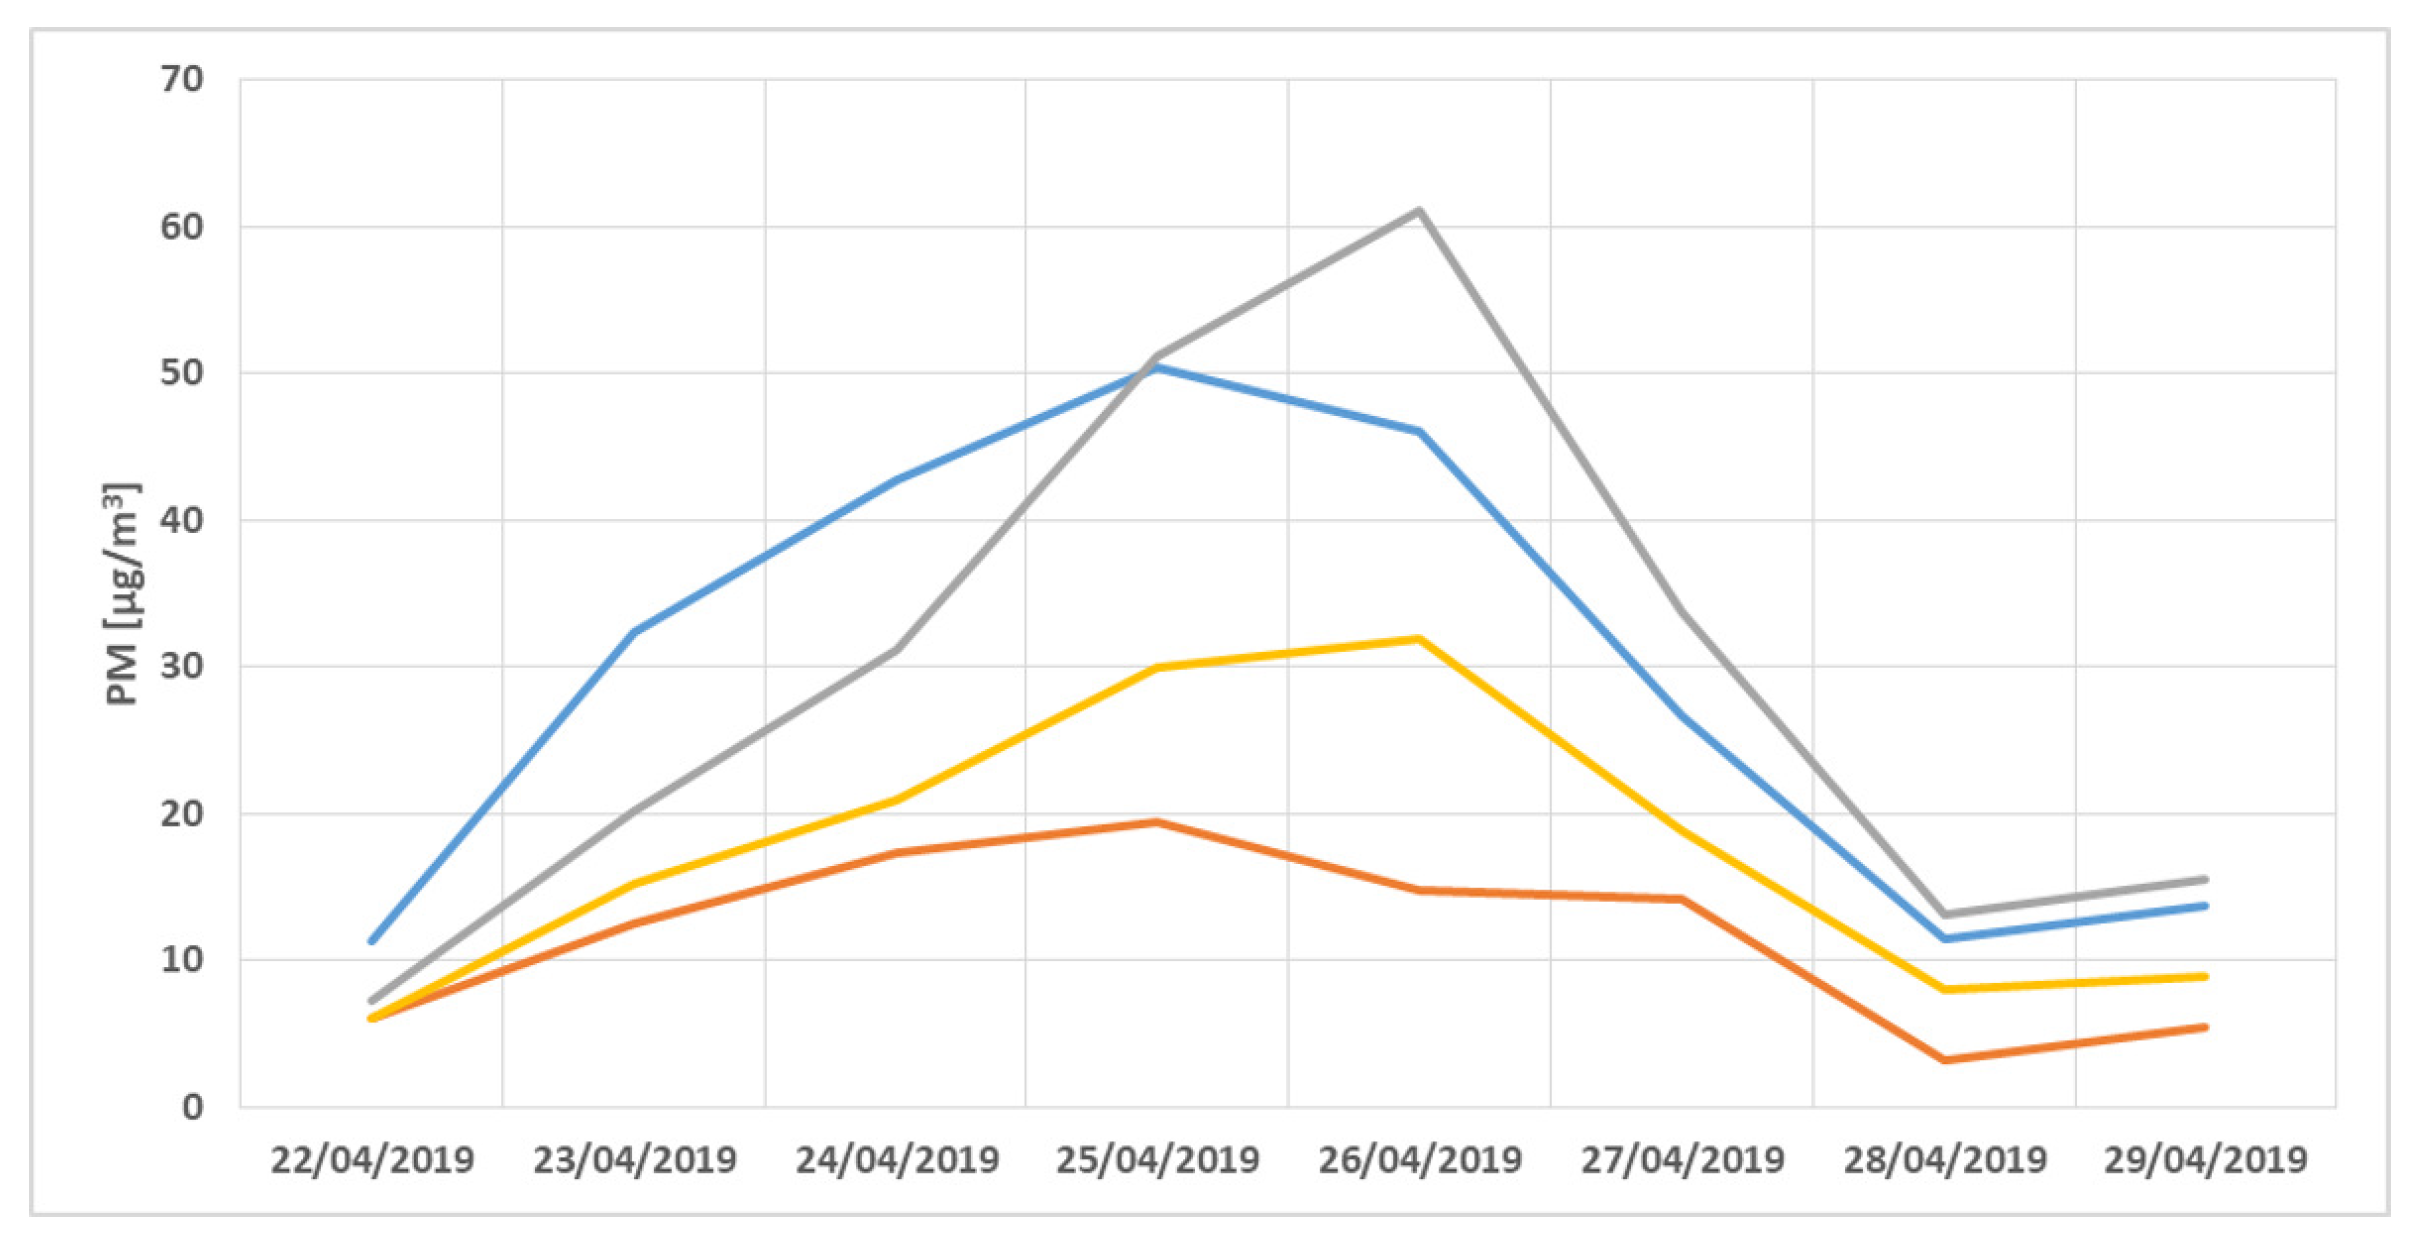
4.1. Derived Intensive Parameters

In addition to the direct measurements in situ, already analyzed, during the selected case studied we calculated their intensive aerosol parameters and we used sun photometer data, in particular SAE values available from the AERONET site. For the nephelometer measurements, SAE is calculated using Equation (3). Similarly, for column-integrated measurements, we used SAE in the spectral range 440–870 nm.
During intense dust outbreaks, a reduction of SAE 450 , 700 and a simultaneous increasing of PM coarse fraction is evident; this depends on the degree of local pollution and intensity of the dust event [79].
Figure 5 depicts the temporal evolution of the mean daily values of intensive aerosol optical properties both at surface level and column-integrated. SAE 450 , 700 in situ surface from nephelometer measurements, started decreasing on 23 April and reached the minimum values on 25 April, then, increased on 26 to 27 April. Looking at sunphotomether measurements, SAE 440 , 870 mean daily values was stable from 23 to 25 April and increased during 26 and 27 April.
We observed a delay from the column-integrated values obtained from the sunphotometer with respect to in situ surface SAE 450 , 700 values measured from nephelometer. This delay corresponds to the permanence at the surface of a dust plume over LMT station; in fact, on 26 and 27 April, we still observed high daily mean concentration of PM 10 with values 46.1 μ g/m 3 (from SWAM instruments) and 26.6 μ g/m 3 respectively, as shown in Figure 6.
Both used methodologies (in situ and sunphotometer) calculate values close to 0.5 (even close to zero for columnar measures) and this is an indication of coarse particle predominance. The difference between columnar and in situ SAE measurements, during the dust event, suggests a stronger predominance of coarse particles in the atmospheric column (SAE 440 , 870 close to 0) [47] than on the ground (SAE 450 , 700 < 0.7) due to the influence of continental particles mixed with dust, as analyzed later with SEM in Figure 7.
To determine the starting, ending, and peak times for PM 10 concentration levels, we analyzed the temporal behavior of the PM 10 values derived from daily mean OPC and SWAM instruments at LMT. On 25th and 26th April 2019, the highest daily PM 10 values were recorded at LMT station (Figure 6).
During these days SWAM measured one of the most relevant concentrations, as depicted in Figure 6, with respect to the mean PM 10 values during the five years. The statistics is shown in Table 10.
Also, the maximum value of eBC concentration mass in this period is 0.05 μ g/m 3 , which excludes a possible contribution of eBC due to a biomass burning. When compared with measurements from the previous day, daily mean PM 10 values turned from 7.71 μ g/m 3 to maximum peaks values during 25 and 26 on April (50.4 μ g/m 3 ). This variation, according to the behavior of SAE 450 , 700 coefficients, shows a minimum peak around 25 April. The highest values of SAE 450 , 700 (>0.65) during the days of the intrusion of dust show an important component of fine particles due to the mixing aerosols that we measured at surface (Figure 6). In Figure 6 the OPC fine and coarse contribution whose peaks correspond respectively to 31.97 μ g/m 3 and 61.15 g/m 3 is depicted. However, the dust contribution at the surface aerosol sites is remarkable.
The comparison between the observed parameters mainly conductive of dust events collected at the Lamezia Terme experimental site, with different types of model outputs, were confirmed by other analysis of a sample collected on filters. This allows an investigation of the model’s ability to reproduce both the horizontal and the vertical displacement of the dust plume, as well as its evolution in time, taking into account the large-scale atmospheric forcing in driving the dust event. Regarding the sampled filters the ratio Al/Si, for three selected dust episodes (see Table 11), was higher than 0.3 and this condition is always indicative of a desert origin of the particles [80]. In the literature, common mineralogical markers are often used to identify the origin of particulates. The prevalence of Si and Al, during the in-dust days, ascribes a prevailing Saharan origin to the particles [81]. Moreover, elevated values of the Al/Si ratio was used to discriminate the aerosol origins [82,83]. Regarding sampled filters for the Al/Si ratio, for three selected dust episodes (see Table 11), the result were higher than 0.3 and this condition is always indicative of a desert origin of the particles [80].
SEM-EDX analysis on selected samples reveals the presence of Si, Al, Mg, K, Ca and Fe elements. Significant amounts of Na and Cl elements were also detected in the two filters sampled in the spring season for the following two events: (14–17 April 17) and (25 April 19), where the presence of NaCl salt crystals reveals the contribution of marine sea spray due to local circulations (see Figure 8). The SEM-EDX spectra of the single dust particles shows a mixed elemental composition, not homogeneous and spherical shape as in Figure 7 in agreement with the studies by [84,85,86], in which dust particles transported from arid regions are often aggregated.

4.2. Synoptic Features

In Figure 9, Figure 10 and Figure 11 we show Z500, MSLP, and WIND925 (speed and direction), at the 00 UTC on 23 April 2019.
From a meteorological point of view this day, and the selected time, are indicative of the start of the dust event.
The geopotential height map at 500 hPa (Figure 9) shows a strong similarity with the averaged field mentioned above (Figure 10 and Figure 11); this confirms that the event is representative of the all dust events recorded at the experimental site.
A pronounced high-pressure ridge over the Aegean drives the upper-level currents to flow from the Sahara Desert area towards southern Italy. At the surface, the mean sea level pressure (Figure 10) slightly differs from the average, but the main patterns are confirmed. In this case, the low-pressure area on the Mediterranean (gulf of Genoa) is less deep than the average (see Figure 10), while a wide area of high pressure is very pronounced over Eastern Europe. The trajectory of the surface winds, as confirmed by the denser isobars along the western side of the high, is more shifted to east with respect to the averaged fields, and the associated wind speeds are more intense. This fact is confirmed by the wind field map (Figure 11), at 925 hPa that shows the existence of moderate-to-high winds that flow across a pathway oriented from south to north, with values up to 25 m/s. Despite the orientation of the pathway, we can see that in northern Africa there are two different pathways coming, respectively, from the Sahara Desert and from northwestern regions; also, in this case the merging of these two pathways in the Ionian Sea and the consequent flow together in southern Italy is apparent, although the trajectory is slightly shifted to the east with respect to the average fields.

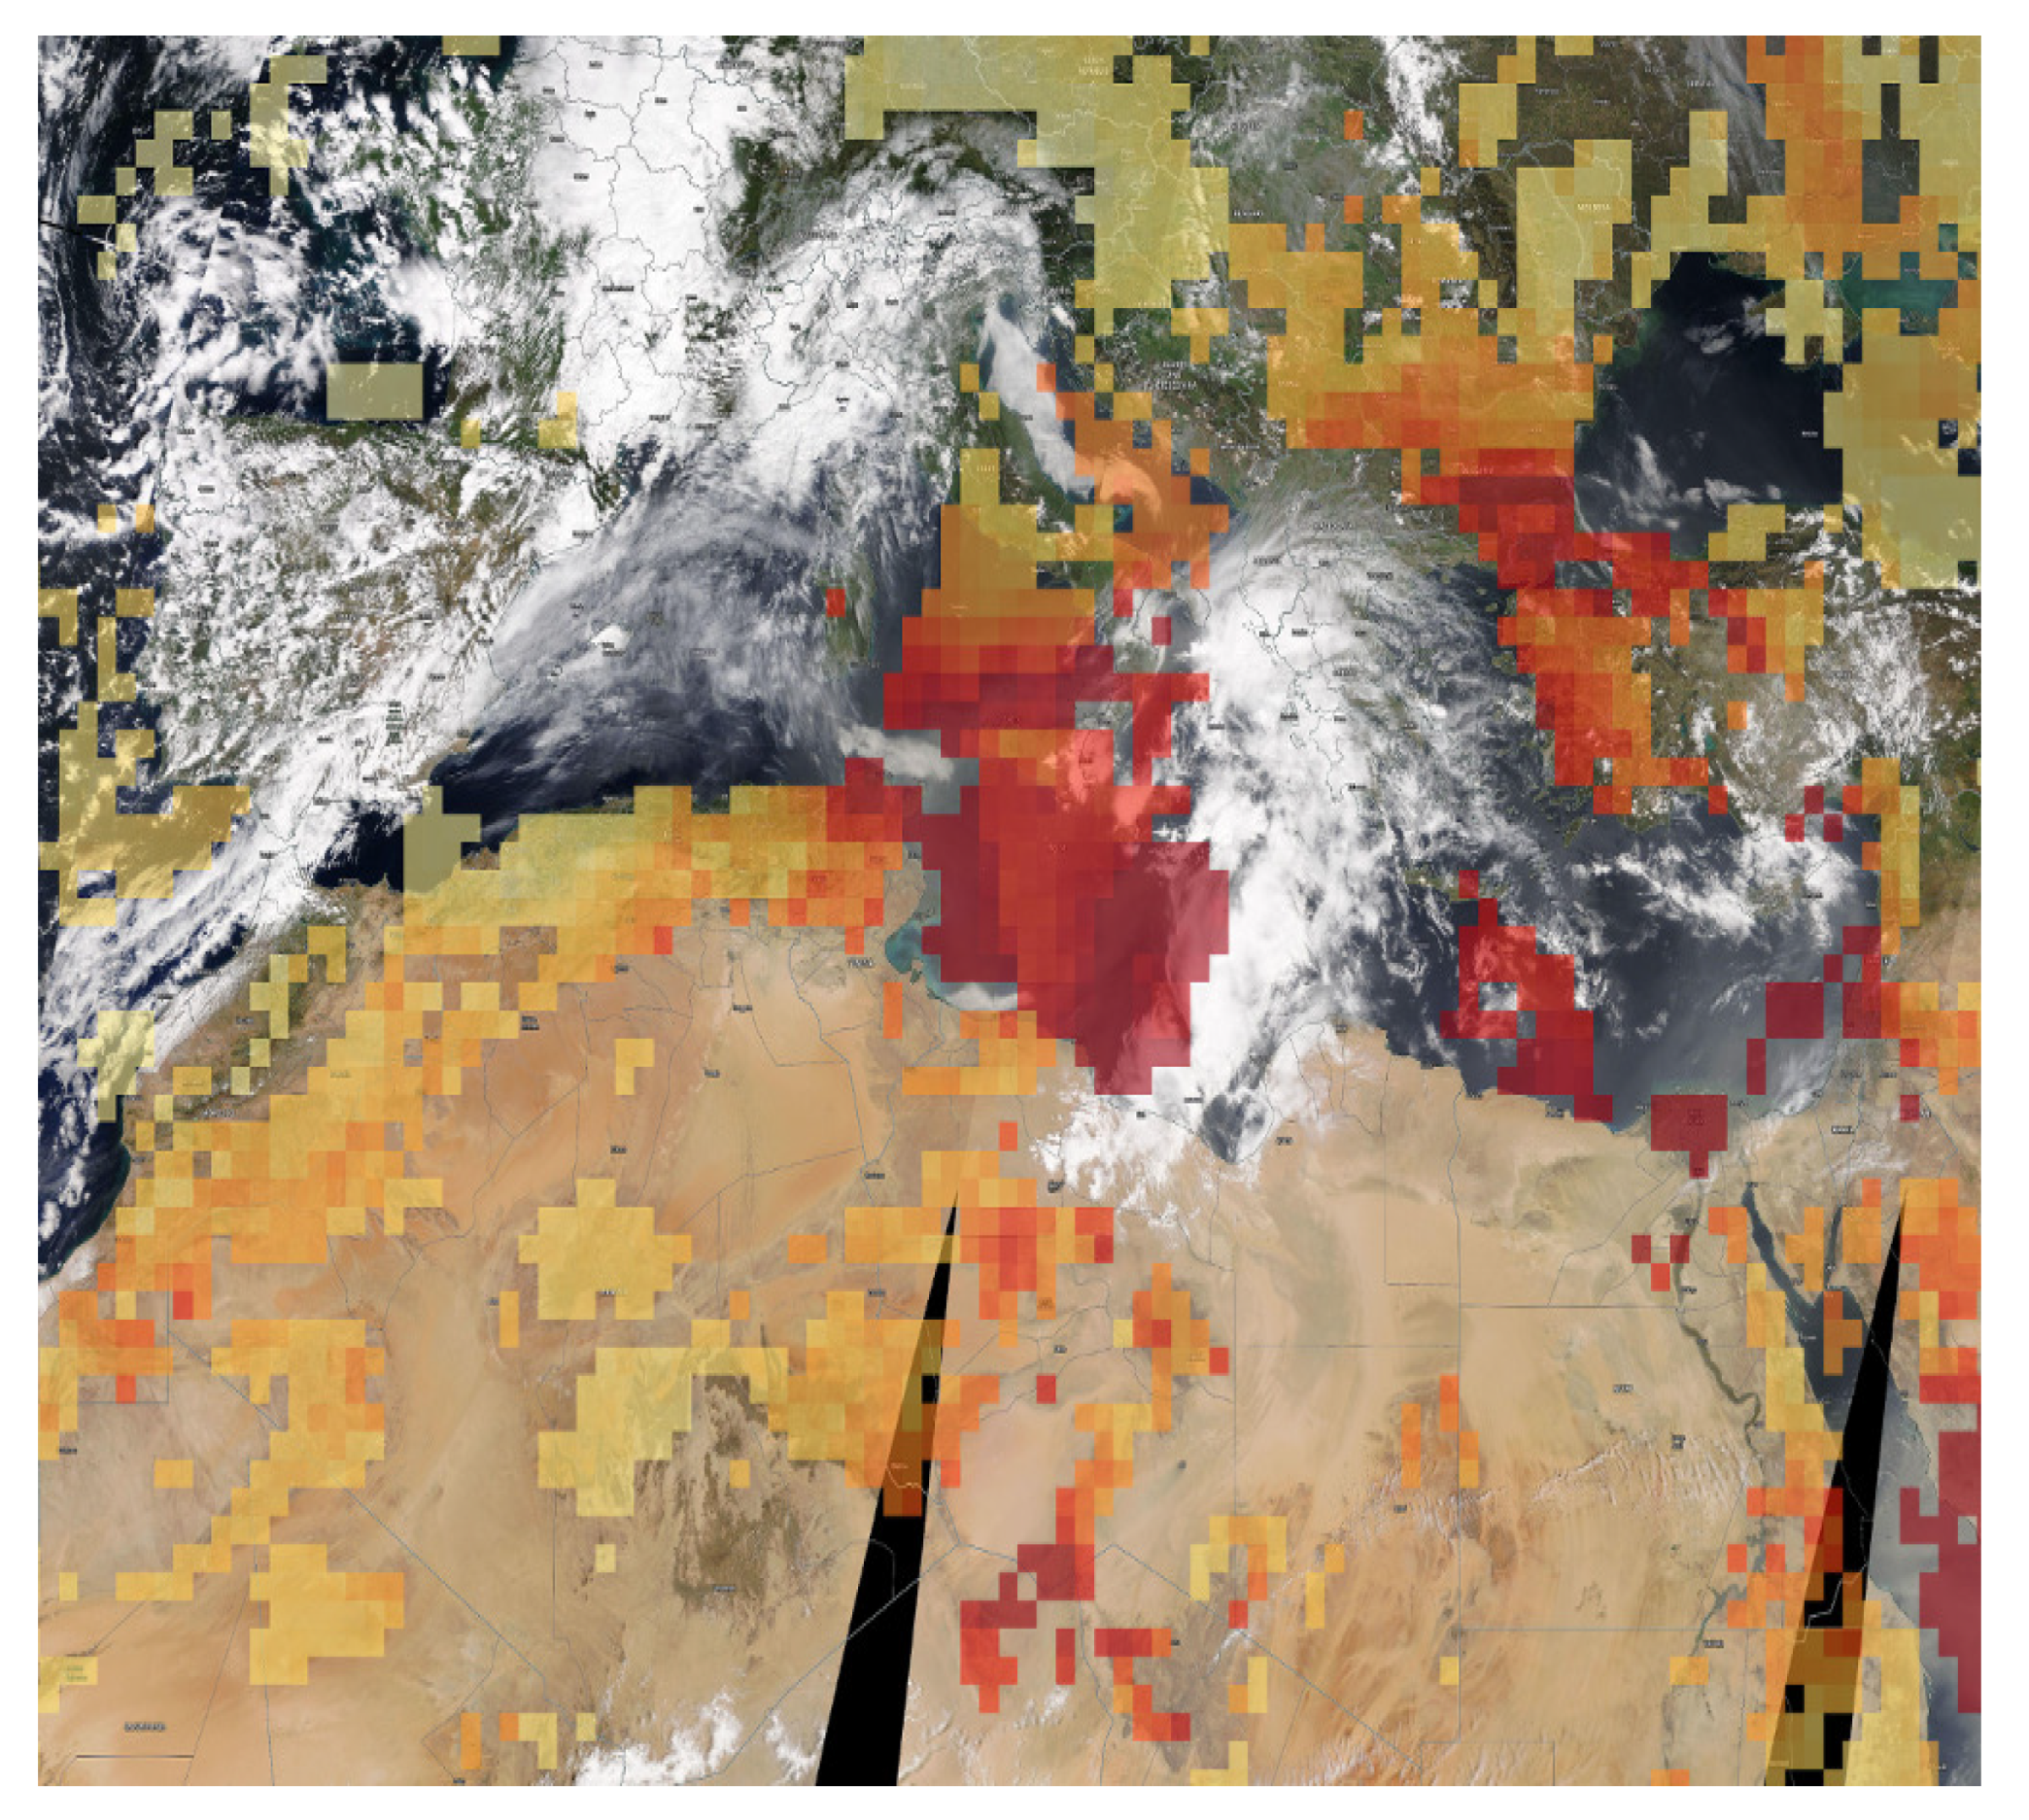
4.3. Satellite and Model Products

The Moderate Resolution Imaging Spectrometer (MODIS) on NASA’s Aqua and Terra satellite permits confirmation of the characteristics of the event.
The MODIS value-added AOD is shown in Figure 12, superimposed on the MODIS Corrected Reflectance, for 25 April 2019, in a central day of the considered dust event period.
It is important to highlight that this product is a result of a specific retrieval method and is not a direct measurement. Furthermore, the aerosol forecasting community largely uses the product to quantitatively describe some specific events with high-resolution satellite products.
As we can see, southern Italy is affected by a high value of AOD, in particular on 25 April.
Observing the positions of the higher AOD values (reddish colors), and observing its evolution in the whole period (all daily maps, not reported for brevity), we deduce that the storm comes from the Sahara and moves east-northeast, according to synoptic analysis and with CAMS-modeled AOD as discussed below.
To evaluate the location of the dust sources that are directly connected to the investigated dust intrusion, we show the CAMS-modeled dust AOD at 550 nm. These fields, despite being modeling products, could be useful also to confirm the meteorological analysis discussed above and the selection of the events to study in more detail.
CAMS analysis confirmed the severity of this dust event. In particular, in Figure 13 the 24-h time interval simulated AOD (from 00 UTC on 22 April to 00 UTC on 26 April) is reported. Although in the previous section (ERA5 analysis) we analyzed the fields starting from 00 UTC on 23 April (the first day of the recognized event), in this part we show the CAMS outputs starting from the day before, in order to highlight the source of the dust. Values higher than 1.6 were reached on 23 April over southern Italy, but larger values (about 2) were simulated in Northern Africa and in the Mediterranean the day before.
Following the spatio-temporal evolution of the simulated dust storm, we can recognize the Saharan nature of the case, mainly on the first phase of the event. In a second phase, large values of AOD are also measured at Lamezia Terme (according to CAMS simulations, Figure 13), but in this case, simultaneously to the eastward translation of the synoptic system, even the dust source appears to be more shifted to the central/eastern African regions.
In Figure 14 the Total AOD at 00 UTC on 23 April, derived by CAMS, is also reported; this map is directly comparable with the Figure 13 referring to the same time. From this map we can see the high values of the Total AOD (>1.8) also in southern Italy, proving the existence of a small anthropogenic contribution to the aerosol detection at the site of interest. Comparing the MODIS Combined Value-Added AOD (Figure 12, referred to on 25 April) and the CAMS Dust AOD at 00 UTC on 25 April, we note a slight difference in the values and position of the larger AOD values. It is important to highlight that none of the two products is a direct observation and, moreover, that the satellite layer is referred to for the whole day, while the CAMS analysis is indicative of a single time (00 UTC in this case).
One of the principal results obtained in this preliminary analysis, regarding the main directions of the dust intrusions, regards the recognized existence of two pathways in the southern Mediterranean, and the subsequent fusion of them, that makes the dust sources (Sahara Desert or north-eastern African regions) often indistinguishable. This peculiarity is unique in the context of similar studies on Mediterranean regions, and characterizes the experimental site of Lamezia Terme.
This dust-outbreak case is a typical example of this occurrence; to confirm this, we show the HYSPLIT [54] back-trajectories, computed for 48 h run, for 23–25 April 2019, respectively (Figure 15a–c); the trajectories are forced with the archived NCEP Global Data Assimilation System (GDAS), at 0.5 resolution. The trajectories are obtained using the READY (Real-time Environmental Applications and Display sYstem) platform (https://www.ready.noaa.gov/index.php) [55] and are forced with the archived NCEP Global Data Assimilation System (GDAS), at 0.5° resolution.
In Figure 15a relating to 23 April, the dust is coming from the Sahara Desert, as confirmed in the previous discussions done with CAMS and MODIS outputs. As anticipated, in the following days, synergistically with the eastward movement of the storm, the dust becomes advected from south-southeast, thus highlighting the predominance of the second pathway in forcing the dust from central/north-eastern Africa regions.

5. Conclusive Remarks and Future Works

Here, we presented a comprehensive study of aerosol optical properties, performing statistical analysis integrated with modeled large-scale atmospheric fields to characterize dust events at our LMT GAW Regional site.
The paper focused on an incremental method to select dust-outbreak events that occurred in 2015–2019 period. We adopted thresholds based on a basic statistical analysis on the entire dataset, for aerosol optical properties, and collected particles in order to help us to efficiently identify dust outbreaks. The dust events were identified by the intersection between two different datasets using, respectively, SWAM and nephelometer data. SWAM data allowed us to select days and events (grouping at least three consecutive days) by choosing collected filters that present the double of the mean value (i.e., the 95th percentile) of particle concentration corresponding to 10.69 μ g/cm 3 , this represents the aerosol mass threshold in which desert dust transport has a high probability to occur, and in our case this is confirmed by SEM observation. By optical parameters, obtained from nephelometer, we choose within the already selected days, through SWAM-considered mass threshold, those days in which SAE results were lower than 0.65. This selection technique plausibly reduces the total number of events that occurred, but allows us to keep track of only those occurrences objectively recorded by the sensors, according to the technique adopted. A total of 62 days of possible dust events were first identified by SWAM analysis. In 10 of these days, the values of eBC concentration are greater than a threshold choice of the 90th percentile of the daily mean (1.01 μ g/cm 3 ), and this indicates the presence of local pollution; therefore, these days were discarded (52 days are retained). SWAM sampling was sometimes done with daily (one-day) collection times and, other times, with three-day collection times. By unifying all the three-day collection times, the sample was reduced to 26 sampling periods, now consisting of both one-day and three-day collection times. These sampling periods are, in some cases, contiguous. By further merging the all periods with contiguous dates, thus associating the same plausible large-scale atmospheric configuration to the single dust event, the sample is further reduced to 15 dust periods.
From analysis of data results that the LMT site is subject to frequent dust incursions and the most significant events occur during warm and cold seasons.
The collected dust particles generally present a coarse grain characterization with optical mean values that do not present relevant difference.
Due to the peculiarity of our site, dust outbreaks are related to two different pathways coming, respectively, from the Sahara Desert and from the northwestern African regions.
A difference exists for events coming from the two main directions in which western storms transport coarse dust particles, while eastern storms present mixed resulting aerosols that cross anthropized surroundings.
The analyzed case event, using all available instruments at LMT and by comparing the observed parameters with different types of model outputs and confirmed by other analysis on sample collected on filters, allows us to investigate the model’s ability to reproduce both the horizontal and the vertical displacement of the dust plume, as well as its evolution in time, taking in a major account the large-scale atmospheric forcing in driving the dust event.
In this last case, the convergence of two air masses coming from both privileged directions supports our results:
  • SAE parameter with value close to 0.65, shows that the PM coarse fraction at the surface is mixed with fine/coarse due to the influence of the transport of continental aerosol;
  • g parameter does not show a significant change, but there is a small increase when we considering the S-E event sector;
  • filter images by SEM demonstrate the presence of mixed particles.
The ERA5 dataset was found to reproduce the synoptic meteorological conditions driving the dust outbreak well. Analysis of future and further dust outbreaks will give us a new chance to test further our incremental method.
Future work is needed, mainly related to mineralogical studies, to understand if this circulation pattern, that sometimes occurs, transports mass from both main dust sources, the Sahara Desert and Middle East.

Author Contributions

Conceptualization, C.R.C., E.A.; Data curation, I.A., D.G., M.D.P. and C.R.C.; Funding acquisition, C.R.C.; Project administration, C.R.C. and M.D.P.; Methodology, C.R.C., E.A., D.G., A.D. and T.L.F.; Supervision, C.R.C. and E.A.; Visualization, C.R.C.; Writing—original draft, C.R.C., E.A., A.D., and T.L.F.; Writing—review & editing, C.R.C., E.A., A.D. and T.L.F. All authors have read and agreed to the published version of the manuscript.

Funding

This research was funded by I-AMICA Project (Italian National Operation Program Ricerca e Competitività (Research and Competitiveness) 2007–2013 (PON R&C). The work was further supported by the ACTRIS European Infrastructure and Italian Joint Research Unit (JRU) funded by Italian Ministry of Education, University and Research (MIUR) (2017–2018).

Acknowledgments

The European Commission, the Copernicus programme (European Union’s Earth observation programme) and the ECMWF (European Centre for Medium-Range Weather Forecasts) are acknowledged for the use of the CAMS model outputs. ECMWF and Copernicus Climate-Change Service (C3S) are also acknowledged for the use of the ERA5 reanalysis. NOAA Air Resources Laboratory’s (ARL) is acknowledged for the use of HYSPLIT outputs. NASA’s Earth Observing System Data and Information System (EOSDIS) is acknowledged for the use of MODIS images. Some images are derived by the NASA’s platform https://worldview.earthdata.nasa.gov. Thanks to Francesco Sinopoli and Maria Rosaria Bruno—from DIMEILA—INAIL Research Center Lamezia Terme for SEM availability for filter analysis.

Conflicts of Interest

The authors declare no conflict of interest.

References

  1. Textor, C.; Schulz, M.; Guibert, S.; Kinne, S.; Balkanski, Y.; Bauer, S.E.; Berntsen, T.; Berglen, T.F.; Boucher, O.; Chin, M.; et al. Analysis and quantification of the diversities of aerosol life cycles within AeroCom. Atmos. Chem. Phys. 2006, 6, 1777–1813. [Google Scholar] [CrossRef] [Green Version]
  2. Huneeus, N.; Schulz, M.; Balkanski, Y.; Griesfeller, J.; Prospero, M.J.; Kinne, S.; Bauer, S.; Boucher, O.; Chin, M.; Dentener, F.; et al. Global dust model intercomparison in AeroCom phase I. Atmos. Chem. Phys. 2011, 11, 7781–7816. [Google Scholar] [CrossRef] [Green Version]
  3. Washington, R.; Todd, M.; Middleton, N.J.; Goudie, A.S. Dust-Storm Source Areas Determined by the Total Ozone Monitoring Spectrometer and Surface Observations. Ann. Assoc. Am. Geogr. 2003, 93, 297–313. [Google Scholar] [CrossRef]
  4. Prospero, J.M.; Ginoux, P.; Torres, O.; Nicholson, S.E.; Gill, T.E. Environmental characterization of global sources of atmospheric soil dust identified with the NIMBUS 7 Total Ozone Mapping Spectrometer (TOMS) absorbing aerosol product. Rev. Geophys. 2002, 40. [Google Scholar] [CrossRef]
  5. Papayannis, A.; Balis, D.; Amiridis, V.; Chourdakis, G.; Tsaknakis, G.; Zerefos, C.; Castanho, A.D.A.; Nickovic, S.; Kazadzis, S.; Grabowski, J. Measurements of Saharan dust aerosols over the Eastern Mediterranean using elastic backscatter-Raman lidar, spectrophotometric and satellite observations in the frame of the EARLINET project. Atmos. Chem. Phys. 2005, 5, 2075–2110. [Google Scholar] [CrossRef] [Green Version]
  6. Israelevich, P.; Ganor, E.; Alpert, P.; Kishcha, P.; Stupp, A. Predominant transport paths of Saharan dust over the Mediterranean Sea to Europe. J. Geophys. Res. 2012, 117, D02205. [Google Scholar] [CrossRef] [Green Version]
  7. Shao, Y.; Wyrwoll, K.H.; Chappell, A.; Huang, J.; Lin, Z.; Mc-Tainsh, G.H.; Mikami, M.; Tanaka, T.Y.; Wang, X.; Yoon, S. Dust cycle: An emerging core theme in Earth system science. Aeolian Res. 2011, 2, 181–204. [Google Scholar] [CrossRef]
  8. D’Almeida, G.A. A model for Saharan dust transport. Clim. Appl. Meteorol. 1986, 25, 903–916. [Google Scholar] [CrossRef] [Green Version]
  9. Prospero, J.M.; Mayol-Bracero, O.L. Understanding the trans- port and impact of African dust on the Caribbean basin. Bull. Am. Meteorol. Soc. 2013, 94, 1329–1337. [Google Scholar] [CrossRef]
  10. Yu, H.; Chin, M.; Bian, H.; Yuan, T.; Prospero, J.M.; Omar, A.H.; Remer, L.A. Quantification of trans-Atlantic dust transport from seven-year (2007–2013) record of CALIPSO lidar measurements. Emerg. Infect Dis. 2015, 159, 232–249. [Google Scholar] [CrossRef]
  11. Moulin, C.; Lambert, C.E.; Dayan, U.; Masson, V.; Ramonet, M.; Bousquet, P.; Legrand, M.; Balkanski, Y.J.; Guelle, W.; Marticorena, B.; et al. Satellite climatology of African dust transport in the Mediterranean atmosphere. Geophys. Res. Atmos 1998, 103, 13137–13144. [Google Scholar] [CrossRef]
  12. Barnaba, F.; Gobbi, G.P. Aerosol seasonal variability over the Mediterranean region and relative impact of maritime, continental and Saharan dust particles over the basin from MODIS data in the year 2001. Atmos. Chem. Phys. 2004, 4, 2367–2391. [Google Scholar] [CrossRef] [Green Version]
  13. Pey, J.; Querol, X.; Alastuey, A.; Forastiere, F.; Stafoggia, M. African dust outbreaks over the Mediterranean Basin during 2001–2011: PM10 concentrations, phenomenology and trends, and its relation with synoptic and mesoscale meteorology. Atmos. Chem. Phys. 2003, 13, 1395–1410. [Google Scholar] [CrossRef] [Green Version]
  14. Goudie, A.S.; Middleton, N.J. Saharan dust storms: Nature and consequences. REarth Sci. Rev. 2001, 56, 179–204. [Google Scholar] [CrossRef]
  15. Engelstaedter, S.; Tegen, I.; Washington, R. North African dust emissions and transport. Earth Sci. Rev. 2006, 79, 73–100. [Google Scholar] [CrossRef]
  16. Barkan, J.; Kutiel, H.; PAlpert, P.; Kischa, P. The synoptics of dust transportation days from Africa toward Italy and central Europe. J. Geophys. Res.-Atmos. 2005, 110, D07208. [Google Scholar] [CrossRef] [Green Version]
  17. Dayan, U.; Hefter, J.; Miller, J.; Gutman, G. Dust intrusion events into the Mediterranean basin. J. Appl. Meteor. 1991, 30, 1188–1193. [Google Scholar] [CrossRef] [Green Version]
  18. Ginoux, P.; Chin, M.; Tegen, I.; Prospero, J.M.; Holben, B.; Dubovik, O.; Lin, S.J. Sources and distributions of dust aerosols simulated with the GOCART model. J. Geophys. Res. 2001, 106, 20255–20273. [Google Scholar] [CrossRef]
  19. Tsidulko, M.; Krichak, S.O.; Alpert, P.; Kakaliagou, O.; Kallos, G.; Papadopoulos, A. Numerical study of a very intensive eastern mediterranean dust storm, 13–16 March 1998. J. Geophys. Res. 2002, D21, 1–13. [Google Scholar] [CrossRef]
  20. Rizza, U.; Barnaba, F.; Miglietta, M.M.; Mangia, C.; Di Liberto, L.; Dionisi, D.; Costabile, F.; Grasso, F.; Gobbi, G.P. WRF-Chem model simulations of a dust outbreak over the central Mediterranean and comparison with multi-sensor desert dust observations. Atmos. Chem. Phys. 2017, 17, 93–115. [Google Scholar] [CrossRef] [Green Version]
  21. Gobbi, G.P.; Barnaba, F.; Di Liberto, L.; Bolignano, A.; Lucarelli, F.; Nava, S.; Perrino, C.; Pietrodangelo, A.; Basart, S.; Costabile, F.; et al. An inclusive view of Saharan dust advections to Italy and the Central Mediterranean. Atmos. Environ. 2019, 9, 242–256. [Google Scholar] [CrossRef]
  22. Moulin, C.; Dulac, F.; Lambert, C.E.; Chazette, P.; Jankowiak, I.; Chatenet, B.; Lavenu, F. Long-term daily monitoring of Saharan dust load over ocean using Meteosat ISCCP-B2 data, 2, Accuracy of the method and validation using sunphotometer measurements. Geophys. Res. 1997, 102, 959–969. [Google Scholar] [CrossRef] [Green Version]
  23. Alpert, P.F.; Ganor, E. Sahara mineral dust mineral dust measurements from TOMS:Comparison to surface observations over Middle East for the extreme duststorm, 14–17 March 1998. J. Geophys. Res. 2001, 106, 275–286. [Google Scholar] [CrossRef] [Green Version]
  24. Israelevich, P.; Levin, Z.; Joseph, J.H.; Ganor, E. Desert aerosol transport in the Mediterranean region as inferred from the TOMS aerosol index. J. Geophys. Res. 2001, 107, 4572. [Google Scholar] [CrossRef]
  25. Rodrıguez, S.; Querol, X.; Alastuey, A.; Kallos, G.; Kakaliagou, O. Saharan dust contribution to PM10 and TSP levels in Southern and Eastern Spain. Atmos. Environ. 2001, 35, 2433–2447. [Google Scholar] [CrossRef]
  26. Meloni, D.; Di Sarra, A.; Biavati, G.; DeLuisi, J.J.; Monteleone, F.; Pace, G.; Piacentino, S.; Sferlazzo, D.M. Seasonal behavior of Saharan dust events at the Mediterranean island of Lampedusa in the period 1999–2005. Atmos. Environ. 2007, 41, 3041–3056. [Google Scholar] [CrossRef]
  27. Marticorena, B.; Chatenet, B.; Rajot, J.L.; Coulibaly, M.; Diallo, A.; Maman, A.; NDiaye, T.; Zakou, A. Temporal variability of mineral dust concentrations over West Africa: Analyses of a pluriannual monitoring from the AMMA Sahelian Dust Transect. Atmos. Chem. Phys. 2010, 10, 8899–8915. [Google Scholar] [CrossRef] [Green Version]
  28. Pereira, S.N.; Wagner, F.; Silva, A.M. Seven year of measurements of aerosol scattering properties, near the surface, in the southwestern Iberia Peninsula. Atmos. Chem. Phys. 2011, 11, 17–29. [Google Scholar] [CrossRef] [Green Version]
  29. Perrone, M.R.; Romano, S.; Orza, J.A.G. Particle optical properties at a Central Mediterranean site: Impact of advection routes and local meteorology. Atmos. Res. 2014, 145–146, 152–167. [Google Scholar] [CrossRef]
  30. Kaly, F.; Marticoréna, B.; Chatenet, B.; Rajot, J.L.; Janicot, S.; Niang, A.; Yahi, H.; Thiria, S.; Maman, A.; Zakou, A.; et al. Variability of mineral dust concentrations over West Africa monitored by the Sahelian Dust Transect. Atmos. Res. 2015, 164–165, 226–241. [Google Scholar] [CrossRef]
  31. Pandolfi, M.; Alados-Arboledas, L.; Alastuey, A.; Andrade, M.; Angelov, C.; Backman, J.; Baltensperger, U.; Bonasoni, P.; Bukowiecki, N.; Coen, M.C. A European aerosol phenomenology—6: Scattering properties of atmospheric aerosol particles from 28 ACTRIS sites. Atmos. Chem. Phys. 2018, 18, 7877–7911. [Google Scholar] [CrossRef] [Green Version]
  32. Donateo, A.; Lo Feudo, T.; Marinoni, A.; Calidonna, C.R.; Contini, D.; Bonasoni, P. Long-term observations of aerosol optical properties at three GAW regional sites in the Central Mediterranean. Atmos. Res. 2020, 241, 104976. [Google Scholar] [CrossRef]
  33. Perrone, M.R.; Romano, S.; Genga, A.; Paladini, F. Integration of optical and chemical parameters to improve the particulate matter characterization. Atmos. Res. 2018, 205, 93–106. [Google Scholar] [CrossRef]
  34. Conte, M.; Merico, E.; Cesari, D.; Dinoi, A.; Grasso, F.M.; Donateo, A.; Guascito, M.R.; Contini, D. Long-term characterisation of African dust advection in south-eastern Italy: Influence on fine and coarse particle concentrations, size distributions, and carbon content. Atmos. Res. 2019, 233, 104690. [Google Scholar] [CrossRef]
  35. Hamonou, E.; Chazette, P.; Balis, D.; Dulac, F.; Schneider, X.; Galani, E.; Ancellet, G.; Papayannis, A. Characterization of the vertical structure of Saharan dust export to the Mediterranean basin. J. Geophys. Res. 1999, 104, 22257–22270. [Google Scholar] [CrossRef] [Green Version]
  36. Gobbi, G.P.; Barnaba, F.; Giorgi, R.; Santacasa, A. Altitude-resolved properties of a Saharan Dust event over the Mediterranean. Atmos. Environ. 2000, 34, 5119–5127. [Google Scholar] [CrossRef]
  37. Ansmann, A.; Bösenberg, J.; Chaikovsky, A.; Comerón, A.; Eckhardt, S.; Eixmann, R.; Freudenthaler, V.; Ginoux, P.; Komguem, L.; Linné, H.; et al. Long-range transport of Saharan dust to northern Europe: The 11–16 October 2001 outbreak observed with EARLINET. J. Geophys. Res. 2003, 108, 4783. [Google Scholar] [CrossRef]
  38. Müller, T.; Laborde, M.; Kassell, G.; Wiedensohler, A. Design and performance of a three-wavelength LED-based total scatter and backscatter integrating nephelometer. Atmos. Meas. Tech. 2011, 4, 1291–1303. [Google Scholar] [CrossRef] [Green Version]
  39. Federico, S.; Pasqualoni, L.; Sempreviva, A.M.; De Leo, L.; Avolio, E.; Calidonna, C.R.; Bellecci, C. The seasonal characteristics of the breeze circulation at a coastal Mediterranean site in South Italy. Adv. Sci. Res. 2010, 4, 47–56. [Google Scholar] [CrossRef] [Green Version]
  40. Anderson, T.L.; Covert, D.S.; Marshall, S.F.; Laucks, M.L.; Charlson, R.J.; Waggoner, A.P.; Ogren, J.A.; Caldow, R.; Holm, R.L.; Quant, F.R.; et al. Performance characteristics of a high-sensitivity, three-wavelength, total scatter/backscatter nephelometer. J. Atmos. Ocean. Technol. 1996, 13, 967–986. [Google Scholar] [CrossRef] [Green Version]
  41. Petzold, A.; Schloesser, H.; Sheridan, P.J.; Arnott, P.; Ogren, J.A.; Virkkula, A. Evaluation of multiangle absorption photometry for measuring aerosol light absorption. Aerosol Sci. Technol. 2005, 39, 40–51. [Google Scholar] [CrossRef] [Green Version]
  42. Petzold, A.; Schönlinner, M. A Multi-angle absorption photometry—A new method for the measurement of aerosol light absorption and atmospheric black carbon. Aerosol Sci. 2004, 35, 421–441. [Google Scholar] [CrossRef]
  43. WMO/GAW Standard Operating Procedures for In-Situ Measurements of Aerosol Mass Concentration, Light Scattering and Light Absorption. Edited by John A. Ogren. World Meteorological Organization. 2011. Available online: https://wmo-gaw-wcc-aerosol-physics.org/files/gaw-200.pdf (accessed on 27 January 2020).
  44. OPC Technical Specification, Fai Instruments. Available online: http://fai-instruments.net/wp-content/uploads/2016/02/de\protect\discretionary{\char\hyphenchar\font}{}{}pliant_OPC_multi\protect\discretionary{\char\hyphenchar\font}{}{}canale_Mag\protect\discretionary{\char\hyphenchar\font}{}{}2010-1.pdf (accessed on 27 January 2020).
  45. SWAM Technical Specification, Fai Instruments. Available online: http://fai-instruments.net/wp-content/uploads/2016/02/TECHNICAL-SPECIFICATIONS-SW-DC-1.pdf (accessed on 27 January 2020).
  46. CIMEL Data Sheet, CIMEL. Available online: https://www.cimel.fr/wp-content/uploads/2019/06/Brochure-CE318-T-1.pdf (accessed on 21 April 2020).
  47. Holben, B.N.; Eck, T.F.; Slutsker, I.; Tanre, D.; Buis, J.P.; Setzer, A.; Vermote, E.; Reagan, J.A.; Kaufman, Y.; Nakajima, T.; et al. AERONET—A federated instrument network and data archive for aerosol characterization. Remote Sens. Environ. 1998, 66, 1–16. [Google Scholar] [CrossRef]
  48. Dubovik, O.; King, M.D. A flexible inversion algorithm for retrieval of aerosol optical properties from Sun and sky radiance measurements. Geophys. Res. Atmos. 2000, 105, 20673–20696. [Google Scholar] [CrossRef] [Green Version]
  49. Eck, T.F.; BNHolben, J.S.; Smirnov, A.; O’Neill, N.T.; Slutsker, I.; Kinne, S. Wavelength dependence of optical depth of biomass burning, urban, and dust aerosols. Geophys. Res. 1999, 104, 31333–31349. [Google Scholar] [CrossRef]
  50. Dubovik, O.; Holben, B.; Eck, T.F.; Smirnov, A.; Kaufman, Y.J.; King, M.D.; Tanré, D.; Slutsker, I. Variability of absorption and optical properties of key aerosol types observed in worldwide locations. J. Atmos. Sci. 2002, 59, 590–608. [Google Scholar] [CrossRef]
  51. Copernicus Climate Change Service (C3S) (2017): ERA5: Fifth Generation of ECMWF Atmospheric Reanalyses of the Global Climate. Copernicus Climate Change Service Climate Data Store (CDS). Available online: https://cds.climate.copernicus.eu/cdsapp#!/home (accessed on 3 April 2020).
  52. Benedetti, A.; Morcrette, J.J.; Boucher, O.; Dethof, A.; Engelen, R.J.; Fisher, M.; Flentje, H.; Huneeus, N.; Jones, L.; Kaiser, J.W.; et al. Aerosol analysis and forecast in the European Centre for Medium- Range Weather Forecasts Integrated Forecast System. Part 2: Data assimilation. J. Geophys. Res. Atmos. 2009, 114, D13205. [Google Scholar] [CrossRef] [Green Version]
  53. Morcrette, J.-J.; Boucher, O.; Jones, L.; Salmond, D.; Bechtold, P.; Beljaars, A.; Benedetti, A.; Bonert, A.; Kaiser, J.W.; Razinger, M.; et al. Aerosol analysis and forecast in the European Centre for Medium-Range Weather Forecasts Integrated Forecast System. Part 1: Forward modelling. J. Geophys. Res. Atmos. 2009, 114, D06206. [Google Scholar] [CrossRef]
  54. Stein, A.F.; Draxler, R.R.; Rolph, G.D.; Stunder, B.J.B.; Cohen, M.D.; Ngan, F. NOAA’s HYSPLIT atmospheric transport and dispersion modeling system. Bull. Am. Meteorol. Soc. 2015, 96, 2059–2077. [Google Scholar] [CrossRef]
  55. Rolph, G.; Stein, A.; Stunder, B. Real-time Environmental Applications and Display System: Ready. Environ. Mod. Soft. 2017, 95, 210–228. [Google Scholar] [CrossRef]
  56. Levy, R.C.; Mattoo, S.; Munchak, L.A.; Remer, L.A.; Sayer, A.M.; Patadia, F.; Hsu, N.C. The Collection 6 MODIS aerosol products over land and ocean. Atmos. Meas. Tech. 2013, 6, 2989–3034. [Google Scholar] [CrossRef] [Green Version]
  57. Wei, J.; Peng, Y.; Guo, J.; Sun, L. Performance of MODIS Collection 6.1 Level 3 aerosol products in spatial-temporal variations over land. Atmos. Environ. 2019, 206, 30–44. [Google Scholar] [CrossRef]
  58. Wei, J.; Li, Z.; Peng, Y.; Sun, L. MODIS Collection 6.1 aerosol optical depth products over land and ocean: Validation and comparison. Atmos. Environ. 2019, 201, 428–440. [Google Scholar] [CrossRef]
  59. Wei, J.; Li, Z.; Sun, L.; Peng, Y.; Wang, L. Improved merge schemes for MODIS collection 6.1 dark target and deep blue combined aerosol products. Atmos. Environ. 2019, 202, 315–327. [Google Scholar] [CrossRef]
  60. Zhang, G.; Wu, J.; Fan, W.; Yang, Q.; Zhao, D. Review of aerosol optical depth retrieval using visibility data. Earth Sci. Rev. 2020, 200, 102986. [Google Scholar] [CrossRef]
  61. Anderson, T.L.; Ogren, J.A. Determining Aerosol Radiative Properties Using the TSI 3563 Integrating Nephelometer. Aerosol. Sci. Technol. 1998, 29, 57–69. [Google Scholar] [CrossRef] [Green Version]
  62. Bond, T.C.; Covert, D.S.; Müller, T. Truncation and Angular- Scattering Corrections for Absorbing Aerosol in the TSI 3563 Nephelometer. Aerosol. Sci. Technol. 2009, 43, 866–871. [Google Scholar] [CrossRef] [Green Version]
  63. Costabile, F.; Barnaba, F.; Angelini, F.; Gobbi, G.P. Identification of key aerosol populations through their size and composition resolved spectral scattering and absorption. Atmos. Chem. Phys. 2013, 13, 866–871. [Google Scholar] [CrossRef] [Green Version]
  64. Bryant, C.; Eleftheriadis, K.; Smolik, J.; Zdimal, V.; Mihalopoulos, N.; Colbeck, I. Optical properties of aerosols over the eastern Mediterranean. Atmos. Environ. 2006, 40, 6229–6244. [Google Scholar] [CrossRef]
  65. Andrews, E.; Sheridan, P.J.; Fiebig, M.; McComiskey, A.; Ogren, J.A.; Arnott, P.; Covert, D.; Elleman, R.; Gasparini, R.; Collins, D.; et al. Comparison of methods for deriving aerosol asymmetry parameter. J. Atmos. Res. 2006, 111, D05S04. [Google Scholar] [CrossRef] [Green Version]
  66. Schuster, G.L.; Dubovik, O.; Holben, B.N. Angstrom exponent and bimodal aerosol size distributions. J. Geophys. Res. 2006, 111, D07207. [Google Scholar] [CrossRef] [Green Version]
  67. Virkkula, A.; Backman, J.; Aalto, P.P.; Hulkkonen, M.; Riuttanen, L.; Nieminen, T.; dalMaso, M.; Sogacheva, L.; de Leeuw, G.; Kulmala, M. Seasonal cycle, size dependencies, and source analyses of aerosol optical properties at the SMEARII measurement station in Hyytiälä, Finland. Atmos. Chem. Phys. 2011, 11, 4445–4468. [Google Scholar] [CrossRef] [Green Version]
  68. Petzold, A.; Kramer, H.; Schönlinner, M. Continuous Measurement of Atmospheric Black Carbon Using a Multi-angle Absorption Photometer. Environ. Sci. Pollut. Res. 2002, 4, 78–82. [Google Scholar]
  69. Donateo, A.; Lo Feudo, T.; Marinoni, A.; Dinoi, A.; Avolio, E.; Merico, E.; Calidonna, C.R.; Contini, D.; Bonasoni, P. Characterization of In Situ Aerosol Optical Properties at Three Observatories in the Central Mediterranean. Atmosphere 2018, 9, 369. [Google Scholar] [CrossRef] [Green Version]
  70. Meloni, D.; di Sarra, A.; Pace, G.; Monteleone, F. Optical properties of aerosol over the Central Mediterranean. 2. Determination of single scattering albedo at two wavelengths for different aerosol types. Atmos. Chem. Phys. 2006, 6, 715–727. [Google Scholar] [CrossRef] [Green Version]
  71. Pace, G.; di Sarra, A.; Meloni, C.; Piacentino, S.; Chamard, P. Aerosol optical properties at Lampedusa (Central Mediterranean). Influence of transport and identification of different aerosol types. Atmos. Chem. Phys. 2006, 6, 697–713. [Google Scholar] [CrossRef] [Green Version]
  72. Pederzoli, A.; Mircea, M.; Finardi, S.; di Sarra, A.; Zaninia, G. Quantification of Saharan dust contribution to PM10 concentrations over Italy during 2003–2005. Atmos. Environ. 2010, 44, 4181–4190. [Google Scholar] [CrossRef]
  73. Dinoi, A.; Donateo, A.; Conte, M.; Contini, D.; Belosi, F. Comparison of atmospheric particle concentration measurements using different optical detectors: Potentiality and limits for air quality applications. Meas. J. Int. Meas. Conf. 2017, 106, 274–282. [Google Scholar] [CrossRef]
  74. Sellitto, P.; Zanetel, C.; di Sarra, A.; Salerno, G.; Tapparo, A.; Meloni, D.; Pace, G.; Caltabiano, T.; Briole, P.; Legras, B. The impact of Mount Etna sulfur emissions on the atmospheric composition and aerosol properties in the central Mediterranean: A statistical analysis over the period 2000–2013 based on observations and Lagrangian modelling. Atmos. Environ 2017, 148, 77–88. [Google Scholar] [CrossRef] [Green Version]
  75. Gullì, D.; Avolio, E.; Calidonna, C.R.; LoFeudo, T.; Torcasio, R.C.; Sempreviva, A.M. Two years of wind-lidar measurements at an Italian Mediterranean Coastal Site. Energy Procedia 2017, 125, 214–220. [Google Scholar] [CrossRef] [Green Version]
  76. Pandolfi, M.; Cusack, M.; Alastuey, A.; Querol, X. Variability of aerosol optical properties in the Western Mediterranean Basin. Atmos. Chem. Phys. 2011, 11, 8189–8203. [Google Scholar] [CrossRef] [Green Version]
  77. Esteve, A.R.; Ogren, J.A.; Sheridan, P.J.; Andrews, E.; Holben, B.N.; Utrillas, M.P. Sources of discrepancy between aerosol optical depth obtained from AERONET and in-situ aircraft profiles. Atmos. Chem. Phys. 2012, 12, 2987–3003. [Google Scholar] [CrossRef] [Green Version]
  78. Chomette, O.; Legrand, M.; Marticorena, B. Determination of the wind speed threshold for the emission of desert dust using satellite remote sensing in the thermal infrared. J. Geophys. Res. Atmos. 1999, 104, 31207–31215. [Google Scholar] [CrossRef]
  79. Ealo, M.; Alastuey, A.; Ripoll, A.; Pérez, N.; Minguillon, M.C.; Querol, X.; Pandolfi, M. Detection of Saharan dust and biomass burning events using near-real-time intensive aerosol optical properties in the north-western Mediterranean. Atmos. Chem. Phys. 2016, 16, 12567–12586. [Google Scholar] [CrossRef] [Green Version]
  80. Guerzoni, S.; Molinaroli, E.; Chester, R. Saharan dust inputs to the W. Mediterranean Sea: Depositional patterns, geochemistry and sedimentological implications. Deep Sea Res. II 1997, 44, 331–654. [Google Scholar] [CrossRef]
  81. Matassoni, L.; Pratesi, G.; Centioli, D.; Cadoni, F.; Lucarelli, F.; Nava, S.; Malesani, P. Saharan dust contribution to PM10, PM2.5 and PM1 in urban and suburban areas of Rome: A comparison between single-particle SEM-EDS analysis and whole-sample PIXE analysis. J. Environ. Monit. 2011, 13, 732. [Google Scholar] [CrossRef]
  82. Molinaroli, E.; Guerzoni, S.; Rampazzo, G. Contribution of Saharan dust to the central Mediterranean basin. Processes controlling the composition of clastic sediments. Geol. Soc. Am. 1993, 1SP284, 303–312. [Google Scholar]
  83. Blanco, A.; De Tomasi, F.; Filippo, E.; Manno, D.; Perrone, M.R.; Serra, R.; Tafuro, A.M.; Tepore, A. Characterization of African dustover southern Italy. Atmos. Chem. Phys. Disc. 2003, 13, 4633–4670. [Google Scholar] [CrossRef] [Green Version]
  84. Falkovich, A.H.; Ganor, E.; Levin, E.; Formenti, P.; Rudich, Y. Chemical and mineralogical analysis of individual mineral dust particles. J. Geophys. Res. 2001, 106, 29–36. [Google Scholar] [CrossRef] [Green Version]
  85. Reid, J.S.; Jonsson, H.H.; Maring, H.B.; Smirnov, A.; Savoie, D.L.; Cliff, S.S.; Reid, E.A.; Livingston, J.M.; Meier, M.M.; Dubovik, O.; et al. Comparison of size and morphological measurements of coarse mode dust particles from Africa. J. Geophys. Res. 2003, 108. [Google Scholar] [CrossRef] [Green Version]
  86. Shi, Z.; Shao, L.; Jones, T.P.; Lu, S. Microscopy and mineralogy of airborne particles collected during severe dust storm episodes in Beijing. China. Geophys. Res. 2005, 110, D01303. [Google Scholar] [CrossRef] [Green Version]
Figure 1. CNR-ISAC LMT GAW-WMO Regional site: localization, altitude Calabria region, observatory equipment.
Atmosphere 11 00456 g001
Figure 2. Averaged (at 00 UTC for the selected 15 “dust events”) geopotential height (m) at 500 hPa. The maps are generated using Copernicus Climate-Change Service Information (2015–2019).
Atmosphere 11 00456 g002
Figure 3. Averaged (at 00 UTC for the selected 15 “dust events”) mean sea level pressure (hPa). The maps are generated using Copernicus Climate-Change Service Information (2015–2019).
Atmosphere 11 00456 g003
Figure 4. Averaged (at 00 UTC for the selected 15 “dust events”) wind speed (shaded contours; m/s) and direction (vector) at 925 hPa. The maps are generated using Copernicus Climate-Change Service Information (2015–2019).
Atmosphere 11 00456 g004
Figure 5. Temporal evolution of mean daily SAE 450 , 700 measured with nephelometer (blue line) and mean daily SAE 440 , 870 were obtained by CIMEL (orange line).
Atmosphere 11 00456 g005
Figure 6. PM—Temporal evolution of daily mean of PM 10 measured with OPC (gray line) and SWAM (blue line) and PM2.5 measured with OPC (yellow line) and SWAM (orange line) instruments.
Atmosphere 11 00456 g006
Figure 7. 25 April 2019 dust event, magnified sampled filter image and elements concentration.
Atmosphere 11 00456 g007
Figure 8. 14–17 April 2018 dust event magnified sampled filter image and elements result.
Atmosphere 11 00456 g008
Figure 9. Geopotential height (m) at 500 hPa, at 00 UTC on 23 April 2019. The maps are generated using Copernicus Climate-Change Service Information (2015–2019).
Atmosphere 11 00456 g009
Figure 10. Mean sea level pressure (hPa) at 00 UTC on 23 April 2019. The maps are generated using Copernicus Climate-Change Service Information (2015–2019).
Atmosphere 11 00456 g010
Figure 11. Wind speed (shaded contours; m/s) and direction (vector) at 925 hPa, at 00 UTC on 23 April 2019. The maps are generated using Copernicus Climate-Change Service Information (2015–2019).
Atmosphere 11 00456 g011
Figure 12. MODIS Combined Value-Added AOD for the 25 April 2019. The image is directly derived by the NASA’s platform https://worldview.earthdata.nasa.gov.
Atmosphere 11 00456 g012
Figure 13. Dust AOD at 550 nm, from 00 UTC on 26 April to 00 UTC on 26th on April every 24 h. The maps (ae) are generated using Copernicus Atmosphere Monitoring Service Information (2015–2019).
Atmosphere 11 00456 g013
Figure 14. Total Aerosol Optical Depth (AOD) at 550 nm, at 00 UTC on 23rd April. The maps are generated using Copernicus Atmosphere Monitoring Service Information (2015–2019).
Atmosphere 11 00456 g014
Figure 15. Back-trajectories obtained using the READY platform (https://www.ready.noaa.gov/index.php) for 23rd (a), 24th (b) and 25th (c) on April 2019.
Atmosphere 11 00456 g015
Table 1. eBC concentration during selected 52 events.
eBC ( μ g/m 3 )
daily mean0.51
median0.81
std. dev0.31
max1.60
perc 100.17
perc 900.81
Table 2. Dust events, their duration and identification in cold and warm season.
Dust Events StartingEvent Duration (Days)Cold SeasonWarm Season
5 February 20153X
25 March 20153X
15 February 20163X
13 April 20163 X
17 June 20161 X
25 February 20173X
27 April 20173 X
12 May 20173 X
7 February 20183X
15 April 20189 X
19 October 20182X
29 October 20182X
23 April 20195 X
12 May 20193 X
19 December 20196X
Total155287
Table 3. PM coarse fraction statistics during cold and warm seasons.
Cold Season ( μ g/m 3 )Warm Season ( μ g/m 3 )
mean29.0931.60
median22.2027.45
std.dev12.5310.34
min20.820.6
max60.0450.04
Table 4. Data availability for SWAM, OPC, MAAP and nephelometer for the (2015–2019) quality checked dataset.
Year20152016201720182019Total /Mean %
SWAM/days2832822671912181241
SWAM/%77.5377.0573.1552.3359.7367.96
OPC/hours7658758445064438310727293
OPC/%87.4286.3451.4450.6635.4762.27
MAAP/hours7287729375698657862339429
MAAP/%83.1883.0386.4098.8298.4489.98
NEPH/hours4568423548744050390221629
NEPH/%52.1548.2155.6446.2344.5449.35
Table 5. Statistics (from 1h average) of the measured and calculated optical properties ( σ s c , σ b s c , SAE, g), eBC and of the measured of PM coarse (from 1 day average), over the whole period analyzed, at LMT Observatory.
MeanMedianMaxMinperc10perc90Std err
σ s c 450 (Mm 1 )44.4432.87805.550.5117.74114.950.7
σ s c 550 (Mm 1 )32.0823.22660.300.3113.3882.340.52
σ s c 700 ( Mm 1 )14.999.48308.260.363.5938.720.23
σ b s c 450 (Mm 1 )5.554.2288.470.0032.4211.500.07
σ b s c 550 (Mm 1 )4.413.4063.970.022.029.000.05
σ b s c 700 (Mm 1 )2.401.6170.950.070.596.580.03
SAE 450 , 700 1.841.943.75−1.451.122.930.01
SAE 550 , 700 2.071.965.23−3.231.033.650.01
SAE 450 , 700 1.561.854.05−2.681.042.160.01
g 700 0.5700.4900.990−1.0600.4340.8600.002
g 550 0.5300.5400.990−2.9000.4990.600.002
g 450 0.5600.5700.980−2.9000.5310.6440.002
eBC ( μ g/m 3 )0.6430.58611.2660.0350.2491.0960.001
PM coarse ( μ g/m 3 )10.699.5160.42.57.919.90.02
Table 6. Statistics ( σ s c , σ b s c , SAE, g), at LMT Observatory, all selected dust events.
# Dust EventsMeanMedianstd.devstd.err
All data15151515
σ s c 450 (Mm 1 )42.9540.4922.530.64
σ s c 550 (Mm 1 )40.9938.4922.160.63
σ s c 700 (Mm 1 )26.7323.5717.580.50
σ b s c 450 (Mm 1 )5.314.763.370.09
σ b s c 550 (Mm 1 )5.124.343.020.09
σ b s c 700 (Mm 1 )3.312.872.300.07
SAE 450 , 700 0.6140.6330.1920.005
SAE 550 , 700 0.8220.6520.4350.012
SAE 450 , 550 0.3470.3730.4140.012
g 700 0.6830.7050.1010.002
g 550 0.5900.5860.0550.001
g 450 0.5940.5720.0930.002
Table 7. Statistics ( σ s c , σ b s c , SAE, g), at LMT Observatory, all selected dust events in cold season.
Cold Season ONDJFM EventsMeanMedianstd.devstd.err
All data8888
σ s c 450 (Mm 1 )41.3637.4524.811.65
σ s c 550 (Mm 1 )40.2433.6224.961.67
σ s c 700 (Mm 1 )25.2320.7019.291.29
σ b s c 450 (Mm 1 )5.564.763.350.22
σ b s c 550 (Mm 1 )5.164.343.020.21
σ b s c 700 (Mm 1 )3.252.672.610.17
SAE 450 , 700 0.5570.6210.1690.011
SAE 550 , 700 0.8750.9550.4460.030
SAE 450 , 550 0.1740.1790.3480.023
g 700 0.6770.6710.1090.007
g 500 0.5890.5920.0330.002
g 550 0.5720.5710.0330.002
Table 8. Statistics ( σ s c , σ b s c , SAE, g), at LMT Observatory, all selected dust events in warm season.
Warm Season AMJJAS EventsMeanMedianstd.devstd.err
All data7777
σ s c 450 (Mm 1 )44.9241.8121.491.43
σ s c 550 (Mm 1 )41.9240.6120.521.37
σ s c 700 (Mm 1 )29.3427.8615.781.05
σ b s c 450 (Mm 1 )4.712.563.490.23
σ b s c 550 (Mm 1 )4.953.082.850.19
σ b s c 700 (Mm 1 )3.513.160.9650.06
SAE 450 , 700 0.6690.6600.2030.013
SAE 550 , 700 0.7210.5610.4170.028
SAE 450 , 550 0.5660.5070.4170.028
g 700 0.6900.7160.0890.006
g 550 0.5960.5830.0760.005
g 450 0.6220.5780.1340.009
Table 9. Statistics ( σ s c , σ b s c , SAE, g), at LMT Observatory, all selected dust events with South-West and South-Est wind prevalent direction.
Mean (S-W Wind Direction Event)Mean (S-E Wind Direction Event)
# events69
σ s c 450 (Mm 1 )43.34347.32
σ s c 550 (Mm 1 )42.9944.15
σ s c 700 (Mm 1 )27.9631.24
σ b s c 450 (Mm 1 )5.835.72
σ b s c 550 (Mm 1 )5.625.54
σ b s c 700 (Mm 1 )3.873.83
SAE 450 , 700 0.4280.653
SAE 550 , 700 0.6200.758
SAE 450 , 550 0.1970.499
g 700 0.6140.690
g 550 0.5800.594
g 450 0.5790.603
Table 10. PM 10 statistic during 2015–2019 years.
Year/ PM 10 ( μ g/m 3 )MeanMinMax
201510.412.5024.30
201610.124.4046.10
201710.545.7035.50
201811.625.7060.40
201911.143.6050.40
Table 11. Events and PM mass concentration considering AL/Si ratio.
Saharan Dust EventPM 10 Mass Mean ( μ g/m 3 )Al/Si Ratio
25 to 28 February 17270.50
14 to 17 April 1843.70.57
25 April 1950.40.39

