Article

Evaluation of Noah-MP Land-Model Uncertainties over Sparsely Vegetated Sites on the Tibet Plateau

1
State Key Laboratory of Severe Weather, Chinese Academy of Meteorological Sciences, Beijing 100081, China
2
National Center for Atmospheric Research, Boulder, CO 80302, USA
*
Author to whom correspondence should be addressed.
Atmosphere 2020, 11(5), 458; https://doi.org/10.3390/atmos11050458
Submission received: 1 April 2020 / Revised: 24 April 2020 / Accepted: 29 April 2020 / Published: 30 April 2020
(This article belongs to the Section Biosphere/Hydrosphere/Land–Atmosphere Interactions)

Abstract

:
The water budget and energy exchange over the Tibetan Plateau (TP) region play an important role on the Asian monsoon. However, it is not well presented in the current land surface models (LSMs). In this study, uncertainties in the Noah with multiparameterization (Noah-MP) LSM are assessed through physics ensemble simulations in three sparsely vegetated sites located in the central TP. The impact of soil organic matter on energy flux and water cycles, along with the influence of uncertainties in precipitation are explored using observations at those sites during the third Tibetan Plateau Experiment from 1August2014 to31July2015. The greatest uncertainties are in the subprocesses of the canopy resistance, soil moisture limiting factors for evaporation, runoff (RNF) and ground water, and surface-layer parameterization. These uncertain subprocesses do not change across the different precipitation datasets. More precipitation can increase the annual total net radiation (Rn), latent heat flux (LH) and RNF, but decrease sensible heat flux (SH). Soil organic matter enlarges the annual total LH by ~26% but lessens the annual total Rn, SH, and RNF by ~7%, 7%, and 39%, respectively. Its effect on the LH and RNF at the Nagqu site, which has a sand soil texture type, is greater than that at the other two sites with sandy loam. This study highlights the importance of precipitation uncertainties and the effect of soil organic matter on the Noah-MP land-model simulations. It provides a guidance to improve the Noah-MP LSM further and hence the land-atmosphere interactions simulated by weather and climate models over the TP region.

1. Introduction

This study is a follow-up on our previous work [1] investigating uncertainties in the Noah with multiparameterization (Noah-MP) land surface model (LSM)simulation for a single cropland site at the southeastern edge of the Tibetan Plateau (TP). Here, we extend the modeling and analytical framework of Zhang et al. [1] to three sparsely vegetated sites in the central TP because multiple-site, year-long surface-flux observation data from the third TP experiment that recently became available [2]. These data allow for this type of investigation to be conducted in the data-scarce TP region.
Different parameterization schemes are employed in LSMs to represent subprocesses such as evaporation (LE), runoff (RNF), and canopy resistance. However, there are great simulation uncertainties when using different schemes for the same subprocess [1,3,4,5]. Model uncertainty evaluation plays a very important role in LSM development. Zhang et al. [1] systematically assessed the uncertainties in the Noah-MP simulations for a cropland site and identified the crucial subprocesses contributing to uncertainties for that site. The climate regime and land cover types in the southeastern edge of the TP are different from those in the central TP, where alpine grassland is the dominant land cover type. Thus, it is necessary to investigate the uncertainties of Noah-MP for these sparsely vegetated sites.
The complex land–atmosphere interaction in the TP not only plays a key role in the surface energy and hydrological processes in the TP but also affects the weather and climate in China, East Asia, and even the entire Northern Hemisphere [6,7,8]. Moreover, the plateau ecosystem is very vulnerable and sensitive to climate changes because of its high elevation [9]. The TP is characterized by strong solar radiation and relatively low temperature, which provides an opportunity to study water budget and energy exchange of alpine grassland in the unique environment. However, the water budget and energy exchange in the TP are not well presented in the current LSMs [10,11,12], including underestimation of the soil liquid water (SLW) and substantial errors in sensible heat flux (SH) and energy partition in the winter time [11], and the uncertainty in simulated turbulence fluxes resulted from the uncertainty in the near-surface forcing data [1,13].
The partitioning of precipitation into evapotranspiration (ET) and RNF at the land surface is controlled by the atmospheric boundary layer and terrestrial hydrological processes [14]. The factors affecting heat flux variability include variability in atmospheric forcings and land surface characteristics [15]. The near-surface forcing data and soil initial states significantly affect the performance of LSMs [1,16,17,18]. There are great discrepancies in precipitation among different datasets [1,19], which exert a greater impact on the general performance of the Noah-MP ensemble simulations than the other LSM parameters, such as leaf area index (LAI) [1]. ET provides water vapor from the land surface to the atmosphere and affects the stability of the planetary boundary layers and precipitation initiation [3,20]. Therefore, it is important to investigate the distribution of precipitation between the ET and RNF in LSMs.
Measurements indicate that the topsoil of alpine grasslands in the central TP contains high soil organic matter [12]. The thermal and hydraulic properties of organic soil differ significantly from those of mineral soil. With low thermal conductivity and relatively high heat capacity, organic soil modulates the transfer of energy down into the soil during spring and summer, out of the soil during fall and winter and usually leads to lower soil temperatures in summer but higher temperatures in winter [21]. The higher soil organic matter content in the topsoil than in the underlying soil layers leads to higher soil porosity, lower thermal conductivity and bulk density in the topsoil. Evaluations of three LSMs on the TP confirm that the soil stratification induced by soil organic matter should be considered in an LSM to represent its impacts on soil properties and thus on energy and water vapor exchanges [11,22,23]. The soil organic matter within the topsoil has an important impact on changing the profile of soil moisture in the center [3]. However, in the default Noah-MP LSM, the soil organic matter is not yet to be incorporated.
We have assessed the uncertainties in the Noah-MP ensemble simulations of a cropland site in the southeastern edge of Tibetan Plateau [1]. The goal of this study is to investigate the following aspects:
  • What is the relative contribution of precipitation-forcing uncertainty to the overall uncertainty range of Noah-MP simulations?
  • What are the most sensitive physical parameterization for different sites in the alpine region?
  • How do the precipitation uncertainty and soil organic matter impact the energy flux and runoff?
In this paper, the same modeling and analytical method as Zhang et al. [1] is employed to identify the subprocesses in which there are great uncertainties and the optimal parameterization schemes for sparsely vegetated sites in the Noah-MP LSM. The soil organic matter is incorporated into the Noah-MP LSM, and its impact on the hydrological cycles and the uncertainties in precipitation are investigated based on optimal scheme selection. The subprocesses selected for uncertainty assessments are the same as those in the study of Zhang et al. [1], including canopy stomatal resistance (CRS), associated soil moisture limiting factor (BTR), runoff and groundwater (RUN), surface exchange coefficient (SFC), frozen soil permeability (INF), supercooled liquid water in frozen soil (FRZ), snow surface albedo (ALB), and the lower boundary of soil temperature (TBOT). For each subprocess, there are two or three available parameterization schemes. For more details, readers are referred to Table 1 in Zhang et al. [1].
Since the land–atmosphere interactions on TP play an important role in the formation of the Asian monsoon, such a study could provide a guidance for the researchers to improve the Noah-MP LSM and hence the land–atmosphere interactions simulated by weather and climate models over the TP region.

2. Data and Methods

2.1. Site Description and Measurements

The Amdo (32.24° N, 91.62° E), Nagqu (31.37° N, 91.90° E), and Baingoin (31.42° N, 90.03° E) Ecosystem Research Stations selected in this study are located in the central TP, as presented in Figure 1. The land cover types are all alpine grassland at these three sites. The canopy height of alpine grassland is usually 3–4 cm [24]. The precipitation mainly occurs during the monsoon season, which is July–September. The accumulated precipitation from 1 August 2014 to 31 July 2015 is ~186–735 mm, as shown in Table 1. There are great uncertainties in precipitation among in situ measurements, automatic weather station (AWS) hourly observations from the National Meteorological Information Center of China, and the latest climate reanalysis produced by the European Centre for Medium-Range Weather Forecasts (i.e., ERA5 by ECMWF) precipitation data. ERA5 was produced using 4D-Var data assimilation in CY41R2 of ECMWF’s integrated forecast system (IFS), with 137 hybrid sigma/pressure (model) levels in the vertical, with the top level at 0.01 hPa. ERA5 provides hourly estimates of a large number of atmospheric, land and oceanic climate variables. The data cover the Earth on a 30km grid and combines vast amounts of historical observations into global estimates using advanced modelling and data assimilation systems.The annual precipitation difference can be up to ~216 mm at the Nagqu site between the AWS data and that from insitu measurements, and ~371 mm at the Amdo site between ERA5 and AWS precipitation, as shown in Table 1 and Figure 2.
The in situ measurements during the third TP Experiment (TIPEX III) are taken from 1 August 2014 to 31 July 2015, including surface meteorological data measured by the automatic micrometeorological observing system and flux data measured by the open path eddy covariance system. All the sites used a unified sonic anemometer (CSAT3, Campbell Scientific Inc. Logan, UT, USA) and CO2/H2O open-path gas analyzer (LI-7500, Licor, Lincoln, NE, USA). The gradient meteorological measurement details and soil data sampling characteristics are shown in Table 2. Please refer to Wang et al. [24] for more details. Horizontal wind speed (Ws), air temperature (Ta), and relative humidity (Rh) measured at a height of 1.5 m at the Amdo site and Nagqu site and those at a height of 2 m at the Baingoin site are used in this study. The 0–1 m total soil moisture is calculated by the soil moisture at relative depth multiplying the corresponding soil depth.

2.2. Numerical Experiments

Hourly in situ measurements of Ta, mixing ratio, Ws, surface pressure (Ps), downward shortwave radiation and longwave radiation from 1 August 2014 to 31 July 2015 are used to drive the Noah-MP LSM (version 3.6) in a single column offline mode. Hourly data from the China Meteorological Administration Land Data Assimilation System version 2.0 (CLDAS) developed by the National Meteorological Information Center of China are extracted to fill the gaps in the insitu measurements at the corresponding times. The CLDAS data in 2013 are used repeatedly throughout the year (from 1 August 2013) to spin up the Noah-MP LSM to ensure the equilibrium soil state [25,26].
There are great uncertainties in the annual accumulated precipitation among the in situ measurements, the AWS dataset, and ERA5 dataset, as shown in Figure 2. The annual total precipitation in the three datasets increases in the order of in situ < AWS < ERA5 for the three alpine grassland sites. Displayed in Table 1, the in situ annual total precipitation is 258.72 mm, 261.84 mm, and 185.70 mm at the Amdo, Nagqu, and Baingoin sites, respectively. The AWS annual total precipitation at the Amdo, Nagqu, and Baingoin sites is larger than insitu precipitation by ~34%, 82%, and 39%, respectively. Table 1 also displays that the ERA5 annual total precipitation at the three sites is larger than in situ precipitation by ~178%, 181%, and 202%, and lager than AWS precipitation by ~107%, 54%, and 162%, respectively.
The monthly amount of AWS precipitation is usually larger than that of the in situ precipitation except for a few months during winter, as shown in Figure 3. ERA5 monthly precipitation is larger than that of AWS precipitation. Most of the precipitation occurs from June to September and especially in August. The monthly total precipitation from the AWS at the Nagqu site in August is up to ~189 mm, which is ~40% of the total annual precipitation.
The land cover types are set to grassland at the three sites in Noah-MP LSM. The MODIS (MOD15A2) 8-day composite LAI data at a 1 km resolution (Oak Ridge National Laboratory Distributed Active Archive Center, Oak Ridge, Tennessee, USA [27]) are used to replace the default LAI for grassland in Noah-MP LSM in this study, as shown in Figure 4.
In the Noah-MP LSM, only the thermal and hydraulic properties of mineral soil are considered. When the soil organic matter is incorporated into the Noah-MP LSM, the bulk thermal and hydraulic properties are computed as averages of the properties of mineral soil and organic matter by the weight of organic matter fraction (fsoc) [28]. For instance, the bulk saturated hydraulic conductivity dksat= dksat,min × (1 − fsoc) + dksat,soc × fsoc, where dksat,min and dksat,soc are the saturated hydraulic conductivity of mineral soil and organic soil, respectively.The thermal and hydraulic parameters for organic soil are set following Lawrence and Slater [28], including soil thermal conductivity, soil heat capacity, the Clapp and Hornberger parameter, porosity, etc.
The volumetric content of soil organic matter at different sites is shown in Table 3. The volumetric content of soil organic matter at the Amdo and Nagqu sites from Chen et al. [12] are consistent with the extracted values from the dataset of Shangguan et al. [29]. The difference is ~ 0.01% (not shown). The first choice for the ensemble simulations is using soil texture and the volumetric content of soil organic matter from site observations in Chen et al. [13], and the dataset from Shangguan et al. [29] is used when there are no observation data at that site (for instance, the Baingoin site). As such, the soil texture types are sandy loam, sand, and sandy loam at the Amdo site, Nagqu site, and Baingoin site, respectively.
Three ensemble simulation sets Ens1, Ens2, and Ens3 (1152 members with the schemes combined freely) with three different precipitation datasets (in situ, AWS, and ERA5) are designed to identify subprocesses with the largest uncertainties at different conditions and extract the optimal schemes for these subprocesses. The sensitivity tests are designed based on a set of optimal schemes with different precipitation datasets and soil organic matter to examine the effects of uncertainties in the forcing data and the soil organic matter on model simulations. A summary of these tests is shown in Table 4.

3. Results

3.1. Uncertainty Analysis of Noah-MP for TP Sparsely Vegetated Sites

The root-mean-squared-error (RMSE), bias, and index of agreement (IOA) for SH and latent heat flux (LH) of each member in Ens1–Ens3 is computed. The distribution of the maximum, minimum, 5% percentile, 95% percentile and median values of these statistics in Ens1-Ens3are shown in Figure 5. The RMSEs in each ensemble experiment disperse widely for SH and LH. The span of RMSEs at the Nagqu site is up to ~105 Wm−2 for SH in Ens1 as displayed in Figure 5a, and ~41 Wm−2 for LH in Ens2as shown in Figure 5b. For the different precipitation datasets, there are great discrepancies between the median values of RMSEs for SH and LH at the three sites. However, the RMSEs uncertainty has little change across Ens1–Ens3 for each site, except that the dispersion of the RMSEs in Ens3 at the Amdo site becomes narrower. The dispersion of RMSEs for both SH and LH is smallest at the Amdo site in Ens3. Generally, the RMSE decreases in the order of Ens1>Ens2>Ens3as shown in Figure 5a,b, except that the RMSEs for SH in Ens2 at the Amdo site shown in Figure 5a, and the RMSEs for LH in Ens3 at the Baingoin site shown in Figure 5b are the largest. The RMSEs of SH at the Amdo site, and that of LH at the Baingoin site are the smallest compared to those of the other sites. The trend of biases is following that of RMSEs, but the dispersion of biases for LH is smaller, as shown in Figure 5c,d. In general, SH are overestimated but LH are underestimated in Noah-MP at the three sites. AWS and ERA5 precipitation could decrease these errors but not the dispersion. The IOA values for LH are larger than those of SH at the Amdo site and Baingoin site, but smaller at the Nagqu site, as displayed in Figure 5e, f. In general, the IOA values increase in the order of Ens1 < Ens2 < Ens3, except the IOA for SH in Ens2 at the Amdo site which is the smallest compared to those in Ens1 and Ens3. Since the closer value of IOA to 1, the better the simulations, the increase of IOA in Ens1–Ens3 indicates that more precipitation usually improves the model simulations—especially the LH simulations, as shown in Figure 5f.In general, more precipitation amount could decrease RMSEs and biases and improve the IOA, but not the dispersion (i.e., the uncertainties).
The natural selection approach used in our previous work is employed in this study [1]. The RMSEs are sorted in ascending order and the members below the 5th percentile (“best members”) and above the 95th percentile (“worst members”) are chosen for Ens1–Ens3. The times of a given scheme for each subprocess (i.e., the selected frequency) occurring in the best members and worst members are summed.
The selected frequencies of each scheme in “best members” and “worst members” for SH and LH at different sites with in situ precipitation in Ens1 are shown in Figure 6. At all three alpine grassland sites, there are significant differences in the selected frequency of schemes for subprocesses of CRS, BTR, RUN and SFC for SH and LH as shown in Figure 6, indicating great uncertainties in schemes for these four subprocesses. The selected frequencies of INF for SH are also presented uncertainties at some degree. There are no great differences between the frequencies of the available schemes for FRZ, RAD, ALB, and TBOT, indicating that the different schemes could not lead to distinctly different model behavior. From Figure 7 and Figure 8, the main uncertainties of selected frequencies for different schemes occurred in the subprocess of CRS, BTR, RUN and SFC. This indicates that the different precipitation datasets do not change the uncertainties of the subprocesses, consistent with the above analysis shown in Figure 5 to some degree.

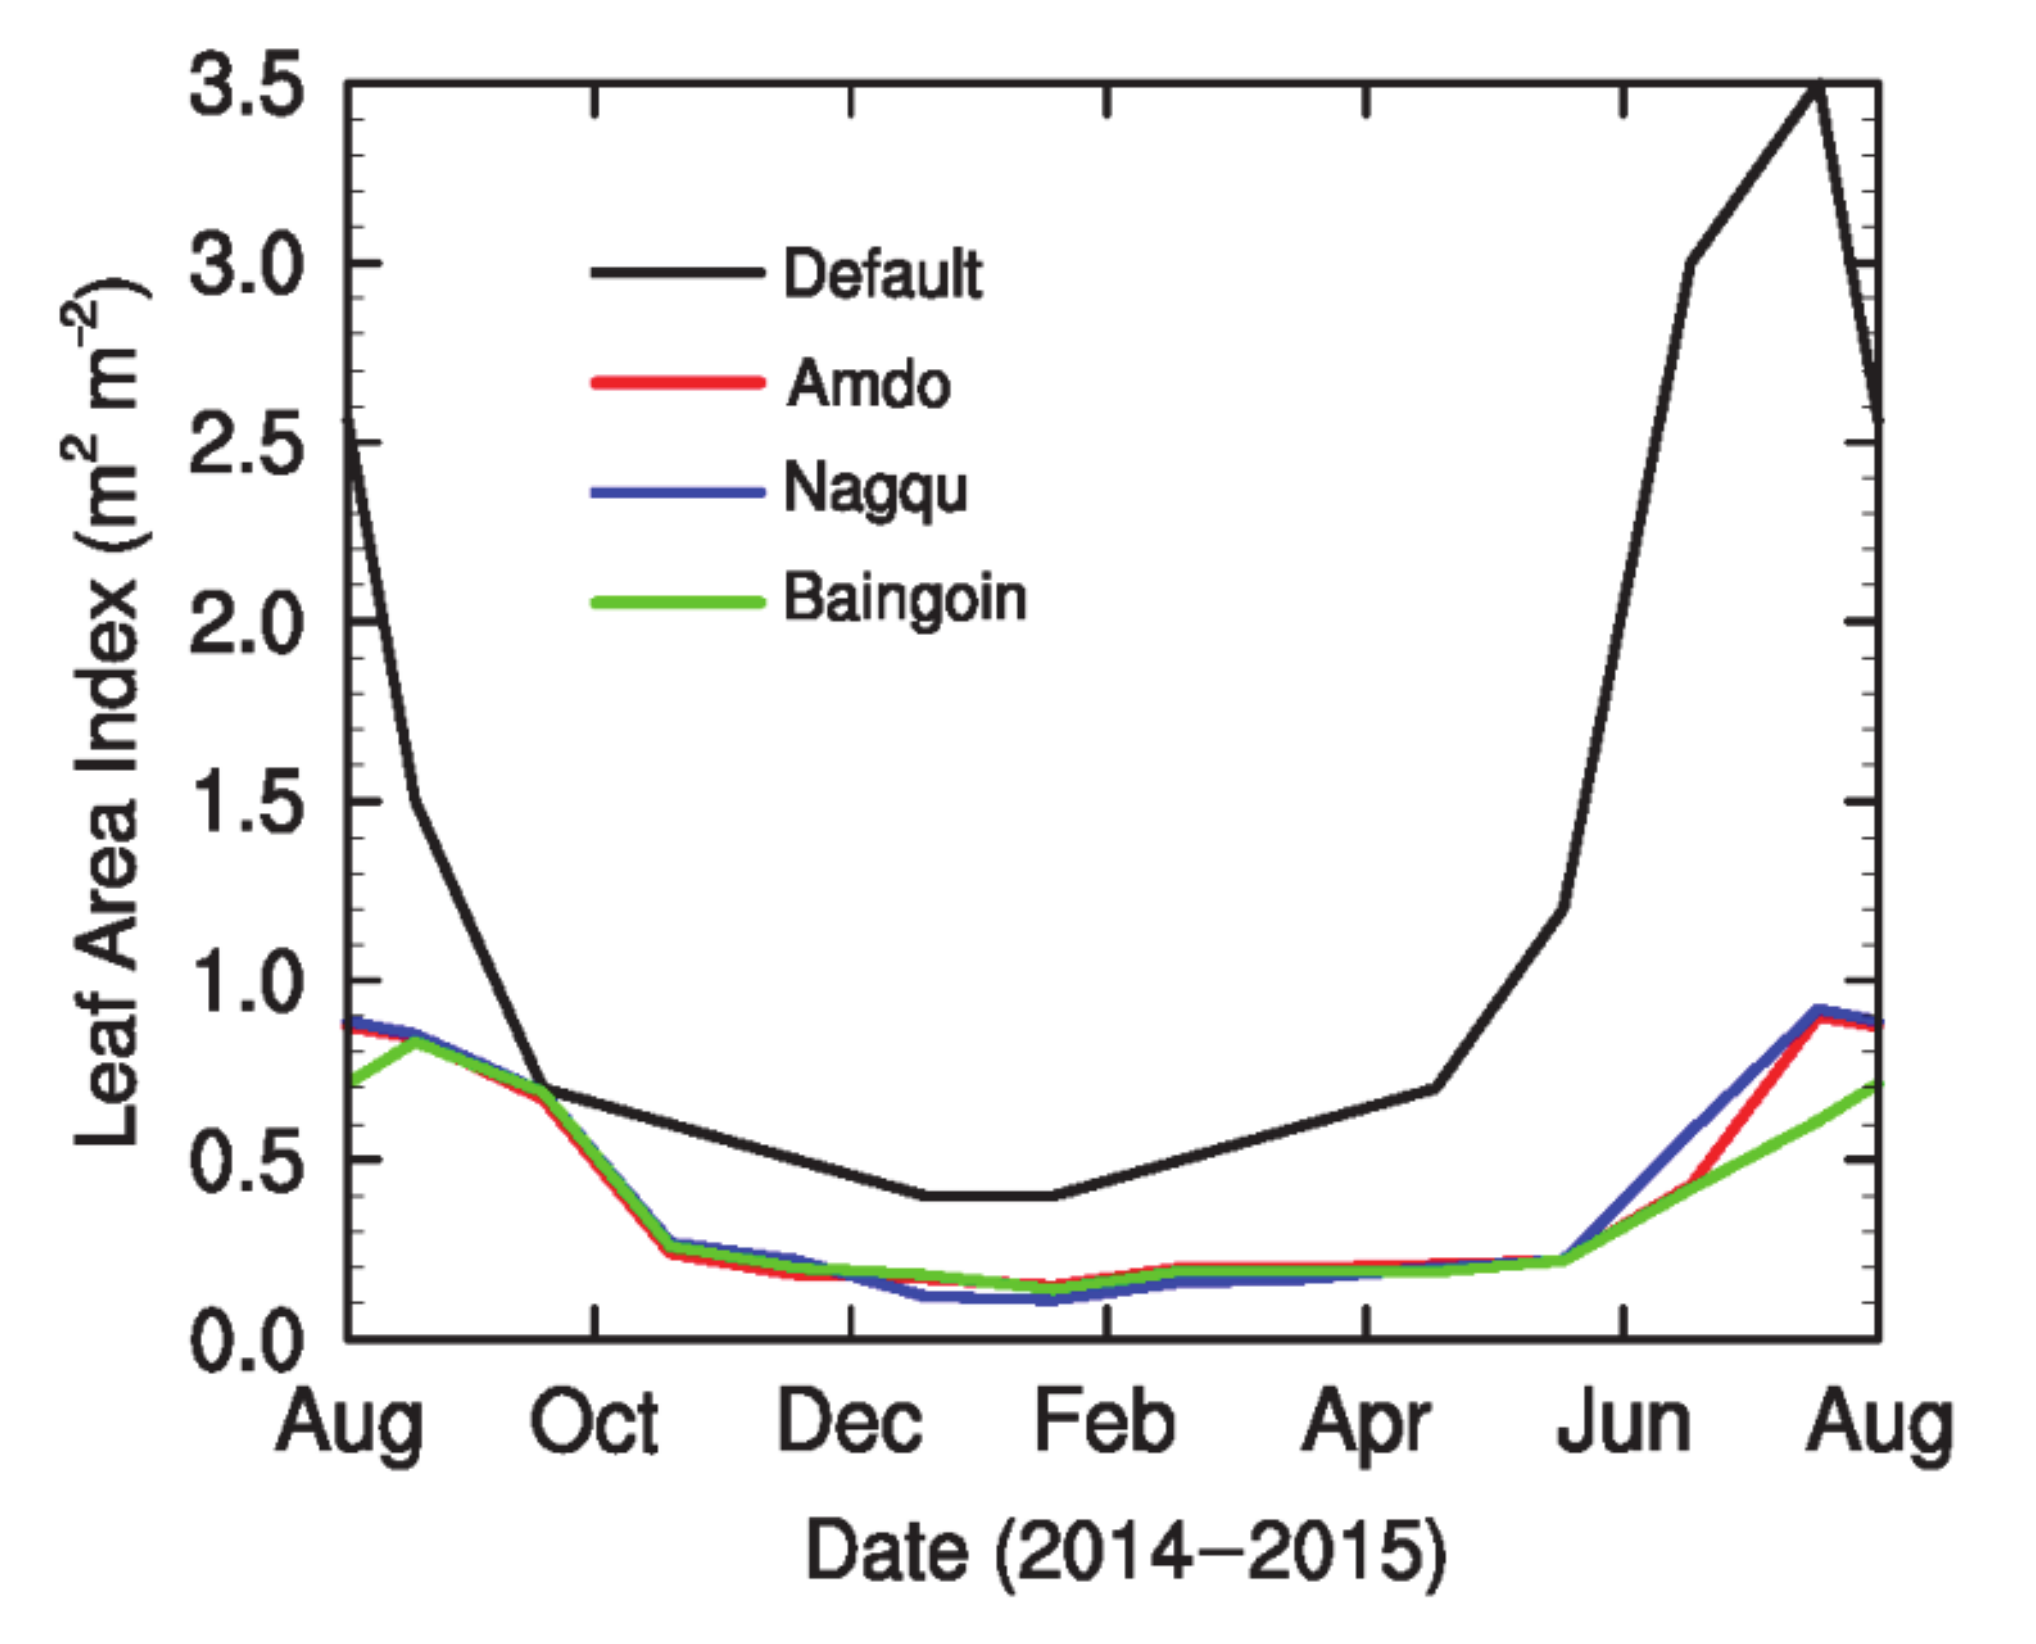
3.2. Noah-MP Optimal Parameterization Schemes and Simulations for TP Sparsely Vegetated Sites

Since there are no big differences between the selected frequencies in the schemes for the subprocesses FRZ, RAD, ALB, and TBOT, here we only analyze the subprocesses with great uncertainties, i.e., CRS, BTR, RUN, SFC, and INF:
CRS (1) (the Ball-Berry scheme) considers photosynthesis rates, but CRS (2) (the Jarvis scheme) is simpler and considers the meteorological variables. Generally, CRS (2) performs better than CRS (1) for SH and LH simulations at the three alpine grassland sites regardless of the precipitation data, except CRS (1) is better at the Baingoin site for the LH simulation in Ens3 with in ERA5 precipitation, as shown in Figure 8f.
BTR is generally crucial during the dry-down period [30].BTR (1) uses the Noah-type soil moisture threshold [31,32], and BTR (2) uses the CLM-typematric potential [33]to define when the transpiration ceases. BTR (1) is better for the SH simulation at the Nagqu site and Baingoin site (Figure 6c,e)and the LH simulation at the Nagqu site (Figure 6f) when the in situ precipitation is used. However, BTR (2) performs better than BTR (1) when the annual precipitation amount is larger in AWS dataset, which is consistent with the report of Gayler et al. [34]. However, the uncertainties between the two schemes for BTR at the Amdo site and Baingoin site when using the ERA5 precipitation are not significant as those at other conditions, and BTR (1) presents slightly larger chances in the selected frequencies. The effect of different soil moisture factors depends on the relative contribution of direct soil evaporation, canopy interception evaporation, and plant transpiration [1]. The optimal schemes vary with different precipitation data, which is likely a result of transpiration becoming more sensitive to soil moisture changes at the Nagqu site in Ens1 because there is much less in situ precipitation than the AWS and ERA5 precipitation.
The subprocess of RUN shows great uncertainties among different schemes at these three dry climate sites due to its dominant role in controlling soil moisture and ET [35,36,37]. Among the three schemes, RUN (1) produces has the largest chance producing the better simulations with in situ precipitation, as shown in Figure 6. However, using the AWS and ERA5precipitation reduces the uncertainties among different schemes for RUN, as displayed in Figure 7 and Figure 8. The drained water in RUN (1) could accumulate in its underlying aquifer during the wet seasons and then recharge the 2m soil column by capillary forces in the dry seasons [2], while RUN (3) does not have this recharge capability. It is reasonable to expect that RUN (1) will perform better under dry climate conditions. However, when the precipitation is sufficient for water consumption, the impact of the aquifers is reduced.
Generally, SFC (2) is superior to SFC (1) for SH and LH with in situ precipitation (although not for LE at the Nagqu site shown in Figure 6d). This is true when using different precipitation datasets (except for LH at the Baingoin site with ERA5 precipitation) and consistent with the reports of Zhang et al. and Hong et al.[1,38].
The subprocess INF is only crucial for SH. With the in situ precipitation, INF (1) performs better than INF (2) at the Amdo site, but INF (2) performs better at the other two sites. When using the AWS and ERA5 precipitation, INF (1) becomes better, as shown in Figure 7a, Figure 8a,c. INF (1) uses the total soil moisture to compute the hydraulic properties of the soil, assuming that the soil ice has a linear (weaker) effect on infiltration, but INF (2) uses only the SLW volume to compute the hydraulic properties, assuming that the soil ice has a nonlinear (greater) effect on soil permeability. Therefore, the effects of these two different schemes depend on the precipitation input to the soil and the amount of soil ice.
Based on the analyses above, the optimal schemes are selected for subprocesses including CRS, BTR, RUN, SFC, and INF mainly based on the results from the natural selection in Ens1, Ens2 and Ens3, as shown in Figure 6, Figure 7 and Figure 8. An optimal scheme would perform better with all three precipitation conditions. When two schemes out of three behave similarly, we exclude the one that behaves the worst in one condition. For instance, RUN (1) and RUN (3) behave similarly in most conditions but RUN (3) has the largest chance of producing the worse simulation in Figure 6c,d, and Figure 8f; then, RUN (1) is chosen. As such, the optimal schemes for CRS, BTR, RUN, and SFC are CRS (2), BTR (2), RUN (1), and SFC (2), respectively. It is hard to decide which scheme is better for INF. INF (1) is chosen majorly based on the selected frequencies for best and worst members in Ens3. Therefore, the optimal scheme set in this study is generally consistent with the results from the proposed optimal schemes at a crop site [1]. The only difference is that BTR (2) is chosen here, but BTR (1) was chosen in the study of Zhang et al. [1].
Using the above optimal Noah-MP schemes, further analyses are conducted to evaluate the impact of precipitation. In Figure 9, Figure 10, Figure 11, Figure 12 and Figure 13, all the energy flux terms are converted to water equivalent (mm) by using the formulation from Stull [39]. For instance, LH (mms−1) = LE (Wm−2)/Lv, where Lv (J kg−1) = (2.501−0.00237 × Ta) × 106 (Ta is air temperature in Celsius). These converted water-equivalent quantities from energy flux only provide a rough estimate for the hydrology comparisons and the energy terms for daytime observations (10 a.m. to 15p.m. for local time) are used.
The experiment CTL, which is the Noah-MP with the optimal scheme set using in situ precipitation, generally produces the pattern of Rn shown in Figure 9. However, it overestimates monthly Rn almost every month at the Amdo site, leading to the overestimation of the annual total Rn by ~23% at the Amdo site as shown in Figure 10. The Rn simulations at the Nagqu site and Baingoin site agree well with the observations.
The CTL experiment overestimates SH from June to September at the Amdo site, but the overestimation occurs two months earlier at the Nagqu site (second row of Figure 9), and the SH at the Baingoin site is overestimated during the whole year. The annual total SH produced by the CTL experiment at the Amdo sites is slightly overestimated. However, Figure 10 shows that CTL overestimates the accumulated SH by ~44% and ~66% at the Nagqu and Baingoin sites, respectively.
In general, LH is underestimated at these three sites, especially at the Nagqu site, as shown in Figure 9. Figure 10 shows that the annual total LE is underestimated by ~36%, 51%, and 14% at the Amdo, Nagqu, and Baingoin sites, respectively.
The monthly total RNF is small at these three sites, as shown in Figure 9. The accumulated RNF ranged from ~25 mm to ~48 mm in the CTL experiment, as displayed in Figure 10. The ratios of annual total RNF to the annual precipitation in CTL are ~11%, 18%, and 14% at the Amdo, Nagqu, and Baingoin sites, respectively.
The experiment CTL underestimates the 0–1-m total SLW at the Nagqu site for the whole year. However, the SLW is significantly overestimated at the Amdo and Baingoin sites during the whole year as displayed in Figure 9 and Figure 10.

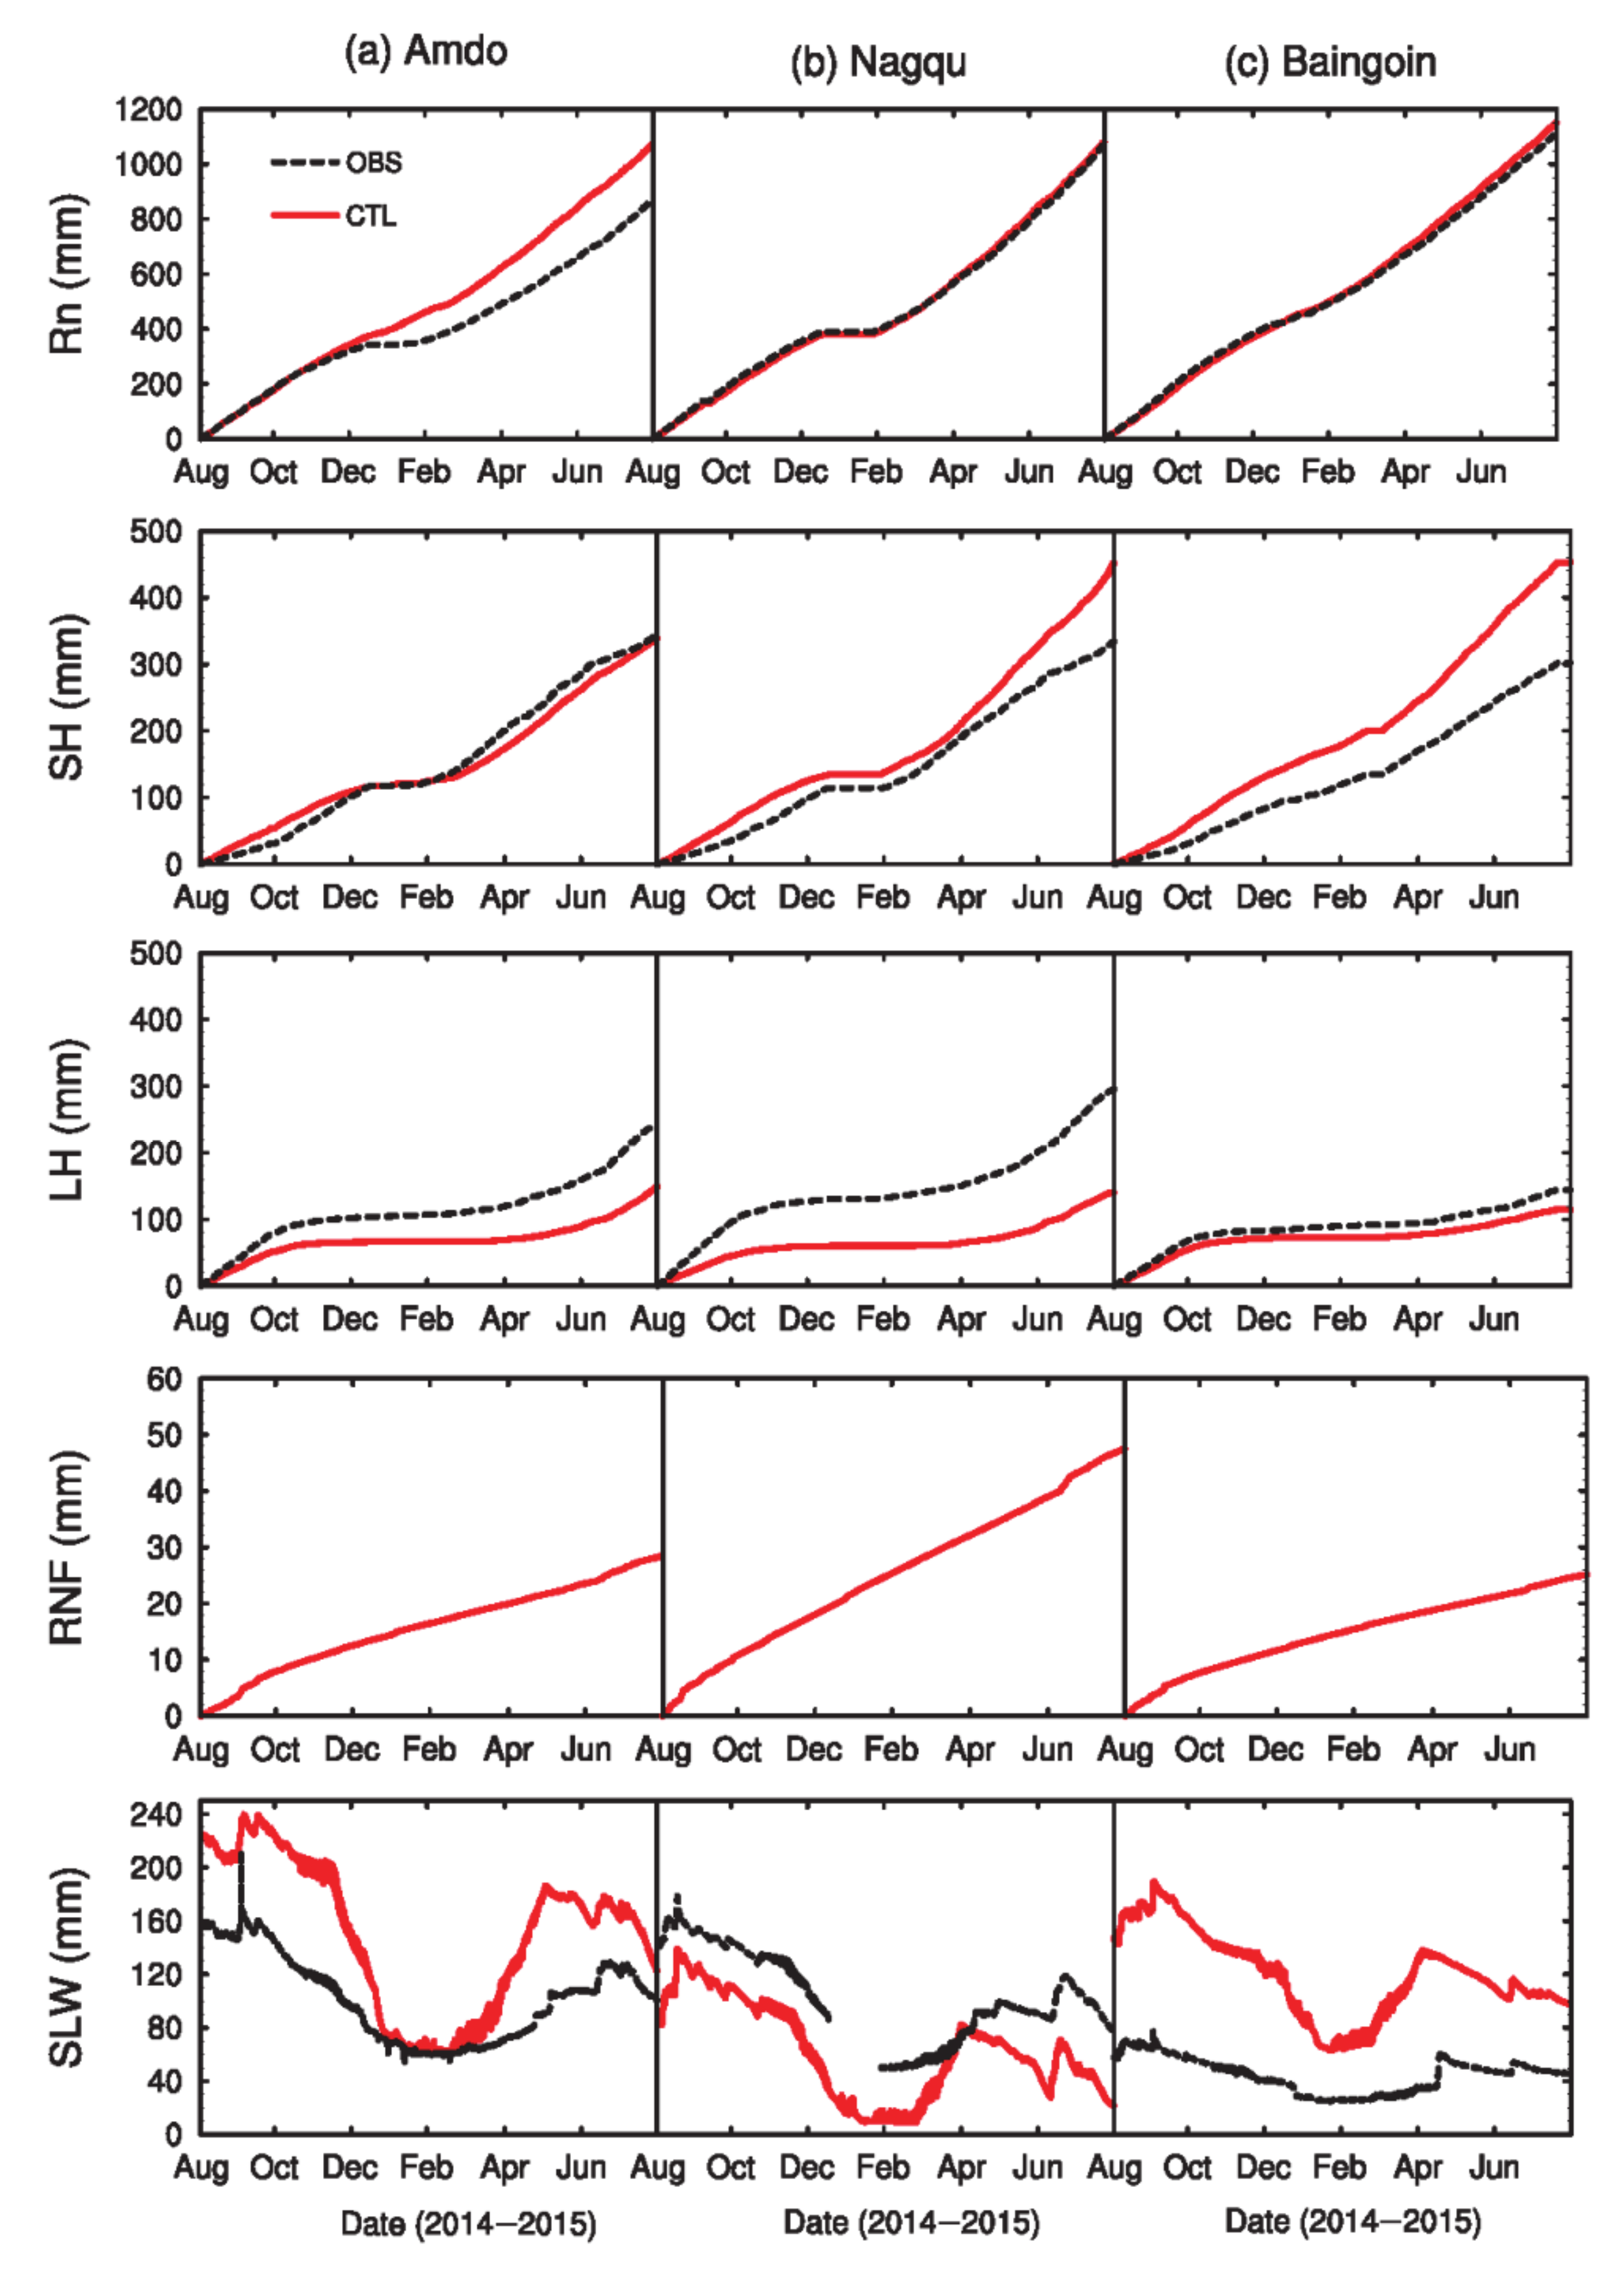
3.3. Impact of Precipitation Uncertainty on theSurface Hydrologic Cycle Simulated with Optimized Noah-MP

Further analyses are conducted to evaluate the impact of precipitation. Note that we examine the simulation difference between CTLAP and CTL, CTLEP and CTLAP, SOMAP and SOM, SOMEP and SOMAP by increasing the precipitation gradually, in which we assume the difference only caused by the precipitation difference. For instance, through the comparison of CTLAP and CTL (red lines), the simulation difference caused by the difference between AWS and in situ precipitation are explored, and through the comparison of CTLEP and CTLAP (green lines), the simulation difference caused by the difference of ERA5 and AWS precipitation are explored. Through the comparisons of SOMAP and SOM (blue lines), SOMEP and SOMAP (purple lines), the effects of precipitation differences are examined with the soil organic matter incorporated, as shown in Figure 11.
The precipitation changes directly affect the input to the soil surface. Therefore, the monthly changes in SLW are similar to those of precipitation, shown in Figure 3b,d and f and last row of Figure 11. More precipitation in the AWS dataset compared to insitu precipitation keeps the soil moister in summer at these three alpine steppe sites. AWS precipitation increased the SLW by up to ~35 mm month−1. The soil organic matter has little impact on the SLW except for at the Nagqu site, where soil organic matter increases the SLW for most months (by approximately ~60 mm month−1).While the increase in precipitation between ERA5 and AWS increases the SLW at the Amdo and Baingoin sites by up to ~120 mm month−1 from April to November, it only increases the SLW by at most ~90 mm month−1during the period of April–July at the Nagqu site.
The increase in soil moisture leads to the decrease in albedo (not shown), which results in the increased Rn (although not for the comparison of CTLEP and CTLAP at the Amdo site; the first row of Figure 11). Note that there is a big drop of Rn in January or February (~10–20 mm month−1) at these three sites, especially at the Amdo site (the first row of Figure 11). There is a one-month lag at the time that the drop occurs in the comparisons of CTLEP and CTLAP. At the corresponding time, the albedo increases sharply and then decreases in the following period because of the snowmelt (not shown). This is probably due to the snow at the three sites in January in the AWS and ERA5 dataset compared to little snow in the in situ precipitation datasets used in CTL. Generally, the effect of precipitation on Rn simulations with the soil organic matter is not changed. The soil organic matter only weakens the jump of Rn in February at the Amdo site, as shown in Figure 11.
The SH differences between different comparisons track those of Rn difference at the three sites, except for the opposite pattern of SH which changes for the period from March to July at the Nagqu site and Baingoin site (the second row of Figure 11). Therefore, more increased available radiation is distributed to the LH during the growing season, excluding the comparison of CTLEP and CTLAP at the Nagqu site. More precipitation increases the LH by up to ~35 mm month−1 during the growing season. The more precipitation has a similar effect on Rn, SH and LH with the soil organic matter considered, as shown in Figure 11.
At the Nagqu site, compared to the insufficient precipitation in CTL, the relatively small increase of precipitation in CTLAP results in the increase of LH during the growing season from May to July, and then it results in mainly an increase in RNF from August to October (red line in the 3rd row of Figure 11). Under this condition, the incorporation of soil organic matter reduces the partition of precipitation to the RNF, increases the precipitation partition to the SLW at the Nagqu site (sandy soil) and has little effect at the Amdo and Baingoin sites (blue line vs. red line in Figure 11). When further precipitation in ERA5 used in CTLEP is compared to the AWS precipitation in CTLAP, a greater proportion of precipitation is distributed to the RNF at the Nagqu site, but to the SLW at the Amdo and Baingoin sites (green and purple lines). Under this condition, the incorporated soil organic matter decreases the RNF and increase the partition of precipitation to LH (purple line vs. green line).
The RNF increases with precipitation. However, the changes are slight while using in situ and AWS precipitation, except at the Nagqu site as shown in Figure 11. The infiltration rate of the soil is related to the saturated hydraulic conductivity (dksat). The dksat of sand (Nagqu site) is one order of magnitude greater than sandy loam (the other three sites). Therefore, with sufficient precipitation, the RNF difference between the Nagqu site and other sites becomes larger (the fourth row in Figure 11).

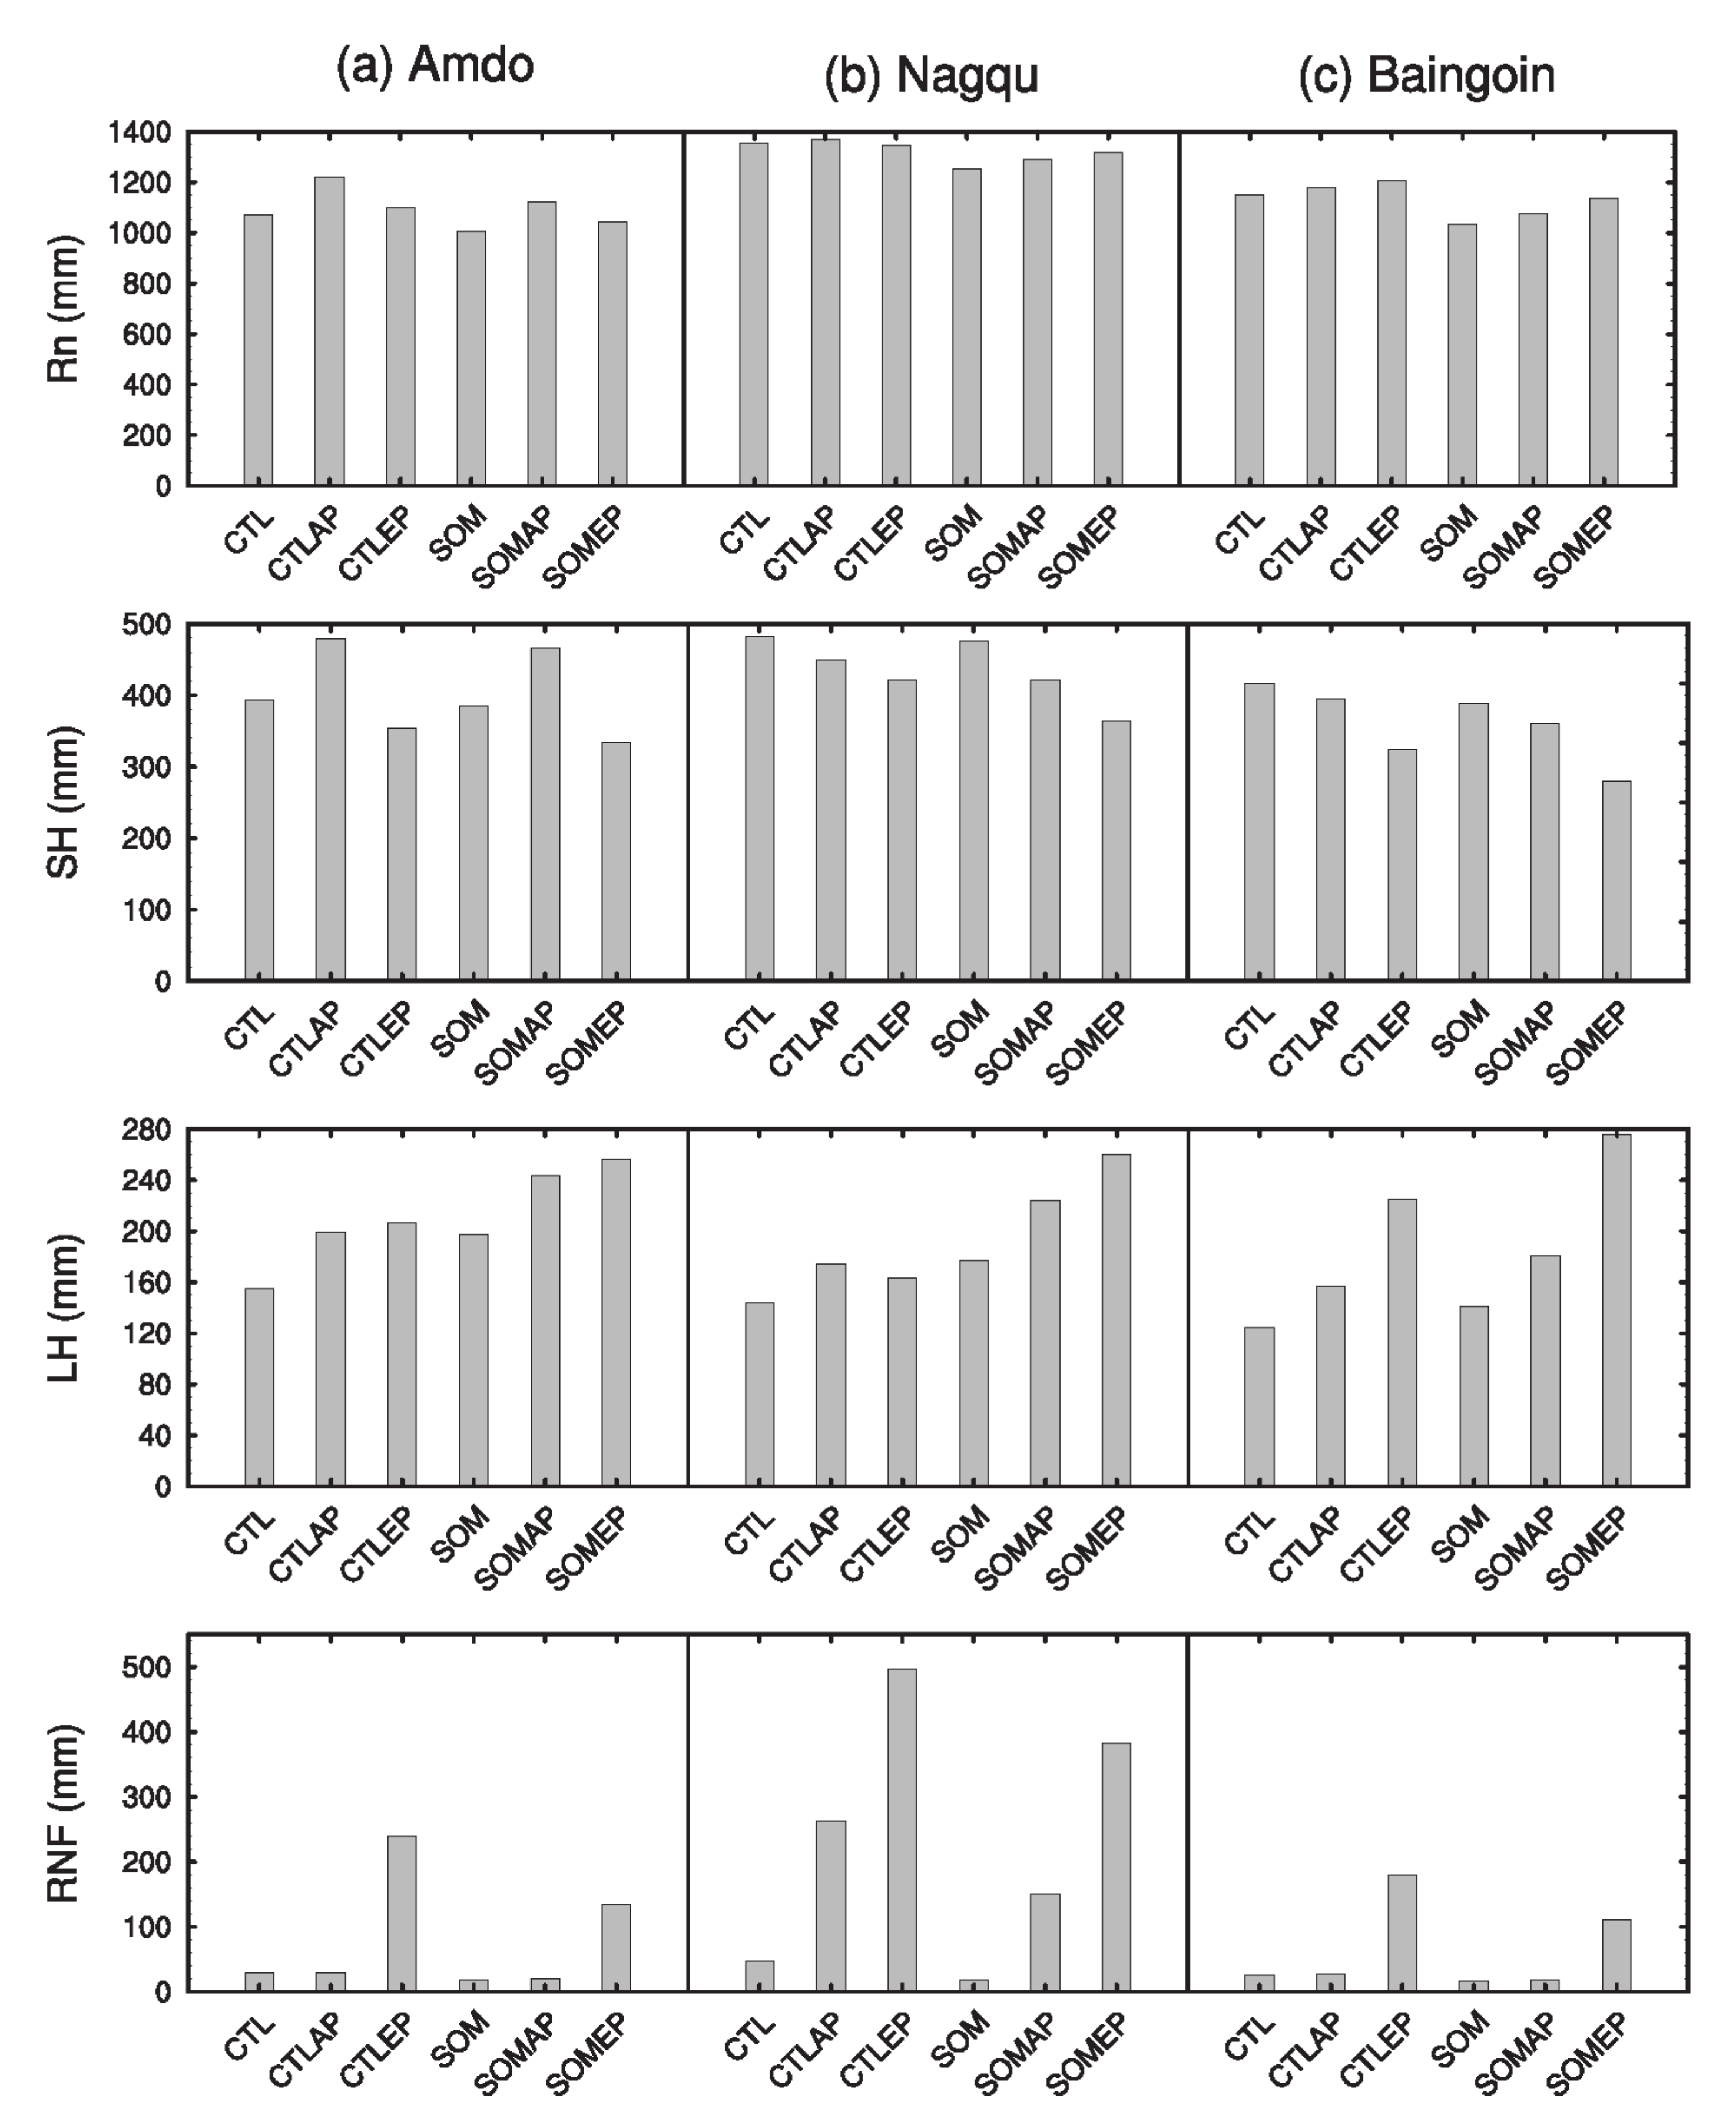
3.4. Impact of Soil Organic Matter on Simulated Surface Hydrologic Cycle

The effects of soil organic matter on monthly Rn changes are generally similar at these three sites, as shown in Figure 12. These effects cause a decrease of Rn, especially for the period from March to June (by ~10–20 mm month−1). The more precipitation weakens this trend. For instance, by the comparison of SOMEP and CTLEP, the Rn decreased by ~5–10 mm month−1. However, the Rn increases sharply in February in SOM compared to CTL at the Amdo site. The Rn changes are closely correlated with those of SLW due to the effect of SLW on surface albedo. The reduction in SLW from April to July leads to the increase in albedo (not shown) and thus a reduction in Rn. Lawrence and Slater [28] found that the winter temperature is slightly warmer due to the insulative properties of organic soil because it does not cool as efficiently as it does during fall and winter. The increased amplitude of monthly soil temperature at the Amdo site is up to 3–4 K larger than those at the Nagqu site and Baingoin site in the freezing period. This results in a larger increase in SLW at the corresponding time and a larger reduction in albedo (not shown). Therefore, there is a sharp jump in Rn difference between SOM and CTL in February at the Amdo site when the in situ precipitation is used. Soil organic matter increases the SLW from December to March but decreases it sharply from April to October. The changes in SLW from August to November at the Nagqu site are different. The reason for this difference is probably that the hydraulic properties of sand are quite different from those of sandy loam at the other two sites.
The organic soil decreases the SH by ~5–15 mm month−1for most months (the second row of Figure 12). The changes in SH follow those of Rn well, especially at the Amdo sites. However, the SH changes at the Nagqu site and Baingoin site show an opposite pattern to those of the Rn change from March to July.
Organic soil does not greatly impact LH from November to February at all three sites (3rd row in Figure 12). The greater SLW accumulation in winter provides more available soil water for LH in the spring. The increase in LH (~5–10 mm month−1) consumes more soil water, which leads to a decrease in SLW in the spring (the fifth row of Figure 12). The greater increase in LH in the spring and the decrease in June or July with in situ and AWS precipitation are consistent with other results [4], which found that in the transient season, soil organic matter can produce higher LH after thawing but lower LH in the monsoon season. Lawrence and Slater [28] also found that in the wet season, soil evaporation (and LH) is generally lower with organic soils. The decrease in soil evaporation can lead to enhanced soil water accumulation and storage during the wet season, followed by increased soil evaporation during the dry season. However, when using the ERA5 precipitation, the LH always increases even in the monsoon season. The reason is probably that the decreased RNF allows more precipitation in ERA5 available for LH.
Soil organic matter always suppresses the RNF, but the absolute values are small, except for when using the AWS and ERA5 precipitation at the Nagqu site. When there is enough precipitation at the Nagqu site, the reduction in RNF is particularly significant (~20–70 mm month−1) (the fourth row of Figure 12). However, larger portion of increased precipitation resulting from the decrease in RNF is not distributed to LH but mainly to SLW at the Nagqu site, as shown in Figure 12.

3.5. The Effects ofPrecipitationand Soil Organic Matter on Annual Total Values

The annual total amount of Rn, SH, LH, and RNF (in water equivalent) for the period of1August 2014 to 31 July 2015 from all optimized Noah-MP simulations are summarized in Figure 13 to synthesize various model sensitivity results. Compared to the control simulation (CTL), larger precipitation with different degrees (in CTLAP and CTLEP) increases Rn, with the exception of the Nagqu site in CTLEP. The increase of Rn, which is usually concentrated in wintertime, is larger in CTLAP at the Amdo site (by ~148 mm) than at the other two grassland sites. This leads to the greater jump in SH in January at this site in CTLAP (the second row of Figure 11). Consequently, it offsets the decrease in SH during other periods and results in a modest increase in the annual total SH by ~86 mm at the Amdo site, as shown in Figure 13. Otherwise, the increased Rn (by ~8–56 mm) roughly translates into the increase of LH by ~30–101 mm, and is largely compensated by a reduction of SH (~32–111 mm). By the comparisons between CTLEP vs. CTLAP, the LH decreases from June to August at the Nagqu site (third row of Figure 11). This results in a slight decrease in the annual total LH in CTLEP (by ~9 mm) at the Nagqu site, as shown in Figure 13.
Regarding the water cycle components, larger precipitation results in more RNF only when the precipitation is enough for the consumption of more LH. At the Amdo site and Baingoin site, the RNF increases only in CTPEP while using the ERA5 precipitation. At the Nagqu site, more precipitation in AWS and ERA5 linearly increase the RNF by ~215–450 mm. The ratios of RNF to precipitation are ~10% in CTL and CTLAP, but ~30% in CTPEP at the Amdo site and the Baingoin site. The ratios of RNF to precipitation at the Nagqu site are ~18%, 55%, and 68% in CTL, CTLAP, and CTLEP, respectively. This indicates that a larger partition of precipitation is distributed to the RNF at the Nagqu site. The different distribution ratios of RNF to precipitation indicate the impact of soil texture. The larger infiltration of sand at the Nagqu site, compared to that of sandy loam at the other two sites, increases the underground RNF and consequently suppresses the SLW, as shown in Figure 9 and Figure 10.
With the soil organic matter incorporated, the effects of larger precipitation on energy flux and RNF in comparisons of SOMAP vs. SOM, SOMEP vs. SOM, are similar to those in comparisons of CTLAP vs. CTL and CTLEP vs. CTL. Compared to SOM, larger precipitation in SOMAP and SOMEP increases Rn by ~33–105mm, along with the reduction of SH by ~34–131mm and an increase of LH by ~40–135mm. The larger precipitation increases RNF by ~1–364mm. Organic soil enhances the effects of precipitation on the energy flux but suppress them on the RNF.
The soil organic matter always reduces the annual total Rn, SH, and RNF, and increases the annual total LH (comparisons of SOM vs. CTL, SOMAP vs. CTLAP, and SOMEP vs. CTLEP). However, it does not change the pattern of how the energy flux and RNF change with the increased precipitation, as shown in Figure 13. The soil organic matter under different precipitation conditions reduces the Rn by ~26–119 mm, along with a reduction of SH (~5–58 mm) and an increase of LH (~17–97 mm). The soil organic matter usually suppresses the RNF by ~9–115 mm. At the Amdo site and the Baingoin site, the ratios of RNF to precipitation are ~6–9% in SOM and SOMAP, but ~20% in SOMEP. At the Nagqu site, the ratios are ~7%, 31%, 52% in SOM, SOMAP, and SOMEP, respectively. From the ratios, we can see that the reduction of RNF at the Nagqu site (compared to experiments before soil organic matter is incorporated) is larger than that at the other two sites. This indicates that the effect of soil organic matter on the RNF at the Nagqu site is the greatest. The soil infiltration rate is related to the soil moisture availability, the bulk dksat and the water input to the soil surface. The much larger dksat, min of sand results in a larger opportunity for available water to be distributed to the RNF in the default Noah-MP LSM at the Nagqu site, compared to that of the sandy loam at the Amdo site and Baingoin site. Soil organic matter generates a lower RNF due to the higher water-holding capacity.

4. Discussion

These uncertainty results are consistent with other results [4]. After investigating the impacts of uncertainties in the parameterization schemes of the Noah-MP LSM at 92 sites covering different vegetation and soil texture types, the researchers found that the subprocess of SFC, RUN and surface resistance to evaporation (SRES) have the most significant impacts on the energy fluxes [4]. As only one scheme for the SRES is available in the Noah-MP v3.6 that is used in this study, the impact of SRES is not examined. In their study, only three subprocesses are considered to be the most uncertain because their results should be suitable for all land cover types and climate conditions. Consequently, the most uncertain subprocesses that are only suitable for one land cover type maybe ignored. When assessing the structural uncertainty for Noah-MP modeling over 10 hydrologic regions in China, RUN, SFC and RAD are found to be the most responsive subprocesses for SH and LH [5]. RAD has three schemes to treat the canopy gap with regard to subgrid vegetation distributions. Over the three sparse grassland sites, the vegetation height is rather small, and therefore, it has no big difference whether the solar zenith angle is considered. The uncertainties indifferent schemes for each subprocess in Noah-MP LSM—which are associated with different land cover types, soil types and climate conditions—need more investigation in the future.
The optimal scheme results indicate that CRS (2) performs better than CRS (1), which is different from Gayler et al. [33]. The reason is probably that dynamic vegetation was used in their study [30] but not in this study. Li et al. [4] found that the interaction between different subprocesses should be considered when identifying the optimal parameterization schemes. CRS (1) is most likely more appropriate for dynamic vegetation. SFC (1) accounts for the zero-displacement height (d0), but the SFC (2) accounts for the difference between the roughness lengths for heat and momentum (z0h and z0m) [40]. The use of d0 is more suitable for forest regions, but for short-vegetated sites such as the alpine grassland sites in this study, SFC (2) performs better.
While organic soil results in general improvements to the simulation of surface energy flux and the uncertainties in precipitation are included, some discrepancies remain between observations and simulations. The discrepancies may be caused by deficiencies in the Noah-MP structure and other subprocess parameterizations, such as the surface-layer coefficients, which need to address in future studies.

5. Conclusions

Observations from flux towers at three alpine grassland sites (i.e., Amdo, Nagqu, and Baingoin site) located in central TP from1 August 2014 to 31 July 2015 were used to assess the uncertainties in parameterization scheme combinations of Noah-MP LSM. By using the natural selection, the great uncertain subprocesses of Noah-MP LSM impacting the hydrological component simulations were identified. Based on the identification of subprocesses with great uncertainties and optimal parameterization schemes at these three sites, sensitivity experiments were conducted to explore the impact of soil organic matter on energy flux and water cycles, along with the influence of uncertainties in precipitation. The main findings are summarized as follows:
  • The uncertainty analyses indicated that there are greater uncertainties in the subprocesses of CRS (canopy resistance), BTR (soil moisture threshold for evaporation), RUN (runoff and groundwater) and SFC (surface-layer parameterization) at these three sites by using the natural selection method. The uncertainties in the INF (frozen soil permeability) parameterization scheme are significant for the simulated SH. A larger precipitation amount could decrease RMSEs and biases and improve the IOA but not the dispersion (i.e., the uncertainties of subprocesses do not change with the different datasets).
  • The sensitivity analyses reveal that more precipitation can increase the total annual Rn, LH and RNF, but decrease the total annual SH. It shows ~2% and 34% averaged increases in Rn and LH respectively, but an ~11% reduction in SH. Much more precipitation in ERA5 precipitation could increase the RNF by ~6–9 times.
  • Soil organic matter enlarges the annual total LH by ~26%, but lessens the annual total Rn, SH, and RNF by ~7%, 7%, and 39%, respectively. Its effect on the LH and RNF at the Nagqu site, which has a sand soil texture type, is more significant than that at the other two sites with sandy loam.

Author Contributions

Conceptualization, methodology, formal analysis, and writing, G.Z.; conceptualization, review and editing, F.C.; visualization and investigation, Y.C. and J.L.; review and editing, X.P. All authors have read and agreed to the published version of the manuscript.

Funding

This research is jointly supported by the National Key R&D Program of China (grant 2018YFC1507003), the Basic Research Special Project of the Chinese Academy of Meteorological Sciences (grant 2019Z008), the National Natural Science Foundation for Young Scientists of China (grant 41605073), and S&T Development Fund of CAMS (2020KJ023).

Acknowledgments

We acknowledge the data support from the Chinese Meteorology Administration. All data used in this study are available by contacting the author ([email protected]).

Conflicts of Interest

The authors declare no conflict of interest.

References

  1. Zhang, G.; Chen, F.; Gan, Y. Assessing uncertainties in the Noah-MP ensemble simulations of a cropland site during the Tibet Joint International Cooperation program field campaign. J. Geophys. Res. Atmos. 2016, 121, 9576–9596. [Google Scholar] [CrossRef]
  2. Zhao, P.; Xu, X.; Chen, F.; Guo, X.; Zheng, X.; Liu, L.; Hong, Y.; Li, Y.; La, Z.; Ma, Y.; et al. The Third Atmospheric Scientific Experiment for Understanding the Earth–Atmosphere Coupled System over the Tibetan Plateau and Its Effects. Bull. Am. Meteor. Soc. 2018, 99, 757–776. [Google Scholar] [CrossRef]
  3. Gao, Y.; Li, K.; Chen, F.; Jiang, Y.; Lu, C. Assessing and improving Noah-MP land model simulations for the central Tibetan Plateau. J. Geophys. Res. Atmos. 2015, 120, 9258–9278. [Google Scholar] [CrossRef]
  4. Li, J.D.; Zhang, G.; Chen, F. Evaluation of land surface sub-processes and their impacts on model performance with global flux data. J. Adv. Model. Earth Syst. 2019. [Google Scholar] [CrossRef]
  5. Gan, Y.; Liang, X.Z.; Duan, Q.; Chen, F.; Li, J.; Zhang, Y. Assessment and reduction of the physical parameterization uncertainty for Noah—MP Land Surface Model. Water Resour. Res. 2019, 55. [Google Scholar] [CrossRef] [Green Version]
  6. Gao, Y.; Xiao, X.; Chen, D.; Chen, F.; Xu, J.; Xu, Y. Quantification of the relative role of land surface processes and large scale forcing in dynamic downscaling over the Tibetan Plateau. Clim. Dyn. 2017. [Google Scholar] [CrossRef]
  7. Wan, B.; Gao, Z.; Chen, F.; Lu, C. Impact of Tibetan-Plateau Surface Heating on Persistent Extreme Precipitation Events in Southeastern China. Mon. Wea. Rev. 2017. [Google Scholar] [CrossRef]
  8. Wu, G.; Duan, A.; Liu, Y.; Mao, J.; Ren, R.; Bao, Q. Tibetan Plateau climate dynamics: Recent research progress and outlook. Natl. Sci. Rev. 2015, 2, 100–116. [Google Scholar] [CrossRef] [Green Version]
  9. Gu, S.; Tang, Y.H.; Cui, X.Y. Characterizing evapotranspiration over a meadow ecosystem on theQinghai-Tibetan Plateau. J. Geophys. Res. 2008, 113, D08118. [Google Scholar] [CrossRef]
  10. Yang, K.; Koike, T.; Ye, B.S.; Bastidas, L. Inverse analysis of the role of soil vertical heterogeneity in controlling surface soil state andenergy partition. J. Geophys. Res. 2005, 110, D08101. [Google Scholar] [CrossRef] [Green Version]
  11. Yang, K.; Chen, Y.Y.; Qin, J. Some practical notes on theland surface modeling in the Tibetan Plateau. Hydrol. Earth Syst. Sci. 2009, 13, 687–701. [Google Scholar] [CrossRef] [Green Version]
  12. Chen, Y.; Yang, K.; Tang, W. Parameterizing soil organic carbon’s impacts on soil porosity and thermal parameters for Eastern Tibet grasslands. Sci China Earth Sci. 2012, 55, 1001–1011. [Google Scholar] [CrossRef]
  13. Duan, Y.; Li, F.; Wang, M.; Wu, G. Persistent Weakening Trend in the Spring Sensible Heat Source over the Tibetan Plateau and Its Impact on the Asian Summer Monsoon. J. Clim. 2011, 24, 5671–5682. [Google Scholar] [CrossRef] [Green Version]
  14. Zheng, H.; Yang, Z.-L.; Lin, P.; Wei, J.; Wu, W.-Y.; Li, L.; Zhao, L.; Wang, S. On the sensitivity of the precipitation partitioning into evapotranspiration and runoff in land surface parameterizations. Water Resour. Res. 2019, 55, 95–111. [Google Scholar] [CrossRef]
  15. Yates, D.N.; Chen, F.; LeMone, M.A. A Cooperative Atmosphere–Surface Exchange Study (CASES) dataset for analyzing and parameterizing the effects of land surface heterogeneity on area-averaged surface heat fluxes. J. Appl. Meteor. 2001, 40, 921–937. [Google Scholar] [CrossRef]
  16. Zhang, G.; Zhou, G.; Chen, F.; Barlage, M.; Xue, L. A trial to improve surface heat exchange simulation through sensitivity experiments over a desert steppe site. J. Hydrometeorol. 2014, 15, 664–684. [Google Scholar] [CrossRef]
  17. Ferguson, C.R.; Sheffield, J.; Wood, E.F.; Gao, H. Quantifying uncertainty in a remote sensing-based estimate of evapotranspiration over continental USA. Int. J. Remote Sens. 2010, 31, 3821–3865. [Google Scholar] [CrossRef]
  18. Badgley, G.; Fisher, J.B.; Jiménez, C.; Tu, K.; Vinukollu, R.K. On uncertainty in global Terrestrial evapotranspiration estimates from choice of input forcing datasets. J. Hydrometeor. 2015, 16, 150317081742006. [Google Scholar] [CrossRef]
  19. Wang, A.; Zeng, X. Evaluation of multi-reanalysis products with in situ observations over the Tibetan Plateau. J. Geophys. Res. 2012, 117, D05102. [Google Scholar] [CrossRef]
  20. Trier, S.B.; Lemone, M.A.; Chen, F.; Manning, K.W. Effects of Surface Heat and Moisture Exchange on ARW-WRF Warm-Season Precipitation Forecasts over the Central United States. Weather Forecast. 2011, 26, 3–25. [Google Scholar] [CrossRef]
  21. Bonan, G.B.; Shugar, H.H. Environmental-factors and ecological processes in boreal forests. Annu. Rev. Ecol. Syst. 1989, 20, 1–28. [Google Scholar] [CrossRef]
  22. Chen, L.; Li, Y.; Chen, F.; Barr, A.; Barlage, M.; Wan, B. The incorporation of an organic soil layer in the Noah-MP Land Surface Model and its evaluation over a Boreal Aspen Forest. Atmos. Chem. Phys. 2016, 16, 8375–8387. [Google Scholar] [CrossRef] [Green Version]
  23. LeMone, M.A.; Wan, B.; Barlage, M.; Chen, F. The influence of fire-induce surface changes on the diurnal temperature change over the Hayman fire scar. J. Appl. Meteorol. Climatol. 2017. [Google Scholar] [CrossRef]
  24. Wang, Y.; Xu, X.; Liu, H. Analysis of land surface parameters and turbulence characteristics over the Tibetan Plateau and surrounding region. J. Geophys. Res.Atmos. 2016, 121, 9540–9560. [Google Scholar] [CrossRef]
  25. Cai, X.; Yang, Z.L.; Xia, Y.; Huang, M.; Wei, H.; Leung, R.; Ek, M. Assessment of simulated water balance from Noah, Noah-MP, CLM, and VIC over CONUS using the NLDAS test bed. J. Geophys. Res. Atmos. 2014, 119, 13–751. [Google Scholar] [CrossRef]
  26. Chen, F.; Manning, K.W.; Lemone, M.A.; Trier, S.B.; Alfieri, J.G.; Roberts, R.D.; Tewari, M.; Niyogi, D.; Horst, T.W.; Oncley, S.P.; et al. Description and evaluation of the characteristics of the NCAR high-resolution land data assimilation system. J. Appl.Meteorol. Climatol. 2007, 46, 694–713. [Google Scholar] [CrossRef] [Green Version]
  27. Amdo site, Nagqu site, and Baingoin site. Available online: http://daac.ornl.gov/MODIS/modis.html (accessed on 15 February 2018).
  28. Lawrence, D.M.; Slater, A.G. Incorporating organic soil into a global climate model. Clim. Dynam. 2008, 30, 145–160. [Google Scholar] [CrossRef]
  29. Shangguan, W.; Dai, Y.; Liu, B.; Zhu, A.-X.; Duan, Q.; Wu, L.; Ji, D.; Ye, A.; Yuan, H.; Zhang, Q.; et al. A China dataset of soil properties for land surface modeling. J. Adv. Model. Earth Syst. 2013, 5, 212–224. [Google Scholar] [CrossRef]
  30. Niu, G.Y.; Yang, Z.L.; Dickinson, R.E.; Gulden, L.E.; Su, H. Development of a simple groundwater model for use in climate models and evaluation with gravity recovery and climate experiment data. J. Geophys. Res. 2007, 112, D07103. [Google Scholar] [CrossRef]
  31. Chen, F.; Dudhia, J. Coupling an advanced land surface hydrology model with the Penn State-NCAR MM5 modeling system. Part I: Model implementation and sensitivity. Mon. Weather Rev. 2001, 129, 569–585. [Google Scholar] [CrossRef] [Green Version]
  32. Chen, F.; Mitchell, K.; Schaake, J.; Xue, Y.; Pan, H.-L.; Koren, V.; Duan, Q.Y.; Ek, M.; Betts, A. Modeling of land-surface evaporation by four schemes and comparison with FIFE observations. J. Geophys. Res. 1996, 101, 7251–7268. [Google Scholar] [CrossRef] [Green Version]
  33. Oleson, K.W. Technical Description of the Community Land Model (CLM); NCAR Tech. Note NCAR/TN-461 + STR;NCAR: Boulder, CO, USA, 2004; p. 174. [Google Scholar]
  34. Gayler, S.; Wöhling, T.; Grzeschik, M.; Ingwersen, J.; Wizemann, H.-D.; Warrach-Sagi, K.; Högy, P.; Attinger, S.; Streck, T.; Wulfmeyer, V. Incorporating dynamic root growth enhances the performance of Noah-MP at two contrasting winter wheat field sites. Water Resour. Res. 2014, 50, 1337–1356. [Google Scholar] [CrossRef]
  35. Yang, Z.L.; Niu, G.Y.; Mitchell, K.E.; Chen, F.; Ek, M.B.; Barlage, M.; Longuevergne, L.; Manning, K.; Niyogi, D.; Tewari, M.; et al. The community Noah land surface model with multiparameterization options (Noah-MP): 2. Evaluation over global river basins. J. Geophys. Res.Atmos. 2011, 116, D12110. [Google Scholar] [CrossRef]
  36. Gutowski, W.J.; Vorosmarty, C.J.; Person, M.; Otles, Z.; Fekete, B.; York, J. A coupled land-atmosphere simulation program (CLASP): Calibration and validation. J. Geophys. Res. 2002, 107, 4283. [Google Scholar] [CrossRef] [Green Version]
  37. Barlage, M.; Tewari, M.; Chen, F.; Miguez-Macho, G.; Yang, Z.-L.; Niu, G.-Y. The effect of groundwater interaction in North American regional climate simulations with WRF/Noah-MP. Clim. Chang. 2015, 129, 485–498. [Google Scholar] [CrossRef]
  38. Hong, S.; Yu, X.; Park, S.K.; Choi, Y.-S.; Myoung, B. Assessing optimal set of implemented physical parameterization schemes in amulti-physics land surface model using genetic algorithm. Geosci. Model Dev. 2014, 7, 2517–2529. [Google Scholar] [CrossRef] [Green Version]
  39. Stull, R.B. An Introduction to Boundary Layer Meteorology; Kluwer Academic Publisher: Dordrecht, The Netherlan, 1988. [Google Scholar]
  40. Niu, G.Y.; Yang, Z.L.; Mitchell, K.E.; Chen, F.; Ek, M.B.; Barlage, M.; Kumar, A.; Manning, K.; Niyogi, D.; Rosero, E.; et al. The community Noah land surface model with multiparameterization options (Noah-MP): 1. Model description and evaluation with local-scale measurements. J. Geophys. Res. 2011, 116, D12109. [Google Scholar] [CrossRef] [Green Version]
Figure 1. The locations of Ecosystem Research Stations (in situ) and AWS at the Amdo, Nagqu, and Baingoin sites. (a) site locations over the TP; (b, c, and d) locations of AWS and in situ stations for Amdo, Nagqu, and Baingoin site respectively.
Atmosphere 11 00458 g001
Figure 2. The accumulated precipitation (mm) from different datasets from 1 August 2014 to 1 August 2015 at the (a) Amdo site, (b) Nagqu site, and (c) Baingoin site. (AWS: precipitation from auto weather station; in situ: precipitation from in situ measurements; ERA5: precipitation from ECMWF reanalysis dataset ERA5).
Atmosphere 11 00458 g002
Figure 3. Comparison of monthly total precipitation and the difference between different datasets at the (a,b) Amdo site, (c,d) Nagqu site, and (e,f) Baingoin site (AWS minus insitu: the difference between AWS and in situ precipitation; ERA5 minus AWS: the difference between ERA5 and AWS precipitation).
Atmosphere 11 00458 g003
Figure 4. Comparison between default LAI for grassland in Noah-MP LSM and MODIS LAI at three sites from 1 August 2014 to 1 August 2015.
Atmosphere 11 00458 g004
Figure 5. The minimum, median, maximum, 5%, and 95% percentile values of RMSE, bias, and IOA for SH ((a), (c), and (e)) and LH ((b), (d), and (f)) respectively in Ens1–Ens3 (red: Ens1; blue: Ens2; green: Ens3).
Atmosphere 11 00458 g005
Figure 6. The selected frequency of different schemes of each subprocess for (left panel) SH and (right panel) LH in the best members (0–1) or worst members (−1–0) at the (a,b) Amdo, (c,d) Nagqu, and (e,f) Baingoin sites in ensemble experiment Ens1 when the in situ precipitation is used.
Atmosphere 11 00458 g006
Figure 7. The selected frequency of different schemes of each subprocess for (left panel) SH and (right panel) LH in the best members (0–1) or worst members (−1–0) at the (a,b) Amdo, (c,d) Nagqu, and (e,f) Baingoin sites in ensemble experiment Ens2 when the AWS precipitation is used.
Atmosphere 11 00458 g007
Figure 8. The selected frequency of different schemes of each subprocess for (left panel) SH and (right panel) LH in the best members (0–1) or worst members (−1–0) at the (a,b) Amdo, (c,d) Nagqu, and (e,f) Baingoin sites in ensemble experiment Ens3 when the ERA5 precipitation is used.
Atmosphere 11 00458 g008
Figure 9. Comparison between the observed (OBS) and simulated hydrological cycles for the selected optimal scheme combinations in CTL at the (a) Amdo site, (b) Nagqu site, and (c) Baingoin site. Subfigures from top to bottom show the monthly total net radiation (Rn), monthly total sensible heat flux (SH), monthly total evaporation (LH), monthly total runoff (RNF), and monthly averaged 0–1 m total soil liquid water (SLW).
Atmosphere 11 00458 g009
Figure 10. Comparison between the observed (OBS) and simulated hydrological cycles for the selected optimal scheme combinations in CTL at the (a) Amdo site, (b) Nagqu site, and (c) Baingoin site. Subfigures from top to bottom show the accumulated net radiation (Rn), accumulated sensible heat flux (SH), accumulated evaporation (LH), accumulated runoff (RNF), and accumulated 0–1 m total soil liquid water (SLW).
Atmosphere 11 00458 g010
Figure 11. The monthly differences in simulated hydrological cycles for the selected optimal scheme combination resulting from different precipitation datasets at the (a) Amdo site, (b) Nagqu site, and (c) Baingoin site; subfigures from top to bottom show the monthly differences in Rn, SH, LH, RNF, and 0–1 m total SLW, respectively.
Atmosphere 11 00458 g011
Figure 12. The monthly differences in simulated hydrological cycles for selected optimal scheme combinations resulted from soil organic matter at the (a) Amdo site, (b) Nagqu site, and (c) Baingoin site; subfigures from top to bottom show the monthly differences in Rn, SH, LH, RNF, and 0–1 m total SLW, respectively.
Atmosphere 11 00458 g012
Figure 13. Annual amount of surface energy and runoff (water equivalent unit) for the period 2014–2015 simulated by Noah-MP in all sensitivity tests: (a) net radiation, (b) sensible heat flux, (c) latent heat flux, and (d) total runoff.
Atmosphere 11 00458 g013
Table 1. The annual total precipitation in different datasets and the difference between different datasets (unit: mm).
SiteIn Situ AWSERA5AWS Minus In SituERA5 Minus AWS
Amdo258.72347.65717.9988.93370.74
Nagqu261.84477.55734.82215.71257.27
Baingoin185.70258.45560.4272.75301.97
Table 2. Geographical conditions and measurements at the four sites used in this study.
SiteElevation
(m)
Land Cover TypeMounted Height (m) of Automatic Micrometeorological Observing SystemGradient Observation Height (m) of Ws, Wd, Ta, RhDepth (cm) of Soil Temperature and Soil Moisture
Amdo4695alpine grassland2.981.5, 3, 6, 125, 10, 20, 40, 80, 160
Nagqu4509alpine grassland3.020.75, 1.5, 3, 6, 12, 225, 10, 20, 40, 80, 160
Baingoin4700alpine grassland2.12, 4, 105, 10, 20, 40, 100
Table 3. Volumetric measurements of soil organic matter at different depths.
DepthSoil Organic FractionReference
AmdoNagqu
0–10cm27.67%21.44% [12]
10–20cm16.27%14.51%
20–30cm12.80%12.08%
30–40cm5.47%16.05%
DepthBaingoin Reference
0–4.5cm16.59% [29]
4.5–9.1cm17.68%
9.1–16.6cm17.10%
16.6–28.9cm14.43%
28.9–49.3cm8.35%
49.3–82.9cm4.85%
Table 4. Summary of experiments.
Experiment NameExperiment DescriptionMembers
Ens1In situ measurements from August 2014 to August 2015 are used as forcing data. Leaf area index is assigned based MODIS composite data.1152
Ens2Same as Ens1, but with AWS precipitation data1152
Ens3Same as Ens1, but with ERA5 precipitation data1152
CTLOptimal from Ens11
CTLAPSame as CTL, but with AWS precipitation data1
CTLEPSame as CTL, but with ERA5 precipitation data1
SOMSame as CTL, but with soil organic matter incorporated1
SOMAPSame as SOM, but with AWS precipitation data1
SOMEPSame as SOM, but with ERA5 precipitation data1

