Article

Comparison of Thermal Comfort between Sapporo and Tokyo—The Case of the Olympics 2020

1
Faculty of Environment and Natural Resources, Albert-Ludwigs University Freiburg, Tennenbacher Str. 4, 79106 Freiburg, Germany
2
Research Centre Human Biometeorology, Deutscher Wetterdienst, Stefan-Meier-Str. 4, 79104 Freiburg, Germany
3
Chair of Environmental Meteorology, Albert-Ludwigs University Freiburg, Werthmannstr. 10, D-79085 Freiburg, Germany
*
Author to whom correspondence should be addressed.
Atmosphere 2020, 11(5), 444; https://doi.org/10.3390/atmos11050444
Submission received: 24 March 2020 / Revised: 20 April 2020 / Accepted: 24 April 2020 / Published: 29 April 2020
(This article belongs to the Special Issue Challenges in Applied Human Biometeorology)

Abstract

:
Weather and climate conditions can be decisive regarding travel plans or outdoor events, especially for sport events. The Olympic Games 2020, postponed to 2021, will take place in Tokyo at a time which is considered to be the hottest and most humid time of the year. However, a part of the athletic competitions is relocated to the northern city Sapporo. Therefore, it is important to quantify thermal comfort for different occasions and destinations and make the results accessible to visitors and sport attendees. The following analysis will quantify and compare thermal comfort and heat stress between Sapporo and Tokyo using thermal indices like the Physiologically Equivalent Temperature and the modified Physiologically Equivalent Temperature (PET and mPET). The results reveal different precipitation patterns for the cities. While a higher precipitation rate appears in Sapporo during winter, the precipitation rate is higher in Tokyo during summer. PET and mPET exhibit a greater probability of heat stress conditions in Tokyo during the Olympic Games, whereas Sapporo has more moderate values for the same period. The Climate-Tourism/Transfer-Information-Scheme (CTIS) integrates and simplifies climate information and makes them comprehensible for non-specialists. The CTIS of Tokyo illustrates lower suitable conditions for “Heat stress”, “Sunny days” and “Sultriness”. Transferring parts of the athletics competition to a northern city is thus more convenient for athletes, staff members and spectators. Hence, heat stress can be avoided and an acceptable outdoor stay is ensured. Overall, this quantification and comparison of the thermal conditions in Sapporo and Tokyo reveal limitations but also possibilities for the organizers of the Olympic Games. Furthermore it can be used to raise awareness for promoting or arranging countermeasures and heat mitigation at specific events and destinations, if necessary.

1. Introduction

The Olympics 2020, now postponed to summer 2021 due to the Covid-19 outbreak, will be held in Tokyo from 23 July to 8 August, and will be exposed to extreme climate conditions. Every attendee, regardless of whether athletes, staff members or spectators, has to face extreme heat and sultriness. Scheduling the Olympic Games at this time could have several reasons. One historical reason might be that many sport events originated in Europe, where conditions with thermal comfort last for the longest during summertime [1]. Another reason might be an economic advantage since no other sport event will take place around this period. The International Olympic Committee (IOC) themed the Olympics 2020 with “Beat the Heat” [2]. Whereupon, they started different promotions on how to adapt to these conditions. One decision made within this context was to transfer the race walk and the marathon to Sapporo, a city 800 km north from Tokyo, to reduce the heat implication.
Wong et al. [3] applied a low-cost sensor to monitor the microclimate of the marathon courses in Hong Kong and examined the association between microclimate changes and environmental settings to provide guidance to marathon organizers about design considerations for an optimum marathon course and the need for heat control to minimize the impact of heat stress to runners. Kosaka et al. [4] investigated the potential heat load of runners along the planned marathon route in Tokyo at the Olympics 2020. The results of the study reveal that the combination of solar radiation and daytime is considered an extremely high-risk for heat stress. Less shade opportunities along the runners’ route and the exposure to direct sunlight forces the runners energy budget to its limitations. For countermeasures, an earlier start of the marathon or a temporary sun shading were mentioned. Vanos et al. [5] has pointed out that spectators have another thermo-physiological background than athletes. For example, they have less time to acclimatize but stay outdoors almost as long as athletes. Besides, spectators are situated in crowds which decreases the airflow and increases heat load. These considerations lead Vanos et al. to the following result: The combination of the solar and the terrestrial radiation is the most significant influence on the human energy balance of spectators. Areas which are unshaded and unvegetated with high impermeable surfaces have a huge heat impact. Adaptations have to be considered for heat stress prevention. Additional to the adaptation to limiting radiation exposure, Vanos et al. recommend increasing the ventilation mechanisms for heat mitigation. However, these studies only investigated the potential heat impact for runners and spectators along the considered route in Tokyo. Since the IOC already decided to transfer the running competitions to Sapporo, this study will examine climatic differences between Sapporo and Tokyo and whether it is appropriate or less appropriate to relocate parts of the Olympics to a northern city.
As stated in Kakamu et al. [6], heat illness could occur during the Olympic Games 2020 in Tokyo, since it will reach the “cancel level for EHS (Environmental, Health and Safety) risk for continuous activity and competition” based on the Wet Bulb Globe Temperature (WBGT) method at each measured time. It also reaches the highest WBGT compared to the three previous Summer Olympics at each measured time. Even though WBGT is a well-established standard, which is already utilized by the International Tennis Federation [7] and the Federation of International Football Association [8], it does not consider thermo-physiological criteria. Thermo-physiological criteria, like the individuals metabolism or activity or a clothing model, are necessary to catch different attributes of individual attendees at sport events (athletes, staff members and spectators).
Matzarakis et al. [9,10] implemented thermal indices considering meteorological and thermo-physiological parameters for sport events. Both publications use the method of Physiologically Equivalent Temperature (PET) and modified Physiologically Equivalent Temperature (mPET) to investigate the thermal impact for visitors in Tokyo during the Olympic Games 2020. Matzarakis et al. [9] quantified thermal stress in Tokyo during the Olympics 2020 and found that air temperature alone cannot represent human thermal comfort precise enough. Further, wind velocity, air humidity, radiation fluxes and the human energy balance should be considered. Based on that, Tokyo reveals a high rate of heat stress at the time of the Olympics. PET and mPET are useful methodologies for predicting prevailing climate conditions and are recommended human-biometeorological instruments for future event plannings. In another study, the Climate-Tourism/Transfer-Information Scheme (CTIS) for the Olympics 2020 in Tokyo has been applied to visualize climate factors for tourists [10]. It is declared as a summary of basic climatological and bioclimatological conditions for destinations and as an adaptable tool for event and holiday preparation.
This study compares the already investigated results of Tokyo with newly compiled results for Sapporo and underlines the differences between both cities according to their thermal impact. The application of two different thermal indices shall reflect the difference in accounting varied clothing models and behavioral adaptation to given climatic conditions in other bioclimatic zones or seasons [11]. Hence, PET and mPET were already applied in previously mentioned studies, these methods are only shortly outlined in the next section. The resulting graphs are in a comprehensible design for a better understanding by non-specialists. The comparison of both cities shall be used as an example and form a basis for future international event planning.

2. Materials and Methods

2.1. Study Area

Sapporo estimates 1.96 million inhabitants and counts as the largest city on the island Hokkaido. Sapporo is considered as the fifth biggest in Japan. The city, which is located about 800 km north of Tokyo, became famous through the Winter Olympics 1972 and its annual snow festival [12]. The local climate is defined as temperate but cold and humid (Koeppen-Geiger climate classification Dfa [13]). Late spring and early summer have a low precipitation rate while August to January counts as wet months (precipitation > 100 mm). The overall average air temperature (Ta) is 8.9 °C, with a minimum Ta of −6 ° C in January and a maximum Ta of 25.2 ° C in August. The overall average precipitation per year amounts to 1045 mm with its most humid month in September with 125.5 mm and its least humid month in May (52.7 mm) (Figure 1).

2.2. Meteorological Data

The used meteorological data are recorded in a temporal resolution of three hours by the World Meteorological Organization (WMO) stations 47412 (Sapporo) and 47662 (Tokyo). The location of the WMO station in Sapporo is at 43 ° 03 36 N and 141 ° 19 43 E on a height of 17.5 m, surrounded by an urban park and parking lots. The WMO Station in Tokyo is located at 35 ° 41 30 N and 139 ° 45 04 E, on a height of 25.2 m in an urban park. The data cover the period from October 1966 to June 2018 for both cities. Wind velocity was measured at different heights due to changes of the anemometer height through the years and was altitude-corrected to a target height of 1.1 m based on a power-law profile approach [14]. The other parameters—air temperature, vapor pressure and global radiation, have been used without altitude correction at a height of 2 m since resulting uncertainties are irrelevant for this case.

2.3. Methods

2.3.1. PET

Physiologically Equivalent Temperature (PET) is one of the most common thermal indices and certificated by the German VDI-Guidelines 3787, Part 2 ([15,16]). PET is based on the Munich Energy-balance Model for Individuals (MEMI), a two-node thermo-physiological heat-balance model and the mean radiant temperature (Tmrt), calculated with the RayMan model. It is defined as “the air temperature at which, in a typical indoor setting, the heat balance of the human body […] is maintained with core and skin temperatures equal to those under the conditions being assessed” [16].

2.3.2. mPET

The modified Physiologically Equivalent Temperature (mPET) originates from PET (see above), which is a more realistic demonstration of the human thermal comfort, also for different climate zones. The meteorological input data are similar to PET and for a better correlation, mPET uses the same classification as PET (Table 1) since the results range in the same spectrum. Unlike PET, mPET uses a multi-node heat transport model equal to the Fiala model [17] and a self-adapting multi-layer clothing model, which includes the simulation of water vapor resistance. Hence, mPET integrates clothing behaviors depending on given thermal conditions [18].

2.3.3. RayMan Model

The application of the RayMan model is used to determine thermal comfort conditions from relevant meteorological and human body variables. The main purpose of the micro-scale model RayMan is to “calculate radiation fluxes in simple and complex environments” [20]. It allows the calculation of mean radiant temperature (Tmrt), which is an important variable for the estimation of thermal human-bioclimatic indices, for example, PET and mPET. The RayMan model also meets the standards of the German VDI-Guidelines 3787, Part 2 [15]. The model was established to combine biometeorology with urban climatology and can be used in other fields, like tourism and recreational studies as well.

2.3.4. CTIS

CTIS, short hand for Climate-Tourism/Transfer-Information-Scheme, reformulates and visualizes accessible climate information in an easy understandable scheme for non-specialists. Especially in the field of tourism, CTIS is useful to decide on destinations. The input data, containing meteorological and human-biometeorological data, are evaluated based on thresholds (Table 2). The subsequent concept of CTIS, including the visualitzation, is easy to handle: Climatic conditions are classified in several categories and, depending on the calculated input data, a colored scale defines the rate of suitability for each condition [21].
Nevertheless, CTIS is designed to give varying information based on the target destination or event and can be modified to different climate regions and cultures.

3. Results

The results are presented in several sections. Every section covers the comparison between Sapporo and Tokyo to highlight the differences between the cities in each category. The first section deals with the frequencies of PET and mPET in an approximate decadal resolution with an interval of three hours covering the years 1966–2018. The thermal classes for each individual day are presented. Second, the frequencies of precipitation represent the average precipitation during the years 1966–2018 in an approximate decadal resolution. Subsequently the average daily distribution for PET and the frequency diagram revealing the average occurence of PET classes during the time of the Olympic Games 2020 is presented. At least the CTIS of Sapporo will be compared to the CTIS of Tokyo to underline the differences of suitable climate conditions for different areas.

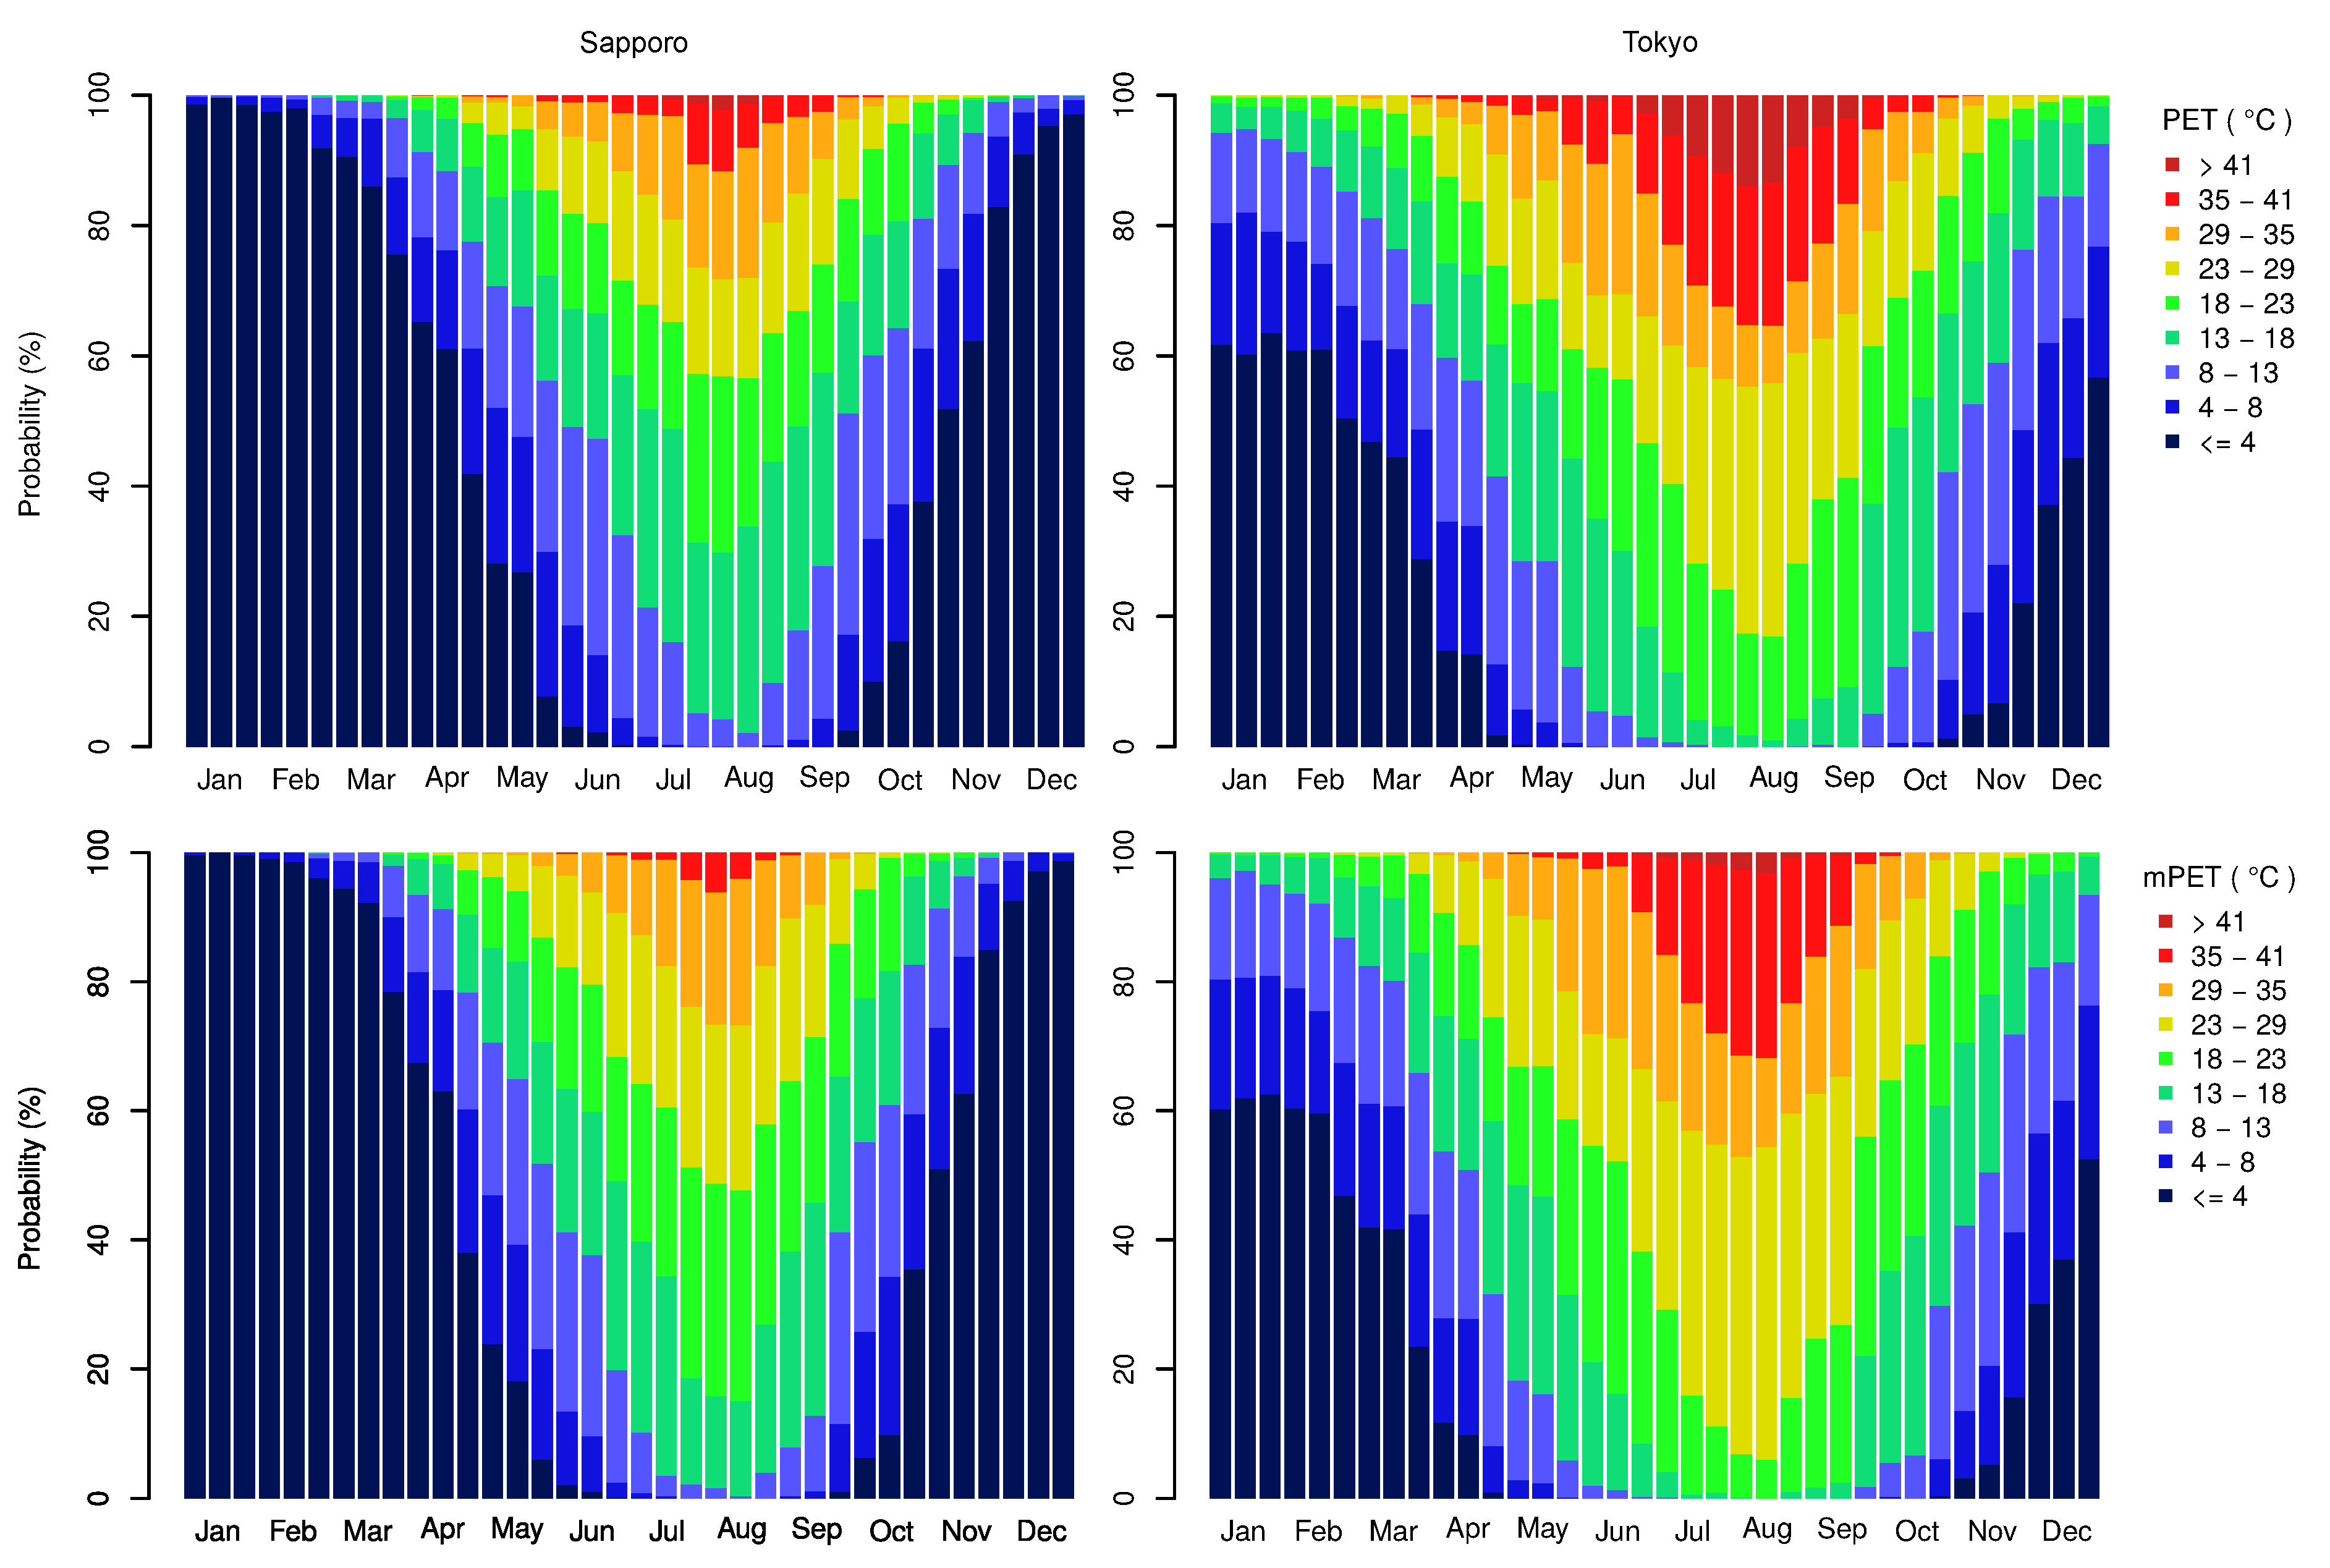
3.1. Frequencies of PET and mPET

This section deals with the annual frequencies of thermal indices, Physiologically Equivalent Temperature and a modified version (PET and mPET), for Sapporo and Tokyo. The temporal resolution of three hours comprises the years 1966–2018. PET values range from less than 4 ° C up to over 41 ° C (Table 1). It has to be noted, that the calculation of the annual frequencies considers day- and nighttime data. Thus the full range of PET classes can partly be seen within one month.
In Sapporo, cold stress occurs in every month, even in August, where no cold stress conditions occur at all for Tokyo (Figure 2, top). From the end of November to mid-March, the lowest PET classes (<4 ° C) prevail most of the time. Classes of a very high PET, above 35 ° C with a frequency between (4% and 9%) are most likely during the end of July and in August. In general, PET classes with over 35 ° C, occur rarely and only from May to September. PET for Sapporo depicts more hours with colder temperatures (averaged over the year 24% more), most likely to occur during nighttime. The other extreme, conditions with heat stress potential, is reduced from 8% for Tokyo to less than 1.5% for Sapporo averaged over the year. Figure 2 (top left) reveals a higher frequency of thermal comfort (13 ° C–29 ° C) in general around 70%. The class of >41 ° C is not represented in mPET for Sapporo at all (Figure 2, bottom left).
Tokyo (Figure 2, top right) covers every given PET class throughout the year. There is a probability of around 90% that an individual person is exposed to cold stress conditions during the end of December to the end of February. Extreme cold (<4 ° C) can occur up until May but it is rather unlikely. During the months of June to September, no cold stress appears (no temperature lower than 8 ° C) but heat stress. At the end of July and in August, there is a probability of around 40% of being under heat stress conditions (which is defined as a temperature greater than 29 ° C), right the time, where the Olympic Games 2020 will take place. Moreover, classes with PET over 35 ° C can be found from April to October with an average probability below 10%, whereas July and August exceed the 10% to up to a probability of around 20%. During late spring and early fall, PET is most likely moderate and stays between 8 ° C and 35 ° C. For Tokyo, almost no cold stress is considered during the Olympics, whereas heat stress will be present. A probability of 55% is observed for conditions with thermal comfort between 18 ° C and 29 ° C. No mPET class below 13 ° C was measured with the mPET method, which indicates no occurrence of cold conditions during the Olympics in Tokyo (Figure 2, bottom right).
Compared to PET (Figure 2, top), the frequencies of mPET (Figure 2, bottom) are slightly more moderate with a lower probability of extreme heat stress conditions. For example, the occurrence of mPET higher than 41 ° C is decreased to under 3% in Tokyo, while the frequency for PET (Figure 2, top right) reveals around 10%. For Sapporo PET over 41 ° C is calculated for less than 2%.
PET and mPET diagrams indicate heat stress conditions for both cities during the Olympics, whereas Tokyo is more likely to have warmer conditions. It should be noted, that there are much higher frequencies of the class >41 ° C for PET than for mPET.

3.2. Frequencies of Precipitation

Figure 3 depicts the probability of regular precipitation rates (mm/3 h) during an averaged year in Sapporo and Tokyo. Although the probability for precipitation events in Sapporo (Figure 3, left) is higher, events with heavy rainfall (>10.0 mm/3 h) are more likely in Tokyo (Figure 3, right). Thus it appears that Tokyo reveals a higher annual amount of precipitation than Sapporo. While precipitation occurs more likely during wintertime in Sapporo, Tokyo expects more in summer.
Figure 3 (left) exhibits the probability of precipitation between 20% in the middle of the year and 50% at the beginning and the end of an averaged year for Sapporo. Light and moderate rain events dominate the annual precipitation picture. Rainfall events from January to March are frequent (around 45%), while the lowest precipitation is expected during summertime. Precipitation happens most likely in December with over 50%, while precipitation events stay below 20% in June.
Precipitation events are pretty low for Tokyo in January (probability of <10%) but occur very likely during June (around 40%) (Figure 3, right). The probability of 10% for precipitation events in August is lower compared to other summer months, whereas precipitation is quite frequent during September and October. Overall, moderate rainfall rates between 1.0 and 10.0 mm/3 h dominate throughout the year, while light (<1.0 mm/3 h) and heavy rainfall rate (>10.0 mm/3 h) are less frequent.

3.3. Daily Distribution of PET

The daily distribution of PET distinguishes periods with heat stress over the day and at night, examining each day in the observed years simultaneously. While comparing the average distribution of PET for Sapporo and Tokyo, different thermal sensations become obvious.
Sapporo has slight heat stress but greater cold stress in general, especially during winter. From December until mid-March, extreme cold stress is presented since PET does not exceed 4 ° C. Figure 4 indicates hot conditions (PET class between 29 ° C and 35 ° C) for a smaller period as for Tokyo (Figure 5) and exceeds 35 ° C only a couple of days in August around midday. Further, the daily duration of hot climatic conditions is shorter in Sapporo. The period indicating moderate PET (13 ° C and 29 ° C) is shorten by two months. Therefore, cold stress conditions occur sooner.
As for Tokyo (Figure 5), the hottest days and hours occur in July and August between 9 a.m. and 4 p.m., where PET exceeds 35 ° C. Hot conditions goes up to 35 ° C between June until mid of September during the day. The nights, starting from end of May until mid-October, are moderate, while cold stress is not expected at all. PET classes below 13 ° C occur from mid-October till the end of May and stay low even during daytime from December until the beginning of March.

3.4. Frequencies of PET and mPET for the time during the Olympic Games 2020
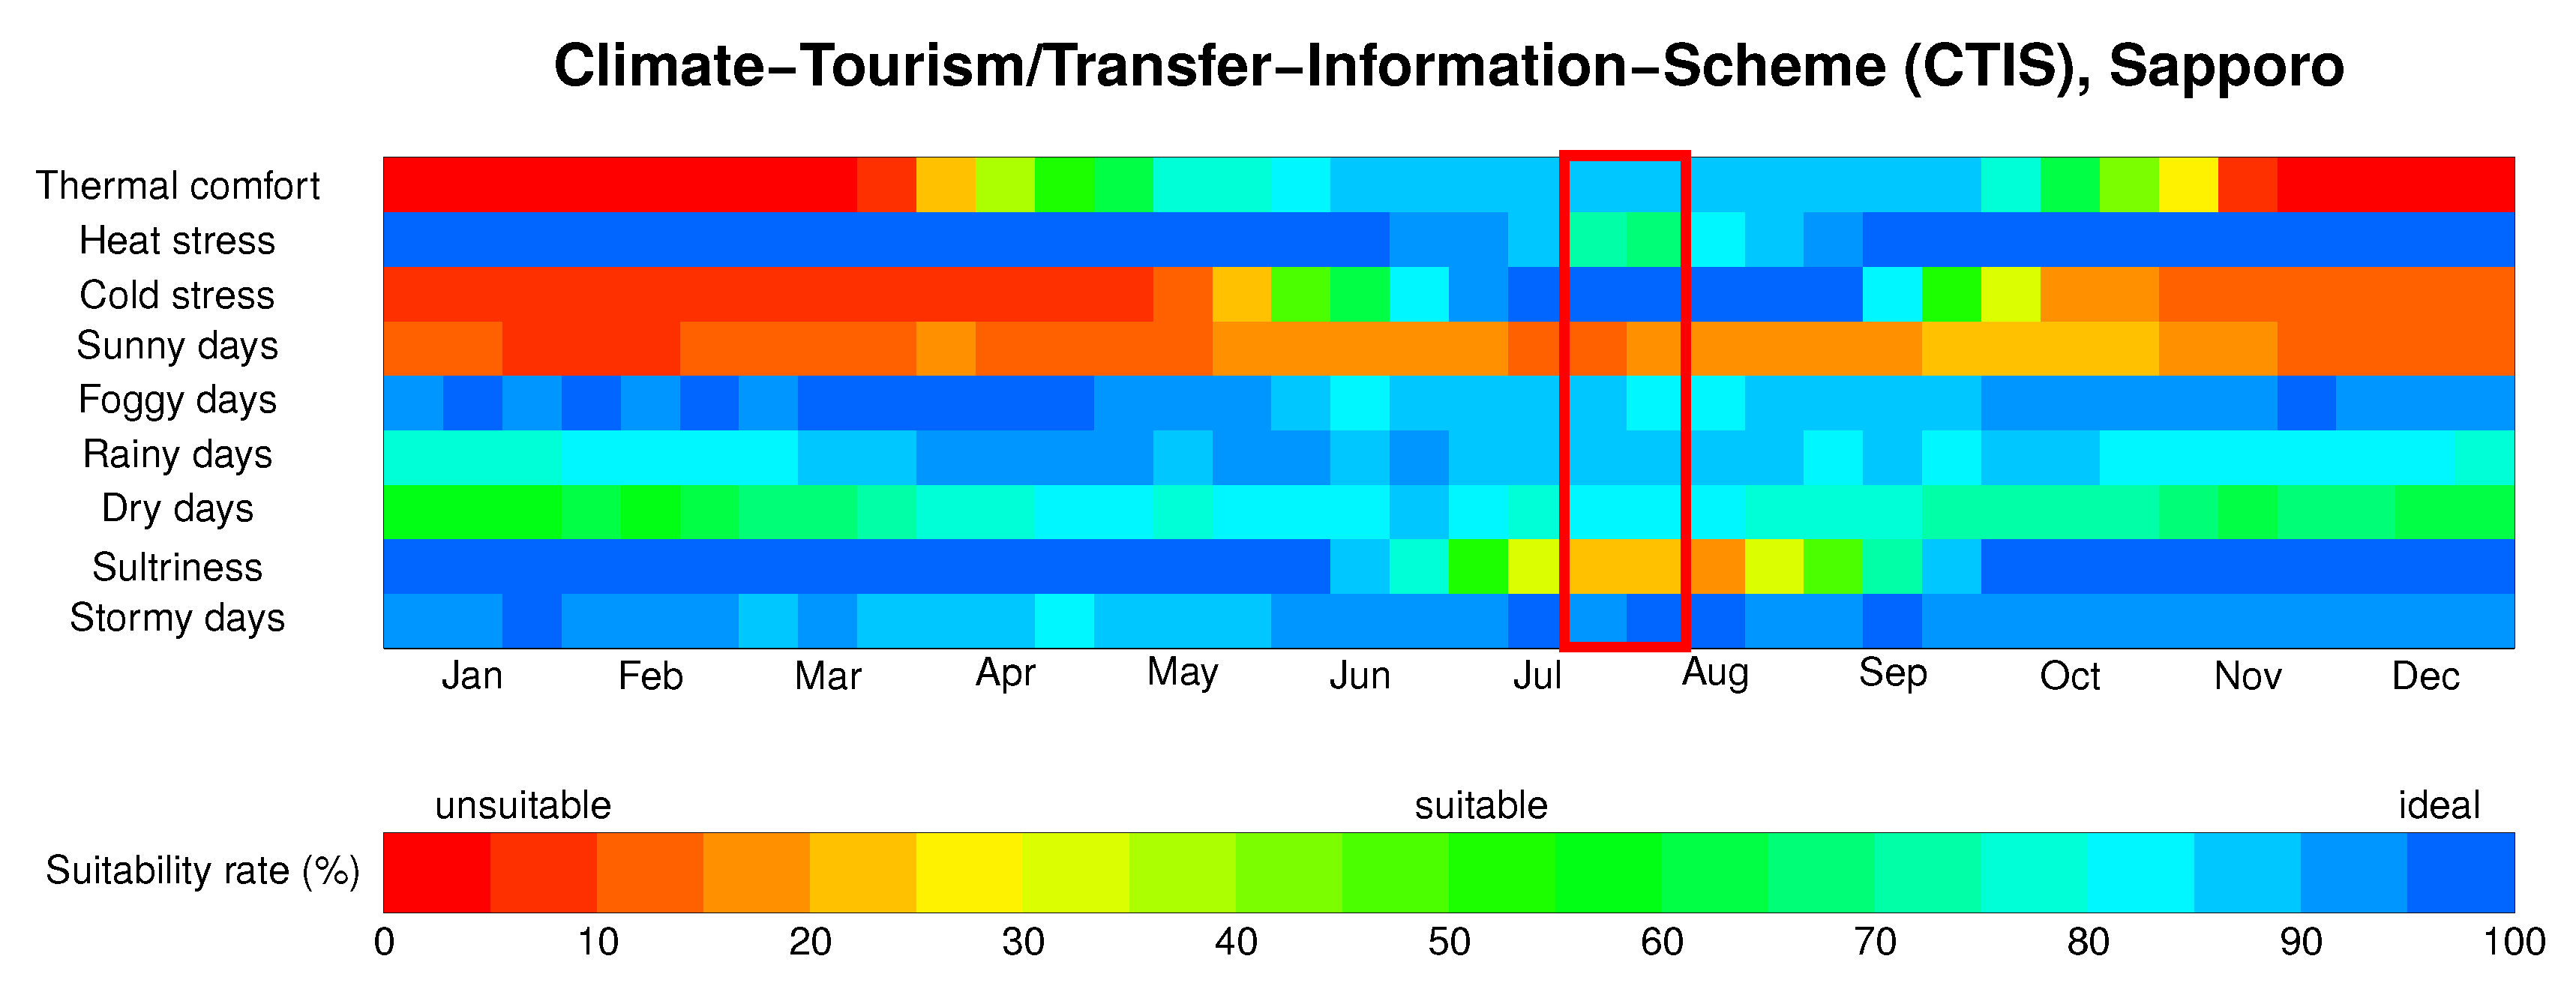
This section discusses the frequencies of PET for Sapporo and Tokyo during the Olympic Games 2020, which will be held from 24 July to 9 August (postponed to 23 July to 8 August 2021) and thus during the hottest time of the year. The frequency of the individual days is formed based on the statistics from 1966 to 2018 for Tokyo and Sapporo.
In Sapporo (Figure 6, left) higher frequencies of moderate PET classes occur in general (around 75%) compared to Tokyo (Figure 6, right). The PET for Sapporo exhibits more hours with colder temperatures (frequency up to 8%), most likely to occur during nighttime. The other extreme, conditions with heat stress potential, occur to less than 15%. The class of > 41 ° C is not represented in mPET for Sapporo at all, while PET for Sapporo implies a frequency of less than 3%.
For Tokyo, almost no cold stress is considered during the Olympics, in contrast, heat stress, which is defined as a PET above 35 ° C (see Table 1) will be present. Heat stress is expected with a probability of at least 25% each individual day, which likely occurs during midday. A probability of less than 60% is observed for acceptable thermal conditions between 13 ° C and 29 ° C. No PET and as well no mPET class below 13 ° C was measured with the PET and mPET method, which indicates no occurrence of cold conditions during the Olympics in Tokyo.
PET and mPET calculate heat stress conditions during the Olympics for both cities, whereas Tokyo is more likely to have warmer conditions. It should be noted that PET calculates much higher frequencies for the class > 41 ° C than mPET.

3.5. CTIS

The “Climate-Tourism/Transfer-Information Scheme” (CTIS) is an approach designed to make human-biometeorological results more accessible for non-experts. The input data are based on the same years as used in the analysis before. For a more detailed description compare Table 2. Many blue colored cells define a high suitability rate for the destination. In general, both cities are proper destinations with less frequent foggy and stormy days. Moreover, dry days which go along with the frequency of precipitation, also have a high suitability rate. Only sunny days and sultriness reveal higher unsuitable conditions during summer according to this analysis.
Regarding Sapporo, Figure 7 reveals more tough conditions during the winter season than Tokyo. Because of a lower PET range below 8 ° C (Figure 2, top left), citizens and visitors are confronted with cold stress conditions and experience less thermal comfort. The rate of suitability for dry days decreases to around 60%, Tokyo has a suitability rate of over 85%. One reason could be snowfall, which is very likely during Sapporos winter season [12]. In general, climatic conditions in Sapporo during the Olympics 2020 are more suitable compared to Tokyo. More sunny days are expected and attendees are confronted with less heat stress (45% more suitable than in Tokyo) and less sultriness (suitability rate at 25%).
Detecting the CTIS of Tokyo (Figure 8) in detail, visitors will be confronted with cold stress conditions during wintertime, although the rate of suitability for thermal comfort in Tokyo is higher than in Sapporo. This higher suitability in winter can be explained by PET of up to 13 ° C in Tokyo and below 4 ° C in Sapporo (Figure 2, top). Hence, the whole period was taken into account and no distinction was made between hours during day- and nighttime. Additionally during summertime more heat stress occurs in Tokyo than in Sapporo but the overall thermal comfort is more suitable in Tokyo as well. Even though this seems to be contradictory, the reduced thermal comfort in Sapporo can be explained by the low PET classes in Sapporo during nighttime in summer.
The most suitable time, according to CTIS, for both cities is late spring and fall where less categories have a very low suitability rate. During the Olympics, the low suitability rate in the categories of sunny days and sultriness are remarkable. The low rate of suitability of sunny days results from a high rate of cloudiness. Precipitation in combination with high temperature leads to sultriness, which explains the low rate of suitability during that time.

4. Discussion and Conclusions

Human-biometeorological and tourism-climatological methods are used to describe climate conditions which are assets for destinations or locations hosting special events, for example, sport events. The evaluation of over 30 years in a high temporal resolution of three hours provides statistical stability and should identify favorable times with comfortable thermal conditions.
PET used in this context is adjusted to the habits of Central Europeans or for people in related climatic conditions [19]. Therefore, as many visitors traveling to Tokyo might not be adapted to hot and humid climate conditions, an estimation of thermal conditions during the Olympic Games 2020 is necessary. It stands out, that Sapporo reveals a low PET rate over 35 ° C, around 20% more unlikely compared to Tokyo (see Section 3.1). The daily distribution of PET for Tokyo highlights the longer duration of heat stress during midday hours and throughout the year compared to Sapporo. The focus of this study is on the analysis of PET to also facilitate the comparison to Matzarakis and Fröhlich [1]. In comparison to that study, it has to be noted, that in this study a longer data set has been used. At the Olympics less sultriness is given in Sapporo since the highest precipitation occurs during wintertime (Figure 3, left) unlike in Tokyo, where most precipitation happens in the summer (Figure 3, right). Both CTIS reveal nearly ideal conditions for thermal comfort during the Olympics (Section 3.5), whereas heat stress is an issue and needs to be dealt with. However, the huge gap between both categories is due to the inclusion of nighttime data. Although European and North-American tourists prefer sunny days for their vacation [22], overcast days could turn out as beneficial since it reduces the exposure to direct sun radiation and therefore has a lower heat stress potential.
In conclusion, this study reveals less heat stress conditions and convenient thermal comfort in Sapporo during the Olympics 2020. Therefore, the transfer of the race walk and the marathon to Sapporo was a proper decision.
As Kosaka and Vanos [4,5] stated, sun radiation influences thermal conditions of athletes, staff members as well as spectators, furthermore, sun shading plays a significant part in thermal comfort. Accordingly, air temperature and precipitation are important factors influencing the thermal environment, but also radiation fluxes and wind velocity are significant parameters. To collect more information about sun shading effects along the runners’ route in Sapporo, further work is required. Moreover, using PET and mPET instead of WBGT [6], thermal-physiological criteria are considered and provide a more realistic perception of air temperature. Matzarakis et al. gave a detailed examination on how to quantify and visualize thermal conditions in Tokyo for the Olympic Games 2020 [9,10].
Considering global warming as an inescapable issue, it is even more relevant to consider human thermal comfort and how to take action in time. To avoid cases like the athletic World Cup 2019 in Qatar, using appropriate methods for a proper time and destination management could help to mitigate heat stress in the future. Even though, time and location are fixed, the applied methods can still be used for heat mitigation. For example, if the day is set, the event can be shifted to another daytime where attendees will be confronted with less heat. It has to be noticed, that the results are composed of averages based on the input data and do not differentiate between day- and nighttime values. To keep this study simpler, it reveals certain limitations. For instance, the input data are from only one individual meteorological station which is hardly representative for a whole urban area, like Sapporo or Tokyo. The modified surface as an urban structure also reshapes the input parameters significantly and leads to microclimatic variations [4], which have not been considered here. To improve the results, several reference stations for one area and the adaption of a building-simulation model to consider actual microclimate conditions could be included. Despite its limitations, the study certainly serves as an example on how to evaluate heat stress for a defined destination and reassure the arrangement to relocate events for more thermal comfort and heat prevention. For this purpose, a heat health warning system could be implemented into the weather forecast, so that early reactions and decisions can be made for similar occasions. A careful prediction of human-biometeorological conditions followed by enabling countermeasurs at early stages ensure the health and well-being of all athletes and attendees.

Author Contributions

Conceptualization, Y.W., K.G. and A.M.; methodology, Y.W. and A.M.; software, Y.W.; validation, Y.W., K.G. and A.M.; formal analysis, Y.W.; investigation, Y.W.; resources, Y.W., K.G. and A.M.; data curation, Y.W.; writing—original draft preparation, Y.W., K.G. and A.M.; writing—review and editing, Y.W., K.G. and A.M.; visualization, Y.W.; supervision, A.M.; project administration, Y.W. and K.G. All authors have read and agreed to the published version of the manuscript.

Funding

This research received no external funding.

Acknowledgments

Special thanks are extended to Dominik Fröhlich for providing the software-routines.

Conflicts of Interest

The authors declare no conflict of interest.

References

  1. Matzarakis, A.; Fröhlich, D. Sport Events and Climate for Visitors—the Case of FIFA World Cup in Qatar 2022. Int. J. Biometeorol. 2015, 59, 481–486. [Google Scholar] [CrossRef] [PubMed]
  2. IOC. Beat the Heat at Tokyo 2020. 2020. Available online: https://www.olympic.org/athlete365/well-being/beat-the-heat/ (accessed on 5 February 2020).
  3. Wong, P.; Lai, P.C.; Hart, M. Microclimate Variations between Semienclosed and Open Sections of a Marathon Route. Adv. Meteorol. 2013, 2013, 1–10. [Google Scholar] [CrossRef] [Green Version]
  4. Kosaka, E.; Iida, A.; Vanos, J.; Middel, A.; Yokohari, M.; Brown, R. Microclimate Variation and Estimated Heat Stress of Runners in the 2020 Tokyo Olympic Marathon. Atmosphere 2018, 9, 192. [Google Scholar] [CrossRef] [Green Version]
  5. Vanos, J.K.; Kosaka, E.; Iida, A.; Yokohari, M.; Middel, A.; Scott-Fleming, I.; Brown, R.D. Planning for Spectator Thermal Comfort and Health in the Face of Extreme Heat: The Tokyo 2020 Olympic Marathons. Sci. Total Environ. 2019, 657, 904–917. [Google Scholar] [CrossRef] [PubMed]
  6. Kakamu, T.; Wada, K.; Smith, D.R.; Endo, S.; Fukushima, T. Preventing heat illness in the anticipated hot climate of the Tokyo 2020 Summer Olympic Games. Environ. Health Prev. Med. 2017, 22, 68. [Google Scholar] [CrossRef] [PubMed] [Green Version]
  7. ITF. 2019 Men’s and Women’s ITF World Tennis Tour Regulations. 2019. Available online: https://www.itftennis.com/media/1456/itf-world-tennis-tour-regulations-revised-august-2019.pdf (accessed on 7 March 2020).
  8. FIFA Medical Network. Heat Breaks Reduce Thermal Stress. 2019. Available online: https://www.fifamedicalnetwork.com/heat-breaks-reduce-thermal-stress/ (accessed on 7 March 2020).
  9. Matzarakis, A.; Fröhlich, D.; Bermon, S.; Adami, P.E. Quantifying Thermal Stress for Sport Events—The Case of the Olympic Games 2020 in Tokyo. Atmosphere 2018, 9, 479. [Google Scholar] [CrossRef] [Green Version]
  10. Matzarakis, A.; Fröhlich, D.; Bermon, S.; Adami, P. Visualization of Climate Factors for Sports Events and Activities–The Tokyo 2020 Olympic Games. Atmosphere 2019, 10, 572. [Google Scholar] [CrossRef] [Green Version]
  11. Staiger, H.; Laschewski, G.; Matzarakis, A. Selection of Appropriate Thermal Indices for Applications in Human Biometeorological Studies. Atmosphere 2019, 10, 18. [Google Scholar] [CrossRef] [Green Version]
  12. City of Sapporo. 2020. Available online: http://www2.city.sapporo.jp/global/english/# (accessed on 10 February 2020).
  13. Walter, H.; Lieth, H. Klimadiagram-Weltatlas; VEB Gustav Fischer Verlag: Jena, Germany, 1960. [Google Scholar]
  14. Kuttler, W. Stadtklima. In Handbuch der Umweltveränderungen und Ökotoxologie; Volume 1B: Atmosphäre; Springer: Berlin/Heidelberg, Germany, 2000; pp. 420–470. [Google Scholar]
  15. VDI. Environmental Meteorology, Methods for the Human-Biometeorological Evaluation of Climate and Air Quality for the Urban and Regional Planning at Regional Level—Part I: Climate, VDI/DIN—Handbuch Reinhaltung der Luft. Band 1b ed.; VDI: Düsseldorf, Germany, 1998. [Google Scholar]
  16. Höppe, P. The physiological equivalent temperature—A universal index for the biometeorological assessment of the thermal environment. Int. J. Biometeorol. 1999, 43, 71–75. [Google Scholar] [CrossRef] [PubMed]
  17. Fiala, D.; Lomas, K.J.; Stohrer, M. Computer prediction of human thermoregulatory and temperature responses to a wide range of environmental conditions. Int. J. Biometeorol. 2001, 45, 143–159. [Google Scholar] [CrossRef] [PubMed]
  18. Chen, Y.C.; Matzarakis, A. Modified physiologically equivalent temperature—basics and applications for western European climate. Theor. Appl. Climatol. 2018, 132, 1275–1289. [Google Scholar] [CrossRef]
  19. Matzarakis, A.; Mayer, H. Another Kind of Environmental Stress: Thermal Stress. WHO Newsl. 1996, 18, 7–10. [Google Scholar]
  20. Matzarakis, A.; Rutz, F.; Mayer, H. Modelling radiation fluxes in simple and complex environments—Application of the RayMan model. Int. J. Biometeorol. 2007, 51, 323–334. [Google Scholar] [CrossRef] [PubMed]
  21. Matzarakis, A. Transfer of Climate Data for Tourism Applications—The Climate-Tourism/Transfer- Information-Scheme. Sustain. Environ. Res. 2014, 24, 273–280. [Google Scholar]
  22. De Freitas, C.R. Tourism Climatology: Evaluating Environmental Information for Decision Making and Business Planning in the Recreation and Tourism Sector. Int. J. Biometeorol. 2003, 48, 45–54. [Google Scholar] [CrossRef] [PubMed]
Figure 1. Walter and Lieth climate diagram exhibiting monthly averages for air temperature (left y-axis, red colored) and average sum of monthly precipitation (right y-axis, blue colored) in the period from October 1966 to June 2018 for Sapporo. Humid conditions are characterized by blue lines above the red curve. The black values on the left hand side (y-axis) reveal the maximum and minimum air temperatures. The annual average air temperature and annual sum of precipitation can be found in the upper right corner [13].
Atmosphere 11 00444 g001
Figure 2. Frequency diagrams in an approximate decadal resolution exhibiting the average PET classes (Table 1) for Sapporo (top left) and for Tokyo (top right) and the average modified Physiologically Equivalent Temperature (mPET) classes for Sapporo (bottom left) and for Tokyo (bottom right) covering the period from October 1966 to June 2018.
Atmosphere 11 00444 g002
Figure 3. Frequency diagram exhibiting average classes of rainfall rates (in mm/3 h) throughout an avereaged year in an approximate decadal resolution for Sapporo (left) and Tokyo (right).
Atmosphere 11 00444 g003
Figure 4. Temporal diagram for PET for Sapporo with a temporal resolution of three hours over the period from October 1966 to July 2018. The x-axis represents the months during a year and the y-axis the variation throughout the day. The thermal sensation classification is stated in Table 1.
Atmosphere 11 00444 g004
Figure 5. Temporal diagram for PET for Tokyo with a temporal resolution of three hours over the period from October 1966 to July 2018. The x-axis represents the months during a year and the y-axis the variation throughout the day. The thermal sensation classification is stated in Table 1.
Atmosphere 11 00444 g005
Figure 6. Frequency diagram presenting the average occurence of PET classes (Table 1) for Sapporo (left) and Tokyo (right) during the time of the Olympic Games 2020 based on the years 1966 to 2018. The x-axis denotes the dates of the days during the Olympic Games.
Atmosphere 11 00444 g006
Figure 7. “Climate-Tourism/Transfer-Information Scheme” (CTIS) for Sapporo. The red lined box highlights the scheduled time for the Olympic Games 2020. The suitability rate defines the suitability of each category for tourists per an approximate decadal resolution.
Atmosphere 11 00444 g007
Figure 8. “Climate-Tourism/Transfer-Information Scheme” (CTIS) for Tokyo. The red lined box highlights the scheduled time for the Olympic Games 2020. The suitability rate defines the suitability of each category for tourists per an approximate decadal resolution.
Atmosphere 11 00444 g008
Table 1. Thermal perception and stress classification for human-beings for Physiologically Equivalent Temperature (PET) (with an internal heat production of 80 W and a heat transfer resistance of clothing of 0.9 clo) after Matzarakis and Mayer [19].
PETThermal PerceptionGrade of Physiological Stress
Very coldExtreme cold stress
° C– – – – –– – – – –
ColdStrong cold stress
° C– – – – –– – – – –
CoolModerate cold stress
13  ° C– – – – –– – – – –
Slightly coolSlight cold stress
18  ° C– – – – –– – – – –
ComfortableNo thermal stress
23  ° C– – – – –– – – – –
Slightly warmSlight heat stress
29  ° C– – – – –– – – – –
WarmModerate heat stress
35  ° C– – – – –– – – – –
HotStrong heat stress
41  ° C– – – – –– – – – –
Very hotExtreme heat stress
Table 2. Threshold criteria (adapted from Reference [21]) for the Climate-Tourism/Transfer-Information -Scheme (CTIS).
CriteriaThreshold
Thermal ComfortPET between 18  ° C and 29  ° C
Heat StressPET > 35  ° C
Cold StressPET < 8  ° C
Sunny Dayscloud cover < 5 octas
Foggy Daysrelative humidity with > 93 %
Rainy Daysdaily sum of precipitation > 5 mm
Dry Daysdaily sum of precipitation < 1 mm
Sultrinessmax. vapor pressure > 18 hPa
Stormy daysmax. wind speed > 8 m/s

