Abstract
The lack of regulations regarding the manufacture of nanoparticle-containing products has enabled the release of many consumer products into the market with uncorroborated claims. Silver nanoparticles are commonly used in consumer goods, particularly in medical and household products. This study was designed to evaluate the aerosol exposure of silver nanoparticles from two consumer spray products currently on the market that claim to contain silver nanoparticles for antibacterial purposes. The study relies on our current understanding of various sampling and analytical methods to effectively evaluate aerosolized nanoparticles, particularly at low concentrations. To characterize low-concentration nanoparticles, various sophisticated sampling methods, including a NanoScan scanning mobility particle sizer, an optical particle sizer, an impinger, and diffusion samplers, were utilized to quantify, collect, and analyze the chemical compositions of the aerosolized products. Our results show that while both products aerosolize silver particles when sprayed, the emitted nanoparticles contain a low concentration of silver and vary in size and overall chemical composition. Further investigation of silver nanoparticle commercial spray products is needed to assess exposure risk and inform health professionals, industrial hygienists, and the general public regarding disparities in product marketing claims and nanoparticle aerosol exposure.
1. Introduction
Silver nanoparticles (NPs) are agglomerates of silver that range from 1 to 100 nm in diameter. While NPs can occur naturally, the synthesis and use of engineered silver NPs is popular today, specifically to take advantage of the antimicrobial properties of these particles. As a result, silver NPs have been increasingly incorporated into everyday household products. A wide variety of products ranging from clothing and toys to air humidifiers and medical instruments now contain silver NPs, for an estimated production of approximately 20 tons of silver NP material in the USA per year [1].
The current regulations regarding silver NP exposure are inconsistent due to varying guidelines across countries and within the USA Although the American Conference of Governmental Industrial Hygienists has set threshold limit values for metallic silver and soluble silver as 0.1 mg/m3 and 0.01 mg/m3 respectively, nonetheless, the Occupational Safety and Health Administration, Mine Safety and Health Administration, and the National Institute for Occupational Safety and Health exposure have declared a limit of only 0.01 mg/m3 for all forms of silver [2]. However, these threshold limits are not applied to exposure that results from the use of consumer products, allowing products to be released into the market without disclosing any warnings regarding concentration or the potential for harm due to NP contents. In addition, nanotechnology-enabled consumer products currently do not require Food and Drug Administration (FDA) approval in the USA before being released for popular consumption. Rather, the FDA reviews products on a case-by-case basis as needed and monitors incident reports post market release [3].
Silver NPs are commonly incorporated into medical and lifestyle products for their antibacterial properties, which include plasma membrane penetration and induction of cell death [4]. One study [5] established the antiviral capabilities of silver NPs against HIV-1 in vitro through competitive binding to the viral envelope. However, the harmful effects of silver NPs on microbes can also extend to human cells. The toxicity of silver NPs on human cells in vitro has been well documented, with studies demonstrating their cytotoxic effect on human lung epithelial cells [6,7] and neurotoxic effects on human embryonic stem cells [8]. The degree of silver NP-induced toxicity in cells is thought to directly correlate with the degree of free silver ions that dissociate from the particle. The risk associated with a high dissociation rate is highest in the brain, because silver NPs tend to accumulate for longer amounts of time in the brain than in other organs [9]. Furthermore, silver NPs can cross the blood–brain barrier [10], induce neuroinflammation and oxidative stress in brain tissue [11,12,13], and reduce spatial cognition in rat studies [14]. Perhaps most alarmingly, silver NPs have been shown to dysregulate vital developmental pathways in mouse embryonic stem cells [15].
Despite extensive research, no consensus on the health risks of silver NP exposure has been established. Argyria, or the development of a blue–gray skin pigmentation, is the only well documented condition attributed to silver NP exposure from consumer products [16]. As a result, an influx of silver NP products citing health benefits have been released into the market in recent years. These products are often marketed as natural, non-toxic, or as dietary supplements and, as a result, are relatively popular among American consumers. A survey conducted by The National Center for Complementary and Integrative Health concluded that 17.7% of American adults used a product marketed as a dietary supplement in 2012, excluding vitamins and minerals. The survey concluded by suggesting that more research should be conducted on the claims of these “natural products” [17].
A comprehensive list of consumer products claiming to contain NPs, termed the Nanotechnology Consumer Products Inventory (CPI), was created in 2005 by the Woodrow Wilson International Center for Scholars and the Project on Emerging Nanotechnologies. As of April 2019, 1829 products were listed in this database, with 52% of product NP claims uncorroborated. Of the listed products, 24% claim to contain silver NPs, making silver the most common NP in consumer goods [18,19]. Despite NP popularity among product manufacturers, the general public is largely uneducated regarding nanoparticles and associated technologies. In a 2013 survey, the Woodrow Wilson Center found that 69% of Americans knew little to nothing about nanotechnology [20]. The inability to adequately assess the risks of NP-containing products renders consumers susceptible to faulty marketing claims and potential overexposure. In perhaps the first step toward consumer education and transparency, the New York State Department of Environmental Conservation released the Household Cleansing Product Information Disclosure Program in 2018. This program mandates cleaning products sold in New York to disclose nanomaterials within product ingredients [21].
Due to possible health risks and lack of regulation in the manufacturing of NP-containing consumer goods, it is important to evaluate and quantify the marketing claims of NP-containing products intended for daily use. In an extensive 2017 study that quantified the release of silver and zinc NPs from 18 consumer spray products, silver NPs were confirmed in all silver-claiming products, but it was found that the average silver concentration ranged widely from 1 to 30 mg/L [22]. Similarly, a study of 19 children’s products found that all liquid products tested contained the amount of silver nanoparticles claimed by the producer [23].
This study aims to evaluate the overall airborne nanoparticle distribution of two silver NP-containing spray products that are currently on the market by using advanced techniques to characterize the release of low-concentration silver NPs during typical product use. The goal was to assess each product’s silver NP claims, thereby shedding light on actual NP delivery concentrations and enhancing our awareness of the general lack of transparency surrounding NPs in consumer products.
2. Experiments
2.1. Materials
Two spray products, Silver Shield Sanitizer (SSS) (Silver Botanicals, Austin, TX, USA) and Silver Throat Spray (STS) (Designs for Health, Suffield, CT, USA), were purchased for their advertised claims to contain silver NPs and ease of accessibility to the general public. Silver Botanicals claims that SSS is a disinfectant spray that is “safe to use on household surfaces, linens, clothing and skin” [24] and contains 15 ppm of silver [24]. Design For Health lists STS under the company’s “Immunity” products and markets it as a dietary supplement to be sprayed directly into the throat. This company claims that its product contains 15 ppm per serving of an “incredibly powerful, non-toxic form of silver, with zero build-up in the body” [25]. The product was manufactured in an FDA-inspected facility but has not been individually evaluated. It is important to note that neither product is listed on the CPI database as of 2019, highlighting the rate of growth in the nanotechnology field as well as the disparity between manufacturer reporting and consumer knowledge.
2.2. Equipment
To accurately identify emitted concentration, size distribution, and chemical and morphological characteristics, each product was aerosolized inside a glovebox (89 cm × 61 cm × 64 cm) equipped with an ultrafilter (manufactured by Terra Universal, Fullerton CA, USA). The airborne particles emitted from these two products were characterized for their particle number concentrations and physical and chemical properties.
To measure particle number concentrations, direct-reading real-time instruments (RTIs), including two NanoScan scanning mobility particle sizers (NanoScan SMPS) (model 3910, TSI, Shoreview, MN, USA), which we will further abbreviate as SMPS, and one optical particle sizer (OPS) (model 3330, TSI, Shoreview, MN, USA) were used. The NanoScan SMPS measures the particle size range of 10–420 nm at a flow rate of 0.9 L/min, and the OPS measures the particle size range of 0.3–10 μm at a flow rate of 1.0 L/min. Both instruments are designed to report data in 1-min time intervals. Conductive silicon tubing with an inside diameter of 0.48 cm (model 3001901, TSI, Shoreview, MN, USA) was attached to each RTI and then extended into the glovebox. As shown in the experimental setup (Figure S1), the two NanoScan SMPS units measured airborne particle concentrations at two locations (A and B). Locations A and B were located at 15 cm (6 in.) and 35 cm (12 in.), respectively, from the site of particle aerosolization. The OPS measured concentrations at location A.
To collect emitted airborne particles and evaluate their physical and chemical properties, an impinger and a specially designed NP sampler, the Tsai diffusion sampler (TDS) [26], were used. A graduated midget impinger (30 mL, model 737550-0000, Kimble Chase, Vineland, NJ, USA) was filled with 10 mL deionized water and connected to a GilAir Plus pump (Sensidyne, St. Petersburg, FL, USA) for sampling and suspending the particles in water at a flowrate of 1 L/min. This set-up was placed in the glove box. The impinger’s collection tube (Tygon, Saint-Goblin, Malvern, PA, USA) was grouped with the collection tubes on the RTIs, at location A.
The other sampler, TDS, was operated using sampling pumps (Pocket Pump TOUCH, SKC Inc., Eighty Four, PA, USA) at an air flow of 0.3 L/min. In TDS, a copper grid (400-mesh with SiO2 film coating, SPI, West Chester, PA, USA) for subsequent analysis by transmission electron microscopy (TEM) was attached to the center of a 25 mm-diameter polycarbonate membrane filter (0.22 mm pore size, Millipore, Billerica, MA, USA) to capture particles via deposition on the filter and grid [26]. One TDS sampler was placed at each location, A and B.
2.3. Experiment Procedure
In two separate sets of experiments, the SSS and STS products were directly deposited into a particle generator (model 8026, TSI, Shoreview, MN, USA) and aerosolized within the glovebox. Particles were emitted around the center of the glovebox. Each experiment was conducted for 40 min, including 10 min of pre-experiment background sampling, 20 min of sampling, and 10 min of postexperiment background sampling. Both NanoScan SMPS and OPS were on during this timeframe to monitor the particle concentration throughout the entire experimental window, while the impinger, particle generator, and both TDSs were only run during the 20-min experimental sampling time. During the experimental sampling time, either aerosolized SSS or STS was continuously released from the particle generator. The entire set-up and sampling method was repeated in triplicate for both SSS and STS. The experimental set-up is shown in Figure S1a,b. In addition, samples of each bulk product were extracted for elemental analysis. Three 10-mL samples were taken directly from each product after shaking, for elemental analysis. Drops of each bulk product were placed onto TEM copper grids and allowed to dry for 24 hours before microscopy analysis. The resulting TEM images and energy-dispersive X-ray spectroscopy (EDS) analyses for each product are shown in the Supplementary Information as Figures S2 and S3.
2.4. Analysis for Physical and Chemical Properties
2.4.1. Microscopic Analysis
Airborne particles collected on the filter and grid using TDS were analyzed by scanning electron microscopy (SEM) and TEM, respectively, to characterize the physical morphology and chemical composition of the particles present. The polycarbonate membrane filters were removed from the TDS samplers after collection. Small pieces of filter containing the collected particles on the surface were excised and then coated with a 10-nm-thick gold layer, followed by SEM analysis (JSM-6500F, JOEL, Peabody, MA, USA) and EDS (model 51-XMX1015, Concord, MA, USA) at 15 kV. Due to the use of a gold layer for conductivity, the element gold was excluded from the elemental analysis results. The TEM grids were removed from the filters in their TDS samplers. The TEM grids used for both aerosolization and bulk product sampling were analyzed by TEM imaging (JEM-2100F, JOEL, Peabody, MA, USA) and EDS at 200 kV. Copper grids were used for sampling, thus the copper elemental response from the background was excluded from the elemental analysis.
2.4.2. Mass Spectrometry Analysis
The particle-containing deionized (DI) water samples collected in the impinger were transferred into a sterilized vial. The impinger samples and bulk product liquid samples were analyzed using single-particle inductively-coupled plasma mass spectrometry (SP-ICP-MS) to characterize the elemental compositions and concentration of suspended particles in the water due to the aerosol sprays. A total quant analysis was conducted to determine the concentration of various particles in each impinger particle-containing liquid sample based on comparison with a blank sample (DI water) as well as a sample with known concentrations of various elements.
Samples were measured using a NexION 350D mass spectrometer (PerkinElmer, Branford, CT, USA) connected to a PFA-ST (Elemental Scientific, Omaha, Nebraska) nebulizer and a Peltier-controlled (PC3x, Elemental Scientific) quartz cyclonic spray chamber (Elemental Scientific) set at 2 °C. Samples were randomized and introduced using the prepFAST SC-2 (Elemental Scientific) autosampler. Before analysis, the nebulizer gas flow and quadrupole ion deflector (QID) were optimized for maximum indium signal intensity.
3. Results
3.1. Emitted Airborne Particles
The particle concentrations and sizes measured by two NanoScan SMPS and OPS were analyzed to provide averaged data across the three repeated experiments. The average particle concentration during background collection was subtracted to obtain the relative increase of concentration during the use of each spray product. The resulting adjusted average total concentrations of the airborne particles as measured by the three instruments throughout the entire experimental period are shown in Figure 1a,b for the testing of products SSS and STS, respectively. Starting at the tenth minute, the increases in concentration are attributed to the emission of particles in the aerosolized product. As seen in Figure 1, SSS (Figure 1a) released a greater amount of particles than STS (Figure 1b) across all three instruments. The NanoScan SMPS was used to measure particle sizes of 10–420 nm at location (A) close to the emission. Accordingly, the aerosol concentrations released from SSS were approximately 3× the amount of particles released from STS, peaking at approximately 5800 particles/cm3 for SSS and 1800 particles/cm3 for STS. Particle concentrations measured in the size range of 0.3–10 μm by OPS were consistent with the SSS product releasing more particles than the STS product.
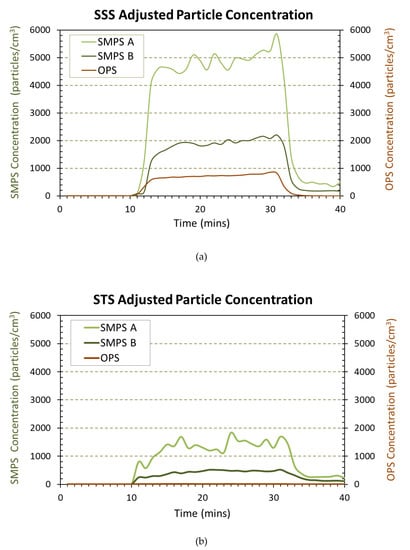
Figure 1.
Real time instrument (RTI) concentration data for particles released from Silver Shield Sanitizer (SSS) (a) and Silver Throat Spray (STS) (b).
The adjusted average size fractioned particle number concentrations measured by NanoScan SMPS and OPS are shown in Figure 2 following the product aerosolization of SSS (Figure 2a–c) and STS (Figure 2d–f). Each figure shows the particle size distributions of the background particles, emitted particles during experimental sampling, and remaining particles post sampling. During experimental sampling, the aerosols were significantly higher in concentration and contained a wider range of particle sizes than the background and post sampling data. Aerosol concentrations less than 420 nm in size emitted from SSS peaked at particle diameters of 15.4 nm, 27.4 nm, and 115.5 nm for measurements at both locations, i.e., close to (A) and far from (B) and the emission source location. Similarly, the aerosol concentration from STS exhibited modes at particle diameters of 15.4 nm, 27.4 nm, and 115.5 nm, but with the greatest concentration at a particle diameter of 15.4 nm for both sampling locations. The aerosol concentrations in the sizes of 0.3–10 μm, as measured by OPS, showed that the highest concentrations of particles for both SSS and STS were detected near the OPS limit of detection at a diameter of 337 nm, as seen in Figure 2c,f.
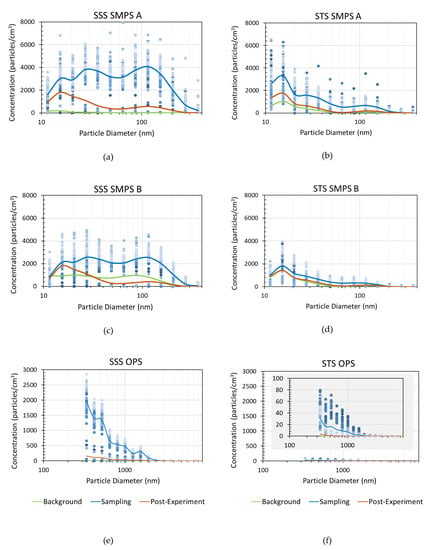
Figure 2.
Nanoscan scanning mobility particle sizers (SMPS) and optical particle sizer (OPS) average data across 3 trials of aerosolized particle size distribution for three time periods, i.e., Background, Sampling, and Post Sampling periods. (a)–(c) Adjusted size distribution of the particles released from SSS. (d)–(f) Adjusted size distribution of the particles released from STS across 3 trials. Note: Standard deviation data are presented in the supplementary information (SI) file.
The adjusted particle number distribution within the size of 10–420 nm, comparing SSS and STS during the emission/experimental sampling period, are shown in Figure 3a for location A and Figure 3b for location B. For both locations, SSS maintained an overall higher concentration of particles than STS across the majority of the detectable size range (10–420 nm). The greatest concentration of aerosolized particles at location A, close to the emission source, was 4090 particles/cm3 for SSS (115.5 nm in diameter) compared to 3310 particles/cm3 for STS (15.4 nm in diameter). At location B, farther from the emission source, the concentration of particles was reduced considerably for both products, where the greatest concentration of particles from SSS aerosolization was 2570 particles/cm3 (27.4 nm), compared to a concentration of 1821 particles/cm3 (15.4 nm) for STS.
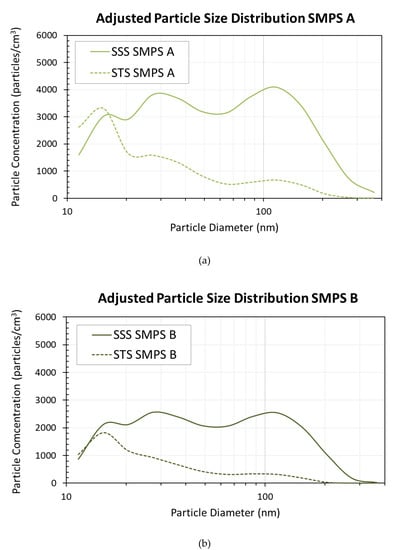
Figure 3.
Comparison of SSS and STS aerosolized particle distributions collected by Nanoscan SMPS during the sampling period at locations of (a) 15 cm/6 in. from the source and (b) 30 cm/12 in. from the source.
3.2. Sampling and Analytical Techniques
3.2.1. Impinger and SP-ICP-MS Analysis
The aerosolized particles from both spray products demonstrated fairly low concentrations of silver content based on SP-ICP-MS analysis. The particles in the liquid suspension, captured using the impinger method, were analyzed and the results are presented in Figure 4, which compares the concentrations of the most prominent elements reported in the SP-ICP-MS analysis to a blank control (DI water) and the SP-ICP-MS analysis of the bulk products before aerosolization. The sprayer, spraying process, and particle interaction of the product contents within the liquid and air during aerosolization and collection processes may affect the amount of aerosolized silver particles and other containing substances able to be dispersed upon aerosolization and collected in the impinger DI water [27,28]. Differences in bulk and aerosolized particle concentration were found in this project, suggesting further study is needed to understand the parameters affecting composition variations.
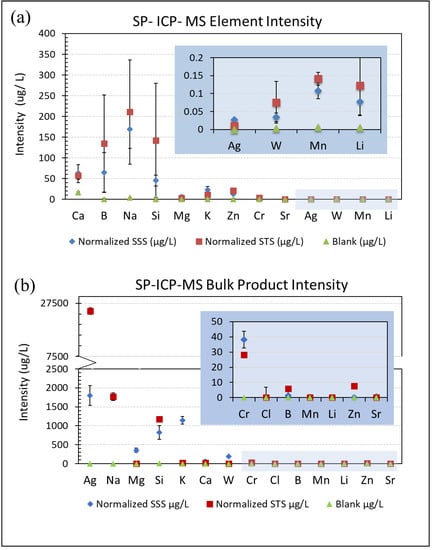
Figure 4.
SP-ICP-MS average element intensity with standard error bars across three trials for SSS and STS impinger samples from the sprayed products (a) and the bulk products before spraying (b). (a) Aerosolized product Ag intensities were 0.0105 μg/L for STS and 0.0273 μg/L for SSS. Element intensities less than 0.2 μg/L are indicated in the scaled area. (b) Bulk product Ag intensity was 24,567 μg/L for STS and 1793 μg/L for SSS. Element intensities less than 50 μg/L are indicated in the scaled area.
It was found in this study that two products intended to have different uses (all-purpose cleaner vs. dietary supplement), exhibited strikingly similar chemical compositions when aerosolized. Sodium (Na), boron (B), and silicon (Si) were the highest intensity elements for both the SSS and STS products. Compared to the other elements present, the silver (Ag) intensity was low for both products. SSS had a slightly higher concentration of silver (0.0273 μg/L) than STS (0.0105 μg/L). Surprisingly, the intensities of the other metallic elements such as magnesium (Mg) and strontium (Sr) were significantly higher than expected, relative to that of silver (Ag). Although the silver content of the product was lower than expected, when compared to the threshold limit, the element intensities of both products exceeded the silver NP inhalation limit of 0.01 mg/m3 or 0.01 μg/L as recommended by OSHA, MSHA, and NIOSH. However, the concentrations measured in this study were in an enclosed glovebox at a distance of approximately 15 cm (6 in.) from the emission of the spray product. This evaluation represented a possible worst-case scenario of product use, spraying a large amount of product in a small and confined space/room.
3.2.2. Nano Sampler and Microscopic Analysis
This section presents the results of the solid aerosol particles collected on the filters and grids. From SEM analysis, the elemental compositions and morphologies of the collected NPs on the TDS polycarbonate filter are presented in Figure 5 and Figure 6. NPs collected on the TDS grid and analyzed using TEM are presented in Figure 7 and Figure 8. EDS compares the element energy level reported in keV against the number of X-ray counts received. Figure 5 depicts the EDS analysis and corresponding SEM images of an approximately 1-μm diameter particle released from STS. EDS analysis confirmed the presence of silver (Ag), which accounted for approximately 1.7% of the total particle percent by weight, among other elements including carbon (C), oxygen (O), sulfur (S), silicon (Si), and chlorine (Cl). Similarly, EDS analysis and corresponding SEM images of a particle released from SSS are shown in Figure 6, where silver accounted for 3.7% of the total percent by weight.
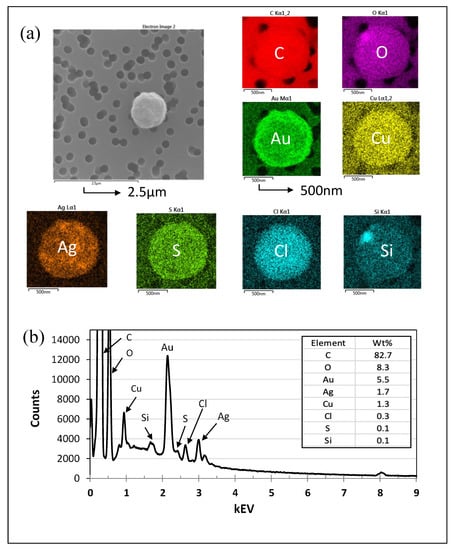
Figure 5.
Microscopy analysis of particles aerosolized from STS. (a) SEM-EDS image of particles used for analysis. The scale bar of the SEM image is 2.5 μm. This particle was found to contain the elements carbon (C), oxygen (O), gold (Au), copper (Cu), silver (Ag), sulfur (S), chlorine (Cl), and silicon (Si) from left to right, with scale bars of 500 nm. (b) EDS analysis of the particle in image (a). Note: Au was used as the coating and therefore was excluded from further analysis or discussion.
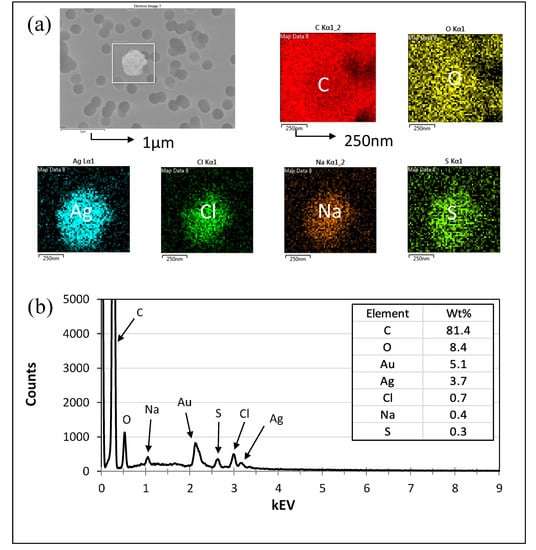
Figure 6.
Microscopy analysis of particles from SSS aerosolization using SEM and EDS. (a) SEM-EDS image of particles used for analysis. The scale bar of the SEM image is 1 μm. This particle was found to contain the elements carbon (C), gold (Au), oxygen (O), silver (Ag), chlorine (Cl), sodium (Na), and sulfur (S), from left to right, with scale bars of 250 nm. (b) EDS analysis of the particle in image (a). Note: Au was used as a coating and therefore was excluded from further analysis or discussion.
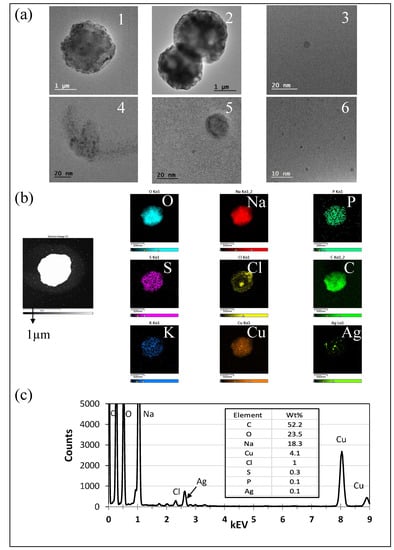
Figure 7.
Microscopy analysis of particles collected from SSS aerosolization using TEM and EDS. (a) TEM images of particles collected on a TDS copper grid from aerosolized SSS, organized from low to high magnification and ranging in size from less than 20 nm to greater than 1 μm. (b) Elemental maps of the particle used for analysis. The scale bar of the image is 1 μm. The particle was found to contain the elements carbon (C), oxygen (O), sodium (Na), phosphorus (P), sulfur (S), chlorine (Cl), potassium (K), copper (Cu), and silver (Ag), from left to right, with scale bars of 500 nm. (c) EDS analysis of particle in image (b).
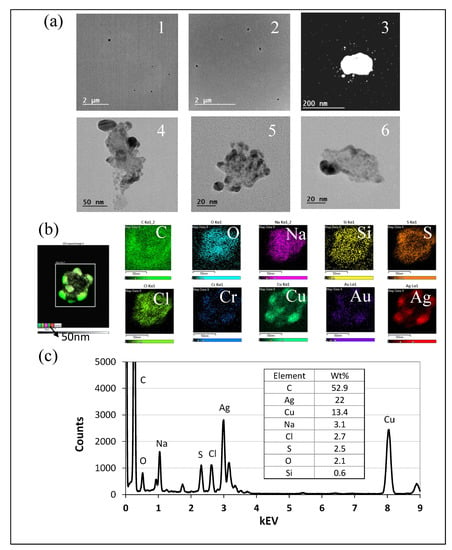
Figure 8.
TEM and EDS analyses of particles from STS aerosolization. (a) TEM images of particles collected on a TDS copper grid from aerosolized STS, organized from low to high magnification and ranging in size from less than 20 nm to greater than 1 μm. (b) Elemental maps of the particle used for EDS analysis. The scale bar is 50 nm. The particle contains the elements carbon (C), oxygen (O), sodium (Na), silicon (Si), sulfur (S), chlorine (Cl), chromium (Cr), copper (Cu), silver (Ag), and gold (Au), from left to right, all with a scale bar of 50 nm. (c) EDS analysis of particle in image (b). Note: Images 1 and 2 with low magnification present overviews of the collected samples showing no large particles observed. Images 3 to 6 clearly present nanoparticles observed with high magnification.
The elemental compositions and morphologies of the NPs collected on the TEM grids are presented in Figure 7 for SSS and Figure 8 for STS. The particles emitted from STS tended to be smaller in size and were more likely to have no distinct shape or to appear as an agglomerate of multiple smaller particles, whereas the particles emitted from SSS tended to be larger with a more defined spherical shape.
TEM images of particles collected from SSS aerosolization depicting the range of particle sizes and shapes are shown in Figure 7a. Within Figure 7a, image 1 shows circular particles less than 10 nm in diameter, while images 5 and 6 indicate the presence of smaller particles, and include circular particles less than 50 nm in diameter. Images 2 and 4 show similarly shaped circular particles greater than 1 μm in diameter. Image 3 shows a misshapen loosely agglomerated particle measuring approximately 40 nm in diameter. TEM-EDS analysis of an SSS particle measuring approximately 1 μm in diameter is shown in Figure 7b,c, where silver accounted for only 0.1% of the total particle percentage by weight.
TEM images of particles collected from STS aerosolization are shown in Figure 8a. Images 1 and 2 within Figure 8a depict small circular particles with diameters significantly less than 1 μm, while images 3, 4, and 5 show misshapen agglomerated particles measuring from 40 to 100 nm in diameter. Image 6 shows a larger misshaped particle nearly 200 nm in diameter. The TEM-EDS analysis of an STS particle measuring approximately 100 nm in diameter is seen in Figure 8b,c. Silver accounted for 22% of the total particle percentage by weight.
Analysis of particles collected on TDS using TEM, SEM, and EDS confirmed that both products emitted silver NPs when sprayed. EDS analysis of the STS particles yielded significantly higher particle counts than SSS particles, despite having an overall lower aerosolized particle concentration. Particles from both products ranged significantly across shape and size and often contained low amounts of silver in relation to other elements, which may impact NP antibacterial activity and the implications of inhalation exposure.
4. Discussion
The SEM and TEM images confirm that both SSS and STS contain silver NPs in varying sizes and compositions, while the SP-ICP-MS intensity results indicate that both products have concentrations of silver that exceed the recommended threshold of 0.01 μg/L. The new sampling methods employed in this study were found to be highly effective for silver NP content analysis of consumer goods, with many solid, nanometer-sized particles being collected by TDS and similar elements found in solid particles and the liquid suspension collected by the impinger. The long-term effects of silver NP exposure on humans remains inconclusive, in particular, the mechanism of toxicity and the impact of particle size. The National Institute for Occupational Safety and Health ( NIOSH) remains primarily focused on workplace exposure of silver NPs [29], and the U.S. Environmental Protection Agency ( EPA) has requested the submission of chemical, processing, and exposure information from nanoparticle product manufacturers since 2017, although no recommended exposure limit has been established [30].
Although the manufacturers of SSS and STS claim that each product contains 15 ppm silver (15,000 μg/L), nonetheless, only 0.0273 μg/L and 0.0105 μg/L of silver were detected, respectively. The low concentrations of silver may affect the antibacterial capabilities of these products. The dose-dependent cytotoxicity of silver NPs varies with silver NP concentration, with concentrations falling within the range of 12.5 to 50 ppm known to be toxic to bacterial and human cells [31], and other in vitro studies reporting cytotoxic effects from concentrations as low as 0.2 ppm in mouse cells [32] and 4 μg/L in human lung cells [33]. The silver NP contents of SSS and STS are significantly below this suggested toxic range, reducing the potential for user exposure. However, the discrepancy between the aerosolized, bulk product, and advertised silver NPs is of concern, with similar discrepancies reported in the analyses of other spray products [28]. The spray nozzle type, aerosolization and vaporization of droplet, and dispersion of nanoparticles were found to influence the proportions of particles to be detected or collected [27,28], with further studies needed to determine differences in exposure due to spraying technique.
Both SSS and STS advertise health benefits from silver NPs without addressing the contrasting literature in regard to the potential cytotoxic and neurotoxic effects of silver NPs on human cells. Rather, these types of products are marketed using choice words such as “safe”, “natural”, and “pure” to appeal to a wide range of health-conscious customers. This type of advertisement further highlights the disparity between consumer knowledge and company transparency in the area of nanotechnology-enabled products. As a result, we recommend and encourage the promotion of greater public education and stricter regulations on silver NP-containing product components, such as including a disclaimer and warning on consumer products, to inform and protect businesses and consumers alike.
SSS and STS each maintain nearly 5-star ratings on Amazon.com with reviewers claiming to use the products on their infants and pets. No reviews currently cite adverse health effects. However, further research on the effects of silver NP inhalation is needed to develop a complete risk analysis of SSS and STS and other consumer spray products containing NPs. In particular, a comprehensive health assessment of long-term exposure to silver NP-containing household products is necessary to develop a complete exposure analysis and deliver insight on possible health implications.
5. Conclusions
SSS and STS released significant concentrations of particles when aerosolized, with SSS emitting a greater concentration and greater sizes of particles than STS. SP-ICP-MS analysis detected low concentrations of silver in both products (0.0105 μg/L for STS and 0.0273 μg/L for SSS), with the silver components confirmed to be silver NPs by SEM imaging. The products were created for different intended uses (SSS used as a cleaning spray and STS as a dietary supplement), which could be one reason that the particle shapes and sizes vary. The silver content found in each sprayed product was significantly lower than that claimed by the product sellers. Although these discrepancies across silver NP products are unregulated, nonetheless it should be a priority among product creators and consumers alike to educate and advocate for complete transparency.
Supplementary Materials
The following are available online at https://www.mdpi.com/2073-4433/11/4/403/s1. Figures S1: (a) Visual Representation of experiment setup. SMPS A and OPS detection tubes and Impinger collection tube were placed together at a single location 0.152 m (6”) from the site of particle emission. TDS #1 was placed at a separate site 0.152 m (6”) away. The SMPS B detection tube and TDS #2 were placed at locations 0.305 m (12”) away from particle emission. (b) 3D Visual Representation of experiment set-up within the glovebox. Each tube/collection device was raised 0.305 m (12”) from the base of the glove box, with 0.152 m (6”) and 0.305 m (12”) distances measured at a diagonal from the site of particle emission. SMPS and OPS tubes extended outside glovebox, while the impinger tube connected to an impinger placed in the glovebox, Figure S2: TEM images of product SSS (a–d) organized from high to low magnification and product STS (e–h) organized from high to low magnification before spraying, and Figure S3: TEM- EDS image of STS particle from product before spraying to confirm presence of silver. The scale bar of the SEM image is 250 nm, and contains the elements carbon (C), chlorine (Cl), nickel (Ni), and silver (Ag) from left to right with scale bars of 50 nm.
Author Contributions
Conceptualization and methodology, H.C. and C.S.J.T.; Investigation and formal analysis, H.C. and N.S.; Writing–original draft preparation, H.C; Writing–review and editing, H.C., C.S.J.T., and N.S.; Supervision, C.S.J.T. and P.L.Q.; Project administration, C.S.J.T. All authors have read and agreed to the published version of the manuscript.
Funding
This research was funded by the Undergraduate Honors Program at Colorado State University, and the startup fund to faculty at Colorado State University.
Acknowledgments
The authors thank Dr. Roy Geiss for technical support in TEM and EDS analysis and Dr. Jacqueline Chaparro for technical analysis through SP-ICP-MS.
Conflicts of Interest
The authors declare no conflict of interest. The funders had no role in the design of the study, in the collection, analyses, or interpretation of data, in the writing of the manuscript, or in the decision to publish the results.
References
- Hendren, C.O.; Mesnard, X.; Dröge, J.; Wiesner, M.R. Estimating Production Data for Five Engineered Nanomaterials as a Basis for Exposure Assessment. Environ. Sci. Technol. 2011, 45, 2562–2569. [Google Scholar] [CrossRef] [PubMed]
- Drake, P.L.; Hazelwood, K.J. Exposure-Related Health Effects of Silver and Silver Compounds: A Review. Ann. Occup. Hyg. 2005, 49, 575–585. [Google Scholar] [PubMed]
- Office of the Commissioner, Nanotechnology—FDA’s Approach to Regulation of Nanotechnology Products, U S Food and Drug Administration. Available online: www.fda.gov/scienceresearch/specialtopics/nanotechnology/ucm301114.htm (accessed on 25 September 2019).
- Morones, J.R.; Elechiguerra, J.L.; Camacho, A.; Holt, K.; Kouri, J.; Ramírez, J.T.; Yacaman, M.J. The bactericidal effect of silver nanoparticles. Nanobiotechnology 2005, 16, 2346–2353. [Google Scholar] [CrossRef]
- Elechiguerra, J.L.; Burt, J.L.; Morones, J.R.; Camacho-Bragado, A.; Gao, X.; Lara, H.H.; Yacaman, M.J. Interaction of silver nanoparticles with HIV-1. J. Nanotechnol. 2005, 3, 6. [Google Scholar]
- Foldbjerg, R.; Dang, D.A.; Autrup, H. Cytotoxicity and genotoxicity of silver nanoparticles in the human lung cancer cell line, A549. Arch. Toxicol. 2010, 85, 743–750. [Google Scholar] [CrossRef]
- Simon-Deckers, A.; Gouget, B.; Mayne-L’Hermite, M.; Herlin-Boime, N.; Reynaud, C.; Carriere, M. In vitro investigation of oxide nanoparticle and carbon nanotube toxicity and intracellular accumulation in A549 human pneumocytes. Toxicology 2008, 253, 137–146. [Google Scholar] [CrossRef]
- Repar, N.; Li, H.; Aguilar, J.S.; Li, Q.Q.; Drobne, D.; Hong, Y.; Drobne, D. Silver nanoparticles induce neurotoxicity in a human embryonic stem cell-derived neuron and astrocyte network. Nanotoxicology 2018, 12, 104–116. [Google Scholar] [CrossRef]
- Reidy, B.; Haase, A.; Luch, A.; Dawson, K.A.; Lynch, I. Mechanisms of Silver Nanoparticle Release, Transformation and Toxicity: A Critical Review of Current Knowledge and Recommendations for Future Studies and Applications. Materials (Basel) 2013, 6, 2295–2350. [Google Scholar] [CrossRef]
- Trickler, W.J.; Lantz, S.M.; Murdock, R.C.; Schrand, A.M.; Robinson, B.; Newport, G.D.; Schlager, J.J.; Oldenburg, S.J.; Paule, M.G.; Slikker, W.; et al. Silver Nanoparticle Induced Blood-Brain Barrier Inflammation and Increased Permeability in Primary Rat Brain Microvessel Endothelial Cells. Toxicol. Sci. 2010, 118, 160–170. [Google Scholar] [CrossRef]
- Sun, C.; Yin, N.; Wen, R.; Liu, W.; Jia, Y.; Hu, L.; Zhou, Q.; Jiang, G. Silver nanoparticles induced neurotoxicity through oxidative stress in rat cerebral astrocytes is distinct from the effects of silver ions. NeuroToxicology 2016, 52, 210–221. [Google Scholar] [CrossRef]
- Yin, N.; Liu, Q.; Liu, J.; He, B.; Cui, L.; Li, Z.; Yun, Z.; Qu, G.; Liu, S.; Zhou, Q.; et al. Silver Nanoparticle Exposure Attenuates the Viability of Rat Cerebellum Granule Cells through Apoptosis Coupled to Oxidative Stress. Small 2013, 9, 1831–1841. [Google Scholar] [CrossRef] [PubMed]
- Xu, L.; Shao, A.; Zhao, Y.; Wang, Z.; Zhang, C.; Sun, Y.; Deng, J.; Chou, L.L. Neurotoxicity of Silver Nanoparticles in Rat Brain After Intragastric Exposure. J. Nanosci. Nanotechnol. 2015, 15, 4215–4223. [Google Scholar] [CrossRef] [PubMed]
- Liu, Y.; Guan, W.; Ren, G.; Yang, Z. The possible mechanism of silver nanoparticle impact on hippocampal synaptic plasticity and spatial cognition in rats. Toxicol. Lett. 2012, 209, 227–231. [Google Scholar] [CrossRef] [PubMed]
- Yin, N.; Hu, B.; Yang, R.; Liang, S.; Liang, S.; Faiola, F. Assessment of the developmental neurotoxicity of silver nanoparticles and silver ions with mouse embryonic stem cells in vitro. J. Interdiscip. Nanomed. 2018, 3, 133–145. [Google Scholar] [CrossRef]
- Kwon, H.B.; Lee, J.H.; Lee, S.H.; Lee, A.Y.; Choi, J.S.; Ahn, Y.S. A Case of Argyria Following Colloidal Silver Ingestion. Ann. Dermatol. 2009, 21, 308–310. [Google Scholar] [CrossRef]
- U.S. Department of Health and Human Services, National Institute of Health (NIH). Complementary, Alternative, or Integrative Health: What’s in a Name? 2016. Available online: nccih.nih.gov (accessed on 25 September 2019).
- CPI. Nanotechnology, Nanotech Project. 2019. Available online: https://www.nanotechproject.org/cpi/products/ (accessed on 18 April 2019).
- Vance, M.E.; Kuiken, T.; Vejerano, E.P.; McGinnis, S.P.; Hochella, M.F.; Rejeski, D.; Hull, M.S. Nanotechnology in the real world: Redeveloping the nanomaterial consumer products inventory. Beilstein J. Nanotechnol. 2015, 6, 1769–1780. [Google Scholar] [CrossRef]
- Hart Research Associates. Awareness & Impressions of Synthetic Biology: A Report of Findings Based On A National Survey Among Adults; Hart Research Associates: Washington, DC, USA, 9 September 2010. [Google Scholar]
- Nano and Other Emerging Chemical Technologies Blog, New York Household Cleansing Product Disclosure Program Will Require Disclosure of Nano Ingredients, 9 June 2018. Available online: nanotech.lawbc.com/2018/2006/new-york-household-cleansing-product-disclosure-program-will-require-disclosure-of-nano-ingredients/ (accessed on 25 September 2019).
- Calderon, L.; Han, T.; McGilvery, C.; Yang, L.; Subramaniam, P.; Lee, K.-B.; Schwander, S.; Tetley, T.D.; Georgopoulos, P.G.; Ryan, M.; et al. Release of airborne particles and Ag and Zn compounds from nanotechnology-enabled consumer sprays: Implications for inhalation exposure. Atmos. Environ. 2017, 155, 85–96. [Google Scholar] [CrossRef]
- Tulve, N.S.; Stefaniak, A.B.; Vance, M.E.; Rogers, K.; Mwilu, S.; LeBouf, R.; Schwegler-Berry, D.; Willis, R.; Thomas, T.A.; Marr, L.C. Characterization of silver nanoparticles in selected consumer products and its relevance for predicting children’s potential exposures. Int. J. Hyg. Environ. Health 2015, 218, 345–357. [Google Scholar] [CrossRef]
- Silver Botanicals. Silver Shield Sanitizer, all Natural Colloidal Silver Sanitizer, 12 oz. Available online: https://silver-botanicals.com/products/silver-shield-sanitizer.html (accessed on 18 April 2019).
- Silvercillin™ Spray, Designs for Health. Available online: https://shop.designsforhealth.com/silvercillin-spray?quantity=1&custcol_dfh_size=49 (accessed on 18 April 2019).
- Tsai, C.S.-J.; Theisen, D. A sampler designed for nanoparticles and respirable particles with direct analysis feature. J. Nanoparticle Res. 2018, 20, 209. [Google Scholar] [CrossRef]
- Nazarenko, Y.; Han, T.; Lioy, P.J.; Mainelis, G. Potential for exposure to engineered nanoparticles from nanotechnology-based consumer spray products. J. Expo. Sci. Environ. Epidemiol. 2011, 21, 515–528. [Google Scholar] [CrossRef]
- Park, J.; Ham, S.; Jang, M.; Lee, J.; Kim, S.; Kim, S.; Lee, K.; Park, D.; Kwon, J.-T.; Kim, H.; et al. Spatial–Temporal Dispersion of Aerosolized Nanoparticles During the Use of Consumer Spray Products and Estimates of Inhalation Exposure. Environ. Sci. Technol. 2017, 51, 7624–7638. [Google Scholar] [CrossRef] [PubMed]
- NIOSH. External Review Draft—Current Intelligence Bulletin: Health Effects of Occupational Exposure to Silver Nanomaterials; Zumwalde, R.D., Kuempel, E.D., Holdsworth, G., Eds.; U.S. Department of Health and Human Services, Centers for Disease Control and Prevention, National Institute for Occupational Safety and Health: Cincinnati, OH, USA, 2015. [Google Scholar]
- EPA. Fact Sheet: Nanoscale Materials, United States Environmental Protection Agency, 14 August 2017. Available online: https://www.epa.gov/reviewing-new-chemicals-under-toxic-substances-control-act-tsca/fact-sheet-nanoscale-materials (accessed on 25 September 2019).
- Greulich, C.; Braun, D.; Peetsch, A.; Diendorf, J.; Siebers, B.; Epple, M.; Köller, M. The toxic effect of silver ions and silver nanoparticles towards bacteria and human cells occurs in the same concentration range. RSC Adv. 2012, 2, 6981. [Google Scholar] [CrossRef]
- Park, E.-J.; Yi, J.; Kim, Y.; Choi, K.; Park, K. Silver nanoparticles induce cytotoxicity by a Trojan-horse type mechanism. Toxicol. In Vitro 2010, 24, 872–878. [Google Scholar] [CrossRef] [PubMed]
- Piao, M.J.; Kang, K.A.; Lee, I.K.; Kim, H.S.; Kim, S.; Choi, J.Y.; Choi, J.; Hyun, J.W. Silver nanoparticles induce oxidative cell damage in human liver cells through inhibition of reduced glutathione and induction of mitochondria-involved apoptosis. Toxicol. Lett. 2011, 201, 92–100. [Google Scholar] [CrossRef]
© 2020 by the authors. Licensee MDPI, Basel, Switzerland. This article is an open access article distributed under the terms and conditions of the Creative Commons Attribution (CC BY) license (http://creativecommons.org/licenses/by/4.0/).