Abstract
Clouds are significant in the global radiation budget, atmospheric circulation, and hydrological cycle. However, knowledge regarding the observed climatology of the cloud vertical structure (CVS) over Beijing is still poor. Based on high-resolution radiosonde observations at Beijing Nanjiao Weather Observatory (BNWO) during the period 2010–2017, the method for identifying CVS depending on height-resolved relative humidity thresholds is improved, and CVS estimation by radiosonde is compared with observations by millimeter-wave cloud radar and ceilometer at the same site. Good consistency is shown between the three instruments. Then, the CVS climatology, including the frequency distribution and seasonal variation, is investigated. Overall, the occurrence frequency (OF) of cloudy cases in Beijing is slightly higher than that of clear-sky cases, and the cloud OF is highest in summer and lowest in winter. Single-layer clouds and middle-level clouds are dominant in Beijing. In addition, the average cloud top height (CTH), cloud base height (CBH), and cloud thickness in Beijing are 6.2 km, 4.0 km, and 2.2 km, respectively, and show the trend of reaching peaks in spring and minimums in winter. In terms of frequency distribution, the CTH basically resides below an altitude of 16 km, and approximately 43% of the CBHs are located at altitudes of 0.5–1.5 km. The cloud OF has only one peak located at altitudes of 4–8 km in spring, whereas it shows a trimodal distribution in other seasons. The height at which the cloud OF reaches its peak is highest in summer and lowest in winter. To the best of our knowledge, the cloud properties analyzed here are the first to elucidate the distribution and temporal variation of the CVS in Beijing from a long-term sounding perspective, and these results will provide a scientific observation basis for improving the atmospheric circulation model, as well as comparisons and verifications for measurements by ground-based remote sensing equipment.
1. Introduction
As critical driving forces of climate systems, clouds play a significant role in modulating the energy budget, atmospheric circulation, and hydrologic cycle of the Earth [1,2,3,4]. Clouds are mixtures of water droplets or ice crystals suspended at a certain height in the atmosphere, resulting from water vapor cooling and condensation by atmospheric vertical motions. Atmospheric circulation is significantly affected by the vertical and horizontal gradients in the radiative and latent heat fluxes induced by clouds [5]. There are large uncertainties in the net impact of clouds on the energy budget due to two opposite effects, depending on cloud thickness [6] and the interaction with aerosols [7,8,9]; high clouds tend to warm the surface by absorbing longwave radiation, while low clouds tend to cool the surface by reflecting solar radiation. By conducting multiple simulation experiments on cloud vertical structure (CVS) effects on large-scale circulation, Wang and Rossow [10] demonstrated that CVS played an important role in modifying the radiative cooling profile and latent heating profile of the atmosphere. For example, single-layer clouds located at middle levels led to the strongest Hadley circulation, and two-layer clouds with the uppermost clouds residing in the upper troposphere also intensified the Hadley circulation. Therefore, knowledge about CVS and its variation is critical to improved understanding of atmospheric circulation. Hence, the geographic distribution and variations of CVS, including the cloud top height (CTH), cloud base height (CBH) and cloud thickness, are indispensable for constraining the cloud-related feedback in climate change in atmospheric general circulation models [10]. Unfortunately, explicit knowledge about CVS seems to be elusive because of the large temporal and spatial variability in CVSs, leading to considerable difficulty in global weather and climate prediction [2,11].
Cloud vertical structures have been successfully determined by ground-based instruments [12], radiosondes [13,14,15], aircraft [16], and ground- and satellite-based remote sensing techniques [17,18,19]. Ground-based remote sensing instruments, such as lidar [20], ceilometers, and millimeter wavelength cloud radar (MMCR) [21,22,23] allow for the accurate determination of CVS with fine resolution and continuous temporal coverage. However, lidar and ceilometers are easily affected by aerosols and random noise from pollution, and cloud radar observations are influenced by attenuation during precipitation [24,25]. Passive sensors onboard satellites, such as MODIS (Moderate Resolution Imaging Spectroradiometer), have the advantages of making large-scale and wide-coverage observations of clouds from space, but tend to underestimate low-level clouds and overestimate middle-level clouds [26]. The active sensors onboard polar-orbiting satellites, such as CloudSat and CALIPSO (Cloud Aerosol Lidar and Infrared Pathfinder Satellite Observation), show strong capability in capturing CVSs on both regional and global scales [27]. However, these satellites have a 16-day revisit cycle, and the time resolution is relatively low [28,29,30].
Radiosondes are increasingly attracting attention in climate research due to their long records and fine vertical resolutions. Typically, radiosondes can penetrate cloud layers to provide vertical profiles of temperature, relative humidity, and pressure, which are fundamental to estimating CVSs by identifying the saturated levels in the atmosphere. Poore et al. [31] produced a dataset including cloud amount, cloud type, CBH, CTH, and cloud thickness by combining 14 years of surface and upper-air observations at 63 sites in the Northern Hemisphere. Based on 20-year global twice-daily radiosonde profiles, Wang et al. [14] investigated the geographical distribution and seasonal variation of the cloud vertical structure by applying a relative humidity threshold method. Chernykh et al. [32] presented the trends in time series of cloud bases and tops from 795 radiosonde stations from 1964 to 1998 by utilizing the Comprehensive Aerological Reference Data Set (CARDS) and the method of second derivatives of temperature and humidity. Narendra Reddy et al. [15] comprehensively analyzed the frequency distribution and seasonal variation of the cloud vertical structure over a tropical station in India during the period from 2006 to 2017, based mainly on high-resolution radiosonde measurements.
Beijing, the capital of China, has experienced increasingly high-impact weather characterized by severe storms and haze under the influence of global warming [33,34,35,36], posing a threat to the security of humans and economic growth. Therefore, it is imperative to understand the fine-resolution CVS and its associated variation in Beijing because of the critical role in convective initiation and evolution of catastrophic weather [37]. Radiosondes, as references for studying atmospheric profiles, can lay a foundation for the verification of cloud characteristics by remote sensing equipment. Recently, a few studies have focused on comparison between CVS measurements by radiosondes and those by other equipment (such as cloud radar and ceilometers) in Beijing [38,39]. However, (to the best of our knowledge) no attempt has been made to examine the climatology of the CVS over Beijing from long-term sounding observations.
Therefore, the objective of this study is to retrieve the CVS with a robust method by radiosonde and then elucidate the distribution and temporal characteristics of the CVSs at the Beijing Nanjiao Weather Observatory (BNWO, 39.81° N, 116.47° E, 32 m above sea level) based on long-term soundings for the period from January 2010 to December 2017. The remainder of this paper proceeds as follows: Section 2 describes the data and methods employed, followed by consistency analysis between MMCR and radiosonde observations, as well as the climatology, distribution and seasonal variation of CVSs over Beijing, in Section 3. Finally, the key findings are summarized in Section 4.
2. Data and Methods
2.1. Radiosonde and MMCR Observations
The data considered here are collected at the BNWO, a Chinese national atmospheric observatory dedicated to comprehensive observation experiments and meteorological research. Active and passive remote sensing instruments are installed and operated at the BNWO, including an MMCR, a multichannel microwave radiometer, a wind profiler radar, and a backscatter lidar, in addition to an operational L-band sounding system that is launched twice a day by the Chinese Meteorological Administration (CMA) [40,41]. The availability of all these nearly collocated instruments provides the opportunity to make an analytical comparison of CVSs.
The L-band sounding system used in this study consists of GFE (L) 1 secondary wind radar and a GTS1 digital electronic radiosonde, which are located at the BNWO [13]. With a high-temporal resolution of 1.2 s and vertical resolution of approximately 8 m, the L-band radiosonde has the ability to measure wind direction, wind speed, temperature, pressure, and relative humidity (RH) from the ground to an altitude of approximately 30 km at all levels twice a day {at 0800 Local Standard Time (LST, UTC+8) and 2000 LST} since 2010. To improve the predictability of high-impact weather, two additional soundings (i.e., 0200 LST and 1400 LST) are launched at the BNWO in summer or winter.
From the results of the World Meteorological Organization (WMO) comparison of high-quality radiosonde systems in Yangjiang, China in 2010, there is good consistency between GTS1 radiosondes and Vaisala-RS90 radiosondes, with a temperature deviation of less than 0.4 K and humidity deviation of approximately 4–6 % below a 14 km height [42], indicating that the performance of the GTS1 radiosonde is reliable. Therefore, a total of 6550 profiles were collected at the BNWO during the period of January 1, 2010 to December 31, 2017, including 13 profiles at 0200 LST, 2919 profiles at 0800 LST, 700 profiles at 1400 LST and 2918 profiles at 2000 LST.
With a vertical resolution of 30 m and a temporal resolution of 1 min for a single profile, the Ka-band MMCR installed by the Meteorological Observation Center of CMA at the BNWO in 2013 is expected to provide continuous cloud observations for improving numerical weather forecasts. Based on the vertically resolved reflectivities continuously observed at the BNWO, the CVSs are determined using the method proposed by Zhou et al. [22].
2.2. Determination of CVS by Radiosonde
Clouds form when water vapor in the atmosphere reaches saturation, so the CVS can be obtained by identifying the saturated levels in the atmosphere. Several methods have been developed to determine CVS based on the profiles of temperature, relative humidity (RH), and pressure by radiosonde measurements [31,43,44,45,46]. Poore et al. [31] estimated the cloud base and cloud top heights using temperature-dependent dewpoint depression thresholds (PWR95 method for short). Wang and Rossow [43] retrieved CVS based on temperature, pressure, and RH directly derived from the humicap (WR95 method), and the algorithm was conducted as follows: (1) RH was computed with respect to ice instead of liquid water for the levels with temperatures lower than 0 °C; (2) two thresholds were set for judging clouds (min RH = 84% and max RH = 87%); (3) there must be a negative (positive) RH jump exceeding 3% at the cloud top (bottom) from the above (underlying) level; and (4) the minimum threshold of CBH was set as 500 m. Chernykh and Eskridge [44] considered CVS to be closely connected with variations in temperature and RH (CE96 method), in which clouds were identified when the second derivatives of the temperature and RH with respect to the height (z) were positive and negative, respectively, i.e., T(z) ≥ 0 and RH(z) ≤ 0. Minnis et al. [45] developed an empirical parameterization where the probability of the occurrence of clouds (POC) was calculated based on RH and temperature measurements from radiosondes, and the cloud layer was identified wherever POC ≥ 67% (MNS05 method). Zhang et al. [46] improved the WR95 method by applying altitude-dependent RH thresholds instead of a single RH threshold (ZHA10 method), i.e., minimum and maximum RH thresholds in cloud layers (min-RH and max-RH) and minimum RH thresholds within the distance of two adjacent layers (inter-RH), based on the observation from a RS90 radiosonde in an experiment implemented in Anhui Province of China.
Costa-Surós et al. [47] compared the CVSs derived from the PWR95, WR95, CE96, MNS05, and ZHA10 methods, which were applied to radiosonde data obtained at the Atmospheric Radiation Measurement (ARM) Southern Great Plains site in 2009, and concluded that the ZHA10 method had certain advantages, with a perfect agreement of 53.9% and an approximate agreement of 29.5%; these researchers improved the ZHA10 method by raising the minimum cloud thickness threshold to 400 m. The results showed that the consistency between CVSs by radiosonde and other observations was further improved.
According to previous studies and the performance of the GTS1 radiosonde, the algorithm of ZHA10 [46] is applied and improved for CVS detection in this study (hereinafter referred to as the ZHA18 method): (1) To avoid the bias in CVS determination induced by rainfall, the radiosonde measurements under rainy conditions (rainfall amount > 0.1 mm) were excluded from the CVS detection. (2) Because the dry bias of the GTS1 radiosonde is on the order of 10% below 500 hPa [48], the height-resolving thresholds used in the ZHA10 method are adjusted, as shown in Table 1. (3) Setting the minimum CBH at 280 m AGL (above ground level), as in ZHA10, may not be applicable for data from Beijing because the minimum thresholds of CBH should be set according to local observations in connection with weather conditions and climate characteristics. Thus, cloud observations from the ceilometer at the BNWO during the period from January 2014 to December 2017 are obtained and analyzed in this study. The highest frequency is at approximately 290 m for cloud bases lower than 500 m according to the ceilometer data from the BNWO, so the lowest cloud base height is set to 290 m. (4) The threshold of cloud thickness, i.e., 30.5 m for low clouds and 61 m for high clouds in the ZHA10 method, tends to result in misjudgment of single-layered clouds with loose structures as multilayered clouds, so the threshold is modified to 400 m for low clouds and 300 m for middle-high clouds in this paper to make the results more accurate and reasonable. In our previous studies [13], we conducted uncertainty analysis in determining CBH from radiosonde measurements by varying critical RH thresholds. It was concluded that the CBHs calculated using various RH thresholds (RH = 83%, 84%, and 85%) did not change significantly.

Table 1.
Summary of height-resolving relative humidity (RH) thresholds (ZHA18).
3. Results and Discussion
3.1. Consistency Analysis
It is necessary to verify the accuracy of CVS retrieved from the ZHA18 method based on radiosonde observations before proceeding further. The Megacities Experiment on Integrated Meteorological Observations in China has been carried out at the BNWO since 2016, supplying opportunities for comparison and verification among different observations. Therefore, the CVSs retrieved from the millimeter-wave cloud radar (MMCR) implemented at the BNWO are compared with the CVS estimation from the radiosonde data from December 2016 to March 2017. Figure 1 shows a comparison between the CVS retrieved from MMCR and that from the radiosonde data at 0800 LST on 11 March 2017. The CVS detected by radiosonde is comparable to that derived from MMCR. More specifically, the CTH and CBH from the MMCR are 6920 m and 3000 m, respectively, when averaged over one minute from 0700 LST to 0800 LST, while the CTH and CBH from the radiosonde are 6842 m and 3556 m, respectively. Therefore, the CVS results are in good agreement. Figure 2 shows another example of CVS observed at 0800 LST 26 December 2016. It can be seen that two-layer clouds are detected both by radiosonde and MMCR. The CBH of lower layer of clouds detected by radiosonde is 1535 m on average, which is slightly lower than that derived from MMCR (1725 m). However, the CTH of uppermost layer clouds observed by radiosonde is about 2500 m higher than MMCR. This is possibly caused by the hysteresis effect of the humidity sensor of the radiosonde, whose accuracy tends to decrease greatly in low temperature environments and results in the higher CTHs derived by radiosonde. The correlation between the cloud height observations by MMCR and radiosonde is also examined, as shown in Figure 3. This high correlation coefficient (R > 0.76) indicates that the CTH and CBH retrievals from MMCR agree well with those from radiosonde observations. Furthermore, it is worth noting that the best fits do not follow the 1-to-1 line. In particular, the CTHs derived by radiosonde tend to be higher than those derived from MMCR for higher clouds, while CBHs derived by radiosonde tend to be lower than those obtained from MMCR for lower clouds. The potential reasons for the deviation of CTHs between radiosonde and MMCR are twofold: (1) From the perspective of MMCR detection capability, it is likely that the echo of the high-level thin cloud detected by the radiosonde will be lower than the threshold of MMCR (−40 dBz), which leads to the lower cloud heights retrieved by MMCR. (2) The accuracy of the humidity sensor of the radiosonde decreases greatly in low temperature environments (especially below −30 °C), and this hysteresis effect results in the higher CTHs from radiosonde. From the perspective of thermodynamic properties, water vapor reaches saturation and begins to form cloud droplets at an altitude which radiosonde identifies as CBH. In this case, the size and concentration of cloud droplets are too small to be detected by MMCR, leading to the overestimated MMCR-derived CBH.
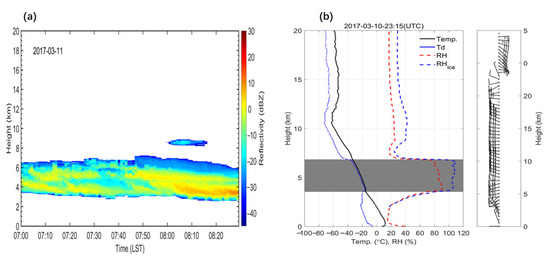
Figure 1.
(a) Cloud vertical structures (CVS) derived from millimeter wavelength cloud radar (MMCR) at Beijing Nanjiao Weather Observatory (BNWO, 39.81° N, 116.47° E, 32 m above sea level) during 0700 to 0830 LST on 11 March 2017; (b) CVS from radiosonde sounding measurements at 0715 LST 11 March 2017.
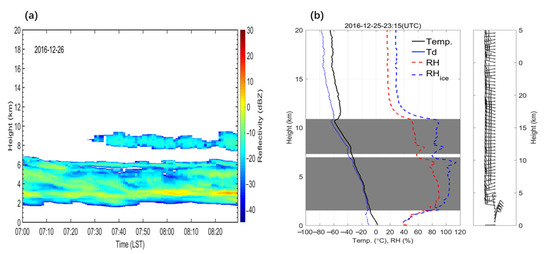
Figure 2.
(a) Cloud vertical structures (CVS) derived from millimeter wavelength cloud radar (MMCR) at Beijing Nanjiao Weather Observatory (BNWO, 39.81° N, 116.47° E, 32 m above sea level) during 0700 to 0830 LST on 26 December 2016; (b) CVS from radiosonde sounding measurements at 0715 LST 26 December 2016.
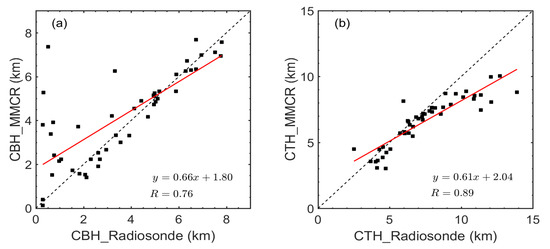
Figure 3.
Scatterplots of cloud height observations from MMCR and radiosonde (a. cloud base height (CBH), b. cloud top height (CTH)). Note that the red line denotes the linear fitting curves. Also shown are the regression equation and correlation coefficient.
To make further comparisons, the CBHs retrieved from the ceilometer operated at the BNWO are also compared with those from the radiosonde soundings from December 2016 to March 2017. Overall, the CBHs derived by radiosonde are consistent with those derived by ceilometer, with a correlation coefficient greater than 0.9, as shown in Figure 4. The CBHs derived from radiosonde are generally lower than those from ceilometer, likely due to the differential detection capability of both instruments.
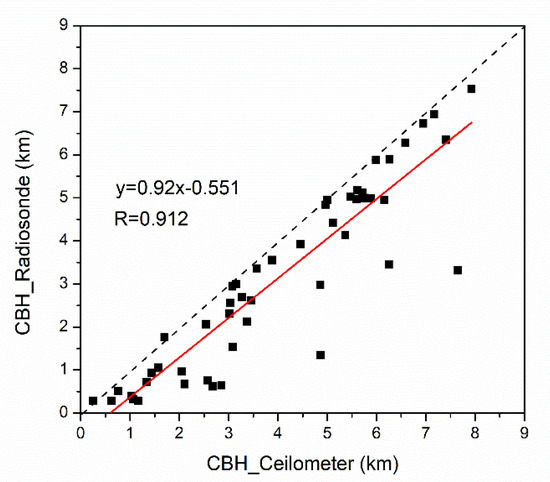
Figure 4.
Scatterplots of cloud base heights derived from ceilometer against those from radiosonde. Note that the red line denotes the linear fitting curve. Also shown are the regression equation and correlation coefficient.
3.2. Overall Statistics
Based on the radiosonde observations at the BNWO from January 2010 to December 2017, the number of profiles that are identified as clear-sky, single-layer cloud and multilayer cloud from each season are calculated using the method described in Section 2.2, and the occurrence frequency (OF) of cloudy profiles or clear-sky profiles is defined as the ratio of the number of cases identified as cloudy or clear-sky to all the valid radiosonde launches, respectively. The OF of clear-sky, one-layer, two-layer, three-layer, and four- or more-layer clouds for four seasons is calculated as shown in Figure 5. In general, the OF of clouds in Beijing is slightly higher (~56.3%) than the OF of clear-sky clouds (~43.7%). From the aspect of seasonal variation, the total number of profiles taken during spring, summer, autumn, and winter are 1476, 2143, 1482, and 1449, respectively, among which the number of cloudy profiles in the four seasons are 737, 1490, 813, and 649, respectively. Cloudy profiles account for 11.3%, 22.7%, 12.4%, and 9.9% of the time with balloon launched in four seasons, respectively. Hence, the OF of clouds peaks in summer (~22.7%) and reaches a minimum in winter (~9.9%). Single-layer, two-layer, three-layer, and four- or more-layer clouds account for 33.3%, 16.5%, 5.1%, and 1.4% of all radiosonde launches, respectively, indicating that single-layer clouds are dominant in Beijing and that two-layer clouds are the main type of multilayer clouds. Although the frequency of multilayer clouds is lower than that of single-layer clouds, multilayer clouds play an important role in the study of radiation transmissions and cloud macroscopic characteristics. The OFs of single-layer (multilayer) clouds during spring, summer, autumn, and winter are 7.6%, 11.6%, 7.2%, and 6.9% (3.6%, 11.2%, 5.2%, and 3.0%), respectively. Both single-layer and multilayer clouds tend to appear more frequently in summer than in the other seasons, which is mainly related to warm and moist atmospheric conditions in summer. This is consistent with previous studies. Zhang et al. [46] found that the OF of multilayer clouds is higher during summer than during autumn over Shouxian. Peng et al. [49] reported that the frequency of occurrence of single-layer and multilayer clouds is highest in summer and lowest in winter in northern China based on observations from the cloud observing satellites CloudSat and Cloud Aerosol Lidar and Infrared Pathfinder Satellite Observations (CALIPSO). In terms of the occurrence frequencies of clouds at different times, the OF of cloud at 0800 LST and that at 2000 LST are nearly the same, as shown in Figure 6. The OF of cloud at 2000 LST is higher than that at 0800 LST in spring and autumn, while the situation is the opposite in summer and winter.
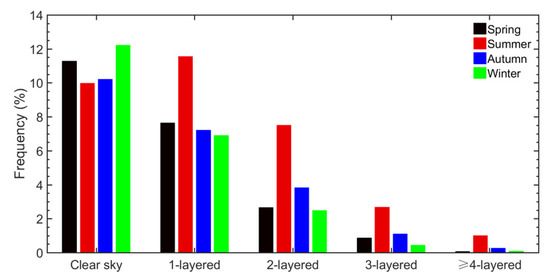
Figure 5.
Occurrence frequencies of clear skies and one-layer, two-layer, three-layer, and four- or more-layer clouds at BNWO in four seasons during 2010–2017.
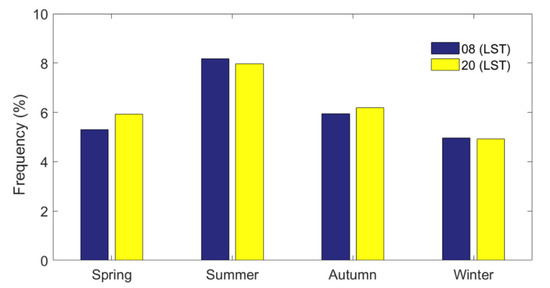
Figure 6.
Cloud frequency in Beijing at 0800 and 2000 LST in four seasons during 2010–2017.
There are a series of effects of different cloud types residing at different altitudes on the earth radiation budget [50]. According to the method proposed by Zhang et al. [46], clouds have been classified into four groups based on the CBH and cloud thickness: (1) high-level clouds with bases greater than 5 km; (2) mid-level clouds with bases ranging from 2 to 5 km; (3) low-level clouds with bases lower than 2 km and thickness less than 6 km; and (4) deep convective clouds (DCCs) with a base at less than 2 km and thicknesses greater than 6 km. The occurrence frequencies of different cloud regimes in four seasons are calculated, and shown in Figure 7. These four types of clouds account for 9.7%, 20.9%, 11.8%, and 13.9% of all valid launches, respectively. The occurrence of mid-level cloud is more frequent than that of other cloud types in spring, autumn, and winter, demonstrating that mid-level clouds are dominant in Beijing, while the cloud frequency of DCCs is highest among the four cloud types in summer. This is mainly because Beijing is strongly affected by the East Asian Summer Monsoon that brings warm and moist air mass from the South China Sea and Northwestern Pacific Ocean, which is oftentimes linked to strong convective cloud and precipitation. Low-level (high-level) clouds account for approximately 1.7%, 5.7%, 2.6%, and 1.8% (2.7%, 4.3%, 1.8%, and 1.0%) of all valid launches during the spring, summer, autumn, and winter, respectively.
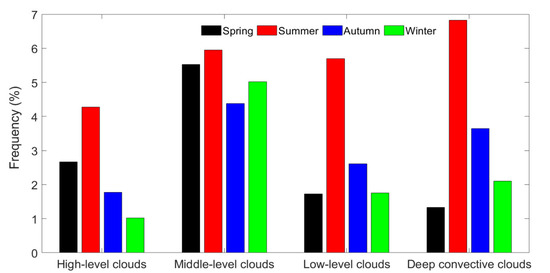
Figure 7.
Occurrence frequencies of diverse cloud regimes in Beijing in four seasons during 2010–2017.
Figure 8 and Figure 9 show the mean vertical structure (cloud top height, cloud base height and cloud thickness) of one-layer, two-layer, three-layer, and all clouds during the whole period and different seasons, respectively. Overall, the average CTH and CBH of all the clouds in the Beijing area are 6.2 km and 4.0 km, respectively.
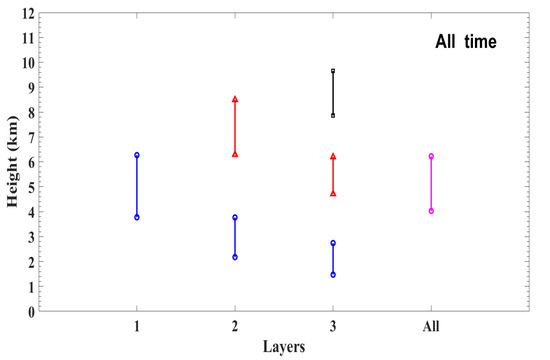
Figure 8.
Mean vertical structures (cloud top height, cloud base height, and cloud thickness) of one-layer, two-layer, three-layer, and all clouds in Beijing.
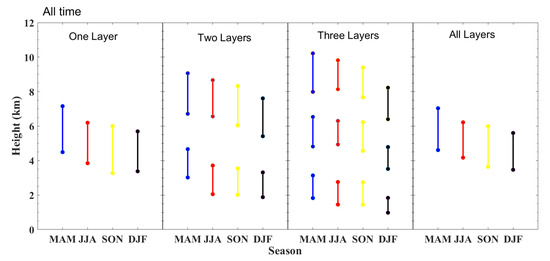
Figure 9.
Mean vertical structures (cloud top height, cloud base height, and cloud thickness) of one-layer, two-layer, three-layer, and all clouds observed during different seasons.
In terms of the vertical distribution of multilayer clouds, the average CTH of the upper layer of three-layer clouds is the highest (~9.7 km), followed by those of the upper layer of two-layer clouds (~ 8.5 km), single-layer clouds (~ 6.3 km), and the middle layer of the three-layer clouds (~ 6.2 km). The CTH of the lower layer of three-layer clouds is the lowest (~2.7 km). Similar to the CTH distribution, the CBH of the upper layer of three-layer clouds reaches the highest (~7.9 km), while the lower layer of three-layer clouds reaches the lowest (~1.5 km). The vertical structure of different cloud layers at different times is also investigated, which is shown in Figure S1. The cloud height generally follows an upward trend from 0800 LST to 2000 LST: 0800 LST > 1400 LST > 2000 LST. The average CTH and CBH of all the clouds at 0800 LST (2000 LST) are 3.7 km (4.4 km) and 5.7 km (6.8 km), respectively, which are similar to the results given by Zhang et al. [13], who analyzed the climatology of CBH from long-term radiosonde observations in China.
From the perspective of seasonal variation of CVS (Figure 9), the average CTH and CBH reach the maximum (7.0 km and 4.6 km, respectively) in spring while reaching the minimum (5.6 km and 3.5 km, respectively) in winter. This result is basically consistent with previous conclusions regarding the characteristics of CVS distribution in northern China using observations from CloudSat and CALIPSO [51,52].
The average cloud thickness in Beijing is 2.2 km. The single-layer clouds are thicker than the layers forming the multilayer clouds, and the upper-layer clouds are thicker than the lower-layer clouds in the multilayer clouds during all seasons. This phenomenon could be mainly attributed to the cloud dynamic process. By and large, the thickness of clouds depends on the degree or extent to which the cloud mixes with its surrounding dry air. Under the influence of the strong convective activities in the atmospheric boundary layer, low-level clouds tend to continuously blend with the ambient dry air, resulting in the decrease of water vapor content and cloud dissipation. However, cloud lifetime tends to be dramatically elongated in the cold upper troposphere because the saturation specific humidity is much smaller than the condensed water loading of cloudy updrafts, which leads to slow cloud evaporation and decay [53]. On the other hand, thermodynamic processes, namely the exchange of longwave radiation between the cloud base of the upper layer and the cloud top of the lower layer, at the very least in part explains the distribution of the CVS. As a result, the existence of upper layers of clouds exerts a strong effect on the reduction of longwave radiation cooling at the top of the lower layer of clouds [17,46]. The maximum cloud thickness occurs during spring for the three-layer clouds and the uppermost layer of two-layer cloud configurations. However, the minimum cloud thickness is observed during winter for single-layer clouds and the lower layer of multilayer clouds. In terms of seasonal variation of CVS at different local times (Figure S2), the average cloud thickness of single-layer clouds in all seasons at 2000 LST is larger than that at 0800 LST. The average cloud height reaches a maximum in spring and a minimum in winter at both local times.
The CVS of different cloud regimes in four seasons for one-layer clouds are examined as shown in Figure 10. At 0800 LST, cloud heights and cloud thickness of low-level clouds both reach a maximum in spring, with average CBH, CTH, and cloud thickness of 0.6 km, 2.3 km, 1.7 km, respectively. For middle-level and high-level clouds, cloud heights both peak in summer while reaching a minimum in winter. In summer, the average CBH and CTH of middle-level clouds (high-level clouds) is 3.6 km (7.4 km) and 6.1 km (9.5 km), respectively. The difference of cloud heights between summer and winter is larger for high clouds than that for middle clouds. For deep convective clouds, cloud heights reach a maximum in spring, with average CBH and CTH of 0.9 km and 12.9 km, respectively. At 2000 LST, the CVS of different cloud types in four seasons is similar to that at 0800 LST, However, the cloud heights are generally larger than those at 0800 LST. The thickness of different types of clouds varies from season to season. The average cloud thickness of low-level, middle-level, high-level, and deep convective clouds at 0800 LST (2000 LST) is 1.5 km (1.8 km), 2.3 km (2.4 km), 2.1 km (2.9 km), and 9.4 km (10.0 km), respectively. The seasonal variability of cloud thickness is largest for deep convective clouds and smallest for low-level clouds.
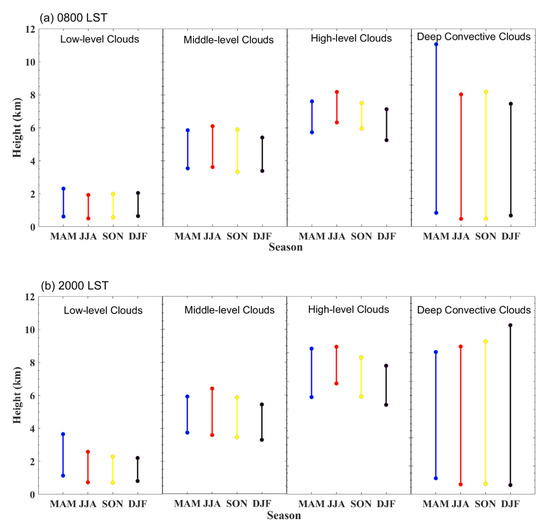
Figure 10.
Mean vertical structures (cloud top height, cloud base height and cloud thickness) of low-level, middle-level, high-level, and deep convective clouds observed during different seasons at 0800 LST (a) and 2000 LST (b).
3.3. Frequency Distribution and Seasonal Variation of CVS
The occurrence frequency and cumulative frequency of the CBH, average CTH, CTH of the uppermost layer, and cloud thickness observed during the whole period in Beijing are shown in Figure 11a,b. The cloud top generally resides below an altitude of 16 km, and the occurrence frequency of clouds with top heights lower than 10 km reaches 80%. The peak of the average CTH (CTH for the uppermost layer) is observed at ~1.5 km (~9.5 km), with a frequency of 5.8% (6.1%). The CBH from radiosonde observations in Beijing is generally low. Clouds with base heights ranging from 0.5 to 1.5 km contribute approximately 43% of all the cloudy cases.
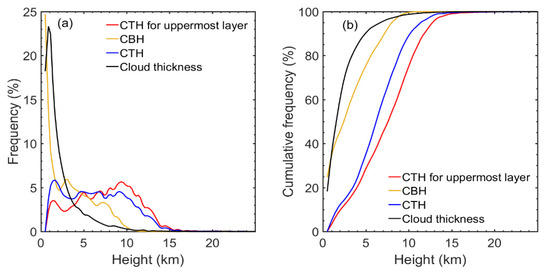
Figure 11.
Occurrence frequency (a) and cumulative frequency (b) distributions of cloud base and cloud top heights (km) and layer thicknesses (km) for all cloud layers and cloud top height (km) of the highest cloud layers during the whole period in Beijing. The altitude bin size is 500 m.
The CBHs are subtracted from the CTHs of each cloud layer to extract the cloud thickness. The frequency distribution pattern of cloud thickness is similar to that of CBH, showing a tendency to decrease exponentially as cloud thickness increases. The occurrence frequency of cloud thickness reaches a maximum (~23.2%) below 500 m for all seasons. In terms of cumulative frequency, more than 43% (84%) of the cloud layers have cloud thicknesses < 1 km (<3.5 km).
The cloud frequency as a function of height for single-layer clouds, two-layer clouds, three-layer clouds, and all clouds are calculated and shown in Figure 12. The occurrence frequencies of all clouds and single-layer clouds show a bimodal distribution, with the first peak observed at ~1 km and the second peak observed between 6 and 7 km of altitude. Most of the clouds reside at altitudes of 1 to 9 km. The occurrence frequencies of the mid-layer and upmost layer of two-layer clouds and three-layer clouds have distributions close to the normal distribution. For two-layer cloud systems, the lower layers are concentrated at altitudes below 5.5 km at a frequency of 80%, and the cloud frequency tends to decrease sharply with height after reaching the maximum at ~1 km. Comparatively, the uppermost cloud layers appear over a wide height range of 1–14 km with the peak frequency centered at 8 km. The frequency of the uppermost, middle, and lower layers of the three-layer cloud peaks at 1 km, 5.5 km, and 9.7 km, respectively. Most of the uppermost (middle) layer clouds are located at altitudes between 3 and 14 km (2 and 11 km), while the lower layer clouds are concentrated at altitudes below 3.9 km. This conclusion is generally consistent with the results given by Wang et al. [54], who analyzed the cloud frequency in northern China using CloudSat data, where the frequencies of single-layer clouds and multilayer clouds are also normally distributed, whereas the altitude at which the cloud frequency reaches its peak is slightly higher than the results in this paper.
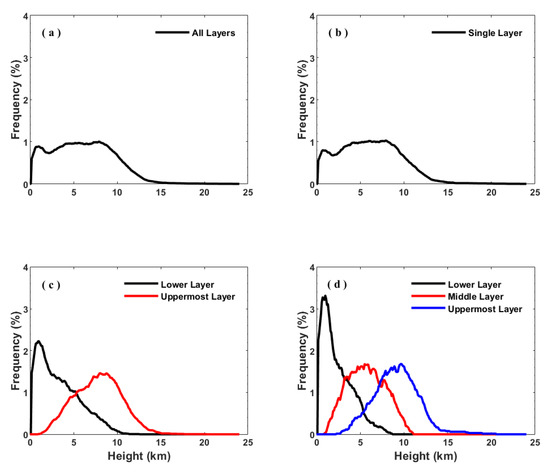
Figure 12.
Distributions of occurrence frequencies as a function of height for all cloud layers and (a) single-layer (b), two-layer (c) and three-layer cloud systems (d) in Beijing. In the two-layer cloud system, the red and black lines represent the uppermost layer and lower layer, respectively. In the three-layer cloud system, the blue line, red line, and black line represent the uppermost, middle, and lowest layers, respectively.
The seasonal variation in cloud frequency at different altitudes is shown in Figure 13. Except during the spring season, the cloud frequency pattern represents a trimodal distribution, with the first peak observed at altitudes of 1 km, 1 km, and 0.7 km, followed by the second (third) peak at altitudes of 4.7 km, 4 km, and 4 km (8.7 km, 7.6 km and 6 km) in summer, autumn, and winter, respectively. In spring, the cloud frequency shows a unimodal distribution with peak values concentrated between 4 and 8 km. Therefore, the height at which the cloud frequency reaches its peak is relatively highest in summer and lowest in winter.
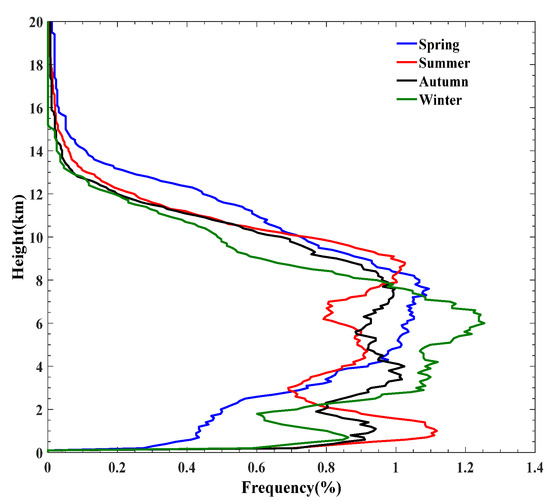
Figure 13.
The seasonal variation in cloud frequency at different heights at BNWO.
4. Conclusions
Based on the high-resolution radiosonde measurements obtained at the Beijing Nanjiao Weather Observatory (BNWO) over an eight-year period from January 2010 to December 2017, the cloud vertical structure (CVS) is retrieved by applying an improved method that relies on height-resolved relative humidity thresholds. The detected cloud layers are compared with measurements from millimeter wave cloud radar (MMCR) and ceilometer installed at the same location, and good consistency is observed between radiosonde and these two independent measurements. Then, the statistics regarding the CVS, as well as its frequency distribution and seasonal variation, are presented. To the best of our knowledge, the climatology of CVS produced in this study is the first to elucidate the distribution and temporal variation of the CVS in Beijing from a long-term sounding perspective.
Overall, the occurrence frequency (OF) of cloudy cases in Beijing is slightly higher than that of clear-sky cases, and the cloud OF is highest in summer (~22.7%) and lowest in winter (~9.9%). Single-layer clouds are dominant in Beijing, and two-layer clouds are the main type of multilayer cloud. Mid-level clouds occur more frequently than other cloud types in spring, autumn, and winter, while deep convective clouds are more prevalent in summer.
From the perspective of statistics for CVS parameters, the average cloud top height (CTH) and cloud base height (CBH) of all the clouds in Beijing are 6.2 km and 4.0 km, respectively, and the cloud heights show the characteristics of reaching peaks in spring and minimums in winter. The average cloud thickness in the Beijing area is 2.2 km. The single-layer clouds are thicker than the multilayer cloud layers, and upper-layer clouds are thicker than the lower-layer clouds in the multilayer clouds during all seasons, which is mainly attributed to the cloud dynamic process. The average cloud height and cloud thickness at 2000 LST is generally larger than that at 0800 LST. In terms of different cloud regimes, cloud heights and cloud thickness reach a maximum in spring for low-level clouds and deep convective clouds, while peak in summer for middle-level and high-level clouds.
According to the frequency distribution of the CVS at different altitudes, the CTH basically resides below an altitude of 16 km, and CBH ranging from 0.5 to 1.5 km contributes approximately 43% of the cloudy cases. The frequencies of all clouds and single-layer clouds represent bimodal distribution patterns, with the first peak observed at ~1 km and the second peak observed between 6 and 7 km, while the frequencies of the mid-layer and upmost layer of two-layer clouds and three-layer clouds generally follow normal distribution patterns. In Beijing, the cloud OF has only one peak located at altitudes of 4–8 km in spring, whereas it shows a trimodal distribution in other seasons. The height at which the cloud OF reaches its peak is relatively highest in summer and lowest in winter.
The climatology of the CVS in Beijing elucidated in this paper by utilizing radiosonde data can provide a scientific observation basis for improving the cloud parameter scheme in atmospheric circulation models, as well as comparisons and verifications for measurements by ground-based remote sensing equipment. However, as the radiosonde profiles obtained at 0200 LST and 1400 LST are less than those observed at 0800 LST and 2000 LST, the result in this paper is more representative of the climatology of cloud vertical structure at 0800 LST and 2000 LST in Beijing. Regarding clouds with shorter lifetimes of only a few hours, it may cause biases. Moreover, radiosondes are generally launched twice per day, so monitoring the diurnal variation in cloud properties by this method is limited. Therefore, future studies should be focused on synergistic cloud measurements by satellite and ground-based cloud radar, in addition to a detailed investigation of the relationship of the spatial distribution between the cloud layer and the temperature profile.
Supplementary Materials
The following are available online at https://www.mdpi.com/2073-4433/11/4/401/s1, Figure S1: Mean vertical structures (cloud-top height, cloud-base height and cloud thickness) of one-layer, two-layer, three-layer and all clouds at 0800 LST (a), 1400 LST (b) and 2000 LST (c) in Beijing. Figure S2: Mean vertical structures (cloud-top height, cloud-base height and cloud thickness) of one-layer, two-layer, three-layer and all clouds observed during different seasons at 0800 LST (a) and 2000 LST (b) in Beijing.
Author Contributions
Conceptualization, Q.Z. and Y.Z.; methodology, Q.Z.; software, S.J.; validation, Q.Z., S.J. and Y.Z.; formal analysis, S.J.; investigation, Q.Z.; resources, Y.Z.; data curation, Q.Z.; writing—original draft preparation, Q.Z.; writing—review and editing, Y.Z., Q.Z. and J.J.; visualization, S.L. and Y.L.; supervision, Y.Z.; funding acquisition, Y.Z. All authors have read and agreed to the published version of the manuscript.
Funding
This research was funded by auspices of the Ministry of Science and Technology of China, grant numbers 2017YFC1501802 and 2017YFC1501701, and the National Natural Science Foundation of China, grant numbers 41805027 and 91644223.
Acknowledgments
The authors would like to acknowledge Lin Li from Beijing Meteorological Observation Center and Fa Tao from Meteorological Observation Center of CMA for providing the MMCR data and radiosonde data used in the study.
Conflicts of Interest
The authors declare no conflict of interest.
References
- Cess, R.D.; Potter, G.L.; Blanchet, J.P.; Boer, G.J.; Ghan, S.J.; Kiehl, J.T.; Treut, H.L.; Li, Z.-X.; Liang, X.-Z.; Mitchell, J.F.B.; et al. Interpretation of cloud-climate feedback as produced by 14 atmospheric general circulation models. Science 1989, 245, 513–516. [Google Scholar] [CrossRef] [PubMed]
- Stephens, G.L. Cloud Feedbacks in the Climate System: A Critical Review. J. Clim. 2005, 18, 237–273. [Google Scholar] [CrossRef]
- Zhou, C.; Zelinka, M.D.; Klein, S.A. Impact of decadal cloud variations on the Earth’s energy budget. Nat. Geosci. 2016, 9, 871–874. [Google Scholar] [CrossRef]
- Li, Z.; Barker, H.M.; Moreau, L. The variable effect of clouds on atmospheric absorption of solar radiation. Nature 1995, 376, 486–490. [Google Scholar] [CrossRef]
- Li, Z.; Cribb, M.C.; Chang, F.-L.; Alexander, T.; Luo, Y. Natural variability and sampling errors in solar radiation measurements for model validation over the Atmospheric Radiation Measurement Southern Great Plains region. J. Geophys. Res. 2005, 110, S19. [Google Scholar] [CrossRef]
- Naud, C.; Muller, J.P.; Clothiaux, E.E. Comparison between active sensor and radiosonde cloud boundaries over the ARM Southern Great Plains site. J. Geophys. Res.-Atmos. 2003, 108, 291–302. [Google Scholar] [CrossRef]
- Guo, J.; Deng, M.; Lee, S.S.; Wang, F.; Li, Z.; Zhai, P.; Liu, H.; Lv, W.; Yao, W.; Li, X. Delaying precipitation and lightning by air pollution over the Pearl River Delta. Part I: Observational analyses. J. Geophys. Res.-Atmos. 2016, 121, 6472–6488. [Google Scholar] [CrossRef]
- Guo, J.; Su, T.; Li, Z.; Miao, Y.; Li, J.; Liu, H.; Xu, H.; Cribb, M.; Zhai, P. Declining frequency of summertime local-scale precipitation over eastern China from 1970 to 2010 and its potential link to aerosols. Geophys. Res. Lett. 2017, 44, 5700–5708. [Google Scholar] [CrossRef]
- Rosenfeld, D.; Andreae, M.O.; Asmi, A.; Chin, M.; De Leeuw, G.; Donovan, D.P.; Kahn, R.; Kinne, S.; Kivekäs, N.; Kulmala, M.; et al. Global observations of aerosol-cloud-precipitation-climate interactions. Rev. Geophys. 2014, 52, 750–808. [Google Scholar] [CrossRef]
- Wang, J.H.; Rossow, W.B. Effects of Cloud Vertical Structure on Atmospheric Circulation in the GISS GCM. J. Clim. 1998, 11, 3010–3029. [Google Scholar] [CrossRef]
- Clement, A.C.; Burgman, R.; Norris, J.R. Observational and Model Evidence for Positive Low-Level Cloud Feedback. Science 2009, 325, 460–464. [Google Scholar] [CrossRef]
- Warren, S.G.; Hahn, C.J.; London, J.; Chervin, R.M.; Jenne, R.L. Global Distribution of Total Cloud Cover and Cloud Type Amounts Over the Ocean; NCAR Technical Note NCAR/TN-317+STR; USDOE Office of Energy Research: Washington, DC, USA, 1988; p. 212. [Google Scholar]
- Zhang, Y.; Zhang, L.; Guo, J.; Feng, J.; Cao, L.; Wang, Y.; Zhou, Q.; Li, L.; Li, B.; Xu, H.; et al. Climatology of cloud-base height from long-term radiosonde measurements in China. Adv. Atmos. Sci. 2018, 35, 158–168. [Google Scholar] [CrossRef]
- Wang, J.H.; Rossow, W.B.; Zhang, Y. Cloud Vertical Structure and Its Variations from a 20-Yr Global Rawinsonde Dataset. J. Clim. 2000, 13, 3042–3056. [Google Scholar] [CrossRef]
- Narendra Reddy, N.; Venkat Ratnam, M.; Basha, G.; Ravikiran, V. Cloud vertical structure over a tropical station obtained using long-term high-resolution Radiosonde measurements. Atmos. Chem. Phys. 2018, 18, 11709–11727. [Google Scholar] [CrossRef]
- Chen, S.S.; Kerns, B.W.; Guy, N.; Jorgensen, D.P.; Delanoë, J.; Viltard, N.; Zappa, C.J.; Judt, F.; Lee, C.-Y.; Savarin, A. Aircraft observations of dry air, the ITCZ, convective cloud systems, and cold pools in MJO during DYNAMO. Bull. Am. Meteorol. Soc. 2015, 97, 405–423. [Google Scholar] [CrossRef]
- Wang, J.; Rossow, W.B.; Uttal, T.; Rozendaal, M. Variability of Cloud Vertical Structure during ASTEX Observed from a Combination of Rawinsonde, Radar, Ceilometer, and Satellite. Mon. Weather Rev. 1999, 127, 2484–2502. [Google Scholar] [CrossRef]
- Morel, C.; Senesi, S. A climatology of mesoscale convective systems over Europe using satellite infrared imagery. I: Methodology. Q. J. R. Meteorol. Soc. 2002, 128, 1953–1971. [Google Scholar] [CrossRef]
- Yang, Y.; Lu, D.; Fu, Y. Spectral Characteristics of Tropical Anvils Obtained by Combining TRMM Precipitation Radar with Visible and Infrared Scanner Data. Pure Appl. Geophys. 2015, 172, 1717–1733. [Google Scholar] [CrossRef]
- Borg, L.A.; Holz, R.E.; Turner, D.D. Investigating cloud radar sensitivity to optically thin cirrus using collocated Raman lidar observations. Geophys. Res. Lett. 2011, 38, 387–404. [Google Scholar] [CrossRef]
- Kollias, P.; Clothiaux, E.E.; Miller, M.A.; Albrecht, B.A.; Stephens, G.L.; Ackerman, T.P. MILLIMETER-WAVELENGTH RADARS New Frontier in Atmospheric Cloud and Precipitation Research. Bull. Am. Meteorol. Soc. 2007, 88, 1608–1624. [Google Scholar] [CrossRef]
- Zhou, Q.; Zhang, Y.; Li, B.; Li, L.; Feng, J.; Jia, S.; Lv, S.; Tao, F.; Guo, J. Cloud-base and cloud-top heights determined from a ground-based cloud radar in Beijing, China. Atmos. Environ. 2019, 201, 381–390. [Google Scholar] [CrossRef]
- Zhang, Y.; Zhou, Q.; Lv, S.; Jia, S.; Tao, F.; Chen, D.; Guo, J. Elucidating cloud vertical structures based on three-year Ka-band cloud radar observations from Beijing, China. Atmos. Res. 2019, 222, 88–99. [Google Scholar] [CrossRef]
- Guo, J.; Liu, H.; Wang, F.; Huang, J.; Xia, F.; Lou, M.; Wu, Y.; Jiang, J.H.; Xie, T.; Zhaxi, Y.; et al. Three-dimensional structure of aerosol in China: A perspective from multi-satellite observations. Atmos. Environ. 2016, 178–179, 580–589. [Google Scholar] [CrossRef]
- Zhang, Y.; Guo, J.; Yang, Y.; Wang, Y.; Yim, S. Vertical Wind Shear Modulates Particulate Matter Pollutions: A Perspective from Radar Wind Profiler Observations in Beijing, China. Remote Sens. 2020, 12, 546. [Google Scholar] [CrossRef]
- Naud, C.M.; Chen, Y.H. Assessment of ISCCP cloudiness over the Tibetan Plateau using CloudSat-CALIPSO. J. Geophys. Res.-Atmos. 2010, 115, D06117. [Google Scholar] [CrossRef]
- Huang, J.; Guo, J.; Wang, F.; Liu, Z.; Jeong, M.-J.; Yu, H.; Zhang, Z. CALIPSO inferred most probable heights of global dust and smoke layers. J. Geophys. Res.-Atmos. 2015, 120, 5085–5100. [Google Scholar] [CrossRef]
- Sassen, K.; Wang, Z. Classifying clouds around the globe with the CloudSat radar: 1-year of results. Geophys. Res. Lett. 2008, 35. [Google Scholar] [CrossRef]
- Chen, T.; Guo, J.; Li, Z.; Zhao, C.; Liu, H.; Cribb, M.; Wang, F.; He, J. ACloudSatPerspective on the Cloud Climatology and Its Association with Aerosol Perturbations in the Vertical over Eastern China. J. Atmos. Sci. 2016, 73, 3599–3616. [Google Scholar] [CrossRef]
- Winker, D.M.; Hunt, W.H.; Mcgill, M.J. Initial performance assessment of CALIOP. Geophys. Res. Lett. 2007, 34, 19. [Google Scholar] [CrossRef]
- Poore, K.D.; Wang, J.H.; Rossow, W.B. Cloud layer thicknesses form a combination of surface and upper-air observations. J. Clim. 1995, 8, 550–568. [Google Scholar] [CrossRef]
- Chernykh, I.V.; Alduchov, O.A.; Eskridge, R.E. Trends in low and high cloud boundaries and errors in height determination of cloud boundaries. Bull. Am. Meteorol. Soc. 2001, 82, 1941–1947. [Google Scholar] [CrossRef]
- Zhang, D.; Lin, Y.; Zhao, P.; Yu, X.; Wang, S.; Kang, H.; Ding, Y. The Beijing extreme rainfall of 21 July 2012: “Right results” but for wrong reasons. Geophys. Res. Lett. 2013, 40, 1426–1431. [Google Scholar] [CrossRef]
- Li, Z.; Lau, W.K.M.; Ramanathan, V.; Wu, G.; Ding, Y.; Manoj, M.G.; Liu, J.; Qian, Y.; Li, J.; Zhou, T.; et al. Aerosol and monsoon climate interactions over Asia. Rev. Geophys. 2016, 54, 866–929. [Google Scholar] [CrossRef]
- Zhang, Y.; Xu, Y.; Dong, W.; Cao, L.; Sparrow, M. A future climate scenario of regional changes in extreme climate events over China using the PRECIS climate model. Geophys. Res. Lett. 2006, 33, L24702. [Google Scholar] [CrossRef]
- Guo, J.; Yan, Y.; Chen, D.; Lv, Y.; Han, Y.; Guo, X.; Liu, L.; Miao, Y.; Chen, T.; Nie, J.; et al. The response of warm-season precipitation extremes in China to global warming: An observational perspective from radiosonde measurements. Clim. Dynam. 2020. [Google Scholar] [CrossRef]
- Behrendt, A.; Pal, S.; Aoshima, F.; Bender, M.; Blyth, A.; Corsmeier, U.; Cuesta, J.; Dick, G.; Dorninger, M.; Flamant, C.; et al. Observation of convection initiation processes with a suite of state-of-the-art research instruments during COPS IOP 8b. Q. J. R. Meteorol. Soc. 2011, 137, 81–100. [Google Scholar] [CrossRef]
- Wang, Z.; Wang, Z.H.; Cao, X.Z. Consistency analysis for cloud vertical structure derived from millimeter cloud radar and radiosonde profiles. Acta Meteorol. Sin. 2016, 74, 815–826. (In Chinese) [Google Scholar]
- Zhao, J.; Cao, X.Z.; Dai, T.G.; Wang, Z.C.; Chen, D.D.; Zheng, D. Comparative Analysis of Cloud Observed by Millimeter Wave Cloud Radar and Sounding. Meteorol. Mon. 2017, 43, 101–107. [Google Scholar]
- Guo, J.; Miao, Y.; Zhang, Y.; Liu, H.; Li, Z.; Zhang, W.; He, J.; Lou, M.; Yan, Y.; Bian, L.; et al. The climatology of planetary boundary layer height in China derived from radiosonde and reanalysis data. Atmos. Chem. Phys. 2016, 16, 13309–13319. [Google Scholar] [CrossRef]
- Guo, J.; Li, Y.; Cohen, J.B.; Li, J.; Chen, D.; Xu, H.; Liu, L.; Yin, J.; Hu, K.; Zhai, P. Shift in the Temporal Trend of Boundary Layer Height in China Using Long-Term (1979–2016) Radiosonde Data. Geophys. Res. Lett. 2019, 46, 6080–6089. [Google Scholar] [CrossRef]
- Li, W.; Zhao, P.; Guo, Q.; Wang, M. The international Radiosonde intercomparison results for China-made GPS Radiosonde. J. Appl. Meteorol. Sci. 2011, 22, 453–462. (In Chinese) [Google Scholar]
- Wang, J.H.; Rossow, W.B. Determination of Cloud Vertical Structure from Upper-Air Observations. J. Appl. Meteorol. 1995, 34, 2243–2258. [Google Scholar] [CrossRef]
- Chernykh, I.V.; Eskridge, R.E. Determination of cloud amount and level from radiosonde soundings. J. Appl. Meteorol. 1996, 35, 1362–1369. [Google Scholar] [CrossRef]
- Minnis, P.; Yi, Y.; Huang, J.; Ayers, K. Relationships between radiosonde and RUC-2 meteorological conditions and cloud occurrence determined from ARM data. J. Geophys. Res. 2005, 110. [Google Scholar] [CrossRef]
- Zhang, J.; Chen, H.; Li, Z.; Fan, X.; Peng, L.; Yu, Y.; Cribb, M. Analysis of cloud layer structure in Shouxian, China using RS92 radiosonde aided by 95 GHz cloud radar. J. Geophys. Res. 2010, 115. [Google Scholar] [CrossRef]
- Costa-Surós, M.; Calbó, J.; González, J.A.; Long, C.N. Comparing the cloud vertical structure derived from several methods based on radiosonde profiles and ground-based remote sensing measurements. Atmos. Meas. Tech. 2014, 7, 2757–2773. [Google Scholar] [CrossRef]
- Bian, J.; Chen, H.; Vömel, H.; Duan, Y.; Xuan, Y.; Lü, D. Intercomparison of humidity and temperature sensors: GTS1, Vaisala RS80, and CFH. Adv. Atmos. Sci. 2011, 28, 139–146. [Google Scholar] [CrossRef]
- Peng, J.; Zhang, H.; Shen, X. Analysis of vertical structure of clouds in East Asia with CloudSat data. J. Atmos. Sci. 2013, 37, 91–100. (In Chinese) [Google Scholar]
- Behrangi, A.; Kubar, T.; Lambrigtsen, B. Phenomenological Description of Tropical Clouds Using CloudSat Cloud Classification. Mon. Weather. Rev. 2012, 140, 3235–3249. [Google Scholar] [CrossRef]
- Li, J.; Huang, J.; Yi, Y.; Lv, D. Analysis of Vertical Distribution of Cloud in East Asia by Space-Based Lidar Data. Chin. J. Atmos. Sci. 2009, 33, 698–707. (In Chinese) [Google Scholar]
- Chen, C.; Meng, H.; Jin, R.; Wang, Z. Cloud macroscopic Characteristics over north China based on CloudSat data. Meteorol. Sci. Technol. 2014, 42, 294–301. [Google Scholar]
- Seeley, J.T.; Jeevanjee, N.; Langhans, W.; Romps, D.M. Formation of Tropical Anvil Clouds by Slow Evaporation. Geophys. Res. Lett. 2019, 46, 492–501. [Google Scholar] [CrossRef]
- Wang, S.; Han, Z.; Yao, Z.; Zhao, Z. An analysis of cloud types and macroscopic characteristics over China and its neighborhood based on the CloudSat data. Acta Meteorol. Sin. 2011, 69, 883–899. (In Chinese) [Google Scholar]
© 2020 by the authors. Licensee MDPI, Basel, Switzerland. This article is an open access article distributed under the terms and conditions of the Creative Commons Attribution (CC BY) license (http://creativecommons.org/licenses/by/4.0/).