Influence of the Long-Term Temperature Trend on the Number of New Records for Annual Maximum Daily Precipitation in Japan

Abstract
1. Introduction
2. Methodology
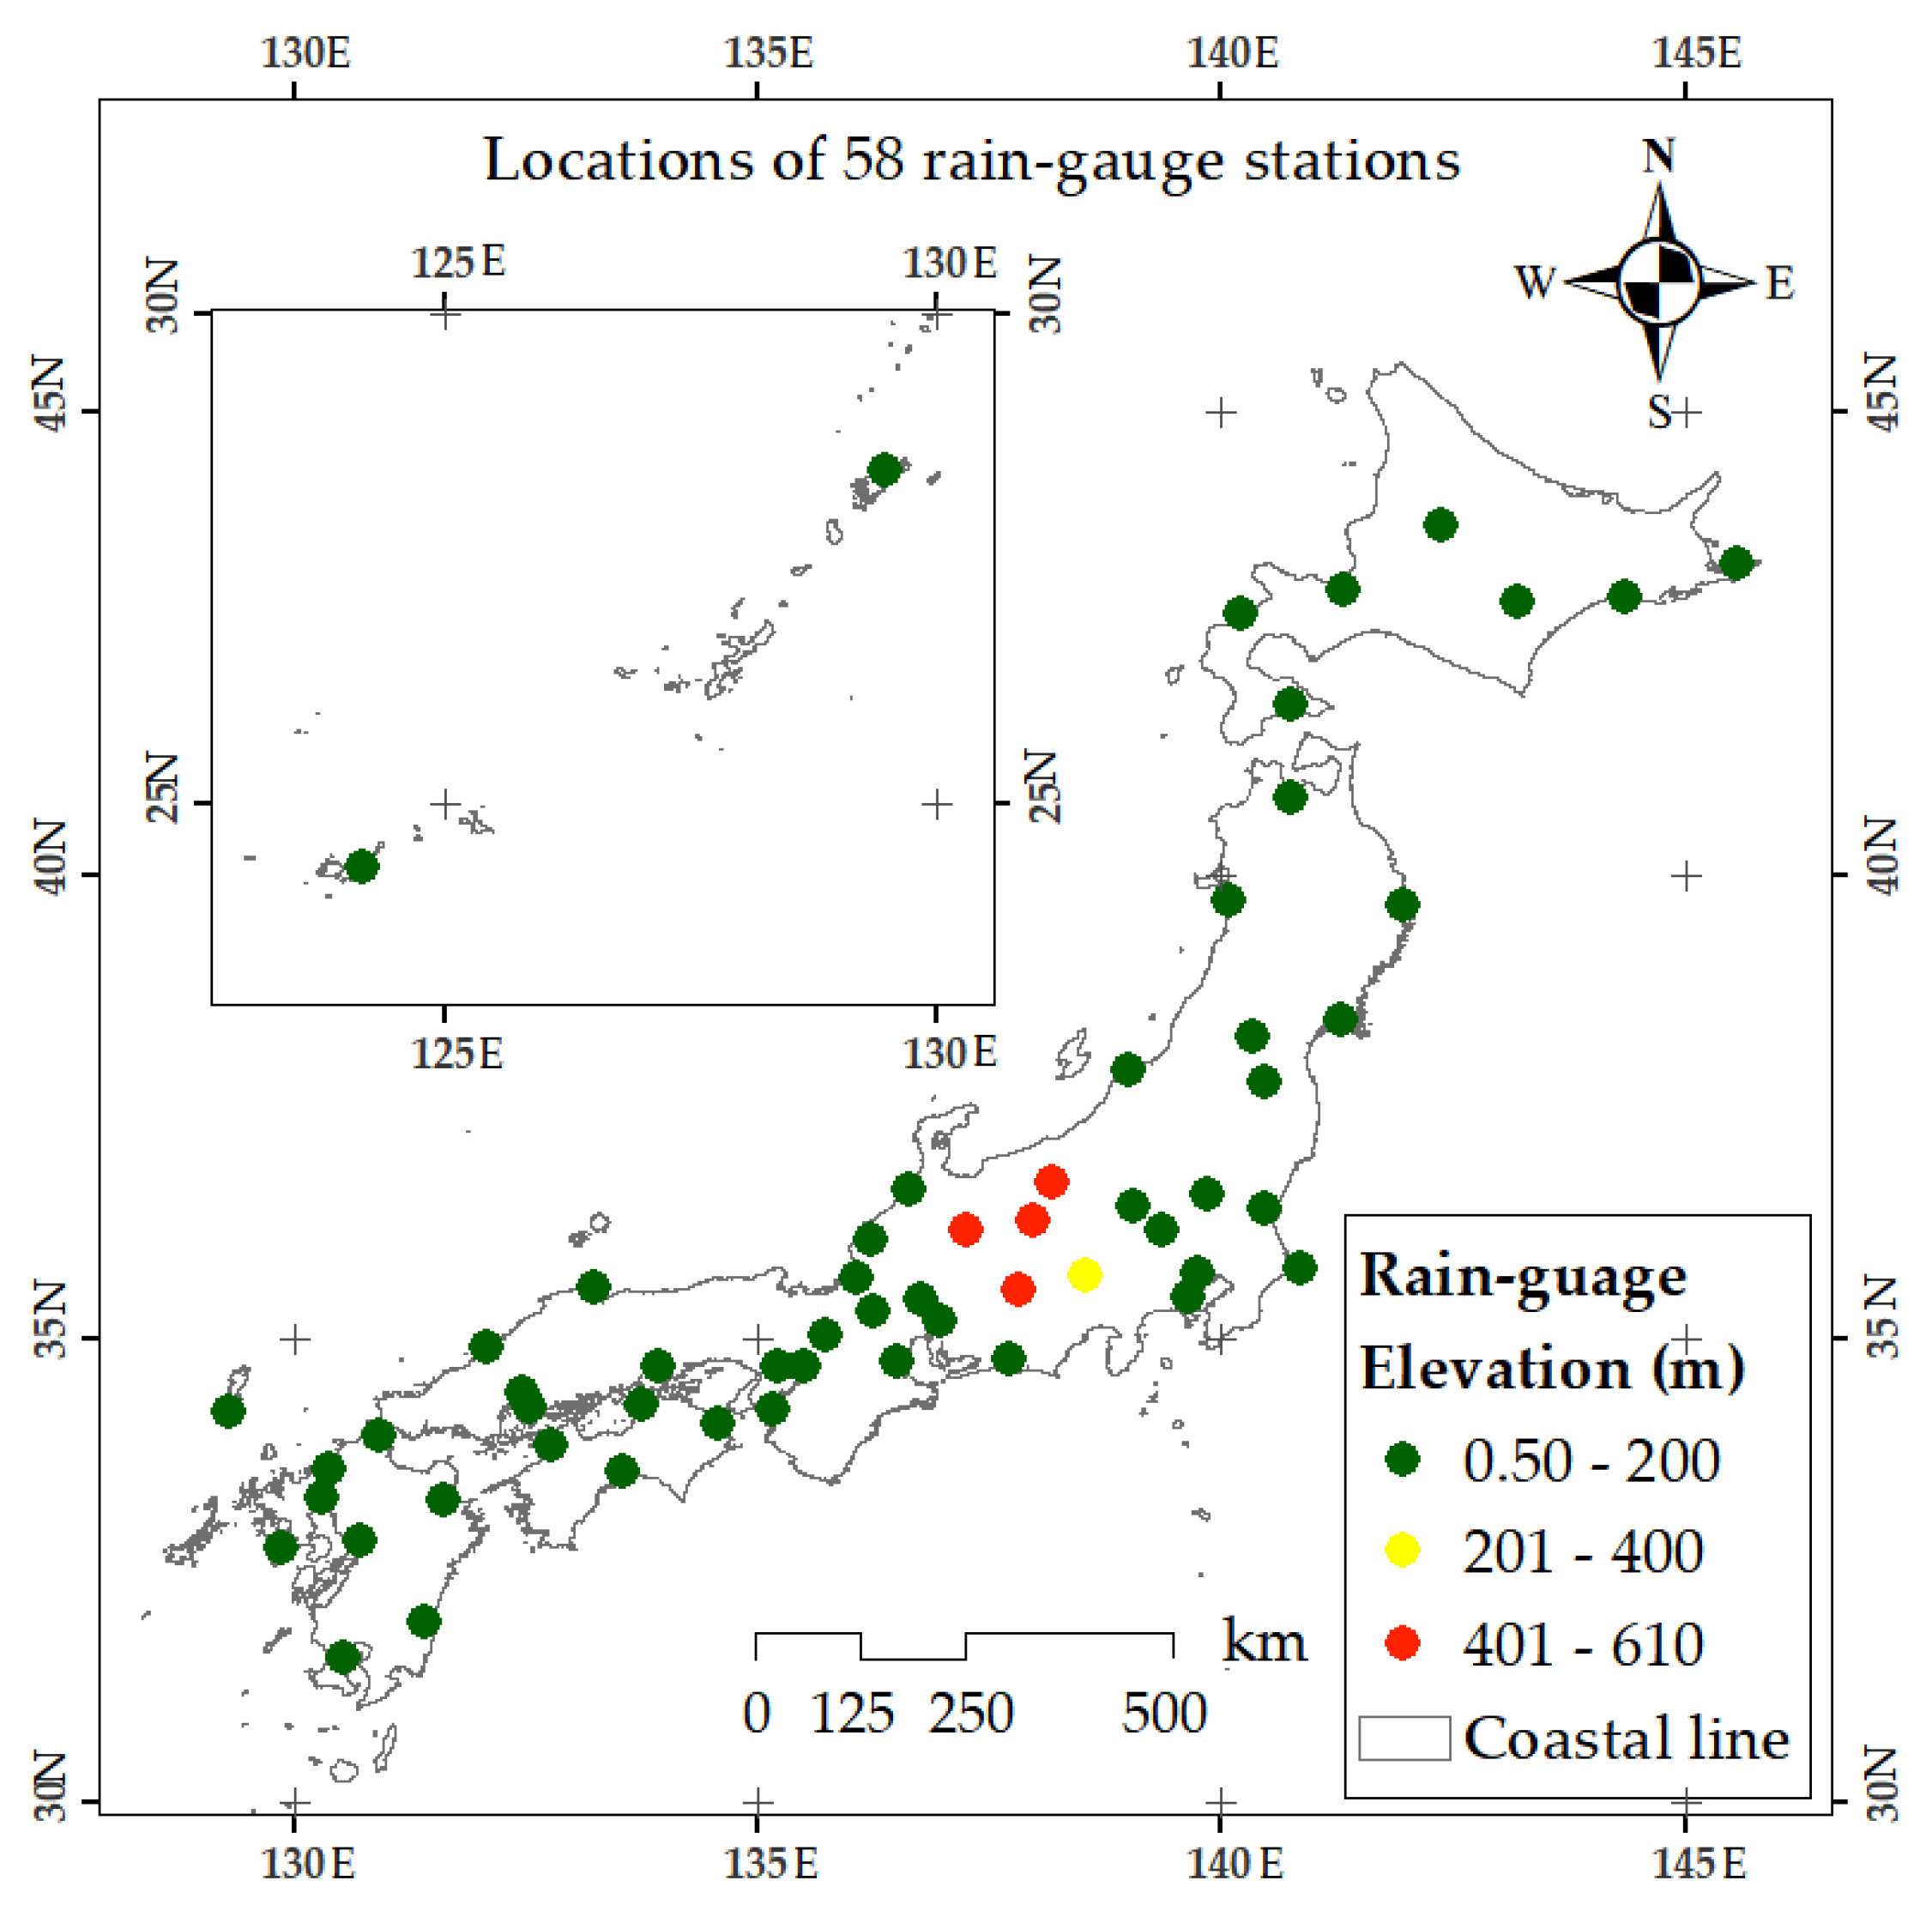
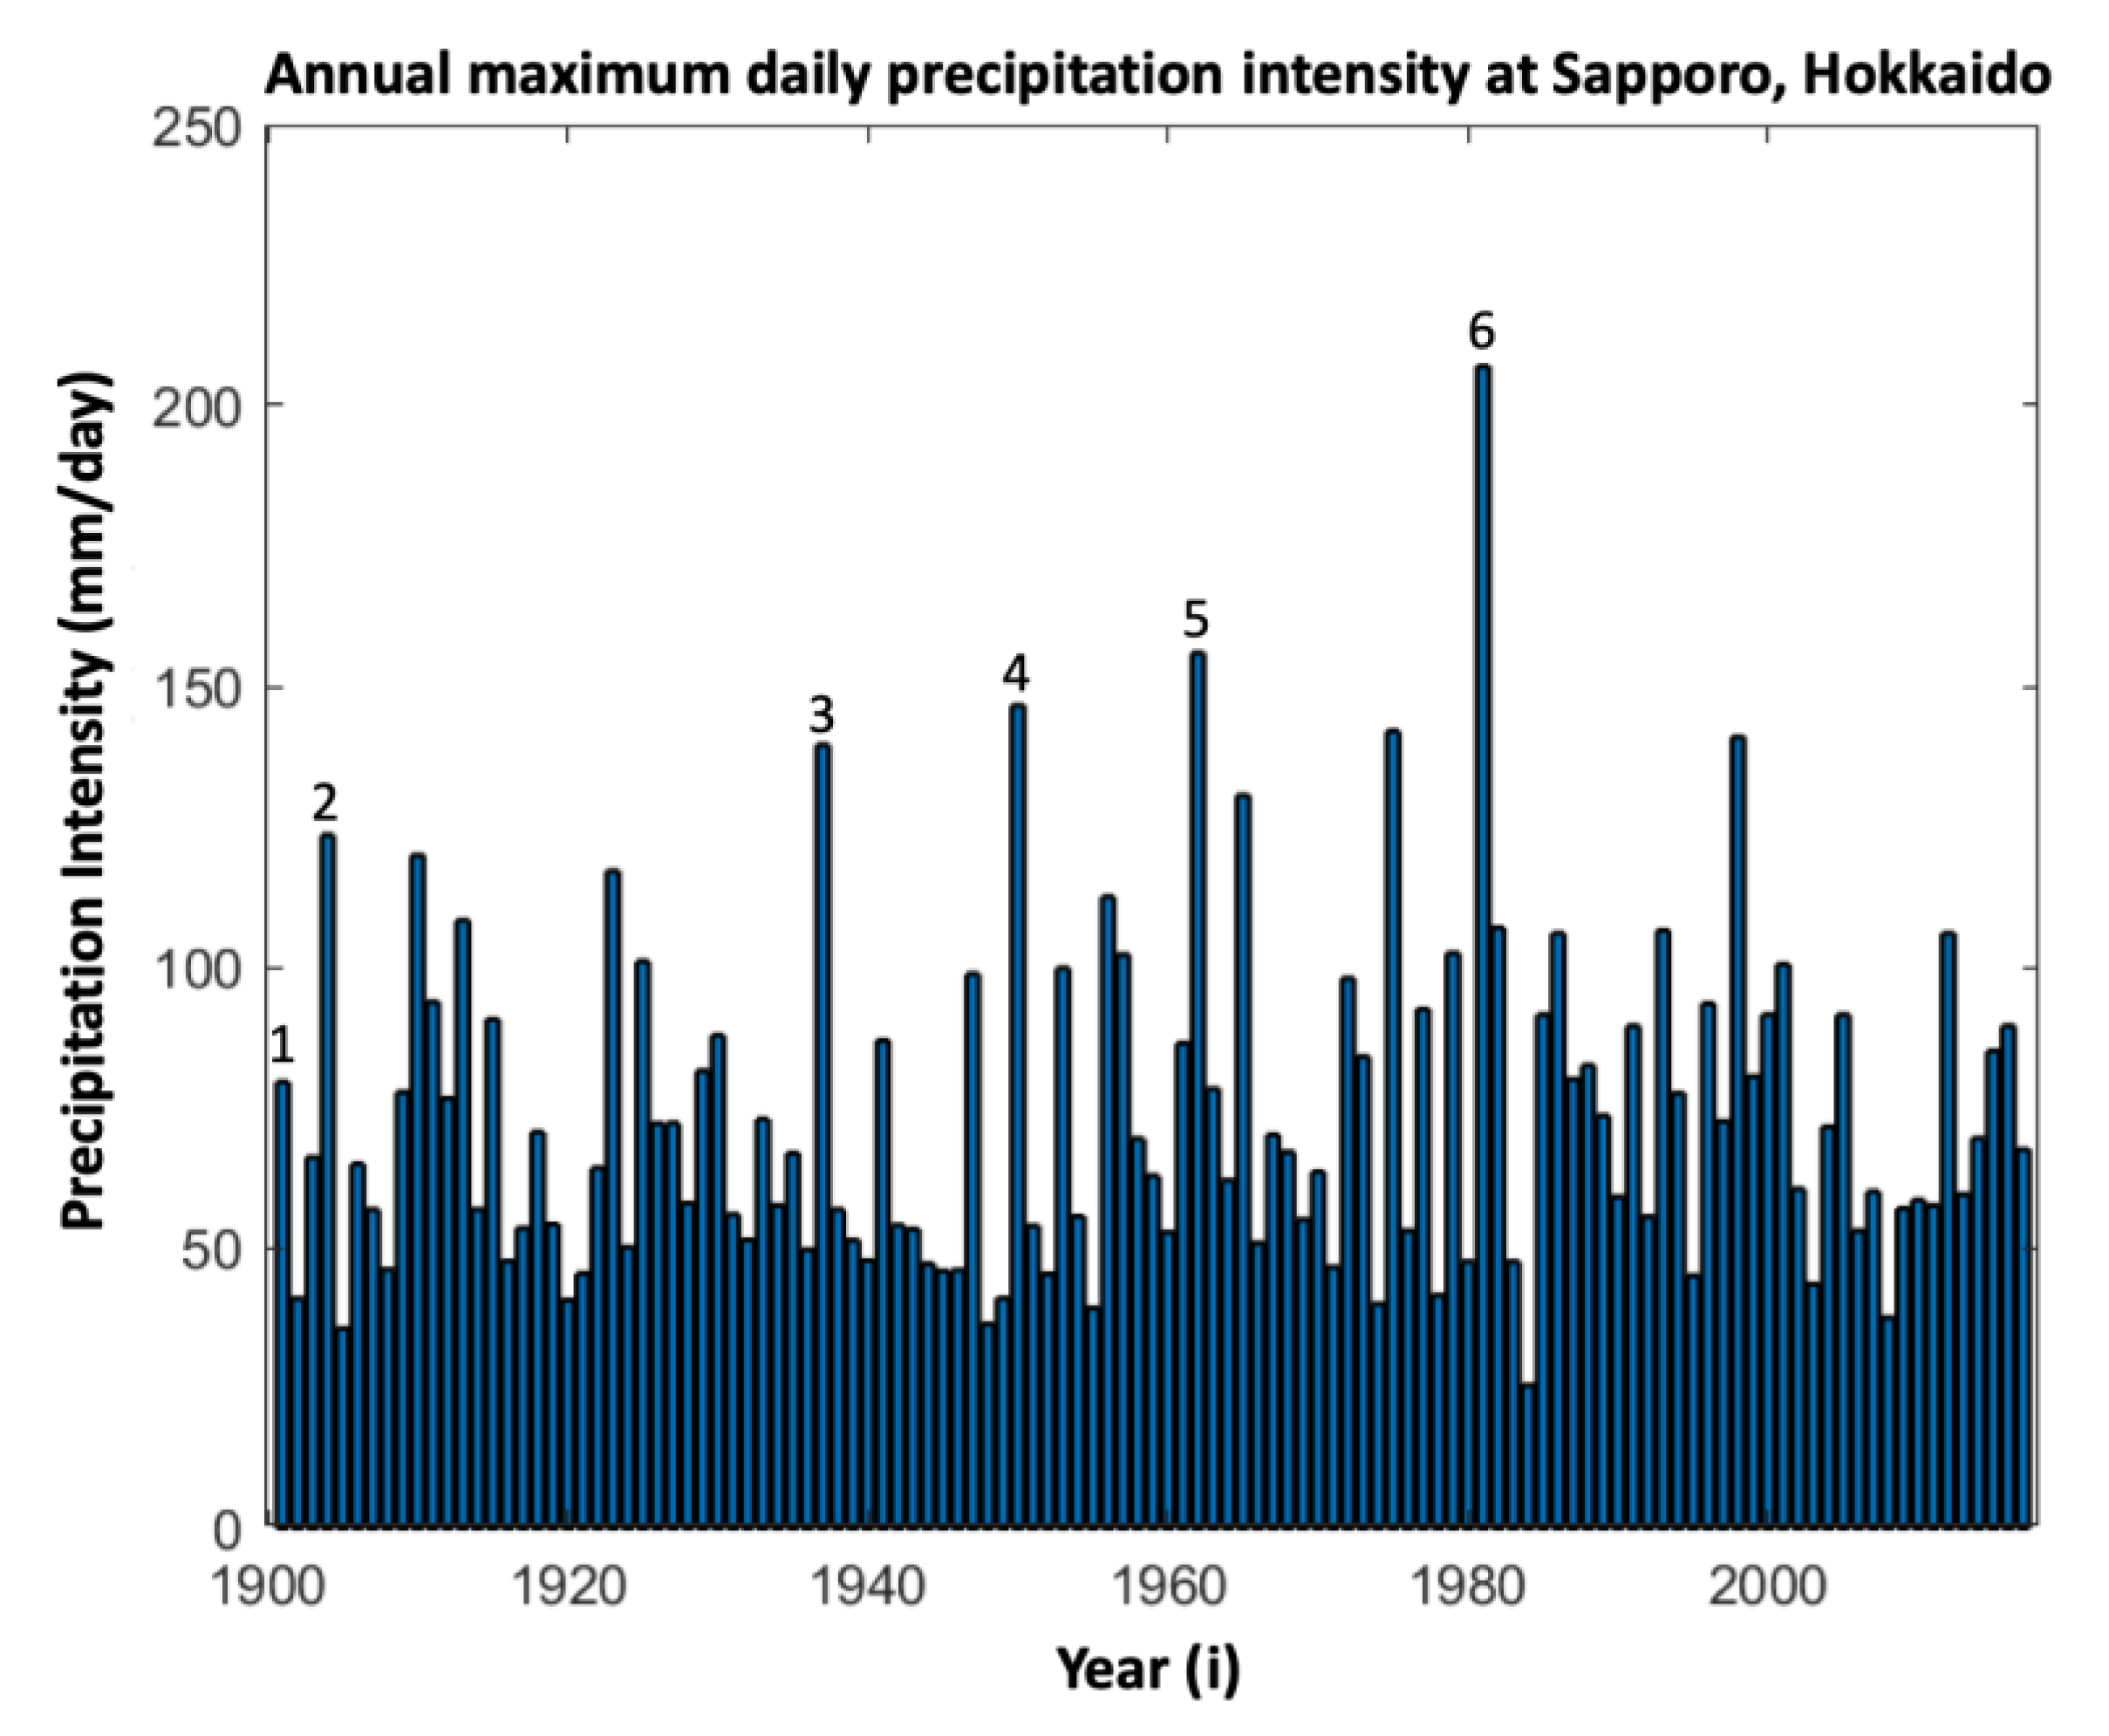
2.1. Data
2.2. Sampling Number Theory
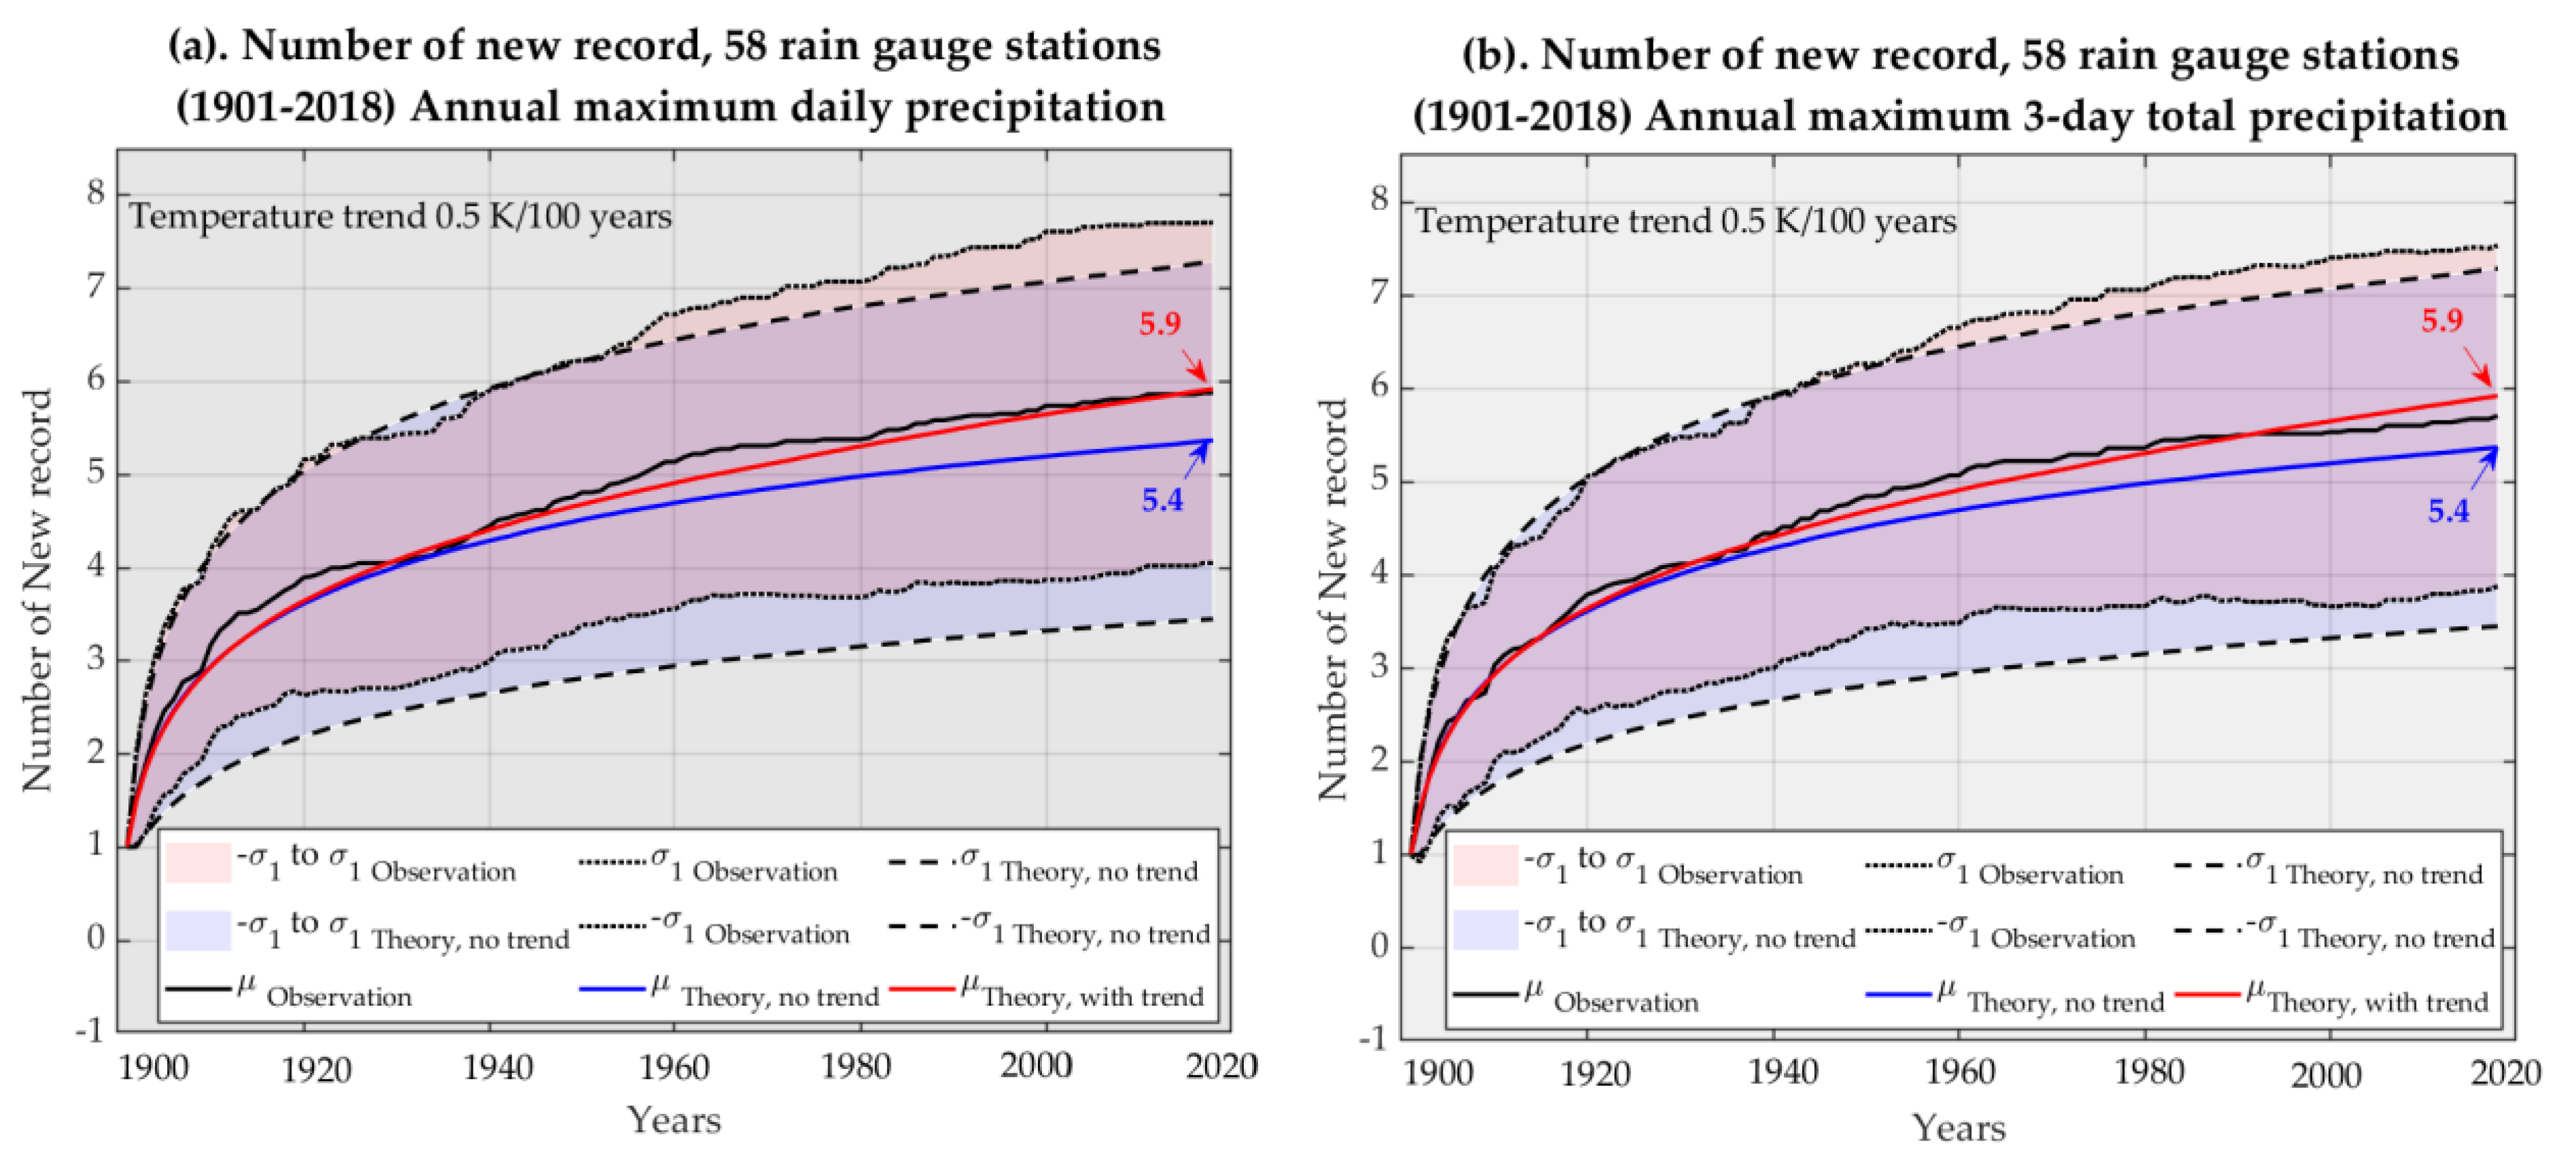
2.3. Number of New Records with Long-Term Temperature Trend
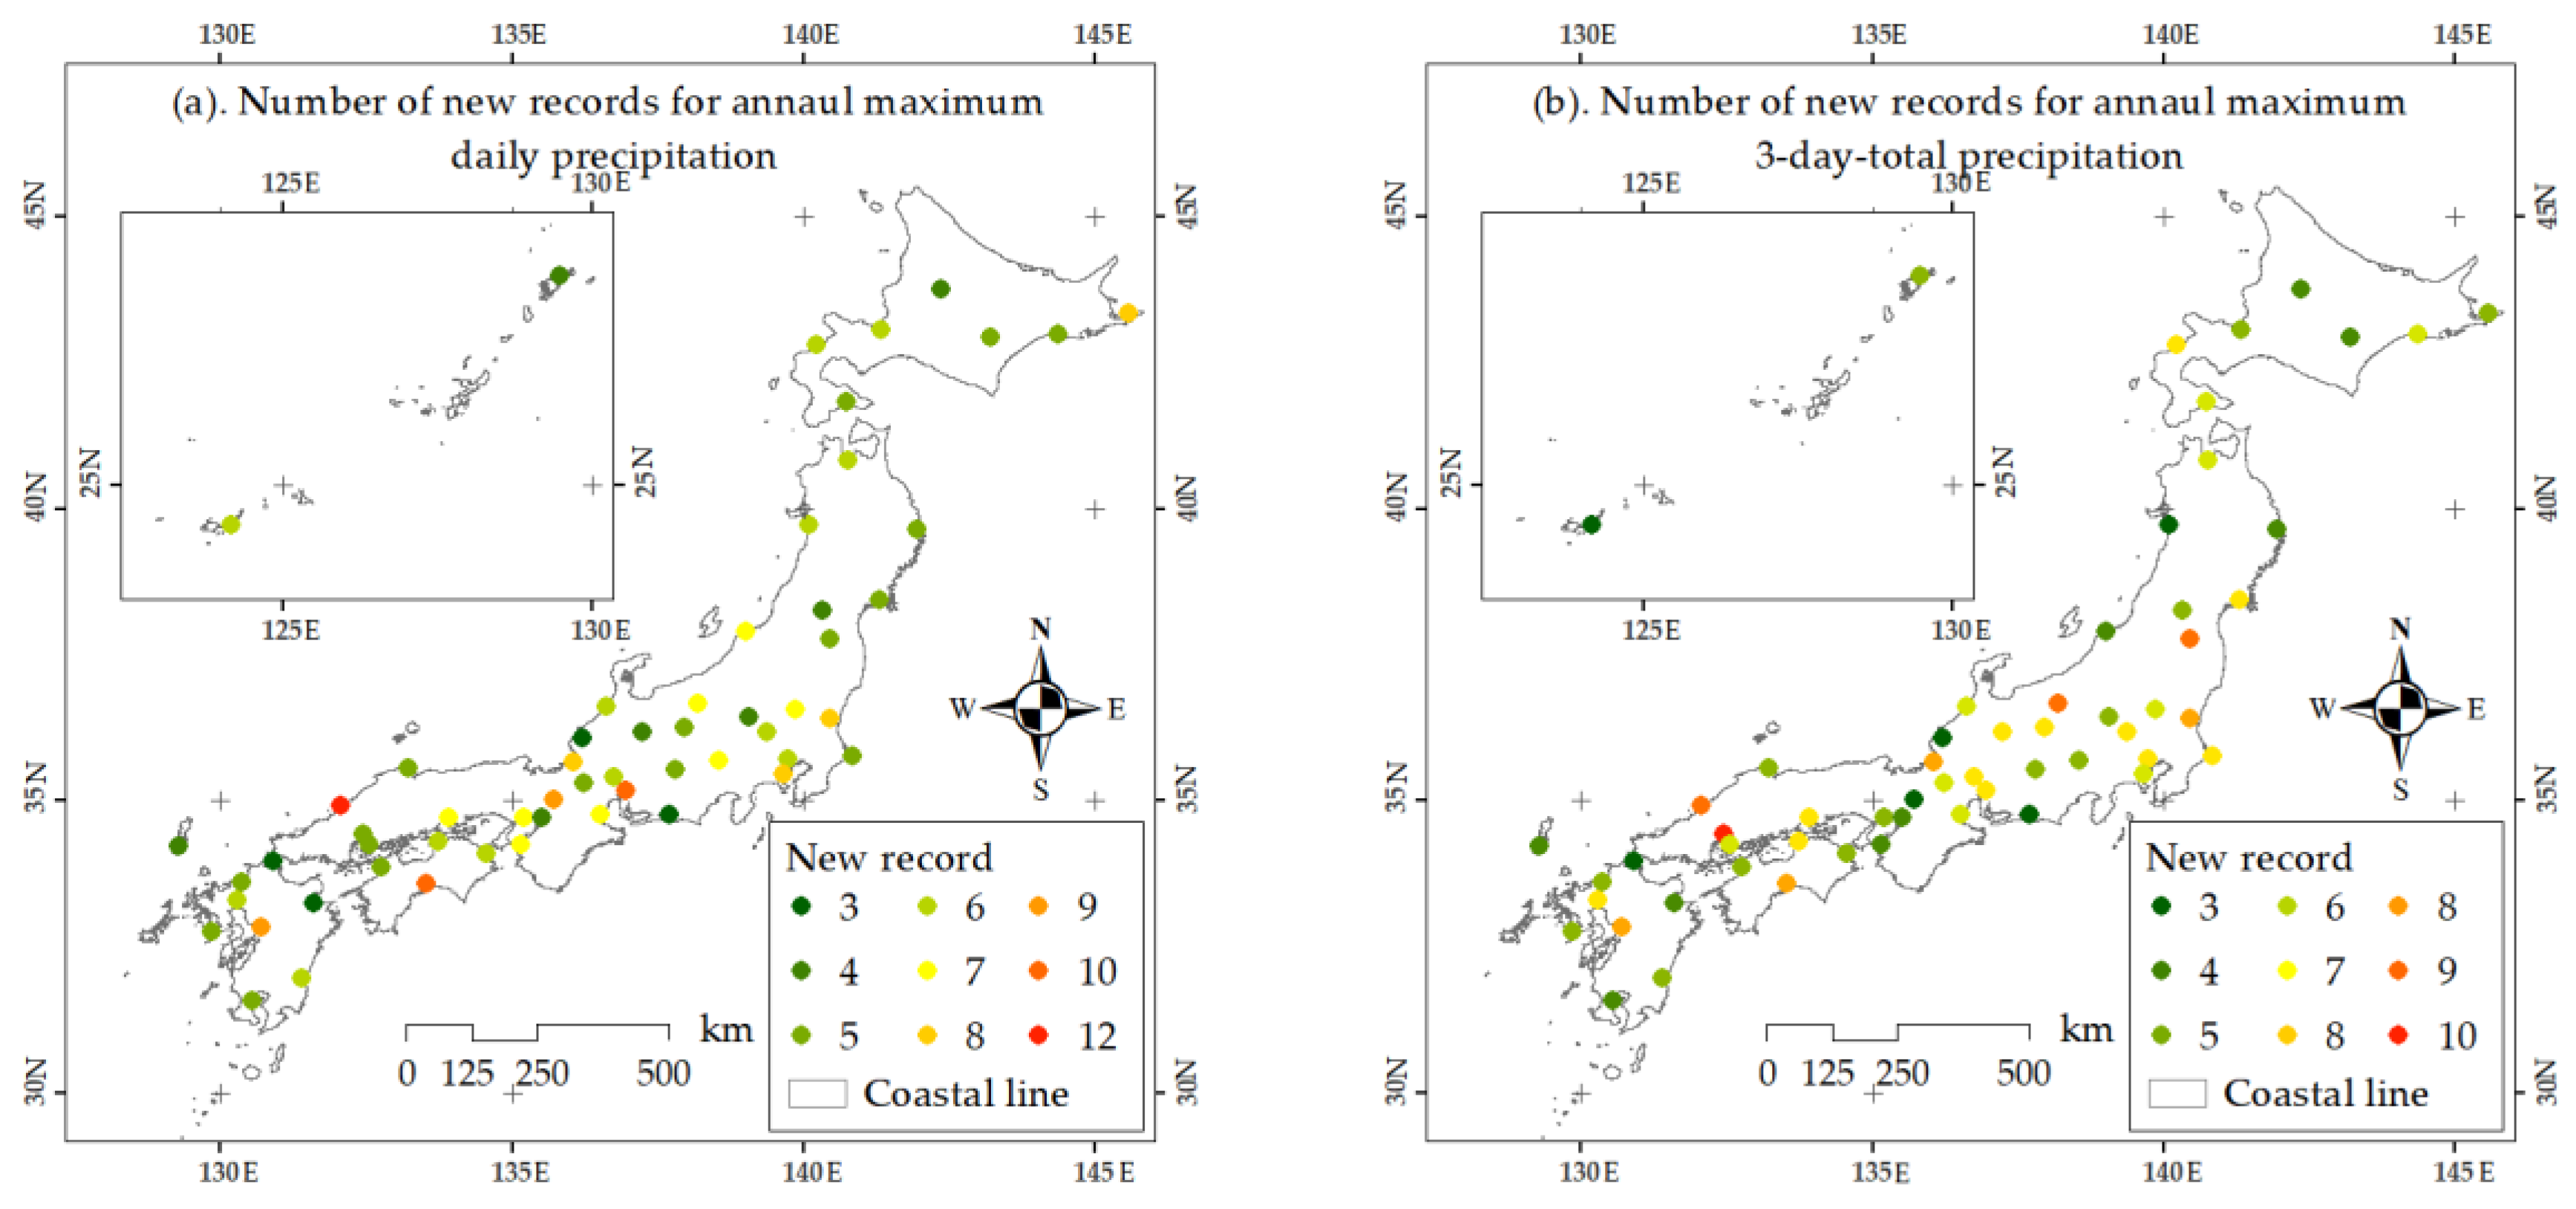
3. Results
4. Summary
Author Contributions
Funding
Acknowledgments
Conflicts of Interest
References
- Ministry of Land, Infrastructure, Transport, and Tourism (MLIT). Water Disaster Report. Available online: https://www.mlit.go.jp/river/pamphlet_jirei/pdf/suigai2018.pdf (accessed on 15 February 2020).
- Japan Meteorological Agency (JMA). Available online: https://www.jma.go.jp/jma/press/1808/10c/h30goukouon20180810.html (accessed on 15 February 2020).
- AR5 Synthesis Report: Climate Change 2014; Intergovernmental Panel on Climate Change (IPCC): Geneva, Switzerland, 2014.
- Summary for Policymakers. Global warming of 1.5 °C; Intergovernmental Panel on Climate Change (IPCC): Geneva, Switzerland, 2018. [Google Scholar]
- Pall, P.; Stone, D.A. Testing the Clausius-Clapeyron constraint on changes in extreme precipitation under CO2 warming. Clim. Dyn. 2007, 28, 351–363. [Google Scholar] [CrossRef]
- Zhang, X.; Zwiers, F.W.; Hegerl, G.C.; Lambert, F.H.; Gillett, N.P.; Solomon, S.; Stott, P.A.; Nozawa, T. Detection of human influence on twentieth-century precipitation trends. Nature 2007, 448, 461–465. [Google Scholar] [CrossRef] [PubMed]
- Zhang, X.; Wan, H.; Zwiers, F.W.; Hegerl, G.C.; Min, S.-K. Attributing intensification of precipitation extremes to human influence. Geophys. Res. Lett. 2013, 40, 5252–5257. [Google Scholar] [CrossRef]
- Min, S.-K.; Zhang, X.; Zwiers, F.W.; Hegerl, G.C. Human contribution to more-intense precipitation extremes. Nature 2011, 470, 378–381. [Google Scholar] [CrossRef] [PubMed]
- Emori, S.; Brown, S.J. Dynamic and thermodynamic changes in mean and extreme precipitation under changed climate. Geophys. Res. Lett. 2005, 32, L17706. [Google Scholar] [CrossRef]
- Allen, M.; Ingram, W. Constraints on future changes in climate and the hydrologic cycle. Nature 2002, 419, 224–232. [Google Scholar] [CrossRef] [PubMed]
- Utsumi, N.; Seto, S.; Kanae, S.; Eiji Maeda, E.; Oki, T. Does higher surface temperature intensity extreme precipitation? Geophys. Res. Lett. 2011, 38, L16708. [Google Scholar] [CrossRef]
- Fujibe, F. Clausius-Clapeyron-like relationship in multidecadal changes of extreme short-term precipitation and temperature in Japan. Atmos. Sci. Lett. 2013, 14, 127–132. [Google Scholar] [CrossRef]
- Yamada, T.J.; Farukh, M.A.; Fukushima, T.; Inatsu, M.; Sato, T.; Pokhrel, Y.N.; Oki, T. Extreme precipitation intensity in future climates associated with the Clausius-Clapeyron-like relationship. Hydrol. Res. Lett. 2014, 8, 108–113. [Google Scholar] [CrossRef]
- Glick, N. Breaking Records and Breaking Boards. Am. Math. Mon. 1978, 85, 2–26. [Google Scholar] [CrossRef]
- Galambos, J. Asymptotic Theory of Extreme Order Statistics; Wiley Series in Probability and Mathematical Statistics; John Wiley and Sons: Hoboken, NJ, USA, 1978. [Google Scholar]
- Benestad, R.E. How often can we expect a record event? Clim. Res. 2003, 25, 3–13. [Google Scholar] [CrossRef]
- Benestad, R.E. Record-values, non-stationarity tests and extreme value distributions. Glob. Planet. Chang. 2004, 44, 11–26. [Google Scholar] [CrossRef]
- Redner, S.; Petersen, M.R. Role of global warming on the statistics of record-breaking temperatures. Phys. Rev. E 2006, 74, 061114. [Google Scholar] [CrossRef] [PubMed]
- Meehl, G.A.; Tebaldi, C.; Walton, G.; Easterling, D.; McDaniel, L. Relative increase of record high maximum temperatures compared to record low minimum temperatures in the U.S. Geophys. Res. Lett. 2009, 36. [Google Scholar] [CrossRef]
- Anderson, A.; Kostinski, A. Evolution and distribution of record-breaking high and low monthly mean temperatures. J. Appl. Meteorol. Climatol. 2011, 50, 1859–1871. [Google Scholar] [CrossRef]
- Coumou, D.; Robinson, A.; Rahmstorf, S. Global increase in record-breaking monthly-mean temperatures. Clim. Chang. 2013, 118, 771–782. [Google Scholar] [CrossRef]
- Lehmann, J.; Coumou, D.; Frieler, K. Increased record-breaking precipitation events under global warming. Clim. Chang. 2015, 132, 501–515. [Google Scholar] [CrossRef]
- Donat, M.G. Updated analyses of temperature and precipitation extreme indices since the beginning of the twentieth century: The HadEX2 dataset. J. Geophys. Res. 2013, 118, 2098–2118. [Google Scholar] [CrossRef]


© 2020 by the authors. Licensee MDPI, Basel, Switzerland. This article is an open access article distributed under the terms and conditions of the Creative Commons Attribution (CC BY) license (http://creativecommons.org/licenses/by/4.0/).
Share and Cite
Yamada, T.J.; Seang, C.N.; Hoshino, T. Influence of the Long-Term Temperature Trend on the Number of New Records for Annual Maximum Daily Precipitation in Japan. Atmosphere 2020, 11, 371. https://doi.org/10.3390/atmos11040371
Yamada TJ, Seang CN, Hoshino T. Influence of the Long-Term Temperature Trend on the Number of New Records for Annual Maximum Daily Precipitation in Japan. Atmosphere. 2020; 11(4):371. https://doi.org/10.3390/atmos11040371
Chicago/Turabian StyleYamada, Tomohito J., Chhay Ngorn Seang, and Tsuyoshi Hoshino. 2020. "Influence of the Long-Term Temperature Trend on the Number of New Records for Annual Maximum Daily Precipitation in Japan" Atmosphere 11, no. 4: 371. https://doi.org/10.3390/atmos11040371
APA StyleYamada, T. J., Seang, C. N., & Hoshino, T. (2020). Influence of the Long-Term Temperature Trend on the Number of New Records for Annual Maximum Daily Precipitation in Japan. Atmosphere, 11(4), 371. https://doi.org/10.3390/atmos11040371