Article

Gaseous Emissions from a Seagoing Ship under Different Operating Conditions in the Coastal Region of China

Navigation College, Dalian Maritime University, Dalian 116026, China
*
Author to whom correspondence should be addressed.
Atmosphere 2020, 11(3), 305; https://doi.org/10.3390/atmos11030305
Submission received: 8 February 2020 / Revised: 3 March 2020 / Accepted: 19 March 2020 / Published: 21 March 2020
(This article belongs to the Special Issue Traffic-Related Air Pollution and Its Impacts on Human Health)

Abstract

:
Pollution caused by ship emissions has drawn attention from various countries. Because of the high density of ships in ports, channels, and anchorages and their proximity to the densely populated areas, ship emissions will considerably impact these areas. Herein, a Chinese seagoing ship is selected and a platform is established for monitoring the ship emissions to obtain detailed characteristics of the ship’s nearshore emissions. The ship navigation and pollution emission data are obtained under six complete operating conditions, i.e., berthing, manoeuvring in port, acceleration in a channel, cruising, deceleration before anchoring, and anchoring. This study analyzes the concentrations of the main emission gases (O2, NOX, SO2, CO2, and CO) and the average emission factors (EFs) of the pollution gases (NOX, SO2, CO2, and CO) based on the engine power under different operating conditions. Results show that the change in O2 concentration reflects the load associated with the main engine of the ship. The NOX, SO2, and CO2 emission concentrations are the highest during cruising, whereas the peak CO emission concentration is observed during anchoring. The average EFs of NOX and SO2 based on the power of the main engine are the highest during cruising, and those of CO2 and CO are the highest after anchoring. The ship EFs are different during acceleration and deceleration. By comparing the EFs along the coast of China and the global EFs commonly used to perform the emission inventory calculations in China, the NOX EFs under different operating conditions is observed to be generally lower than the global EFs under the corresponding operating conditions. Furthermore, the SO2 EF is considerably affected by the sulfur content in the fuel oil and the operating conditions of the ship. The average CO2 EFs are higher than the global EFs commonly used during cruising, and the CO EFs are higher than the global EFs under all the conditions. Our results help to supplement the EFs for this type of ship under different operating conditions, resolve the lack of emission data under anchoring conditions, and provide data support to conduct nearshore environmental monitoring and assessment.

1. Introduction

With the rapid development of maritime transporting, the environmental problems associated with ship emissions have become concerning; therefore, several countries and international organizations have deemed the assessment of ship emissions important. When compared with the ordinary diesel used by the vehicles plying on roads, such as motor vehicles, marine fuel oil exhibits a high sulfur content, high viscosity, and high heavy metal content; in particular, the sulfur content of marine fuel oil is considerably higher than that of ordinary diesel, resulting in higher sulfur oxides (SOX) and particulate matter (PM) emissions. The majority of the ports, channels, and anchorages are located near human communities, and more than 70% of ship emissions may affect the inland environment located within a radius of hundreds of kilometers [1,2]. The aforementioned pollutants interact with and influence the sea and land weather as well as the climate system, considerably harming human health and ecosystems [3] and resulting in climate change, which cannot be ignored [4].
To effectively reduce the nitrogen oxides (NOX) and SOX content from the marine engine emissions, the International Maritime Organization (IMO) has promulgated and implemented the International Convention for the Prevention of Pollution from Ships(MARPOL), in which Annex VI “prevention of air pollution caused by ships” [5] requires that the NOX emission of engine (Table 1) and sulfur content (Table 2) in fuel must meet the control requirements. The sulfur content of the marine fuel in emission control areas (ECAs) should be controlled to 0.1% (m/m) by 2015 and the global sulfur content should be controlled to 0.5% (Table 2) by 2020 [6]. Accordingly, the European Union and the United States have implemented regional regulations to reduce the ship emissions [7]. The Ministry of Transport of the People’s Republic of China has promulgated and implemented the “Implementation Scheme of the Domestic Emission Control Areas for Atmospheric Pollution from Vessels” [8]. The emission requirements with respect to ships in the domestic ECAs will be implemented on a step-by-step basis, and the coastal areas and inland rivers of China will be divided into ship ECAs (Table 2) [9]. In the future, the scale of China’s shipping trade, ports, and ship activities will continue to gradually increase, and the environmental problems associated with the ship emissions will become increasingly prominent. To effectively control the ship emissions of China, it is important to conduct ship emission tests and establish a local ship emission inventory for implementing feasible ship emission control measures.
A ship emission test is an effective method to obtain the characteristics of the types of ship emissions; such a test includes a bench test and a real ship test with respect to the ship’s engine. The bench test can be used to obtain the emission characteristics under various load conditions in accordance with the test requirements [10,11,12]; however, there is a gap between the bench test and the real ship conditions [13]. It is difficult to conduct a real ship test even though the pollution data obtained using a real ship test are in accordance with the characteristics of the actual ship. According to the existing international ship test research, the real ship emissions are affected by many factors. Under the berthing, manoeuvring, and cruising conditions, the emission characteristics of the main engine and the auxiliary engine pollutants with respect to same ships or different types of ships can be significantly different [6,13,14,15,16,17]. This is closely related to the main engine or auxiliary engine load, navigation environment, ship operation, and fuel oil properties under different ship operating conditions; in addition, the SO2 emission will be significantly reduced if a seawater exhaust-gas washing device is used [14,18]. A previous study has proved that there are differences between the actual measured values and the commonly used global emission factors (EFs) [19]. Scholars in China have also conducted research in the field of real ship testing, including the testing of the inland ship emissions [20,21]; however, when compared with the seagoing ships, the inland ships exhibit a smaller tonnage and larger differences with respect to ship performance. Furthermore, the inland ships cannot completely represent the emission characteristics of the seagoing ships. Liu et al. [22] verified the EFs of eight fishing vessels exhibiting small tonnage, Huang et al. [23] measured the emission of a bulk carrier under the berthing, manoeuvring, and cruising conditions, Zhang et al. [24] verified the emission characteristics of three seagoing ships under different operating conditions, including low speed, medium speed, high speed, acceleration, and idling, and Wang et al. [25] used a portable emission measurement system according to the model year of the ship to verify the average emission characteristics of various vessels under different conditions, including departing, cruising, and docking. The real ship emission tests in China are still in their infancy. When compared with the existing test data obtained from foreign countries, fewer types as well as quantities of ships and main as well as auxiliary engine types have been tested in China. When compared with the ship emissions when cruising in the open sea, the emissions in ports and during manoeuvring are minor components of the total emission inventory. However, when the ships are in ports, channels, and anchorages, they are located closer to the densely populated areas; therefore, the emissions in these instances considerably affect the land environment. Furthermore, the accuracy of the total emission estimates can be improved by completely considering the ship emissions at the port and under the manoeuvring conditions [26,27]. However, the existing ship emission tests provide less-detailed emission analyses in the nearshore environment, especially when the ship is at anchorage.
According to United Nations Conference on Trade and Development(UNCTAD) statistics [28], China was the largest shipowning country in terms of vessel numbers in 2018 and there are 3556 Chinese flag-bearing ships of 1000 gross tons and above, many of which are deployed in domestic trades. A report issued by the Ministry of Transport of the People’s Republic of China indicates that there were 1832 dry bulk carriers over 10,000 dwt working in domestic coastal in 2018 [29]. However, Ship emissions are an important but long-term missing component of China’s regional air pollution source emission inventory. The emission characteristics and EFs in China’s emission inventory are primarily based on the commonly used global EFs due to the relative lack of the ship emission test data [30,31,32,33]. However, the existing domestic tests have denoted that the direct application of the international common database to the calculations of the emission inventory can result in large errors; therefore, it is important to obtain local ship EFs [25].
This study selected a Chinese seagoing ship which is representative in terms of gross tonnage and main engine power and built a platform suitable for marine pollutant monitoring to obtain detailed characteristics of the nearshore ship emissions because only the ship emission tests can be used to obtain the emission characteristics of the ship exhaust emissions and owing to the fact that the ship emission test is an effective method to accurately calculate the pollutant content in ship emissions. Furthermore, we collected the ship navigation and pollution emission data under six complete operating conditions. In addition, we compared the main engine power-based EFs to those presented in previous studies. The data obtained using this real ship emission test exhibit an important reference value with respect to supplementing China’s local EFs for this type of ship, improving the deficiencies in the EFs of the ships under anchoring conditions, and monitoring and evaluating the coastal pollution.

2. Experimental Section

2.1. Ship and Equipment

The measurements were conducted in April 2018 on a seagoing special-purpose ship during an actual sea voyage. The major ship specifications are presented in Table 3. The ship was equipped with one main engine, four auxiliary engines, and an exhaust boiler. In this study, the emissions were measured with respect to the main engine.
Prior to departure, the ship berthed at wharf 27 in the Dalian Port (38°56.22′ N, 121°38.98′ E); after leaving the port, the ship navigated to the sea area near the Changhai Island and anchored there (39°22.13′ N 123°11.51′ E). The sampling time was approximately 7 h and 10 min. The weather and sea conditions were good during the voyage; the Beaufort wind scale was 3–4, and the wave height was 1–2 m. The ship operated in a stable state without any violent turbulence. The pollutant monitoring instrument and equipment comprised the RJ-SEMS-type equipment, which can be used to realize continuous online monitoring and record the position as well as speed of the test ship. With respect to NOX, SOX, CO2 and CO, the nondispersive infrared technology (NDIR) was used in the smoke instrument of the marine exhaust pollutant test system. In case of O2, the electrochemical method was used, whereas the differential pressure method was used to obtain the exhaust flow. The entire test process was performed in accordance with IMO [34] and ISO 8178 [35].

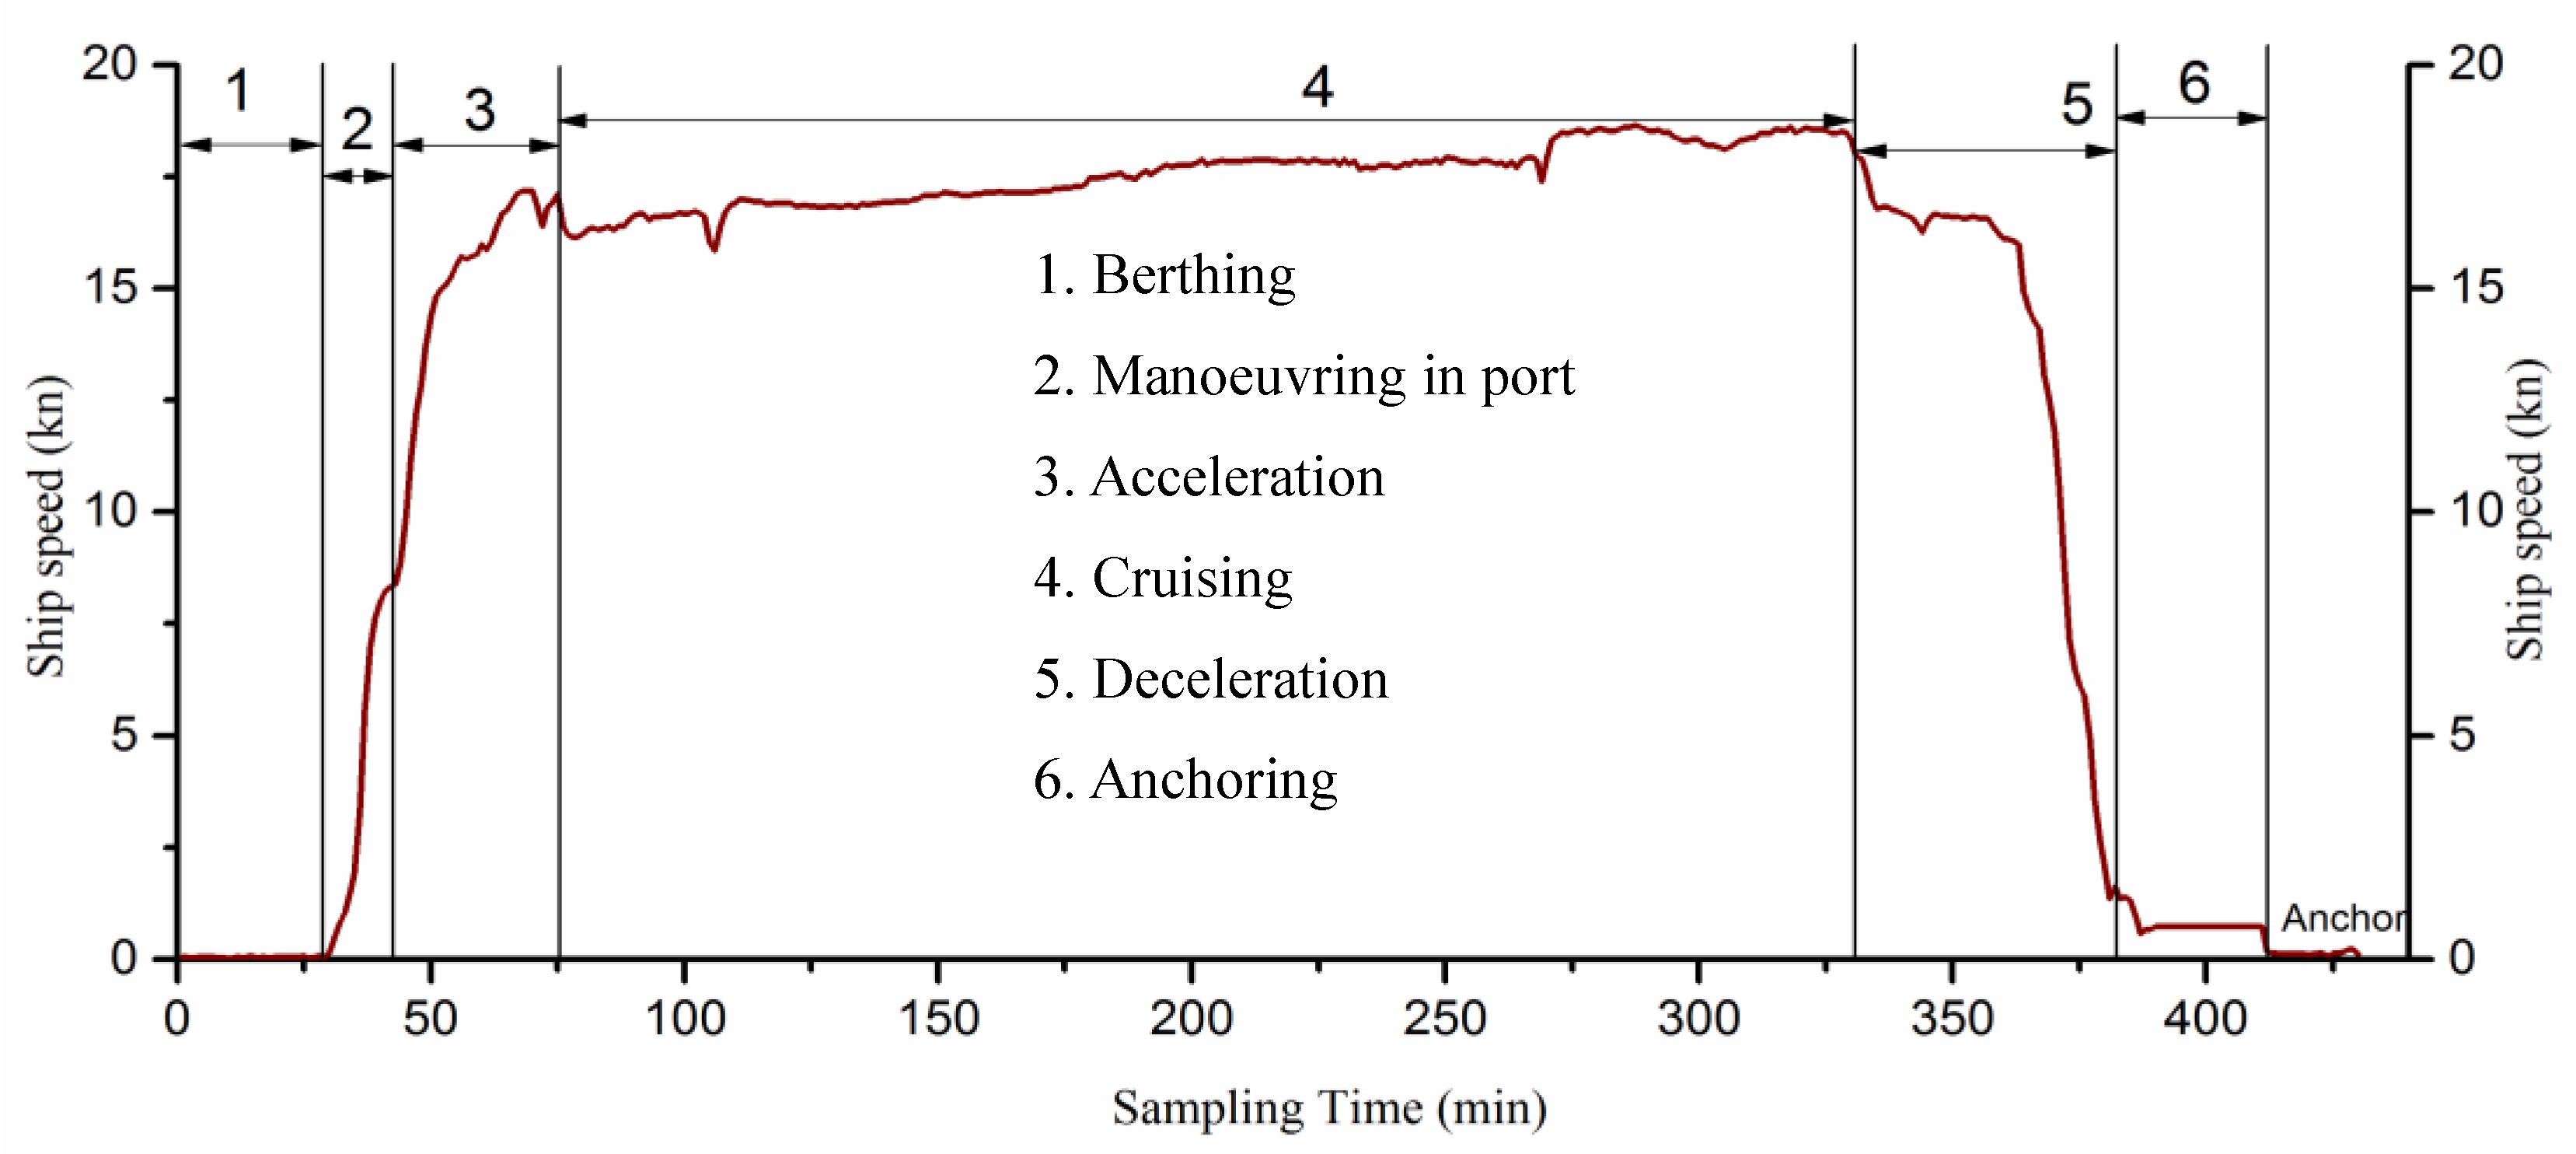
2.2. Data Collection and Processing

The analyzed exhaust from the main engine was sampled through a single hole in the funnel positioned behind the exhaust boiler and 8 m before the funnel exit plane. The sampling scheme is presented in Figure 1. The stainless-steel sampling probe penetrated into the funnel of the main engine through the hole (Figure 2). The sampling pipeline was automatically backfilled based on the on-board compressed air after every 2 h to prevent the sampling probe from being blocked by the exhaust impurities. The test instrument was calibrated prior to use to ensure the accuracy of the test instrument.
The stainless-steel probe in the funnel could continuously collect the gaseous O2, NOX, SO2, CO2, and CO and monitor the exhaust flow via the gas meter simultaneously. The gas pressure, temperature, and humidity in the funnel were obtained from the instruments in the engine control room, and the exhaust gas was calibrated according to the international standard ISO 8178. The real-time power of the ship’s main engine was obtained via the instruments in the engine control room, whereas the ship position and speed over ground in the real-time operating condition data were obtained from the ship’s global positioning system (GPS). The ship’s speed through water and its voyage were obtained based on the Log. In this study, the ship’s speed over ground was used during the emission test and emission pollutant analysis process. The test ship primarily used two types of fuel oil: marine diesel oil (MGO) with a low sulfur content (0.02% (m/m)) was used during berthing, manoeuvring in port, and anchoring to ensure the ship’s good maneuverability, whereas heavy fuel oil (HFO) with a high sulfur content (0.437% (m/m) was used during cruising to save costs. When the ship accelerated in the channel, the main engine gradually changed from MGO to HFO; when the ship decelerated prior to anchoring, the main engine gradually changed from HFO to MGO. Therefore, under these operating conditions, the main engine used mixed fuel, and the time for fuel replacement in the engine can be obtained based on the Engine Log Book. Fuel flow can be obtained through a fuel meter on the pipeline. The formulas for the calculation of EF of different pollutants is [26]
E F i = ( C i × 10 2 ) × M W i 22.4 × 10 3 × E x h a u s t   g a s   f l o w   E n g i n e   p o w e r
E F j = ( C j × 10 6 ) × M W j 22.4 × 10 3 × E x h a u s t   g a s   f l o w   E n g i n e   p o w e r
where E F i or E F j is the emission factor of gases, which is presented as mass per kWh of engine (g/kWh). C i or C j and M W i or M W j are the concentration and molecular weight of O2, NOX, SO2, CO2, and CO in the exhaust gas, respectively. Subscripts i and j denote gaseous concentration in vol% and ppm, respectively. Data on exhaust gas flow and engine power were obtained from the ship’s instruments and gas meter.
In this study, the starting and ending times of the different ship operating conditions were obtained based on the Deck Log Book and speed over ground of the ship. The voyage of the ship was divided into six operating conditions (Figure 3): (1) berthing: the main engine is started until all the cables of the ship have been released; (2) manoeuvring in port: the ship departs from the wharf and reaches the port gate; (3) acceleration: the ship gradually accelerates in the channel after leaving the port until the sea speed is achieved; (4) cruising: the load of the main engine remains stable, and the ship cruises at a relative constant speed. However, due to the influence of wind, waves and currents, the speed over ground of ship will fluctuate; (5) deceleration: the ship gradually decelerates and arrives at the designated anchorage location; and (6) anchoring: the ship drops anchor until the main engine is shut down.

3. Results and Discussion

3.1. Gaseous Emissions

Figure 4a denotes the change in concentration of the main exhaust gases emitted by the main engine (O2, NOX, SO2, CO2, and CO) during the entire voyage under different ship operating conditions. Generally, the main engine of the ship operated stably and the gaseous emission concentration was stable when the ship was cruising at a constant speed. However, the gaseous emission concentration drastically changed under the remaining operating conditions because the engine started from a cold condition, whereas the engine was relatively warm when cruising at a constant speed. In addition, the engine load changed rapidly during the manoeuvring operations, which resulted in considerable uncertainty with respect to the nearshore unsteady-speed emissions when compared with the cruising emissions [36]. Figure 4b shows the average EFs obtained based on the power of the main engine for the pollutants, NOX, SO2, CO2, and CO, and the corresponding changes under six operating conditions.

3.1.1. O2

The change in O2 emission concentration in the exhaust gases discharged by the test ship reflects the working conditions of the main engine of the ship. When the ship was berthing, the main engine was started and the O2 emission concentration began to gradually decrease. When the ship is in a manoeuvring condition, such as manoeuvring in the port, acceleration in the channel, and deceleration before anchoring, the load of the ship’s main engine changes greatly, and the O2 emission concentration in the exhaust gas fluctuates greatly. In cruising conditions where the ship’s main engine power is relatively stable, O2 emission concentration fluctuations are small. Similarly, when the main engine was shut down, the O2 emission concentration gradually normalized.

3.1.2. NOX

NOX is the main focus of ship emission control [34]. The NOX emission is dependent on the engine temperature; therefore, the NOX EFs are dependent on the engine load, where high engine loads result in high emissions [14,16]. When the ship is berthing, the main engine is started. At this time, the temperature inside the main engine gradually increases, and the NOX emission concentration increases. As the speed of the ship continues to increase, the NOX emission concentration also gradually increases. However, during the manoeuvring condition in the port, owing to the frequent operation of the main engine, the NOX emission concentration fluctuates greatly. Similarly, during the deceleration condition and the anchoring condition, as the ship speed and main engine temperature decrease, the NOX emission concentration gradually decreases. When the ship was cruising at a constant speed, the ship load reached its maximum, the engine temperature was the highest, the emission concentration reached its maximum, and the average NOX EF reached its highest value of 11.23 g/kW·h. Furthermore, the average EFs of the ship in the acceleration and deceleration conditions were not considerably different. According to the IMO Tier I standards for the NOX emission limits, the emission limit of the test ship should be 16.054 g/kW·h. Therefore, the NOX emission of the test ship satisfies the IMO limit requirements under different operating conditions. Some sulfur elements in the fuel oil were used in the main engine of the ship; however, the sulfur contents in the fuel oils of different qualities are different.

3.1.3. SO2

The SOX emission is directly related to the sulfur content in the fuel [27,37]. The ship consumes less fuel during berthing, manoeuvring in the port, and anchoring conditions. In addition, the main engine of the ship uses MGO with low sulfur content, which results in lower SO2 emission concentration and SO2 EF between 0.14 and 0.23 g/kW·h. During the whole voyage, because of the high sulfur content of the fuel oil used by the ship under constant speed cruising conditions, the SO2 emission concentration of the ship was the largest and the SO2 EF was the highest at 0.69 g/kW·h when compared with the values measured under other operating conditions. The change rate with respect to the SO2 emission concentration differed for the acceleration and deceleration conditions; the SO2 EF was larger under the acceleration condition when compared with that in the deceleration condition.

3.1.4. CO2

During the berthing condition, after the main engine is started, the CO2 emission concentration exhibits a jumping fluctuation with large amplitude. Moreover, during berthing, manoeuvring in the port, and anchoring conditions, the engine load is unstable and the CO2 emission concentration fluctuates. The CO2 emission concentration was stable during cruising; however, the average CO2 EF was the largest among the EFs of the pollutants emitted by the ship under different ship operating conditions. The operating condition when the average CO2 EF reached its maximum was anchoring at 1124.51 g/kW·h. The average CO2 EF in the anchoring stage was significantly higher than those at the remaining operating conditions for the test ship. Because the ship should perform a short-term astern operation, the main engine load increased during anchoring, considerably increasing the CO2 emissions in a short period of time and increasing the EF.

3.1.5. CO

The CO emitted by the ships can be primarily attributed to the incomplete combustion of fuel owing to the lack of oxygen or other similar reasons [27]. The concentration of CO emitted from the ships can fluctuate considerably during the test process. During voyage, the CO emission concentration was large when the ship speed was low and decreased with increasing ship speed. This is because when a ship leaves a port, the main engine must be stopped and restarted frequently to control its speed and adjust its course. These operations drastically change the engine load. Therefore, the air and fuel are not evenly mixed in the engine cylinder. When the fuel is not completely burned, the combustion in the engine cylinder deteriorates, resulting in increased CO emissions. However, when the engine load increases gradually, the CO emission will exhibit the opposite trend because combustion is more complete under an increased load [16]. The maximum CO emission concentration can be observed during anchoring in this test experiment, and the average CO EF at the time also was the highest at 9.74 g/kW·h. The reason for this result is the same as the abovementioned increase in CO2 emission at this stage.

3.2. Comparison and Analysis of Gaseous Emissions

Table 4 presents the average EFs obtained based on the engine power and the previous results obtained in case of the seagoing ships in China and the global EFs commonly used in China’s domestic emission inventory. Domestic test emission results reveal that there are certain differences in the emission characteristics of ships. This is because emissions are specific to a ship, as individual ships have varying machinery, activity specifications, and fuel content [37,38]. For example, the type of main engine will affect the prevailing combustion conditions, and the emission levels of NOX and CO will also be affected. Emissions from the main engine also vary as a function of main engine rated power output, load factor, engine build year, etc. The rated power output and load factor of the main engine depends on the ship’s operating conditions and specific activities, speed, loading conditions, weather, etc. However, the emissions of certain pollutants are determined solely by the fuel content and have nothing to do with the combustion conditions of the main engine, such as carbon dioxide and sulfur dioxide emissions [27,39].In case of the NOX EFs, only the engineering vessel of Huang et al. [23] and the arrival condition of Zhang et al. [24] exhibited higher values than those observed in Cooper [27] and Entec [36]. The sulfur content of the fuel oil used in this study and in the study of Zhang et al. is low; therefore, the SO2 EFs were lower than those obtained in Entec. The SO2 EF was related to the sulfur content in the fuel oil; therefore, the sulfur content in the fuel oil should be considered when developing the ship emission inventory. The average CO2 EF under the anchoring condition was observed to be the largest. More real ships should be tested under the anchoring condition because no specific test result was obtained for this condition. Table 4 denotes that the average CO2 EFs of the Chinese coastal test ships under the cruising condition are higher than those observed by Cooper and Entec. The average CO EF in the anchoring condition was the largest when compared with those in the literature, and the CO EFs under all the ship conditions tested in coastal China are higher than those obtained by Cooper. Therefore, the existing ship EFs are different from the commonly accepted international factors.
It is generally believed that the operation of ships near the shore has little impact on regional or global ship emissions inventories [14], but the emissions of ships near the shore will directly affect the atmospheric environment of the land, so the nearshore emissions of ships cannot be ignored. According to this study and exiting research of China, the operation of ships in ports, channels, and anchorages for a period of time will also cause a large amount of pollution gas emissions, and many ships will have a fuel change process near the shore, and the impact of this process on ship emissions requires more detailed testing and assessment.
The aim of this paper is to test the emission characteristics of the ship under different operating conditions and quantify and characterize emissions from seagoing ships to enhance the relevant database. However, it is undeniable that there will be some uncertainty in the test results, which may come from basic information of ships, accuracy of test equipment, sampling rate of emissions, division of different working conditions, calculation methods, etc. [26,27,30,37]. Therefore, it is necessary to conduct the emission measurements of various ship classes to minimize the uncertainty and ultimately improve the accuracy of China’s ship emission inventory. In addition, the comparison between the on-board measurements and the benchmarks information of main engines should be of some significance for the accurate judgment of the emission test. As to whether an accurate calculation model can be established between the gaseous emission of a certain type of ship and the speed or the performance of the main engine, more on-board measurements are also required, and a large amount of data needs to be analyzed to verify its accuracy.

4. Conclusions

Herein, we tested six main operating conditions of a Chinese seagoing ship, i.e., berthing, port manoeuvring, acceleration in a channel, cruising, deceleration before anchoring, and anchoring, and focused on the ship emissions before and after anchoring. The data set obtained in this experiment is suitable for this type of ship, and it can be used for comparison and reference of emission characteristics for light ships with little difference between the types of main engine and fuel. The results showed that the emission characteristics of the main exhaust pollutants were closely related to the different ship operating conditions. The change in O2 concentration reflected the working state of the main engine of the ship. The NOX emission concentration and EFs were consistent with the change in engine load. The EFs reached a maximum of 11.23 g/kW·h during the cruising stage but were lower than the limits specified in the IMO Tier I standard. The SO2 emission concentration and EF were highest during cruising, and the SO2 EF was 0.69 g/kW·h. CO2 exhibited the largest EF among the tested exhaust pollutants, especially during anchoring when the CO2 EF reached its highest value of 1124.51 g/kW·h. The CO emission concentration fluctuated considerably, and the CO EF reached its maximum value of 9.74 g/kW·h at the end of anchoring. By comparing the EF values of China’s existing ships with the international EFs used in China’s calculation of the emission inventory, we can find that the NOX EFs of the domestic test ships under the manoeuvring and cruising conditions are generally lower, the average CO2 EFs during the cruising stage are higher, and the CO EFs under all the conditions are higher than the global EFs. Therefore, emission measurements for different types of ships under detailed operating conditions in China’s coastal areas can obtain more emission factor data sets to verify the findings. Because of the large number of ships along China’s coast and the frequent operation of ships in ports, channels, and anchorages, these data sets are of great significance for monitoring and assessing the nearshore environmental pollution as well as supervising China’s ECAs.

Author Contributions

Conceptualization, Y.L.; Data curation, C.B.; Formal analysis, C.B. and B.L.; Funding acquisition, Y.L.; Investigation, B.L., Z.Z. and P.W.; Methodology, C.B., B.L. and P.W.; Project administration, Y.L.; Resources, Z.Z.; Validation, C.B.; Writing—original draft, C.B.; Writing—review & editing, C.B. and Y.L. All authors have read and agreed to the published version of the manuscript.

Funding

This research was funded by National Key Research and Development Project, grant number 2017YFC0211904 and Dalian Innovation Support Foundation, grand number 2018J11CY024; This research was partially supported by the Fundamental Research Funds for the Central University, grant number 3132019133 and 3132019350.

Conflicts of Interest

The authors declare no conflict of interest.

References

  1. Eyring, V.; Isaksen, I.S.A.; Berntsen, T.; Collins, W.J.; Corbett, J.J.; Endresen, O.; Grainger, R.G.; Moldanova, J.; Schlager, H.; Stevenson, D.S. Transport impacts on atmosphere and climate: Shipping. Atmos. Environ. 2010, 44, 4735–4771. [Google Scholar] [CrossRef]
  2. Shang, F.; Chen, D.; Guo, X.; Lang, J.; Zhou, Y.; Li, Y.; Fu, X. Impact of Sea Breeze Circulation on the Transport of Ship Emissions in Tangshan Port, China. Atmosphere 2019, 10, 723. [Google Scholar] [CrossRef] [Green Version]
  3. Merico, E.; Dinoi, A.; Contini, D. Development of an integrated modelling-measurement system for near-real-time estimates of harbour activity impact to atmospheric pollution in coastal cities. Transp. Res. Part D Transp. Environ. 2019, 73, 108–119. [Google Scholar] [CrossRef]
  4. Lauer, A.; Eyring, V.; Hendricks, J.; Jockel, P.; Lohmann, U. Global model simulations of the impact of ocean-going ships on aerosols, clouds, and the radiation budget. Atmos. Chem. Phys. 2007, 7, 5061–5079. [Google Scholar] [CrossRef] [Green Version]
  5. IMO. Annex VI of Marpol 73/78—Regulations for the Prevention of Air Pollution from Ships; IMO: London, UK, 1997. [Google Scholar]
  6. Chu Van, T.; Zare, A.; Jafari, M.; Bodisco, T.A.; Surawski, N.; Verma, P.; Suara, K.; Ristovski, Z.; Rainey, T.; Stevanovic, S.; et al. Effect of cold start on engine performance and emissions from diesel engines using IMO-Compliant distillate fuels. Environ. Pollut. 2019, 255, 113260. [Google Scholar] [CrossRef]
  7. Cheng, Y.L.; Wang, S.S.; Zhu, J.; Guo, Y.L.; Zhang, R.F.; Liu, Y.M.; Zhang, Y.; Yu, Q.; Ma, W.C.; Zhou, B. Surveillance of SO2 and NO2 from ship emissions by MAX-DOAS measurements and the implications regarding fuel sulfur content compliance. Atmos. Chem. Phys. 2019, 19, 13611–13626. [Google Scholar] [CrossRef] [Green Version]
  8. MOT. Implementation Scheme of the Domestic Emission Control Areas for Atmospheric Pollution from Vessels; MOT, Ed.; MOT: Beijing, China, 2018. [Google Scholar]
  9. Wan, Z.; Zhang, Q.; Xu, Z.; Chen, J.; Wang, Q. Impact of emission control areas on atmospheric pollutant emissions from major ocean-going ships entering the Shanghai Port, China. Mar. Pollut. Bull. 2019, 142, 525–532. [Google Scholar] [CrossRef]
  10. Kowalski, J. An experimental study of emission and combustion characteristics of marine diesel engine with fuel pump malfunctions. Appl. Therm. Eng. 2014, 65, 469–476. [Google Scholar] [CrossRef]
  11. Kowalski, J. An Experimental Study of Emission and Combustion Characteristics of Marine Diesel Engine with Fuel Injector Malfunctions. Pol. Marit. Res. 2016, 23, 77–84. [Google Scholar] [CrossRef] [Green Version]
  12. Yang, Z.Y.; Tan, Q.M.; Geng, P. Combustion and emissions investigation on low-speed two-stroke marine diesel engine with low sulfur diesel fuel. Pol. Marit. Res. 2019, 26, 153–161. [Google Scholar] [CrossRef] [Green Version]
  13. Chu Van, T.; Rainey, T.; Ristovski, Z.; Pourkhesalian, A.; Garaniya, V.; Abbassi, R.; Yang, L.; Brown, R. Emissions from a Marine Auxiliary Diesel Engine at Berth Using Heavy Fuel Oil. In Proceedings of the 10th Australasian Heat and Mass Transfer Conference: Selected, Peer Reviewed Papers, Brisbane, Australia, 14–15 July 2016. [Google Scholar]
  14. Winnes, H.; Fridell, E. Emissions of NOX and particles from manoeuvring ships. Transp. Res. Part D Transp. Environ. 2010, 15, 204–211. [Google Scholar] [CrossRef]
  15. Cooper, D.A. Exhaust emissions from ships at berth. Atmos. Environ. 2003, 37, 3817–3830. [Google Scholar] [CrossRef]
  16. Winnes, H.; Fridell, E. Particle emissions from ships: Dependence on fuel type. J. Air Waste Manag. Assoc. 2009, 59, 1391–1398. [Google Scholar] [CrossRef] [PubMed]
  17. Winnes, H.; Moldanova, J.; Anderson, M.; Fridell, E. On-board measurements of particle emissions from marine engines using fuels with different sulphur content. Proc. Inst. Mech. Eng. Part M J. Eng. Marit. Environ. 2016, 230, 45–54. [Google Scholar] [CrossRef]
  18. Fridell, E.; Salo, K. Measurements of abatement of particles and exhaust gases in a marine gas scrubber. Proc. Inst. Mech. Eng. Part M J. Eng. Marit. Environ. 2016, 230, 154–162. [Google Scholar] [CrossRef]
  19. Moldanova, J.; Fridell, E.; Popovicheva, O.; Demirdjian, B.; Tishkova, V.; Faccinetto, A.; Focsa, C. Characterisation of particulate matter and gaseous emissions from a large ship diesel engine. Atmos. Environ. 2009, 43, 2632–2641. [Google Scholar] [CrossRef]
  20. Fu, M.L.; Ding, Y.; Ge, Y.S.; Yu, L.X.; Yin, H.; Ye, W.T.; Liang, B. Real-world emissions of inland ships on the Grand Canal, China. Atmos. Environ. 2013, 81, 222–229. [Google Scholar] [CrossRef]
  21. Yin, H.; Ding, Y.; Ge, Y.-S.; Ye, W.-T.; Wang, J.-F.; Bai, T.; Qian, L.-Y. Emissions characteristics of diesel engines for inland waterway vessels in China. Res. Environ. Sci. 2014, 27, 470–476. [Google Scholar] [CrossRef]
  22. Liu, Y.; Ge, Y.; Tan, J.; Fu, M.; Shah, A.N.; Li, L.; Ji, Z.; Ding, Y. Emission characteristics of offshore fishing ships in the Yellow Bo Sea, China. J. Environ. Sci. (China) 2018, 65, 83–91. [Google Scholar] [CrossRef]
  23. Huang, C.; Hu, Q.; Wang, H.; Qiao, L.; Jing, S.; Wang, H.; Zhou, M.; Zhu, S.; Ma, Y.; Lou, S.; et al. Emission factors of particulate and gaseous compounds from a large cargo vessel operated under real-world conditions. Environ. Pollut. 2018, 242, 667–674. [Google Scholar] [CrossRef]
  24. Zhang, F.; Chen, Y.; Tian, C.; Lou, D.; Li, J.; Zhang, G.; Matthias, V. Emission factors for gaseous and particulate pollutants from offshore diesel engine vessels in China. Atmos. Chem. Phys. 2016, 16, 6319–6334. [Google Scholar] [CrossRef] [Green Version]
  25. Wang, C.; Hao, L.; Ma, D.; Ding, Y.; Lv, L.; Zhang, M.; Wang, H.; Tan, J.; Wang, X.; Ge, Y. Analysis of ship emission characteristics under real-world conditions in China. Ocean Eng. 2019, 194. [Google Scholar] [CrossRef]
  26. Chu-Van, T.; Ristovski, Z.; Pourkhesalian, A.M.; Rainey, T.; Garaniya, V.; Abbassi, R.; Jahangiri, S.; Enshaei, H.; Kam, U.S.; Kimball, R.; et al. On-board measurements of particle and gaseous emissions from a large cargo vessel at different operating conditions. Environ. Pollut. 2018, 237, 832–841. [Google Scholar] [CrossRef] [PubMed] [Green Version]
  27. Cooper, D.; Gustafsson, T. Methodology for Calculating Emissions from Ships: 1. Update of Emission Factors; Swedish Methodology for Environmental Data: Uppsala, Sweden, 2004. [Google Scholar]
  28. UNCTAD. Review of Maritime Transport 2018; United Nations Conference on Trade and Development: New York, NY, USA, 2018. [Google Scholar]
  29. MOT. Domestic Coastal Cargo Ship Capacity Analysis Report in 2018; Ministry of Transport of the People’s Republic of China: Beijing, China, 2019.
  30. Cao, Y.-L.; Wang, X.; Yin, C.-Q.; Xu, W.-W.; Shi, W.; Qian, G.-R.; Xun, Z.-M. Inland Vessels Emission Inventory and the emission characteristics of the Beijing-Hangzhou Grand Canal in Jiangsu province. Process. Saf. Environ. Prot. 2018, 113, 498–506. [Google Scholar] [CrossRef]
  31. Sun, X.; Tian, Z.; Malekian, R.; Li, Z.X. Estimation of Vessel Emissions Inventory in Qingdao Port Based on Big Data Analysis. Symmetry 2018, 10, 452. [Google Scholar] [CrossRef] [Green Version]
  32. Zhang, Y.; Yang, X.; Brown, R.; Yang, L.; Morawska, L.; Ristovski, Z.; Fu, Q.; Huang, C. Shipping emissions and their impacts on air quality in China. Sci. Total Environ. 2017, 581, 186–198. [Google Scholar] [CrossRef]
  33. Fan, Q.; Zhang, Y.; Ma, W.; Ma, H.; Feng, J.; Yu, Q.; Yang, X.; Ng, S.; Fu, Q.; Chen, L. Spatial and Seasonal Dynamics of Ship Emissions over the Yangtze River Delta and East China Sea and Their Potential Environmental Influence. Environ. Sci. Technol. 2015, 50. [Google Scholar] [CrossRef]
  34. IMO. Amendments to the Annex of the Protocol of the Protocol of 1997 to Amend the International Convention for the Prevention of Pollution from Ships, 1973, As Modified by the Protocol of 1978 Relating Thereto, MEPC 58/23/Add.1 ed.; International Maritime Organization: London, UK, 2008. [Google Scholar]
  35. ISO. ISO 8178-2 Reciprocating Internal Combustion Engines—Exhaust Emission Measurement. In Part 2: Measurement of Gaseous and Particulate Exhaust Emissions under Field Conditions; ISO: Geneva, Switzerland, 2008. [Google Scholar]
  36. Entec. Quantification of Emissions from Ships Associated with Ship Movements Between Ports in the European Community; European Commission: Brussel, Belgium, 2002. [Google Scholar]
  37. IMO. Third IMO GHG Study 2014; International Maritime Organization: London, UK, 2014. [Google Scholar]
  38. IMO. Second IMO GHG Study 2009; International Maritime Organization: London, UK, 2009. [Google Scholar]
  39. Nunes, R.A.O.; Alvim-Ferraz, M.C.M.; Martins, F.G.; Sousa, S.I.V. The activity-based methodology to assess ship emissions—A review. Environ. Pollut. 2017, 231, 87–103. [Google Scholar] [CrossRef]
Figure 1. The emission measurement platform and the data acquisition scheme.
Atmosphere 11 00305 g001
Figure 2. The sampling probe in the funnel of the main engine and calibration of the instruments.
Atmosphere 11 00305 g002
Figure 3. Distribution of the operating conditions of the seagoing ship.
Atmosphere 11 00305 g003
Figure 4. (a) The relation between the gas emission concentration and the ship speed under different operating conditions over the entire experiment. (b) The average emission factors (EFs) based on the power of the main engine for the pollutants under different ship conditions. The operating conditions are (1) berthing, (2) manoeuvring in port, (3) acceleration, (4) cruising, (5) deceleration, and (6) anchoring.
Atmosphere 11 00305 g004
Table 1. MARPOL Annex VI NOX emission limits.
TierTotal Weighted Cycle Emission Limit (g/kWh)
n = engine’s rated speed (rpm)
n < 130130 ≤ n < 2000n ≥ 2000
Tier I standards17.045·n−0.29.8
Tier II standards14.444·n−0.237.7
Tier III standards3.49·n−0.22.0
Table 2. The International Maritime Organization (IMO) and Chinese regulations related to sulfur limits in fuel and the NOX emission limits.
AreaCompliance Date (Year. Month)Sulfur Limit in Fuel
(m/m)
NOX Emission Limit
Global2000.014.5%Tier I standards
2011.01-Tier II standards
2012.013.5%-
2020.010.5%-
Emission Control Areas2000.011.5%-
2010.071.0%-
2015.010.1%-
2016.01-Tier III standards
China (Domestic Emission Control Areas)Coastal Control Areas2015.03-Tier II standards *
2019.010.5%-
2022.01
(Hainan waters)
0.1%Tier III standards *
2025.01
(Assessed)
0.1%Tier III standards *
Inland River Control Areas2015.03-Tier II standards *
2019.010.5%-
2020.010.1%-
2022.01-Tier III standards *
* Only for Chinese ships engaged in domestic voyages.
Table 3. Specifications of the test ship.
Ship SpecificationsParticulars
Build year2006
Gross tonnage6106
Length116.00 m
Breadth18.00 m
Draft5.40 m
Main engine typeMAN B&W 6S35MC-C
Maximum continuous power of main engine4440 kW
Maximum engine’s rated speed173 r/min
Fuel consumption rate186.7 g/kW·h
Maximum design speed17.2 kn
Sulfur content of the fuel 0.02% (m/m) and 0.437% (m/m)
Table 4. Comparison of the average emission factors based on the main engine power.
StudyShip Type/Main Engine Power (kW)Operating ConditionSulfur % (m/m)EFs (g/kW·h)
NOXSO2CO2CO
This studySpecial-purpose ship/4440Berthing0.025.19 0.18 694.25 5.66
Manoeuvring in port6.12 0.14 540.91 3.25
Acceleration0.02/0.437 *9.53 0.48 665.81 3.37
Cruising0.43711.23 0.69 715.22 3.70
Deceleration0.437/0.02 *9.13 0.31 695.42 4.88
Anchoring0.027.47 0.23 1124.51 9.74
Huang et al. (2018) [23]Bulk carrier/7948Departure
Main Engine load (0%–50%)
1.1210.50-722.753.35
Cruising
Main Engine load (74%)
7.73-607.392.09
Arrival
Main Engine load (50%–0%)
15.05-601.76.78
Zhang et al. (2015) [24]Engineering vessel/700-0.079823.90.366356.92
Research vessel/3200-0.04587.140.186311.39
Research vessel/500-0.136.970.576972.01
Cooper (2004) [27]-Manoeuvring0.413.6-6471
Cruising17.0-5880.5
Entec (2002) [36]-Manoeuvring (in port)0.513.61.0647-
Cruising17.00.9588-
* Change fuel.

