Abstract
Aerosol optical depth (AOD) has become one of the most crucial parameters for climate change assessment on regional and global scales. The present study investigates trends in AOD using long-term data derived from moderate resolution imaging spectro-radiometer (MODIS) over twelve regions in Pakistan. Different statistical tests are used to assess the annual and seasonal trends in AOD. Results reveal increasing AOD trends over most of the selected regions with an obvious increase over the north and northeastern parts of the study area. Annually, increasing trends (0.0002–0.0047 year−1) were observed over seven regions, with three being statistically significant. All the selected regions experience increasing AOD trends during the winter season with six being statistically significant while during the summer season seven regions experience increasing AOD trends and the remaining five exhibit the converse with two being statistically significant. The changes in the sign and magnitude of AOD trends have been attributed to prevailing meteorological conditions. The decreasing rainfall and increasing temperature trends mostly support the increasing AOD trend over the selected regions. The high/low AOD phases during the study period may be ascribed to the anomalies in mid-tropospheric relative humidity and wind fields. The summer season is generally characterized by high AOD with peak values observed over the regions located in central plains, which can be attributed to the dense population and enhanced concentration of industrial and vehicular emissions over this part of the study area. The results derived from the present study give an insight into aerosol trends and could form the basis for aerosol-induced climate change assessment over the study area.
1. Introduction
The direct and indirect effects of atmospheric aerosols on Earth’s climate system make them an integral part of the regional and global climate system [1,2,3]. The cooling and heating effects of aerosols produced by backscattering and absorption of solar radiation respectively, are some of their adverse effects responsible for large scale mutation of the earth’s climate. The absorption and scattering of the radiant energy by atmospheric aerosols can alter atmospheric stability, thereby affecting the cloud microphysics, their lifetime, and other properties. Consequently, aerosols can indirectly influence the hydrological cycle, global surface temperature, and the ecosystems [4,5,6,7,8,9,10]. The scattering and absorption of dust particles modify the transmission of both short-wave and long-wave radiation through the atmosphere and consequently heating the atmospheric column [11,12]. In addition, aerosols are known to have detrimental effects on human health, air quality and visibility [13,14]. Thus, looking into the aforementioned effects, the trend analysis of aerosol optical depth is of great importance for the accurate assessment of aerosol impacts on a regional climate [15]. The basic property of aerosol related to their atmospheric column integrated amount is the aerosol optical depth (AOD) which is an optical parameter, defined as the integration of the extinction coefficient over a vertical column of unit cross section. Therefore, AOD can be seen as an appropriate parameter for quantification and long-term trend analysis of aerosols.
South Asia is very prone to the adverse effects of increasing aerosol amount because of population expansion, rapid urbanization, land use changes, increasing motorized traffic, and growing industrialization within, and adjacent to urban areas. The list for generating these aerosols includes anthropogenic and natural sources. Natural aerosols (e.g., dust and sea salt) mostly originate from the southern dry regions and the nearby ocean [16,17], while anthropogenic aerosols originate mainly from vehicular and industrial emissions [18,19,20,21]. Dust lifted from the Thar desert, as a result of dust storms during the pre-monsoon season may be associated with increased dust concentration over the Indo-Gangetic-Plane (IGP) [22]. Related studies suggest that aerosols exhibit high variability over space and time in the region. Singh et al. [20] have reported considerable spatial and temporal variation of fine mode aerosols over different parts of South Asia. Ul-Haq et al. [23] have reported an increase in NO2–AOD correlation over South Asia with an overall positive trend over different mega cities of the region. Recently Kumar et al. [24] have reported a high aerosol loading over the IGP region with a statistically insignificant increasing AOD trend of 0.002 year−1. The main factors responsible for variation in AOD across the region were found to be seasonality, multifaceted topography, and complex built environment.
Pakistan, situated in the northwestern part of South Asia, is also affected by the growing aerosol concentration. However, a limited number of studies have been conducted on long-term trends of aerosols in Pakistan, so far. Kumar et al. [24] have reported statistically insignificant increasing AOD trend over Lahore, Multan and Karachi in Pakistan. Gupta et al. [25] analyzed 10 years of MODIS data and found decreasing AOD trend at the rate of 0.07 year−1 over Lahore. Moreover, Alam et al. [26] have reported higher AOD values in summer and lower values in winter for different cities in Pakistan. It has been reported that the regional meteorology and seasonal variation in particle source strength could be the primary causes of spatial inconsistencies in the distribution of aerosol types as well as their concentration. The spatiotemporal variations in aerosol characteristics associated with an increase in aerosol emissions over the region during the last two decades [24,26,27], motivated us to examine the long term trends in AOD over different regions in Pakistan.
For better estimation of the impact of aerosols on climate, their properties need to be understood at regional and global scales. In this regard, a number of remote sensing techniques, ranging from ground-based [28,29,30,31] to satellite-based techniques [32,33,34,35], have been designed to provide accurate measurements of AOD along with other aerosol properties. The ground-based aerosol robotic network (AERONET) is one of the commonly used networks providing reliable and continuous data on aerosol properties [28,36], but because of being limited to point observations, this technique cannot be used over wide range spatial characteristics of aerosols. In contrast to AERONET, satellite-based remote sensing provides a good opportunity to monitor aerosols characteristics with an extended geographical extent. The MODIS sensors onboard the Terra and Aqua satellites utilize distinct algorithms to provide long-term spatiotemporal characteristics of aerosols at regional and global scales. Advancements in satellite remote sensing of aerosols have simplified the assessment of aerosol properties over a large area with a high number of repeated observations. A growing body of literature has also reported the use of satellite observations to investigate the indirect effects of spatial and temporal patterns of aerosols, at both regional and global scales [24,37,38,39]. Satellite remote sensing is a powerful tool for monitoring and assessing the global aerosol budget and the radiative effects of aerosols on climate [40,41,42]. Moreover, the satellite remote sensing has the benefit of assessing the spatial distribution and properties of aerosols over a large area in a single snapshot [43]. This technique is undoubtedly a unique opportunity to derive regional and global patterns for aerosol distribution and aerosol properties.
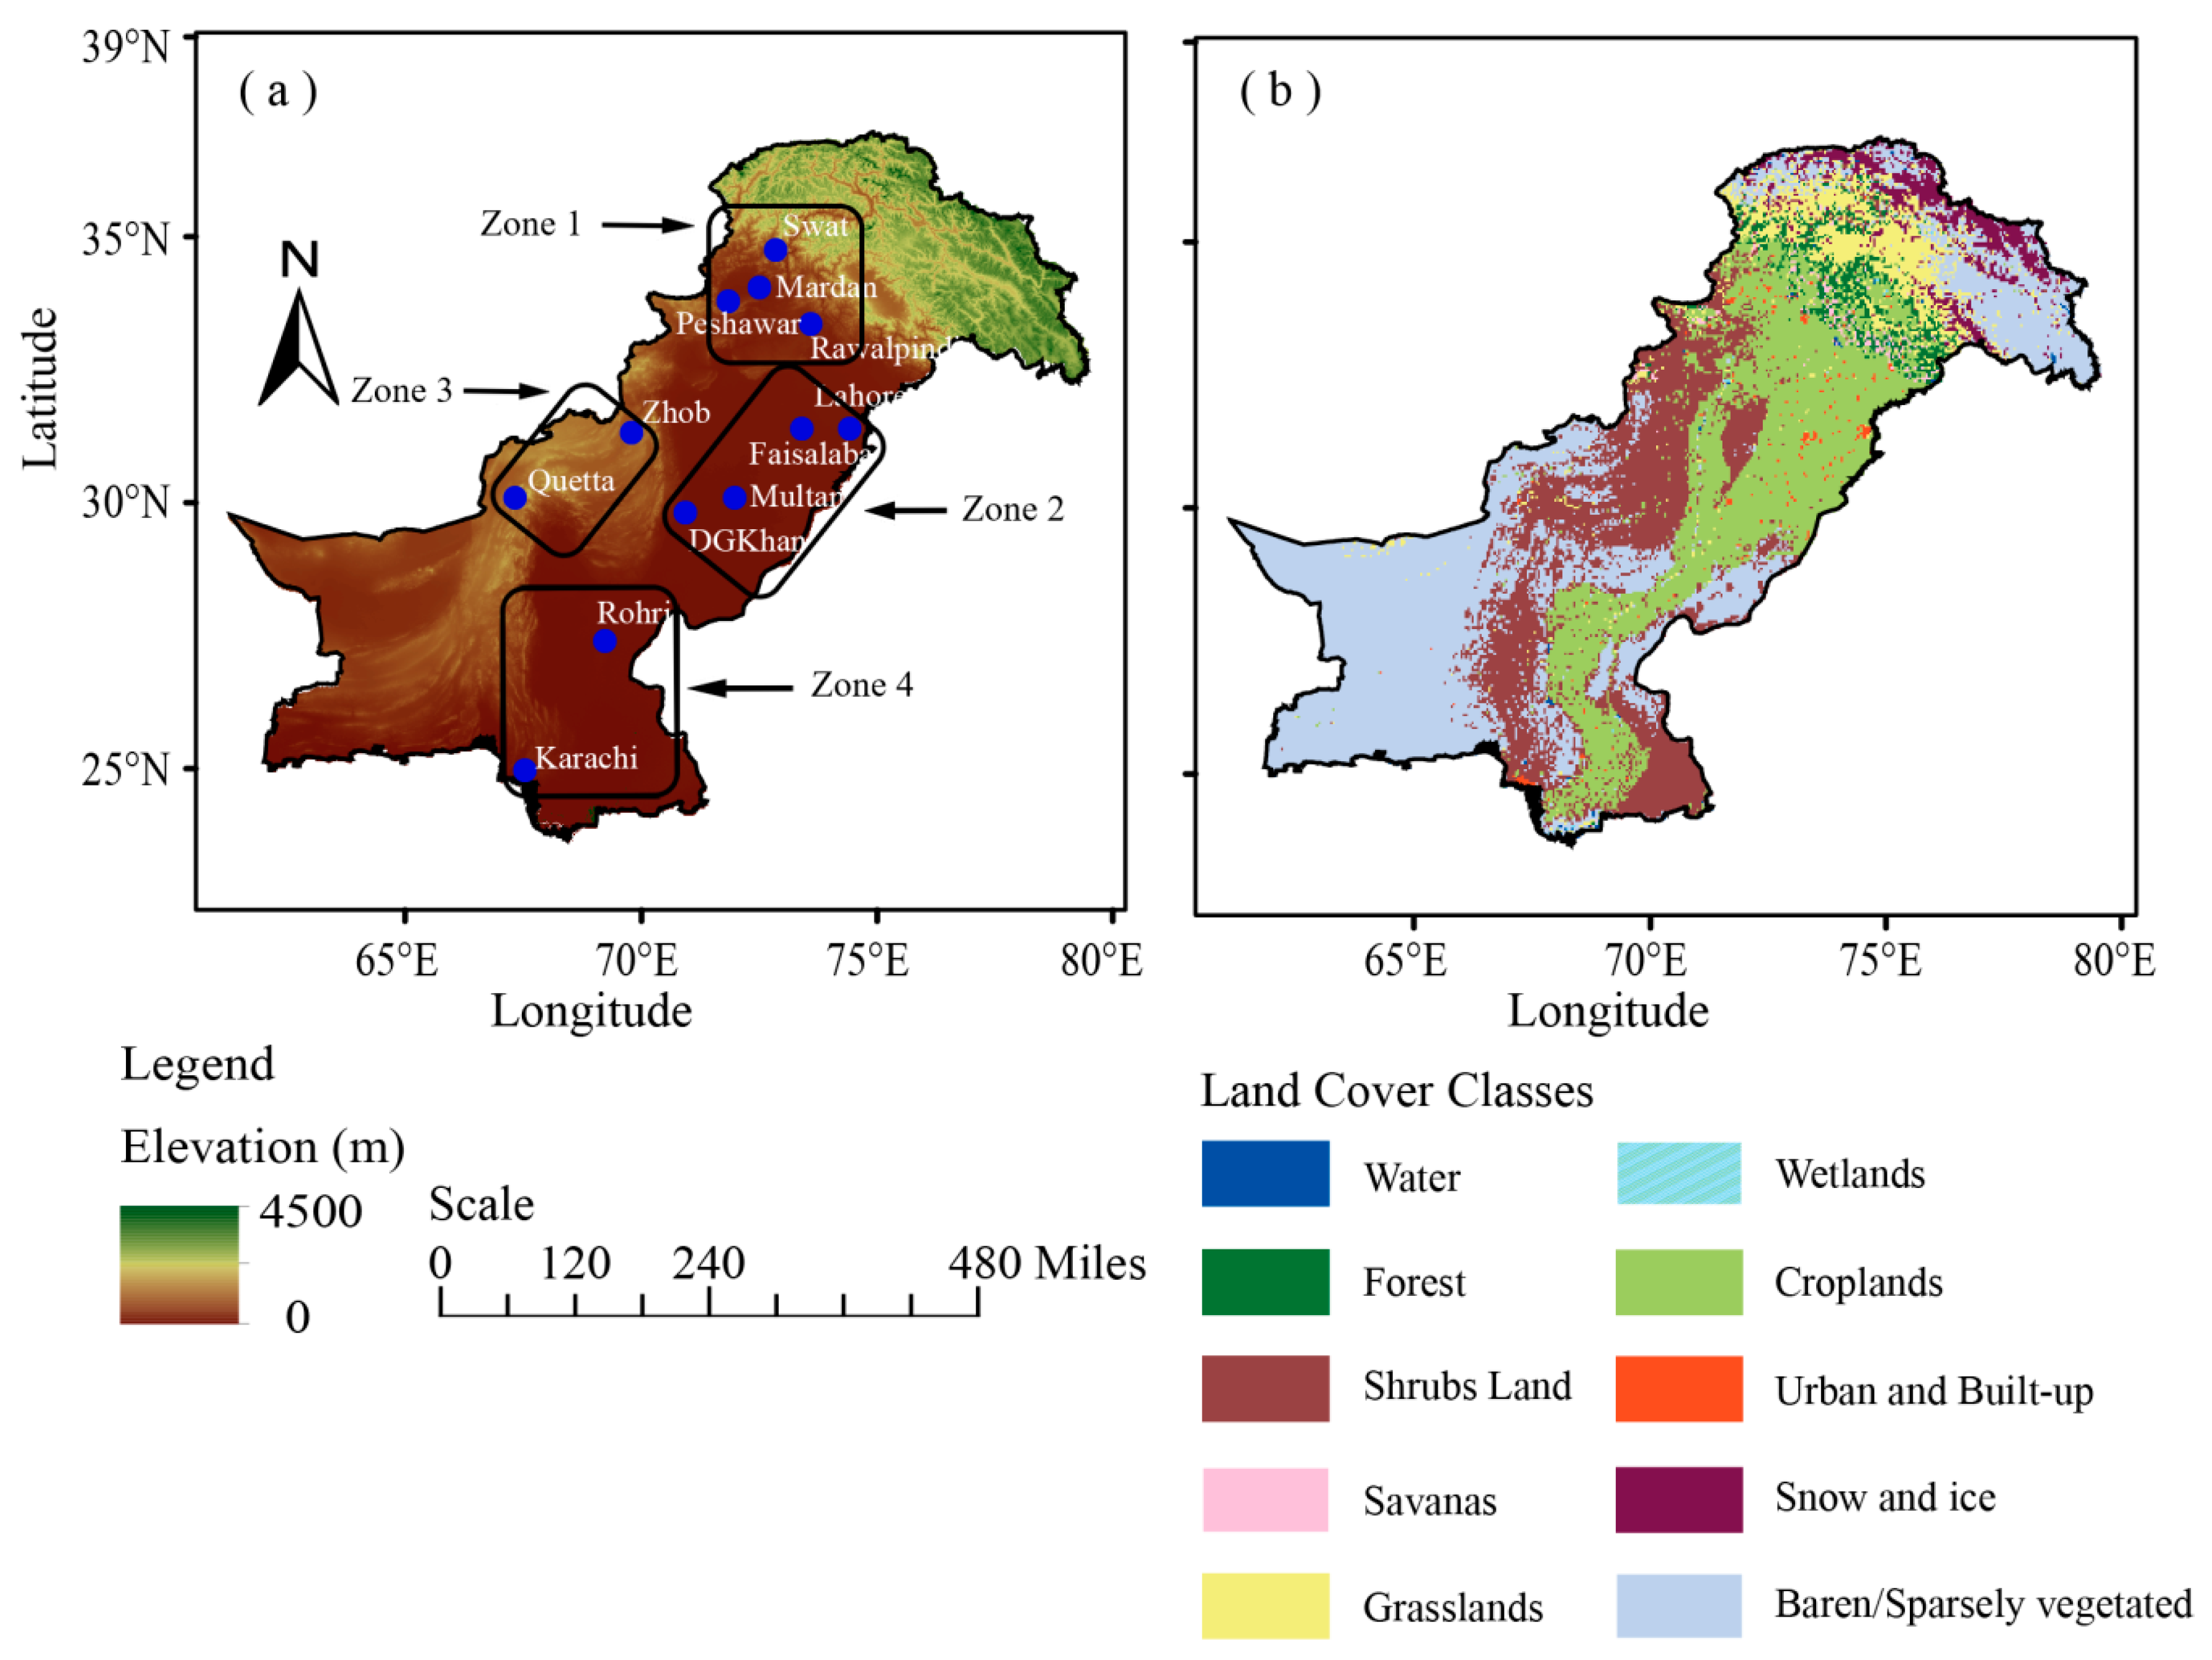
The present study aims to analyze the spatiotemporal variability of AOD on annual and seasonal scales over the selected distinct climatic regions of Pakistan. These include; Swat, Mardan, Peshawar, Rawalpindi, Lahore Faisalabad, Multan, DG-Khan, Zhob, Quetta, Rohri, and Karachi (Figure 1, Table 1). These are the major urban centers in the country with diverse residential and industrial setups. The study investigates the AOD trends over these distinct regions based on climatology, topography, and population. The regions selected here are representative of the entire study domain. The regions have been further grouped into four different zones based on similarity between their topography and climatology (Figure 1). The aerosol concentration over urban areas is usually high because of multiple aerosol sources as compared to rural areas. The main concern of the aerosol study is to figure out the aerosol impact on the human population. Therefore, we are focusing on urban centers. The analysis utilizes 15 years (2003–2017) of AOD data obtained from MODIS Collection 6.1 (C061) enhanced deep blue (DB) algorithm [34,35] over land which has been restructured to incorporate an improved smoke detection mask and better surface reflectance scheme for rugged terrain in order to reduce the systematic biases in AOD retrieval due to elevated areas.
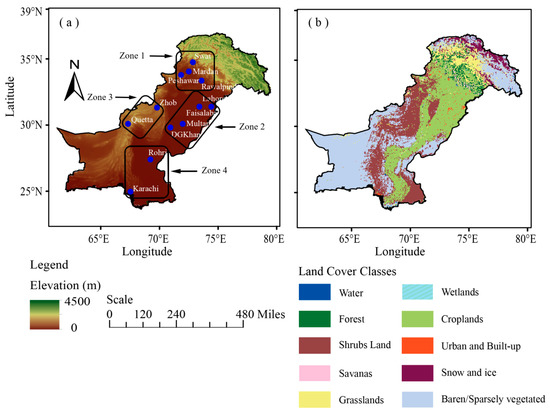
Figure 1.
Map of the study domain showing (a) Elevation and locations of the selected regions and (b) land cover. The elevation map is based on Shuttle Radar Topography Mission (STRM) data [44]; whereas, the land cover map is based on the Terra and Aqua combined MODIS Land Cover Type (MCD12Q1) Version 6 data product available on [45]. The four zones in Figure 1(a) correspond to the selected regions with similar topography and climatology.

Table 1.
Information of selected regions, multiyear mean AOD (2003–2017); annual, summer (JJAS) and winter (DJF) along with standard deviations (SD) from the mean, acquired from MODIS-Terra DB product. The Population record (in millions) is based on 2017 census [46]; the numbers in brackets show the urban percentage for each region.
In order to identify aerosol distribution and recognize aerosol characteristics over the selected regions, we used various statistical methods and techniques. The Sen’s slope (SS) estimator test was used to quantify the slope of the trend, whereas the modified Mann–Kendall (m-MK) test was used to determine significance of the trend. Moreover, the sequential Mann–Kendall (SqMK) test was employed to detect the abrupt temporal shift or change in the trend during the study period. The main focus of this study is to quantify the aerosol characteristics on regional scale in Pakistan, which is perceived to help in understanding the aerosol effects on and responses to the inter-annual variations and trends in rainfall over the study region. The rest of this paper is structured as follows. Section 2 describes the study area. Section 3 introduces the datasets and methodology. The evaluation results and discussion are provided in Section 4. Finally, Section 5 provides the conclusion.
2. Study Area and Meteorology
Pakistan is located in South Asia between 23.6° and 37.0° North and 60.0° and 78.0° East. Pakistan covers an area of 796,100 km2. The country has a unique topography, with altitude varying from 0 m at sea level in the south to the highest peaks of the Himalayan and Karakoram ranges in the north and northeast [26,47]. The central part comprises of the flat agricultural plains of the Indus River Basin and the coast of the Arabian Sea in the South. Significant spatiotemporal variability exists in climatic conditions with dominating arid to semi-arid conditions over most parts of the study domain. Climate in the northern parts is sub-humid to arid whereas coastal climate prevails over the southern parts. The central parts are mostly dominated by tropical and continental climatic conditions [48,49,50,51]. The topographic variations from northern highlands to the southern coastal belt make Pakistan geographically unique for any study of spatiotemporal aerosol patterns [26]. Data for twelve selected distinct regions (Figure 1, Table 1) have been analyzed and the temporal variations in aerosol concentration investigated. A short description of each selected location (e.g., the geographical position, population, climatology, and emission sources etc.) is delineated in Section 2.1.
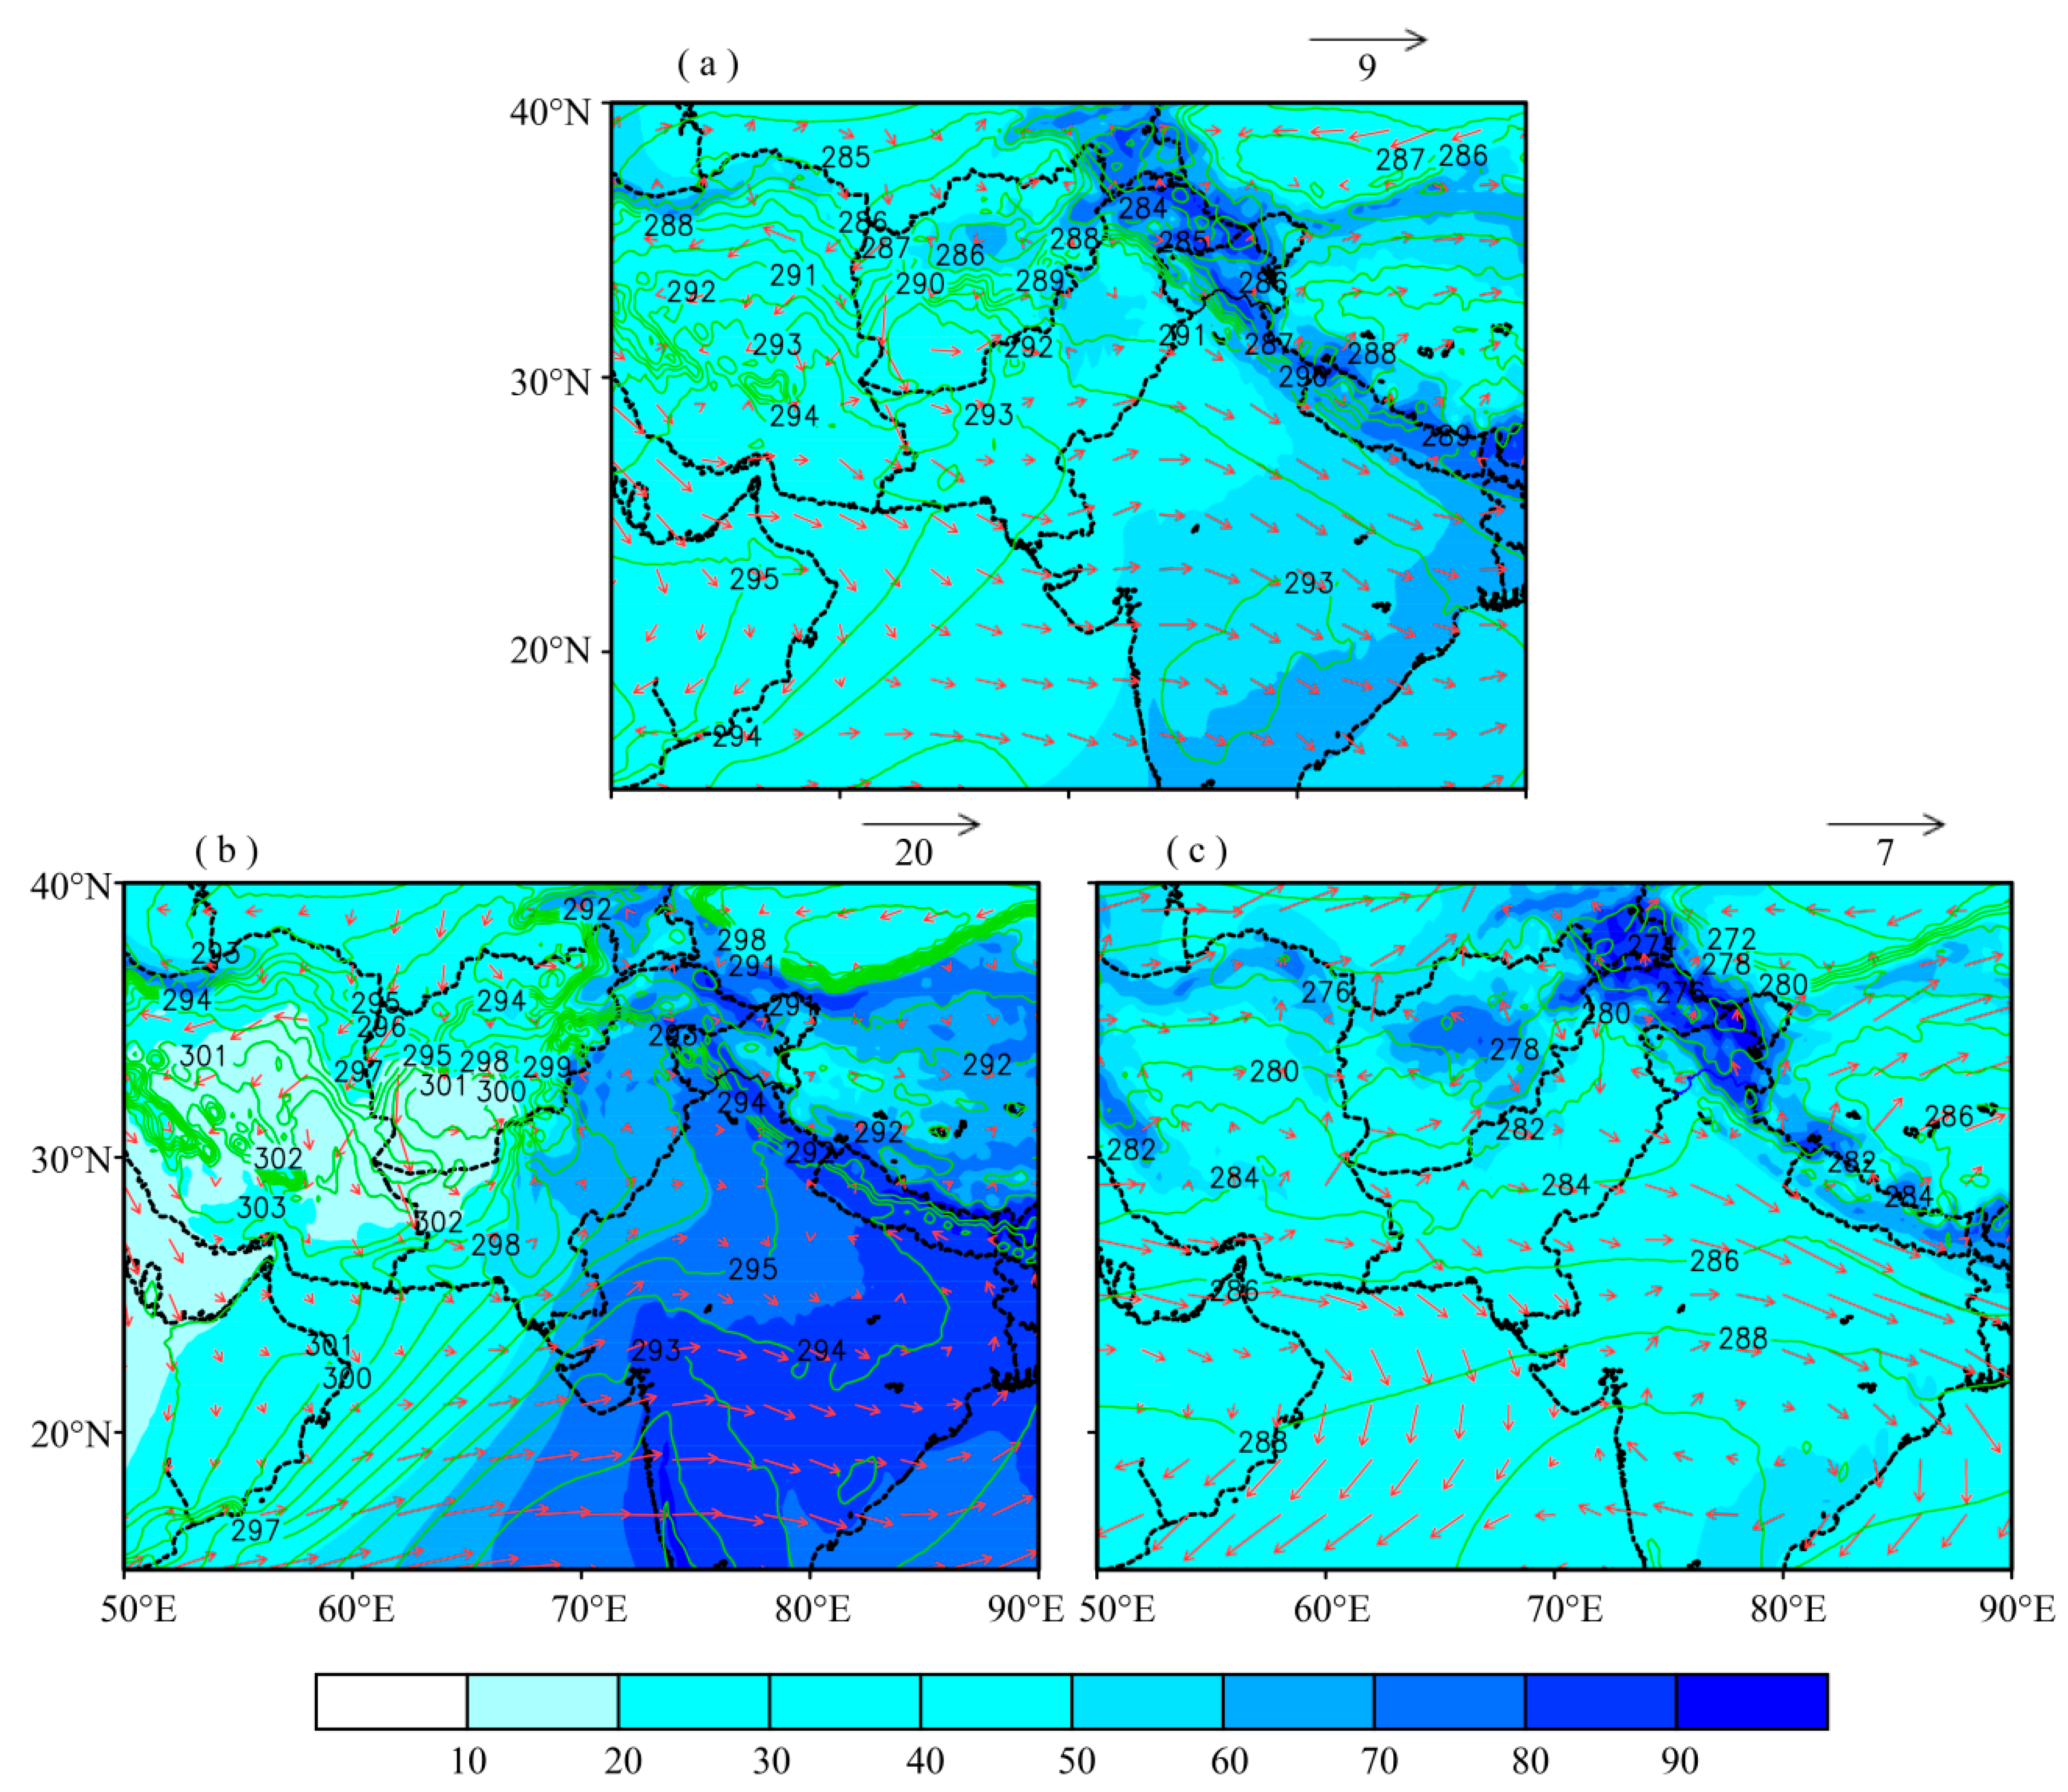
Pakistan experiences two extreme weather conditions every year, namely summer (June to September) and winter (December to February). The summer season is characterized by high surface temperature, especially over eastern and north-eastern planes of the region (Zones 2 and 4), resulting in strong surface convection and frequent dust storms occur particularly during early days of the summer season. The winter season is characterized by low surface temperature and high pressure. The central and north-eastern planes (Zone 2) of the region experience haze/fog during this season due to high atmospheric stability. The western and north-western parts usually experience cold condition due to western weather system causing most of the precipitation during this season [52,53]. Synoptic meteorological conditions play a critical role for the aerosol characterization of a region [54]. Figure 2 shows the mean annual and seasonal synoptic meteorology during the study period. The monthly mean weather parameters relative humidity, wind pattern, and temperature at 850 hPa pressure level were used to study the synoptic meteorological conditions over and around the study domain during the study period from 2003 to 2017. The data sets at 0.25° × 0.25° horizontal resolution were obtained from ERA-interim reanalysis data set available online on [55]. The shaded color contours represent RH (%) while the green contours show the air temperature (K). The wind speed (ms−1) and direction (deg) are represented by the arrow’s lengths and directions. The region is generally characterized by westerly to northwesterly winds during the study period, with relatively higher wind speed during summer season (Figure 2). Similar results were obtained by Khan et al. [56], Kumar et al. [16], Tiwari and Singh [57], and Tiwari et al. [58]. Further, a significant gradient in RH is observed as we move from south to north and northeast.
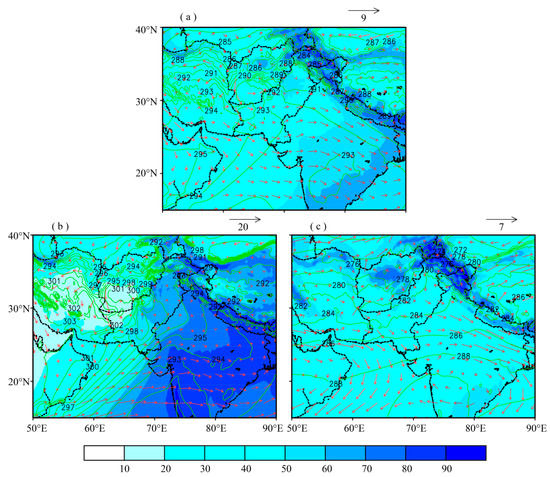
Figure 2.
Synoptic meteorological conditions derived from the ECMWF, ERA-Interim reanalysis data sets at 850 hPa pressure level during 2003–2017, over and around the study domain; (a) Annual, (b) Summer, (c) Winter. The shaded color contour represents RH (%), and the green line contour represents air temperature (K), winds are represented by arrows pointing towards the wind direction and the length of arrows represent the wind speed (in ms−1).
2.1. Regions Description
(a) Swat (34.77° N, 72.36° E) is located in north-western part of Pakistan. It is considered as the least polluted region as compared to other regions in the country. The main sources of aerosols over this area include soil and road dust and emissions from vehicles and industries. Emissions from wood burning for cooking and heating in winter season are considered as anthropogenic sources of aerosols. Alam et al. [59] reported biomass burning in the nearby Nuristan forest as possible aerosol source.
(b) Mardan (34.20° N, 72.05° E) is located in the north-western Pakistan near Peshawar. The hot and semi-arid climate in this region makes it prone to natural aerosols originating from soil and road dust. Vehicular and industrial emissions are some of the anthropogenic aerosol sources.
(c) Peshawar (34.01° N, 71.52° E) is the capital city of Khyber Pakhtunkhwa Province. The climate is tropical with a mean maximum temperature of 40 °C in summer and 10 °C in winter. Major sources of aerosols in the city include natural sources like soil and road dust and anthropogenic sources like vehicular, industrial, brick kiln emission and household combustion emission.
(d) Rawalpindi (33.60° N, 73.05° E) is the fourth largest city in Pakistan, situated near the capital city Islamabad. The subtropical climate prevails over this city with hot summers and mild winters. Rawalpindi is the commercial center and hosts chemical, textile, and metalworking industries. The major sources of aerosols at this site mostly include agricultural activities, local industries, vehicles, mechanical workshops, and road dust.
(e) Lahore (31.48° N, 74.26° E) is the second largest city and the capital of the Punjab province in Pakistan with a population of about 11 million inhabitants. It is situated on the Ravi River, close to the border with India. Hot and semi-arid climate conditions prevail over Lahore with hot and humid summers and warm and dry winters. The temperature in summer ranges between 36 and 46 °C. Lahore contains one of the major industrial setups in the country. Aerosol sources at this site are mainly soil or road dust, industrial and vehicular emissions and emissions from the burning of crop residues in the surrounding areas.
(f) Faisalabad (31.45° N, 73.14° E) is ranked as the third largest city in Pakistan in terms of population but the second largest in terms of industrialization. The overall climate of Faisalabad is extreme with temperature variations from −1°C in winter to 48°C in summer. Most of the rainfall occurs during summer monsoon season. Industrial emission is the prime source of aerosols as well as vehicular emissions and open solid waste combustion including plastic are also deteriorating the ambient air quality of the area [60].
(g) Multan (30.19°N, 71.47°E) is located in the southern part of Punjab province, Pakistan. This city is a major urban center having tropical kind of climate and mostly surrounded by agricultural lands. Due to its proximity to Nara and Cholistan deserts, dust is the major source of aerosols along with vehicular emissions. Other sources of aerosols include road dust, smoke, and emissions from automobiles and heavy machinery.
(h) DG-Khan (30.03° N, 70.64° E) is located at the junction of the four provinces of Pakistan. Like Multan, DGKhan is also close to desert region therefore dust aerosols are more persistent, along with local vehicular emissions. Other sources of aerosols include; industrial emissions, road dust, smoke, and emission from heavy machinery [26,61].
(i) Karachi (24.95° N, 67.14° E) is the largest city in Pakistan located on the flat, sandy coastal area of the east coast of Arabian Sea. With a population of 15 million, it is considered as an economic hub for the country with major industries. This city represents a typical urban setting with a variety of air pollution sources including industrial and vehicular emissions, dust and sea salts.
(j) Rohri (27.67° N, 68.88° E) is an arid, suburban region located in southern Pakistan. It is considered as a hotspot of dust aerosols because of its proximity to Thar and Cholistan deserts as well as the intrusion of sea salt aerosols from the nearby Arabian Sea [27].
(k) Quetta (30.18° N, 67° E) is the capital city of Baluchistan province and considered as a city with high atmospheric pollution. Quetta and its surroundings are one of the coal rich regions of Pakistan. Because of being a remote area subject to a lack of facilities, the local population mostly uses coal for heating purposes during the winter season. Further, eighty percent of the population uses LPG as a fuel alongside kerosene for cooking purposes. A few thermal power plants, 25 brick kilns, a number of small scale industries, as well as a large amount of automobiles cause the emissions mostly rich with hydrocarbons [62].
3. Materials and Methods
3.1. Data
The moderate resolution imaging spectro-radiometer (MODIS) is a remote sensing instrument on board the NASA’s (National Aeronautics and Space Administration) two Earth Observing System (EOS), Terra and Aqua satellites. MODIS operates at an altitude of 705 km and makes radiance observations in 36 spectral channels in the wavelength range of 410–1440 nm at spatial resolution ranging from 250 m to 1 km with a 2300 km wide swath and almost daily global coverage. Details of MODIS aerosol retrieval are given in Levy et al. [63] and Hsu et al. (2013, 2019) [34,35]. Two algorithms, namely the Dark target (DT) and deep blue (DB), are used to retrieve AOD over land and ocean [34,35,63]. The latest MODIS Collection 6.1 (C061) incorporates several improvements in the retrieval algorithms and the uncertainties have been effectively mitigated as compared to the previous collections [47,64,65,66]. More details on data products, retrieval algorithms, calibration, and uncertainties can be found in related studies [34,35,63,66,67,68,69].
The present study utilizes 15 (2003–2017) years of AOD data at 550 nm obtained from the Terra-MODIS C061 DB product acquired from the LAADS-DAAC [70]. We used high resolution (10 × 10 km2), level 2, and recommended quality flag (QA ≥ 2) AOD data to analyze the aerosol characteristics over the study domain. The enhanced DB algorithm incorporates an improved assessment of surface reflectance with better cloud screening and dust identification. It is applicable to any land cover type except snow/ice [34,35]. Wei et al. [71] evaluated the MODIS AOD products and found that the C061 performed better as compared to the old collection C006. They further reported that the DB algorithm is more stable and less affected by changes in atmospheric conditions over different parts of the world. Furthermore, the C061-DB algorithm has been found to perform better in retrieving aerosol properties over the study domain [47] though with slight underestimation. Additionally, AOD at 10×10 km2 has been used to better characterize the long-term trend over urban areas. In an attempt to analyze AOD trends utilizing MODIS Aqua and Terra data over Indian subcontinent Srivastava et al. [72] have reported that trends estimated from various techniques are comparable for both the datasets. In a recent study by Sayer et al. [66], it is reported that the overall performance of DB applied to MODIS Terra and Aqua is similar. However, based on the stability of AERONET AOD data, the MODIS sensors onboard the Terra and Aqua platforms are suffering from artificial drifts in AOD retrievals. The drift in MODIS-Terra (0.005 per decade) is smaller as compared to Aqua (0.01 per decade) [66]. Therefore, for the current study the MODIS-Terra AOD product was used. The MODIS-DB AOD expected uncertainty over land is given as ± (0.05 + 20%).
The AERONET AOD data in the study domain is only available for two stations, namely Lahore and Karachi. This data is based on ground-based remote sensing measurements, conducted by the AERONET network by applying the Cimel sun photometer, which is open and free for the public, available at (https://aeronet.gsfc.nasa.gov/) [28]. The instrument provides AOD measurements in a wide spectral range (0.340–1.069 μm) with low uncertainty (0.01–0.02) and high temporal resolution (every 15 min). The recently released version 3 data comprises three quality levels (i.e., level 1.0, 1.5 and 2.0) [36]. The level 2 product provides the highest quality data obtained after final calibration and manual inspection, however, limited on a temporal scale. A reliable long-term trend analysis needs continuous data with least/no missing values. For Karachi, the long-term continuous level 2 data is only available during 2007 to 2012, but for Lahore, the continuous level 2 data is very limited. Alternatively, level 1.5 data for Lahore is available during 2010 to 2016. For the rest of the study period, the AERONET data at both levels are not suitable for use due to a large number of missing values. Therefore, the monthly mean AERONET version 3, level 2 data for Karachi (2007 to 2012) and level 1.5 data for Lahore (2010 to 2016) is obtained and utilized for AOD trend analysis. Further, the AERONET AOD data available at 500 nm is interpolated to the MODIS wavelength band (550 nm) using the Ångström power law [73]. This condition is required for a reliable comparative analysis.
Apart from MODIS AOD product, monthly rainfall and temperature data for the selected locations were acquired from Pakistan Meteorological Department (PMD). Other meteorological datasets for relative humidity (RH), wind speed (WS) and temperature (T) were retrieved from ERA-interim reanalysis data set available online [55]. The mean of the meteorological parameters at different temporal scales (seasonal and annual) was calculated from their respective monthly data sets.
3.2. Methods
Level 2 AOD data at 550 nm were retrieved from the MODIS sensor onboard the Terra satellite. The AOD for individual region was retrieved by taking the spatial average of all recommended quality flags (QA ≥ 2) AOD measurements (at least two pixels) within a window of 5 × 5 pixels centered over the urban area. High-resolution Google Earth maps were used to identify the central location of each region, based on the spatial distribution of urban development. Using these retrievals, the mean AOD at various temporal resolutions for each region was calculated. Based on the local climatology the summer season comprises of the months June to September (JJAS), whereas December to February (DJF) corresponds to the winter season [74,75,76,77]. In addition, a number of statistical tests, including the modified Mann–Kendall (m-MK), Sen’s slope (SS) estimator, and sequential Mann–Kendall (SqMK) tests were used to quantify the trends in annual and seasonal AOD time series [78,79,80,81,82]. The non-parametric m-MK test was used to detect the significance of the trend, while the SS estimator was used to determine the magnitude of the trend in AOD time series. The Sen’s statistic gives a robust estimation of trend and is based on the median slope of each point-pair slope in a dataset, hence fairly resistant to outliers. Similarly, the Mann–Kendall test is simple and robust against outliers and missing values as well as distribution free and has the high power for non-normal distributed data [72,83,84,85,86,87,88,89,90,91]. It is worth mentioning that the modified version of Mann–Kendall (m-MK) test was used which has the ability to nullify the effect of autocorrelation prior to determination of statistical significance. The m-MK test first proposed by Hamed and Ramachandran [80] is robust in the presence of autocorrelation in the time series. Abrupt changes or shifts in the trend over time were detected using the SqMK test. Studies by several researchers including [92,93,94,95] have suggested the use of this test statistic to be the most appropriate for climate abrupt change detection. Further, statistical significance of the AOD annual and seasonal time series at 95% confidence level was determined. The governing equations for statistical tests can be found in the work done by a number of researchers including [85,93,94,95,96,97]. In order to find a possible dependence of AOD trends upon rainfall and temperature, trends in multi-year annual and seasonal mean rainfall and temperature during the study period were calculated for the selected regions. Moreover, the high and low AOD years were identified based on the standardized AOD time series. The anomalies in relative humidity (RH) and wind speed (WS) during high/low AOD phases were calculated to examine their possible relationship with AOD trends over the study area.
4. Results and Discussion
4.1. AOD Climatology and Atmospheric Dynamics over the Study Domain
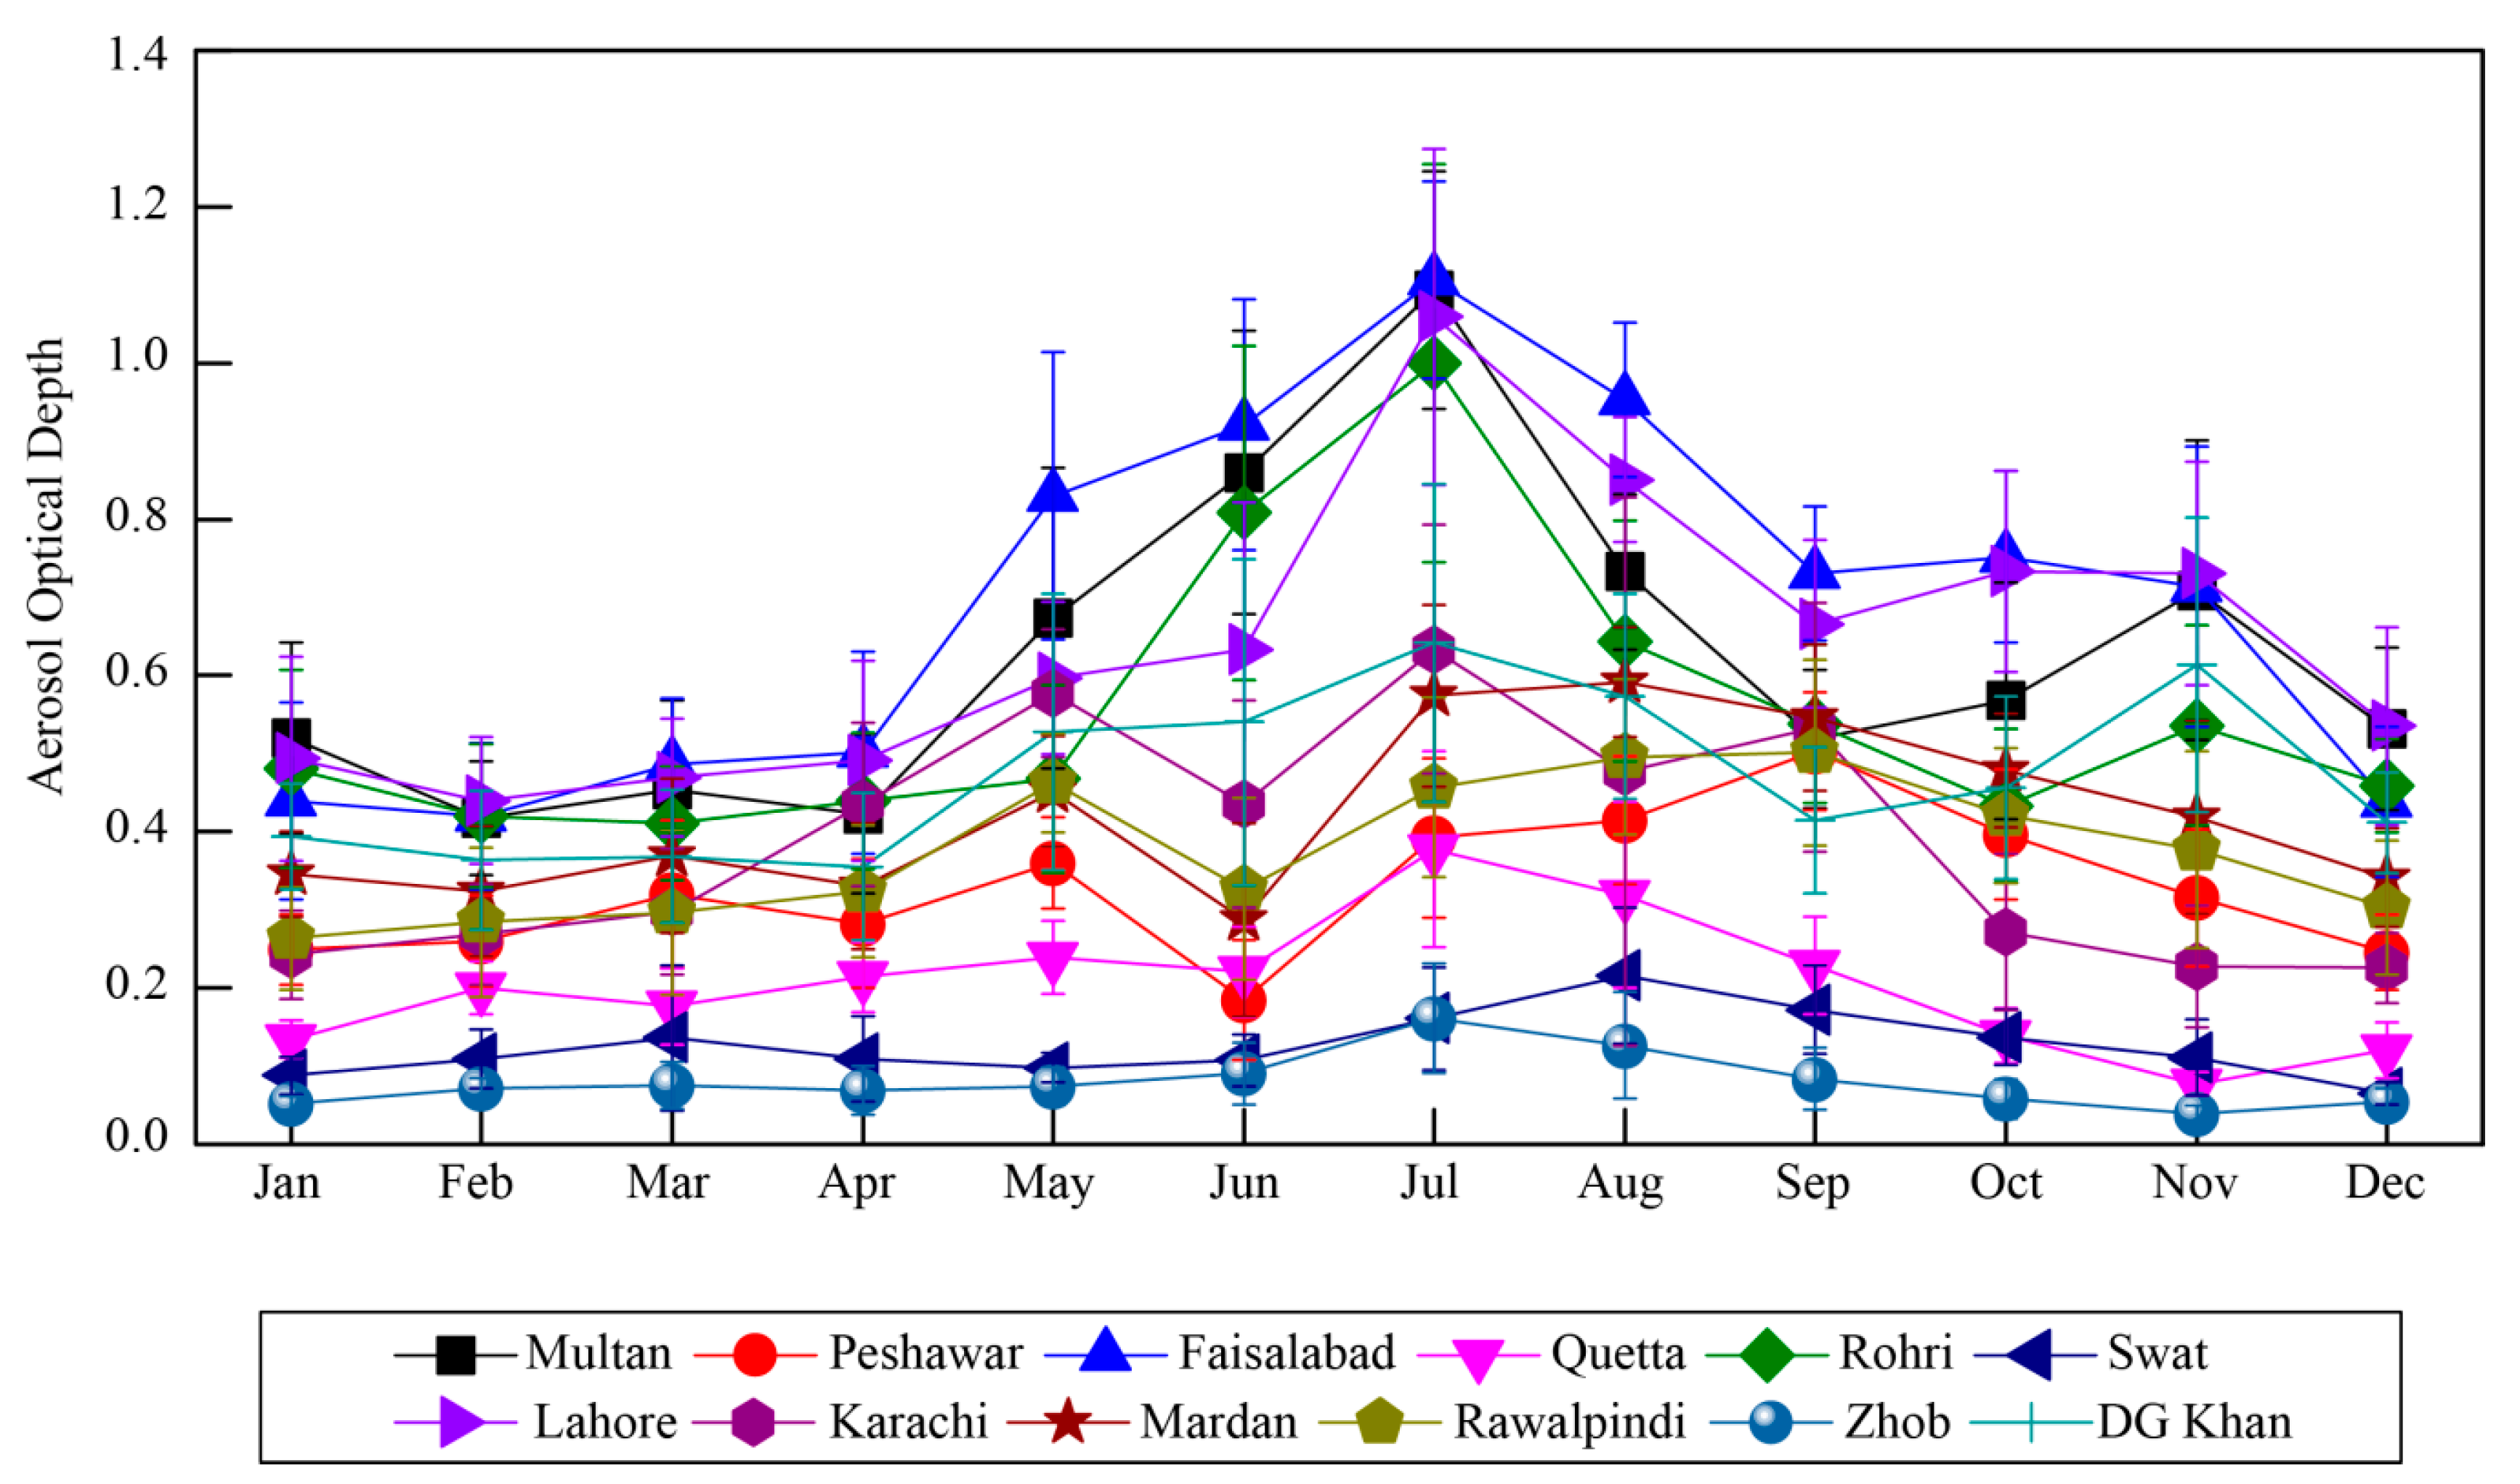
The topography of the study domain varies from the coastal belt in the south, through the inland plains, arid and semi-arid regions to the mountains, and plateaus with tropical and subtropical climate conditions (Figure 1). Figure 3 shows the annual cycle of AOD derived from MODIS over selected locations during the study period.
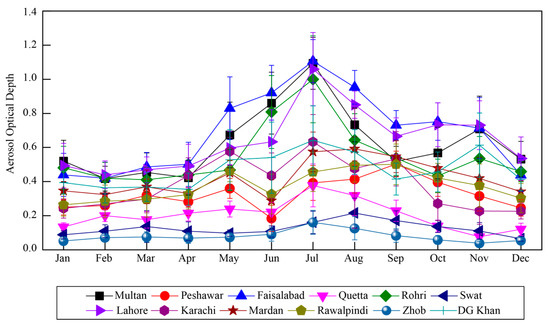
Figure 3.
The annual cycle of MODIS AOD over the selected regions between 2003 and 2017. The vertical bars represent standard deviation from the mean.
High AOD is observed over the stations located in the inland plains (Zone 2) especially during summer months similar to the results reported by a number of authors including Alam et al. [61] and Mehta et al. [98]. The AOD values generally experience a gradient as we move away from Zone 2 (Figure 1) in either direction with peak values observed over the regions located in this zone. The regions at higher altitudes (Figure 1, Table 1) (e.g., Swat, Zhob and Quetta) experience lower AOD values. Further, low AOD is generally observed during winter months but comparatively high over regions located in the central plains (Figure 3, Zone 2).
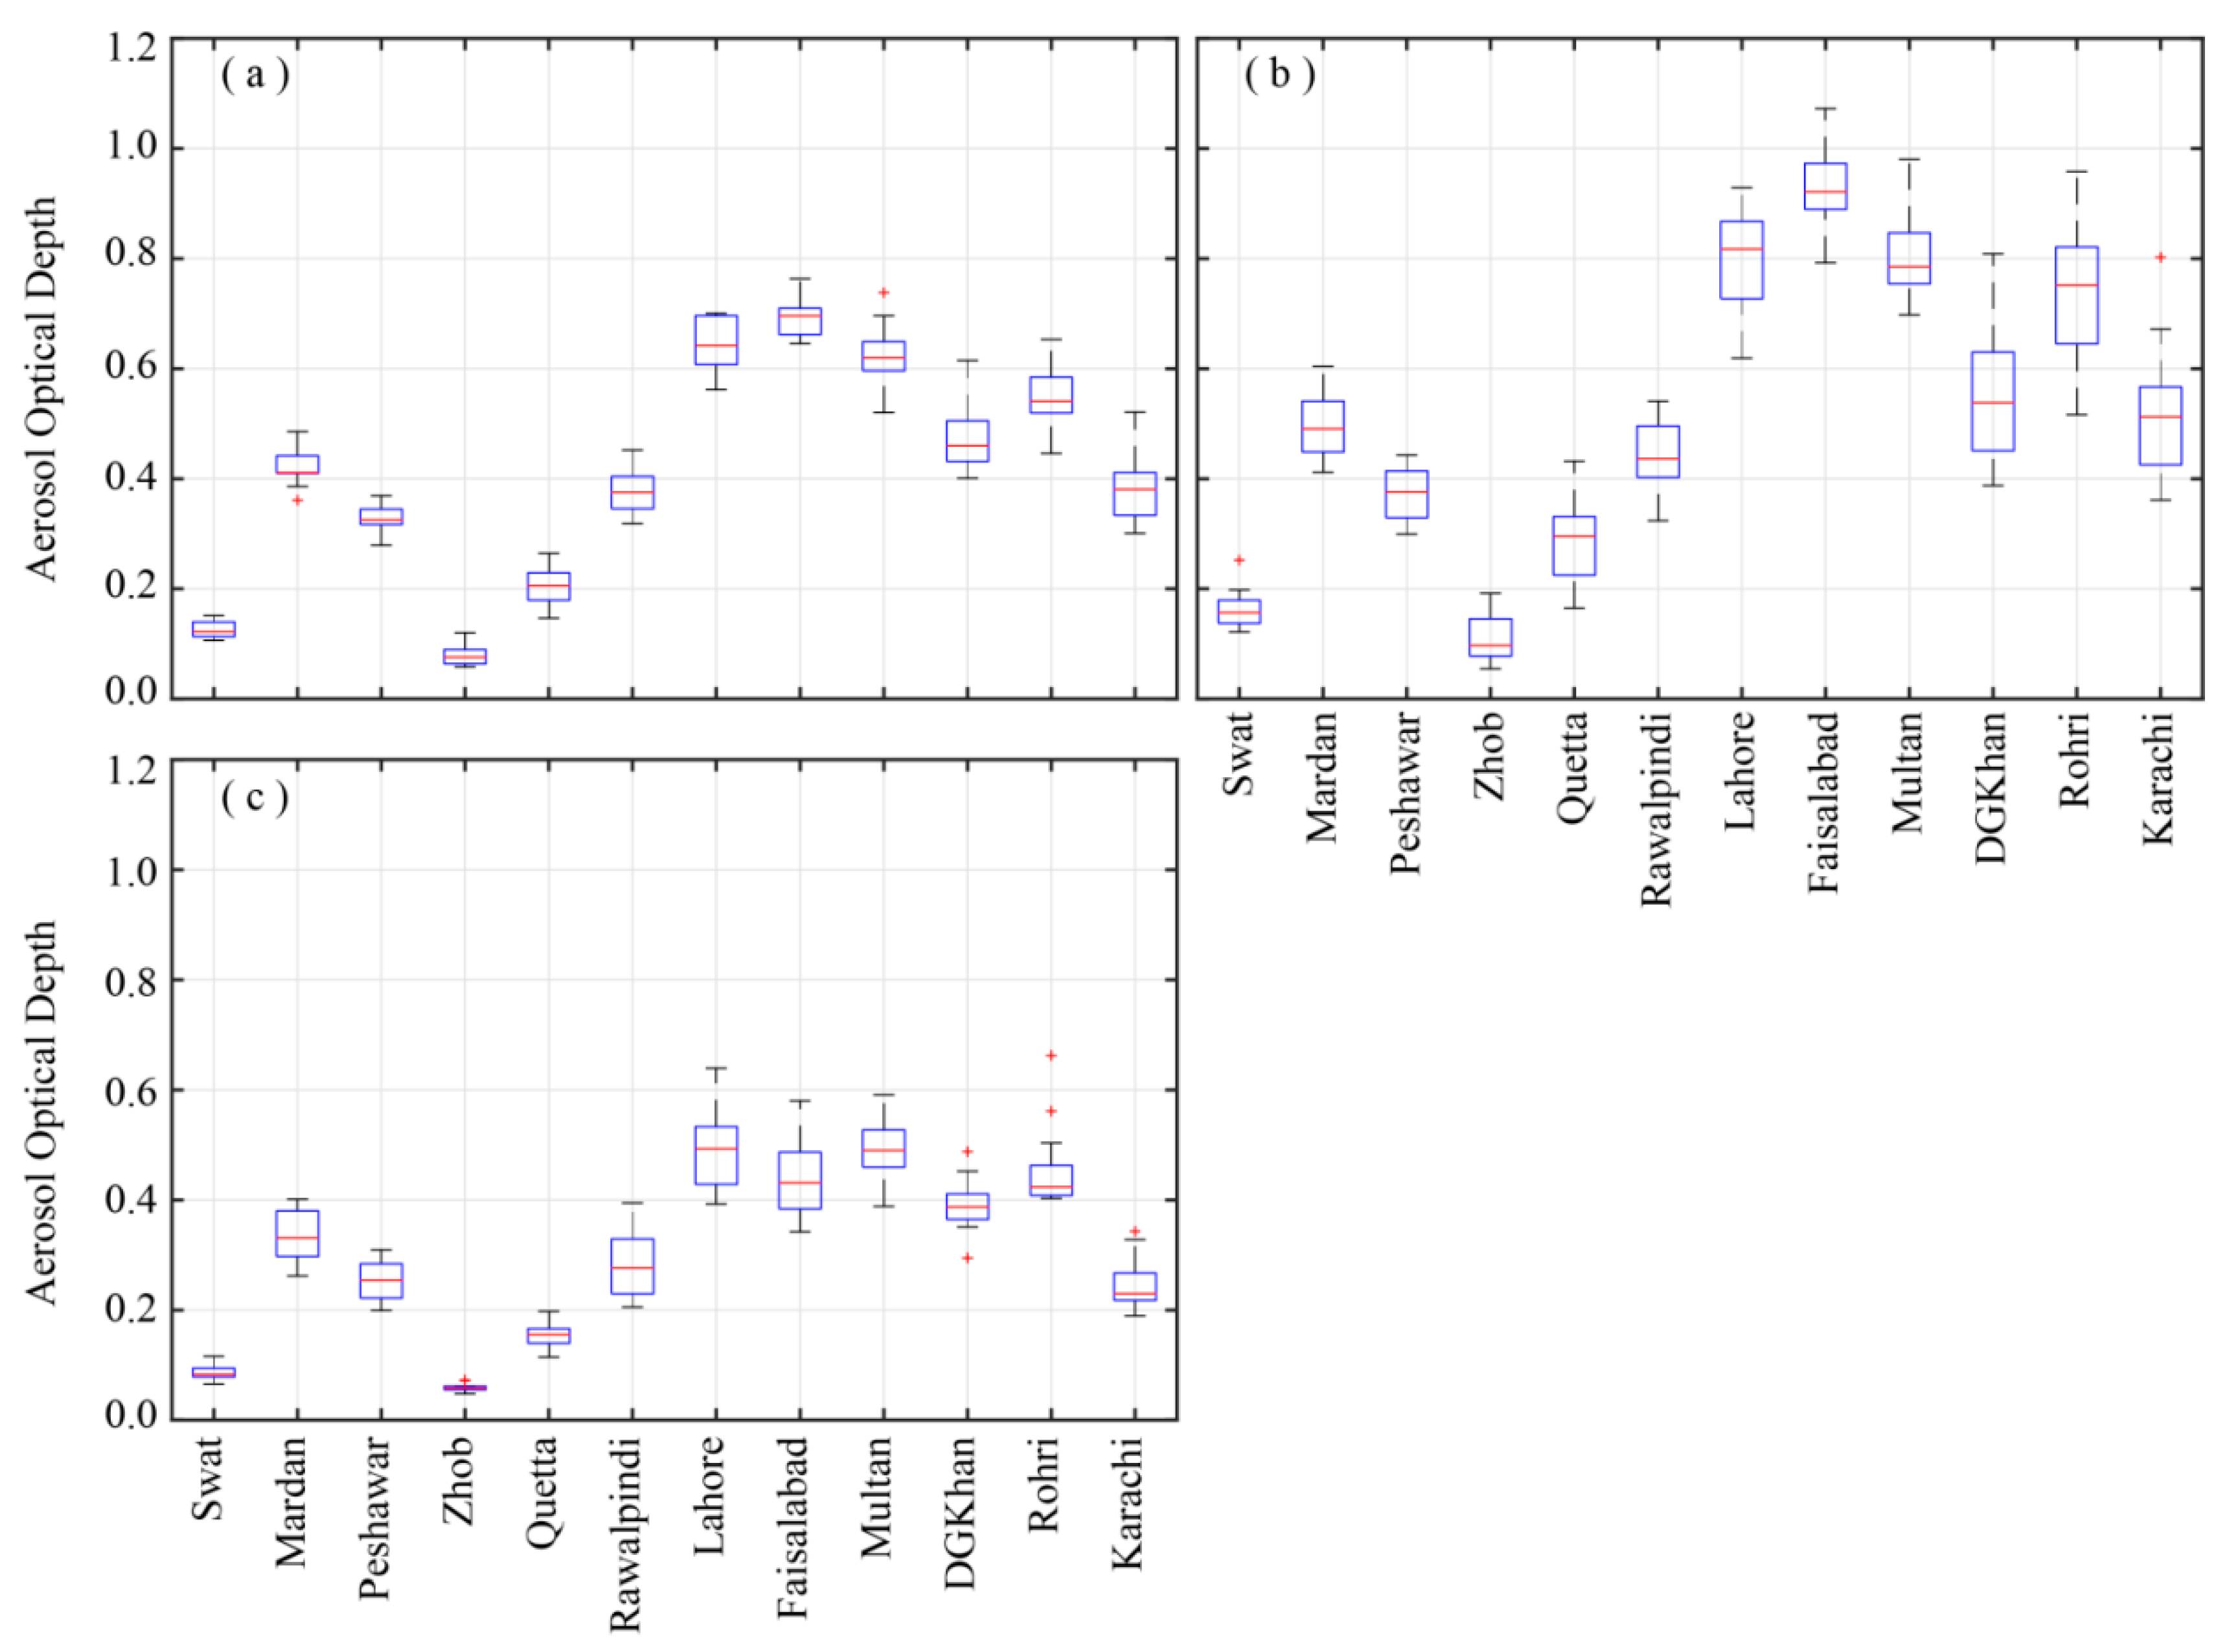
The multiyear (2003–2017) monthly/seasonal mean of AOD retrieved over the selected regions are depicted in Figure 4a–c. The annual and seasonal mean patterns are in line with the monthly climatology. The regions experiencing maximum aerosol concentration are located in the central plains (Zone 2) of the study area. The maximum annual mean AOD (along with standard deviation from the mean) is reported at Faisalabad (0.69 ± 0.26) followed by Lahore (0.64 ± 0.22), Multan (0.63 ± 0.23), and Rohri (0.55 ± 0.22). The AOD values reported in this study are relatively higher than those reported by Kumar et al. [24], but lower than those reported by Alam et al. [26] over the selected stations in IGP, including Pakistan. Such discrepancy may be attributed to shorter study period previously used, as well as the difference in MODIS collections used. The lower annual mean AOD retrievals at Swat (0.13 ± 0.07), as compared to the one reported by Alam et al. [59], may also be attributed to reduced uncertainties associated with newer AOD collection. A positive correlation between AOD and atmospheric water vapor was reported by Alam et al. [27] with relatively higher values at higher latitudes in Pakistan. Syed et al. [99] associated the increasing fog events to the increasing trend in RH from 1990 onward over the South Asian region. The reduced air temperature during the winter season enhances the likelihood of hygroscopic growth of ambient aerosols, as the temperature can reach the dew point level more frequently. Likewise, higher relative humidity during the summer season may cause significant hygroscopic growth of atmospheric aerosols. The hysteresis behavior of the aqueous droplets during evaporation may cause them to persist for a longer time period in metastable state [100]. This could be the reason behind the higher AOD values during summer as well as the persistent haze/fog events during the winter season.
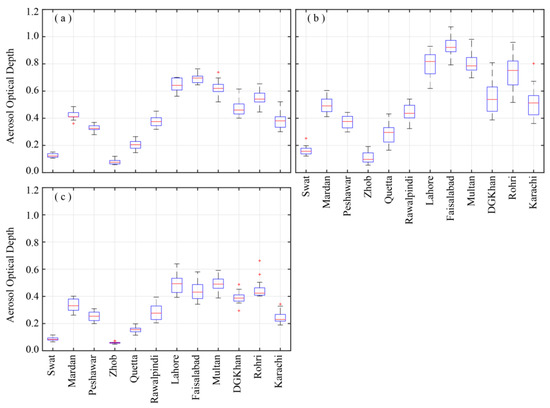
Figure 4.
Variation of aerosol optical depth over selected regions during 2003–2017, (a) Annual, (b) Summer, (c) Winter, based on AOD data acquired from MODIS-Terra DB product. The central red line corresponds to the median and the box lower and upper edges represent the first and third quartiles respectively. The red signs, whether above or below of some of the whiskers represent the outliers which have a value more than 1.5 times the interquartile range.
The atmospheric boundary layer (ABL) height plays an important role in the columnar aerosol concentration. The ABL height is maximum during summer and minimum during winter seasons. A deeper boundary layer is developed as a result of strong convection during summer season, thus facilitating the inclusion of more natural and anthropogenic aerosols in the atmospheric column. Further, it is also worth mentioning that the summer season is mostly characterized by high wind speeds and frequent dust storms which support the emission of dust aerosols into the atmosphere [101]. Additionally, the advection of aerosols from source to receptor may increase the regional aerosol burden [102], thus providing more aerosols for vertical uplift. The shallow ABL during winter season causes to confine the aerosols in a smaller volume [17,103,104]. Therefore, the ABL controls the vertical mixing of aerosols in the atmosphere and hence the AOD values vary during different seasons, provided the relative humidity, temperature, and other meteorological factors support the growth of aerosols as well as production of secondary particles. The relative humidity remains high in summer especially during the monsoon months which enhances the hygroscopic growth of water soluble aerosols [104,105]. Thus, a deeper boundary layer accompanied by strong convection and hygroscopic growth of aerosols result in higher AODs during the summer months. Due to low elevation angles of the sun in the sky during winter season, the outgoing long wave radiations from the earth’s surface exceed the incoming shortwave radiations received from the sun. This results in the development of inversion layer which opposes the vertical mixing of aerosols, confining aerosols near the earth’s surface during winter [106,107]. In addition, the winter season is characterized by low relative humidity and anthropogenic aerosols dominate, while during summer season aerosols from natural sources (e.g., sea salt and mineral dust) are dominant [103]. Due to the maximum variability in temperature, relative humidity, atmospheric boundary layer, and aerosols between summer and winter seasons, the trend analysis in AOD is only restricted to these two dominant seasons as well as annual scales over the study area. Thus, the mean AOD corresponding to June, July, August, and September (summer), December, January, and February (winter), and January to December (annual) were considered for trend estimates in AOD over the selected regions. The AOD over the selected regions during the two seasons (summer and winter) shows marked variation with summer season mostly dominated by higher AOD values as compared to winter season (Figure 4, Table 1).
4.2. Trends in Aerosol Optical Depths
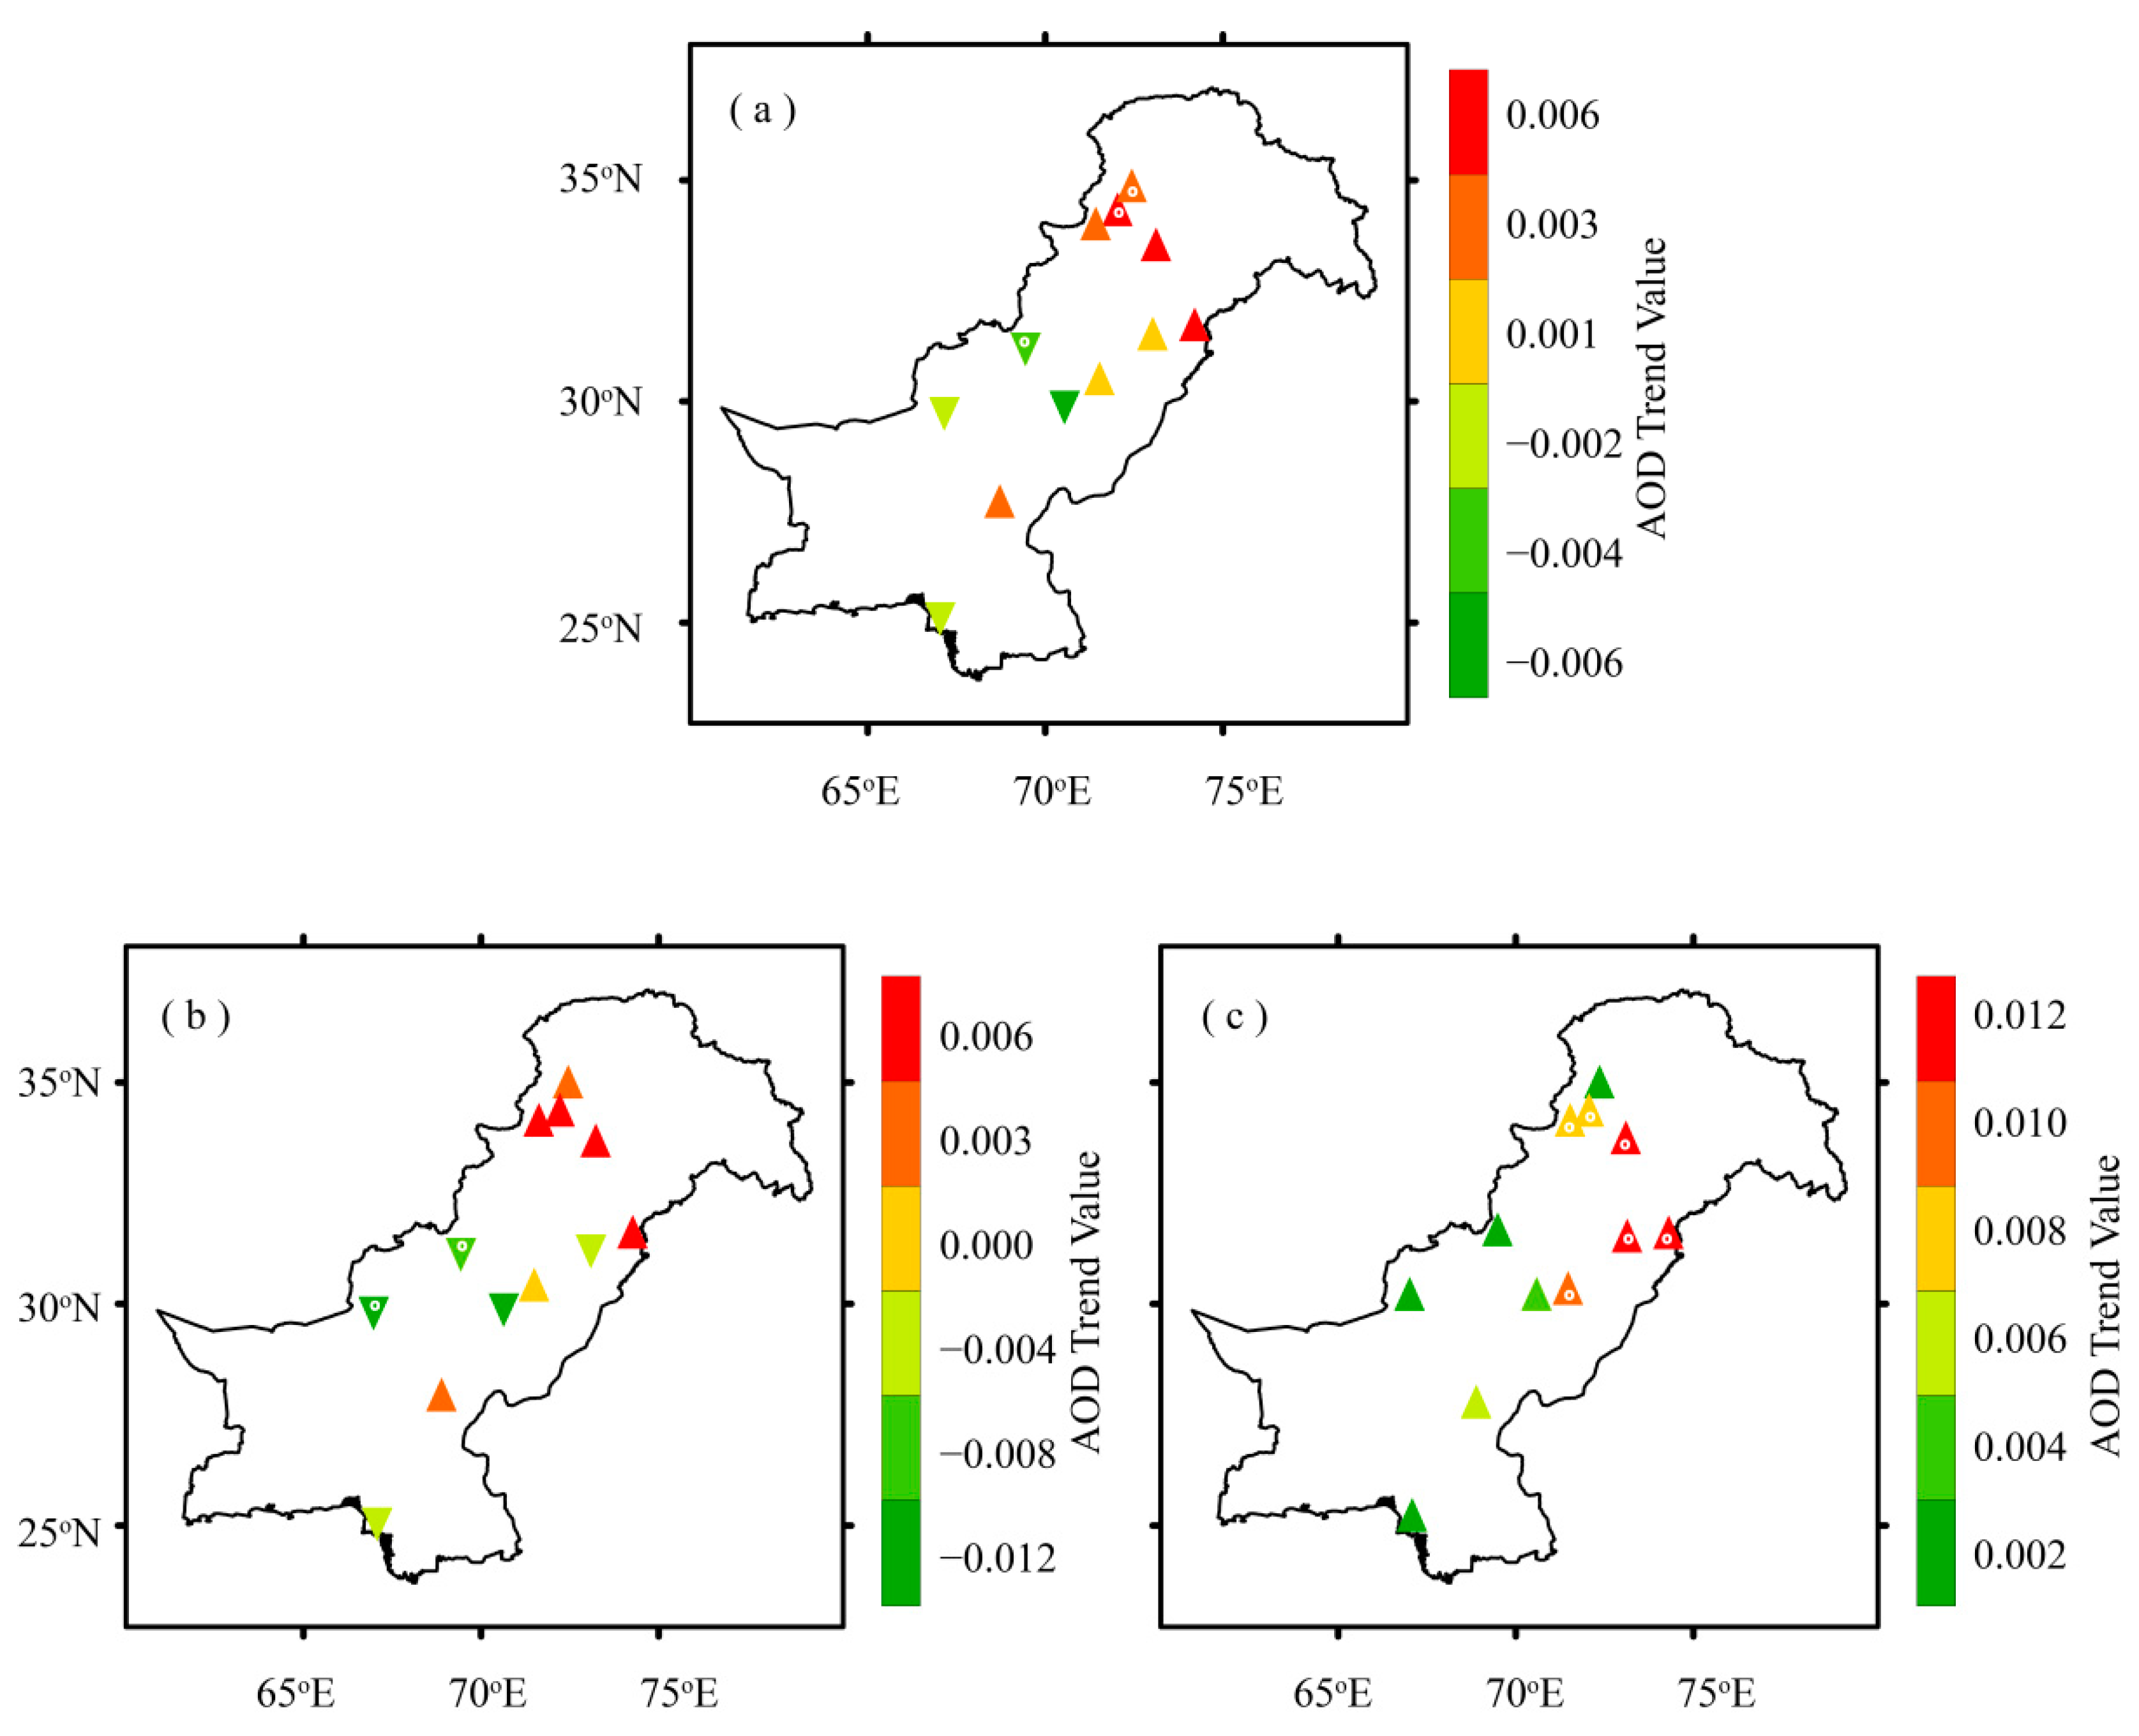
Figure 5 shows the results of the m-MK test, whereas Table 2 summarizes the magnitudes of trends or Sen’s slopes (annual and seasonal) for each region. Annually, increasing trends dominate over the regions located towards the north and northeast of the study domain (Zones 1 and 2), being significant (at 95% confidence level) over two of them. In contrast, decreasing AOD trends characterize the regions located towards the south and southwestern part of the study domain. Seven regions out of the total under consideration experience increasing AOD trends annually. The statistically significant increasing AOD trend (in units/year) is experienced by Mardan (+0.0034) and Swat (+0.0019). On the other hand, DG-Khan (–0.0061), Zhob (–0.0031), Quetta (−0.0025), Karachi (–0.0013) and Multan (–0.0003) experience decreasing AOD trend with only Zhob being statistically significant at 95% confidence level.
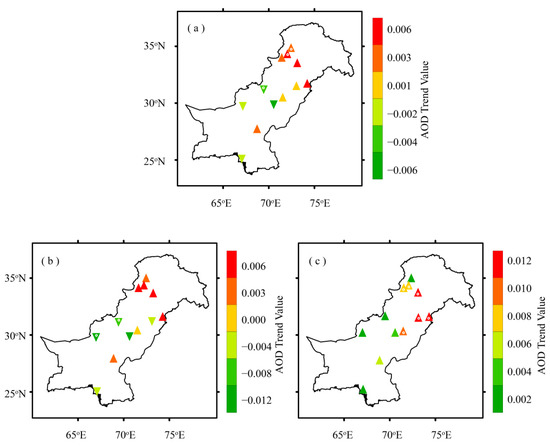
Figure 5.
Distribution of annual and seasonal means AOD trends (in units/year) over the study area during 2003–2017, (a) Annual, (b) Summer, (c) Winter, based on AOD data acquired from MODIS-Terra DB product. The points with central white dots represent statistically significant AOD trends over the selected regions. Magnitudes of trends are listed in Table 2.

Table 2.
Magnitude of seasonal and annual AOD trends (per year) for selected regions during (2003–2017); based on AOD data acquired from MODIS-Terra DB product, * represents statistically significant trends over the selected regions.
The seasonal AOD trends are consistent with the annual AOD trends, with magnitudes of positive trends being slightly higher during winter than summer over most of the regions. During the summer season, six out of twelve regions experience an increasing AOD trend but none of them is statistically significant. The remaining six regions experience decreasing AOD trends. The two high altitude regions located towards the western side of the study domain (Zone 3), namely Quetta (–0.0091) and Zhob (–0.0066) experience statistically significant decreasing AOD trends for summer. More interestingly, during winter season eleven of the selected regions experience increasing AOD trends being statistically significant over six locations, mostly located towards the north and northeastern part of the study area (Zones 1 and 2), except Zhob which showed a trend around zero.
Mehta et al. [98] have reported significantly increasing AOD trends during winter season (DJF) over Indian sub-continent including Pakistan, which is consistent with our findings. They attributed the increase in AOD trends mainly to anthropogenic factors over this region. The possible reasons responsible for increase (or decrease) in AOD trends may include changes in anthropogenic aerosol source strengths and/or some of the natural factors affecting atmospheric aerosols amount. Alam et al. [61] have attributed the increase in AOD to anthropogenic activities like urbanization, industrialization, and change in land use. Regional practices of biomass burning coupled with emission from residential biofuel as well as industrial emissions are directly linked to rapid urbanization and industrial development, and these are the largest sources of atmospheric aerosol concentrations. Analyzing aerosol loading over the Indian state of Punjab, the nearest neighbor to our study area, Sharma et al. [108] have attributed the increase in AOD to agricultural crop residue burning during post-monsoon season. Apart from the anthropogenic aerosol sources, the natural activities related to atmospheric dynamics may also act as precursors for aerosol generation/growth, and consequently increasing AOD concentration over an area. The high (low) concentration of water vapor in the atmosphere as well as high (low) temperature may be the cause of higher (lower) AOD levels [109,110]. Higher relative humidity aided by high temperature may intensify the hygroscopic growth of aerosols and gas-to-particle conversion process, producing more secondary aerosols and resulting in higher AOD [111,112,113,114]. Transportation of aerosols from source to receptor region is dependent on wind speed. Studies by Luo et al. [102] and Boiyo et al. [115] have connected a decline in wind speed to the transport of aerosols leading to increasing (decreasing) AOD trends over the source (receptor) regions. Moreover, variability in rainfall, dust storms and other related atmospheric phenomena may also affect the long term AOD trends. Though, the aerosol types, their production and removal mechanisms may alter their relationship with prevailing meteorological conditions [103]. The possible links between the observed AOD trends and some of the meteorological parameters in the study area are discussed in Section 4.5.
Based on the findings from the present work as well as other related studies, the main factors that could affect AOD trends over any atmospheric environment can be summarized into four distinct categories: 1) changes in emission of primary aerosols, both natural and anthropogenic, 2) changes in emissions of aerosol precursors or their transformation into secondary aerosols, 3) atmospheric transport of aerosols or their precursors from main source regions to regions having weaker sources, and 4) the removal of aerosols from the atmosphere (main precipitation scavenging).
4.3. AOD Trends in Comparison to AERONET Data
Table 3 summarizes the annual and seasonal mean AOD results acquired from both MODIS as well as AERONET data for the two stations (Lahore and Karachi) during the stipulated time period mentioned next to their names. Magnitudes of the AOD trends are also listed. The AOD values from both MODIS and AERONET over Lahore seem in reasonable agreement on annual scale as well as during summer season. However, over Karachi the MODIS retrievals exhibit slight underestimation as compared to AERONET data, being consistent with findings by Sayer et al. [66] and Ali et al. [47]. Contrasting results during winter season at Lahore may be due to selecting a shorter time period as well as utilizing the AERONET level 1.5 data for comparison.

Table 3.
Multiyear annual and seasonal mean AOD with standard deviation (SD); Seasonal and annual AOD trends (per year) for the two stations; based on MODIS-Terra DB as well as AERONET AOD data products.
The trend magnitudes (or Sen’s slopes) based on MODIS and AERONET AOD data exhibit statistically non-significant increasing behavior over both the regions with reasonable agreement between the two data sets on annual as well as seasonal scales except during winter season over Lahore. This region experiences a high AOD trend during winter season based on AERONET data (0.0157 per year) as compared to the corresponding value (0.0065 per year) based on MODIS data (Table 3). This potential discrepancy could possibly be attributed to the DB algorithm’s inherited characteristics of underestimating the AOD over the region [47,66]. The comparatively shorter duration and reduced vegetation cover during winter season along with using the comparatively low quality AERONET level 1.5 data may be the other possible reasons for this observed discrepancy between the AOD trend results from the two sources.
4.4. Mutation of Annual and Seasonal Mean AOD over Selected Regions
The transition of the climate from one stable state to another when some external forces compel the system to cross a certain threshold level is termed as an abrupt shift in the climate system. The SqMK test was used to detect the abrupt changes in temporal trends of seasonal and annual AOD time series [92,97]. This test also shows fluctuation in the trend over time. The SqMK test was used to detect abrupt changes in AOD trend on annual and seasonal bases over the selected locations. The statistics UF represent the trend variability in forward direction whereas UB represent the trend in the backward direction with zero mean and unit standard deviation. The sequential behavior fluctuates around the zero level. If they intersect each other and diverge beyond a specific threshold value (e.g., ±1.96 for 95% confidence level in our case), then there is a statistically significant change point. The point where they cross each other indicates the possible turning year of the trend within a time series [92,93].
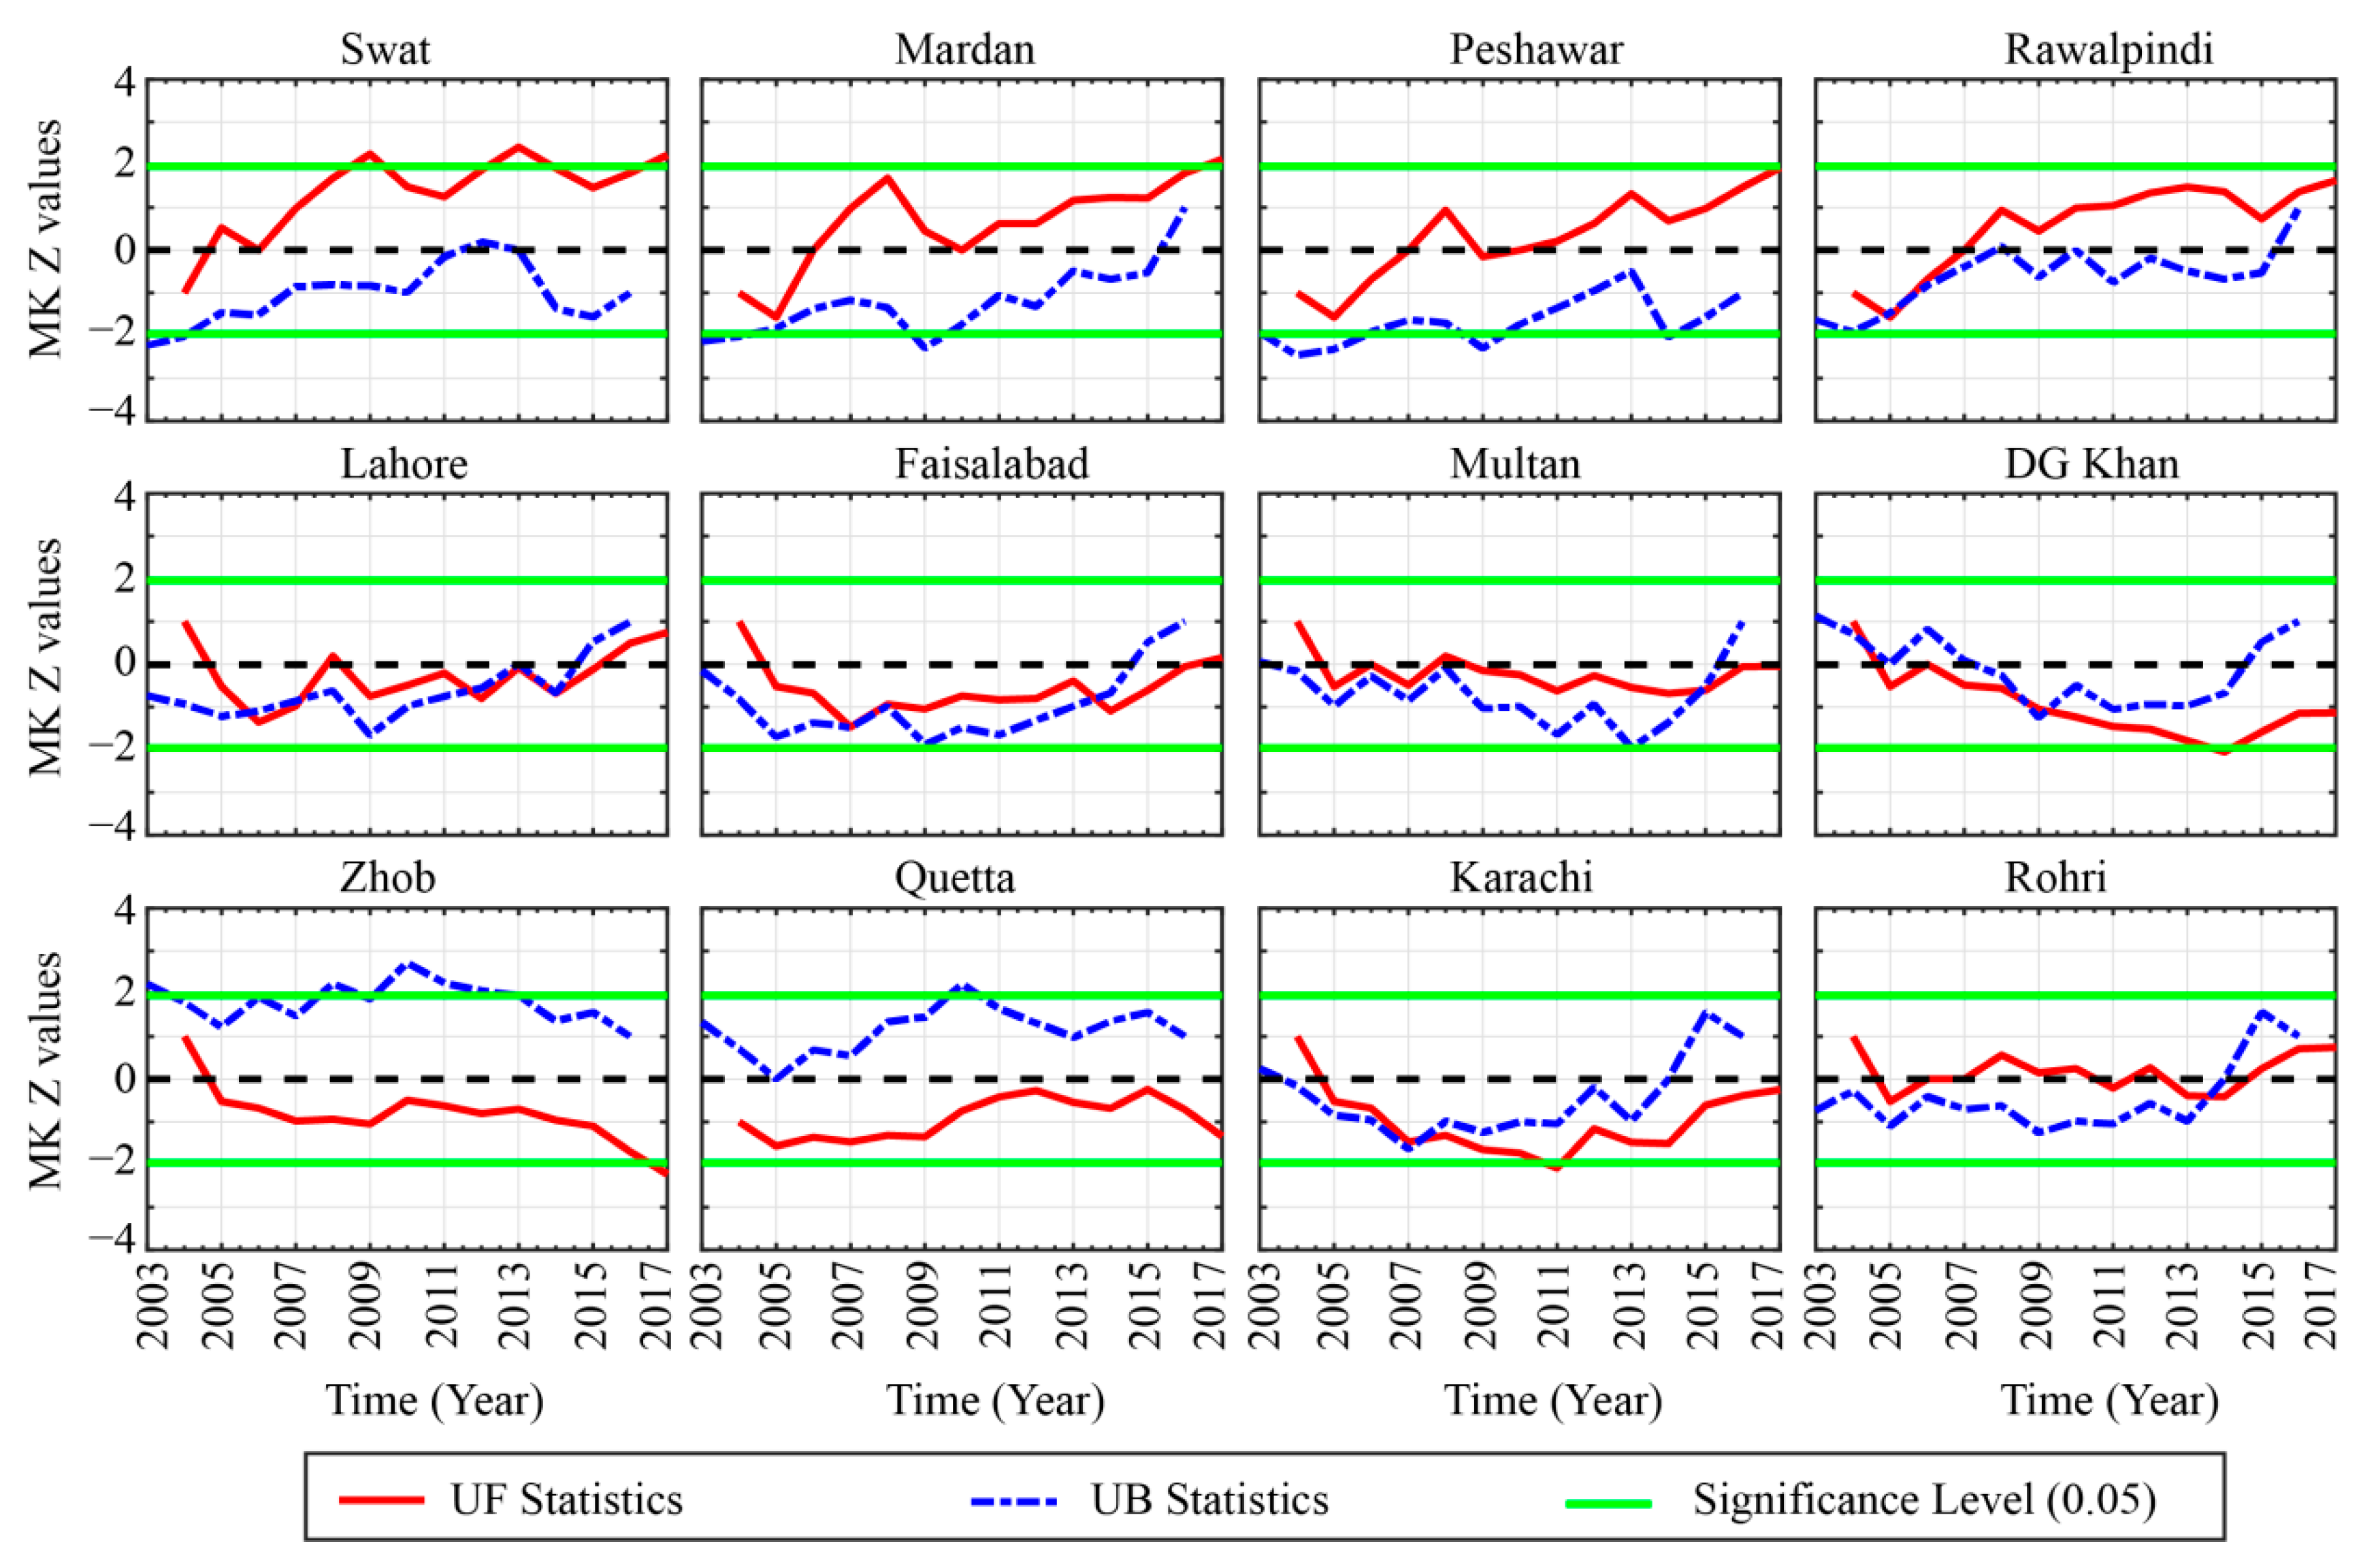
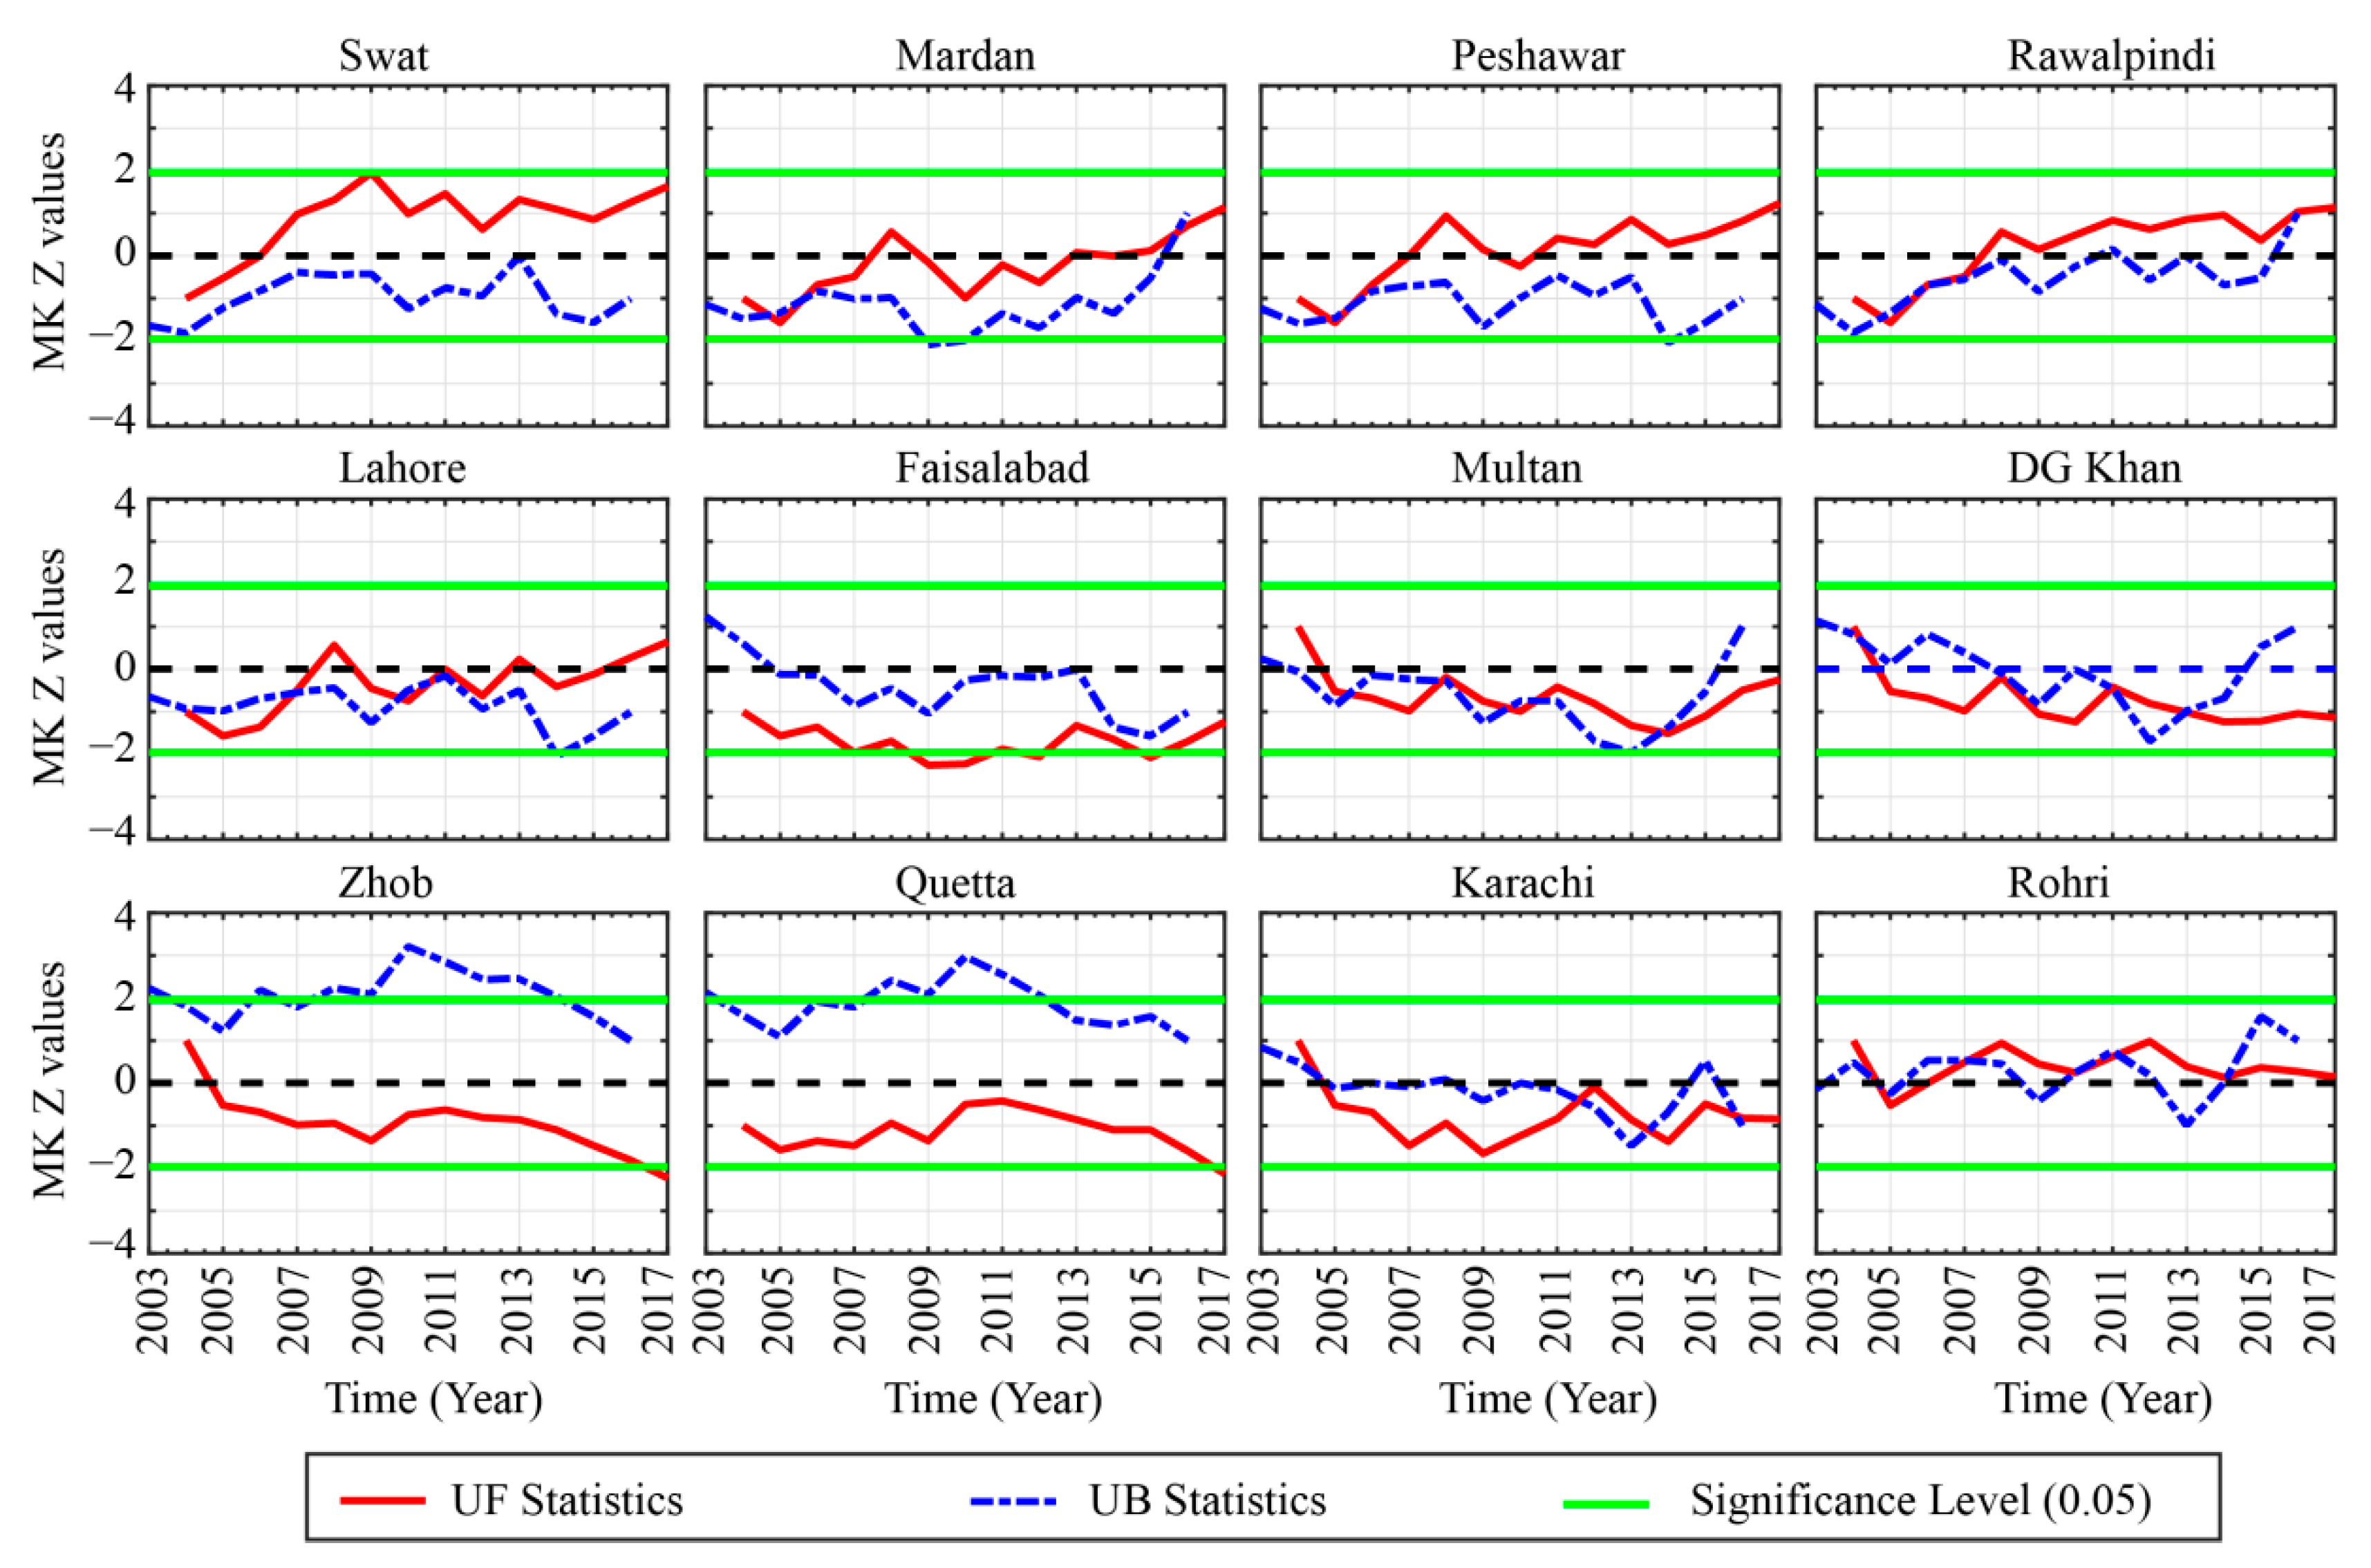
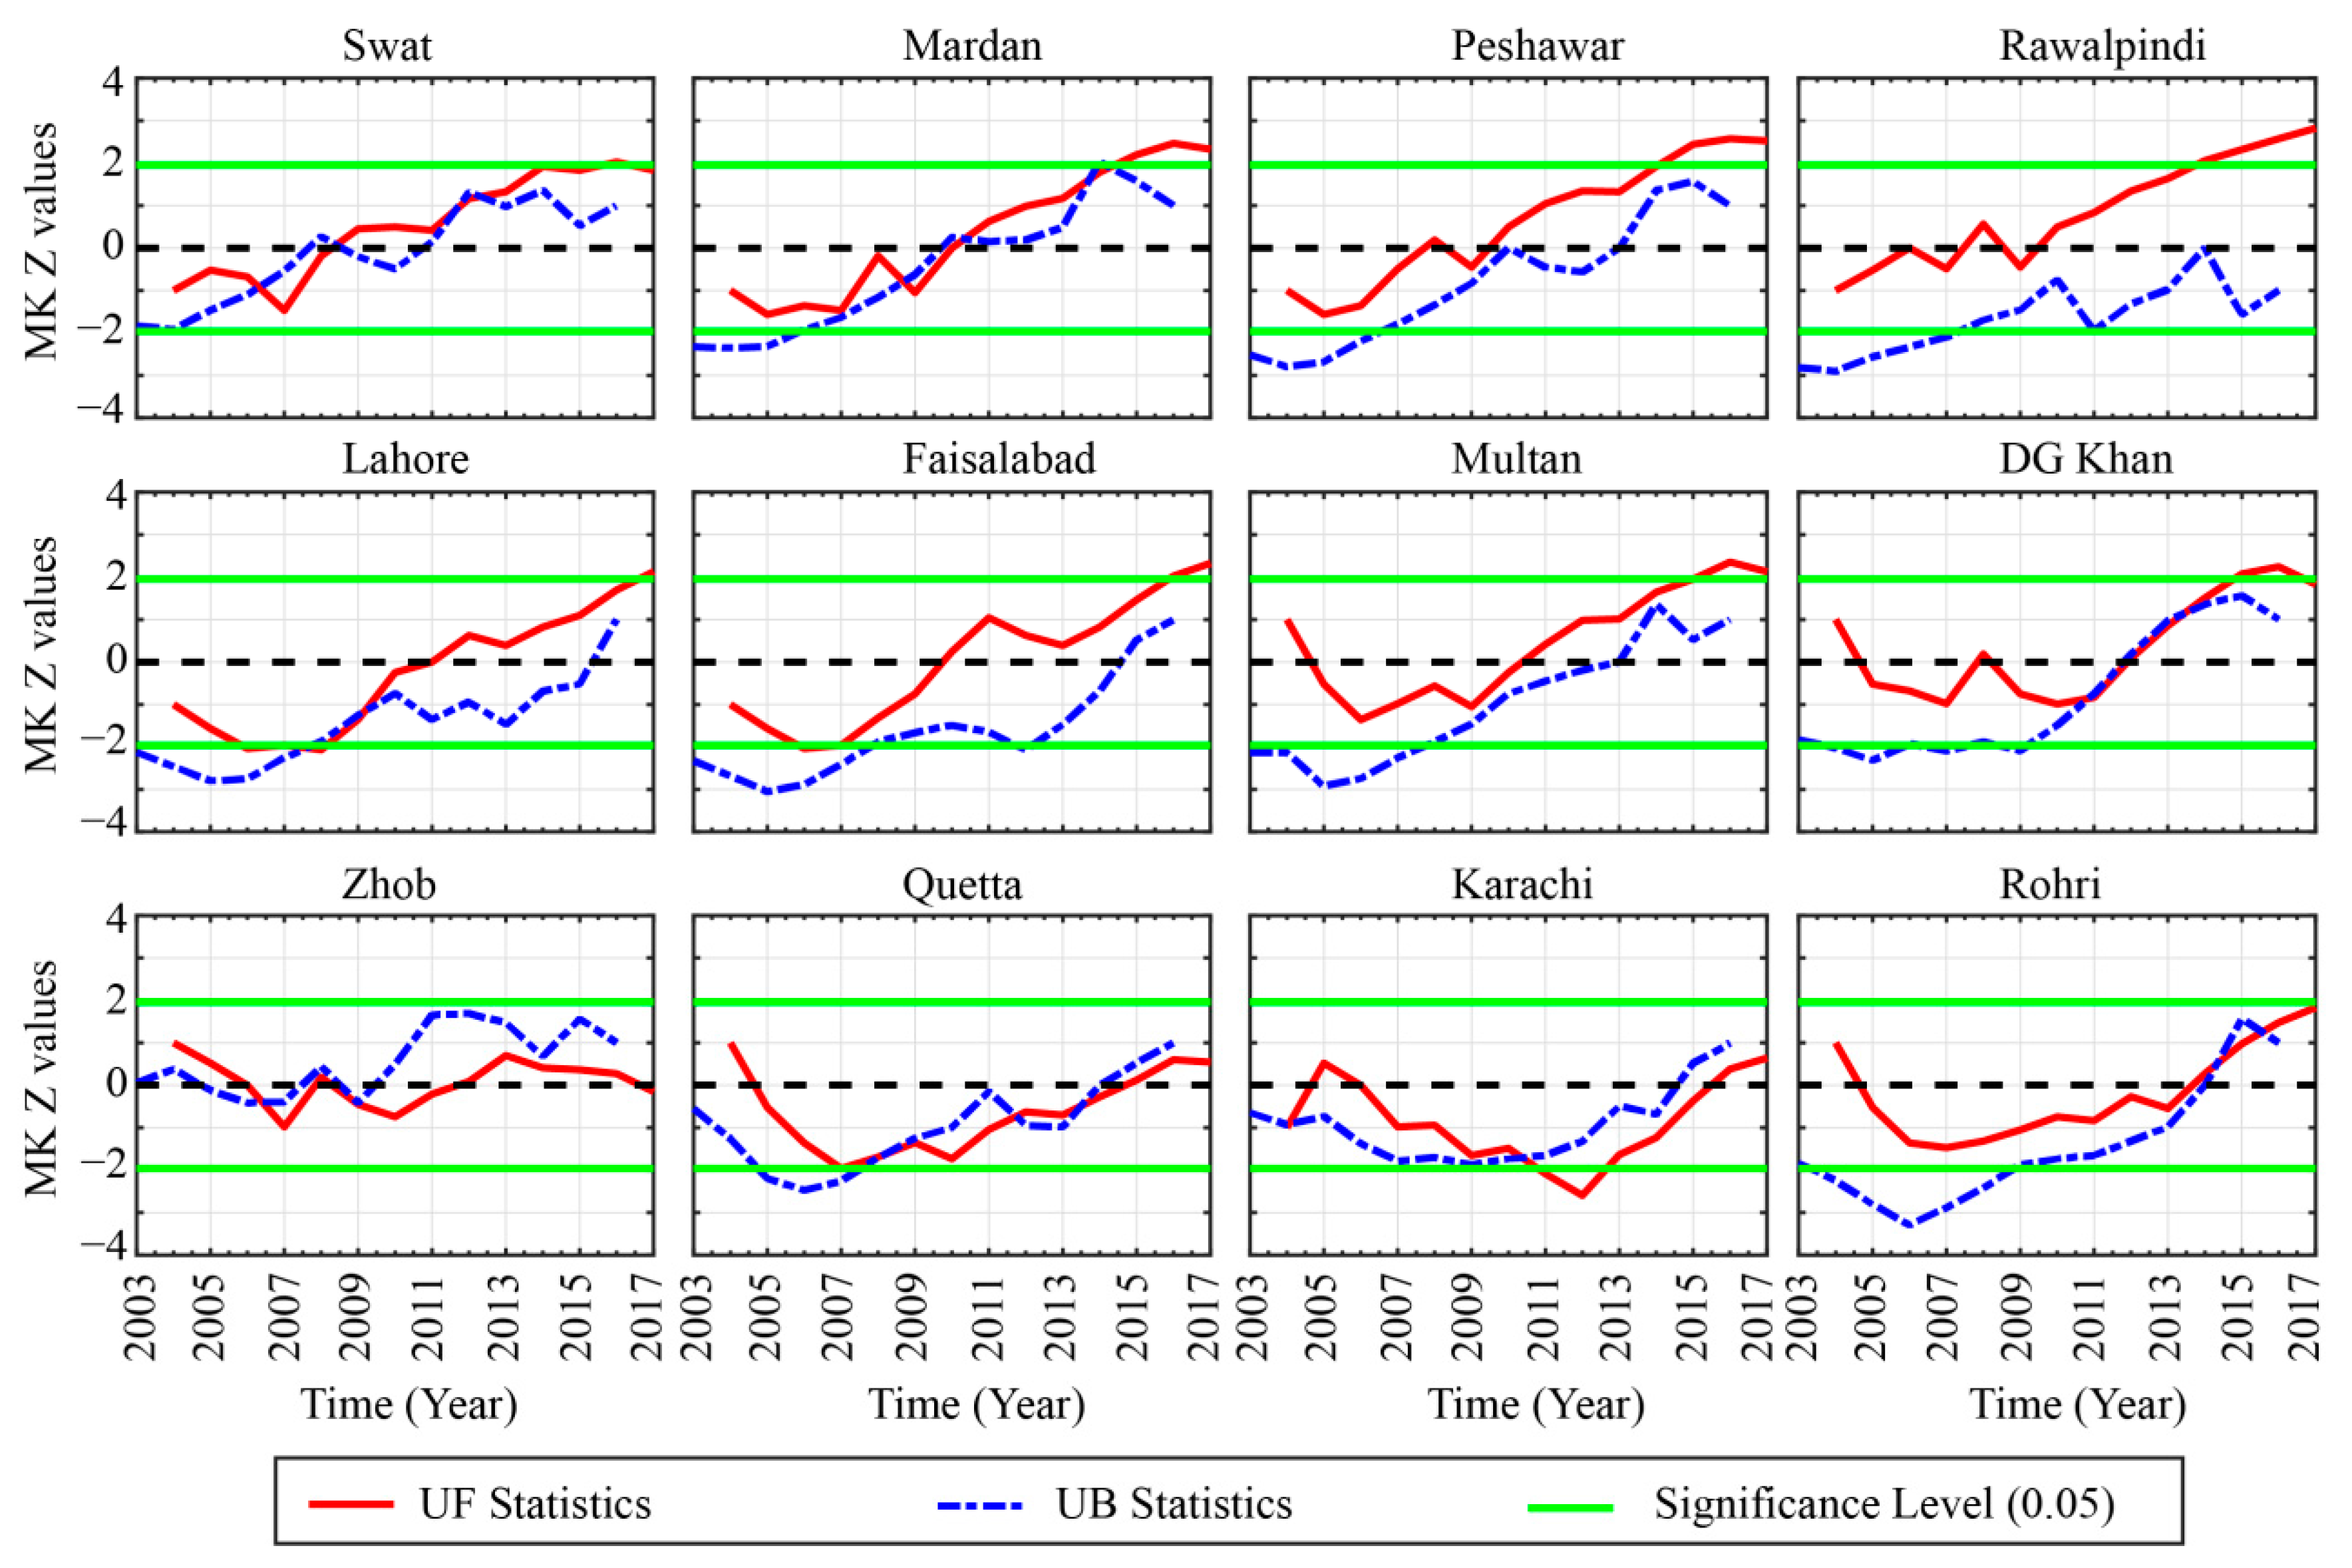
Figure 6, Figure 7 and Figure 8 show the results of the SqMK test for abrupt changes in mean annual, summer, and winter AOD trends, respectively, over different regions.
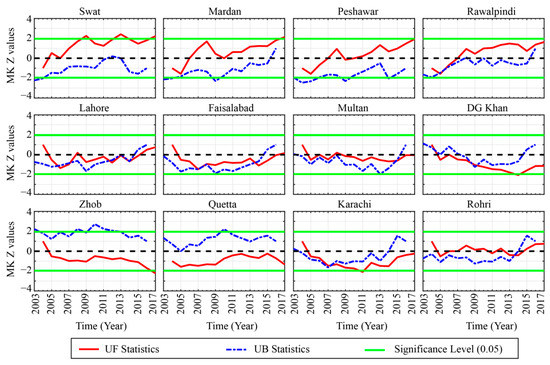
Figure 6.
Abrupt changes of annual mean aerosol optical depths during 2003–2017 over the selected locations.
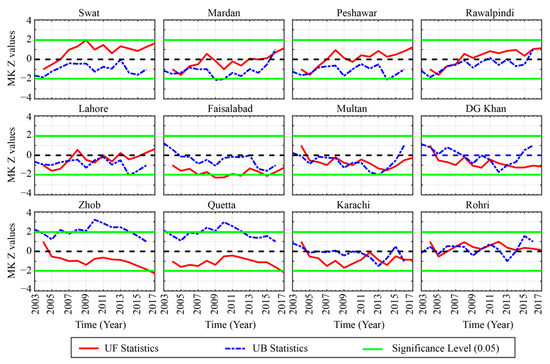
Figure 7.
Abrupt changes of summer mean aerosol optical depths during 2003–2017 over the selected locations.
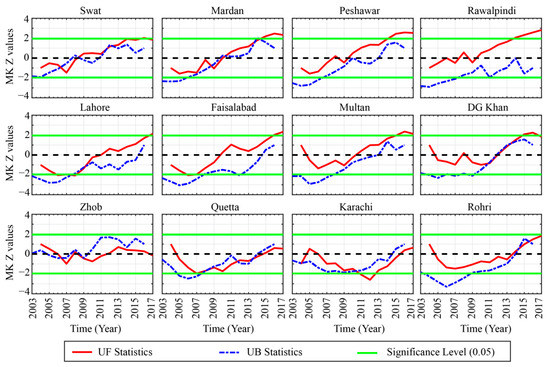
Figure 8.
Abrupt changes of winter mean aerosol optical depths during 2003–2017 over the selected locations.
At the annual scale (Figure 6), the AOD variability at the 12 selected regions can be classified into three different patterns. At first, in northern relatively higher altitude regions located in Zone 1 (Figure 1), an obvious increase in the AOD is prominent. During the early years of 2003 to 2007 the overall AOD trend in these four locations was negative, which however have shown an exponential increase in the later years till 2017. In the central regions (Zone 2), a concave-shaped pattern in AOD variability is obvious during the study period. Both UF and UB exhibited similar variability over the regions in this zone. The AOD trend exhibited an initial decrease during 2003 and later on several abrupt change points are obvious for all the regions with an increase in the trend after 2013. In Zone 3, Zhob and Quetta are located at a relatively higher altitude and thus the trend appeared to be different from the regions in other zones. In Zhob and Quetta, a significant increasing trend in the AOD exists during 2009–2011, which is more prominent in Quetta than Zhob. Both of these regions experience decreasing AOD trends from 2015 onward till the end of the study period. For the two southern regions in Zone 4 (Karachi, and Rohri), the AOD variability exhibited a similar trend as observed for the regions in Zone 2 with an obvious increase in the later years.
During the summer season (Figure 7), an obvious increase in AOD trend is seen over the regions in Zone 1. It is interesting to notice that Swat is relatively smaller and has less population than the rest of the regions in the north of Pakistan, yet the trend in AOD is much more obvious and significant. Possible reason could be the rapid urbanization, local infrastructure development, and changes in local hydrometeorological cycle [49,97,116]. In Zone 2, a similar pattern as observed for annual AOD is seen except for the recent years where a slight increase in AOD trend over Lahore and Multan is obvious. For the regions in Zones 3 and 4, the AOD exhibits an obvious decreasing trend over all of the locations, however over Karachi and Rohri (Zone 4) the trends have shown some shifts, but they are rather instantaneous. During the winter season (Figure 8), the AOD values have shown a significant increase after 2013 over the regions in Zone 1. The overall trend is following an abrupt increase since 2007 exponentially in all the regions however the trend is significant after 2013. For the regions in Zone 2, alike pattern with a more abrupt and exponential increase in the AOD is obvious over all the locations. Contrary to the regions in Zone 1 and 2, all the locations in Zone 3 and Zone 4 have different patterns, even though the increase in AOD was present. But for Zhob, the trend and pace of variability vary from those observed in the other parts. In conclusion, the AOD variability at interannual scale can be classified into three different regions on different time scale. The temporal coverage of the AOD data is not enough to better estimate the trend with more confidence. Yet, this relatively short-term analysis can be considered enough for understanding the overview of AOD variability. The AOD appeared to be increasing at the same pace at annual and monsoonal (summer season) scale especially over Zone 1 which is mostly arid to humid with summer monsoon precipitation the main driver of the regional hydrological cycle. Changes in precipitation, land-cover, biomass burning and extended period of elevated temperature [86,87,97,117,118,119] can be the leading drivers of the increase in AOD during summer season in this part. In central part (Zone 2), the variability during annual and summer season is rather more instantaneous and thus can be attributed to later/earlier, excess/deficit precipitation. Further, the role of anthropogenic aerosols over this region is more prominent due to dense population and enhanced vehicular and industrial emissions. During winter season, the overall increase in AOD over the study region could be associated with a decrease in precipitation originating from westerly synoptic weather systems, increased biomass and coal burning, and an increase in temperature.
Summarizing, it is evident that, based on the annual and summer mean AOD data, regions located in Zone 1 experience increasing AOD trends, while those located in Zone 2 and 4 exhibit fluctuating type of behavior with more rapid and complex shifts in AOD trends. The high-altitude regions in Zone 3 experience decreasing trends with minor periodic fluctuations. During the winter season the increasing trends are very distinct as most of the regions experience increasing AOD trends, with a steep upward shift after 2008. The regions in Zone 4, as well as Quetta (in Zone 3), experience significant abrupt changes in AOD trends with overall increasing behavior towards the end of the study period.
4.5. Association between Trends in AOD and Meteorological Parameters
Contrasting evidences are found from the literature regarding the relation between aerosol abundance and rainfall quantity. Jin et al. [120] have reported that there was no clear relationship between monthly mean aerosols and rainfall measurements. Comparing the trends between AOD and rainfall over different locations in India, Ramachandran et al. [103] have reported the non-existence of a clear correlation between the two and attributed it to the differences in the spatiotemporal variations in rainfall and the presence of a variety of aerosol species. On the other hand, Ranjan et al. [110] associated lower values of winter-time AODs to cloud scavenging and heavy rainfall washout processes. Zhu et al. [121] have reported an increase in aerosol concentration over China due to weakening of the East Asian Summer Monsoon. Chowdhury et al. [122] reported that rainfall suppresses the dust emission and the soil moisture prevents the post-precipitation aerosol build up. Similarly, analyzing aerosol trends over East Africa, Makokha et al. [123] and Boiyo et al. [115] attributed the negative trends in AOD to the wet deposition process. Likewise, higher temperature and relative humidity could intensify the hygroscopic growth of atmospheric aerosols. One of the effects of higher temperatures is the increase in convection process and a deep atmospheric boundary layer resulting in higher aerosol loading [17,98,103,104]. Pandithurai et al. [124] attributed the higher AOD during afternoon hours to the higher air temperature, strong convection and strong winds.
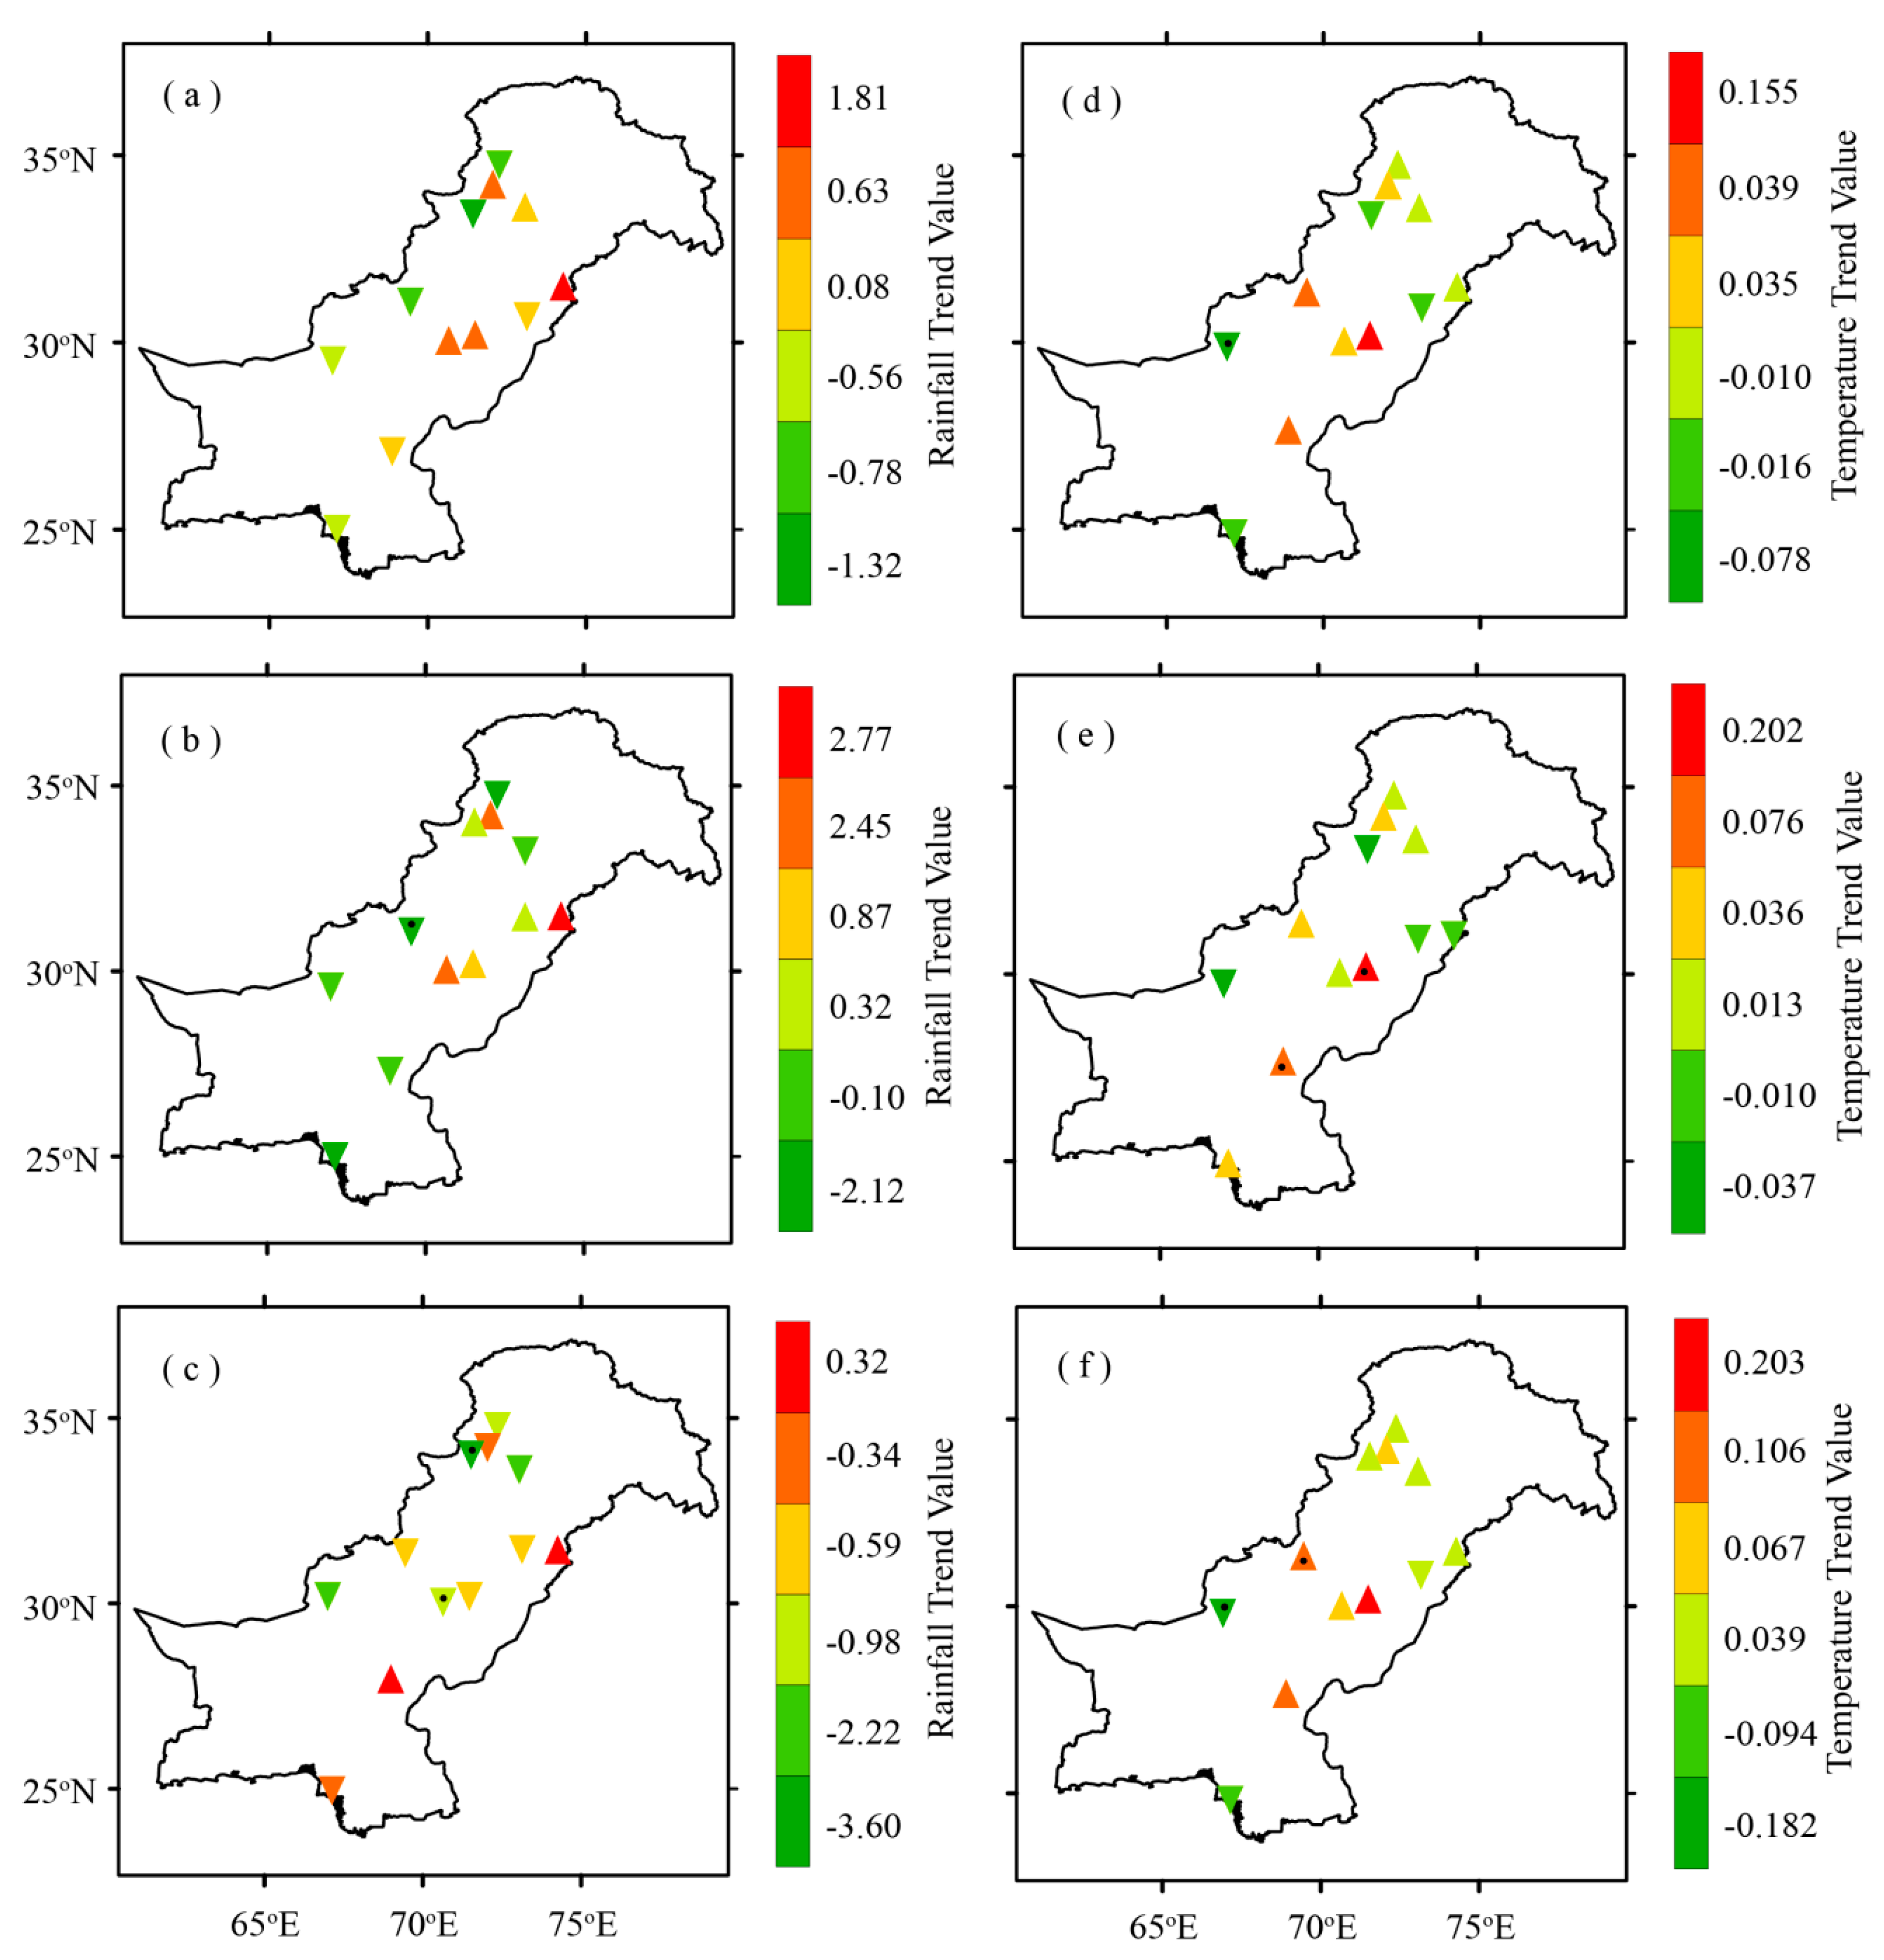
Summer and winter are the two principle rainy seasons in Pakistan and precipitation in these seasons accounts for more than ~90% of the annual precipitation budget over the country [97]. The summer season is characterized by hot weather conditions when the daytime maximum temperature reaches around 40 °C (or even higher) in the central and southern parts of the study area. Cold weather prevails over the northern highlands during winter season whereas the central to southern plains mostly remain warm. Figure 9 shows the results of the m-MK test, whereas Table 4 summarizes the annual and seasonal trends in rainfall and temperature over the selected locations during 2003 to 2017 for each region.
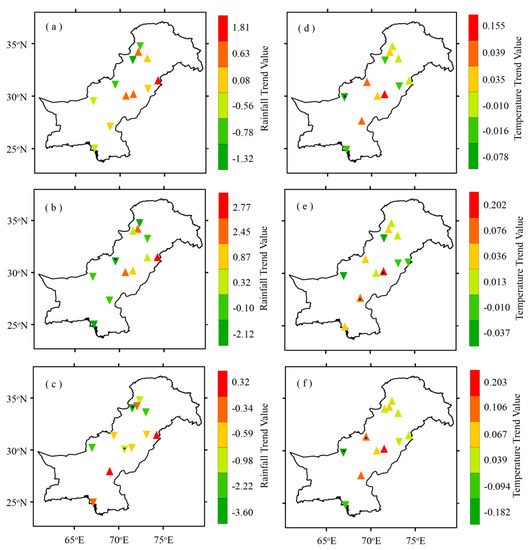
Figure 9.
Distribution of annual and seasonal means rainfall (left column) and temperature (right column) trends over the study area during 2003–2017. For rainfall; (a) Annual, (b) Summer, (c) Winter; and for temperature (d) Annual, (e) Summer, (f) Winter based on the data acquired from PMD. The points with central black dots represent statistically significant AOD trends over the selected regions. Magnitudes of trends are listed in Table 4.

Table 4.
Rainfall trends (mm/year) and temperature trends (°C/year) for selected stations during 2003–2017; * represents statistically significant trends over selected locations.
The trends in AOD and rainfall (Table 2 and Table 4) exhibit a unique pattern. The negative trends in annual mean rainfall over some regions (Table 4) coincide well with positive AOD trends (Table 2), indicating a role of rainfall in regulating aerosol burden over these regions. However, in some other regions (Table 4), the decrease (increase) in rainfall does not necessarily correspond to the increase (decrease) in AOD trends, pointing to other factors; for example, changes in emissions, atmospheric transport or secondary aerosol formation, or any combination of these, playing a role. The decreasing rainfall trends during summer season over Swat, Rawalpindi, and Rohri as well as the increasing rainfall trends over Faisalabad, Multan, and DGKhan support the dependence of AOD on rainfall. The possible reason for contrasting trend results over the remaining regions may be the higher temperatures during summer season aided by the high wind speed which enhances the soil erosion and generation of dust aerosols. The summer season is characterized by high wind speeds and frequent dust storms which support the emission of dust aerosols into the atmosphere [101]. A deep atmospheric boundary layer (ABL) and strong convection during summer seasons may be the other reasons responsible for contrasting AOD behavior. The decreasing AOD trends over the two high altitude regions Quetta and Zhob may be attributed to a decrease in natural aerosol loading, while a decreasing trend over the coastal city of Karachi in summer suggests a decrease in the amount of natural aerosols aided by the variation in atmospheric parameters (like wind, temperature, and relative humidity). Interestingly, the comparison of AOD and rainfall trends during winter season shows a close correspondence between the two during the study period. Ten regions out of the total selected experience decreasing rainfall trend (Table 4). AOD trends during the winter season are increasing over eleven out of twelve selected regions with six being statistically significant (Table 2). Thus the reduced rainfall over most of the selected regions reduces the suppression of atmospheric aerosols through rainfall washout processes, which is consistent with investigations by a number of authors (e.g., [110,115,121,122,123]). Therefore, the trends in precipitation, showing an inverse pattern to the trends in AOD could be responsible for the observed aerosol load. The annual mean temperature over eight regions exhibit increasing trends, though statistically non-significant. Five out of these eight regions (Swat, Mardan, Rawalpindi, Lahore, and Rohri) experiencing increasing AOD trends, are consistent with increasing temperature trends. Likewise, over the two regions, Quetta and Karachi, the negative trends in AOD and temperature are consistent with each other (Table 2 and Table 4). During summer season the trends in AOD and temperature support each other over six regions whereas over the remaining six they exhibit the converse. These contrasting results could be associated with an increase in anthropogenic activities. The winter season increasing temperature trends over eight regions, which could be the result of corresponding decreasing rainfall trends (Table 4), are in line with increasing AOD trends over these regions. Overall, the trends in temperature and AOD mostly showing direct patterns, consistent with investigations by a number of authors (e.g., [98,112,113,114,115,124]). Where there are contrasting trends experienced by the two, the possible reason could be the factors related to anthropogenic activities. For the high elevated regions of Zhob, the annual and summer season decreasing AOD trends are consistent with increasing temperature trends as oppose to the contrasting decreasing rainfall trends. However, the decreasing AOD trends over Quetta are not consistent with either of them, indicating that the dominating factors could be of anthropogenic nature. The annual and winter season increasing AOD trends over Lahore are consistent with increasing temperature trends as opposed to increasing rainfall trends (Table 2 and Table 4).
4.6. Association between AOD and Mid-Tropospheric Circulation
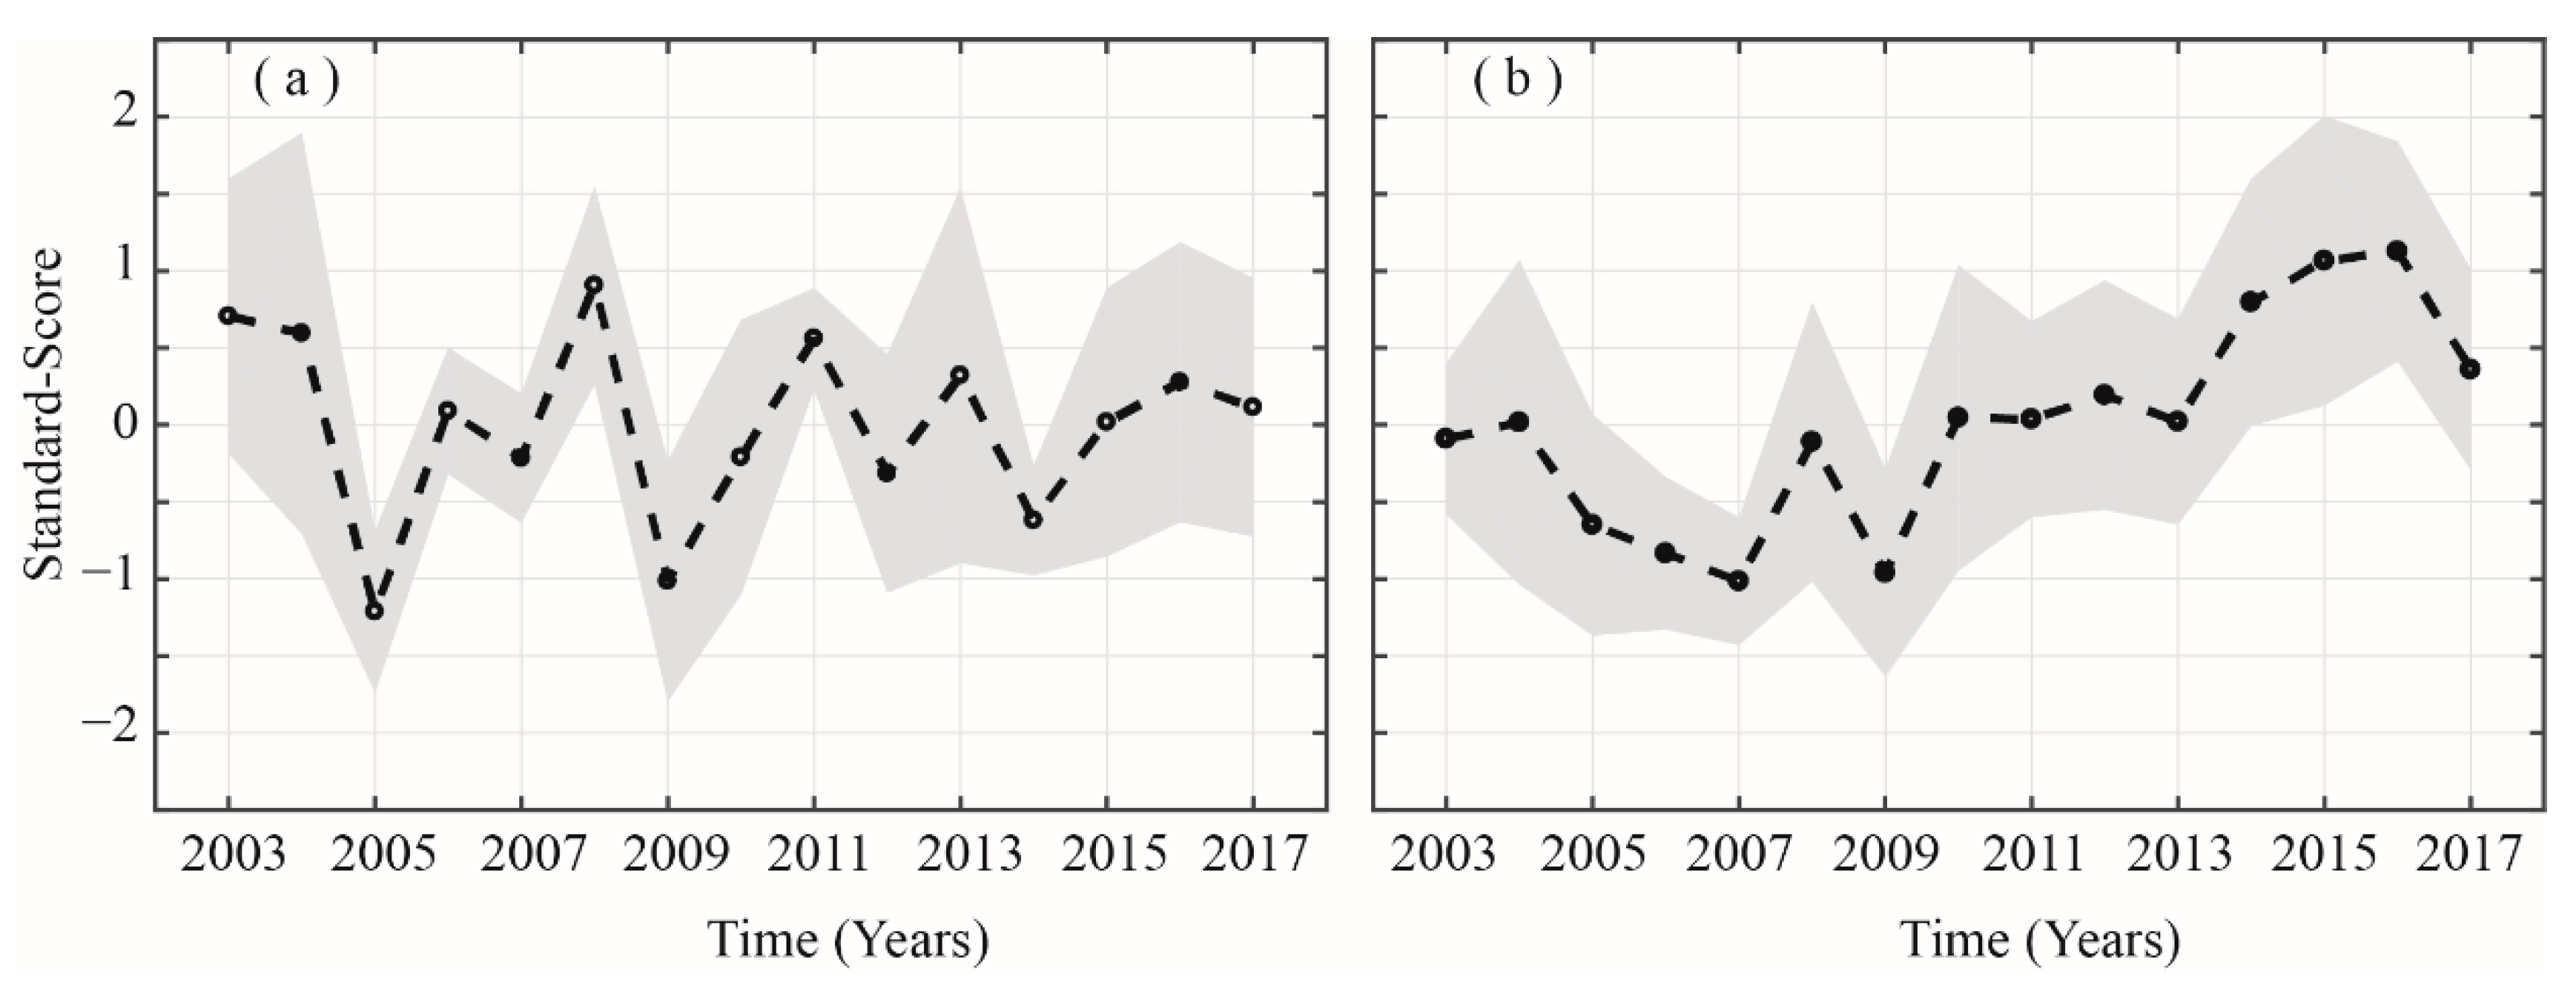
Next, we examine the possibility of a relation between AOD and atmospheric parameters (namely relative humidity (RH) and wind speed (WS)) during the two seasons under consideration. Figure 10a,b presents the inter-annual variation of the standardized AODs over the selected regions. Years with standardized AOD greater than 0.5 (less than –0.5) are taken as stronger (weaker) AOD years for the two seasons. Strong AOD years during summer seasons from 2003 to 2017 include 2003, 2004, 2008, and 2011 and weak years include 2005, 2009, and 2014. Similarly, during winter season, the strong AOD years include 2014, 2015, and 2016 and weak years include 2005, 2006, 2007, and 2009.
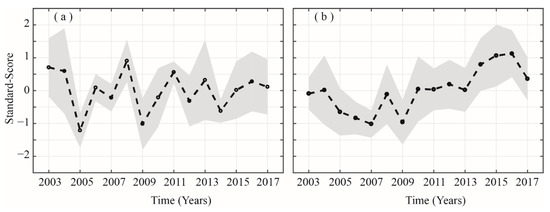
Figure 10.
Standardized AOD time series during (a) summer and (b) winter over the study area. The black line shows mean standard values whereas the shaded region represents the standard deviations.
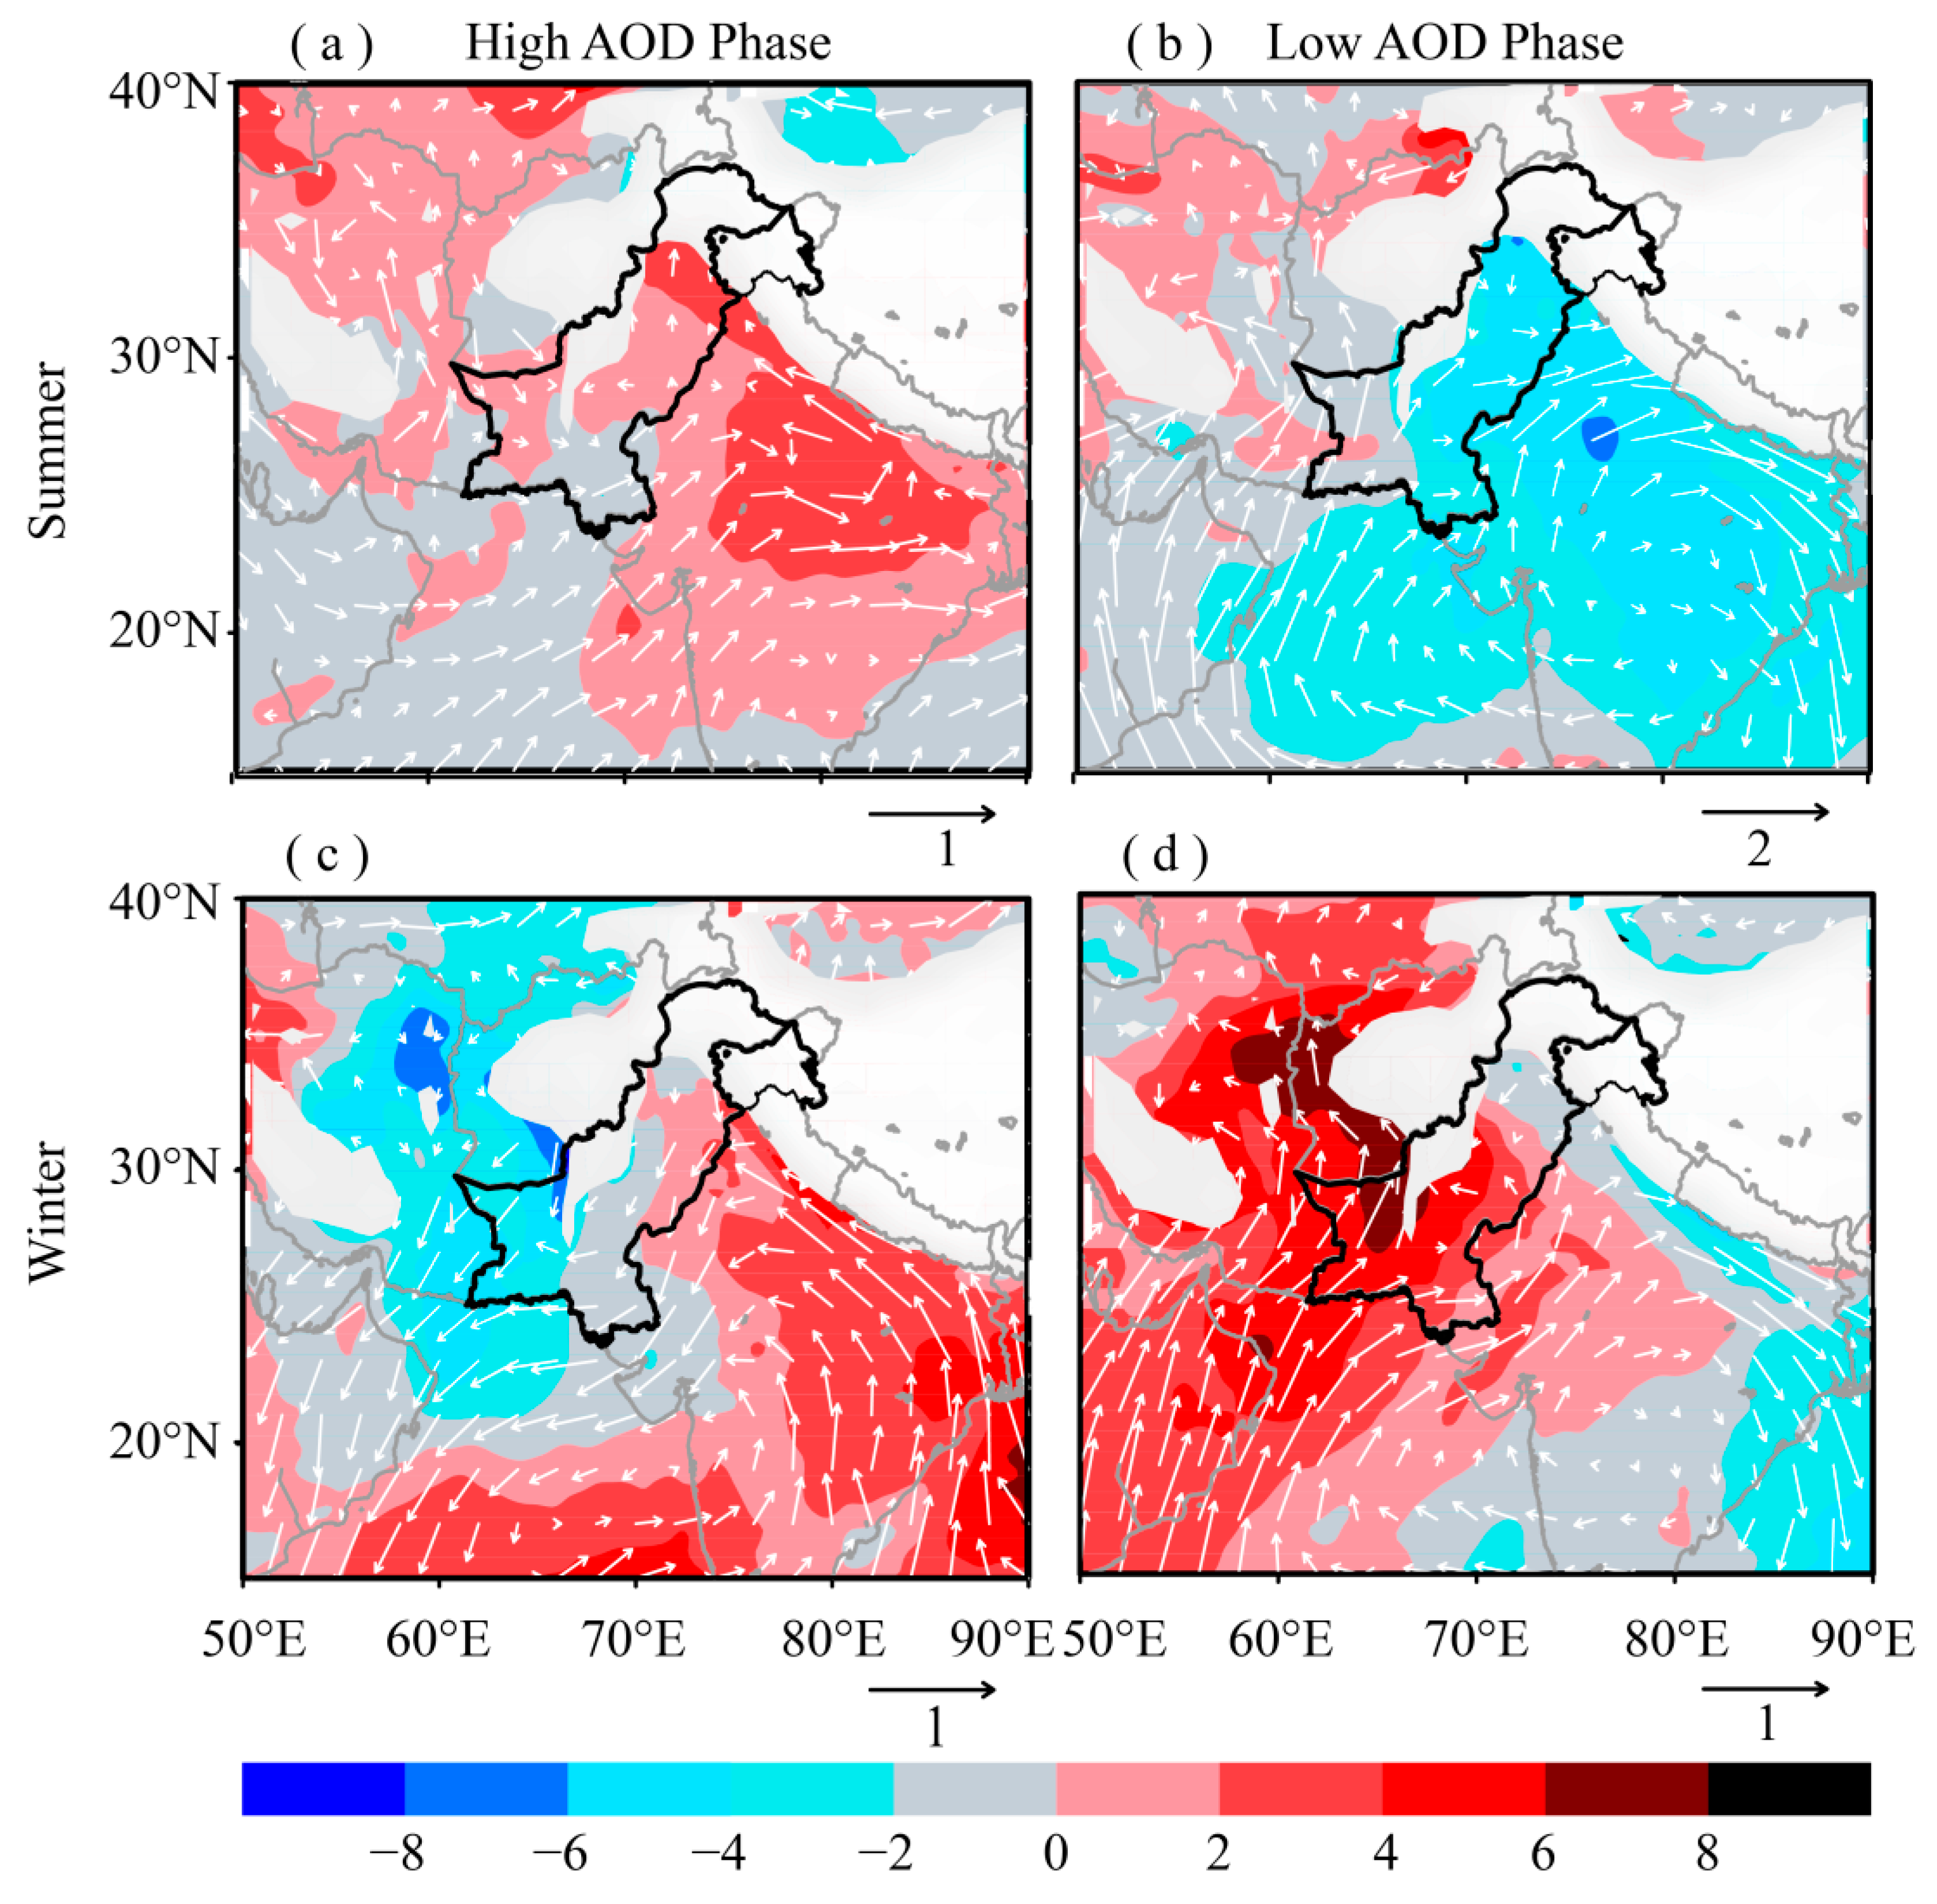
To investigate the influence of circulation change on the AOD, we calculated the anomaly in WS and RH during low and high AOD phases utilizing ERA-Interim reanalysis data [55] from 2003 to 2017 for summer and winter seasons. Earlier studies by Vijayakumar and Devara [125] and Vijayakumar et al. [126] have utilized wind fields at 850 hPa to examine the long-range transport of aerosols over different regions of India. Figure 11a–d shows the anomaly of RH (shaded) and WS (vectors) during strong and weak AOD years at 850 hPa level for the two seasons over the study area as well as the surrounding regions. The meteorological fields at higher altitudes where the surface geopotential is higher than the mean 850 hPa geopotential were masked out. The RH anomaly during high AOD phase of summer season indicates an increase over the northeastern parts of the country as well as the adjoining northern belt of India along the Himalayan foothills (Figure 11a). This region corresponds to the Indo-Gangetic Plane (IGP) which is reported to experience massive aerosol burden due to various factors corresponding to this region [24]. The WS anomaly indicates dominance of the easterly currents. The RH anomaly over the regions on the western side of the study area remains comparatively low. Higher temperatures during the summer season and anomalously high RH over IGP could intensify the generation of secondary aerosols through gas to particle conversion and the hygroscopic growth of the anthropogenic aerosols [111,112,113,114].
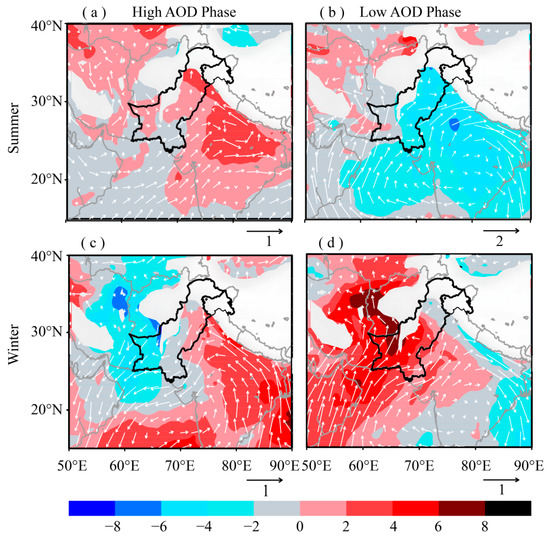
Figure 11.
Anomalous wind speed (vectors) (m s−1) and relative humidity (shaded) at 850 hPa for high and low AOD years during summer (a, b) and winter (c, d) seasons. The arrows below the graphs give the reference for the anomalous wind speed (in ms−1). Locations where the surface geopotential height is higher than the 850 hPa geopotential height have been masked out. The region surrounded by the dark boundary line represents the study area.
Thus, the anomalous meteorological conditions supporting the growth of aerosols, aided by the favorable atmospheric circulation, transferring aerosols from east to west could be the cause of high AOD over different parts of the study area during the summer season. The strong winds moving from the Indian Ocean may cause sea salt aerosols to be advected to the coastal areas and consequently enhancing AODs therein [127]. Contrary to the high AOD phase, the low AOD years are characterized by low RH and dominant westerly and southwesterly currents at mid-tropospheric level (Figure 11b). In contrast, the RH anomaly over the regions on the western side of the study area remains comparatively high and the WS anomaly is almost negligible. Therefore, the prevailing conditions during low AOD phase favor reduced AOD over the study area.
The winter season is mostly characterized by westerly and northwesterly weather pattern (Figure 2c). This weather system causes wide-spread rains over different parts of the study area with maximum intensity over western and northern highlands [97]. The RH and WS anomalies during winter season’s high AOD years are presented in Figure 11c. These anomalies show an increase in RH on the eastern side (Indian landmass) accompanied by a decrease in RH over the regions on the western side of the study area. The anomalous wind field shows a dominant easterly current, supporting the transport of aerosols from across the Indian border to eastern and northeastern Pakistan. Comparatively low RH and reduced WS fields prevail over the regions on the western side indicating a dry winter season with reduced rainfall due to westerly synoptic weather systems. Reduction in rainfall may cause an increase in AOD due to less likelihood of aerosol washout due to rain. Thus, the presence of these anomalous conditions might be the possible causes of enhanced AODs over the study area. The anomalous atmospheric conditions during the winter season low AOD phase are almost opposite to those during the high AOD phase (Figure 11d). High (low) RH over the regions on western (eastern) sides along with dominant westerly wind fields, representative of a typical western weather system, prevails over the study area. The higher RH over the regions on western side is suggesting a wetter than normal winter season due to a typical western weather system. The rainfall washout of atmospheric aerosols may be the cause of reduced AOD over the study area. It is interesting to note that the atmospheric fields have shown a dipole pattern over the regions on eastern and western sides of the study area during high/low AOD phases. However, investigating the dynamics and mechanism of this dipole pattern is beyond the scope of the present study.
5. Conclusions
The present study analyzed the temporal aerosol amount and trends in AOD using the Terra-MODIS 10 × 10 km AOD product over climatically distinct regions in Pakistan during 2003–2017 with focus on the two dominant seasons of the year namely summer (JJAS) and winter (DJF), as well as on annual scale. The summer season is mostly characterized by higher AOD values, particularly over the regions located in the central plains of the study area (Zone 2, Figure 1). Apart from anthropogenic aerosol precursors, the higher temperature and relative humidity during the summer season may be the responsible factors for enhanced aerosol concentration. The trend analysis shows that there is an overall increase in AOD across Pakistan during the study period. Annual mean AODs have increased over seven out of the total twelve selected regions with three being statistically significant at 95% confidence level. Six regions experience statistically non-significant increasing AOD trends during the summer season, while the remaining six stations experience a decreasing AOD trend with Zhob and Quetta being statistically significant. The most interesting outcome of this analysis is the increasing AOD trend over most of the regions during the winter season with six being statistically significant. The AERONET AOD data, available for a limited time period at the two stations (Lahore and Karachi), were also utilized for trend analysis, alongside MODIS-Terra AOD product. The annual and seasonal AOD magnitudes as well as trends from both the data sets are in reasonable agreement over the two regions. However, the winter trend magnitudes based on the two data sets over Lahore deviate from each other, which could possibly be due to the inherited uncertainties associated with satellite AOD retrieval algorithms as well as comparatively shorter time period for analysis. The use of the AERONET level 1.5 data for comparison could be the other reason for this discrepancy.
The trends in AOD over selected locations are fairly supported by trends in rainfall and temperature over these regions. The decreasing rainfall and increasing temperature trends during winter season over most regions support the increasing AOD trends. The decreasing rainfall trend reduces the likelihood of the rainfall washout processes of atmospheric aerosols whereas the increasing temperature trend supports the generation/growth of secondary aerosols as well as strengthening the convection process responsible for vertical distribution of atmospheric aerosols. During the summer season the trends in AOD and rainfall (as well as temperature) exhibit conversely over some locations, for example, the increasing AOD trends over some regions are not supported by the corresponding increasing rainfall and decreasing temperature trends. This factor suggests other parameters, e.g., natural and anthropogenic sources of aerosols, their production mechanisms, removal and transport processes, may be the dominating factors responsible for increasing or decreasing AOD trends over these regions. Annual as well as seasonal trend analyses show that the regions located in north and northeastern parts (Zones 1 and 2, Figure 1) are experiencing increasing AOD trends, mostly statistically significant, whereas a few stations located in southern and southwestern parts (Zones 3 and 4, Figure 1) are experiencing decreasing AOD trends. Overall the aerosol loading reveals a uniform positive trend over most of the regions with statistical significance. The anomalous atmospheric conditions based on relative humidity and wind circulation during high and low AOD phase seems to support the inter-seasonal and inter-annual variations in AOD trends.
The results of this study suggest that the relation between trends in AODs along with other meteorological parameters needs to be studied in greater details as information on temporal trends of aerosols is necessary for regional and global climate impact due to aerosols. The current study solely relied on the quantification of AOD trends with further investigation towards the identification of responsible factors. A deeper insight into the causality between the observables as well as the role of atmospheric transport will be investigated in our future modeling studies.
Author Contributions
All authors have read and agreed to the published version of the manuscript. Conceptualization, G.A. and Y.B.; methodology, G.A. and Y.B.; software, G.A. and W.U.; validation, G.A.; formal analysis, G.A. and W.U.; investigation, G.A. and Y.B.; resources, Y.B., X.L. and L.L.; data curation, G.A. and S.U.; writing—G.A. and Y.B.; writing—review and editing, Q.G., Y.L. and G.L.; visualization, S.U. and J.M.; supervision, Y.B.; project administration, Y.B.; funding acquisition, Y.B.
Funding
This research was supported by the National Key Research and development Program of China (2017YFC1501704, 2018YFC1407200, 2016YFA0600703) and National Natural Science Foundation of China (61527805, 41975046).
Acknowledgments
The authors would like to thank DAAC NASA team for providing MODIS data. The meteorological parameters were provided by Pakistan Meteorological Department. The lead author extends sincere gratitude to World Meteorological Organization (WMO) and Nanjing University of Information Science and Technology (NUIST) for providing financial assistance for 3 years PhD study as well as Pakistan Meteorological Department (PMD) for granting study leave, without which this work would not have been possible.
Conflicts of Interest
Authors declare no conflict of interest.
References
- Kaufman, Y.J.; Boucher, O.; Tanre, D.; Chin, M.; Remer, L.A.; Takemura, T. Aerosol anthropogenic component estimated from satellite data. Geophys. Res. Lett. 2005, 32, 1–4. [Google Scholar] [CrossRef]
- Cazorla, A.; Bahadur, R.; Suski, K.J.; Cahill, J.F.; Chand, D.; Schmid, B.; Ramanathan, V.; Prather, K.A. Relating aerosol absorption due to soot, organic carbon, and dust to emission sources determined from in-situ chemical measurements mixing state of the particles. Atmos. Chem. Phys. 2013, 13, 9337–9350. [Google Scholar] [CrossRef]
- Salah, Z.; Shalaby, A.; Steiner, A.L.; Zakey, A.S.; Gautam, R.; Wahab, M.M.A. Study of Aerosol Direct and Indirect E ff ects and Auto-conversion Processes over the West African Monsoon Region Using a Regional Climate Model. Adv. Atmos. Sci. 2018, 35, 182–194. [Google Scholar] [CrossRef]
- An, W.J.; Pathak, R.K.; Lee, B.H.; Pandis, S.N. Aerosol volatility measurement using an improved thermodenuder: Application to secondary organic aerosol. J. Aerosol Sci. 2007, 38, 305–314. [Google Scholar] [CrossRef]
- Tai, A.P.K.; Mickley, L.J.; Jacob, D.J. Correlations between fine particulate matter (PM2.5) and meteorological variables in the United States: Implications for the sensitivity of PM2.5 to climate change. Atmos. Environ. 2010, 44, 3976–3984. [Google Scholar] [CrossRef]
- Pan, L.; Che, H.; Geng, F.; Xia, X.; Wang, Y.; Zhu, C.; Chen, M.; Gao, W.; Guo, J. Aerosol optical properties based on ground measurements over the Chinese Yangtze Delta Region. Atmos. Environ. 2010, 44, 2587–2596. [Google Scholar] [CrossRef]
- Niu, F.; Li, Z. Systematic variations of cloud top temperature and precipitation rate with aerosols over the global tropics. Atmos. Chem. Phys. 2012, 12, 8491–8498. [Google Scholar] [CrossRef]
- Ramanathan, V.; Crutzen, P.J.; Kiehl, J.T.; Rosenfeld, D. Atmosphere: Aerosols, climate, and the hydrological cycle. Science (80) 2001, 294, 2119–2124. [Google Scholar] [CrossRef]
- Boiyo, R.; Kumar, K.R.; Zhao, T. Statistical intercomparison and validation of multisensory aerosol optical depth retrievals over three AERONET sites in Kenya, East Africa. Atmos. Res. 2017, 197, 277–288. [Google Scholar] [CrossRef]
- Kumar, K.R.; Yin, Y.; Sivakumar, V.; Kang, N.; Yu, X.; Diao, Y.; Adesina, A.J.; Reddy, R.R. Aerosol climatology and discrimination of aerosol types retrieved from MODIS, MISR and OMI over Durban (29.88° S, 31.02° E), South Africa. Atmos. Environ. 2015, 117, 9–18. [Google Scholar] [CrossRef]
- Otto, S.; De Reus, M.; Trautmann, T.; Thomas, A.; Wendisch, M.; Borrmann, S. Atmospheric radiative effects of an in situ measured Saharan dust plume and the role of large particles. Atmos. Chem. Phys. 2007, 7, 4887–4903. [Google Scholar] [CrossRef]
- Haywood, J.M.; Johnson, B.T.; Osborne, S.R.; Baran, A.J.; Brooks, M.; Milton, S.F.; Mulcahy, J.; Walters, D.; Allan, R.P.; Klaver, A.; et al. Motivation, rationale and key results from the GERBILS Saharan dust measurement campaign. Q. J. R. Meteorol. Soc. 2011, 137, 1106–1116. [Google Scholar] [CrossRef]
- Torres, O.; Bhartia, P.K.; Herman, J.R.; Sinyuk, A.; Ginoux, P.; Holben, B. A Long-Term Record of Aerosol Optical Depth from TOMS Observations and Comparison to AERONET Measurements. J. Atmos. Sci. 2002, 59, 398–413. [Google Scholar] [CrossRef]
- Smart, J.C.R.; Hicks, K.; Morrissey, T.; Heinemeyer, A.; Sutton, M.A.; Ashmore, M. Applying the ecosystem service concept to air quality management in the UK: A case study for ammonia. Environmetrics 2011, 22, 649–661. [Google Scholar] [CrossRef]
- Fan, X.; Xia, X.; Chen, H. Can MODIS detect trends in aerosol optical depth over land? Adv. Atmos. Sci. 2018, 35, 135–145. [Google Scholar] [CrossRef]
- Kumar, M.; Tiwari, S.; Murari, V.; Singh, A.K.; Banerjee, T. Wintertime characteristics of aerosols at middle Indo-Gangetic Plain: Impacts of regional meteorology and long range transport. Atmos. Environ. 2015, 104, 162–175. [Google Scholar] [CrossRef]
- Sen, A.; Abdelmaksoud, A.S.S.; Nazeer Ahammed, Y.; Alghamdi, M.A.; Banerjee, T.; Bhat, M.A.; Chatterjee, A.; Choudhuri, A.K.; Das, T.; Dhir, A.; et al. Variations in particulate matter over Indo-Gangetic Plains and Indo-Himalayan Range during four field campaigns in winter monsoon and summer monsoon: Role of pollution pathways. Atmos. Environ. 2017, 154, 200–224. [Google Scholar] [CrossRef]
- Bibi, H.; Alam, K.; Bibi, S. In-depth discrimination of aerosol types using multiple clustering techniques over four locations in Indo-Gangetic plains. Atmos. Res. 2016, 181, 106–114. [Google Scholar] [CrossRef]
- Singh, N.; Mhawish, A.; Deboudt, K.; Singh, R.S.S.; Banerjee, T. Organic aerosols over Indo-Gangetic Plain: Sources, distributions and climatic implications. Atmos. Environ. 2017, 157, 69–74. [Google Scholar] [CrossRef]
- Singh, N.; Murari, V.; Kumar, M.; Barman, S.C.C.; Banerjee, T. Fine particulates over South Asia: Review and meta-analysis of PM2.5source apportionment through receptor model. Environ. Pollut. 2017, 223, 121–136. [Google Scholar] [CrossRef]
- Singh, N.; Banerjee, T.; Raju, M.P.; Deboudt, K.; Sorek-hamer, M.; Singh, R.S. Aerosol chemistry, transport, and climatic implications during extreme biomass burning emissions over the Indo-Gangetic Plain. Atmos. Chem. Phys. 2018, 18, 14197–14215. [Google Scholar] [CrossRef]
- Gautam, R.; Hsu, N.C.; Kafatos, M.; Tsay, S. Influences of winter haze on fog/low cloud over the Indo-Gangetic plains. J. Geophys. Res. Atmos. 2007, 112, 1–11. [Google Scholar] [CrossRef]
- Ul-Haq, Z.; Tariq, S.; Ali, M. Spatiotemporal patterns of correlation between atmospheric nitrogen dioxide and aerosols over South Asia. Meteorol. Atmos. Phys. 2017, 129, 507–527. [Google Scholar] [CrossRef]
- Kumar, M.; Parmar, K.S.; Kumar, D.B.; Mhawish, A.; Broday, D.M.; Mall, R.K.; Banerjee, T. Long-term aerosol climatology over Indo-Gangetic Plain: Trend, prediction and potential source fields. Atmos. Environ. 2018, 180, 37–50. [Google Scholar] [CrossRef]
- Gupta, P.; Khan, M.N.; da Silva, A.; Patadia, F. MODIS aerosol optical depth observations over urban areas in Pakistan: Quantity and quality of the data for air quality monitoring. Atmos. Pollut. Res. 2013, 4, 43–52. [Google Scholar] [CrossRef]
- Alam, K.; Qureshi, S.; Blaschke, T. Monitoring spatio-temporal aerosol patterns over Pakistan based on MODIS, TOMS and MISR satellite data and a HYSPLIT model. Atmos. Environ. 2011, 45, 4641–4651. [Google Scholar] [CrossRef]
- Alam, K.; Iqbal, M.J.; Blaschke, T.; Qureshi, S.; Khan, G. Monitoring spatio-temporal variations in aerosols and aerosol-cloud interactions over Pakistan using MODIS data. Adv. Space Res. 2010, 46, 1162–1176. [Google Scholar] [CrossRef]
- Holben, B.N.; Eck, T.F.; Slutsker, I.; Tanré, D.; Buis, J.P.; Setzer, A.; Vermote, E.; Reagan, J.A.; Kaufman, Y.J.; Nakajima, T.; et al. AERONET—A Federated Instrument Network and Data Archive for Aerosol Characterization. Remote. Sens. Environ. 1998, 66, 1–16. [Google Scholar] [CrossRef]
- Kim, D.; Sohn, B.; Nakajima, T.; Takamura, T.; Takemura, T.; Choi, B.; Yoon, S. Aerosol optical properties over east Asia determined from ground-based sky radiation measurements. J. Geophys. Res. Atmos. 2004, 109, 1–18. [Google Scholar] [CrossRef]
- Amiridis, V.; Balis, D.S.; Kazadzis, S.; Bais, A.; Giannakaki, E.; Papayannis, A.; Zerefos, C. Four-year aerosol observations with a Raman lidar at Thessaloniki, Greece, in the framework of European Aerosol Research Lidar Network (EARLINET). J. Geophys. Res. Atmos. 2005, 110, 1–12. [Google Scholar] [CrossRef]
- Che, H.; Zhang, X.; Chen, H.; Damiri, B.; Goloub, P.; Li, Z.; Zhang, X.; Wei, Y.; Zhou, H.; Dong, F.; et al. Instrument calibration and aerosol optical depth validation of the China aerosol remote sensing network. J. Geophys. Res. Atmos. 2009, 114, 1–12. [Google Scholar] [CrossRef]
- Kahn, R.A.; Gaitley, B.J.; Martonchik, J.V.; Diner, D.J.; Crean, K.A.; Holben, B. Multiangle Imaging Spectroradiometer (MISR) global aerosol optical depth validation based on 2 years of coincident Aerosol Robotic Network (AERONET) observations. J. Geophys. Res. D Atmos. 2005, 110, 1–16. [Google Scholar] [CrossRef]
- Torres, O.; Tanskanen, A.; Veihelmann, B.; Ahn, C.; Braak, R.; Bhartia, P.K.; Veefkind, P.; Levelt, P. Aerosols and surface UV products form Ozone Monitoring Instrument observations: An overview. J. Geophys. Res. 2007, 112, 1–14. [Google Scholar] [CrossRef]
- Hsu, N.C.; Jeong, M.J.; Bettenhausen, C.; Sayer, A.M.; Hansell, R.; Seftor, C.S.; Huang, J.; Tsay, S.C. Enhanced Deep Blue aerosol retrieval algorithm: The second generation. J. Geophys. Res. Atmos. 2013, 118, 9296–9315. [Google Scholar] [CrossRef]
- Hsu, N.C.; Lee, J.; Sayer, A.M.; Kim, W.; Bettenhausen, C.; Tsay, S.-C. VIIRS Deep Blue Aerosol Products over Land: Extending the EOS Long—Term Aerosol Data Records. J. Geophys. Res. Atmos. 2019, 124, 4026–4053. [Google Scholar] [CrossRef]
- Giles, D.M.; Sinyuk, A.; Sorokin, M.G.; Schafer, J.S.; Smirnov, A.; Slutsker, I.; Eck, T.F.; Holben, B.N.; Lewis, J.R.; Campbell, J.R.; et al. Advancements in the Aerosol Robotic Network (AERONET) Version 3 database–automated near-real-time quality control algorithm with improved cloud screening for Sun photometer aerosol optical depth (AOD) measurements. Atmos. Meas. Tech. 2019, 12, 169–209. [Google Scholar] [CrossRef]
- Hsu, N.C.; Tsay, S.; King, M.D.; Member, S.; Herman, J.R. Aerosol Properties over Bright-Reflecting Source Regions. IEEE Trans. Geosci. Remote. Sens. 2004, 42, 557–569. [Google Scholar] [CrossRef]
- Remer, L.A.; Kleidman, R.G.; Levy, R.C.; Kaufman, Y.J.; Tanré, D.; Mattoo, S.; Martins, J.V.; Ichoku, C.; Koren, I.; Yu, H.; et al. Global aerosol climatology from the MODIS satellite sensors. J. Geophys. Res. Atmos. 2008, 113, 1–18. [Google Scholar] [CrossRef]
- Shahzad, M.I.; Nichol, J.E.; Campbell, J.R.; Wong, M.S. Assessment of MODIS, OMI, MISR and CALIOP aerosol products for estimating surface visual range: A mathematical model for Hong Kong. Remote. Sens. 2018, 10, 1333. [Google Scholar] [CrossRef]
- Penner, J.E.; Zhang, S.Y.; Chuang, C.C. Soot and smoke aerosol may not warm climate. J. Geophys. Res. Atmos. 2003, 108, 1–9. [Google Scholar] [CrossRef]
- Tripathi, S.N.; Pattnaik, A.; Dey, S. Aerosol indirect effect over Indo-Gangetic plain. Atmos. Environ. 2007, 41, 7037–7047. [Google Scholar] [CrossRef]
- Seinfeld, J.H.; Bretherton, C.; Carslaw, K.S.; Coe, H.; DeMott, P.J.; Dunlea, E.J.; Feingold, G.; Ghan, S.; Guenther, A.B.; Kahn, R.; et al. Improving our fundamental understanding of the role of aerosol−cloud interactions in the climate system. Proc. Natl. Acad. Sci. USA 2016, 113, 5781–5790. [Google Scholar] [CrossRef] [PubMed]
- Kosmopoulos, P.G.; Kaskaoutis, D.G.; Nastos, P.T.; Kambezidis, H.D. Seasonal variation of columnar aerosol optical properties over Athens, Greece, based on MODIS data. Remote. Sens. Environ. 2008, 112, 2354–2366. [Google Scholar] [CrossRef]
- Farr, T.G.; Rosen, P.A.; Caro, E.; Crippen, R.; Duren, R.; Hensley, S.; Kobrick, M.; Paller, M.; Rodriguez, E.; Roth, L.; et al. The Shuttle Radar Topography Mission. Rev. Geophys. 2007, 45, 1–33. [Google Scholar] [CrossRef]
- MODIS Land Cover Type data. Available online: https://lpdaac.usgs.gov/products/mcd12q1v006/ (accessed on 11 December 2018).
- Pakistan Bureau of Statistics. Available online: www.pbs.gov.pk (accessed on 25 February 2020).
- Ali, G.; Bao, Y.; Boiyo, R.; Tang, W.; Lu, Q.; Min, J. Evaluating MODIS and MISR aerosol optical depth retrievals over environmentally distinct sites in Pakistan. J. Atmos. Solar-Terr. Phys. 2019, 183, 19–35. [Google Scholar] [CrossRef]
- Ullah, W.; Wang, G.; Ali, G.; Tawia Hagan, D.; Bhatti, A.; Lou, D. Comparing Multiple Precipitation Products against In-Situ Observations over Different Climate Regions of Pakistan. Remote. Sens. 2019, 11, 628. [Google Scholar] [CrossRef]
- Hanif, M.; Khan, A.H.; Adnan, S. Latitudinal precipitation characteristics and trends in Pakistan. J. Hydrol. 2013, 492, 266–272. [Google Scholar] [CrossRef]
- Tariq, M.A.U.R.; Van de Giesen, N. Floods and flood management in Pakistan. Phys. Chem. Earth 2012, 47–48, 11–20. [Google Scholar] [CrossRef]
- Iqbal, M.F.; Athar, H. Validation of satellite based precipitation over diverse topography of Pakistan. Atmos. Res. 2018, 201, 247–260. [Google Scholar] [CrossRef]
- Tiwari, S.; Srivastava, A.K.; Singh, A.K.; Singh, S. Identification of aerosol types over Indo-Gangetic Basin: Implications to optical properties and associated radiative forcing. Environ. Sci. Pollut. Res. 2015, 22, 12246–12260. [Google Scholar] [CrossRef]
- Das, S.K.; Jayaraman, A.; Misra, A. Fog-induced variations in aerosol optical and physical properties over the Indo-Gangetic Basin and impact to aerosol radiative forcing. Ann. Geophys. 2008, 26, 1345–1354. [Google Scholar] [CrossRef]
- Devara, P.C.S.; Raj, P.E.; Pandithurai, G.; Dani, K.K.; Maheskumar, R.S. Relationship between lidar-based observations of aerosol content and monsoon precipitation over a tropical station, Pune, India. Meteorol. Appl. 2003, 262, 253–262. [Google Scholar] [CrossRef]
- ERA-Interim Reanalysis Data. Available online: https://www.ecmwf.int/ (accessed on 10 June 2019).
- Khan, R.; Raghavendra, K.; Zhao, T. The climatology of aerosol optical thickness and radiative effects in Southeast Asia from 18-years of ground-based observations. Environ. Pollut. 2019, 254, 113025. [Google Scholar] [CrossRef] [PubMed]
- Tiwari, S.; Singh, A.K. Variability of Aerosol parameters derived from ground and satellite measurements over Varanasi located in the Indo-Gangetic Basin. Aerosol Air Qual. Res. 2013, 13, 627–638. [Google Scholar] [CrossRef]
- Tiwari, S.; Pandithurai, G.; Attri, S.D.; Srivastava, A.K.; Soni, V.K.; Bisht, D.S.; Anil Kumar, V.; Srivastava, M.K. Aerosol optical properties and their relationship with meteorological parameters during wintertime in Delhi, India. Atmos. Res. 2015, 153, 465–479. [Google Scholar] [CrossRef]
- Alam, K.; Khan, R.; Ali, S.; Ajmal, M.; Khan, G.; Muhammad, W.; Ali, M.A. Variability of aerosol optical depth over Swat in Northern Pakistan based on satellite data. Arab. J. Geosci. 2015, 8, 547–555. [Google Scholar] [CrossRef]
- Alvi, M.U.; Chishtie, F.; Shahid, I.; Mahmud, T. Traffic- and Industry-Related Air Pollution Exposure Assessment in an Asian Megacity. Clean 2018, 46, 1–20. [Google Scholar] [CrossRef]
- Alam, K.; Khan, R.; Blaschke, T.; Mukhtiar, A. Variability of aerosol optical depth and their impact on cloud properties in Pakistan. J. Atmos. Solar-Terr. Phys. 2014, 107, 104–112. [Google Scholar] [CrossRef]
- Ilyas Zafar, S.; Khattak, A.I.; Nasir, S.M.; Qurashi, T.; Durrani, R. Air pollution assessment in urban areas and its impact on human health in the city of Quetta, Pakistan. Clean Technol. Environ. Policy 2010, 12, 291–299. [Google Scholar] [CrossRef]
- Levy, R.C.; Remer, L.A.; Mattoo, S.; Vermote, E.F.; Kaufman, Y.J. Second-generation operational algorithm: Retrieval of aerosol properties over land from inversion of Moderate Resolution Imaging Spectroradiometer spectral reflectance. J. Geophys. Res. Atmos. 2007, 112, 1–21. [Google Scholar] [CrossRef]
- Tian, X.; Liu, Q.; Li, X.; Wei, J. Validation and Comparison of MODIS C6. 1 and C6 Aerosol Products over Beijing, China. Remote. Sens. 2018, 10, 2021. [Google Scholar] [CrossRef]
- Wang, Y.; Yuan, Q.; Li, T.; Shen, H.; Zheng, L. Evaluation and comparison of MODIS Collection 6. 1 aerosol optical depth against AERONET over regions in China with multifarious underlying surfaces. Atmos. Environ. 2019, 200, 280–301. [Google Scholar] [CrossRef]
- Sayer, A.M.; Hsu, N.C.; Dutcher, S.T.; Lee, J. Validation, Stability, and Consistency of MODIS Collection 6. 1 and VIIRS Version 1 Deep Blue Aerosol Data Over Land. J. Geophys. Res. Atmos. 2019, 124, 4658–4688. [Google Scholar] [CrossRef]
- Sayer, A.M.; Hsu, N.C.; Bettenhausen, C.; Jeong, M.J. Validation and uncertainty estimates for MODIS Collection 6 deep Blue aerosol data. J. Geophys. Res. Atmos. 2013, 118, 7864–7872. [Google Scholar] [CrossRef]
- Levy, R.C.; Mattoo, S.; Munchak, L.A.; Remer, L.A.; Sayer, A.M.; Patadia, F.; Hsu, N.C. The Collection 6 MODIS aerosol products over land and ocean. Atmos. Meas. Tech. 2013, 6, 2989–3034. [Google Scholar] [CrossRef]
- Sayer, A.M.; Munchak, L.A.; Hsu, N.C.; Levy, R.C.; Bettenhausen, C.; Jeong, M. MODIS Collection 6 aerosol products: Comparison between Aqua’s e-Deep Blue, Dark Target, and merged data sets, and usage recommendations. J. Geophys. Res. Atmos. 2014, 119, 13965–13989. [Google Scholar] [CrossRef]
- MODIS AOD Level 2 Data. Available online: https://ladsweb.modaps.eosdis.nasa.gov/ (accessed on 10 June 2019).
- Wei, J.; Li, Z.; Peng, Y.; Sun, L. MODIS Collection 6.1 aerosol optical depth products over land and ocean: Validation and comparison. Atmos. Environ. 2019, 201, 428–440. [Google Scholar] [CrossRef]
- Srivastava, A.; Saran, S. Comprehensive study on AOD trends over the Indian subcontinent: A statistical approach. Int. J. Remote. Sens. 2017, 38, 5127–5149. [Google Scholar] [CrossRef]
- Ångstrom, A. Techniques of Determinig the Turbidity of the Atmosphere. Tellus A 1961, 13, 214–223. [Google Scholar] [CrossRef]
- Khokhar, M.F.; Yasmin, N.; Chishtie, F.; Shahid, I. Temporal variability and characterization of aerosols across the Pakistan region during the winter fog periods. Atmosphere 2016, 7, 1–18. [Google Scholar] [CrossRef]
- Nabeel, A.; Athar, H. Classification of precipitation regimes in Pakistan using wet and dry spells. Int. J. Climatol. 2018, 38, 2462–2477. [Google Scholar] [CrossRef]
- Naheed, G.; Kazmi, D.H.; Rasul, G. Seasonal Variation of Rainy Days in Pakistan. Pak. J. Meteorol. 2013, 9, 9–13. [Google Scholar]
- Kazmi, D.H.; Li, J.; Ruan, C.; Zhao, S.; Li, Y. A statistical downscaling model for summer rainfall over Pakistan. Clim. Dyn. 2016, 47, 2653–2666. [Google Scholar] [CrossRef]
- Mann, H.B. Nonparametric Tests against Trend. Econometrica 1945, 13, 245–259. [Google Scholar] [CrossRef]
- Kendall, M.G. Rank Correlation Methods, 4th ed.; Griffin, C., Ed.; Griffin: London, UK, 1975. [Google Scholar]
- Hamed, K.H.; Ramachandra, R. A modified Mann-Kendall trend test for autocorrelated data. J. Hydrol. 1998, 204, 182–196. [Google Scholar] [CrossRef]
- Bari, S.H.; Rahman, M.T.U.; Hoque, M.A.; Hussain, M.M. Analysis of seasonal and annual rainfall trends in the northern region of Bangladesh. Atmos. Res. 2016, 176–177, 148–158. [Google Scholar] [CrossRef]
- Sen, P.K. Estimates of the Regression Coefficient Based on Kendall’s Tau. J. Am. Stat. Assoc. 1968, 63, 1379–1389. [Google Scholar] [CrossRef]
- Li, J.; Carlson, B.E.; Dubovik, O.; Lacis, A.A. Recent trends in aerosol optical properties derived from AERONET measurements. Atmos. Chem. Phys. 2014, 14, 12271–12289. [Google Scholar] [CrossRef]
- Zhao, B.; Jiang, J.H.; Gu, Y.; Diner, D.; Worden, J.; Liou, K.-N.; Su, H.; Xing, J.; Garay, M.; Huang, L. Decadal-scale trends in regional aerosol particle properties and their linkage to emission changes. Environ. Res. Lett. 2017, 12, 54021. [Google Scholar] [CrossRef]
- Maghrabi, A.H.; Alotaibi, R.N. Long-term variations of AOD from an AERONET station in the central Arabian Peninsula. Theor. Appl. Climatol. 2018, 134, 1015–1026. [Google Scholar] [CrossRef]
- Latif, M.; Hannachi, A.; Syed, F.S. Analysis of rainfall trends over Indo-Pakistan summer monsoon and related dynamics based on CMIP5 climate. Int. J. Climatol. 2018, 38, e577–e595. [Google Scholar] [CrossRef]
- Latif, M.; Syed, F.S.; Hannachi, A. Rainfall trends in the South Asian summer monsoon and its related large-scale dynamics with focus over Pakistan. Clim. Dyn. 2017, 48, 3565–3581. [Google Scholar] [CrossRef]
- Yue, S.; Pilon, P.; Phinney, B.; Cavadias, G. The influence of autocorrelation on the ability to detect trend in hydrological series. Hydrol. Process. 2002, 16, 1807–1829. [Google Scholar] [CrossRef]
- Zamani, R.; Mirabbasi, R.; Abdollahi, S.; Jhajharia, D. Streamflow trend analysis by considering autocorrelation structure, long-term persistence, and Hurst coefficient in a semi-arid region of Iran. Theor. Appl. Climatol. 2017, 129, 33–45. [Google Scholar] [CrossRef]
- Shahid, S. Trends in extreme rainfall events of Bangladesh. Theor. Appl. Climatol. 2011, 104, 489–499. [Google Scholar] [CrossRef]
- Salman, S.A.; Shahid, S.; Ismail, T.; Chung, E.S.; Al-Abadi, A.M. Long-term trends in daily temperature extremes in Iraq. Atmos. Res. 2017, 198, 97–107. [Google Scholar] [CrossRef]
- Matyasovszky, I. Detecting abrupt climate changes on different time scales. Theor. Appl. Clim. 2011, 105, 445–454. [Google Scholar] [CrossRef]
- Chatterjee, S.; Bisai, D.; Khan, A. Detection of Approximate Potential Trend Turning Points in Temperature Time Series (1941–2010) for Asansol Weather Observation Station, West Bengal, India. Atmos. Clim. Sci. 2014, 4, 64–69. [Google Scholar] [CrossRef]
- Chatterjee, S.; Khan, A.; Akbari, H.; Wang, Y. Monotonic trends in spatio-temporal distribution and concentration of monsoon precipitation (1901–2002), West Bengal, India. Atmos. Res. 2016, 182, 54–75. [Google Scholar] [CrossRef]
- Liu, Q.; Wan, S.; Gu, B. A Review of the Detection Methods for Climate Regime Shifts. Discret. Dyn. Nat. Soc. 2016, 2016, 10. [Google Scholar] [CrossRef]
- Adnan, S.; Ullah, K.; Shuanglin, L.; Gao, S. Comparison of various drought indices to monitor drought status in Pakistan. Clim. Dyn. 2018, 51, 1885–1899. [Google Scholar] [CrossRef]
- Ullah, S.; You, Q.; Ullah, W.; Ali, A. Observed changes in precipitation in China-Pakistan economic corridor during 1980–2016. Atmos. Res. 2018, 210, 1–14. [Google Scholar] [CrossRef]
- Mehta, M.; Singh, R.; Singh, A.; Singh, N. Anshumali Recent global aerosol optical depth variations and trends—A comparative study using MODIS and MISR level 3 datasets. Remote. Sens. Environ. 2016, 181, 137–150. [Google Scholar] [CrossRef]
- Syed, F.S.; Kornich, H.; Tjernstrom, M. On the fog variability over south Asia. Clim. Dyn. 2012, 39, 2993–3005. [Google Scholar] [CrossRef]
- Shrestha, P.; Barros, A.P.; Khlystov, A. CCN estimates from bulk hygroscopic growth factors of ambient aerosols during the pre-monsoon season over Central Nepal. Atmos. Environ. 2013, 67, 120–129. [Google Scholar] [CrossRef]
- Prasad, A.K.; Singh, R.P. Comparison of MISR-MODIS aerosol optical depth over the Indo-Gangetic basin during the winter and summer seasons (2000–2005). Remote. Sens. Environ. 2007, 107, 109–119. [Google Scholar] [CrossRef]
- Luo, Y.; Zheng, X.; Chen, J. A climatology of aerosol optical depth over China from recent 10 years of MODIS remote sensing data. Int. J. Climatol. 2014, 870, 863–870. [Google Scholar] [CrossRef]
- Ramachandran, S.; Kedia, S.; Srivastava, R. Aerosol optical depth trends over different regions of India. Atmos. Environ. 2012, 49, 338–347. [Google Scholar] [CrossRef]
- Ramachandran, S. Aerosol optical depth and fine mode fraction variations deduced from Moderate Resolution Imaging Spectroradiometer (MODIS) over four urban areas in India. J. Geophys. Res. Atmos. 2007, 112, 1–11. [Google Scholar] [CrossRef]
- Singh, R.P.; Dey, S.; Tripathi, S.N.; Tare, V.; Holben, B. Variability of aerosol parameters over Kanpur, northern India. J. Geophys. Res. D Atmos. 2004, 109, 1–14. [Google Scholar] [CrossRef]
- Banerjee, T.; Singh, S.B.; Srivastava, R.K. Development and performance evaluation of statistical models correlating air pollutants and meteorological variables at Pantnagar, India. Atmos. Res. 2011, 99, 505–517. [Google Scholar] [CrossRef]
- Banerjee, T.; Kumar, R. Evaluation of environmental impacts of Integrated Industrial Estate—Pantnagar through application of air and water quality indices. Environ. Monit. Assess. 2011, 172, 547–560. [Google Scholar] [CrossRef] [PubMed]
- Sharma, A.R.; Kharol, S.K.; Badarinath, K.V.S.; Singh, D. Impact of agriculture crop residue burning on atmospheric aerosol loading—A study over Punjab State, India. Ann. Geophys. 2010, 28, 367–379. [Google Scholar] [CrossRef]
- Masmoudi, M.; Chaabane, M.; Tanre, D.; Gouloup, P.; Blarel, L.; Elleuch, F. Spatial and temporal variability of aerosol: Size distribution and optical properties. Atmos. Res. 2003, 66, 1–19. [Google Scholar] [CrossRef]
- Ranjan, R.R.; Joshi, H.P.; Iyer, K.N. Spectral Variation of Total Column Aerosol Optical Depth over Rajkot: A Tropical Semi-Arid Indian Station. Aerosol Air Qual. Res. 2007, 7, 33–45. [Google Scholar] [CrossRef]
- Chen, S.; Li, W.B.; Du, Y.D.; Mao, C.Y.; Zhang, L. Urbanization effect on precipitation over the Pearl River Delta based on CMORPH data. Adv. Clim. Chang. Res. 2015, 6, 16–22. [Google Scholar] [CrossRef]
- Tan, F.; Lim, H.S.; Abdullah, K.; Yoon, T.L.; Holben, B. Monsoonal variations in aerosol optical properties and estimation of aerosol optical depth using ground-based meteorological and air quality data in Peninsular Malaysia. Atmos. Chem. Phys. 2015, 15, 3755–3771. [Google Scholar] [CrossRef]
- Floutsi, A.A.; Korras-Carraca, M.B.; Matsoukas, C.; Hatzianastassiou, N.; Biskos, G. Climatology and trends of aerosol optical depth over the Mediterranean basin during the last 12 years (2002–2014) based on Collection 006 MODIS-Aqua data. Sci. Total. Environ. 2016, 551–552, 292–303. [Google Scholar] [CrossRef]
- Kang, N.; Kumar, K.R.; Hu, K.; Yu, X.; Yin, Y. Long-term (2002–2014) evolution and trend in Collection 5.1 Level-2 aerosol products derived from the MODIS and MISR sensors over the Chinese Yangtze River Delta. Atmos. Res. 2016, 181, 29–43. [Google Scholar] [CrossRef]
- Boiyo, R.K.; Raghavendra, K.; Zhaoa, T. Spatial variations and trends in AOD climatology over East Africa during 2002–2016: A comparative study using three satellite data sets. Int. J. Climatol. 2018, 38, e1221–e1240. [Google Scholar] [CrossRef]
- Ahmad, I.; Tang, D.; Wang, T.; Wang, M.; Wagan, B. Precipitation Trends over Time Using Mann-Kendall and Spearman’s rho Tests in Swat River Basin, Pakistan. Adv. Meteorol. 2015, 2015. [Google Scholar] [CrossRef]
- Ullah, S.; You, Q.; Ali, A.; Ullah, W.; Ahmad, M.; Zhang, Y. Observed changes in maximum and minimum temperatures over China- Pakistan economic corridor during 1980–2016. Atmos. Res. 2019, 216, 37–51. [Google Scholar] [CrossRef]
- Ullah, S.; You, Q.; Ullah, W.; Ali, A.; Xie, W.; Xie, X. Observed changes in temperature extremes over China—Pakistan Economic Corridor during 1980–2016. Int. J. Climatol. 2019, 39, 1457–1475. [Google Scholar] [CrossRef]
- Ali, S.; Khalid, B.; Kiani, R.S.; Babar, R.; Nasir, S.; Rehman, N. Spatio-Temporal Variability of Summer Monsoon Onset over Pakistan. Asia-Pac. J. Atmos. Sci. 2019, 56, 147–172. [Google Scholar] [CrossRef]
- Jin, M.; Shepherd, J.M.; King, M.D. Urban aerosols and their variations with clouds and rainfall: A case study for New York and Houston. J. Geophys. Res. 2005, 110, 1–12. [Google Scholar] [CrossRef]
- Zhu, J.; Liao, H.; Li, J. Increases in aerosol concentrations over eastern China due to the decadal-scale weakening of the East Asian summer monsoon. Geophys. Res. Lett. 2012, 39, 1–6. [Google Scholar] [CrossRef]
- Chowdhury, S.; Dey, S.; Ghosh, S.; Saud, T. Satellite-based estimates of aerosol washout and recovery over India during monsoon. Aerosol Air Qual. Res. 2016, 16, 1302–1314. [Google Scholar] [CrossRef]
- Makokha, J.W.; Odhiambo, J.O.; Godfrey, J.S. Trend Analysis of Aerosol Optical Depth and Ångström Exponent Anomaly over East Africa. Atmos. Clim. Sci. 2017, 7, 588–603. [Google Scholar]
- Pandithurai, G.; Pinker, R.T.; Devara, P.C.S.; Takamura, T.; Dani, K.K. Seasonal asymmetry in diurnal variation of aerosol optical characteristics over Pune, western India. J. Geophys. Res. 2007, 112, 1–9. [Google Scholar] [CrossRef]
- Vijayakumar, K.; Devara, P.C.S. Optical exploration of biomass burning aerosols over a high-altitude station by combining ground-based and satellite data. J. Aerosol Sci. 2014, 72, 1–13. [Google Scholar] [CrossRef]
- Vijayakumar, K.; Safai, P.D.; Devara, P.C.S.; Bhaskara, S.V.; Jayasankar, C.K. Effects of agriculture crop residue burning on aerosol properties and long-range transport over northern India: A study using satellite data and model simulations. Atmos. Res. 2016, 178–179, 155–163. [Google Scholar] [CrossRef]
- Moorthy, K.K.; Suresh Babu, S.; Manoj, M.R.; Satheesh, S.K. Buildup of aerosols over the Indian Region. Geophys. Res. Lett. 2013, 40, 1011–1014. [Google Scholar] [CrossRef]
© 2020 by the authors. Licensee MDPI, Basel, Switzerland. This article is an open access article distributed under the terms and conditions of the Creative Commons Attribution (CC BY) license (http://creativecommons.org/licenses/by/4.0/).

