1. Introduction
One of the most important social problems in recent years is the deterioration of air quality. It is widely accepted that the emission of most pollutants is closely related to the volume of industrial production. This means that any increase in production inevitably entails an increase in emissions and vice versa, a reduction in production, e.g., as a result of the economic crisis, which reduces most of the emissions. This thesis is partly true, but the decrease in emissions also results from the improvement of production processes, implementation of new technologies, equipping installations with increasingly better emission-reduction systems or changes in legal regulations. Furthermore, the volume of pollutant emissions usually does not simply translate into an increase in their emissions, i.e., deterioration of air quality. This relationship exists but air pollution is affected by a much larger number of factors, not just the volume of emission.
Sources of air pollution are numerous and diverse, both natural and resulting from human activities. The substances most commonly emitted to the atmosphere from commercial activities include sulfur dioxide, nitrogen oxides, particulate matter, volatile organic compounds, heavy metals and odors [
1,
2,
3]. Large combustion plants, i.e., above all power plants and combined heat and power plants, are considered the most important sources of sulfur dioxide emissions. In second place are housing (local boiler houses) and combustion processes in industry. Nitrogen oxides are emitted mainly from road transport, metallurgy and cement plants.
The two air pollution types presented above are the most important reasons for the deterioration of air quality, which is often referred to as smog. Smog is the best known negative effect of air pollution in the ground layer of the atmosphere [
4,
5,
6,
7]. Smog can be called an atmospheric phenomenon consisting of the co-occurrence of air pollution caused by human activity and adverse natural atmospheric phenomena, which results in temperature inversion, and often also fog. Originally the word smog comes from the combination of two words: smoke and fog, and was used to refer to phenomena observed in London in the early 1950s. Today, under the name smog, we usually mean the oversized air pollution in cities arising as a result of emissions from low emitters (residential combustion and cars) under certain meteorological conditions (especially temperature inversion). In the literature, numerous descriptions of two types of smog can be found: acid smog (London type) and photochemical smog (Los Angeles type).
Acid smog occurs mainly from November to January. During this time, temperature inversion occurs in the temperate climate zone, i.e., there is an atypical temperature distribution with altitude above the earth surface. During temperature inversion, the temperature increases with height and does not decrease, as it results, among others, from the laws of thermodynamics. The vertical movement of the atmosphere is then strongly inhibited, and in weak wind or windless weather there is a concentration of pollutants near the earth surface [
8,
9,
10]. Near the ground level an acid aerosol is formed which is toxic to humans and the environment and is also allergic to some parts of the population. As the name suggests, the main components of acid smog acidic compounds formed by absorption of acidic substances resulting from the absorption of acidic gases such as sulfur dioxide, nitrogen oxides, carbon monoxide emitted from combustion processes in drops of water creating fog.
The opposite of acid smog is photochemical smog. It arises primarily in the summer months, in subtropical zones, with intense sunlight and air temperature above 30 °C [
11,
12,
13,
14]. The main components of photochemical smog are nitrogen oxides, carbon monoxide and hydrocarbons, and most of all ozone formed as a result of a series of photochemical reactions.
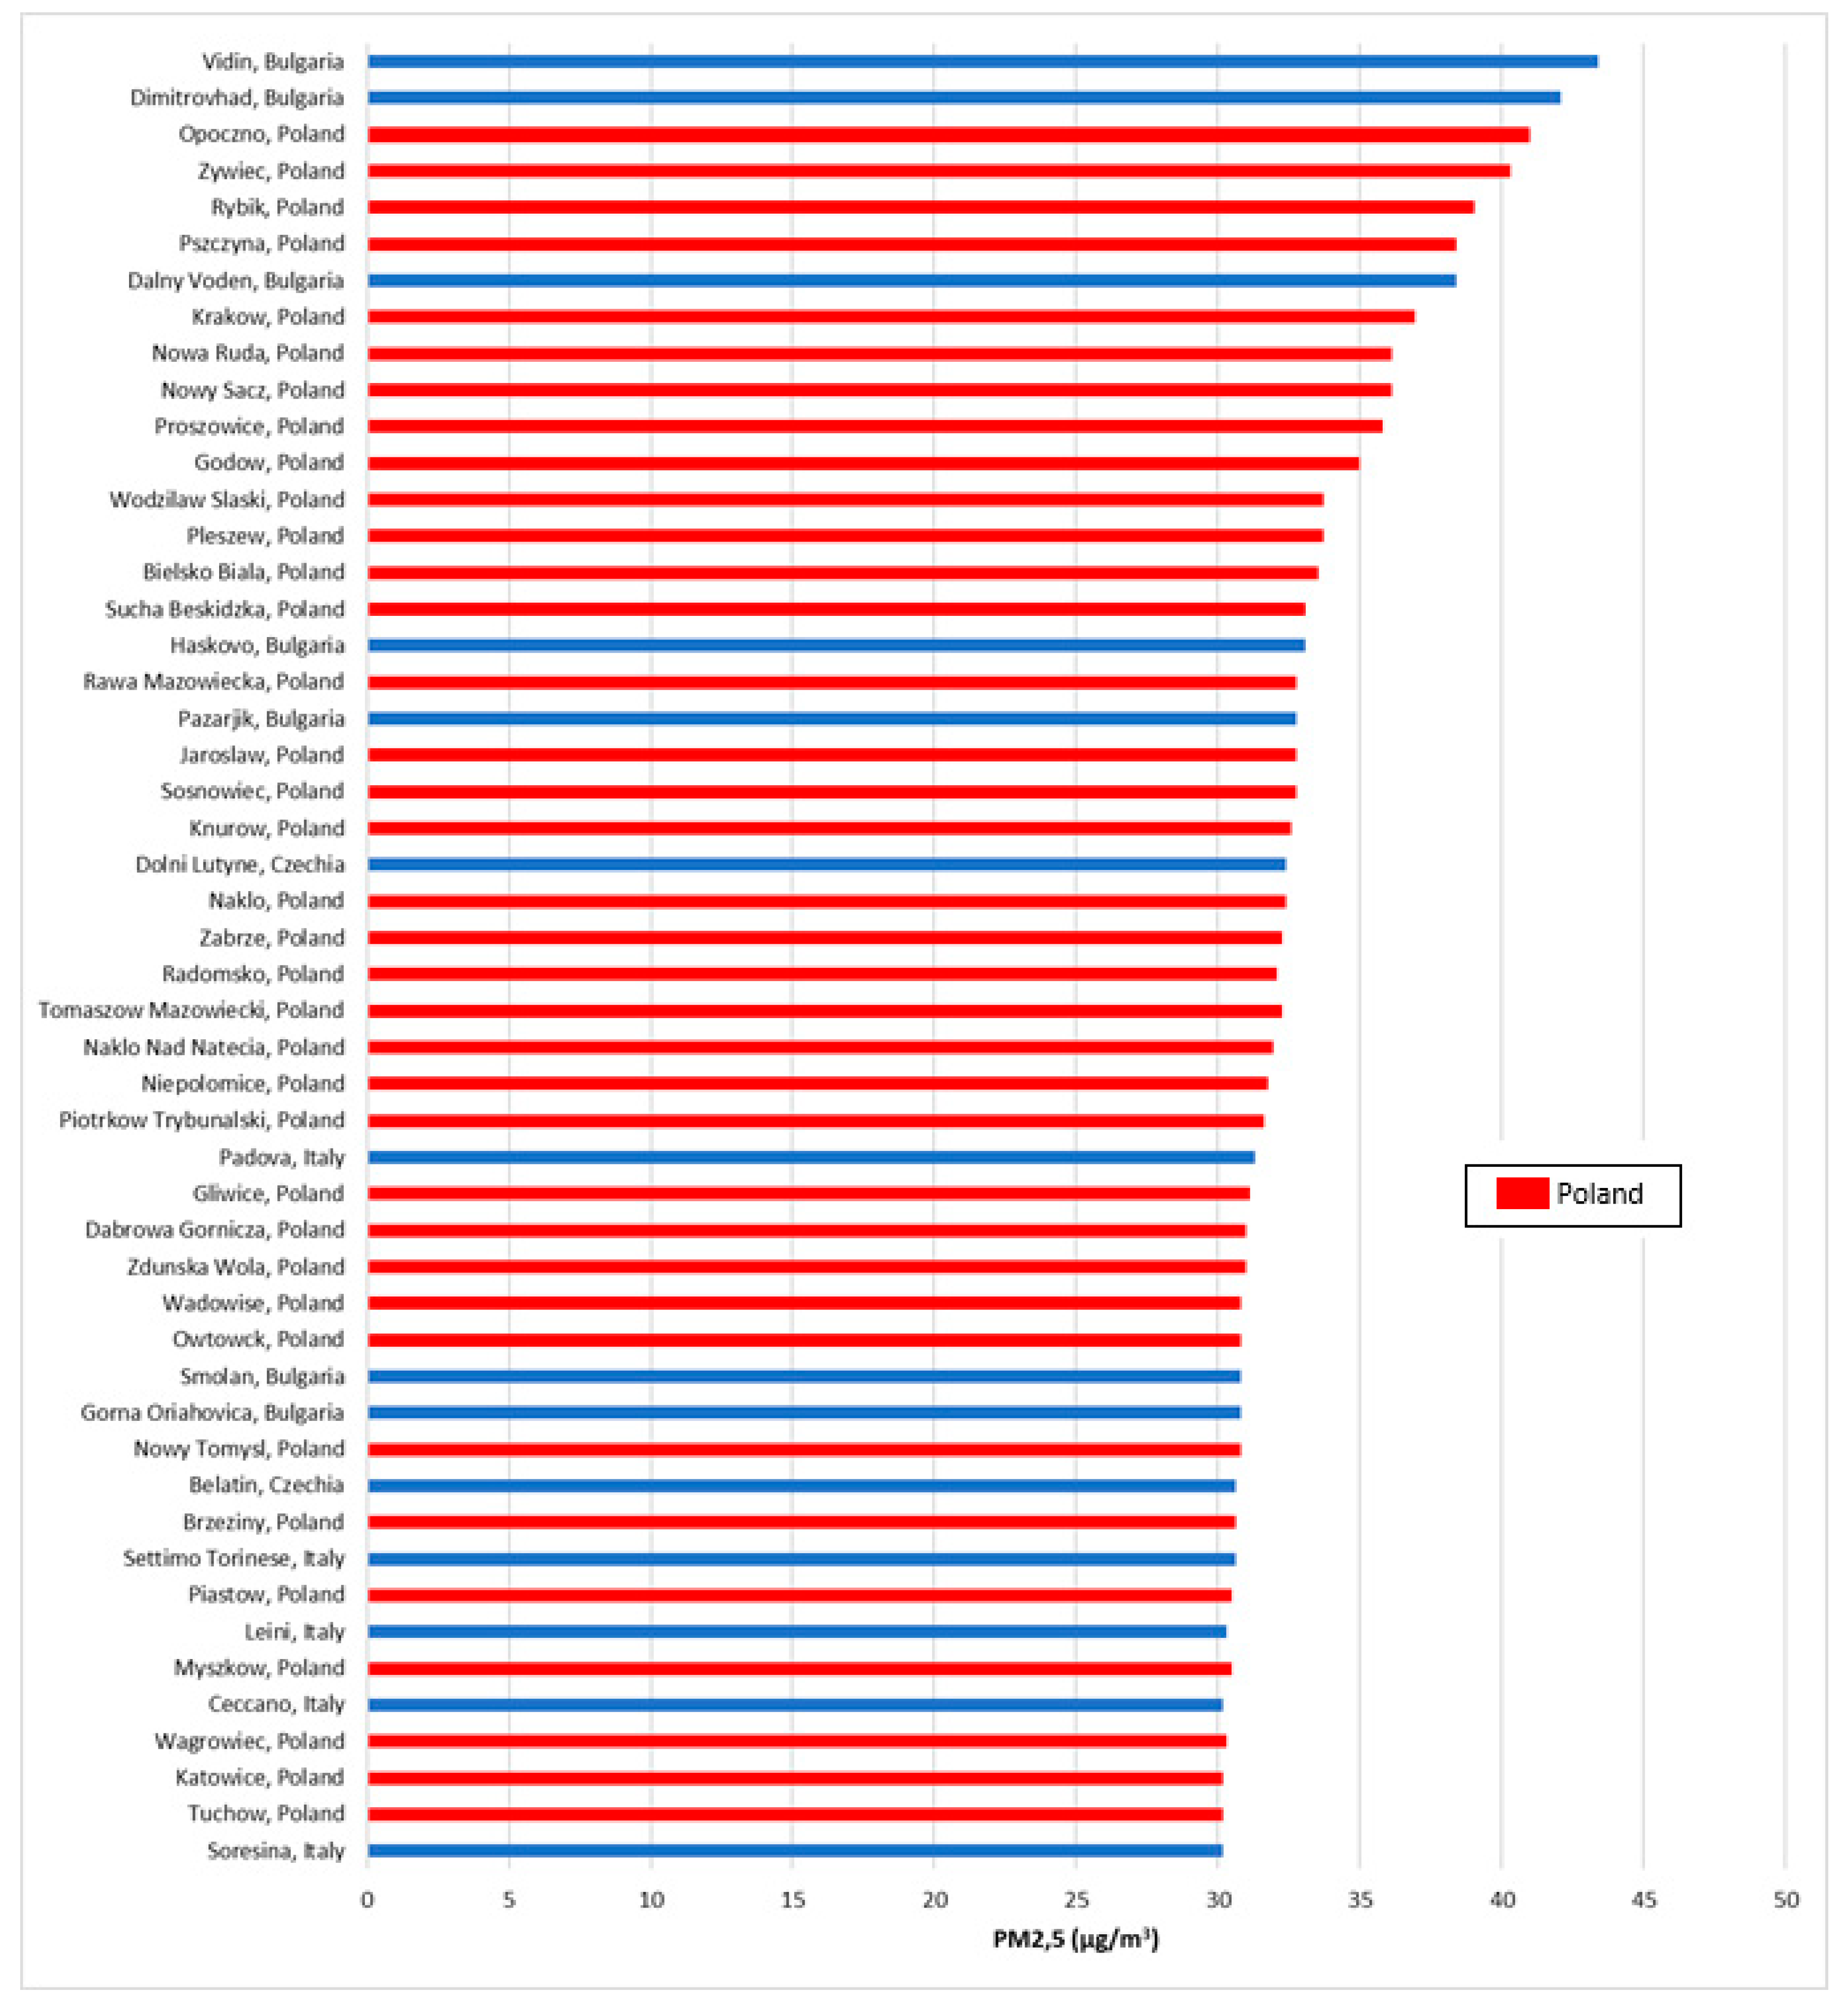
Many countries and cities struggle with the problem of smog. In Poland this problem also exists. The highest above-average concentrations are achieved by the following pollutants: particulate matter, benzo(a)pyrene and nitrogen dioxide. While the concentrations of particulate matter and benzo(a)pyrene exceed norms practically throughout the country in large cities and also in smaller towns, the problem of nitrogen dioxide occurs only in the largest cities at busy communication arteries. This is due to the fact that the dominant source of particulate matter and benzo(a)pyrene are domestic furnaces–coal- and wood-fired boilers, and of nitrogen dioxide–cars. In 2018, the World Health Organization published a report on air quality in Europe. In terms of PM2.5, as many as 36 of the 50 most polluted cities in the European Union are in Poland (
Figure 1).
Based on observations made in Poland for several years, it can be concluded that there is another type of smog characteristic of Poland, which can be described as dust smog or “Polish smog”–a term recently coined in the literature [
15,
16,
17]. Polish smog is characterized by different atmospheric conditions in which it arises. It also has a different composition than London smog where there is a high concentration of sulfur dioxide and carbon monoxide, as well as PM10. The conditions for the formation of Polish smog is discussed in detail later in the article.
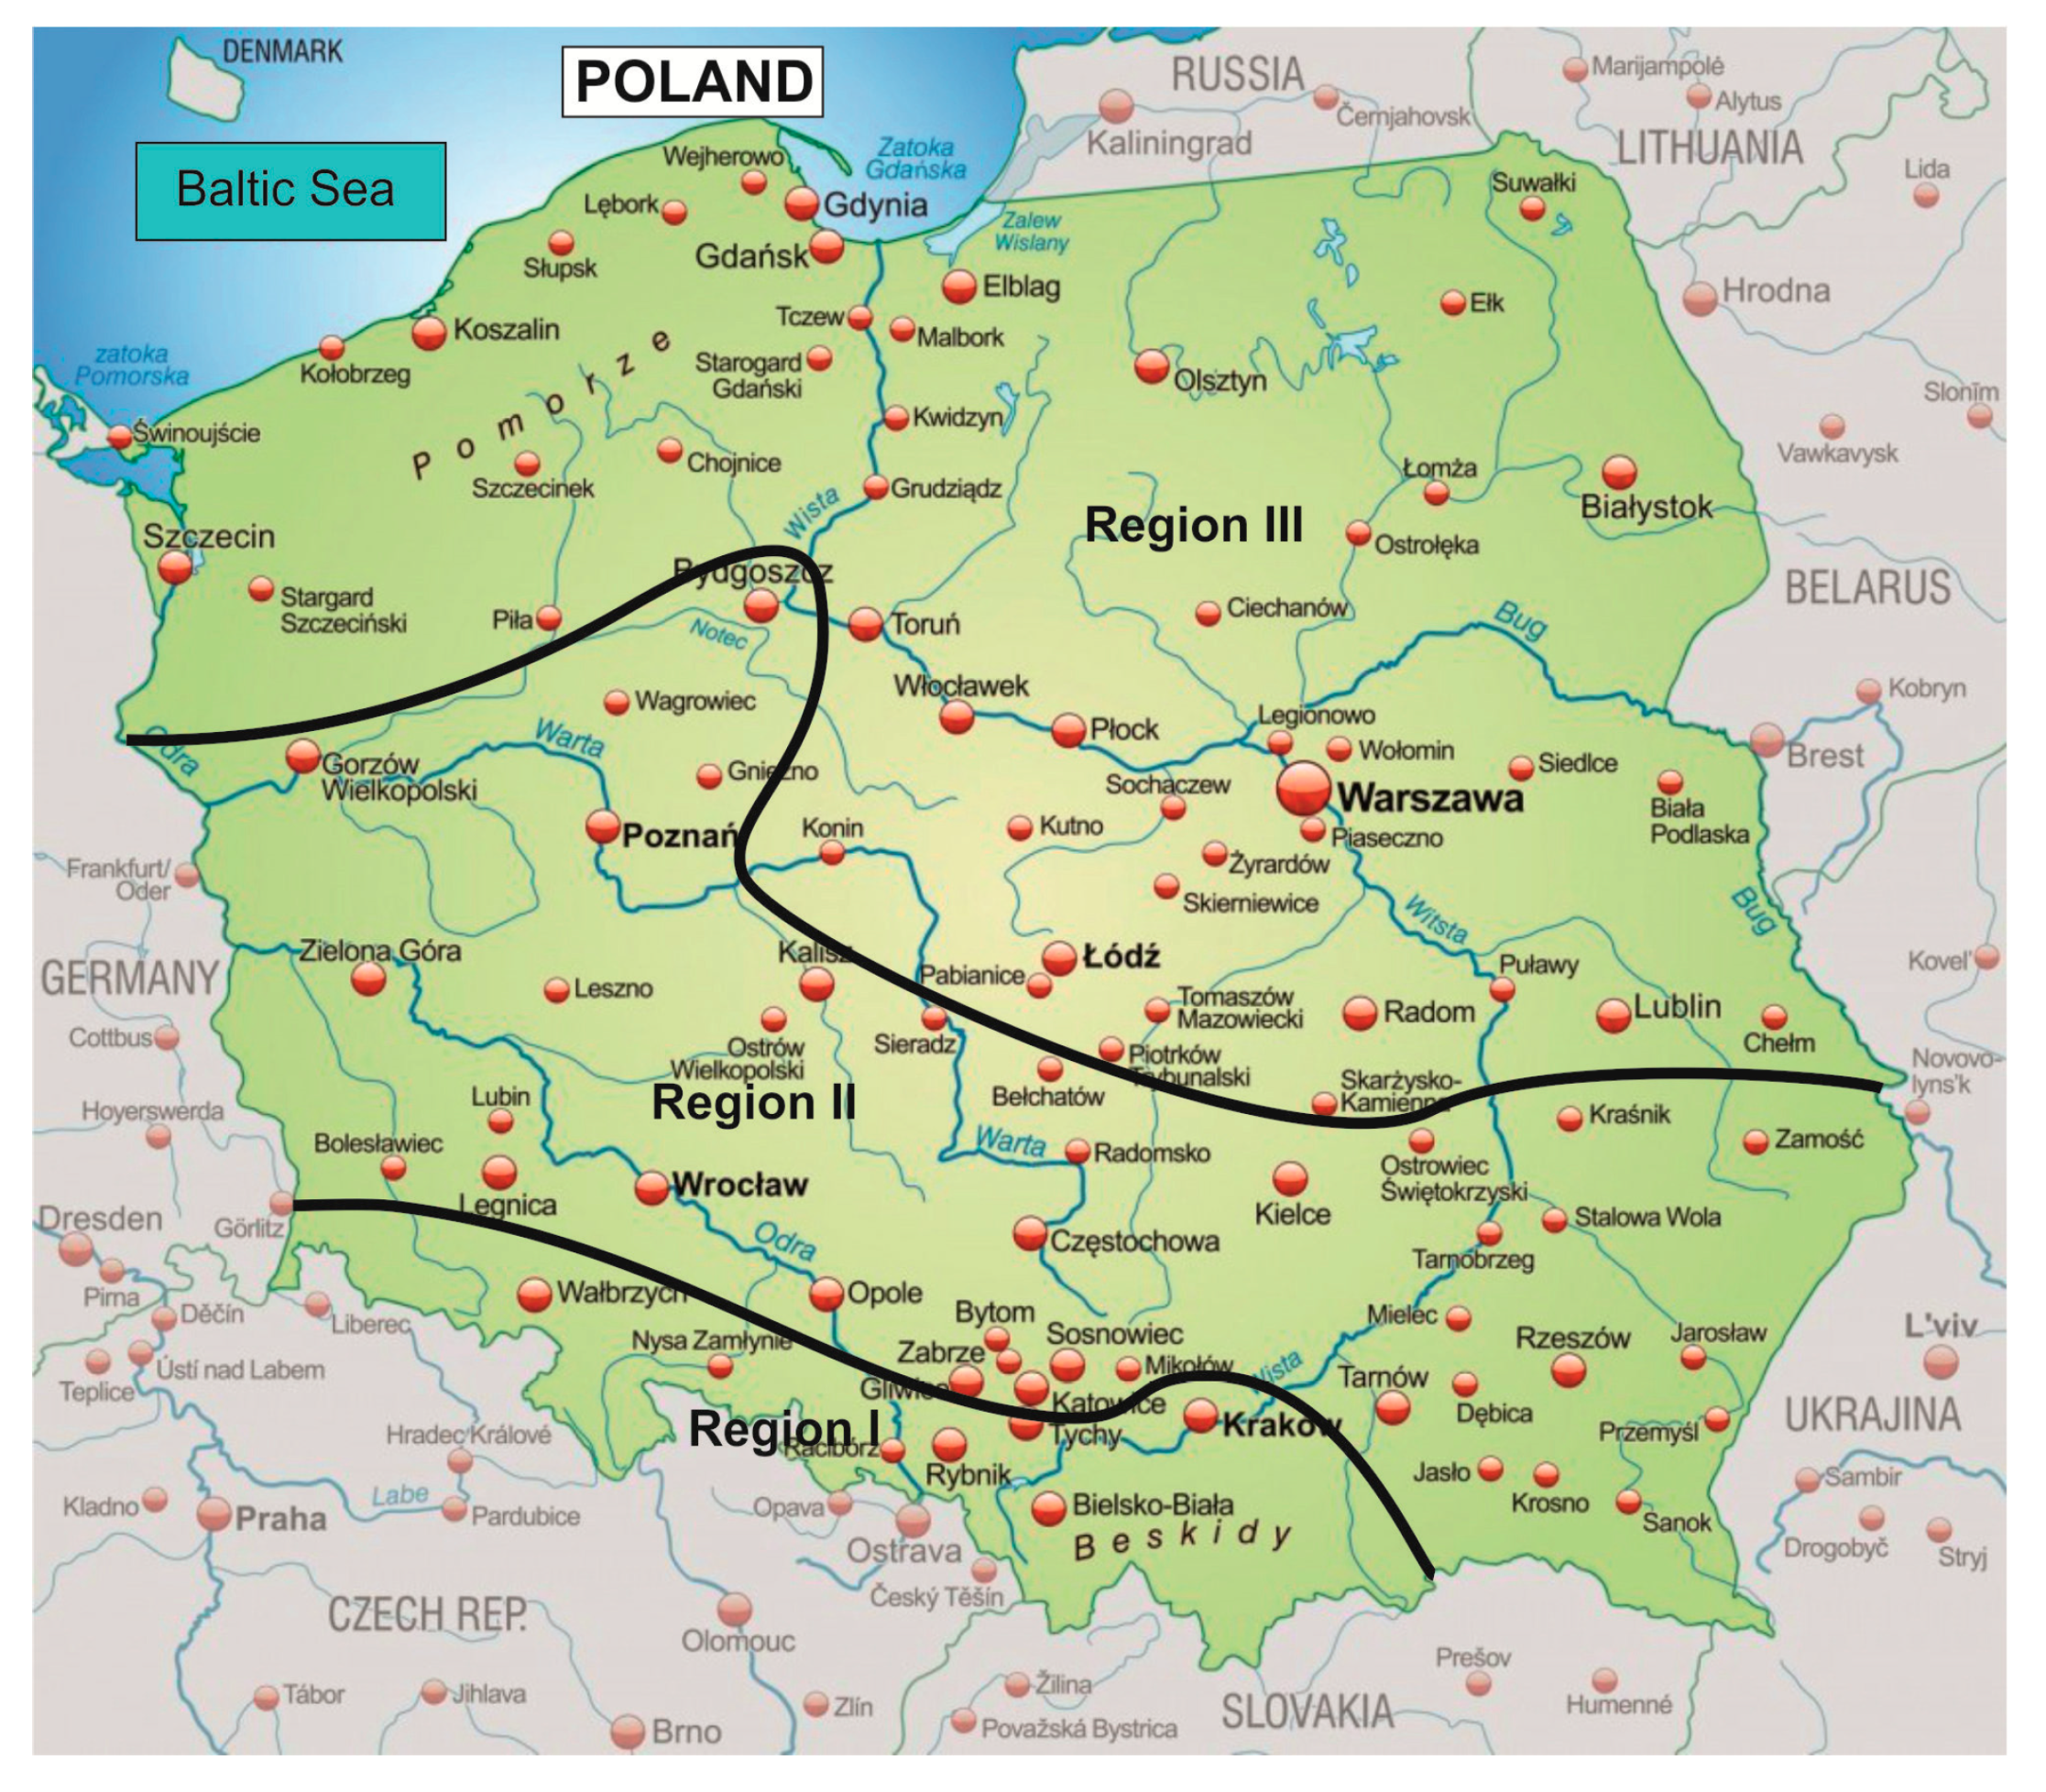
In 2018, Rawicki et al. [
19] showed that due to meteorological conditions and the occurrence of smog episodes, Poland could be divided into three areas: I—southern, in which smog episodes last the longest and occur most often, II—central with moderate frequency of smog episodes and III—northern, where smog episodes occur sporadically. This is due to the fact that a constant balance dominates in the southern part of Poland, and a much larger share of unstable balance occurs in the northern part [
20,
21]. The division of Poland according to the frequency of smog episodes is shown in
Figure 2.
2. Experimental
The high and very high concentrations of dust pollution observed in Poland in the winter season for several years, both PM10 and PM2.5, are commonly called smog. However, it seems that this phenomenon differs from the smog episodes described in the literature in the winter (the so-called London-type smog) and in the summer (the so-called Los Angeles-type smog). To verify this hypothesis, it was decided to analyze the conditions for the formation of oversized concentrations of certain air pollutants in Poland using data from State Inspection for Environmental Protection monitoring stations. It was also decided to answer the question why during smog episodes in Poland we do not report exceeding the permissible concentrations of sulfur dioxide (as it happened in 1952 in London), despite the fact that the source of air pollution in winter is solid fuel combustion processes, in Poland, which is primarily coal, wood and partly illegal incineration of municipal waste in household stoves. The main source of poor air quality in Poland is very high concentrations of dust, as well as benzo(a)pyrene, while no exceedances of permitted sulfur dioxide concentrations has been observed. Therefore, the next hypothesis was adopted that ammonia emission from solid fuel combustion processes may be the cause of sulfur dioxide binding in the form of ammonium sulfate. The results of our investigations on combustion processes showed that such ammonia emissions occur during the combustion of coal, biomass and sewage sludge as well. Therefore, available literature data on the chemical composition of PM10 and PM2.5 dust present in high concentrations in atmospheric air in some Polish cities was analyzed. The results of the analysis confirmed the adopted research hypotheses, which is presented in the later part of this publication.
The first step in determining how the Polish smog differed from others known from the literature was the analysis of meteorological conditions conducive to its formation. To check how exactly they influence this process, an analysis was carried out of four major Polish cities: Gdańsk, Łódź, Zabrze and Kraków. Gdańsk located in Northern Poland lies on the Baltic Sea, Łódź is in the center of the country, and Zabrze and Kraków, one of the most polluted cities in Poland, are in its southern part. Based on the data of the Chief Inspectorate for Environmental Protection in Poland, the emission information on PM10 was collected and compared with the prevailing atmospheric conditions (air temperature and atmospheric pressure). The recorded hourly concentrations and meteorological parameters such as pressure and temperature come from stationary stations for continuous air quality monitoring located in the analyzed cities.
3. Results
The analysis covered data from the winter seasons in the years 2014 to 2017. PM10 mass concentration data (one-hour values) and meteorological data included the months January, February, March and December. The same relationships were observed in all analyzed cases, which is why the results for 2017 are discussed in this publication.
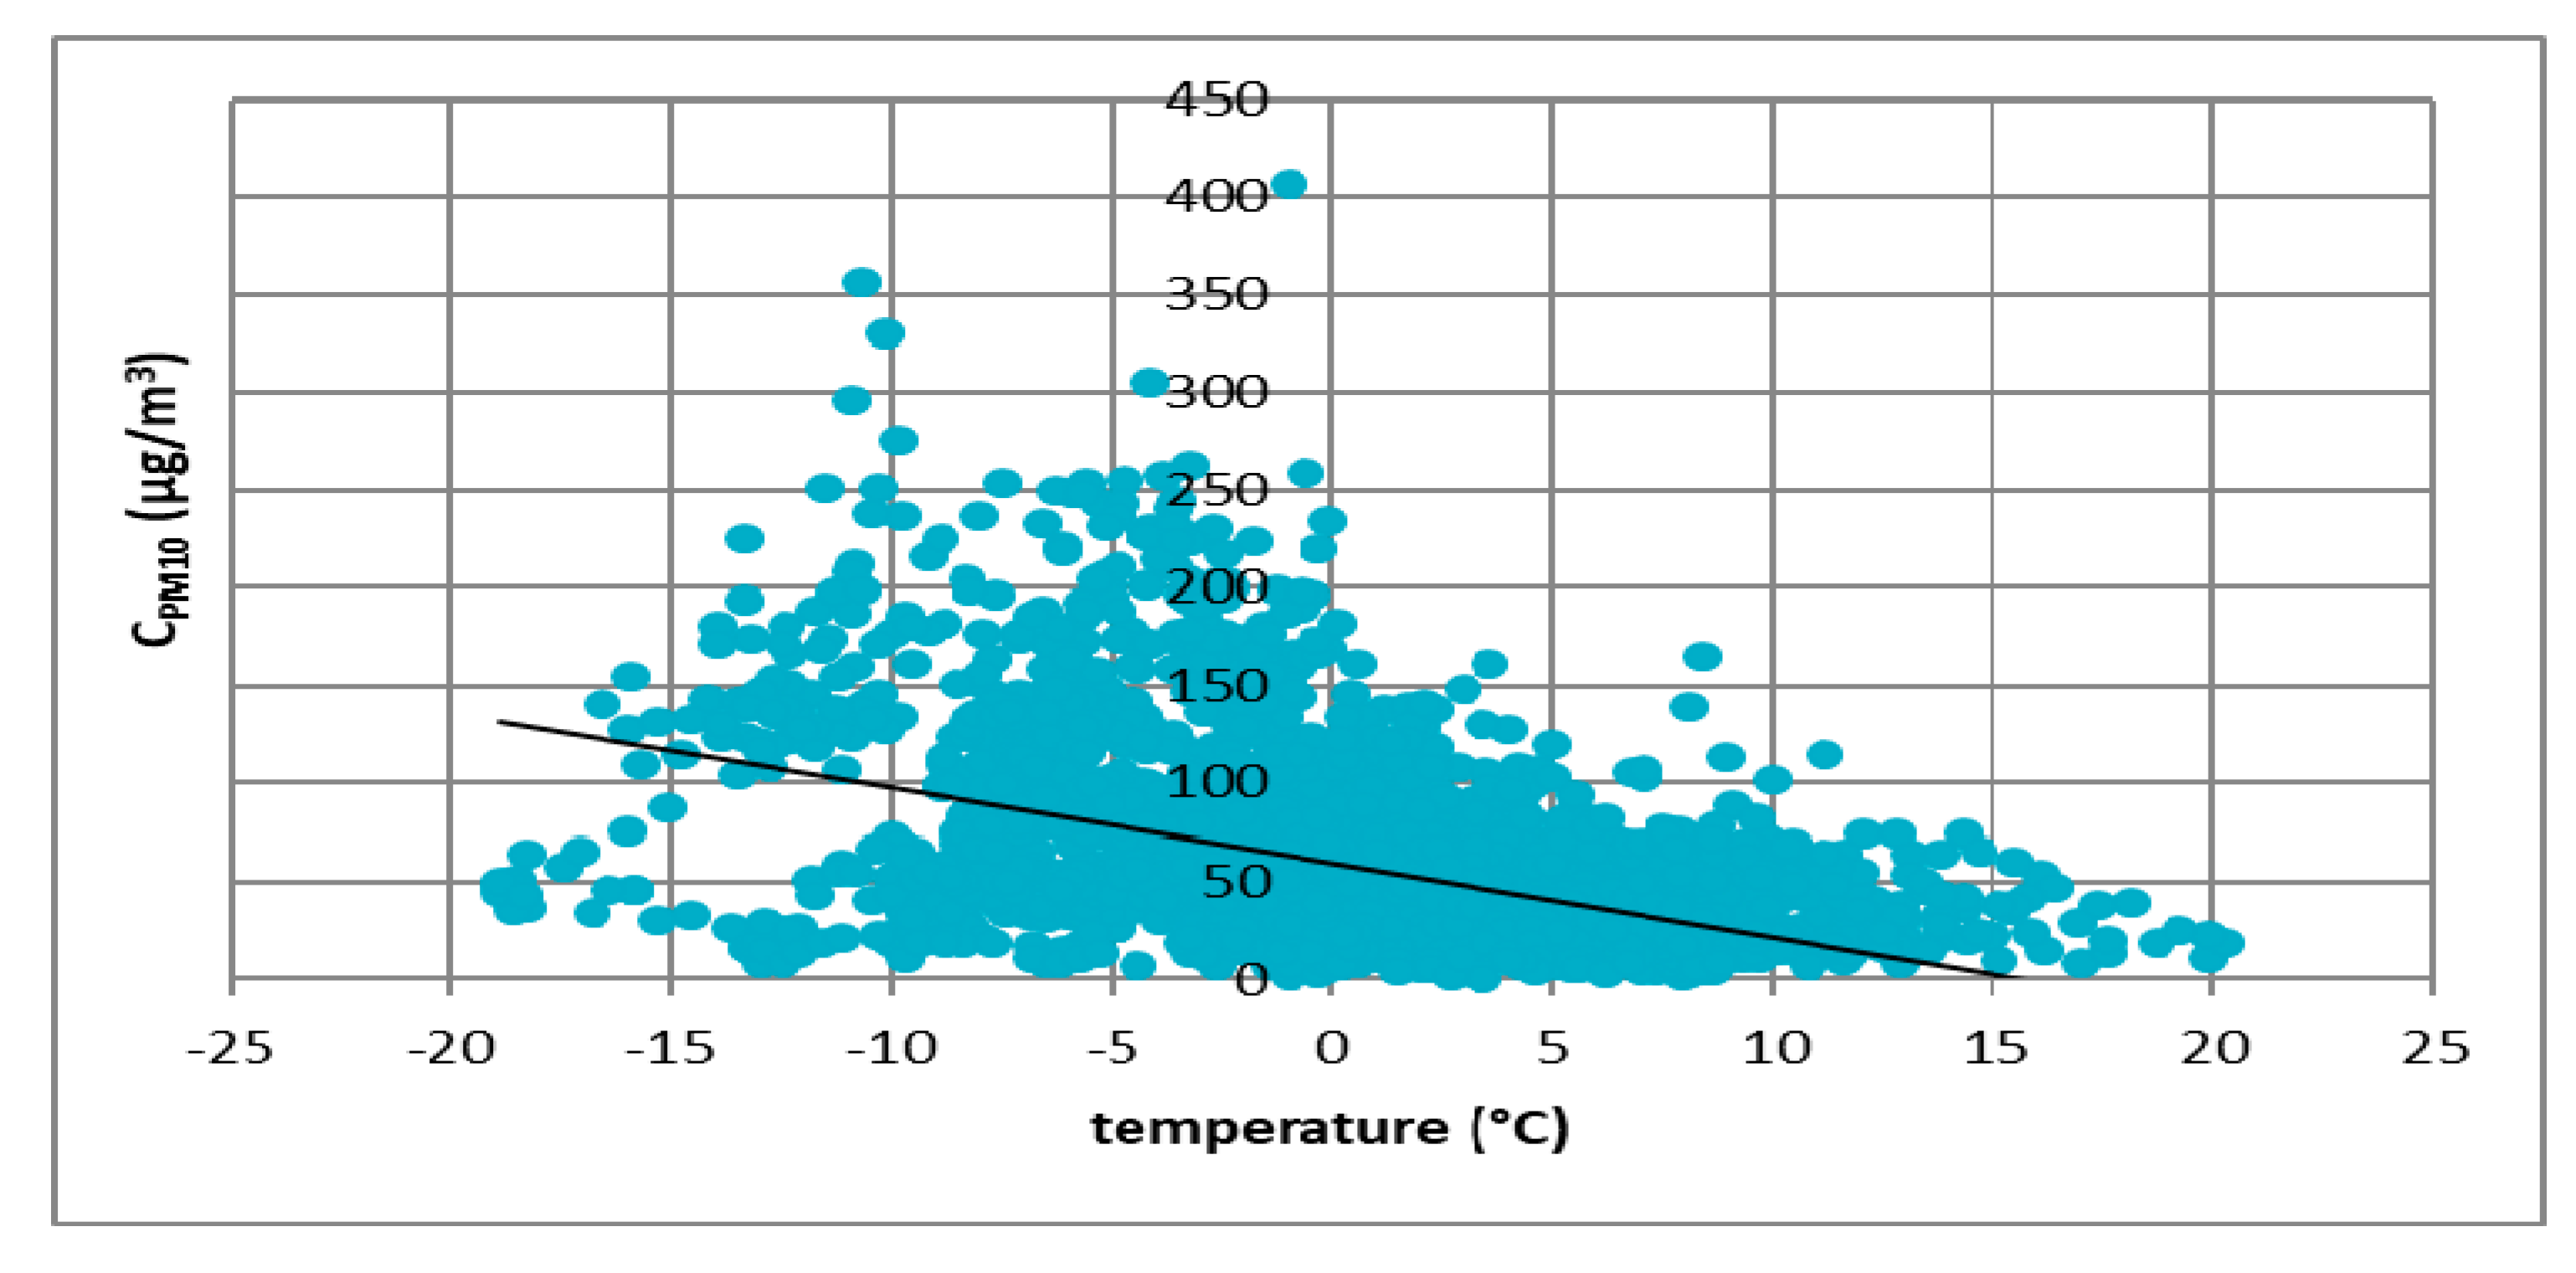
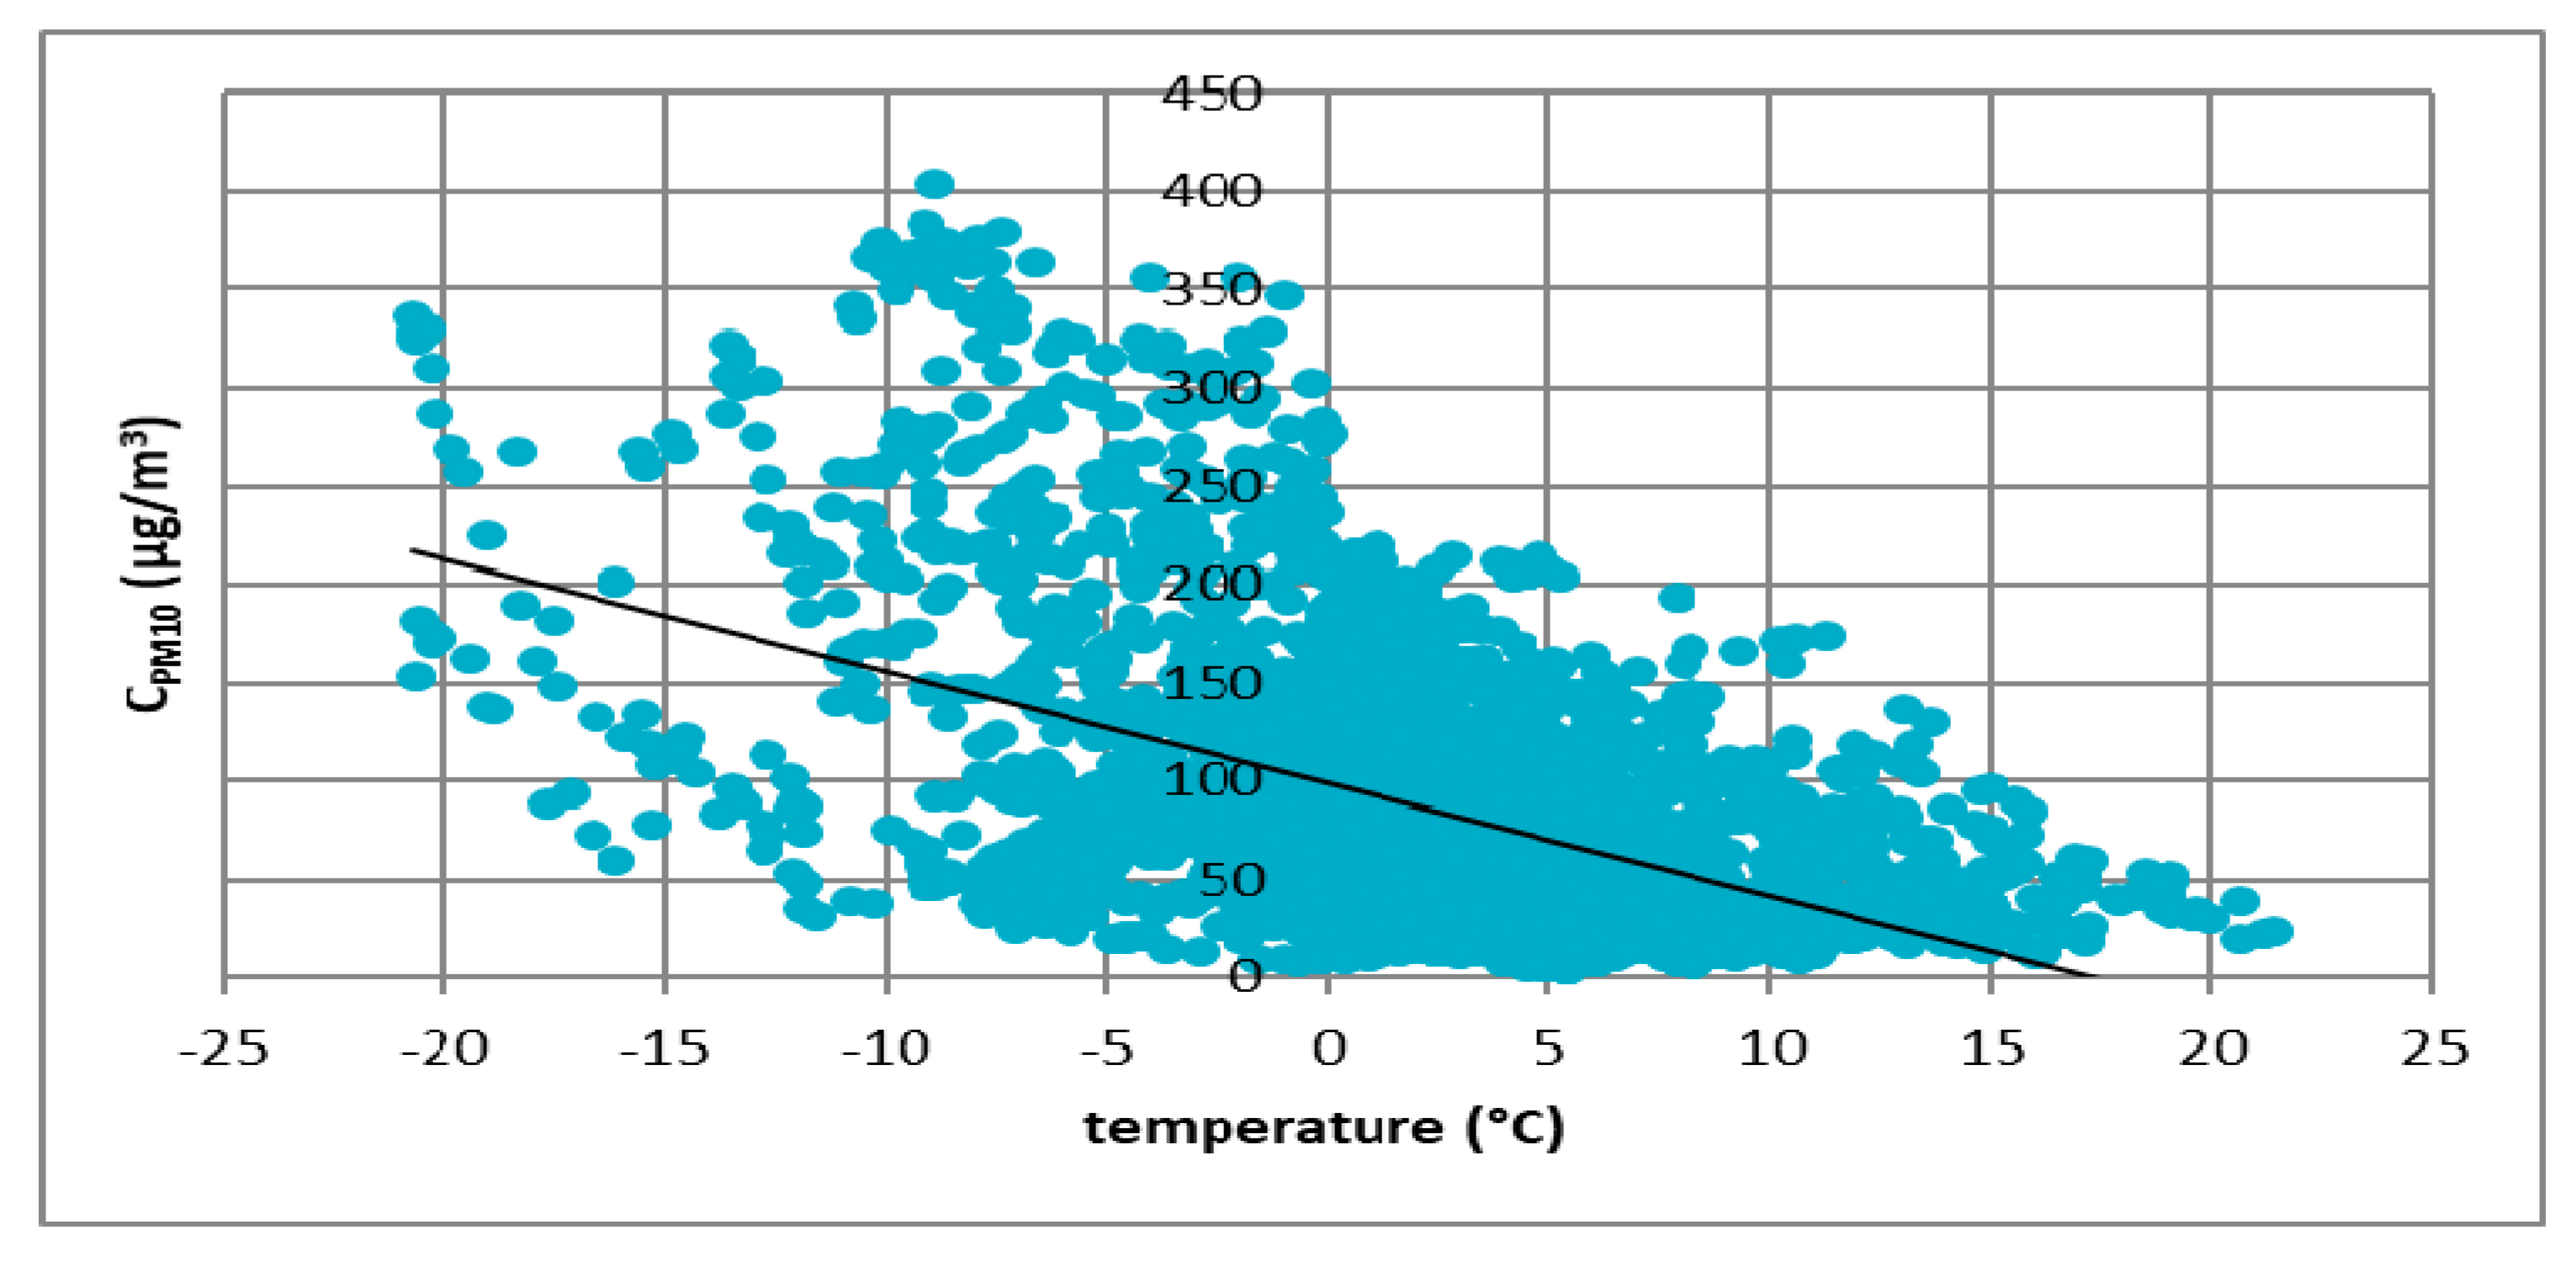
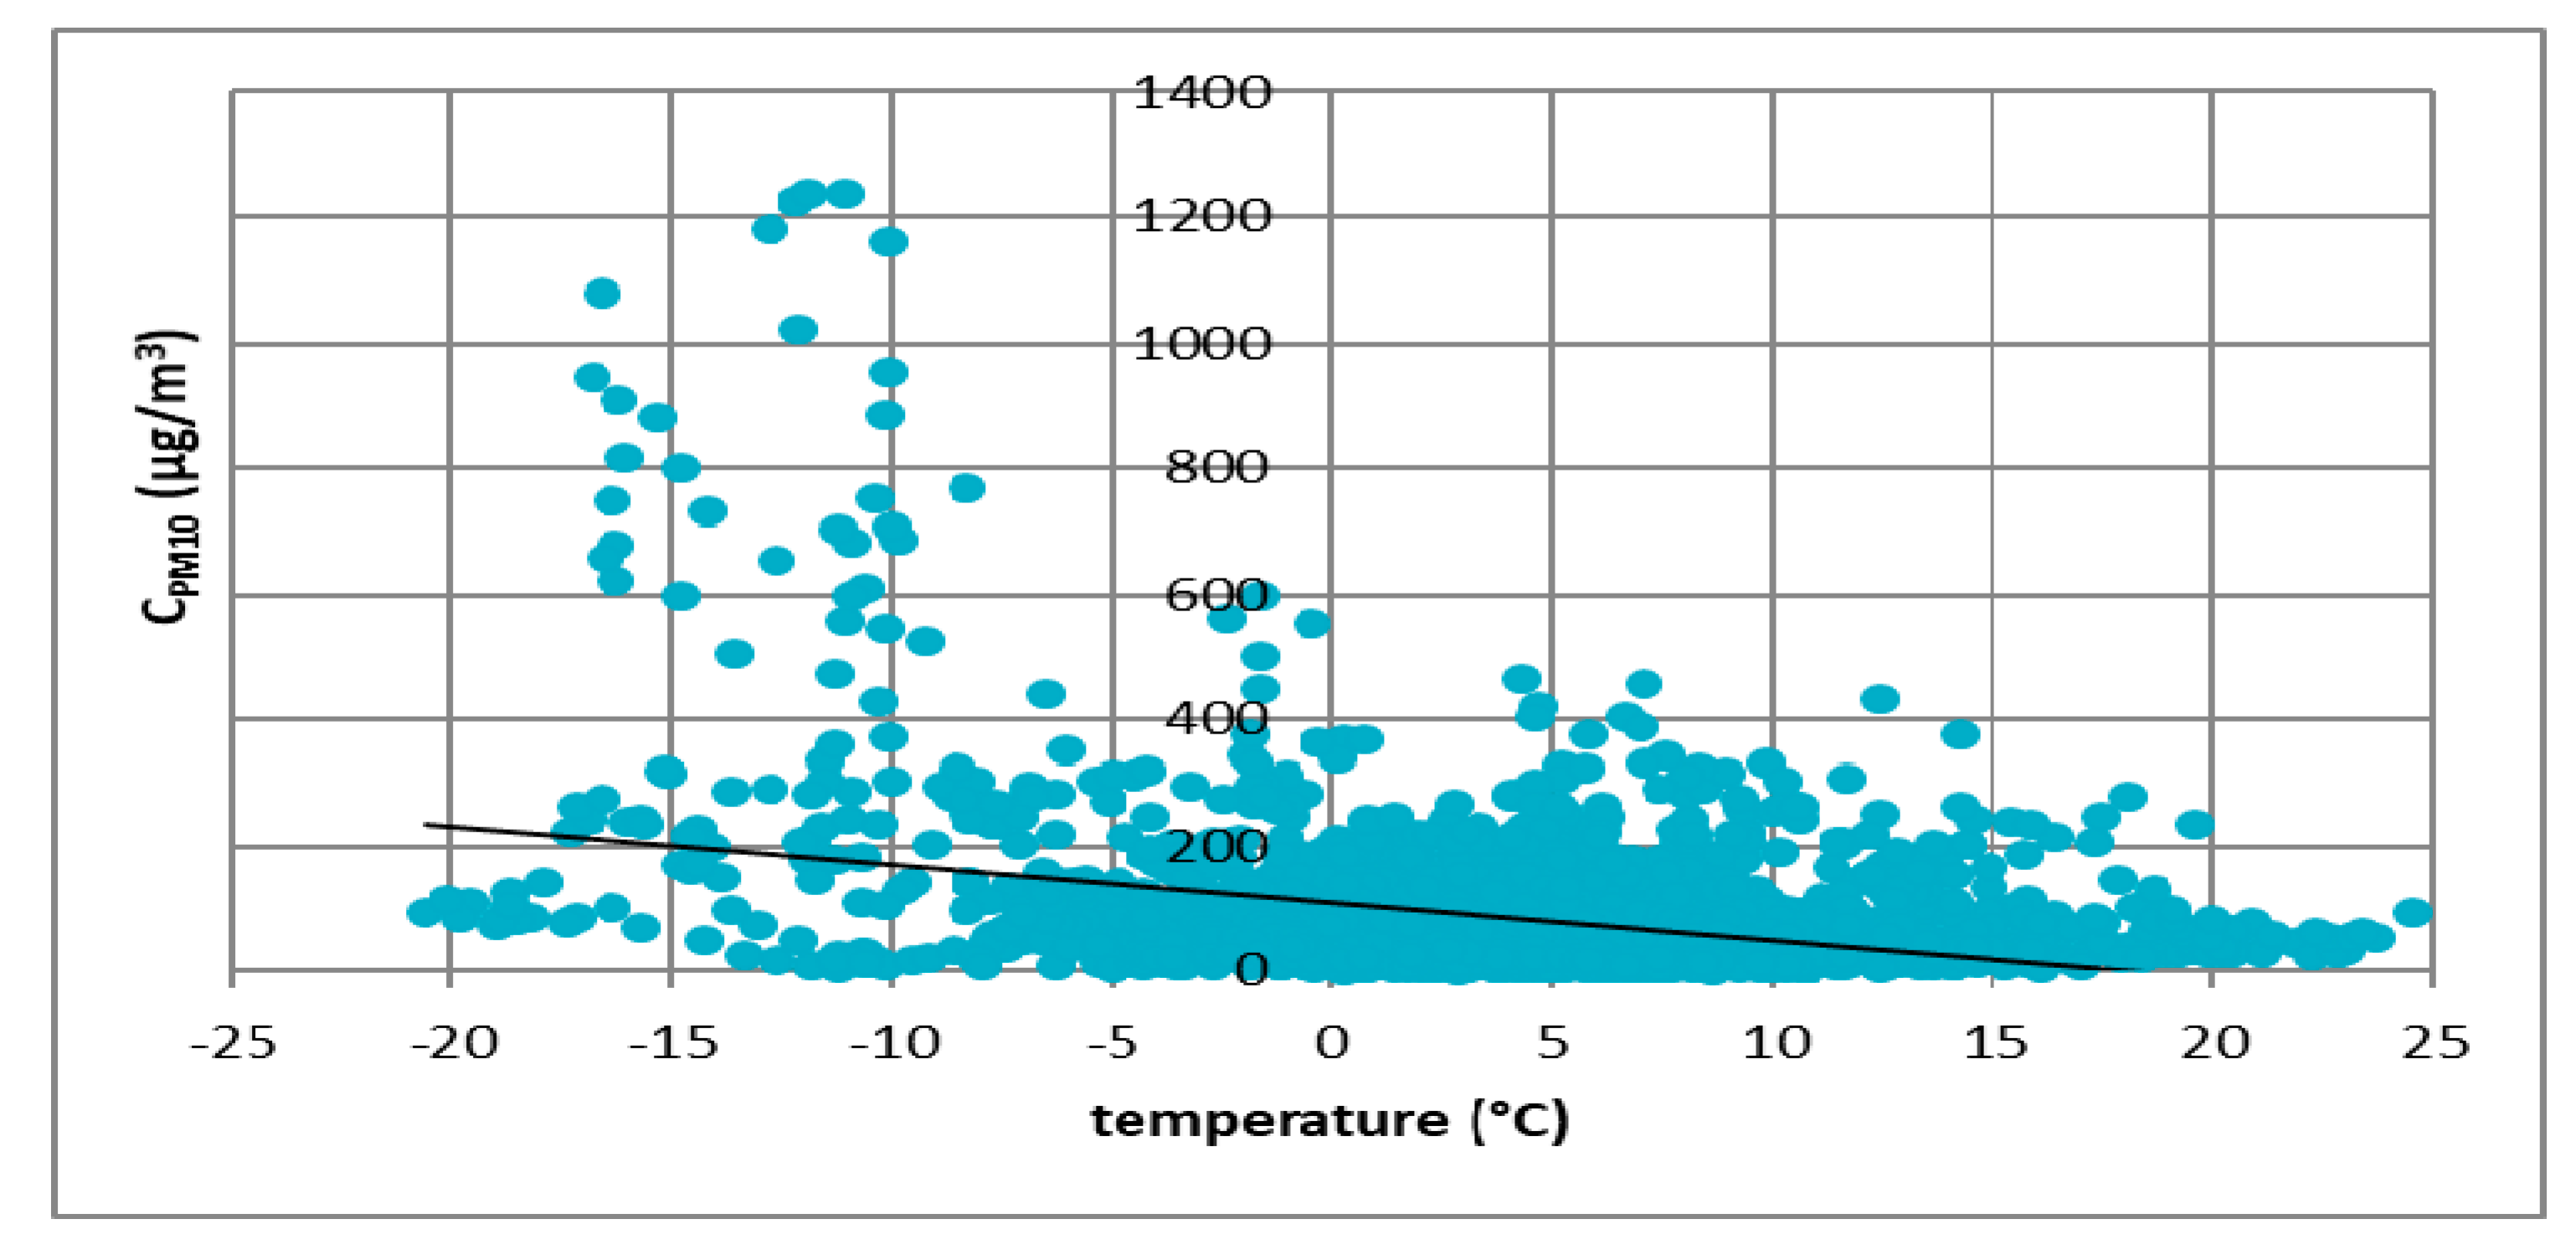
The first atmospheric factor that was taken into account was the air temperature. Results of the analyzes for all cities are presented in
Figure 3,
Figure 4,
Figure 5 and
Figure 6.
These figures show the effect of temperature on PM10 concentration. In all cases, it was found that the PM10 concentration decreased as the temperature increased. The highest concentrations of PM10 were observed in the temperature range of −10 to 0 °C.
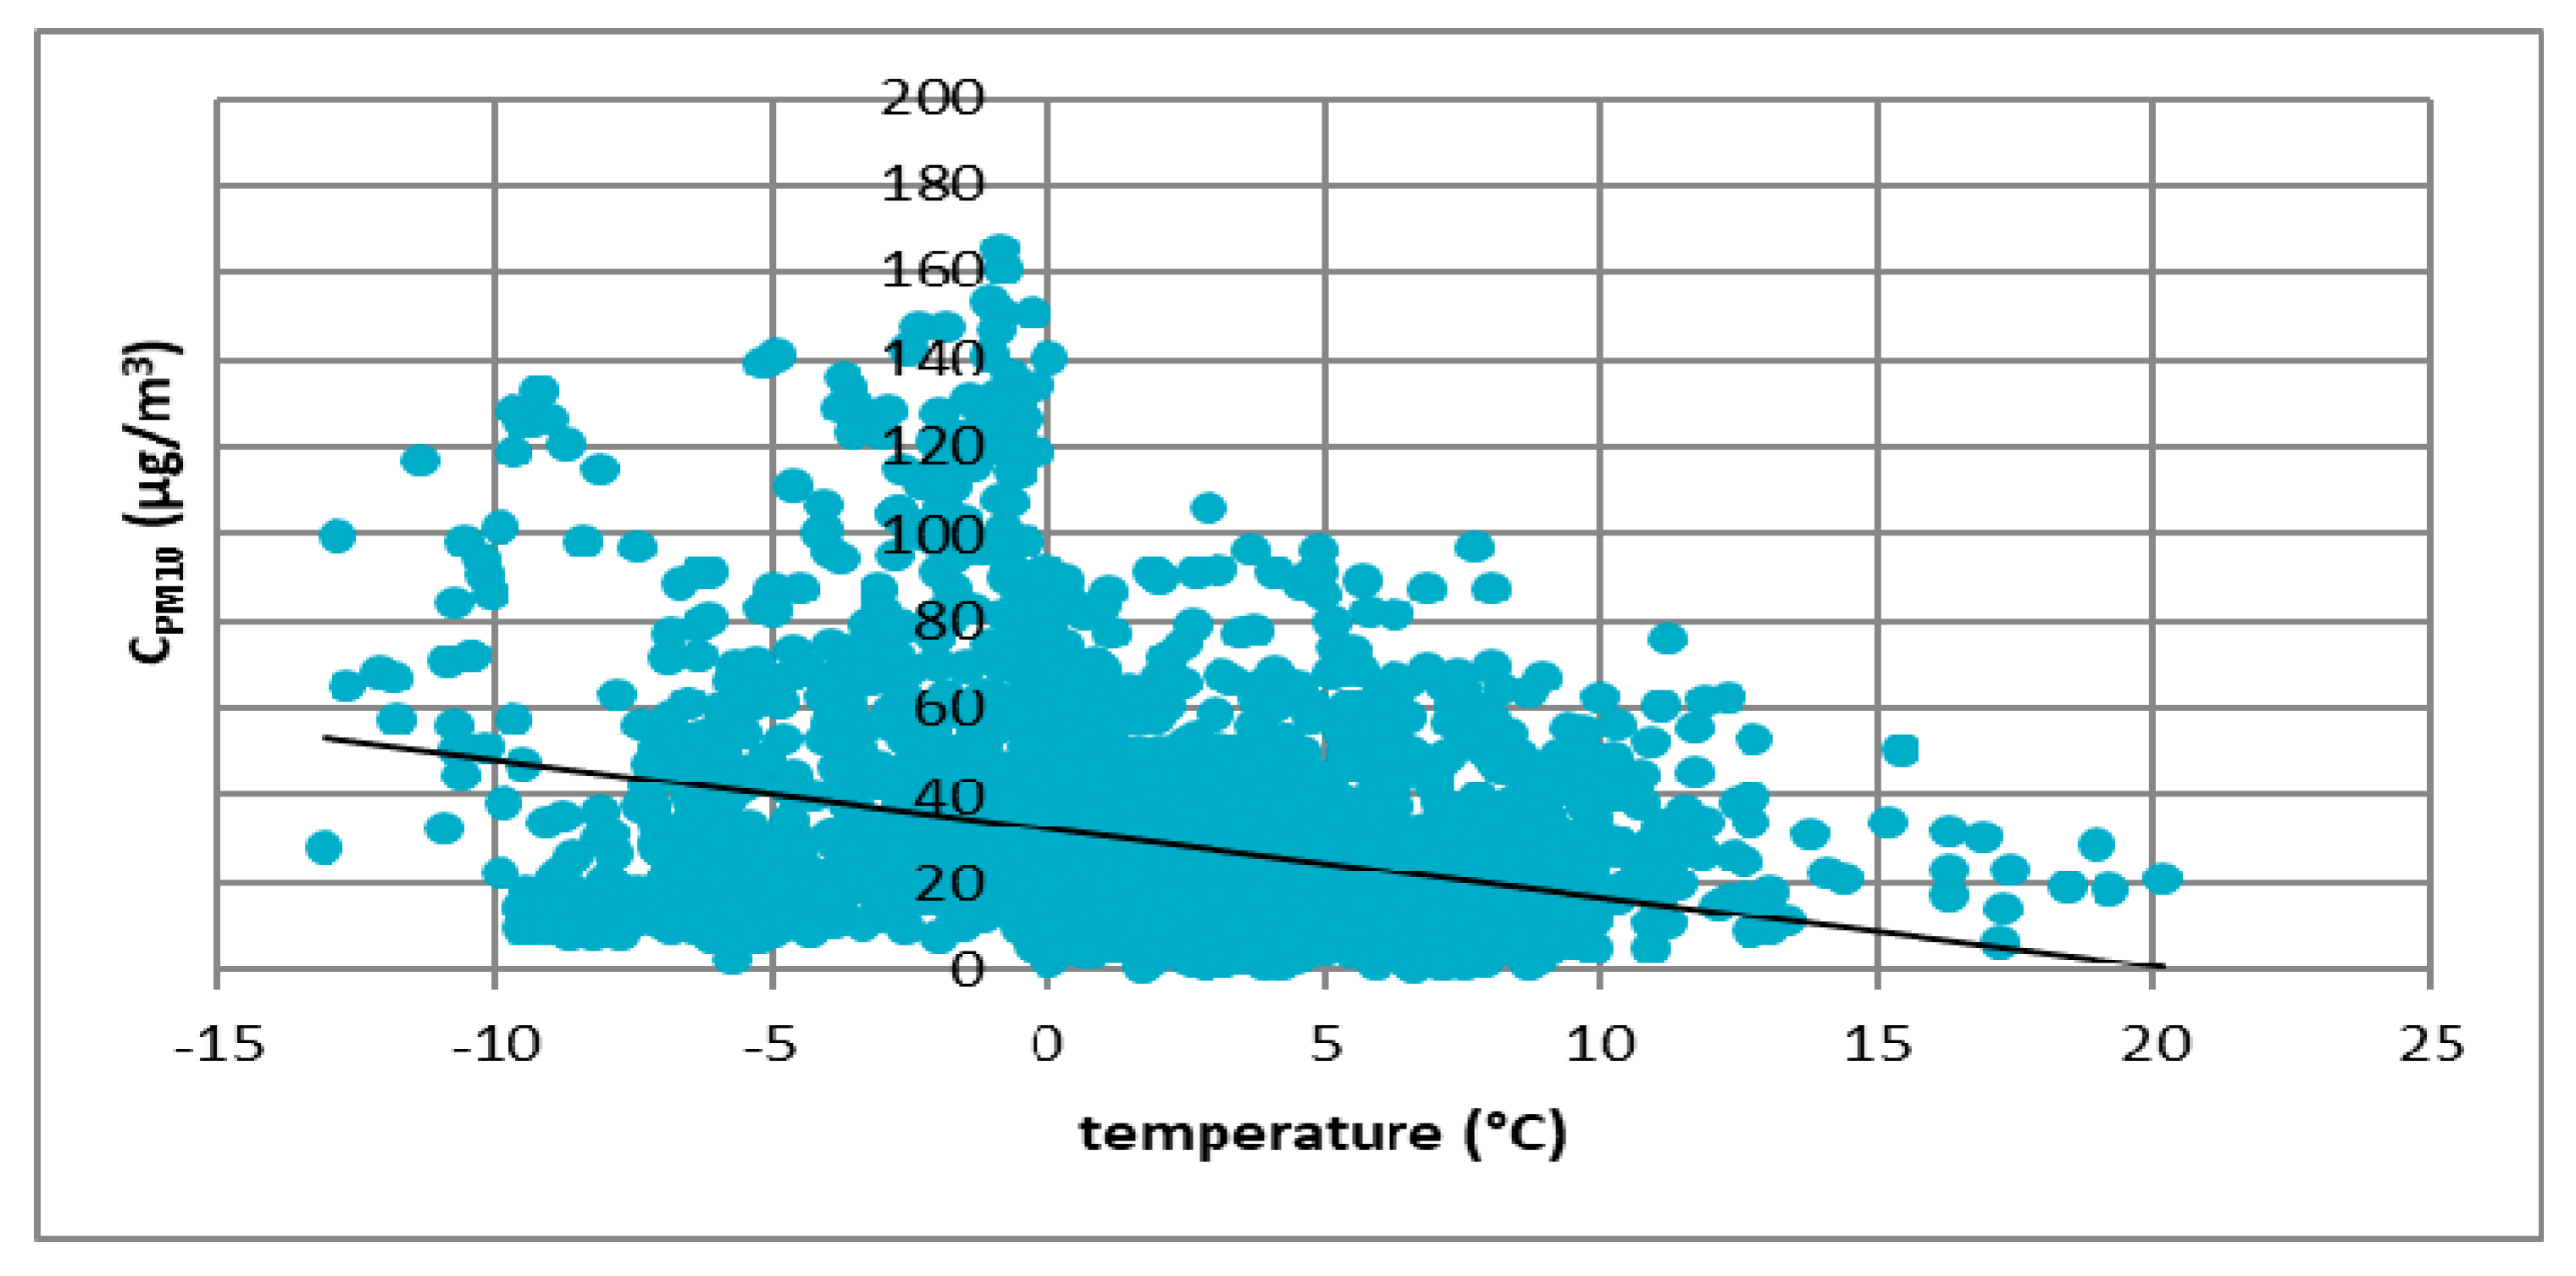
Figure 3,
Figure 4,
Figure 5 and
Figure 6 show the effect of temperature on PM10 concentration. In all cases, it was found that the PM10 concentration decreased as the temperature increased. The highest concentrations of PM10 were observed in the temperature range of −5 to 0 °C.
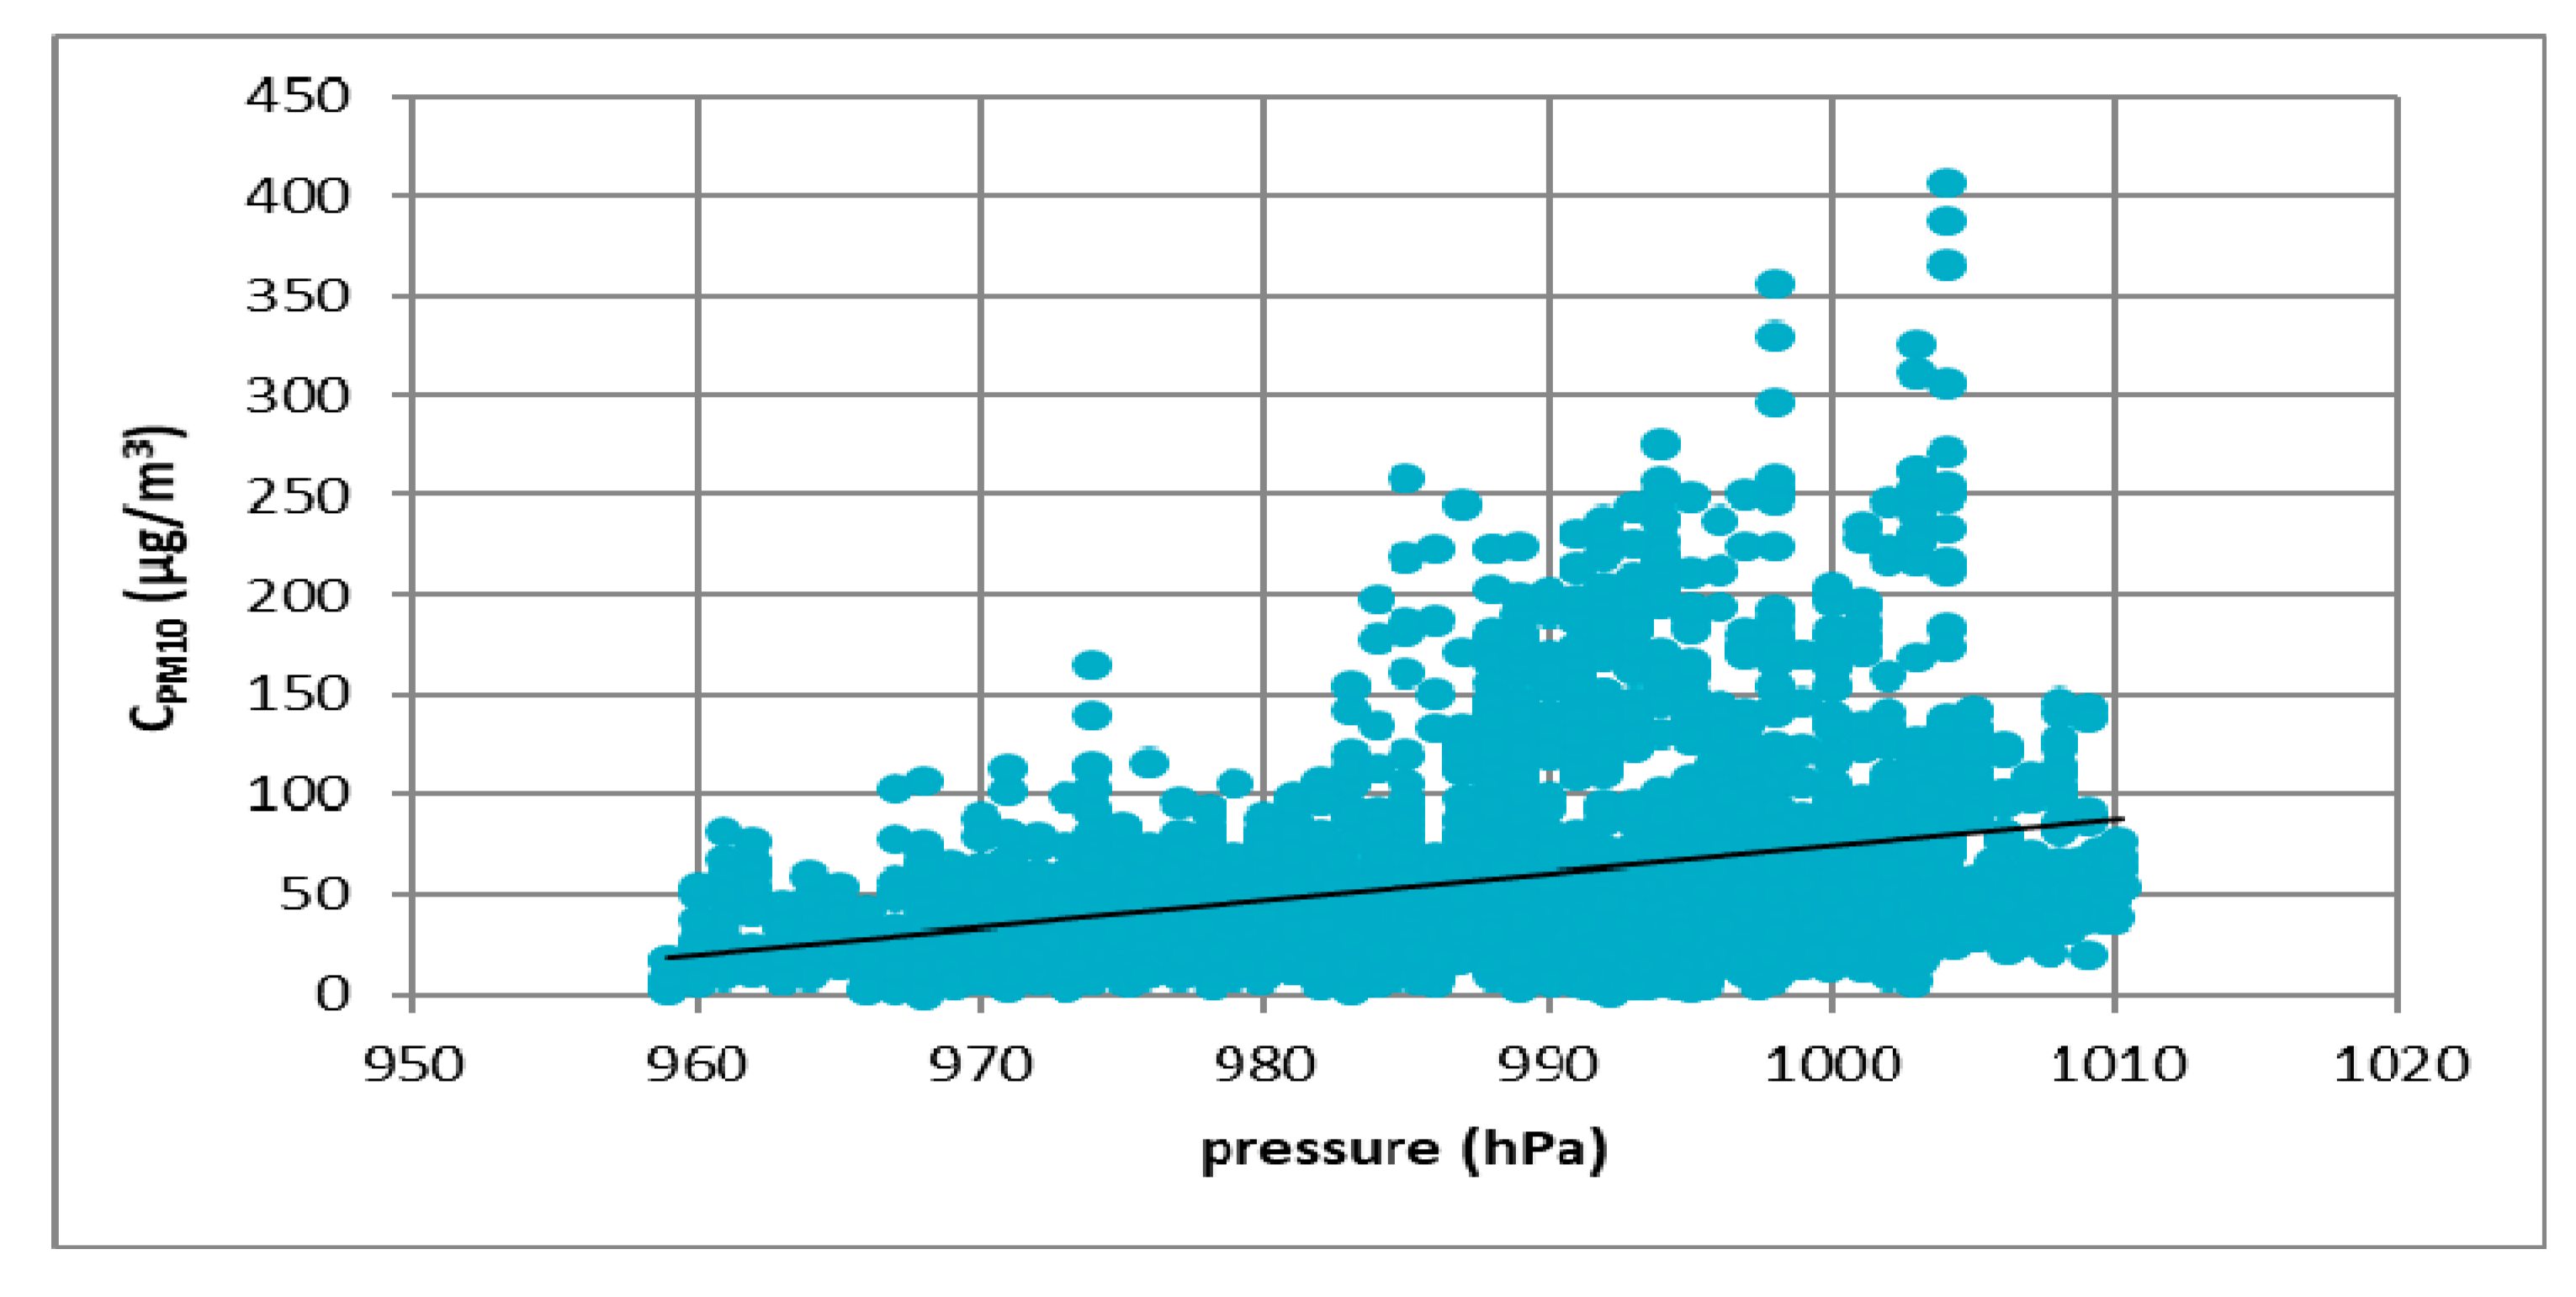
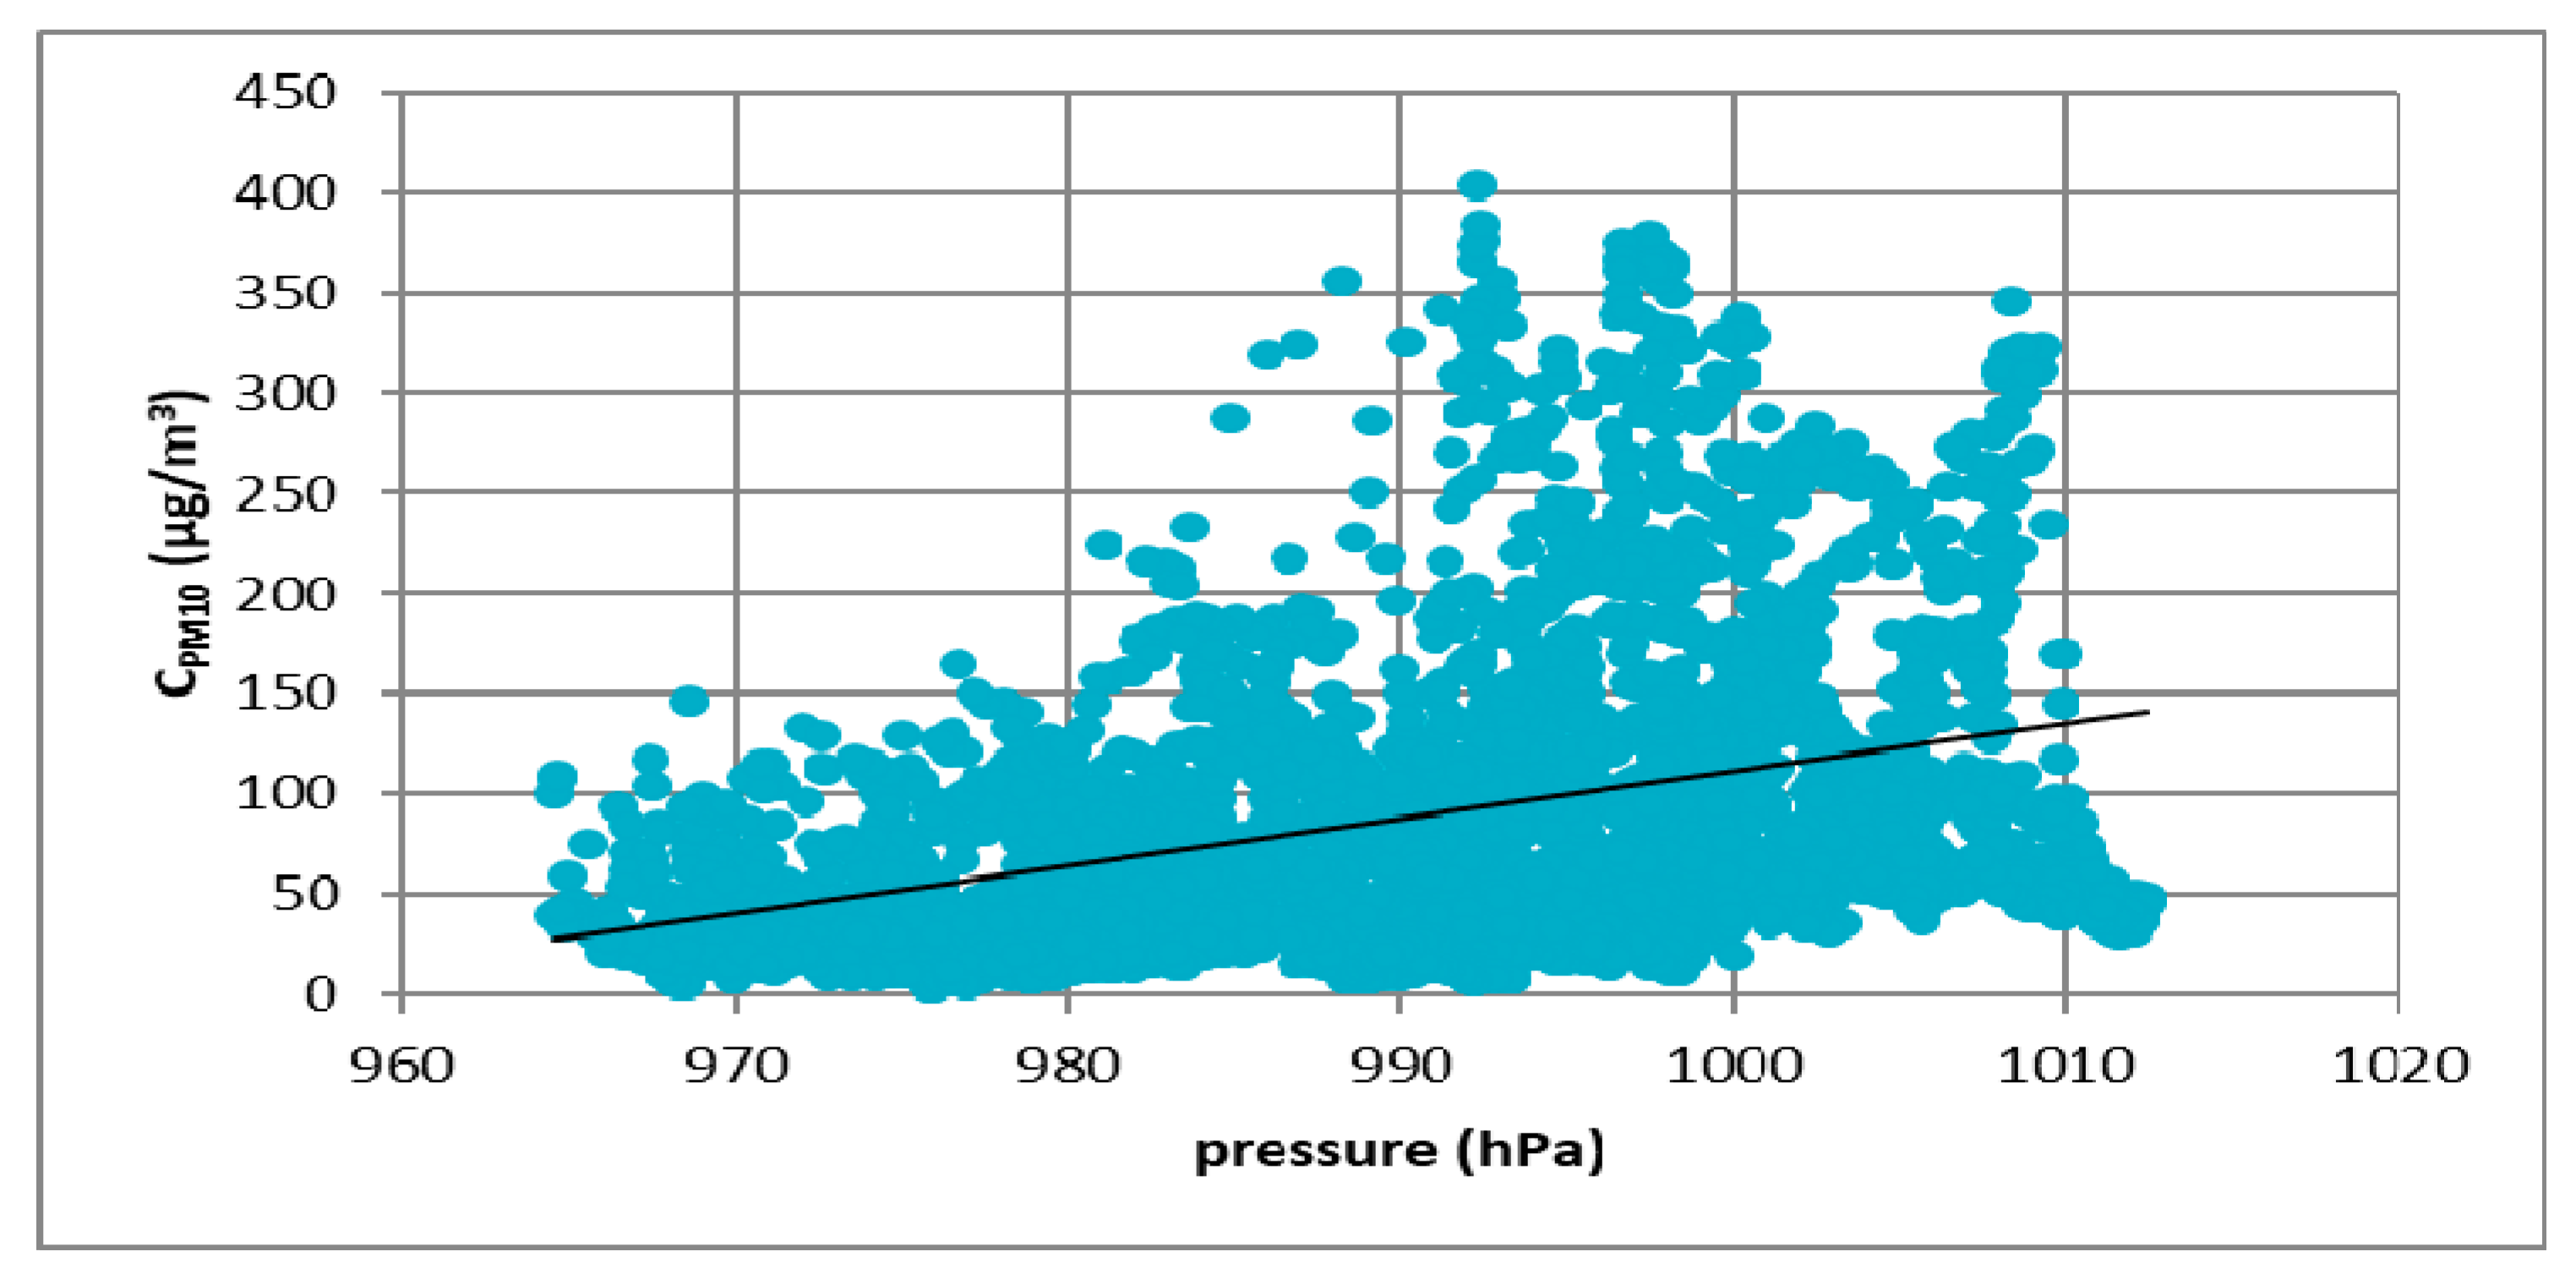
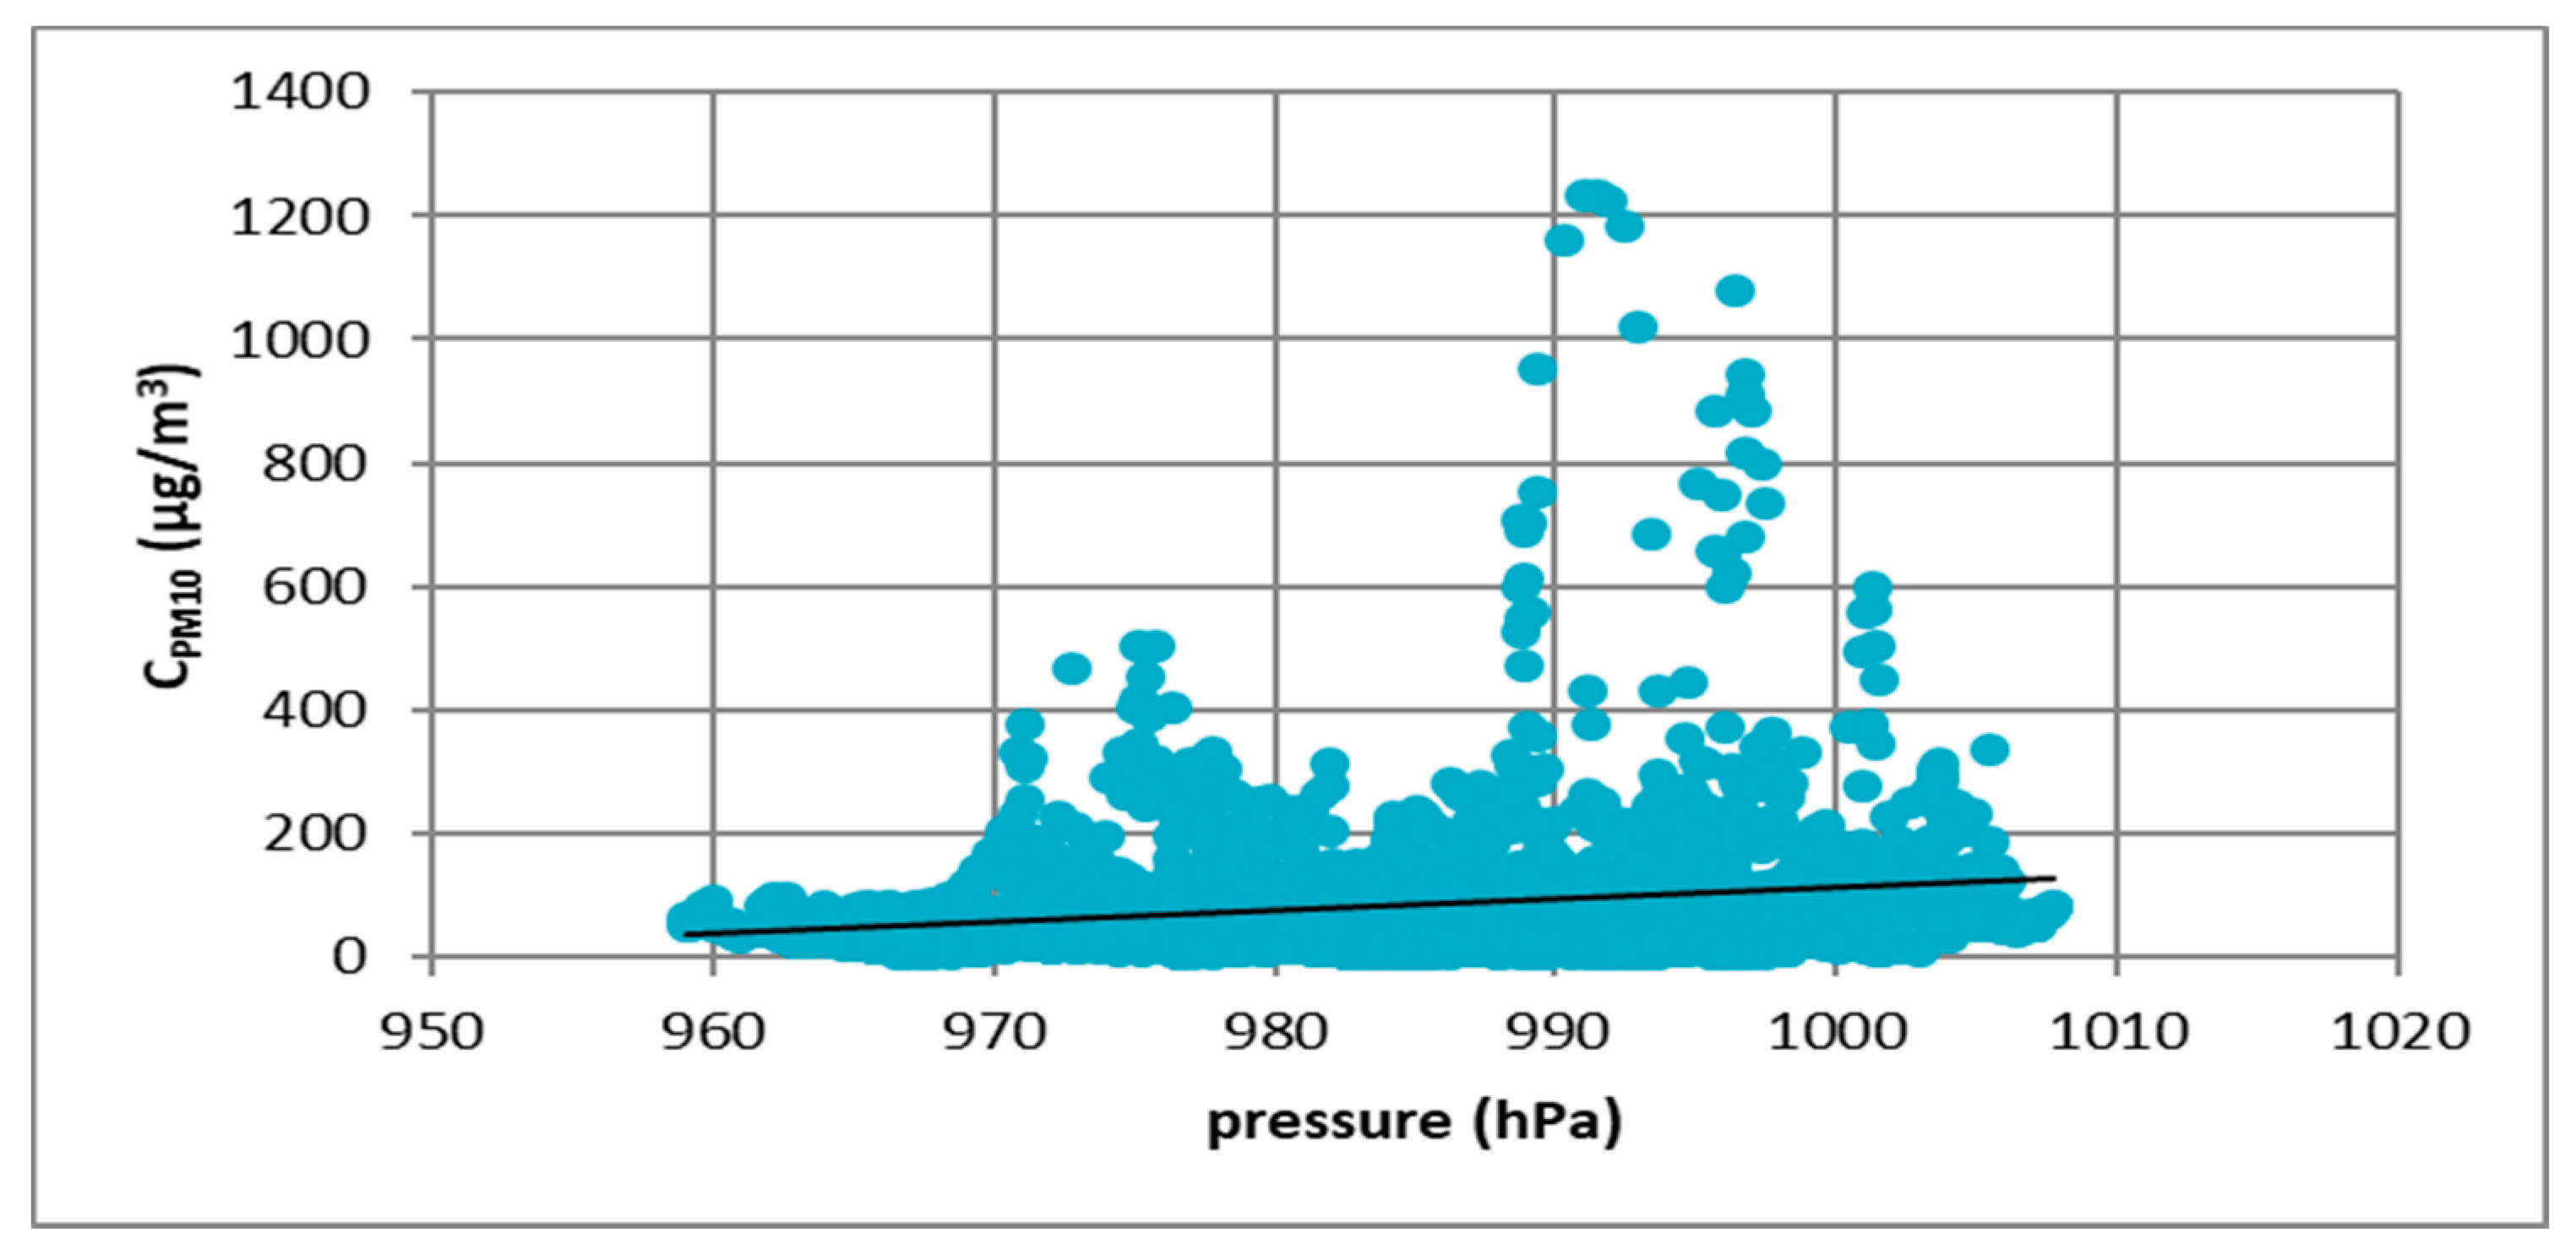
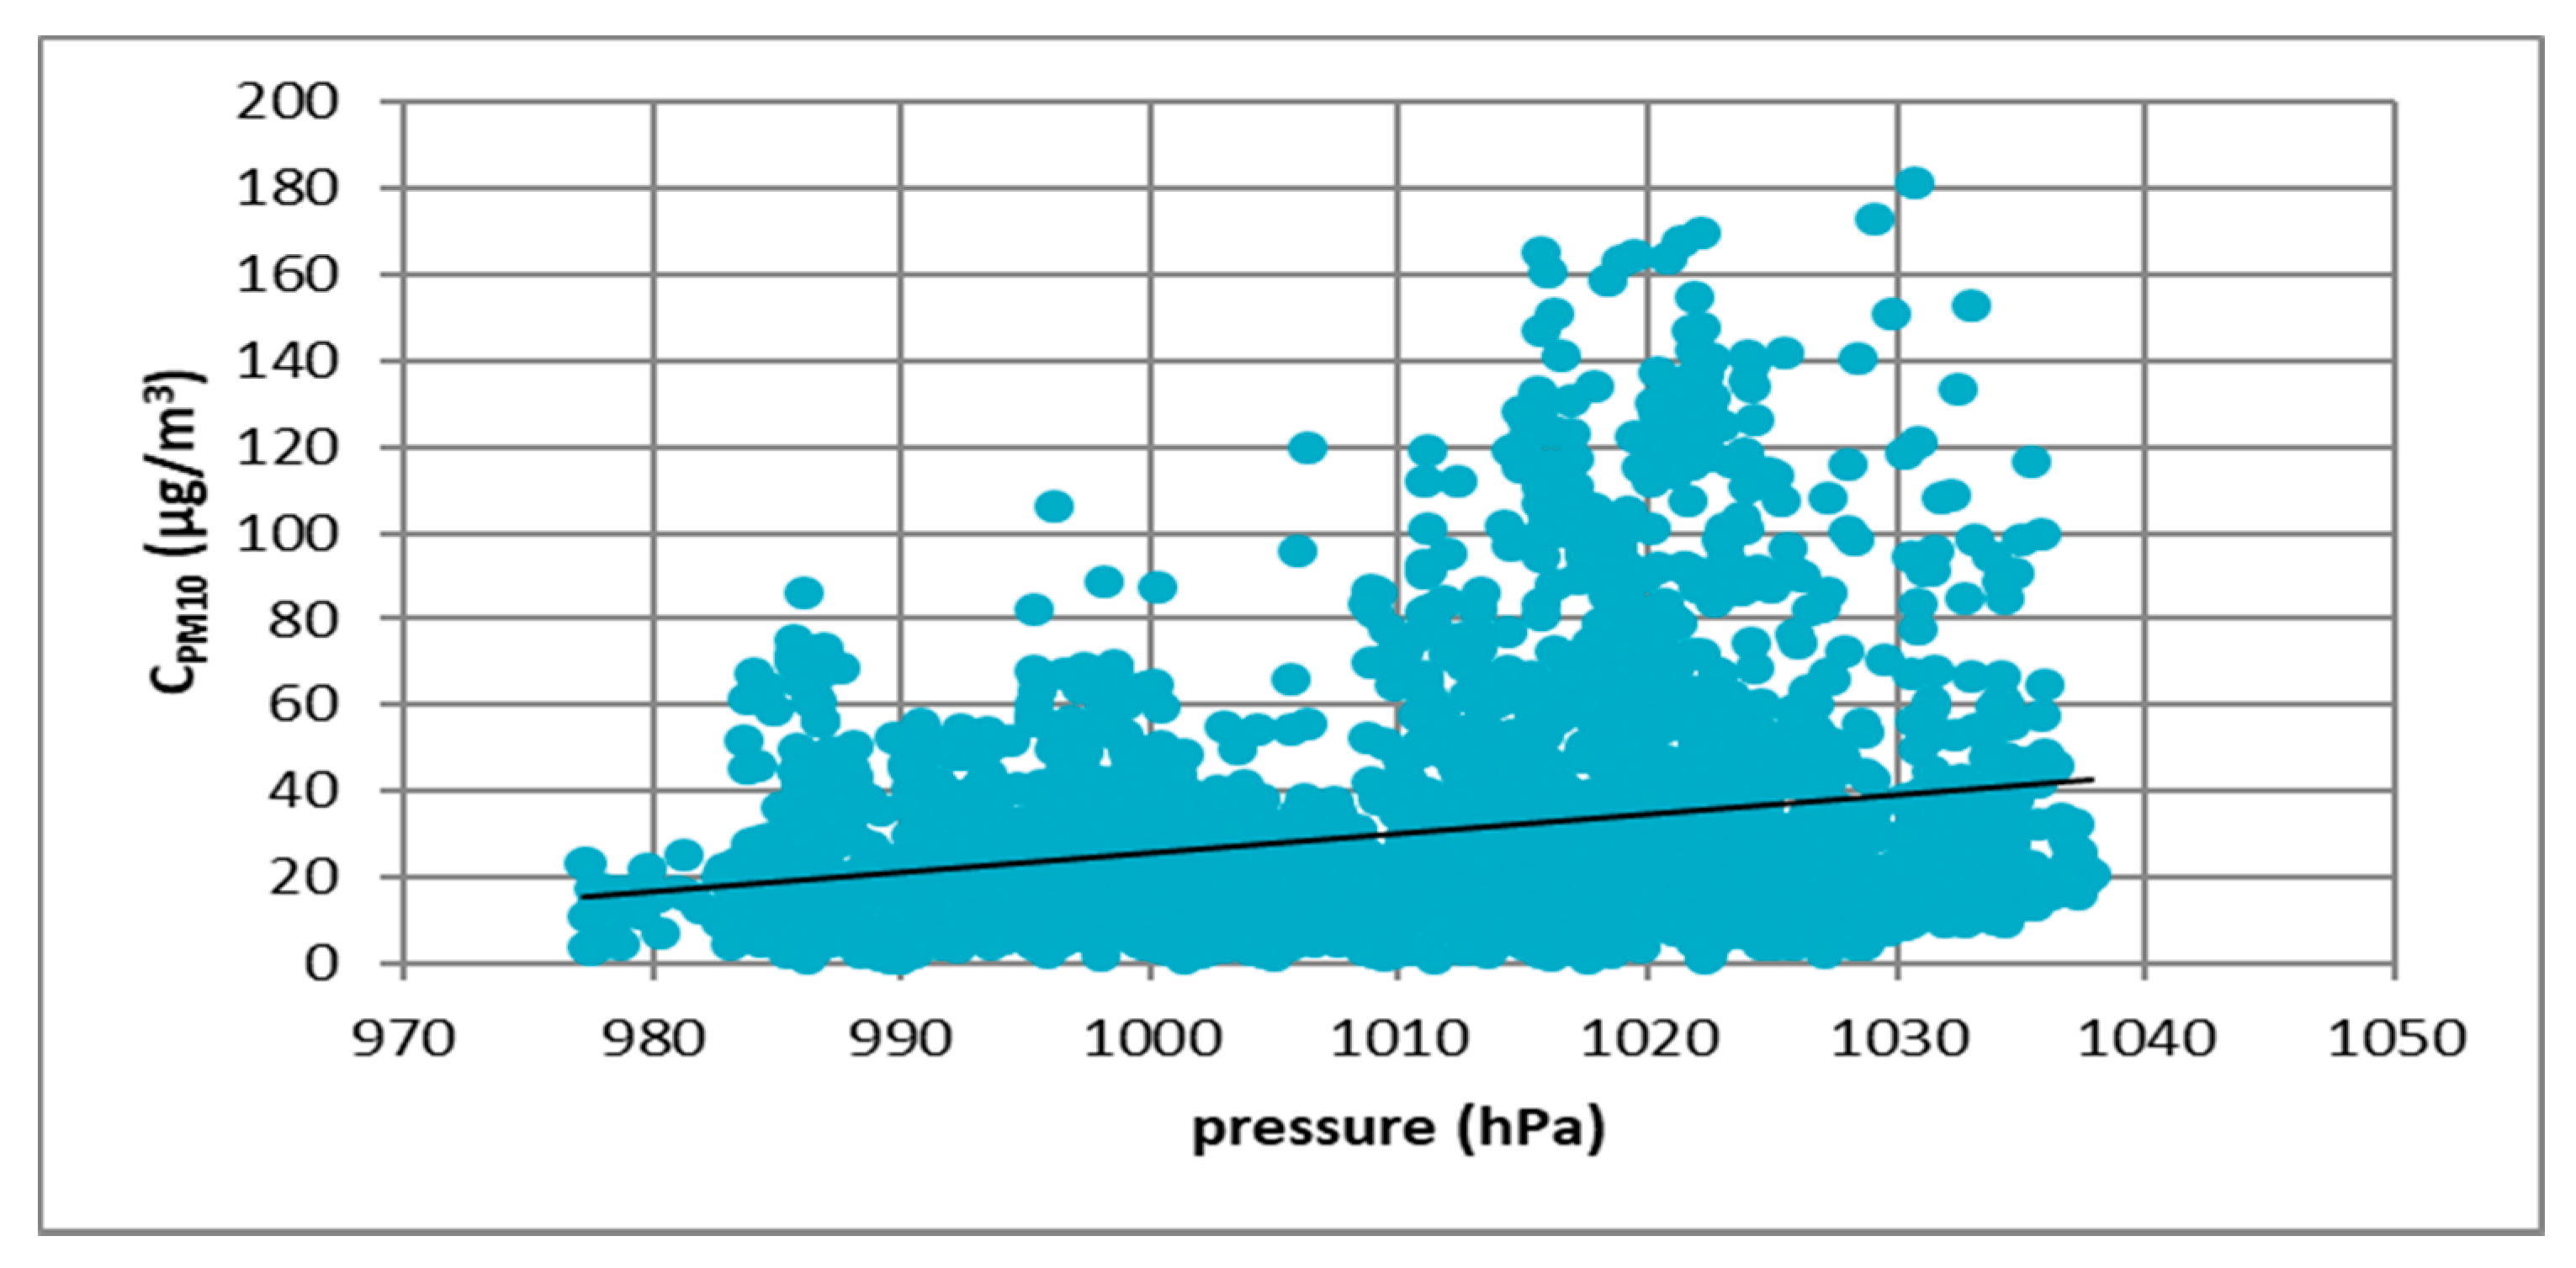
Another atmospheric factor for which the analysis was carried out was atmospheric pressure.
Figure 7,
Figure 8,
Figure 9 and
Figure 10 show the relationship between atmospheric pressure and PM10 concentration. Based on the figures, it was found that the relationship was inverse than in the case of temperature. The higher the atmospheric pressure, the greater the PM10 concentration.
At all analyzed measuring stations, it was observed that the concentration of PM10 decreased with increasing air temperature and increased with increasing atmospheric pressure. These results led to the thesis that Polish smog differed from other ones described in the literature, i.e., acid London smog and photochemical smog. The specific feature of Polish smog is the presence of high concentrations of PM10 at high pressure and negative temperatures. This happens when, in high pressure weather, anticyclone circulation of masses of dry, frosty air from the east flow into Poland. At night, there are strong temperature drops, while during the day solar radiation causes a temperature increase. The near-ground layer of the atmosphere gets warmer while on the ground surface, especially in snowy winters, it is very cold. These are excellent conditions for the formation of temperature inversion and thus for the accumulation of pollutants in the inversion layer at the earth surface. The source of these pollutants is the so-called “low emission”, i.e., the emission from domestic heating systems fired with low-quality coal and wood. Low temperatures obviously increase heat demand, which further increases the stream of emitted pollutants.
The difference between Polish smog and London smog is primarily in meteorological conditions. While London smog is formed in low-weather conditions and at temperatures slightly above zero, Polish smog is formed during frosty high weather.
The second factor differentiating both atmospheric phenomena is the lack of elevated sulfur dioxide concentrations in smog episodes in Poland despite the actual identical source of pollutant emissions—combustion of solid fossil fuels in domestic furnaces.
To explain this phenomenon, it was decided to analyze the chemical composition of particulate matter forming Polish smog. For this purpose, the works of Mathews et al. [
22] and Degórka et al. [
23] were used.
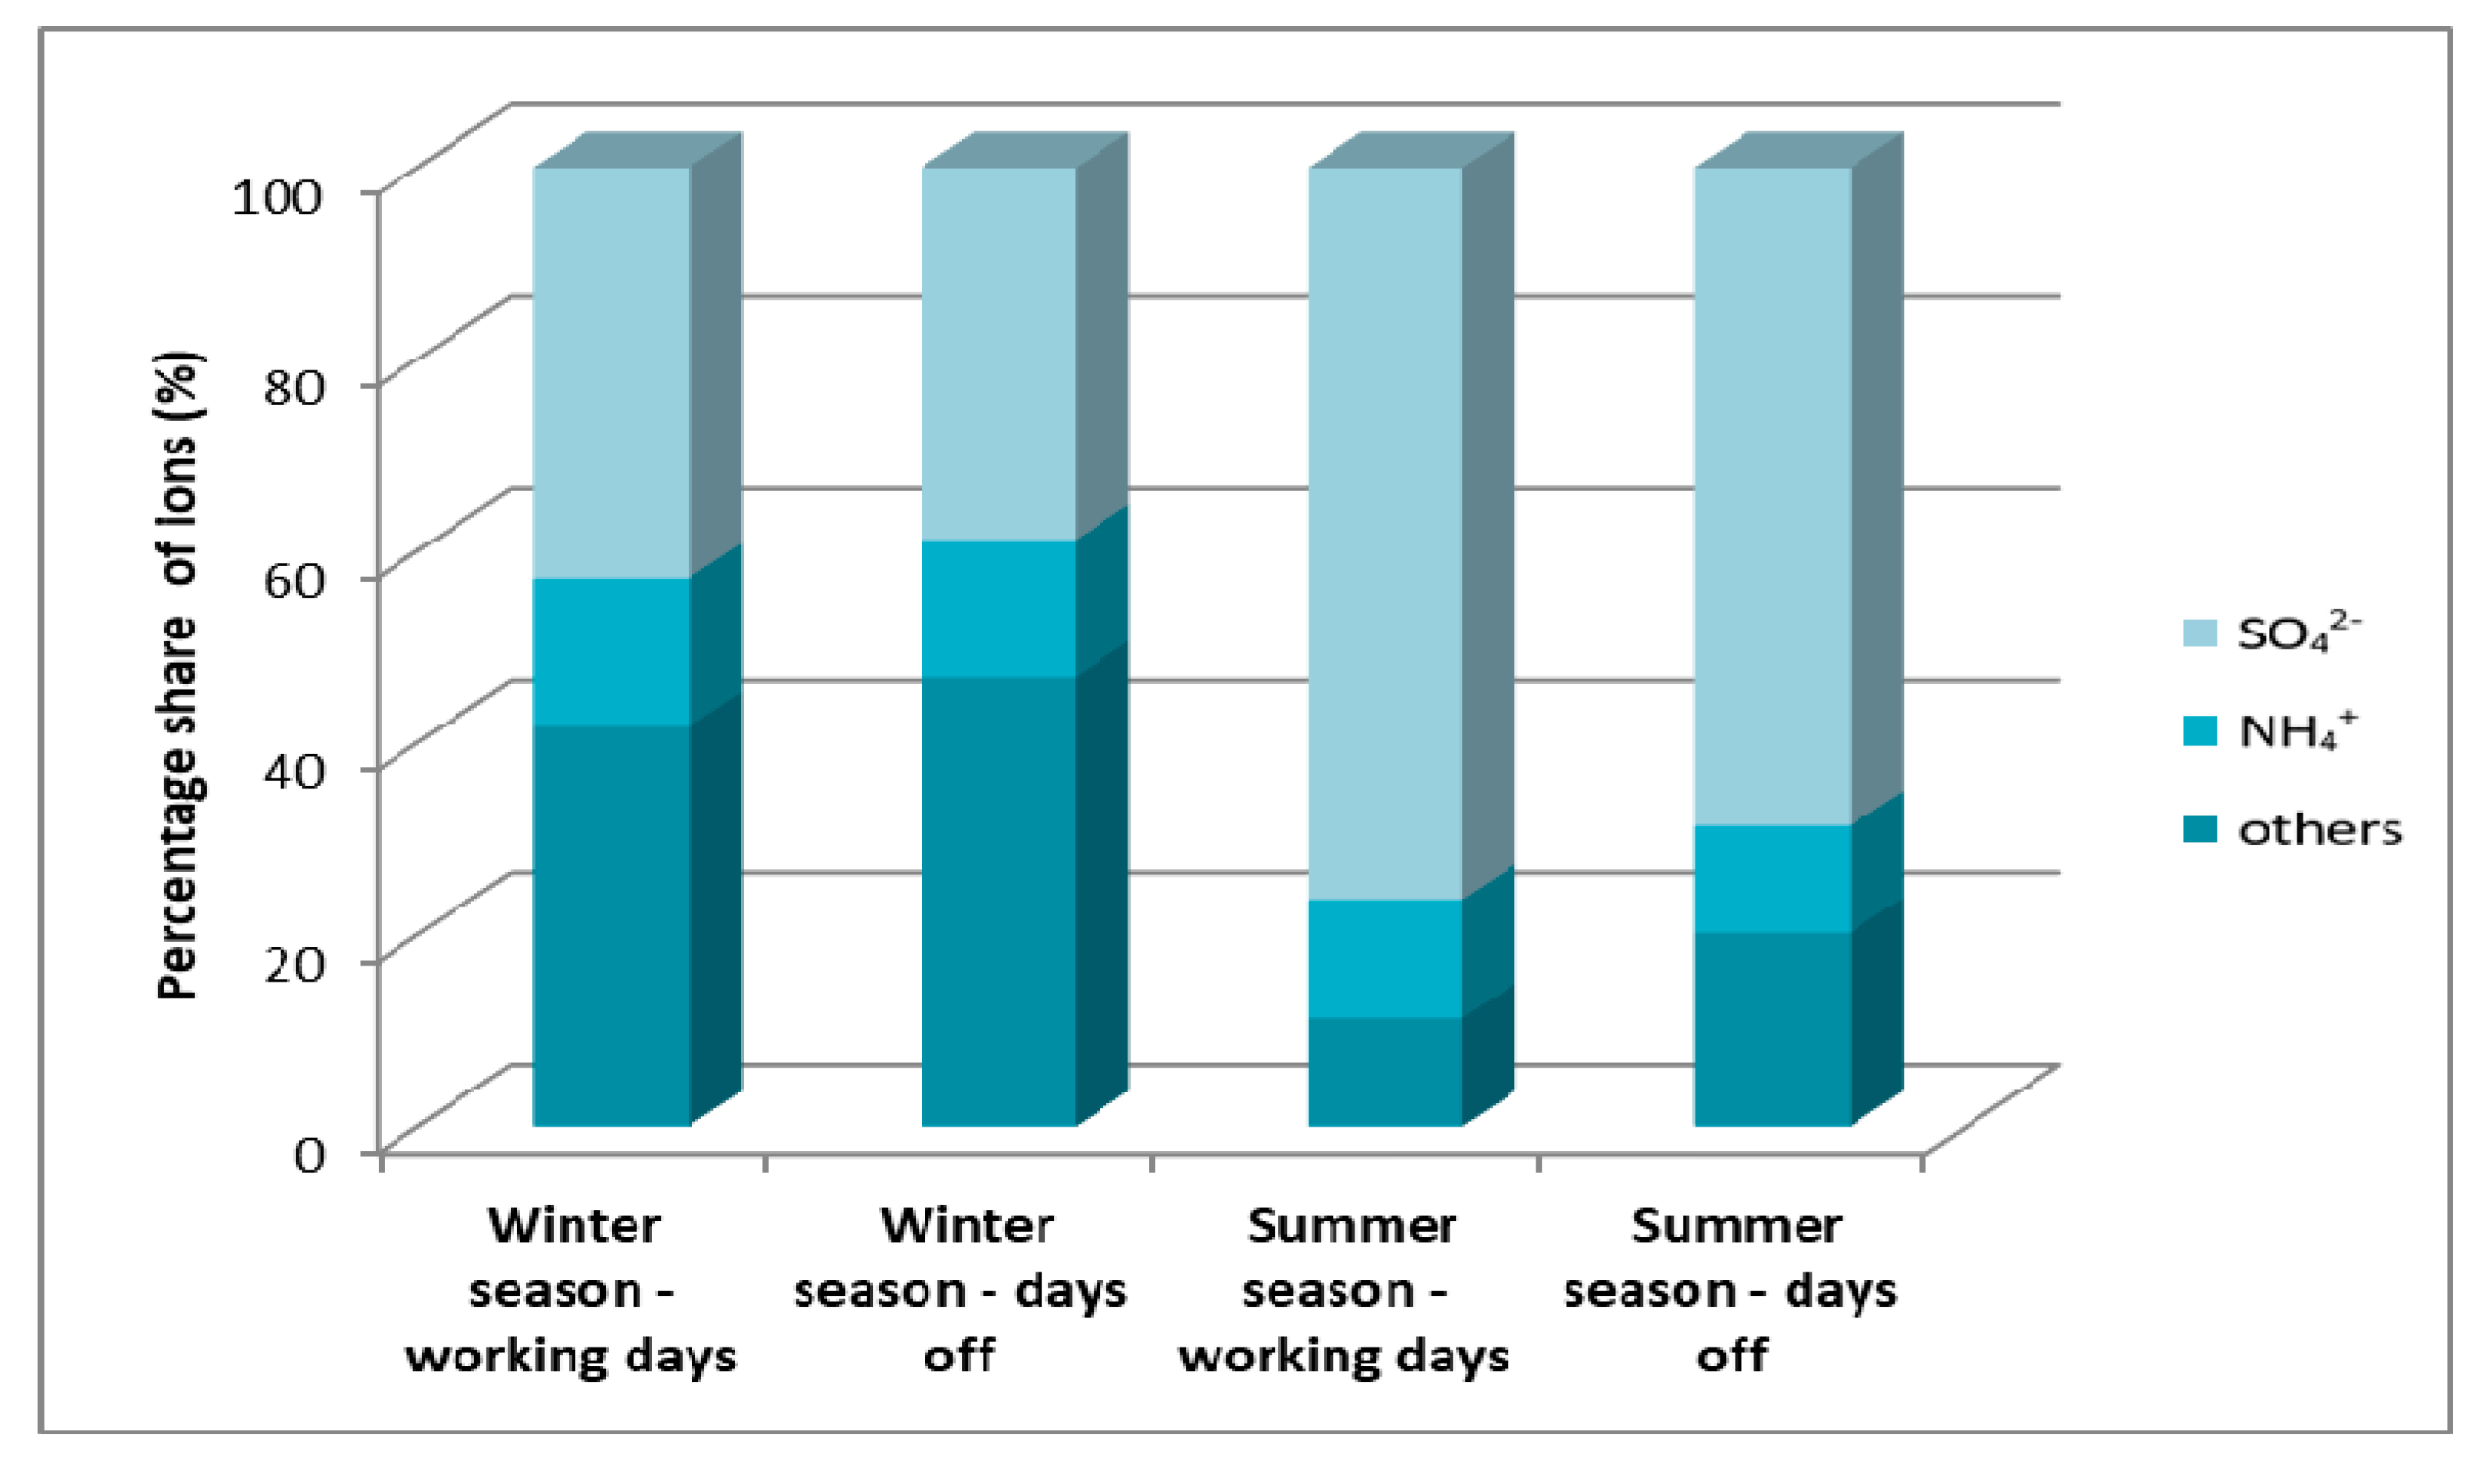
In 2009, Mathews et al. [
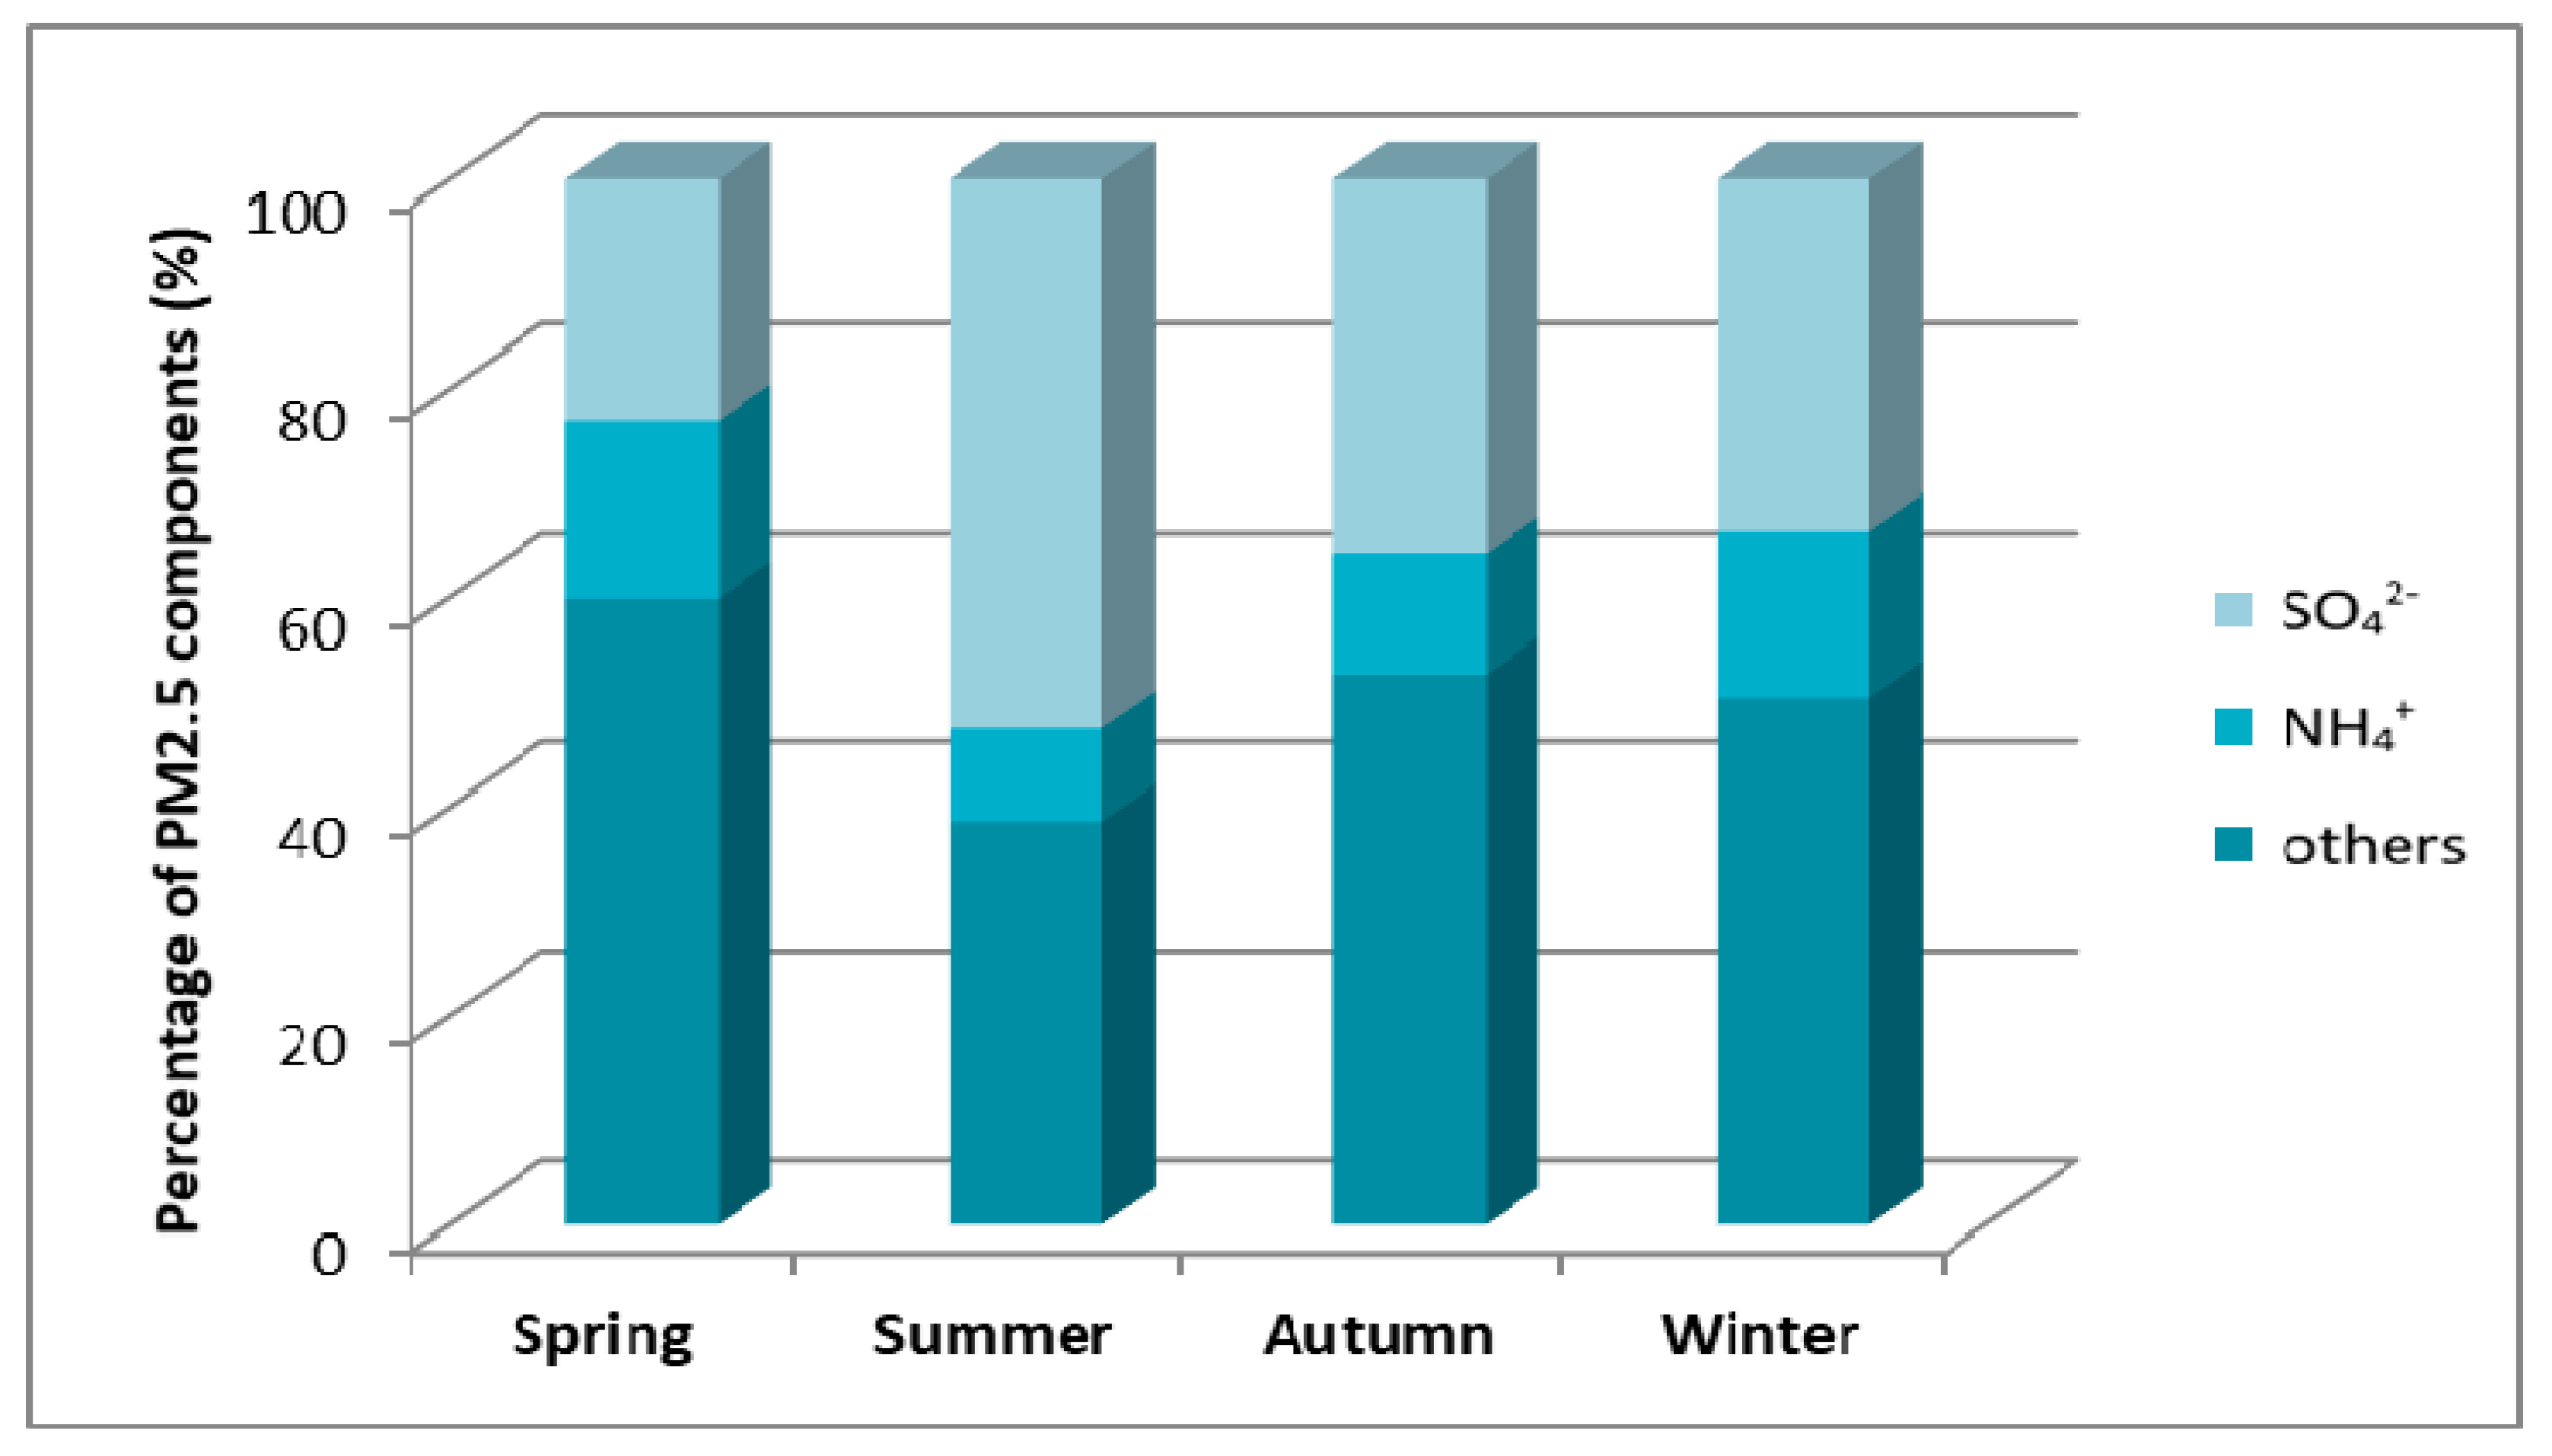
22] conducted a study on determining the concentration of ions in the air and their percentage in the mass of fine particulate matter, i.e., the PM2.5 fraction and coarse particulate matter—PM2.5-10. The research was carried out in the summer and winter seasons in the urban background area in Zabrze, in southern Poland. The results of the analyzes are presented below.
Figure 11 shows the share of cation and anion concentrations in the total ions associated with fine particulate matter. In all analyzed cases, the main components of fine particulate matter were sulfate and ammonium ions. In the winter season, in fine particulate matter, sulfate ions account for about 40% of the composition, and in the winter season this value increases to about 69%–76%. This is due to the seasonality of heating and the increase in sulfur dioxide emissions from local boiler houses. Ammonium ions in the winter and summer seasons do not show large fluctuations and remain at the level from 12% to 15%.
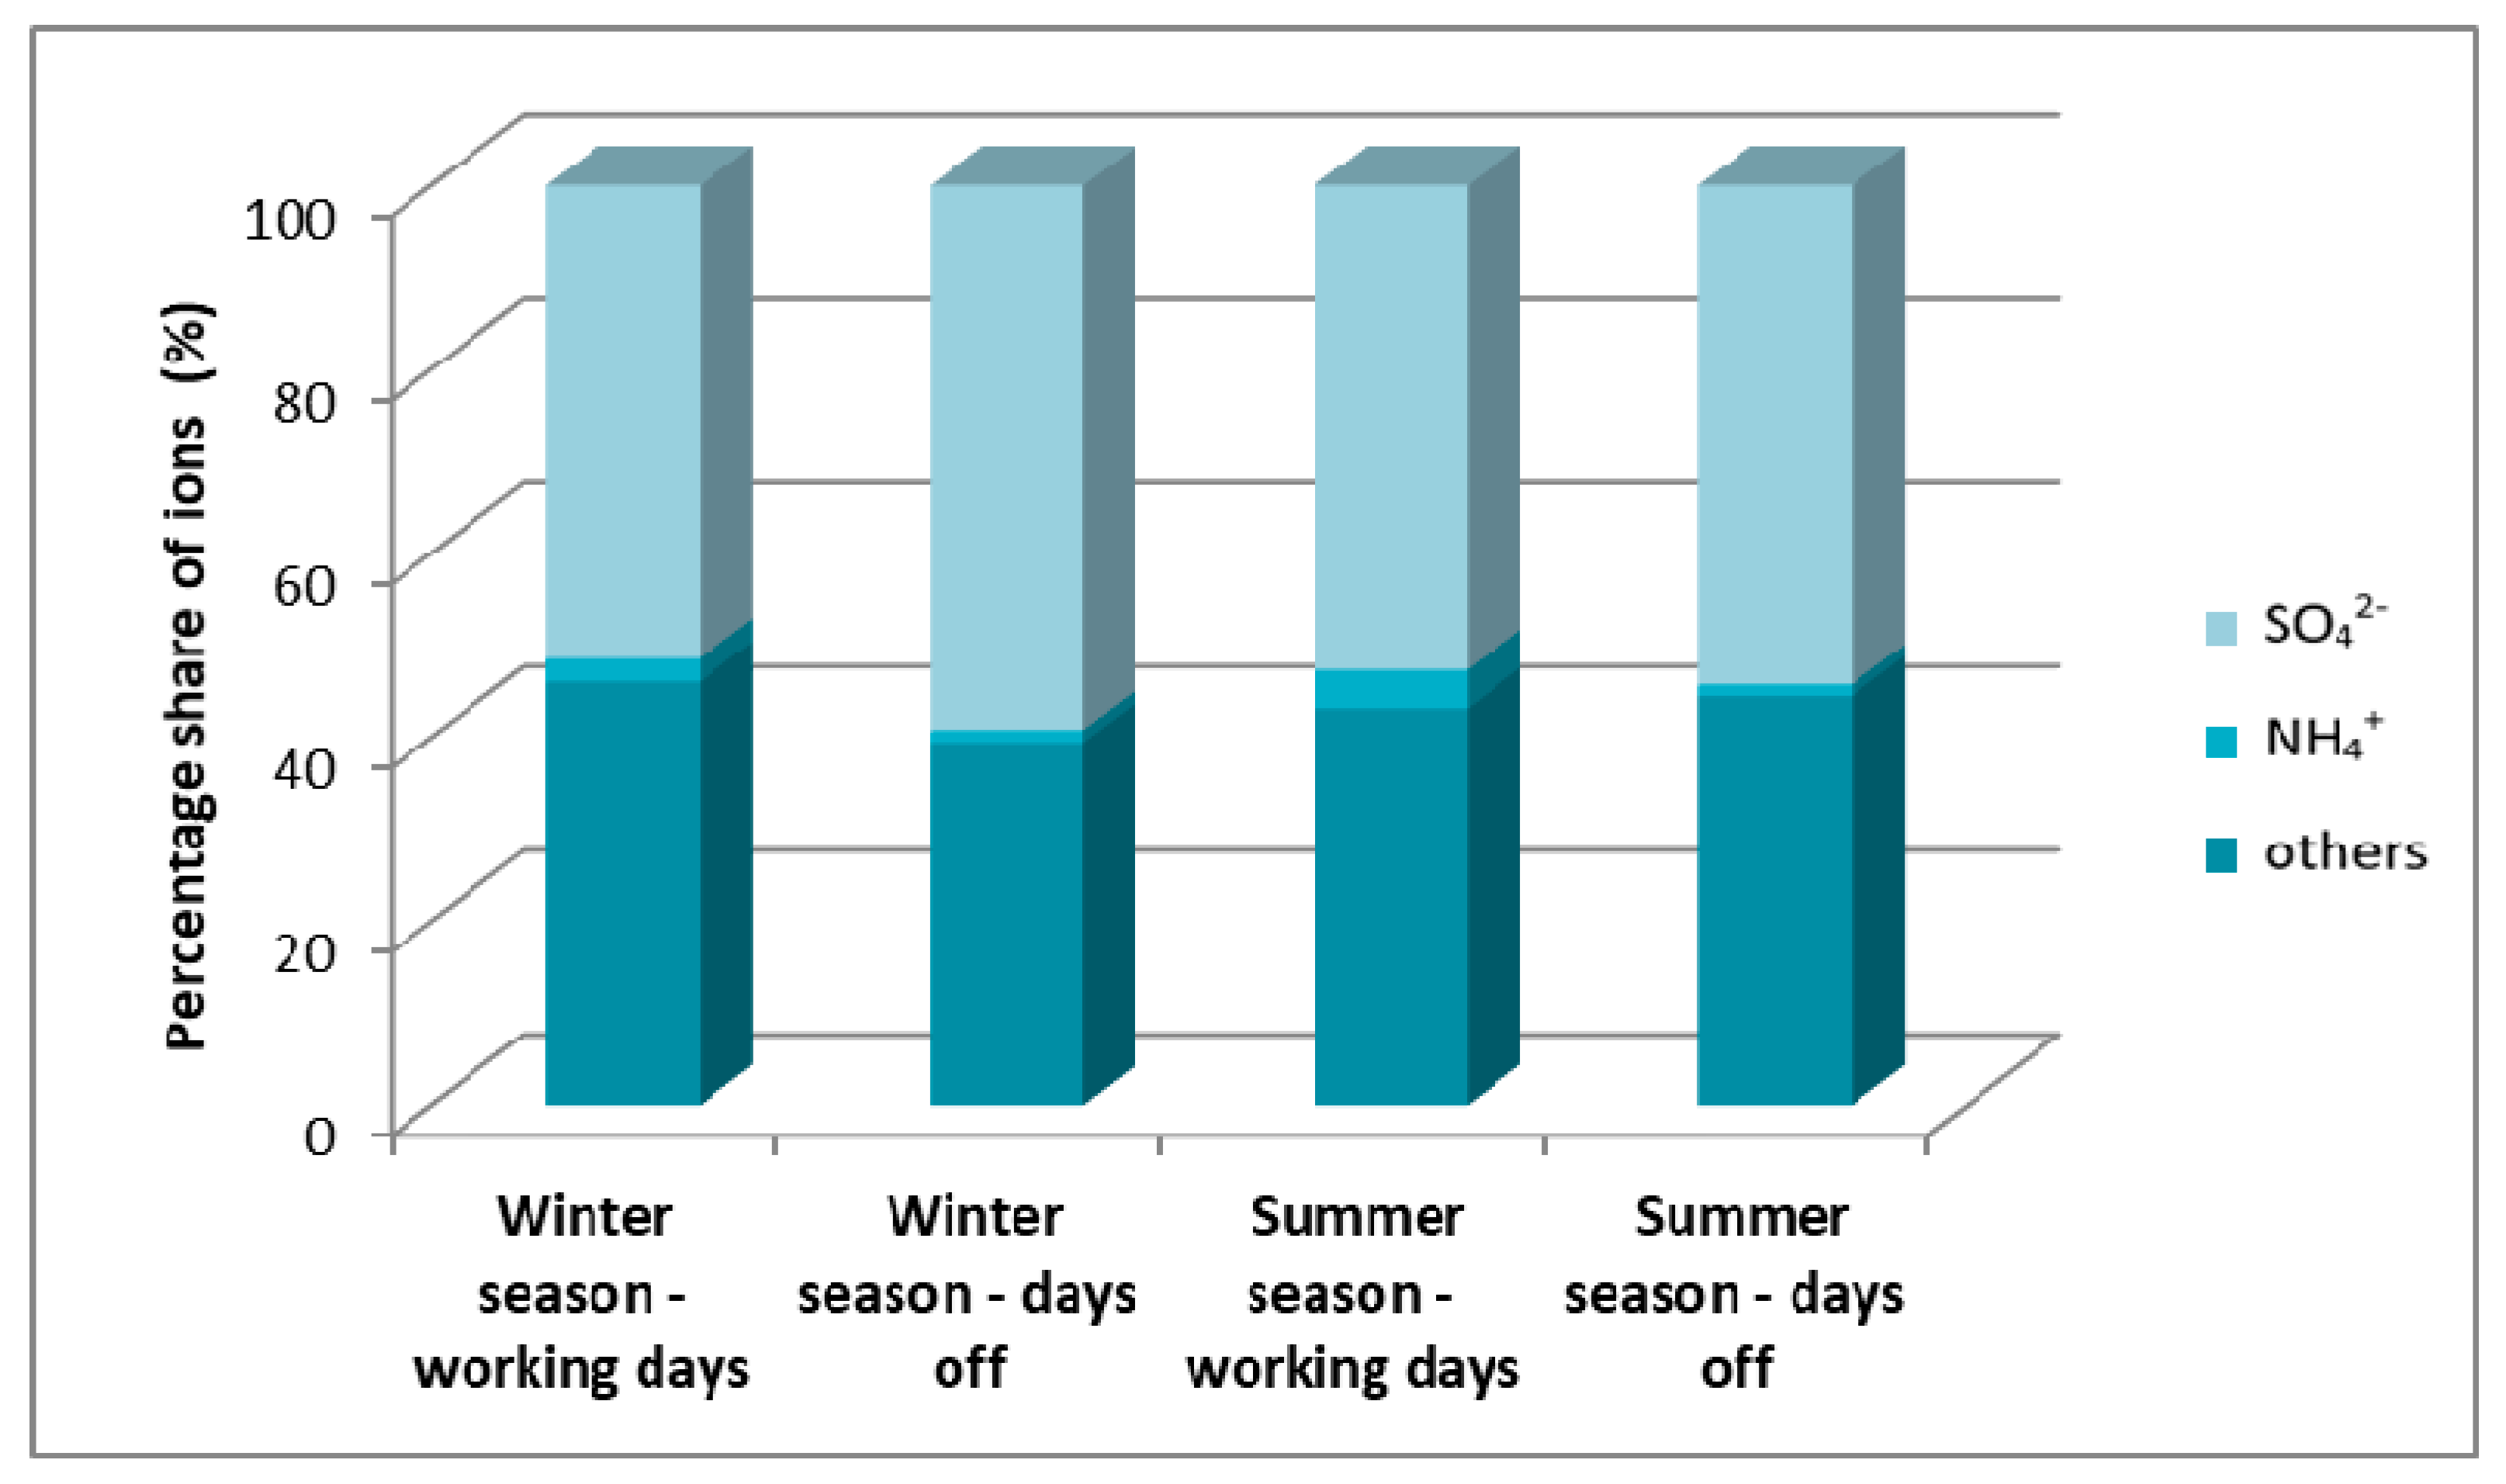
Figure 12 shows the share of cation and anion concentrations in the total concentration of ions associated with coarse particulate matter. In this case, it can be seen that, unlike the fine particulate matter, the concentration of sulfate ion throughout the year remained at a level of around 55%. The share of ammonium ions in coarse particulate matter was much smaller than in fine particulate matter amounting to about 4%.
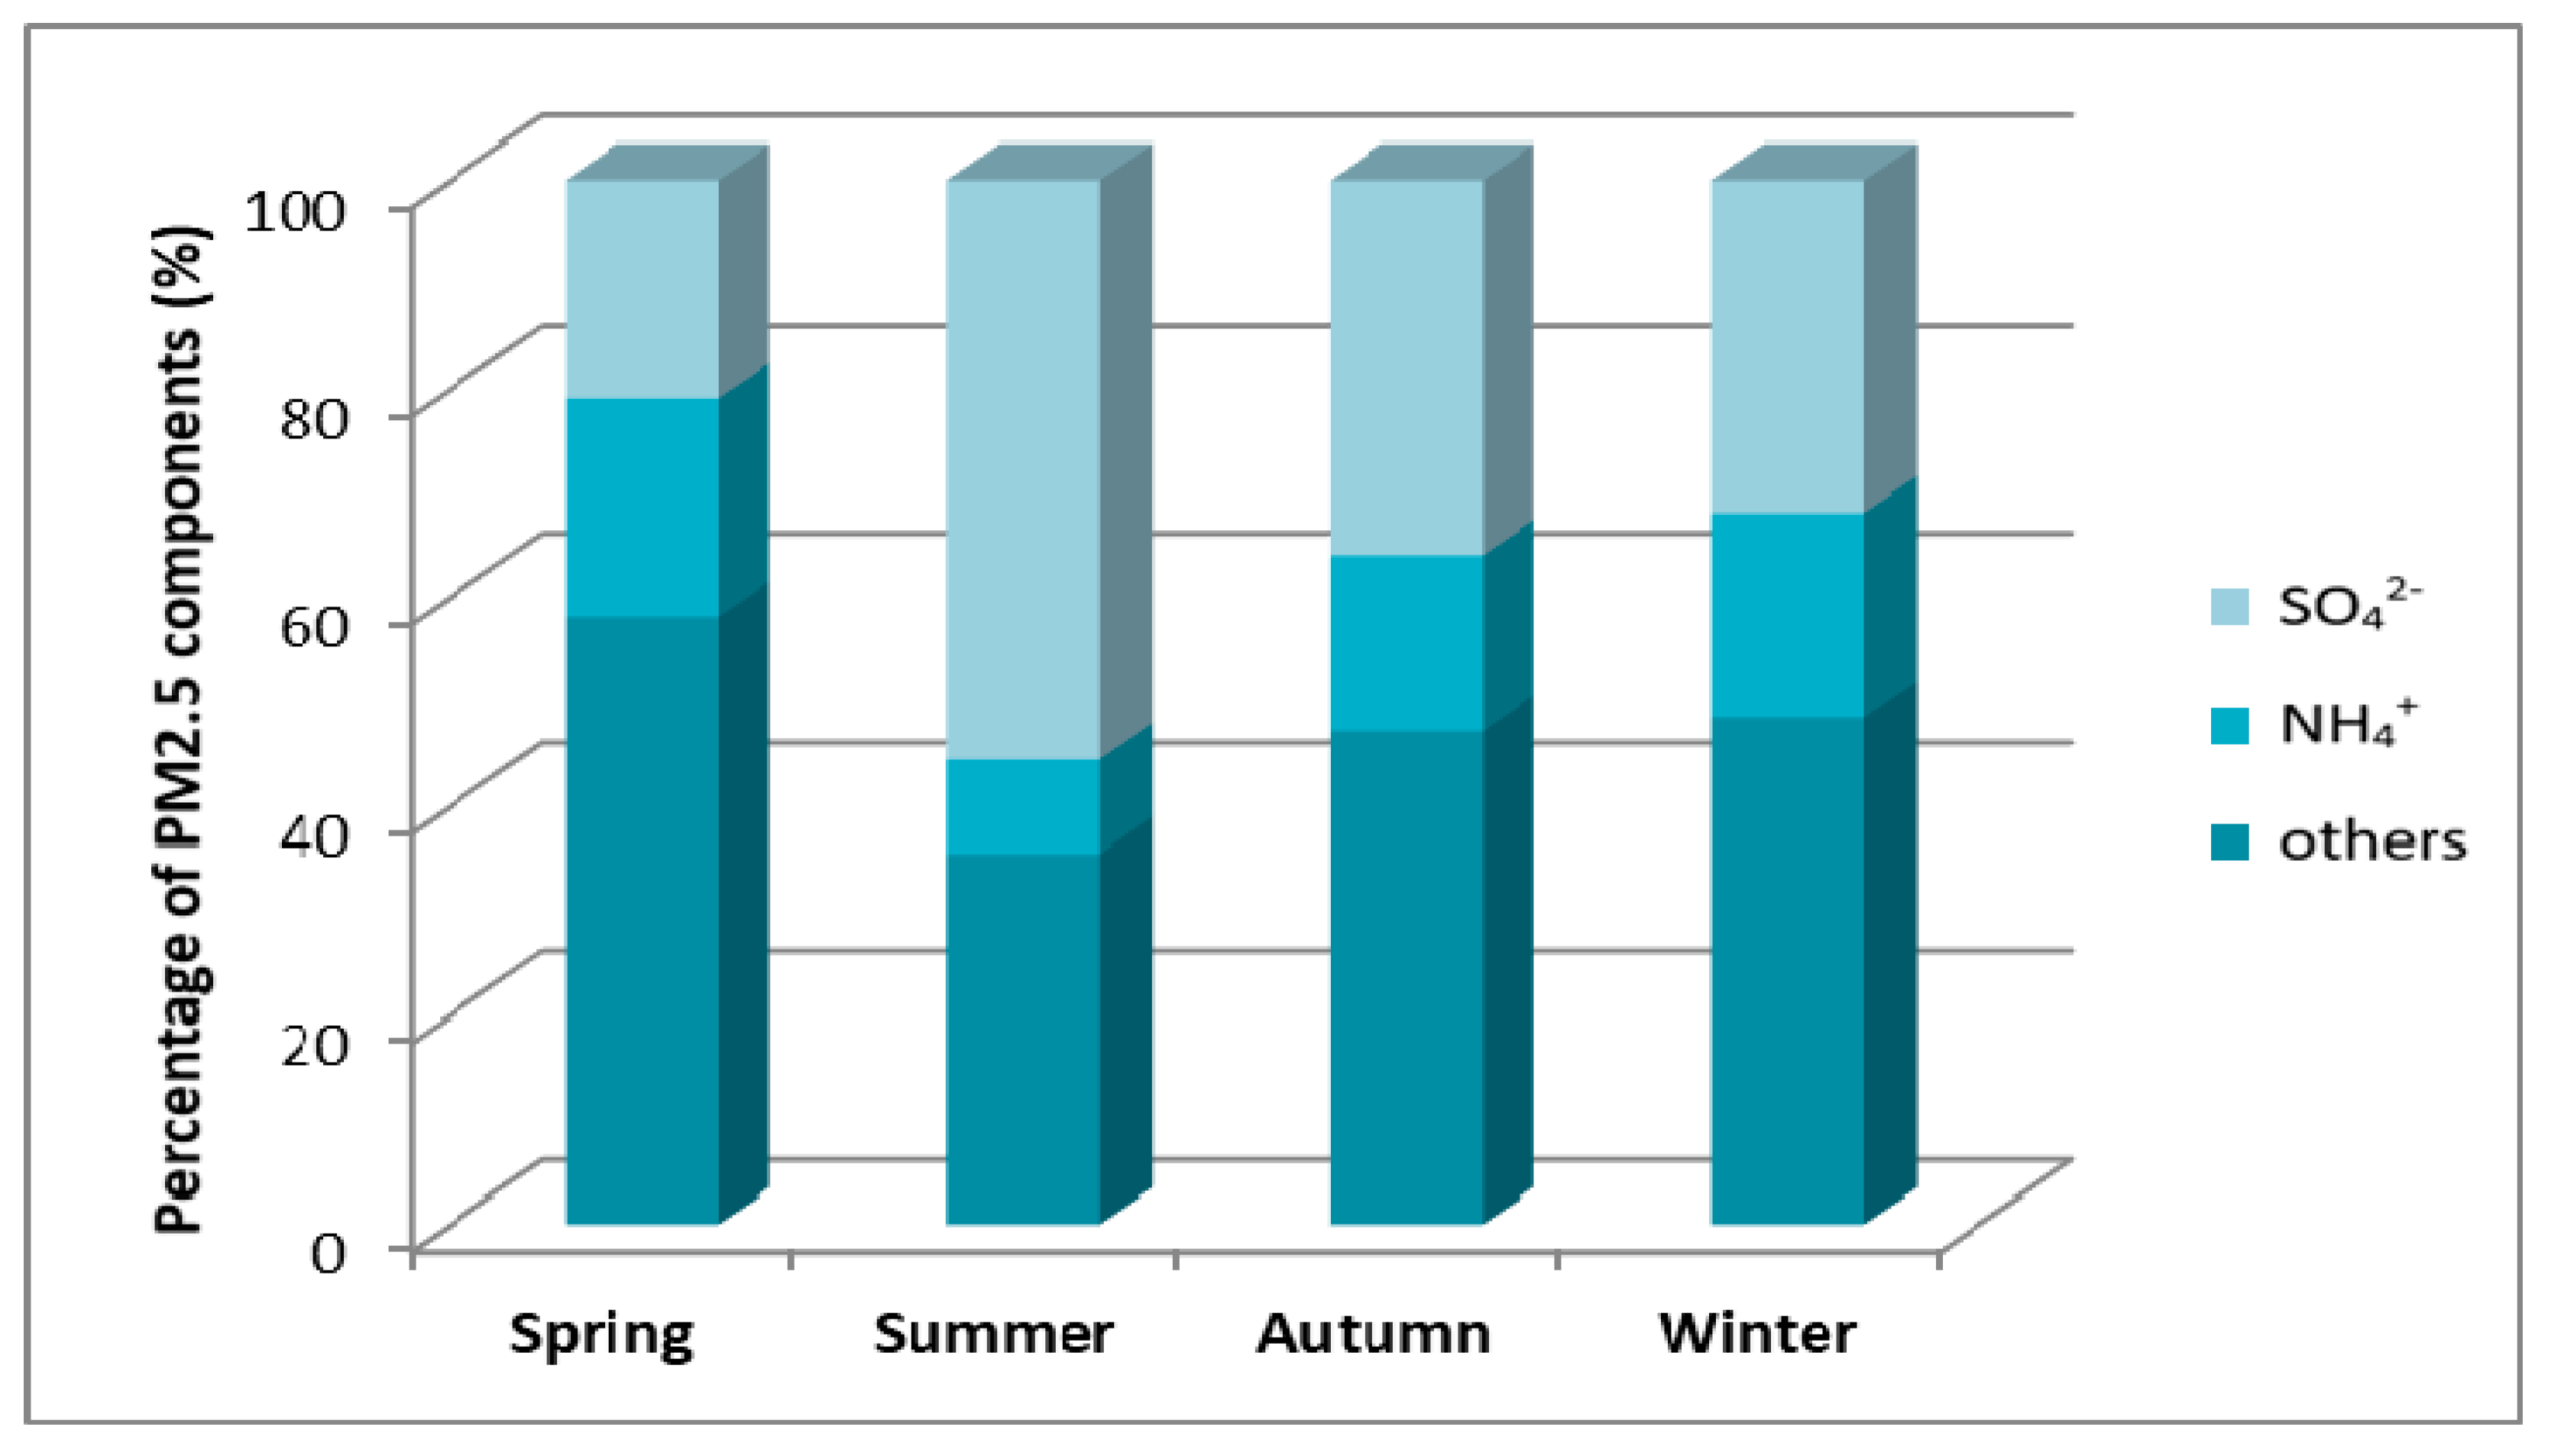
Three years later Degórka et al. conducted tests on the composition of PM2.5 at three different monitoring stations in Poland. Two of them were in the northern part of Poland, in the cities of Gdańsk and Diabla Góra, while the third one was in the south of the country in Katowice. Results of the test are presented below.
Figure 13 and
Figure 14 present the results of analyzes for Northern Poland. For both sulfate and ammonium ion concentrations, a similar trend could be observed depending on the season of the year. It could also be seen that there was a smaller percentage of these ions than in the case of Zabrze, i.e., a town located in the southern part of the country (
Figure 11 and
Figure 12).
Figure 15 presents the results of analyzes for Katowice—the city in the southern part of the country. In autumn and winter a higher percentage of sulfate ions were recorded than in the case of Gdańsk and Diabla Góra. Based on
Figure 13,
Figure 14 and
Figure 15, it can be seen that the concentration of sulfate ions in PM2.5 was the highest in summer. On the basis of this thesis, it can be concluded that it is not related to heating seasonality occurring in the country.
As mentioned earlier, London smog contains mainly particles of sulfur dioxide and carbon monoxide, while Polish smog can be described as dust smog. The significant presence of sulfate and ammonium ions in Polish smog, which most likely form ammonium sulfate, raises the question of the source of ammonia for binding sulfur dioxide produced in combustion processes.
In 2016, Wielgosiński [
24] published results of the research on ammonia emissions from sewage sludge incineration processes. They showed that sewage sludge from the Combined Sewage Treatment Plant in Łódź contains significant amounts of ammonia which is released in the combustion process.
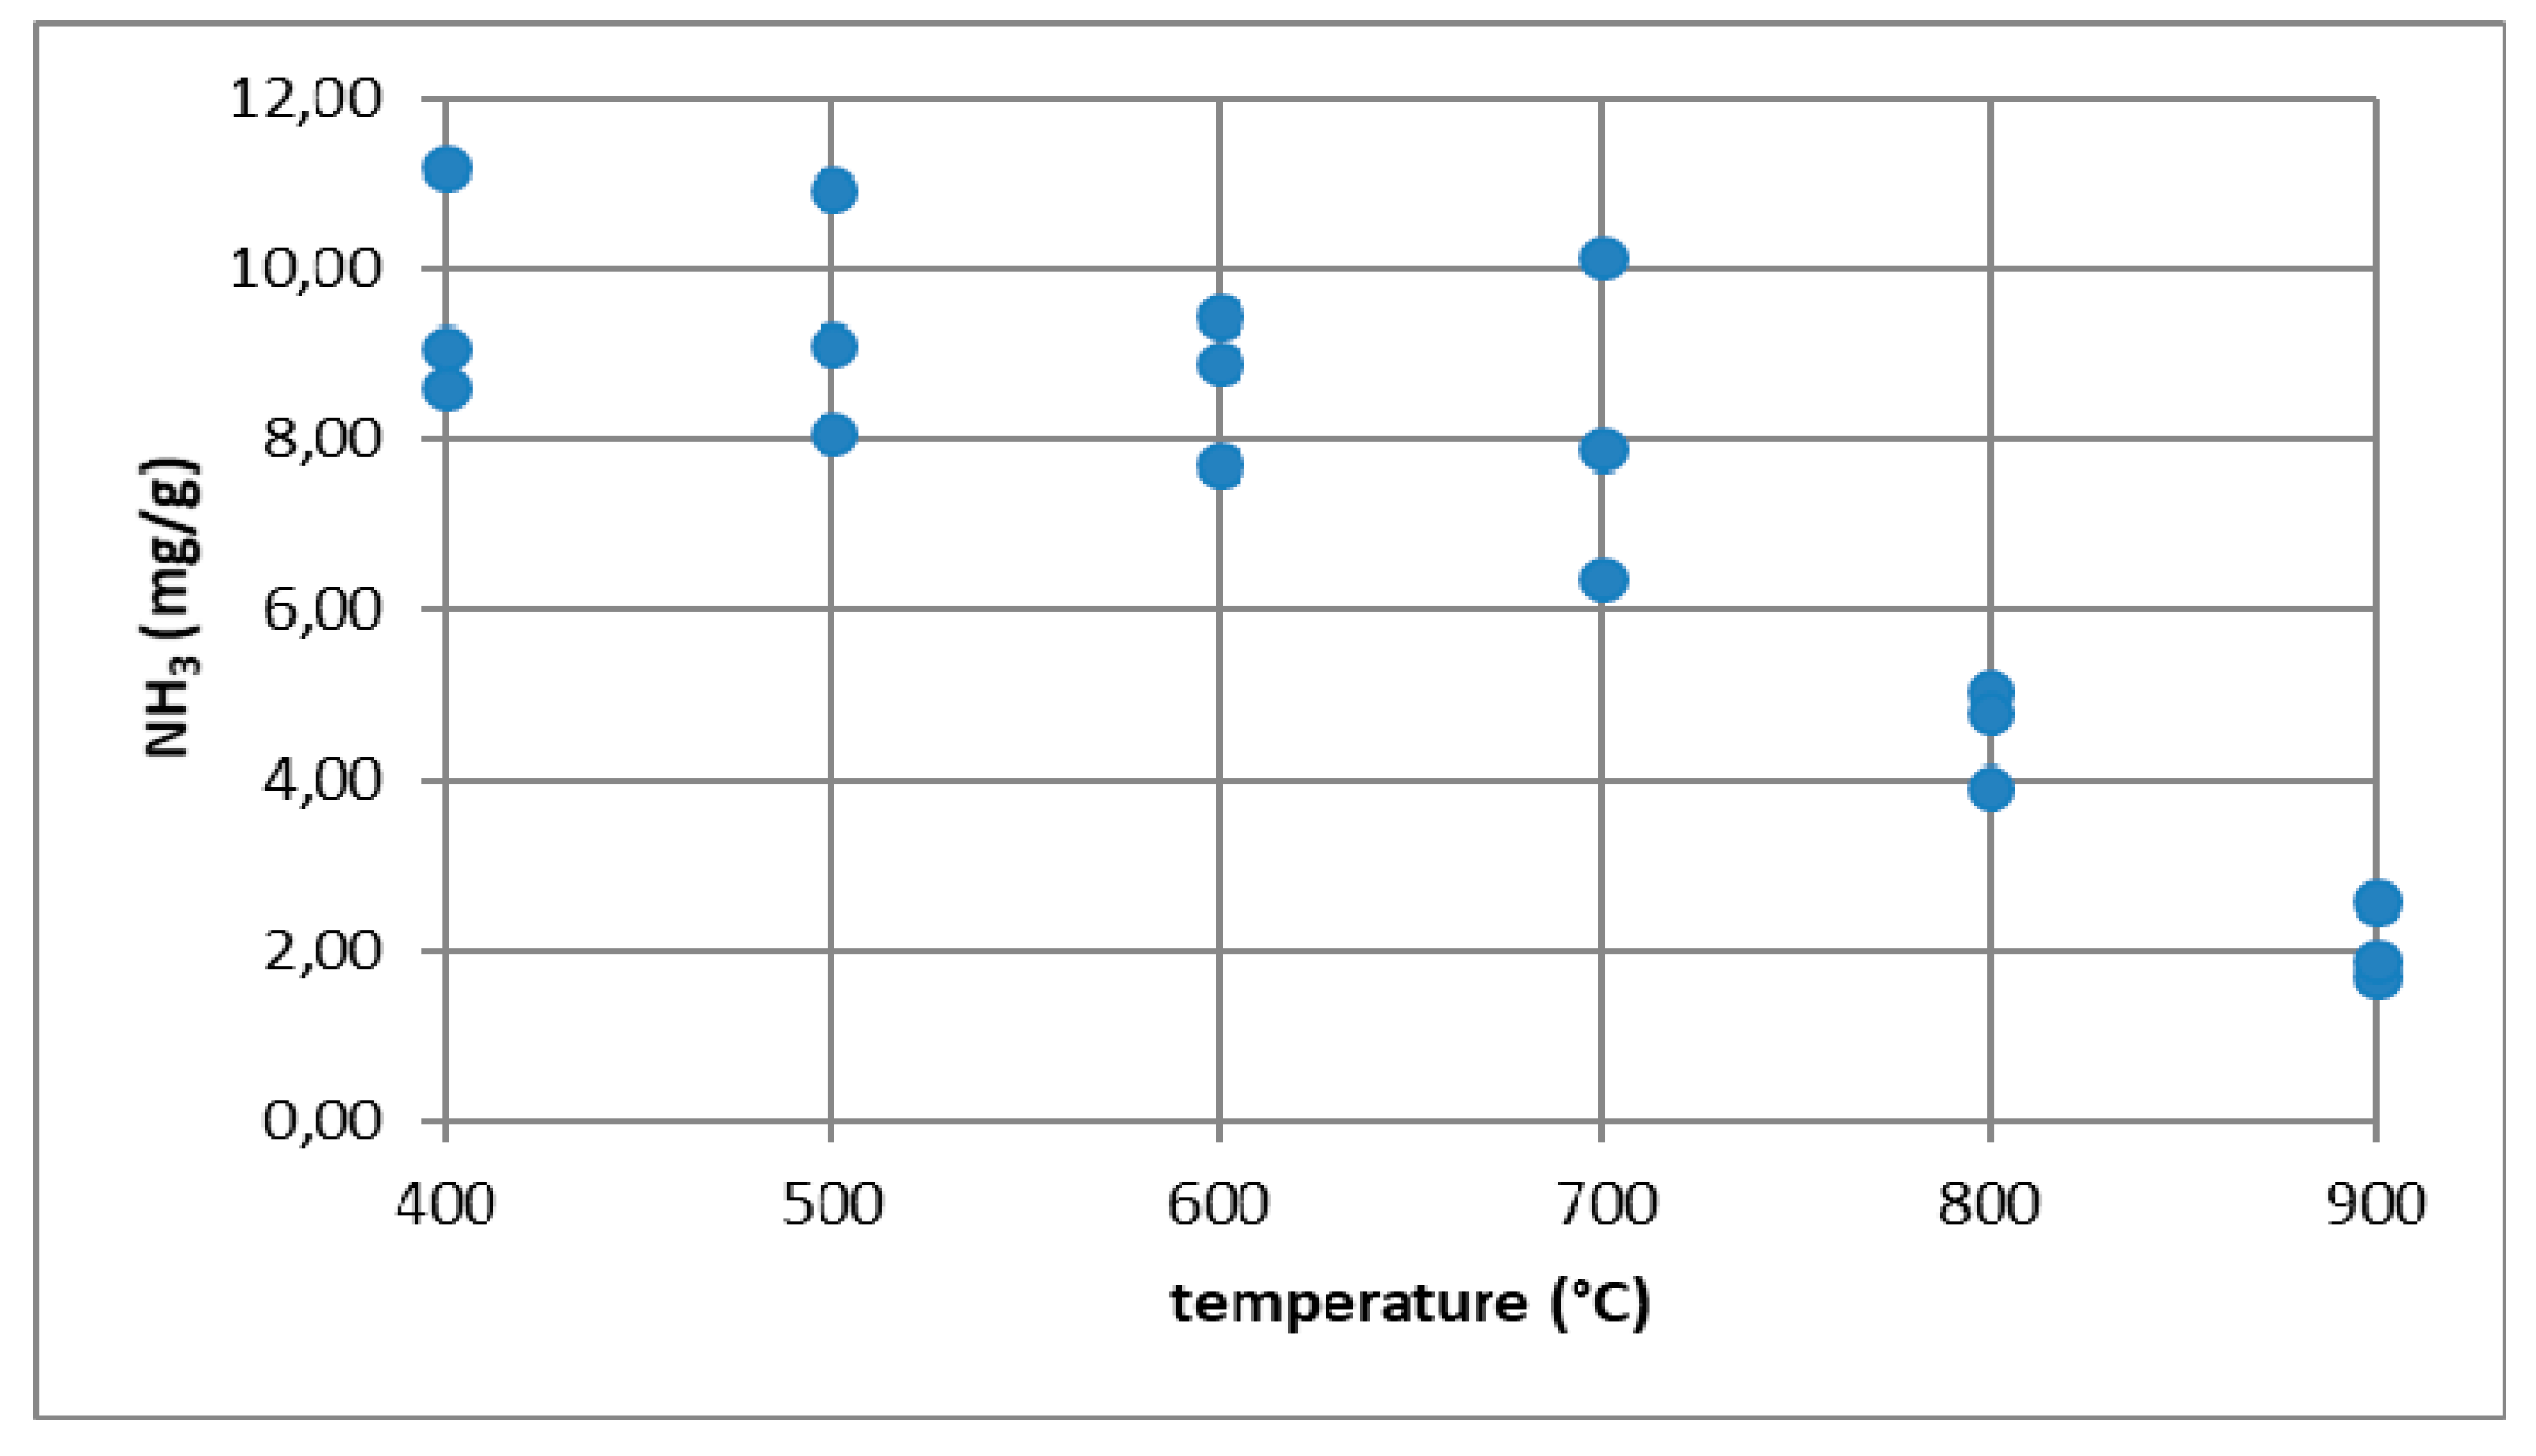
To confirm that ammonia is emitted from combustion processes, ammonia emissions were measured during biomass and coal combustion [
25] in the temperature range from 400 to 900 °C. The process of sample combustion was carried out in a high-temperature electric furnace with a horizontal working chamber in the presence of air. The furnace exhaust gases were directed to a scrubber system filled with 0.1 M sulfuric acid. The amount of ammonia absorbed in this way was analyzed using the Nessler method [
26,
27,
28]. Studies have shown that as the temperature increases, the amount of ammonia emitted decreases to reach the highest value at 400 °C. In the case of biomass, namely rye straw at 400 °C, ammonia emissions were at the level of 12 mg/g (
Figure 16). For the combustion of coal with the trade name Ekogroszek Saturn, the highest emission of ammonia at the level of 1 mg/g was reported at 500 °C (
Figure 17).
The observed emission of ammonia from combustion processes may explain the presence of ammonium ions in particulate matter composition in Polish cities. It can be assumed that the emitted ammonia reacts with sulfur dioxide, which results in a significant reduction of its emission and the formation of ammonium sulfate as the main component of the particulate matter.


