Article

Influence of Quasi-Periodic Oscillation of Atmospheric Variables on Radiation Fog over A Mountainous Region of Korea

1
Department of Atmospheric Sciences, Yonsei University, Seoul 03722, Korea
2
Meteorological Research Division, Environment and Climate Change Canada, Toronto, ON M3H 5T4, Canada
3
Applied Meteorology Research Division, NIMS/KMA, Seogwipo-si, Jeju-do 63568, Korea
*
Author to whom correspondence should be addressed.
Atmosphere 2020, 11(3), 230; https://doi.org/10.3390/atmos11030230
Submission received: 5 February 2020 / Revised: 21 February 2020 / Accepted: 24 February 2020 / Published: 27 February 2020
(This article belongs to the Special Issue Observation, Simulation and Predictability of Fog )

Abstract

:
To enhance our understanding of fog processes over complex terrain, various fog events that occurred during the International Collaborative Experiments for Pyeongchang 2018 Winter Olympics and Paralympics (ICE-POP) campaign were selected. Investigation of thermodynamic, dynamic, and microphysical conditions within fog layers affected by quasi-periodic oscillation of atmospheric variables was conducted using observations from a Fog Monitor-120 (FM-120) and other in-situ meteorological instruments. A total of nine radiation fog cases that occurred in the autumn and winter seasons during the campaign over the mountainous region of Pyeongchang, Korea were selected. The wavelet analysis was used to study quasi-period oscillations of dynamic, microphysical, and thermodynamic variables. By decomposing the time series into the time-frequency space, we can determine both dominant periods and how these dominant periods change in time. Quasi-period oscillations of liquid water content (LWC), pressure, temperature, and horizontal/vertical velocity, which have periods of 15–40 min, were observed during the fog formation stages. We hypothesize that these quasi-periodic oscillations were induced by Kelvin–Helmholtz instability. The results suggest that Kelvin–Helmholtz instability events near the surface can be explained by an increase in the vertical shear of horizontal wind and by a simultaneous increase in wind speed when fog forms. In the mature stages, fluctuations of the variables did not appear near the surface anymore.

1. Introduction

Fog induces low visibility (typically less than 1 km) in the lower part of a planetary boundary layer due to the existence of liquid droplets and/or ice crystals. Such low visibility induced by fog can cause devastating financial and human losses comparable to the losses from tornadoes and thunderstorms (Gultepe et al., 2007 [1]). As reviewed by Gultepe et al. (2019a) [2], fog is one of the most severe weather events that affect aviation operations near the surface. In order to minimize the losses, therefore, improving the accuracy of fog forecasting/nowcasting is critically important. However, fog remains challenging to predict, due to the nonlinearity and diversity of associated processes that include turbulent mixing, radiative cooling, shear instabilities, and aerosol-fog microphysical interaction.
Usually, radiation fog is formed through radiative cooling near the surface during the night. Over the past few decades, many observational and numerical studies have shown that turbulence was an essential factor that affected the evolution of radiation fog (e.g., Roach, 1976; Duynkerke, 1991a; Terradellas et al., 2008; Zhou and Ferrier, 2008; Ye et al., 2015; Degefie et al., 2015; Maronga and Bosveld, 2017 [3,4,5,6,7,8,9]). However, discrepancies exist among the arguments for the effects of turbulent mixing on fog formation. Several studies reported that turbulent mixing suppressed fog formation (Roach, 1976; Ye et al., 2015 [3,7]). Other studies reported that turbulent mixing could contribute to fog formation (Degefie et al., 2015; Gerber, 1981 [8,10]). Meanwhile, Zhou and Ferrier (2008) [6] suggested that a turbulence intensity threshold might exist at which the radiation fog dissipates under the action of intense turbulent mixing. However, the crucial parameters that determine whether turbulent mixing suppresses or induces radiation fog have not been clearly quantified thus far (Maronga and Bosveld, 2017 [9]). Moreover, some studies have suggested that quasi-periodic oscillations of dynamic and thermodynamic state variables also affect the modulation of the fog structure during its life cycle. Quasi-periodic oscillations of temperature (T), visibility (Vis), wind speed, and water vapor, which have periods of 10–40 min, were observed during fog events and these were found to be related to vorticity or shear-generated waves due to Kelvin–Helmholtz instability (KHI) and/or buoyancy-generated internal gravity waves (Roach, 1976; Duynkerke et al., 1991a; Gerber, 1981; Nilsson, 1996; Nilsson and Bigg, 1996; Uematsu et al., 2007; Hang et al., 2016 [3,4,10,11,12,13,14]). Nilsson (1996) [11] and Nilsson and Bigg (1996) [12] suggested that KHI might also affect fog microphysics. A previous large eddy simulation (LES) study (Nakanishi, 2000 [15]) stated that KHI could induce roll structures during the mature and dissipation stages of fog. He concluded that the convective mixing (induced by longwave cooling due to fog droplets) at the top of fog layer produced vertical shear of horizontal wind ( u hs ) across the inversion layer and could promote KHI. Uematsu et al. (2007) [13] showed, for the first time, the multiscale fog structure influenced by KHI and gravity waves, based on a Ka-band scanning Doppler radar. Bergot (2013) [16] found that KHI was induced by u hs in the middle of the fog layer during the formation phase, and the location of the maximum LWC and KHI migrated to the top of the fog layer as the fog became optically thick. He also suggested that KHI might affect fog microphysics. However, the interactions between thermodynamic, microphysical, and dynamical processes that lead to fog formation and development are still only partially understood (Gultepe et al., 2007; Haeffelin et al., 2010 [1,17]).
In the present study, we examine the dynamical, microphysical, and thermodynamic variables of fogs observed in the mountainous region of Pyeongchang, Korea. The observations analyzed were collected during the International Collaborative Experiments for Pyeongchang 2018 Winter Olympics and Paralympics (ICE-POP) campaign. One of the primary objectives of the ICE-POP is to enhance our understanding of the meteorological processes to improve real-time predictability of hazardous weather (e.g., low Vis and gust wind events) in the Pyeongchang mountainous region. The specific goals in this study are to investigate: (1) KHI within the radiation fog layer; and (2) Effect of KHI on fog evolution over the mountainous region of Pyeongchang. The content is organized as follows. Section 2 explains the observation site, instrumentation, and data processing. Section 3 presents the results of the two selected case studies of radiation fog and statistical analyses of all cases. Section 4 describes discussion. Finally, summary and conclusion are given in Section 5.

2. Observations and Methods

2.1. Observation Site and Instrumentation

The observations during the ICE-POP campaign were carried out at the Cloud Physics Observation Site (CPOS) of Korea at the elevation of 842.5 m above sea level in Pyeongchang (37°41’ N, 128°45’ W) as shown in Figure 1. The CPOS is approximately 20 km inland from the sea to the east (East Sea) and is located on a hillside of a steep slope. Due to its geographical uniqueness, fog events at various stages and/or advected low level clouds were observed at CPOS (Song et al., 2019 [18]).
The major instruments installed at CPOS are listed in Table 1. The data used in this study were obtained from a suite of instruments on several platforms: (1) a 3 m Fog and Snow Observing System (FSOS) tower that was equipped with Laser Precipitation Monitor (LPM, Thiessen Inc., Bolton MA, USA), Automatic Weather Station (AWS, WXT-520, Vaisala Inc., Vantaa, Finland) Infrared sensor (IR sensor, Campbell Scientific Inc., Utah, USA), and Present Weather Detector (PWD-52, Vaisala Inc., Vantaa, Finland); (2) FM-120 Fog Monitor-120 (FM-120, Droplet Measurement Technologies Inc., Boulder, CO, USA) separately installed at 2 m above ground; (3) a 10 m meteorological tower equipped with AWS at 5.2 m above ground and PWD-22 at 3.7 m above ground; and (4) Two 3-D sonic anemometers (CSAT3, Campbell Scientific Inc.) at 3- and 6- m above ground. These instruments are approximately 5 m apart from each other, except the 3-D anemometers, which were approximately 30 m away from all the others.

2.2. Fog Microphysics

The FM-120 is a forward-scattering optical spectrometer probe (λ = 0.658 µm) that counts and sizes droplets with diameter ranges from 2 to 50 µm at a fixed true air speed (TAS). The sample flow volume (V) is calculated using TAS as
V = TAS · S
where S = 0.24 mm2 is the sampling area. TAS is a function of dynamic pressure and ambient temperature. Since the dynamic pressure measured by the pitot tube was unreliable, TAS with a fixed rate of 15 m s−1 was used (Guyot et al., 2015 [19]). Based on this information, the fog droplet number concentration, n(r), is obtained, where r is the geometric mean radius of each size interval. The assumption of a constant value of TAS lead to errors in the sample volume. However, the extinction coefficients calculated from the FM-120 and the PWD-52 data are in good agreement with a coefficient of determination, R2, close to 0.79 for all radiation fog cases where Vis is less than 1 km and relative humidity with respect to water ( RH w ) or ice ( RH i ) is higher than 90%. RH i can be obtained using the equations given in Gultepe et al. (2015) [20]. The FM-120 extinction coefficient β FM and the PWD-52 extinction coefficient β PWD are computed by the following equations (Vaisala 2004 [21]):
β FM = Q ext · π · n ( r ) r 2
β PWD = ln ( 0.05 ) Visbility
where the extinction efficiency Q ext is assumed to be 2 for fog droplet sizes and laser wavelength of 658 nm, based on Mie theory.
From the droplet size distribution measured by FM-120, total fog droplet number concentration (Nd), liquid water content (LWC), and mean volume diameter ( D v ) are calculated, respectively, as
N d = n ( r )
LWC = ρ w · 4 π 3 r 3 n ( r )
D v = ( 6 π · LWC ρ w · N d ) 1 3
where ρ w is the density of water.

2.3. Analysis of Kelvin–Helmholtz Instability (KHI)

In this study, we focus on the influence of quasi-periodic oscillations of atmospheric variables on fog evolution in the stable atmospheric boundary layer. Most parameters are averaged over 1-min intervals to remove the effects of small-scale turbulent processes. Due to the mountainous topographical characteristics, low-level clouds that approached from the East Sea were often observed at CPOS as advected fog. To analyze only the radiation fog events generated by longwave radiative cooling, we excluded such cases, which were characterized by non-existence of inversion layer and/or the presence of precipitation.
The Brunt–Vaisala frequency (BVF) is an essential parameter in dynamic meteorology (Stull, 2011 [22]). According to its conceptual definition, wave motion can be generated only when the atmosphere is stable, i.e., the squared BVF (N2) is positive. Under such conditions, a rising air parcel becomes colder than the stable environment due to adiabatic cooling, and therefore it returns to the starting point by the buoyancy force. The frequency of such oscillation in the stably stratified atmosphere is called BVF. On the other hand, if the atmosphere is statically unstable, i.e., if the N2 value is negative, the temperature (T) of the rising air parcel is greater than that of the surrounding air and the air parcel does not return to its starting point and moves to a different state that would be different from the initial one. For dry (unsaturated) atmospheres, BVF can be calculated as in Stull (2011) [22], with the following equation:
N dry 2 = g T · ( Δ T Δ z + Γ dry )
where Γ dry and g are dry adiabatic lapse rate (approximated a constant) and the gravitational acceleration, respectively.
For saturated air layers, BVF can be calculated as described in Lalas and Einaudi (1974) [23], Durran and Klemp (1982) [24], and Wilson et al. (2013) [25]:
N m 2 g T · [ ( T z ) + Γ m ] · [ 1 + L v q s RT ] g 1 + q w ( q w z )
with saturated adiabatic lapse rate as
Γ m = g c pd · ( 1 + q w ) · [ 1 + c pv q s + c w q L c pd + 0.622 · L v 2 q s c pd RT 2 ( 1 + q s 0.622 ) ] 1
where L v is the latent heat of vaporization. q w = ( q L + q s ) is the total water mixing ratio, q L is the liquid water mixing ratio, q s is the saturation mixing ratio, c pd is the specific heat of dry air, and c w is the specific heat of liquid water. Because of the lack of information on the vertical profile of the liquid water mixing ratio, we set d q w / dz = d q s / dz , following Wilson et al. (2013) [25]. Now, consider the bulk Richardson number Rib, which is defined as (Stull, 2011 [22]):
Ri b = N 2 ( Δ u Δ z ) 2 + ( Δ v Δ z ) 2
where the numerator N2 is the squared BVF for air layer and the denominator is the squared vertical shear of horizontal wind ( u hs ). Equation (10) suggested that an increase in u hs leads to a decrease in Rib. According to the inviscid linear theory, the shear instability dominates the buoyancy-related stability when 0 < Ri < 0.25 and vorticity waves can be generated by KHI (Sun et al., 2015 [26]). Meanwhile, Monti et al. (2002) [27] noted that due to nonlinear effects (e.g., wave-turbulence interactions), KHI could still be generated up to the range of Ri = 1 and become an important factor for the generation of turbulent motions and mixing.

3. Results

3.1. Overview of the Fog Cases

A total of 9 fog cases are selected as described in Section 2.3 among all the fog cases that occurred during the 9-month period (from September 2017 to May 2018) of the ICE-POP campaign. Table 2 shows the duration, wind speed, dominant wind direction, T, and microphysical properties of the 9 cases where Vis is less than 1 km and RH w , i is higher than 90%. All 9 cases occurred at dawn and all fog cases were dissipated completely around sunrise [~6:00 KST (KST = UTC + 9 h)]. In two cases, the T was below the freezing point. Glickman (2000) [28] suggested that ice fog usually occurs with T < −30 °C. However, there were also reports that ice fog could be generated by deposition nucleation under ice saturation conditions when ice-nucleating particles existed and T is between −5 and −13 °C (Gultepe et al., 2014, 2016 [29,30]). The average T of −6.5 °C in one case (Table 2, February 26, 2018, Case 8) was within that T range, and this suggested that ice fog may have formed in this case.
Cases 2, 3, and 4 have similar average LWC values (~0.01 g m−3), but the average Nd for Case 4 is the highest, while the average D v for Case 4 is the smallest among the three cases (Table 2). Niu et al. (2010) [31] argued that the first (Twomey) indirect aerosol effect, where polluted clouds would have higher Nd, but smaller droplet sizes than clean clouds when LWC is similar (Twomey, 1977 [32]), could be manifested not only in clouds but also in fog. This suggests that effects of aerosols on fog microphysics need to be studied further. The average Nd in Table 2 is generally comparable to those of the fog events measured in Nanjing, China (Lu et al., 2013 [33]) and those of the continental and marine fogs in Egbert and Lunenburg, Canada (Gultepe et al., 2009 [34]). The average LWC of the 9 cases ranged from 0.009 to 0.037 g m−3 and are comparable to the average LWC of the Nanjing fogs that ranged between 0.001 and 0.074 g m−3 (Lu et al., 2013 [33]).

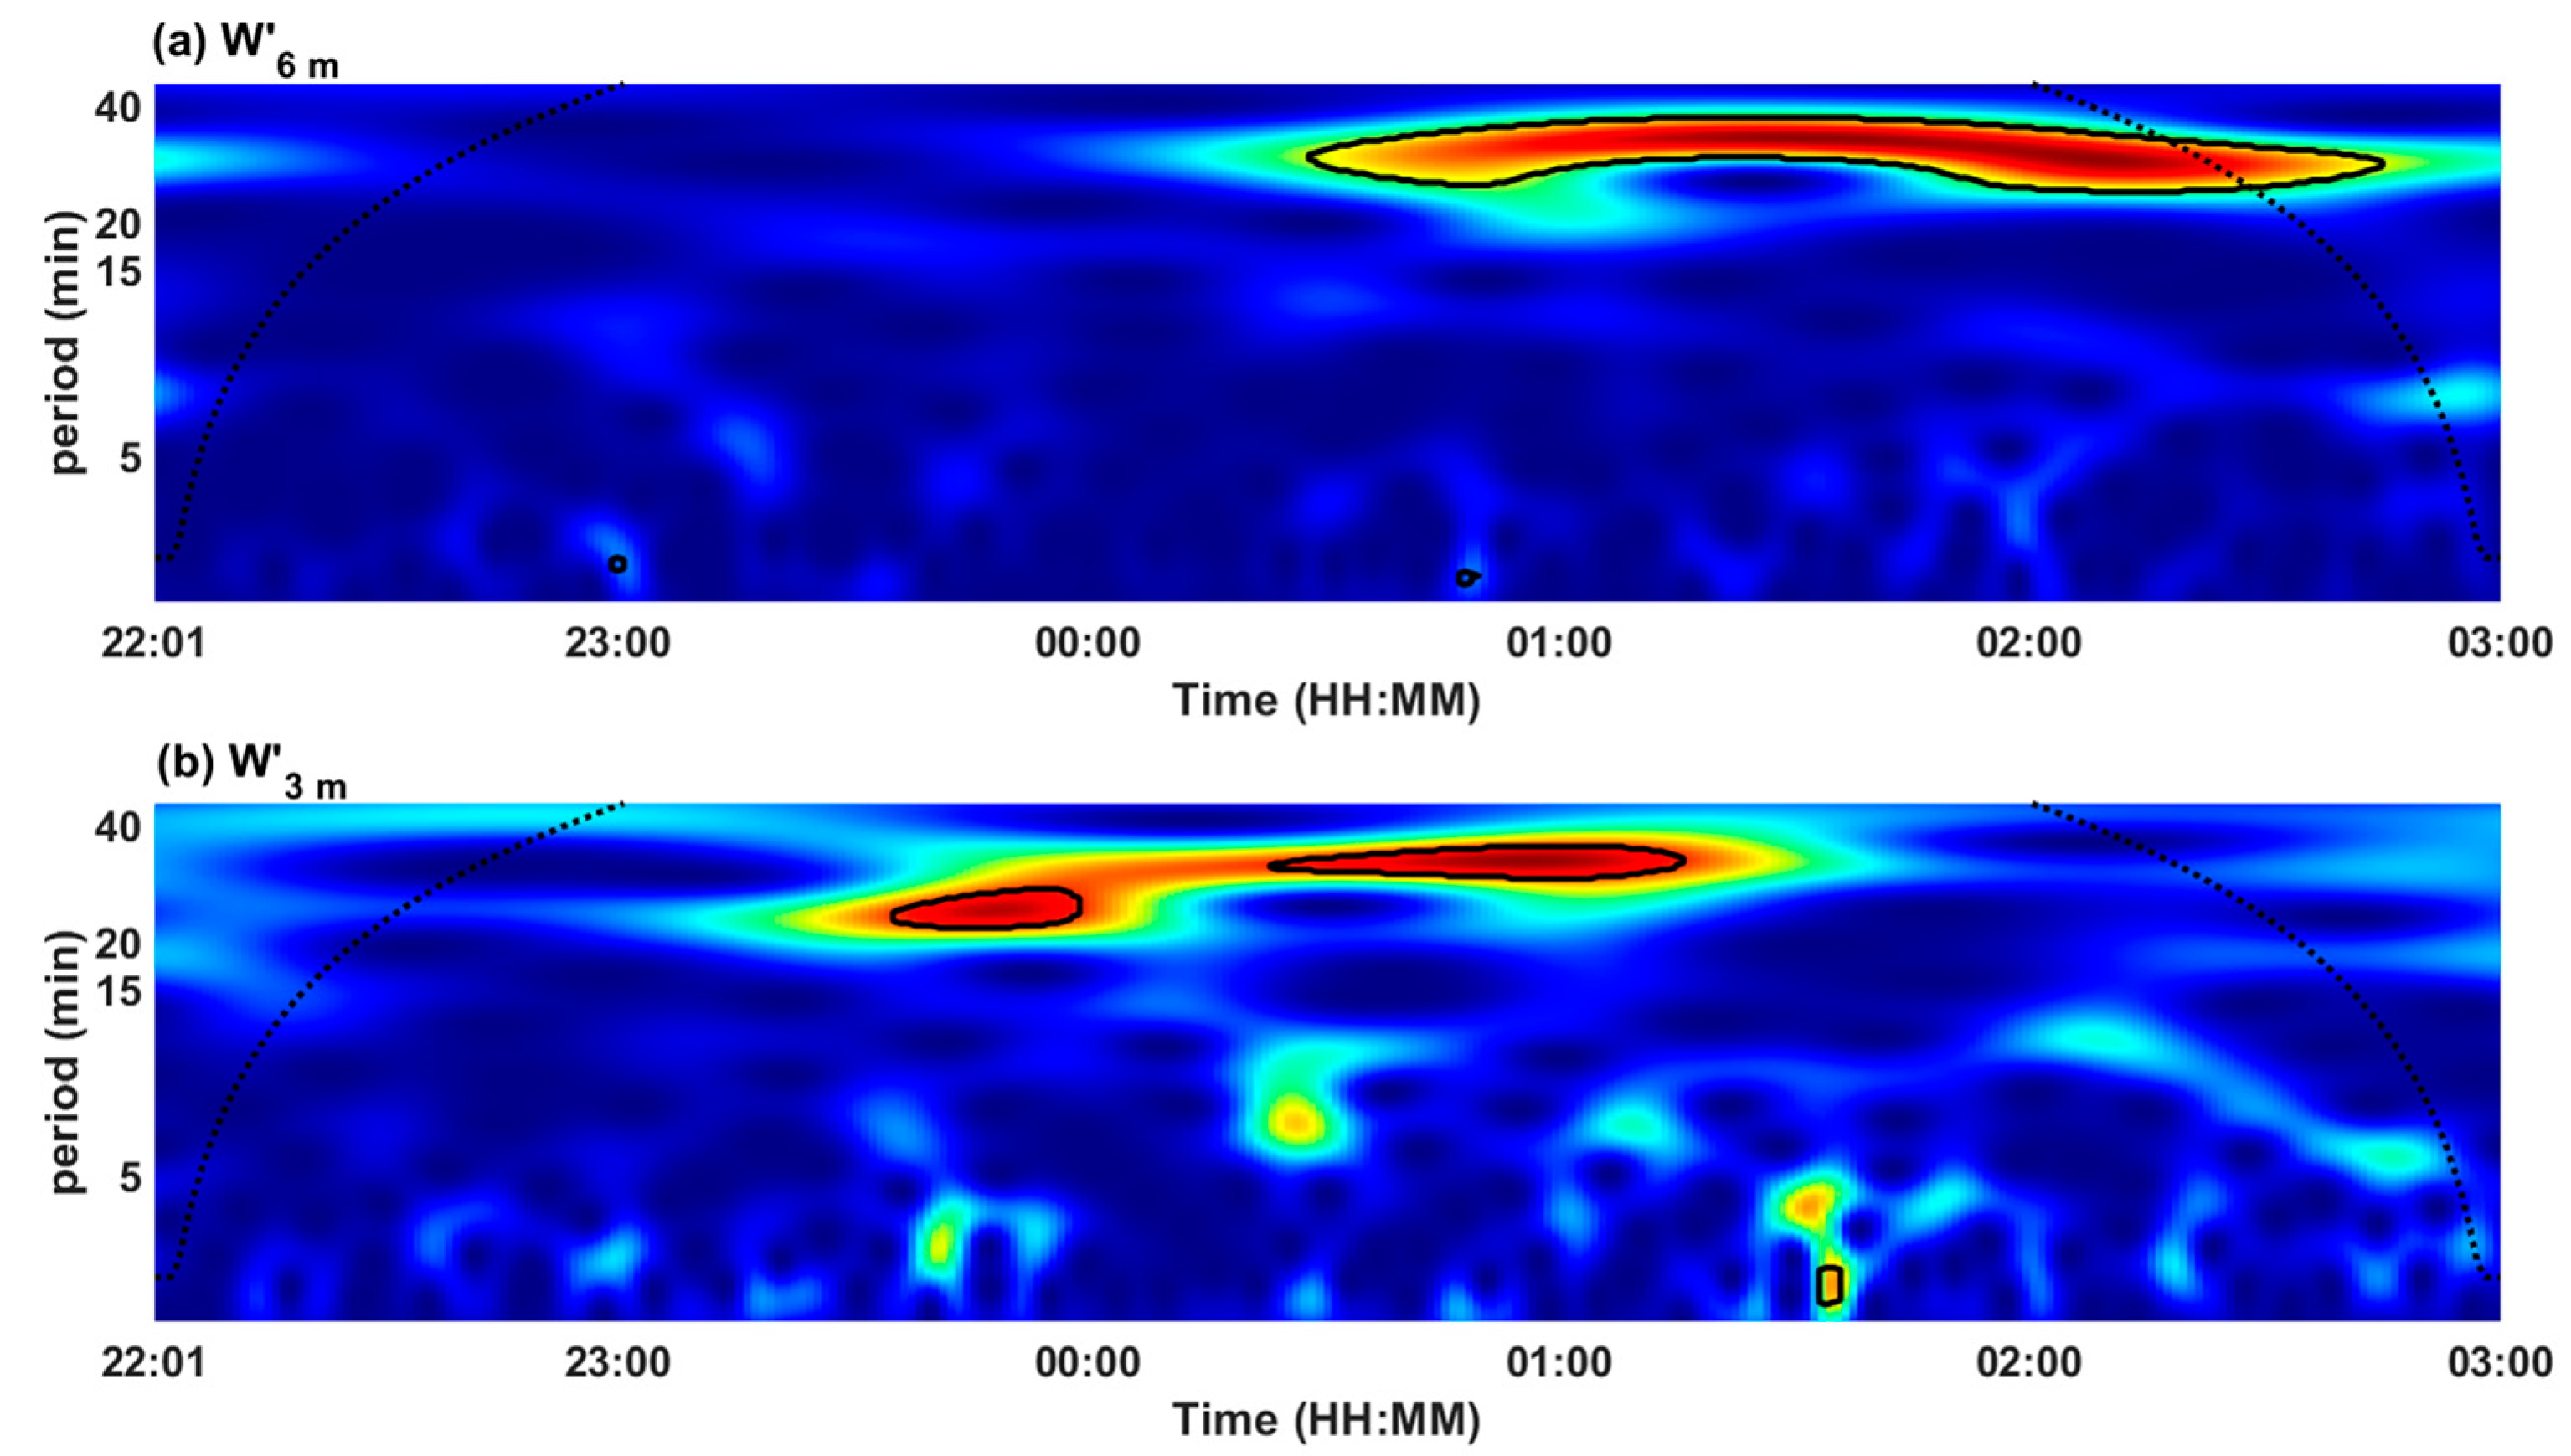
3.2. Results of Wavelet Transform Analysis

A wavelet transform is a powerful tool for time series analysis used in various research. For example, Gultepe et al. (2000) [35] used it to understand the dynamical characteristics of low−level Arctic clouds. By decomposing the time series into the time-frequency space, it can determine both the dominant periods and how these dominant periods change in time. Moreover, various processes occurring at different scales can be singled out. This study utilizes MATLAB implementation of the wavelet analysis defined in Torrence and Compo (1998) [36] and employs the Morlet wavelet analysis, consisting of a plane wave modulated by a Gaussian function. Turbulence and gravity wave structures have been investigated using the wavelet analysis methods (e.g., Hang et al., 2016; Rees et al., 2001; Terradellas et al., 2005; Viana et al., 2008; Román-Cascón et al., 2015 [14,37,38,39,40]). In the present work, wavelet analysis is applied to LWC and pressure time series. Note that the temporal resolution and accuracy of pressure sensors (attached to WXT-520) used in this study are not appropriate for detailed analysis of wave parameters such as wavelength, phase speed, and direction of propagation. However, the present study focuses more on investigating the fog evolution affected by quasi-periodic oscillations rather than studying the characteristics of gravity waves themselves (e.g., wavelength, phase speed) on the formation of fog; therefore, such limitation does not cause a significant problem.
For the selection of quasi-periodic oscillation events in a stable environment, wavelet power spectra are analyzed based on the wavelet transform described above. Periods greater than 45 min are filtered out using a high-pass Butterworth filter to avoid large-scale tendencies and diurnal cycles in the data—such data are called “filtered data.” In previous observational studies, the longest period of oscillations induced by KHI was observed to be about 40 min (e.g., Duynkerke, 1991a [4]), so we decided to remove the periods longer than 45 min. A high-pass Butterworth filter removes power spectrum gradually as the period increases, as shown in Figure S1 of the supporting information. The effect appears to be noticeable around the 40 min period. Wavelet power spectra are calculated by performing a wavelet transform on the filtered data. Figure 2 shows the time series of the raw and filtered data and the wavelet power spectrum of the filtered data. However, periodicity is indicated not only by the presence of quasi-periodic oscillations of LWC, but also by a sudden increase of LWC due to the onset of fog. It can also be influenced by turbulent eddies and some other processes (e.g., wave-turbulence interaction, surface heterogeneity, etc.) that lead to dirty waves consisting of many wave modes (Sun et al., 2015 [26]). For these reasons, several studies have attempted to examine the periodicity of pressure data that are relatively unaffected by turbulence; therefore, usually it is advantageous to identify wave-related oscillations (e.g., Hang et al., 2016; Román-Cascón et al., 2015; Stull, 1988 [14,40,41]). To find a physically meaningful periodicity, the periodicity with a spectral power above the significance level of 0.1 % (for red noise) is needed. Even though the accuracy of the pressure data is low and LWC can be affected by some other processes such as turbulence and topographic effects, the wavelet spectra could offer us at least qualitative insights on the selection of events with periodic motion.

3.3. Results Related to KHI

Using wavelet analysis, we divided the fog cases into two types: The group of Cases 2, 3, 4, 5, and 7 was classified as Type 1, where the filtered pressure ( p ) showed a periodicity when fog formed; and the group of Cases 1, 6, 8, and 9 was classified as Type 2, where no such periodicity appeared when fog formed (not shown). Among the Type 1 cases, Case 4 is selected as a representative KHI event because wave-like patterns were observed for all measured atmospheric parameters and the periodicities of these variables were relatively long-lasting. The periodicities of all other cases are discussed in more detail in Section 4.

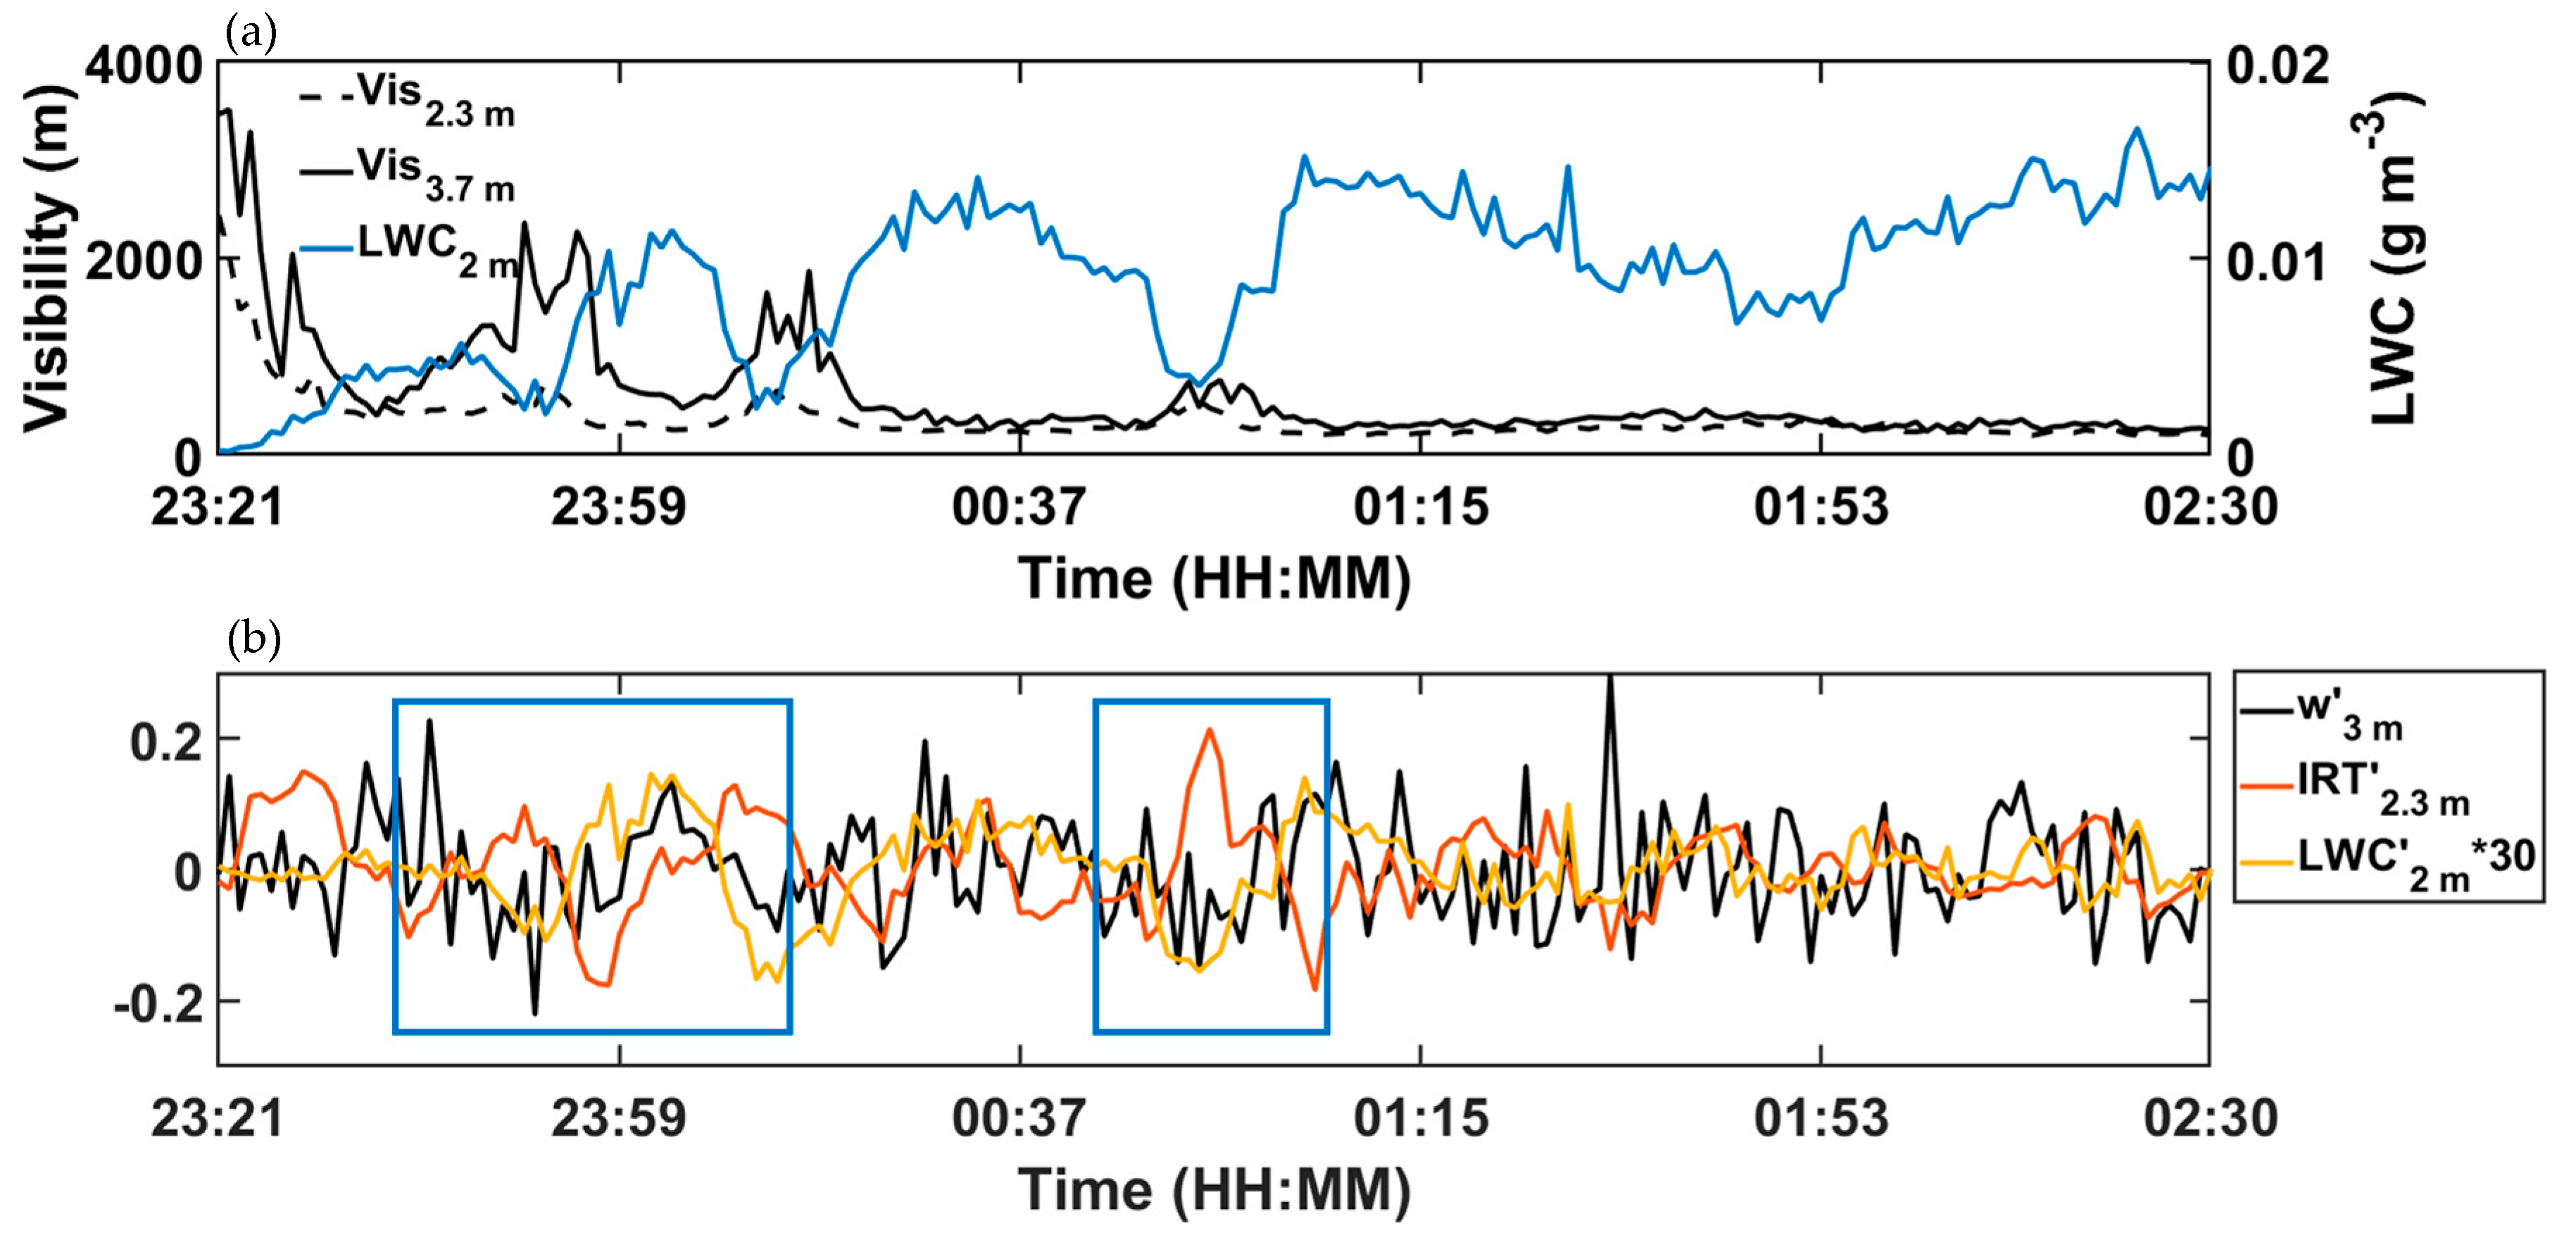
3.3.1. Representative KHI event (Case 4)

Figure 2 indicates that periodicities ranging from 15 to 40 min are statistically meaningful at a significance level of 0.1%. Periodicities were observed from 21:40 KST for p , from 23:30 KST for the filtered LWC ( LWC ), and from 22:00 KST for the filtered log(LWC) [log( LWC )]. Usually, as radiation fog forms, Vis gradually decreases to less than 1 km. Therefore, to detect the periodicity of LWC before the onset of fog, examining log(LWC) values is more desirable because in this way, periodicity of negligibly small LWC values before the onset of fog can be detected. Such stage is sometimes called as “quasi fog” or “near fog” (Haeffelin et al., 2010 [17]). The times at which LWC shows periodicity is later than the time at which p does. However, log( LWC ) does show periodicity nearly simultaneously with p (Figure 2b,f). This may indicate that KHI did induce fluctuation of meager amount of LWC at pre-formed stage of fog, which could be detected only for log(LWC).
To analyze the dynamical and thermodynamic characteristics of the atmosphere before the onset of fog, the time series of the N2 and the squared u hs are examined. The N2 is calculated from the temperature measurements at 3- and 5.1-m levels using 10-min averages of the WXT and AWS data. The u hs is calculated from the wind measurements at 3- and 5.1- m levels using 10-min averages of the WXT and AWS data. In Case 4, the N2 increases as the inversion layer develops until 21:00 KST before fog forms as shown in Figure 3. For saturated conditions (i.e., Vis less than 1 km), the squared moist BVF is shown together (blue dotted line), which is lower than the squared dry BVF because of the effects of latent heat release. After 21:00 KST, the N2 decreases and the squared u hs increases over time. Increasing u hs , which could promote KHI that would destroy the sharp T discontinuity, may induce such destabilization. Note that the time when p and log( LWC ) show periodicity is corresponding to the time when the N2 decreases and the squared u hs increases (Figure 2; Figure 3). Thus, we hypothesize that KHI induces these quasi-periodic oscillations.
Shear-induced mixing is expected to reduce vertical gradient of wind, but contrary to expectation, u hs continues to increase, as shown in Figure 3. Fukao et al. (2011) [42] stated that reduction of u hs by KHI could be negligible when large scale wind is solid enough to maintain u hs . Figure 4 shows that, similarly to u hs , wind speed in the zonal direction (from the 3-D anemometers, located approximately 30 m away from the WXT-520) also gradually increases before fog forms. This can indicate that increase in wind speed is associated with the development of u hs . Moreover, in the middle of the fog duration wave-like patterns occurred also in the time series of the zonal (U) and meridional (V) winds (from ~0000 KST until ~0200 KST). As mentioned earlier, Uematus et al. (2007) [13] showed that KHI could induce roll structures in fog, using Doppler radar data. The roll structure may be associated with oscillations of meteorological variables and is examined in detail in Section 3.4.

3.3.2. Non-KHI event (Case 6)

Case 6 shows yet another different observed pattern compared to Case 4. Both u hs and wind speed were weak and did not increase (Figure 5 and Figure 6) and were broadly consistent with the case of Ye et al. (2015) [7], indicating that shear production of turbulent kinetic energy (TKE) was inefficient and wind speed was weak (1.31 m s−1 at 10 m altitude). Unlike in Case 4 that showed an increase of squared u hs and corresponding decrease of N2, in Case 6 the N2 shows a maximum at 23:00 KST, fluctuates randomly until ~4:00 KST, and then decreases sharply as fog forms (Figure 5). Figure 6 shows that wind speed in Case 6 is weaker than that for Case 4 and does not increase with time.

3.3.3. Statistical analysis

To examine the thermodynamic and dynamic conditions of the 9 radiation fog cases observed during the campaign, a simple linear regression of the time series data (i.e., N2 vs. time, squared u hs vs. time, and wind speed vs. time) is applied and results are shown in Table 3. The calculations were made over an interval from the time at which the maximum value of the N2 appeared prior to the onset of fog to the time of 30 min after the onset of fog. The slope of wind speed is calculated using 3-D sonic anemometer data at 3 m above ground. The slopes of N2, u hs , and wind speed for the Type 1 cases are different from those for the Type 2 cases (Table 3). The slope of the linear regression analysis between squared u hs and time (N2 and time) is higher (lower) for the Type 1 cases than for the Type 2 cases (Table 3). Although linear regression slope does not necessarily show the size of Ri, it means that, as time increased wind shear increased, but N2 decreased, meaning that Ri decreased with time, which is a function of both u hs and N2. That is, the evolution of shear instability for the Type 1 cases were different from that for the Type 2 cases where wave motions did not occur. These results support the hypothesis of KHI being generated by dynamical instability. Moreover, log( LWC ) and p tend to show periodicities simultaneously in the Type 1 cases (not shown). Because log( LWC ) and p have periodicities ranging from 15 to 40 min at the time of the KHI event, it is conjectured that periodicity is affected by KHI.
The Type 2 cases did not show these features of simultaneous occurrence of periodicity of log( LWC ) and p (not shown). Moreover, in the Type 1 cases, wind shear increased but BVF decreased before fog formation, and therefore R2 is relatively high. Such was not true for the Type 2 cases, where these properties randomly fluctuated before the onset of fog, and therefore R2 was relatively low. This means that the destabilization may not be produced by u hs in these cases. Thus, it is conjectured that Kelvin–Helmholtz instability (KHI) does not appear in the Type 2 cases. The slope of wind speed is discussed in Section 4.

3.4. Fog Evolution Affected by KHI

Results show that when KHI appears, warm and dry air above the fog top may entrain into the cold and moist fog layer as depicted in Figure 7. This schematic plot illustrates how a fog layer under the influence of KHI could be transformed into a roll structure as observed by Doppler radar measurement (Uematsu et al., 2007 [13]) and simulated by LES in Bergot (2013) [16]. Figure 8 shows the time series of Vis and LWC, and filtered variables [i.e., LWC , filtered vertical velocity ( w ), and filtered infrared (IR) temperature ( IRT )] at the formation stage of Case 4. For the time ranges marked with the blue rectangles, w and IRT tends to be negatively correlated and so does IRT and LWC , especially when Vis fluctuates (until ~0100 KST, see Figure 8a,b). The phenomena depicted in Figure 7 also indicate that the oscillations in LWC and w’ at 3 m above ground can be anti-correlated with the T oscillations. However, such relationships and periodicity gradually disappear after ~0100 KST (Figure 8a,b). The observed Vis at 2.3 m is lower than that observed at 3.7 m at earlier time, but as the fog deepens Vis gradually becomes similar at the two altitudes (Figure 8a). This could indicate that the depth of the fog layer increases by about 2 m during the fog duration. Then, periodicity would disappear near the surface. Compared to w’ observed at 3 m altitude, oscillations of w’ at 6 m altitude occurred later and continued until later (Figure 9).

4. Discussion

The KHI that occurs near the upper part of the fog with an inversion causes vertical mixing. When KHI appears in fog layer (Case 4), it affects subsequent evolution of fog. KHI seems to appear at the pre-formed stage of fog in cases of increased wind speed (Table 3). Then, as the fog became thick, the fluctuations of LWC at 2 m, IRT at 2.3 m, Vis at 3.7 m, and w’ at 3 m above ground did not appear near the surface anymore. However, w’ at 6 m height showed periodicities later and continued to do so until later than that shown by w’ at 3 m height. This is partially consistent with previous LES studies of wind structures associated with KHI within a radiation fog (e.g., Bergot, 2013 [16]), who simulated a fog case which wind speed increased from ~1 m s−1 to ~3 m s−1 at 10 m altitude as fog formed. He showed that KHI generated in the middle of a fog layer during the fog formation and stated that moderate winds at the top of fog layer could be advantageous to the development of u hs that is strong enough to cause KHI. Moreover, he showed that the maximum LWC and KHI was near the surface when fog formed and then they migrated to the top of the fog layer as the fog deepened. Their depth is about one-third of the fog top height during the mature stage, which may be why the periodicity disappears near the surface in the current study. Furthermore, Maronga and Bosveld (2017) [9] showed that KHI occurred before the onset of fog in the case with the strongest wind among the cases with geostrophic wind speeds between 2 and 6 m s−1. In contrast, Mazoyer et al. (2017) [43] suggested that in the case of increasing wind speeds from ~1 m s−1 to ~3 m s−1 at 10 m altitude, KHI began to be clearly identified when the fog was fully developed but not at the initial stage. Moreover, some LES simulations showed that when fog formed under calm wind condition (less than 1 m s−1 at 10 m altitude), roll structures associated with KHI could be generated at the mature stage and not at the formation stage (Nakanishi, 2000; Porson et al., 2011 [15,44]). Nakanishi (2000) [15] stated that KHI was not found during the formation stage because the ratio of the height of the inflection point to a half depth of the shear layer (i.e., non-dimensional distance of the shear layer from the ground) was less than 0.9 based on the application of the linear stability analysis of Davis and Peltier (1976) [45]. In other observational studies, Duynkerke (1991a, b) [4,46] also observed KHI during the fully developed stage under calm wind condition near the ground. This indicates that moderate wind may not be a prerequisite for the occurrence of KHI.
In Cases 4 and 7 among the Type 1 cases, all the measured atmospheric variables showed periodicities (not shown). In all other Type 1 cases, p , log( LWC ), and filtered temperature ( T ) showed statistically significant periodicity when fog formed but vertical and horizontal winds did not show periodicity (not shown). Perhaps this is because vertical wind induced by waves was generally weak near the surface and also horizontal winds could have been contaminated by the complex mountainous terrain of Pyeongchang (e.g., Sun et al., 2015 [26]). Meanwhile, in his LES model study Bergot (2013) [16] showed that fluctuation of T was relatively weak compared to those of LWC and wind speed. In contrast, in Case 6 among the Type 2 cases, p did not show periodicity when the N2 decreased (not shown), which is contrary to Case 4 (see Figure 2 and Figure 3). However, log( LWC ) did show periodicity when fog formed (not shown) because it might be influenced by a sharply increasing LWC at the time of fog onset and are more likely effected by local terrain features and turbulence than pressure as mentioned in Section 3.2. It is difficult to find complete answer to discriminate between the wave-like pattern and non-wave-like pattern of meteorological parameters (except pressure) in association with radiation fog.
As shown in Figure 1, there may be an effect of the slope on fog formation because CPOS is located at the floor of the valley (150~250 m deep, 3~4 km wide). However, the dominant wind direction is westerly for the Type 1 cases where wave motions occurred. Therefore, the terrain is relatively flat in the zonal direction, and the influence of the down-slope flow should have been weak. One of the ideal conditions for cold pool to occur is calm conditions (Jemmett-Smith et al., 2019 [47]), but the Type 1 cases are not considered to be in calm conditions. Moreover, wind speeds in the Type 1 cases is stronger than those in the Type 2 cases where wave motions did not occur. Therefore, cold air pools, drainage flows and/or katabatic winds may not have exerted notable influences in the Type 1 cases. Meanwhile, Terradellas et al. (2001) [48] showed that the intermittent turbulence had a temporal scale of 2.5 min or smaller. Periodicities ranged from 15 to 40 min (Figure 2), which suggests that observed periodicities were not likely to be caused by intermittent turbulence. One needs to keep in mind that instead of interpreting quasi-periodic oscillations as a result of KHI, they can also be generated by trapped gravity waves near the surface in the stable boundary layer (Duynkerke, 1991a [4]). However, Terradellas et al. (2001) [48] showed that the periods induced by gravity waves were between 12 and 14 min, which was much shorter than the observed periods (15~40 min) in this study, and stated that the periods longer than 16 min might be caused by other processes such as KHI. Moreover, using the Weather Research and Forecasting (WRF) Model, Conrick et al. (2018) [49] showed that KHI developed within the melting layer of stratiform precipitation when easterly flow near the surface increased, wind shear increased, and low-level stability decreased. As shown in Table 3, Type 1 cases where wave motions occurred are also characterized by increase in wind speed and u hs , but a decrease in N2. Such is not the case for the Type 2 cases. Such results support our argument that wave motions in the Type 1 cases are induced by KHI. However, increased u hs is not the only prerequisite for KHI occurrence. As mentioned above, Nakanishi (2000) [15] showed that KHI occurred when non-dimensional distance of the shear layer from the ground was more than 0.9. Moreover, it is difficult to distinguish whether the observed periodicities were induced by simultaneous occurrence of KHI and gravity waves. Garratt (1994) [50] stated that quasi-periodic oscillations could be induced by a combination of some other influences (e.g., low-level jet, gravity waves, topographical effect, advection, mesoscale influences). As mention earlier, based on Ka-band scanning Doppler radar observation, Uematsu et al. (2007) [13] suggested that band (horizontal scale ~ 1.5 km) and roll (horizontal scale ~ 600 m) structures of fog were induced by gravity waves and KHI. Meanwhile, Smyth and Moum (2012) [51] suggested that KHI is a key link in a series of incidents that lead from internal gravity waves to turbulence in the sea. Thus, to explore quasi-periodic oscillations under stable conditions over various temporal and spatial scales, extensive instrumentation is required (from large to micro scales).
Bergot (2013) [16] suggested that the turbulent mixing induced by KHI could break up the surface inversion layer. Moreover, Maronga and Bosveld (2017) [9] showed that KHI induced increase of TKE before the fog formation. Table 3 supports the hypothesis of inversion layer destruction by KHI before the onset of fog, because it shows that the BVF values reduce much faster from the maximum value of BVF for the Type 1 cases than for the Type 2. For example, in Case 4, the BVF continuously decreases as u hs increases after the inversion layer develops before the onset of fog. Because of the vertical mixing by KHI, the T at the upper and lower parts of the fog layers gradually become similar, and the BVF decreases. These results could indicate the possible role of KHI in reducing the BVF effectively. Overall, the comparison between the present fog cases and numerical studies are consistent with each other. However, even in Type 2, the BVF is observed to decrease before the onset of fog (Figure 5) although the BVF values for the Type 2 cases decrease much slower than those for Type 1. More careful studies that investigate the turbulent fluxes (e.g., the surface sensible and latent heat fluxes) related to the evolution of TKE and the effect of horizontal advections of T and water vapor are needed to fully understand why BVF decreases before the fog formation.

5. Summary and Conclusions

We selected nine radiation fog cases in the manner as described in Section 2.3 among all the fog cases occurred at the CPOS observation site in Pyeongchang, Korea, from September 2017 to May 2018. The current study focused on the effects of quasi-periodic oscillations on the evolution of radiation fog. Through wavelet analysis, we investigated the existence of quasi-periodic oscillations that could be associated with KHI, which would indicate the modulation of thermodynamic and dynamic conditions in the fog layer. The main results can be summarized as follow:
(1)
For five fog cases, KHI might affect their development. This is shown by p and log( LWC ) time series that showed periodicity almost simultaneously when the N2 decreases and the squared u hs increases (not shown). These cases are classified as Type 1. The Type 2 cases are the ones that do not show such features (not shown).
(2)
The average wind speeds for the Type 1 cases are larger than those for the Type 2 cases. These results are in reasonable agreement with the results of LES and WRF models (Maronga and Bosveld, 2017; Bergot, 2013; Conrick et al., 2018 [9,16,49]) in the sense that moderate wind speed, causing wind shear to increase, is favorable to generate KHI.
(3)
The Type 1 cases are characterized by increase in wind speed before the onset of fog. Apparently, u hs reduction caused by shear-induced mixing is negligible because large-scale wind field is solid enough to overcome such a setback. The dominant wind direction is westerly in the Type 1 cases. In the meantime, wind is calm and there is no tendency for a dominant wind direction in the Type 2 cases.
(4)
The Type 1 cases last approximately for three to ten hours and are more enduring than the Type 2 cases. However, most cases began to dissipate around sunrise (~ 6:00 KST). Although the Type 1 cases occur about two hours earlier on average, the number of fog cases is insufficient to extract statistically significant feature of KHI. Therefore, more fog cases are needed to estimate how much KHI effects on the fog lifetime.
Gultepe et al. (2019a, b) [1,52] indicated that unmanned aerial vehicles (UAVs), which are becoming popular for meteorological applications, could provide better information more safely, including profiles of dynamic, microphysical, and thermodynamic parameters of meteorological phenomena. Indeed, in future studies, UAV measurement may play an important role in measuring KHI. To identify the contribution of KHI to radiation fog, two critical challenges must be addressed. The first is to quantify the effects of turbulent mixing on fog formation. As mentioned earlier, discrepancies exist among the arguments for the effects of turbulent mixing on fog formation. Thus, the effects of turbulence fluxes associated with KHI on fog formation need to be quantitatively explored in future field experiments. The second is to understand the effect of entrainment at the top of fog on fog microphysics. Entrainment of warm and dry air into the cold and moist fog air due to quasi-periodic oscillations near the fog top may modulate the fog droplet size distribution and subsequent modulation of microphysical and dynamic properties of fog, which is an interesting subject for future fog study.

Supplementary Materials

The following are available online at https://www.mdpi.com/2073-4433/11/3/230/s1, Figure S1: The power spectrum of a pressure for the time series.

Author Contributions

Conceptualization, I.L. and S.S.Y.; methodology, I.L. and J.I.S.; software, I.L. and J.I.S.; validation, I.L. and S.S.Y.; formal analysis, I.L. and J.M.Y.; investigation, I.L., J.M.Y. and I.G.; resources, I.G. and J.W.C.; data curation, I.L., J.M.Y., and I.G.; writing—original draft preparation, I.L.; writing—review and editing, S.S.Y. and I.G.; visualization, I.L.; supervision, S.S.Y.; project administration, S.S.Y.; funding acquisition, S.S.Y. All authors have read and agreed to the published version of the manuscript.

Funding

This work was supported by the National Research Foundation of Korea (NRF) grant funded by the Korea government (MSIT) (No. NRF-2018R1A2B2006965).

Acknowledgments

The Pyeongchang and surroundings map was downloaded from the © Google Earth service.

Conflicts of Interest

The authors declare no conflict of interest.

References

  1. Gultepe, I.; Tardif, R.; Michaelides, S.C.; Cermak, J.; Bott, A.; Bendix, J.; Müller, M.D.; Pagowski, M.; Hansen, B.; Ellrod, G.; et al. Fog research: A review of past achievements and future perspectives. Pure Appl. Geophys. 2007, 164, 1121–1159. [Google Scholar] [CrossRef]
  2. Gultepe, I.; Sharman, R.; Williams, P.D.; Zhou, B.; Ellrod, G.; Minnis, P.; Trier, S.; Griffin, S.; Yum, S.S.; Gharabaghi, B.; et al. A Review of High Impact Weather for Aviation Meteorology. Pure Appl. Geophys. 2019, 176, 1869–1921. [Google Scholar] [CrossRef]
  3. Roach, W.T. On some quasi-periodic oscillations observed during a field investigation of radiation fog. Q. J. R. Meteorol. Soc. 1976, 102, 355–359. [Google Scholar] [CrossRef]
  4. Duynkerke, P.G. Observation of a quasi-periodic oscillation due to gravity waves in a shallow radiation fog. Q. J. R. Meteorol. Soc. 1991, 117, 1207–1224. [Google Scholar] [CrossRef]
  5. Terradellas, E.; Ferreres, E.; Soler, M.R. Analysis of turbulence in fog episodes. Adv. Sci. Res. 2008, 2, 31–34. [Google Scholar] [CrossRef] [Green Version]
  6. Zhou, B.; Ferrier, B.S. Asymptotic analysis of equilibrium in radiation fog. J. Appl. Meteorol. Climatol. 2008, 47, 1704–1722. [Google Scholar] [CrossRef]
  7. Ye, X.; Wu, B.; Zhang, H. The turbulent structure and transport in fog layers observed over the Tianjin area. Atmos. Res. 2015, 153, 217–234. [Google Scholar] [CrossRef]
  8. Degefie, D.T.; El-Madany, T.S.; Hejkal, J.; Held, M.; Dupont, J.C.; Haeffelin, M.; Klemm, O. Microphysics and energy and water fluxes of various fog types at SIRTA, France. Atmos. Res. 2015, 151, 162–175. [Google Scholar] [CrossRef]
  9. Maronga, B.; Bosveld, F.C. Key parameters for the life cycle of nocturnal radiation fog: A comprehensive large-eddy simulation study. Q. J. R. Meteorol. Soc. 2017, 143, 2463–2480. [Google Scholar] [CrossRef]
  10. Gerber, H.E. Microstructure of a Radiation Fog. J. Atmos. Sci. 1981, 38, 454–458. [Google Scholar] [CrossRef] [Green Version]
  11. Nilsson, E.D. Planetary boundary layer structure and air mass transport during the International Arctic Ocean Expedition 1991. Tellus Ser. B Chem. Phys. Meteorol. 1996, 48, 178–196. [Google Scholar] [CrossRef]
  12. Nilsson, E.D.; Bigg, E.K. Influences on formation and dissipation of high arctic fogs during summer and autumn and their interaction with aerosol. Tellus Ser. B Chem. Phys. Meteorol. 1996, 48, 234–253. [Google Scholar] [CrossRef]
  13. Uematsu, A.; Hashiguchi, H.; Yamamoto, M.K.; Dhaka, S.K.; Fukao, S. Influence of gravity waves on fog structure revealed by a millimeter-wave scanning Doppler radar. J. Geophys. Res. Atmos. 2007, 112, 1–10. [Google Scholar] [CrossRef]
  14. Hang, C.; Nadeau, D.F.; Gultepe, I.; Hoch, S.W.; Román-Cascón, C.; Pryor, K.; Fernando, H.J.S.; Creegan, E.D.; Leo, L.S.; Silver, Z.; et al. A Case Study of the Mechanisms Modulating the Evolution of Valley Fog. Pure Appl. Geophys. 2016, 173, 3011–3030. [Google Scholar] [CrossRef]
  15. Nakanishi, M. Large-eddy simulation of radiation fog. Bound. Layer Meteorol. 2000, 94, 461–493. [Google Scholar] [CrossRef]
  16. Bergot, T. Small-scale structure of radiation fog: A large-eddy simulation study. Q. J. R. Meteorol. Soc. 2013, 139, 1099–1112. [Google Scholar] [CrossRef]
  17. Haeffelin, M.; Bergot, T.; Elias, T.; Tardif, R.; Carrer, D.; Chazette, P.; Colomb, M.; Drobinski, P.; Dupont, E.; Dupont, J.C.; et al. PARISFOG: Shedding new light on fog physical processes. Bull. Am. Meteorol. Soc. 2010, 91, 767–783. [Google Scholar] [CrossRef] [Green Version]
  18. Song, J.I.; Yum, S.S.; Gultepe, I.; Chang, K.H.; Kim, B.G. Development of a new visibility parameterization based on the measurement of fog microphysics at a mountain site in Korea. Atmos. Res. 2019, 229, 115–126. [Google Scholar] [CrossRef]
  19. Guyot, G.; Gourbeyre, C.; Febvre, G.; Shcherbakov, V.; Burnet, F.; Dupont, J.C.; Sellegri, K.; Jourdan, O. Quantitative evaluation of seven optical sensors for cloud microphysical measurements at the Puy-de-Dôme Observatory, France. Atmos. Meas. Tech. 2015, 8, 4347–4367. [Google Scholar] [CrossRef] [Green Version]
  20. Gultepe, I.; Zhou, B.; Milbrandt, J.; Bott, A.; Li, Y.; Heymsfield, A.J.; Ferrier, B.; Ware, R.; Pavolonis, M.; Kuhn, T.; et al. A review on ice fog measurements and modeling. Atmos. Res. 2015, 151, 2–19. [Google Scholar] [CrossRef] [Green Version]
  21. Vaisala. Present Weather Detector PWD22 User’S Guide; Vaisala Oyj: Helsinki, Finland, 2004; p. 25. [Google Scholar]
  22. Stull, R. Meteorology for Scientists and Engineers, 3rd ed.; The University of British Columbia: Vancouver, BC, Canada, 2011; pp. 119–142. [Google Scholar]
  23. Lalas, D.P.; Einaudi, F. On the Characteristics of Gravity Waves Geneated by Atmospheric Shear Layers. J. Atmos. Sci. 1976, 33, 1248–1259. [Google Scholar] [CrossRef] [Green Version]
  24. Durran, D.R.; Klemp, J.B. On the effects of moisture on the Brunt-Vaisala frequency. J. Atmos. Sci. 1982, 39, 2152–2158. [Google Scholar] [CrossRef]
  25. Wilson, R.; Luce, H.; Hashiguchi, H.; Shiotani, M.; Dalaudier, F. On the effect of moisture on the detection of tropospheric turbulence from in situ measurements. Atmos. Meas. Tech. 2013, 6, 697–702. [Google Scholar] [CrossRef] [Green Version]
  26. Sun, J.; Nappo, C.J.; Mahrt, L.; Belušic, D.; Grisogono, B.; Stauffer, D.R.; Pulido, M.; Staquet, C.; Jiang, Q.; Pouquet, A.; et al. Review of wave-turbulence interactions in the stable atmospheric boundary layer. Rev. Geophys. 2015, 53, 956–993. [Google Scholar] [CrossRef]
  27. Monti, P.; Fernando, H.J.S.; Princevac, M.; Chan, W.C.; Kowalewski, T.A.; Pardyjak, E.R. Observations of Flow and Turbulence in the Nocturnal Boundary Layer over a Slope. J. Atmos. Sci. 2002, 59, 2513–2534. [Google Scholar] [CrossRef]
  28. Glickman, T.S. 2000: Glossary of Meteorology, 2nd ed.; Am. Meteorol. Soc.: Boston, MA, USA, 2000; p. 565. [Google Scholar]
  29. Gultepe, I.; Kuhn, T.; Pavolonis, M.; Calvert, C.; Gurka, J.; Heymsfield, A.J.; Liu, P.S.K.; Zhou, B.; Ware, R.; Ferrier, B.; et al. Ice fog in arctic during fram-ice fog project aviation and nowcasting applications. Bull. Am. Meteorol. Soc. 2014, 95, 211–226. [Google Scholar] [CrossRef] [Green Version]
  30. Gultepe, I.; Fernando, H.J.S.; Pardyjak, E.R.; Hoch, S.W.; Silver, Z.; Creegan, E.; Leo, L.S.; Pu, Z.; De Wekker, S.F.J.; Hang, C. An Overview of the Materhorn Fog Project: Observations and Predictability. Pure Appl. Geophys. 2016, 173, 2983–3010. [Google Scholar] [CrossRef]
  31. Niu, S.; Lu, C.; Liu, Y.; Zhao, L.; Lü, J.; Yang, J. Analysis of the microphysical structure of heavy fog using a droplet spectrometer: A case study. Adv. Atmos. Sci. 2010, 27, 1259–1275. [Google Scholar] [CrossRef]
  32. Twomey, S. The Influence of Pollution on the Shortwave Albedo of Clouds. J. Atmos. Sci. 1977, 34, 1149–1152. [Google Scholar] [CrossRef] [Green Version]
  33. Lu, C.; Liu, Y.; Niu, S.; Zhao, L.; Yu, H.; Cheng, M. Examination of microphysical relationships and corresponding microphysical processes in warm fogs. Acta Meteorol. Sin. 2013, 27, 832–848. [Google Scholar] [CrossRef]
  34. Gultepe, I.; Pearson, G.; Milbrandt, J.A.; Hansen, B.; Platnick, S.; Taylor, P.; Gordon, M.; Oakley, J.P.; Cober, S.G. The Fog Remote Sensing and Modeling Field Project. Bull. Am. Meteorol. Soc. 2009, 90, 341–360. [Google Scholar] [CrossRef]
  35. Gultepe, I.; Isaac, G.; Hudak, D.; Nissen, R.; Strapp, J.W. Dynamical and microphysical characteristics of Arctic clouds during BASE. J. Clim. 2000, 13, 1225–1254. [Google Scholar] [CrossRef]
  36. Torrence, C.; Compo, G.P. A Practical Guide to Wavelet Analysis. Bull. Am. Meteorol. Soc. 1998, 97, 412–422. [Google Scholar] [CrossRef] [Green Version]
  37. Rees, J.M.; Staszewski, W.J.; Winkler, J.R. Case study of a wave event in the stable atmospheric boundary layer overlaying an Antarctic Ice Shelf using the orthogonal wavelet transform. Dyn. Atmos. Ocean 2001, 34, 245–261. [Google Scholar] [CrossRef]
  38. Terradellas, E.; Soler, M.R.; Ferreres, E.; Bravo, M. Analysis of oscillations in the stable atmospheric boundary layer using wavelet methods. Bound. Layer Meteorol. 2005, 114, 489–518. [Google Scholar] [CrossRef]
  39. Viana, S.; Terradellas, E.; Yague, C.; Maqueda, G. Analysis of the different regimes of atmospheric turbulence observed during a single night. Nuovo Cim. Della Soc. Ital. Fis. C 2008, 31, 723–742. [Google Scholar]
  40. Román-Cascón, C.; Yagüe, C.; Mahrt, L.; Sastre, M.; Steeneveld, G.-J.; Pardyjak, E.; van de Boer, A.; Hartogensis, O. Interactions among drainage flows, gravity waves and turbulence: A BLLAST case study. Atmos. Chem. Phys. 2015, 15, 9031–9047. [Google Scholar]
  41. Stull, R.B. An Introduction to Boundary Layer Meteorology; Kluwer Academic Publishers: Dordrecht, The Netherlands, 1988; pp. 524–534. [Google Scholar]
  42. Fukao, S.; Luce, H.; Mega, T.; Yamamoto, M.K. Extensive studies of large-amplitude Kelvin-Helmholtz billows in the lower atmosphere with VHF middle and upper atmosphere radar. Q. J. R. Meteorol. Soc. 2011, 137, 1019–1041. [Google Scholar] [CrossRef]
  43. Mazoyer, M.; Lac, C.; Thouron, O.; Bergot, T.; Masson, V.; Musson-Genon, L. Large eddy simulation of radiation fog: Impact of dynamics on the fog life cycle. Atmos. Chem. Phys. 2017, 17, 13017–13035. [Google Scholar] [CrossRef] [Green Version]
  44. Porson, A.; Price, J.; Lock, A.; Clark, P. Radiation Fog. Part II: Large-Eddy Simulations in Very Stable Conditions. Bound. Layer Meteorol. 2011, 139, 193–224. [Google Scholar] [CrossRef]
  45. Davis, P.A.; Peltier, W.R. Resonant Parallel Shear Instability in the Stably Stratified Planetary Boundary Layer. J. Atmos. Sci. 1976, 33, 1287–1300. [Google Scholar] [CrossRef] [Green Version]
  46. Duynkerke, P.G. Radiation Fog: A Comparison of Model Simulation with Detailed Observations. Mon. Weather Rev. 1991, 119, 324–341. [Google Scholar] [CrossRef] [Green Version]
  47. Jemmett-Smith, B.C.; Ross, A.N.; Sheridan, P.F.; Hughes, J.K.; Vosper, S.B. A case-study of cold-air pool evolution in hilly terrain using field measurements from COLPEX. Q. J. R. Meteorol. Soc. 2019, 145, 1290–1306. [Google Scholar] [CrossRef] [Green Version]
  48. Terradellas, E.; Morales, G.; Cuxart, J.; Yagüe, C. Wavelet methods: Application to the study of the stable atmospheric boundary layer under non-stationary conditions. Dyn. Atmos. Ocean. 2001, 34, 225–244. [Google Scholar] [CrossRef]
  49. Conrick, R.; Mass, C.F.; Zhong, Q. Simulated Kelvin-Helmholtz waves over terrain and their microphysical implications. J. Atmos. Sci. 2018, 75, 2787–2800. [Google Scholar] [CrossRef]
  50. Garratt, J.R. Review: The atmospheric boundary layer. Earth Sci. Rev. 1994, 37, 89–134. [Google Scholar] [CrossRef]
  51. Smyth, W.D.; Moum, J.N. Ocean Mixing by Kelvin-Helmholtz Instability. Oceanography 2012, 25, 140–149. [Google Scholar] [CrossRef]
  52. Gultepe, I.; Agelin-Chaab, M.; Komar, J.; Elfstrom, G.; Boudala, F.; Zhou, B. A Meteorological Supersite for Aviation and Cold Weather Applications. Pure Appl. Geophys. 2019, 176, 1977–2015. [Google Scholar] [CrossRef]
Figure 1. Maps of the measurement location: (a) areal map the indicates that the Cloud Physics Observation Site (CPOS) at Pyeongchang is 20 km southwest of the East Sea: (b) topographic profile along the yellow line in (a); (c) topographical map surrounding the CPOS, where height contours are plotted every 40 m, with thicker labelled contours every 200 m; (d) topographic profile along the green line in (c). The images in (a,b,d) are courtesy of Google Earth. Map of CPOS in (c) from: “Pyeongchang, Gangwon.” Map, Google Maps. Accessed 22 Jan. 2020.
Atmosphere 11 00230 g001
Figure 2. The time series data (a,c,e) and the local wavelet power spectrum (b,d,f) using the Morlet wavelet (Torrence and Compo 1998 [36]) for the filtered data averaged 1 min for 1900 08 Oct. 2017 - 0500 09 Oct. 2017 in Case 4: (a) Original (top) and filtered pressure p (bottom), (c) Original (top) and LWC (bottom), and (e) Original (top) and log( LWC ) (bottom). The gray shading indicates the fog layer. The power is normalized by 1/ σ 2 . The thick contour encloses regions greater than the 0.1% significance level for a red-noise process. The dotted line is the cone of influence.
Atmosphere 11 00230 g002
Figure 3. The time series of squared Brunt–Vaisala frequency (BVF) (N2) for dry air (red), for saturated air (blue), and squared vertical shear of horizontal wind (black) for 1900 08 Oct. 2017–0500 09 Oct. 2017 in Case 4. The gray shading indicates the fog layer. The BVF is calculated between the 3- and 5.1-m levels using 10-min averages of the WXT and AWS data. For saturated air, FM-120 data at 2 m level are used to calculate liquid water mixing ratio. We assume saturated conditions when the visibility at 2.3 m level is less than 1000 m. The vertical shear of the horizontal wind is calculated between the 3- and 5.1- m levels using 10-min averages of WXT data.
Atmosphere 11 00230 g003
Figure 4. The time series of U and V of horizontal velocity at the 3- and 6- m levels using 1-min averages of anemometer data for 1900 08 Oct. 2017–0500 09 Oct. 2017 in Case 4. The gray shading indicates the fog layer.
Atmosphere 11 00230 g004
Figure 5. Same as Figure 3, except for 2220 27 Oct. 2017–0640 28 Oct. 2017 in Case 6.
Atmosphere 11 00230 g005
Figure 6. Same as Figure 4, except for 2220 27 Oct. 2017–0640 28 Oct. 2017 in Case 6.
Atmosphere 11 00230 g006
Figure 7. Schematic plot of the fog structure affected by Kelvin–Helmholtz instability (adapted from Stull, 1988 [41]).
Atmosphere 11 00230 g007
Figure 8. The time series of (a) visibility at 2.3 m (dashed line), 3.7 m (solid line), and LWC at 2 m (blue); (b) w at 3 m (black), IRT at 2.3 m (brown), and LWC at 2 m (yellow) averaged over 1 min for 2321 08 October 2017 - 0230 09 October 2017 in case 4. The blue rectangles show that w and IRT and IRT and LWC tend to be negatively correlated.
Atmosphere 11 00230 g008
Figure 9. The local wavelet power spectrum using the Morlet wavelet for w’ averaged every 1 min for 2200 08 Oct. 2017 - 0300 09 Oct. 2017 in Case 4: (a) w’ at 6 m height, (b) w’ at 3 m height. The power is normalized by 1/σ2. The thick contour encloses regions greater than the 0.1% significance level for a red-noise process. The dotted line is the cone of influence.
Atmosphere 11 00230 g009
Table 1. The list of surface instruments used during the ICE-POP campaign.
InstrumentMounting HeightCompanyMeasurementsRange and Resolution
LPM (Laser Precipitation Monitor)2.3 mThiessenRainfall intensity and phase state from fall speedResolution of rainfall intensity: 0.001 mm h−1
WXT-520 (Weather Transmitter)3, 5.2 m VaisalaTemperature
Relative humidity
Pressure
Wind speed
Wind direction
Resolution: 0.1 °C, 1 %, 0.1 hPa, 0.1 m s−1, 1°
PWD-52 (Present Weather Detector)2.3 mVaisalaVisibility Range: 10 m-35 km
Resolution: 1 m
IR sensor2.3 mCampbell ScientificSurface temperature Resolution: 0.05 °C
FM-120 (Fog Monitor)2 m Droplet Measurement TechnologiesDroplet size, liquid water content (LWC), and NdRange: 2–50 µm, 30 bins
PWD-223.7 m VaisalaVisibility Range: 10 m-20 km
Resolution: 1 m
3D-Sonic Anemometer3, 6 mCampbell Scientific CSAT3-D wind components
Sonic virtual temperature (Ts)
Resolution:
u, v: 1 mm s−1
w: 0.5 mm s−1
Ts: 0.025 °C
Table 2. Mean values of microphysics parameters for the 9 cases calculated from the 0.1 Hz FM-120 data-set at 2 m above ground and meteorological parameters gathered from the PWD-52 at 2.3 m above ground and WXT-520 sensor at 3 m above ground during the entire fog event.
CaseFormation (KST)Dissipation (KST)Duration (h)Wind Speed (m s−1)Dominant Wind DirectionMean Temperature (°C)LWC (g m−3) D v   ( µ m ) Nd (cm−3)
104/10/17
04:09
04/10/17
05:46
1.50.8NE8.60.028 5.6292
205/10/17
02:00
05/10/17
08:24
5.02.1W5.90.0098.626
307/10/17
23:38
08/10/17
09:15
9.42.6W12.10.0108.039
408/10/17
23:25
09/10/17
06:00
6.63.3W12.00.011 5.9102
522/10/17
04:42
22/10/17
07:53
3.11.7W9.40.0335.4353
628/10/17
04:11
28/10/17
07:26
3.10.9N9.60.0125.3161
728/10/17
23:03
29/10/17
08:57
9.52.3W7.20.0128.831
826/02/18
01:36
26/02/18
02:47
1.11.2N−6.50.0217.5106
928/02/18
02:39
28/02/18
06:23
3.40.9N−0.30.0377.8151
Table 3. The simple linear regression slopes of parameters with time from all cases.
Squared Wind ShearSquared BVFWind Speed
CaseSlope (s−2 h−1)R2p-ValueSlope (×10−3 s−2 h−1)R2p-ValueSlope (m s−1 h−1)R2p-Value
Type 1
20.270.880.000−5.70.670.0130.540.640.000
30.270.650.003−2.70.860.0000.560.310.000
40.140.500.000−2.30.670.0000.370.580.000
50.060.330.035−2.70.820.0000.150.240.000
70.150.860.000−2.40.570.0000.360.680.000
Type 2
10.030.370.001−0.30.370.0010.030.050.000
60.000.000.731−0.70.210.006−0.010.000.342
80.020.030.674−1.80.210.221−0.360.260.000
90.020.100.038−0.30.380.000−0.050.070.000

