Article

Source Identification of Trace Elements in PM2.5 at a Rural Site in the North China Plain

1
State Key Laboratory of Severe Weather & Key Laboratory of Atmospheric Chemistry of China Meteorological Administration, Chinese Academy of Meteorological Sciences, Beijing 100081, China
2
Institute of Urban Meteorology, China Meteorological Administration, Beijing 100089, China
3
School of Energy and Environmental Engineering, University of Science and Technology Beijing, Beijing 100083, China
4
National Meteorological Center, Beijing 100081, China
5
Chinese Academy of Inspection and Quarantine, Beijing 100176, China
6
Titan Instruments, Beijing 10015, China
*
Authors to whom correspondence should be addressed.
Atmosphere 2020, 11(2), 179; https://doi.org/10.3390/atmos11020179
Submission received: 13 December 2019 / Revised: 25 January 2020 / Accepted: 6 February 2020 / Published: 9 February 2020
(This article belongs to the Special Issue Chemical Analysis Methods for Particle-Phase Pollutants)

Abstract

:
An intensive sampling of PM2.5 was conducted at a rural site (Gucheng) in the North China Plain from 22 October to 23 November 2016. A total of 25 elements (Al, Na, Cl, Mg, P, S, K, Ca, Ti, V, Cr, Mn, Fe, Co, Ni, Cu, Zn, As, Se, Br, Sr, Cd, Ba, Pb, and Sb) from PM2.5 filter samples collected daily were measured using a wavelength dispersive X-ray fluorescence spectrometer. Cl, S, and K were the most abundant elements, with average concentrations of 2077.66 ng m−3 (range 118.88–4638.96 ng m−3), 1748.78 ng m−3 (range 276.67–4335.59 ng m−3), and 1287.07 ng m−3 (range 254.90–2748.63 ng m−3), respectively. Among noncrustal trace metal elements, the concentration of Zn was the highest, with an average of 397.74 ng m−3 (range 36.45–1602.96 ng m−3), followed by Sb and Pb, on average, of 299.20 ng m−3 and 184.52 ng m−3, respectively. The morphologies of PM2.5 samples were observed using scanning electron microscopy. The shape of the particles was predominantly spherical, chain-like, and irregular. Positive matrix factorization analysis revealed that soil dust, following by industry, secondary formation, vehicle emissions, biomass and waste burning, and coal combustion, were the main sources of PM2.5. The results of cluster, potential source contribution function, and concentration weighted trajectory analyses suggested that local emissions from Hebei Province, as well as regional transport from Beijing, Tianjin, Shandong, and Shanxi Province, and long-range transport from Inner Mongolia, were the main contributors to PM2.5 pollution.

1. Introduction

In the past few decades, China has experienced rapid economic growth, urbanization, industrialization, and population expansion. As a result of these factors, air pollution has become a primary environmental concern. The North China Plain (NCP) is one of the most polluted regions in China [1,2]. Severe air pollution frequently occurs in autumn and winter, which has become the focus and difficulty of improving the quality of the atmospheric environment. As an important pollutant in the atmosphere, particulate matter, especially that less than 2.5 μm in aerodynamic diameter (PM2.5), can stay in the atmosphere for days to weeks and be transported over hundreds to thousands of kilometers, which has a profound effect on human health, visibility, and climate change.
Exposure to PM2.5 can cause numerous adverse health effects. Increases in morbidity and mortality related to respiratory, cardiovascular, chronic pulmonary, and neurodegenerative diseases, as well a reduction in life expectancy, have been observed in exposed populations [3,4]. Because of its large surface area, small size, and the fact that it contains a considerable amount of harmful toxic characteristics, PM2.5 can be breathed into the deepest recesses of the lung. It is deposited on the alveoli and even escapes into the blood stream to harm the health of humans [5]. PM2.5 can also enter the human body through ingestion and dermal contact. Studies have indicated that trace elements in PM2.5 play a key role in such adverse effects. Fe, Co, Ni, Cu, Zn, V, Cr, Mn, As, Pb, and Cd may boost the generation of reactive oxygen species (ROS). Excess ROS can overwhelm the antioxidant defense system in the body, causing oxidative stress, inflammation, and disease [6,7,8]. Therefore, trace elements pose a substantial threat to human health, even though they account for only a small fraction of the total mass of PM2.5.
Trace elements have proven to be useful tracers [9,10,11] and are widely used as input to aid in the interpretation of specific emission sources in receptor modeling studies. The positive matrix factorization (PMF) model developed by the Environmental Protection Agency (EPA) of USA is an advanced factor analysis technique, which employs a flexible modeling method to effectively use information in data and to identify the possible source contributions without the source profiles. This model has been used worldwide for the source apportionment of PM2.5 [12,13]. The characterization and source identification of trace elements in PM2.5 play an important role in the prevention and control of air pollution. Such approaches can improve air quality and reduce negative effects on human health, thus attracting extensive attention among researchers.
The NCP is a densely populated region with intensive agricultural and industrial activities. Several studies have measured atmosphere pollutants at Gucheng [14,15,16,17], a rural site in the core area of the NCP, and have shown that this site is ideally situated for monitoring the atmospheric pollution levels in the NCP and has favorable regional representativeness. The observed data indicate that Gucheng is a relatively polluted rural area with high levels of gaseous and particle pollutants. It was reported that the daily mean concentration of PM2.5 reached a maximum of 394 μg m−3, and only 8% of daily PM2.5 concentrations were lower than the Chinese National Ambient Air Quality Standards (NAAQS, GB3095-2012) for daily PM2.5 of 75 μg m−3 from December 2016 to January 2017 [16]. Studies related to source appointment of trace elements in PM2.5 at Gucheng are still lacking. Thus, we undertook this study to characterize and identify potential sources of trace elements in PM2.5 collected at Gucheng. The morphologies of PM2.5 samples were observed using scanning electron microscopy (SEM). Enrichment factor (EF) and PMF were used for the source identification of trace elements in PM2.5. In addition, clusters of air mass back trajectories, the potential source contribution function (PSCF), and the concentration weighted trajectory (CWT) were utilized to explore the transport pathways and likely source regions.

2. Materials and Methods

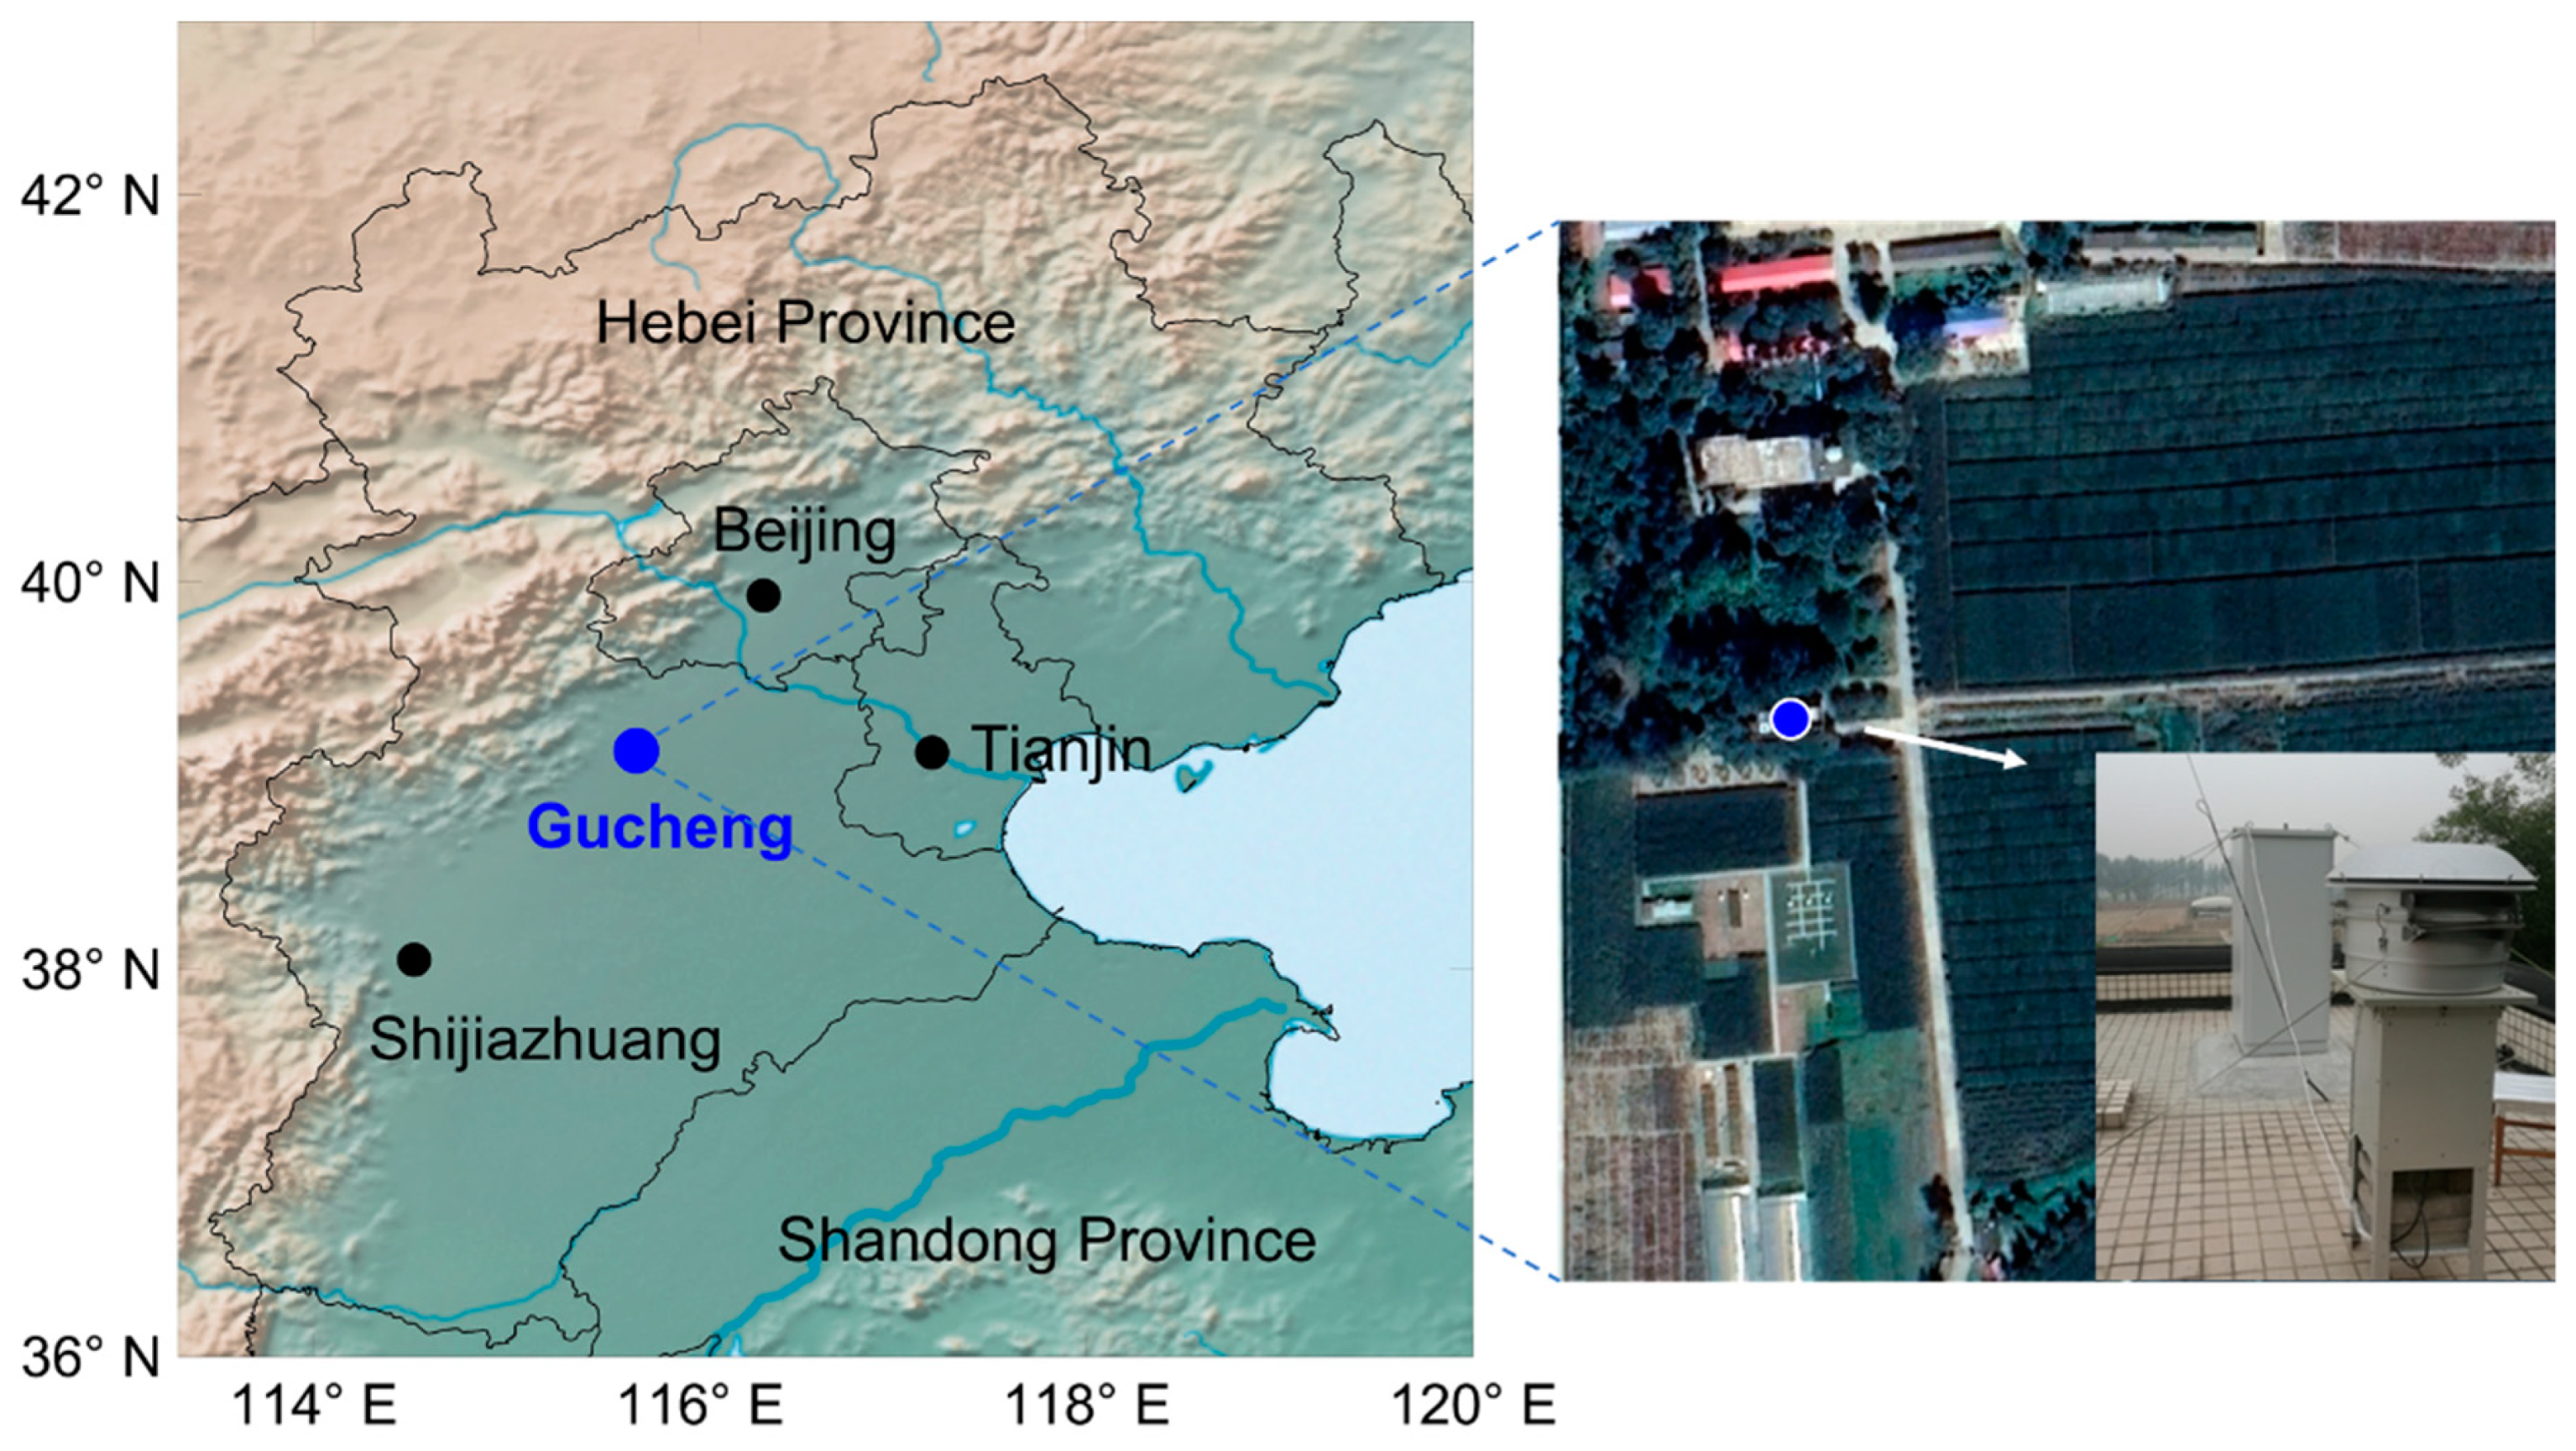
2.1. Sampling Site Description

Sampling was conducted at Gucheng, and Agrometeorological Field Experiment Station (39°08′ N, 115°40′ E) of the Chinese Academy of Meteorological Sciences, which is located in Dingxing County, Hebei Province. As shown in Figure 1, the site is approximately 110 km southwest of Beijing, 130 km west of Tianjin, and 160 km northeast of Shijiazhuang. It is surrounded by farmland, villages, and highway and railway networks.

2.2. Sampling Method and Analysis

PM2.5 samples were collected on the rooftop (about 10 m above the ground) of the observation building from 22 October to 23 November 2016. Each daily sampling was scheduled with two intervals of daytime (from 8:00 to 20:00) and nighttime (from 20:00 to 8:00 the following day). A high-volume sampler (GUV-15HBL1, Thermo Fisher Scientific, Waltham, MA, USA) equipped with a PM2.5 impactor (G1200-41) was employed to collect particles at a nominal flow rate of 1.13 m3 min−1 using quartz fiber filters (20.32 × 25.40 cm, Pall, New York, NY, USA). The filters were baked at 550 °C for 6 h to remove organic species before use. After sampling, all filters were carefully wrapped in aluminum foil and stored at −20 °C until analysis. During the sampling period, the average temperature was 7.8 °C, the relative humidity was 67.5%, and the mean wind speed was 1.5 m s−1. A total of 60 PM2.5 samples were taken after excluding damaged samples.
Twenty-five elements in PM2.5, namely Al, Na, Cl, Mg, P, S, K, Ca, Ti, V, Cr, Mn, Fe, Co, Ni, Cu, Zn, As, Se, Br, Sr, Cd, Ba, Pb, and Sb, were analyzed using a wavelength dispersive X-ray fluorescence spectrometer (RIX3000, Rigaku, Tokyo, Japan), which provides a straightforward technique for determining elemental compositions without the pretreatment of filters. An X-ray tube (Rh anode, 50 kV, 50 mA), with a coarse slit and filed diaphragm diameter of 30 mm, was used for measurement. The quantitative calibration of the system was performed using standard reference samples (Micromatter, Seattle, WA, USA). The detection limits were Al (0.100 μg m−3), Na (0.057 μg m−3), Cl (0.004 μg m−3), Mg (0.053 μg m−3), P (0.003 μg m−3), S (0.027 μg m−3), K (0.036 μg m−3), Ca (0.105 μg m−3), Ti (0.028 μg m−3), V (0.024 μg m−3), Cr ( 0.032 μg m−3), Mn (0.017 μg m−3), Fe (0.147 μg m−3), Co (0.016 μg m−3), Ni (0.082 μg m−3), Cu (0.015 μg m−3), Zn (0.086 μg m−3), As (0.013 μg m−3), Se (0.018 μg m−3), Br (0.017 μg m−3), Sr (0.019 μg m−3), Cd (0.022 μg m−3), Ba (0.056 μg m−3), Pb (0.039 μg m−3), and Sb (0.041 μg m−3). The calibration was verified using the NIST standards, and the relative error between measured value and standard value was within ± 10%.
The morphologies of PM2.5 samples were observed using SEM. In brief, a punch of the filter was fixed firmly on the sample holder with conductive tape. For higher conductivity and better observation, gold particles were sprayed onto the surface of the filter prior to SEM characterization. Magnification images were acquired using an FEI Quanta 650 FEG SEM operated at an accelerating voltage of 10.0 kV at 68.5 mPa.
EF has been widely employed to assess the anthropogenic influences on elements in PM2.5. This was calculated using the following equation:
E F x = ( C x / C r ) P M ( C x / C r ) c r u s t
where EFx is the EF of element x and r is a reference element for crustal material. ( C x / C r ) P M and ( C x / C r ) c r u s t represent the concentration ratio of x to r in PM2.5 and crust, respectively. Generally, an EFx value below 10 suggests that the element x primarily originates from a crustal source. By contrast, an EFx value greater than 10 implies that the element x is enriched and associated with human activities [18]. In this study, Al was chosen as a reference element, and the concentrations of elements in crust refer to their background concentrations in the surface soil of China [19].

2.3. Source Apportionment

PMF is a multivariate factor analysis technique based on the mathematical receptor model. EPA PMF version 5.0 was employed to identify the potential sources of elements in PM2.5. A detailed description of the PMF model can be found in related studies [20,21]. A speciated data set can be deemed as a data matrix X of i by j dimensions with uncertainties u, where i and j, respectively, represent the number of samples and chemical species. The goal of the PMF model is to identify the number of factors, p, the species profile, f, of each factor, and the amount of mass, g, contributed by each factor to individual samples. This can be expressed as:
x i j = k = 1 p g i k f k j + e i j
where eij is the residual for each sample or species.
Factor contributions and profiles were derived by the PMF model by minimizing the objective function Q:
Q = i = 1 n j = 1 n [ x i j k = 1 p g i k f k j u i j ] 2
Two inputs are required to run PMF model, namely concentration and corresponding uncertainty. When the concentration is less than or equal to the method detection limit (MDL), it is replaced with half of the MDL. The uncertainty (Unc) is calculated as follows:
U n c = 5 6 × M D L
When the concentration is higher than the MDL, the calculation is:
U n c = ( E r r o r   f r a c t i o n × C o n c e n t r a t i o n ) 2 + ( 0.5 × M D L ) 2 ,
In this study, 60 samples were included in the PMF analysis. Signal-to-noise (S/N) ratios were used to categorize species [22]. If the S/N ratio was greater than 0.5 but less than 1, the corresponding species was categorized as “weak”. If the S/N ratio was less than 0.5, the species was categorized as “bad.” Thus, V, Cr, Co, and Ni were set as “bad” and excluded from the rest of the analysis.

2.4. Cluster and Source Regions

Air mass back trajectories over 48 h arriving at the Gucheng site during the sampling period were calculated and clustered using the geographic information system-based software, TrajStat [23]. The meteorological data used for the calculation was obtained from the Global Data Assimilation System of the NOAA National Center for Environmental Prediction with a resolution of 1° × 1°. The model was run four times (00:00, 06:00, 12:00, and 18:00 UTC) a day at 100 m above ground level.
The potential source contribution function (PSCF) and contribution weighted factor CWT methods were implemented using TrajStat to identify the potential source regions of PM2.5 [24]. The study field of 60° E to 125° E and 30° N to 65° N with a resolution of 1° × 1° was divided into small equal grid cells (i × j). The PSCF value in the ij cell was defined as:
P S C F i j = m i j n i j
where mij and nij represent the number of “polluted” trajectory endpoints and trajectory endpoints that fall in the ij cell, respectively. A PM2.5 concentration of 75 μg m−3 was chosen as the pollution threshold. In order to determine the relative contribution of different potential source region, the CWT method was used. In the CWT method, each grid cell was assigned a weighted concentration by averaging the sample concentrations that have associated trajectories crossing that grid cell, as follows:
C i j = l = 1 M C l τ i j l l = 1 M τ i j l
where Cij is the average weighted concentration in the ij cell, l is the index of the trajectory, and M is the total number of trajectories. Cl and τijl represent the concentration observed on arrival of trajectory l and the time spends in the ij cell by trajectory l, respectively. Grid cells with high PSCFij and Cij values indicated the potential source regions.
To reduce the uncertainty in cells with a small nij value, the PSCF and CWT value was multiplied by a weight function, Wij, which was defined as:
W i j = { 1.00 , 54 < n i j 0.70 , 18 < n i j 54 0.42 , 9 < n i j 18 0.17 , n i j 9

3. Results and Discussions

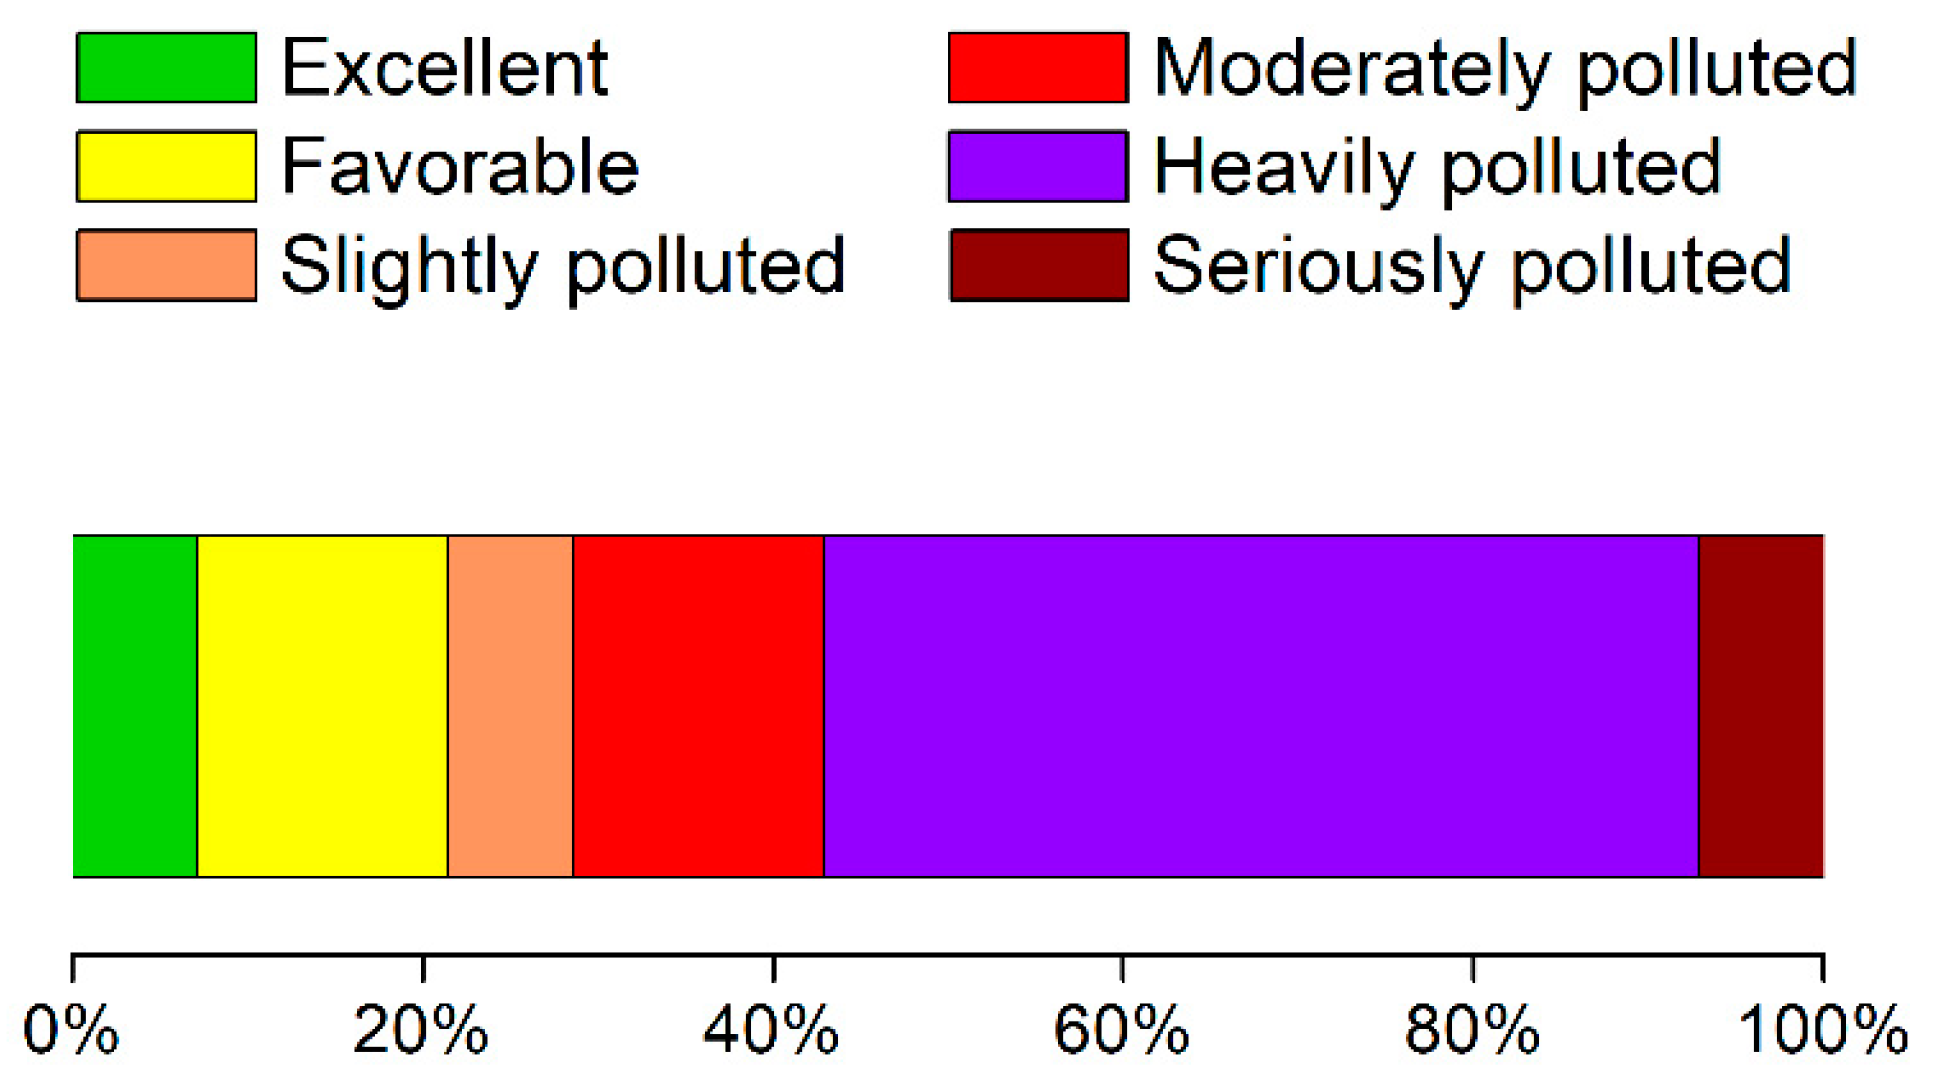
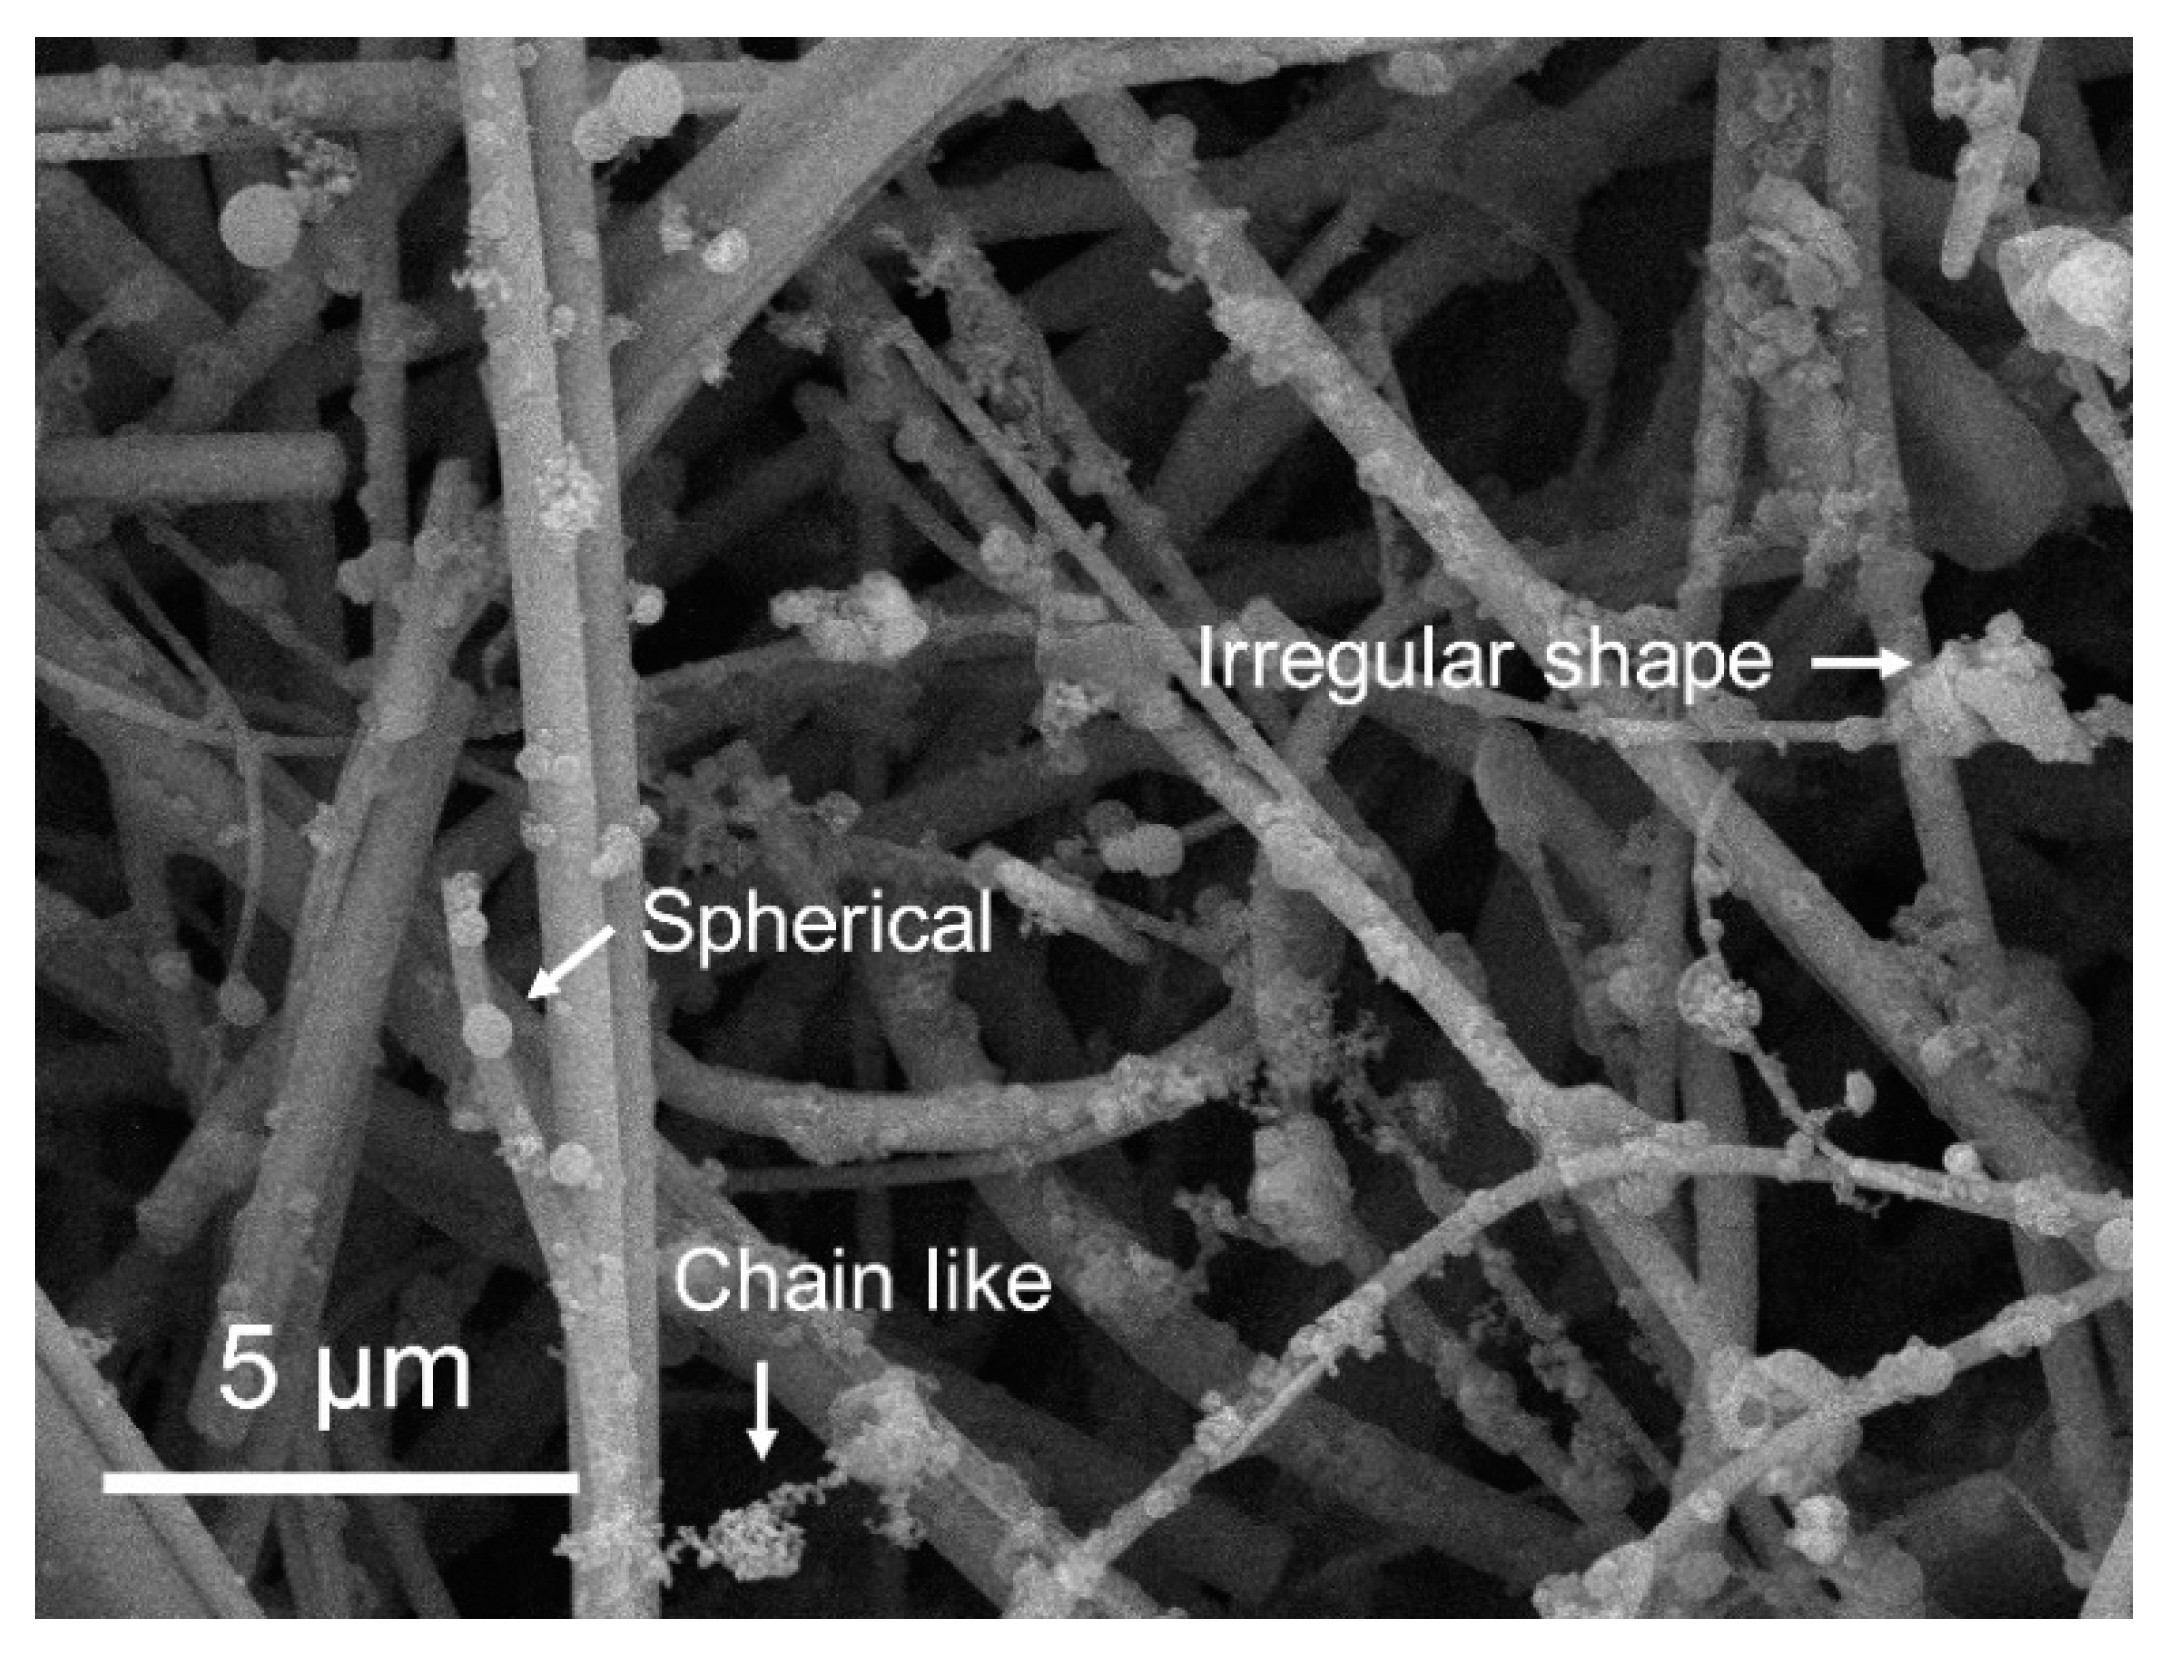
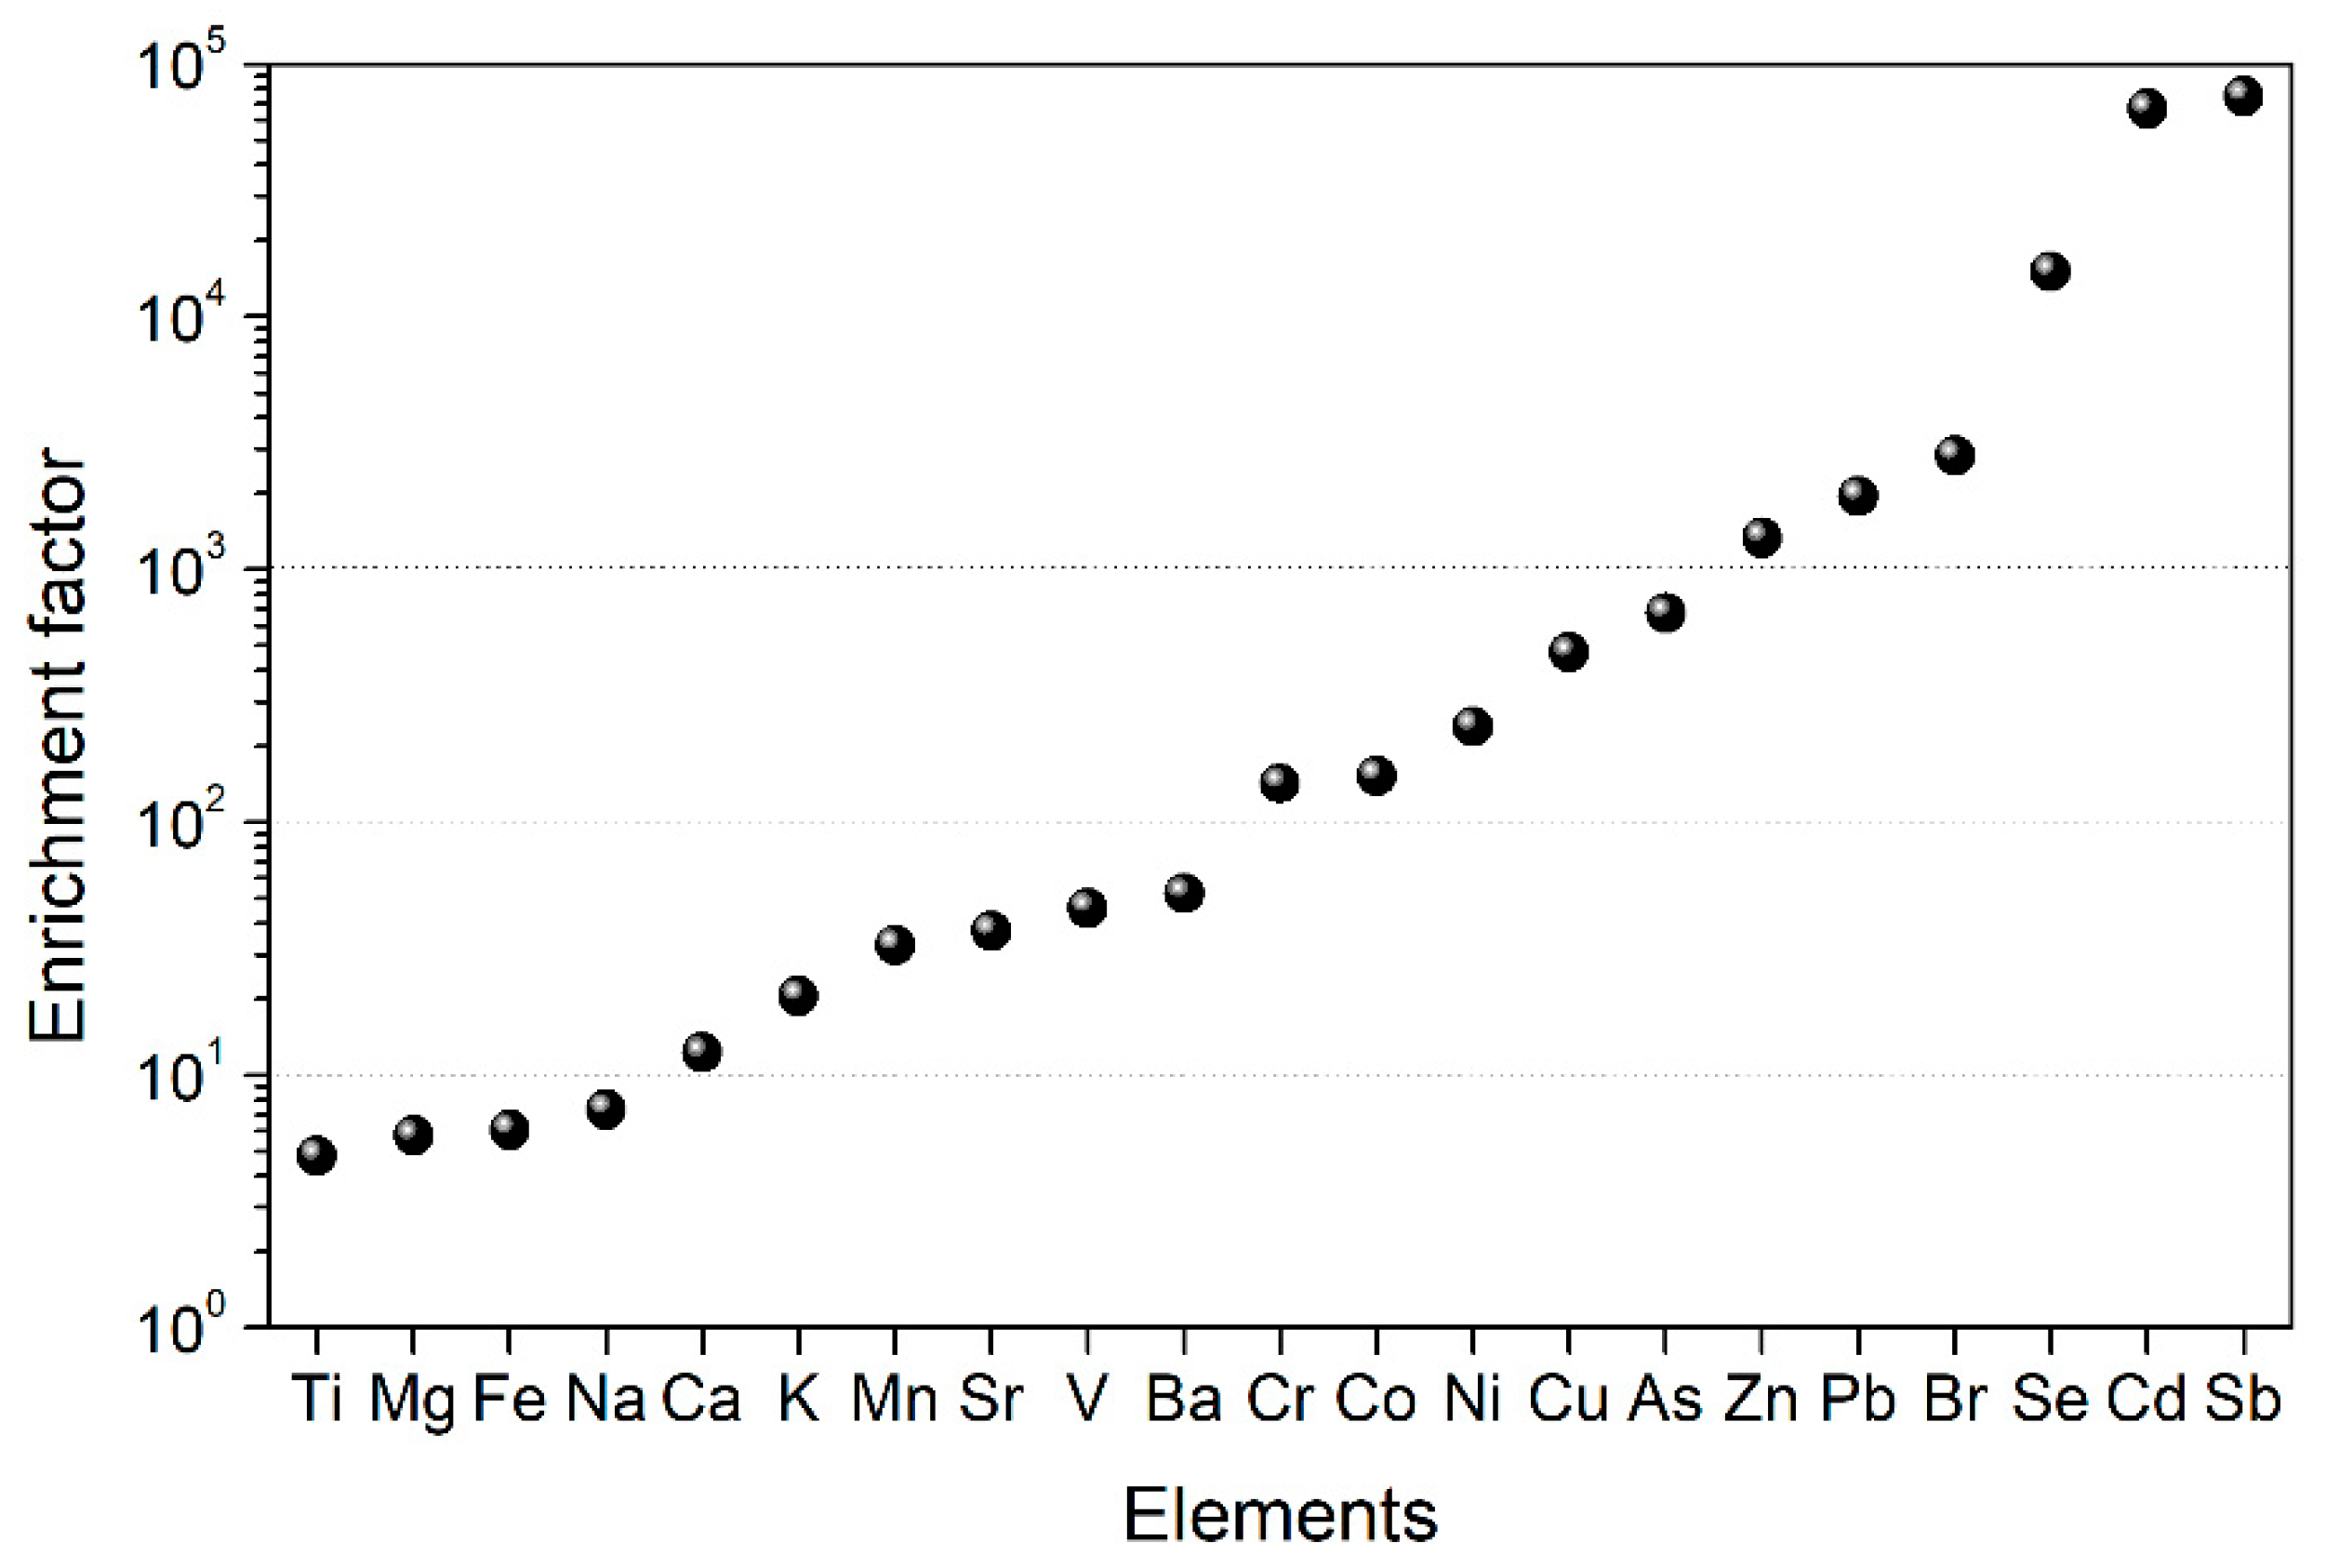
3.1. General Characteristics

The concentrations of PM2.5 and 25 trace elements measured at Gucheng site are summarized in Table 1. During the sampling period, the concentrations of PM2.5 ranged from 23.29 μg m−3 to 319.46 μg m−3, with an average concentration of 149.86 μg m−3. Compared with the results obtained at various sites in China, Mongolia, and Europe from previous studies (Table 2), this concentration was higher than that measured in Beijing (95.47 μg m−3) [25], Ulaanbaatar (Mongolia, 92.8 μg m−3) [26], Košetice (Czech, 13.6 μg m−3) [27], Terviso (Italy, 44 μg m−3) [28], and Athens (Greece, 14.2 μg m−3) [29], but lower than that recorded in Baoding (192 μg m−3) [30]. Considering the ambient air quality index of China (HJ633-2012) and the PM2.5 concentration in the measurement, a daily PM2.5 concentration below 35 μg m−3 was defined as an excellent day, that in the range of 35 μg m−3 to 75 μg m−3 was a favorable day, that in the range of 75 μg m−3 to 115 µg m−3 was a slightly polluted day, 115 μg m−3 to 150 μg m−3 indicated a moderately polluted day, 150 to 250 μg m−3 denoted a heavily polluted day, and that above 250 μg m−3 was a seriously polluted day. The average PM2.5 concentrations for slightly, moderately, heavily, and seriously polluted days were 104.41 μg m−3, 126.06 μg m−3, 191.28 μg m−3, and 286.98 μg m−3, respectively. More than three-quarters of the daily PM2.5 concentrations exceeded 75 μg m−3, and heavily and seriously polluted days accounted for 57.14% of the total detected days (Figure 2), indicating severe pollution in rural areas of the NCP.
Among the 25 elements, Cl (2077.66 ng m−3) was the most abundant element in PM2.5, followed by S and K (higher than 1000 ng m−3), and Ca, Fe, Zn, Al, Sb, Na, Pb, and Mg (between 100 and 1000 ng m−3). Other elements were under 100 ng m−3. Al, Na, Mg, K, Ca, Fe, and Ti, which are typical crustal elements, were the main detected elements in PM2.5, accounting for 42.06% of the total detected elements. For noncrustal trace metal elements, Zn (397.74 ng m−3) had the highest concentration. Zn, along with Sb and Pb, comprised 10.01% of the detected elements. The mean concentration of V (8.85 ng m−3), Mn (60.62 ng m−3), Ni (17.70 ng m−3), and Pb (184.52 ng m−3) were within the limits set by the World Health Organization (WHO; 1000 ng m−3, 150 ng m−3, 25 ng m−3, and 500 ng m−3 for V, Mn, Ni, and Pb, respectively), the European Air Quality Directive (EU Directive 2007/107/EC; 20 ng m−3 and 500 ng m−3 for Ni and Pb, respectively), and the NAQQS of China (500 ng m−3 for Pb). However, the mean concentration of As (26.55 ng m−3) and Cd (16.86 ng m−3) were significantly higher than those in the guidelines of the WHO (6.6 ng m−3 and 5 ng m−3 for As and Cd, respectively), the EU Directive and the NAAQS of China (6 ng m−3 and 5 ng m−3 for As and Cd, respectively), indicating potential threats to human health.
The concentration of S (1748.78 ng m−3) was lower than that measured in Beijing (3700 ng m−3) and Baoding (7800 ng m−3), comparable with that that recorded in Ulaanbaatar (1740 ng m−3), and higher than that observed in Athens (1409.9 ng m−3), Košetice (1011.6 ng m−3), and Treviso (938 ng m−3) (Table 2). The concentration of K (1287.07 ng m−3) was lower than that in Baoding (1920 ng m−3) and higher than that in Terviso (688 ng m−3). The concentrations of Mn, Cu, Zn, and Pb were lower than that in Baoding, but higher than that in Beijing and other sites. In addition, Gucheng, Beijing, Baoding, Ulaanbaatar, and Treviso had high levels of crustal elements, such as Al Mg, Ca, and Fe.
A morphological analysis of PM2.5 was conducted using SEM. According to SEM images (Figure 3), the particles collected on the quartz fiber filter mainly had a spherical, chain-like, and irregular shape, and such particles varied in size (no larger than 2.5 μm). Spherical particles are easily recognized. They generally originate from fluid melts due to high-temperature combustion, and over 95% of fly ash particles are smoothly spherical [31]. Coal combustion is the major source of this type of particle [32]. Chain-like particles are typical soot aggregates consisting of many ultrafine particles, which are mainly produced by combustion emissions, such as from gasoline and diesel exhaust emissions and coal and biomass burning [33]. Irregular particles are mainly composed of mineral matter from windblown dust, resuspended road dust, and agricultural and construction dust [34].
An EF analysis was performed to evaluate the contributions of crustal and noncrustal sources of elements in PM2.5. As shown in Figure 4, the EF values for Ti, Mg, Fe, and Na were lower than 10, demonstrating that these elements were mainly from crustal sources. Ca, K, as well as Mn, Sr, V, and Ba had values ranging from 10 to 100, representing slight enrichment due to an increase in anthropogenic activities, such as agriculture and construction (Ca) and biomass burning (K). The EF values for Cr, Co, Ni, Cu, Sn, and As ranged from 100 to 1000, indicating that these elements were moderately enriched due to human activities. Zn, Pb, Br, Se, Cd, and Sb had values larger than 1000, providing evidence of high enrichment from anthropogenic sources. These elements may be derived from emission-related sources.

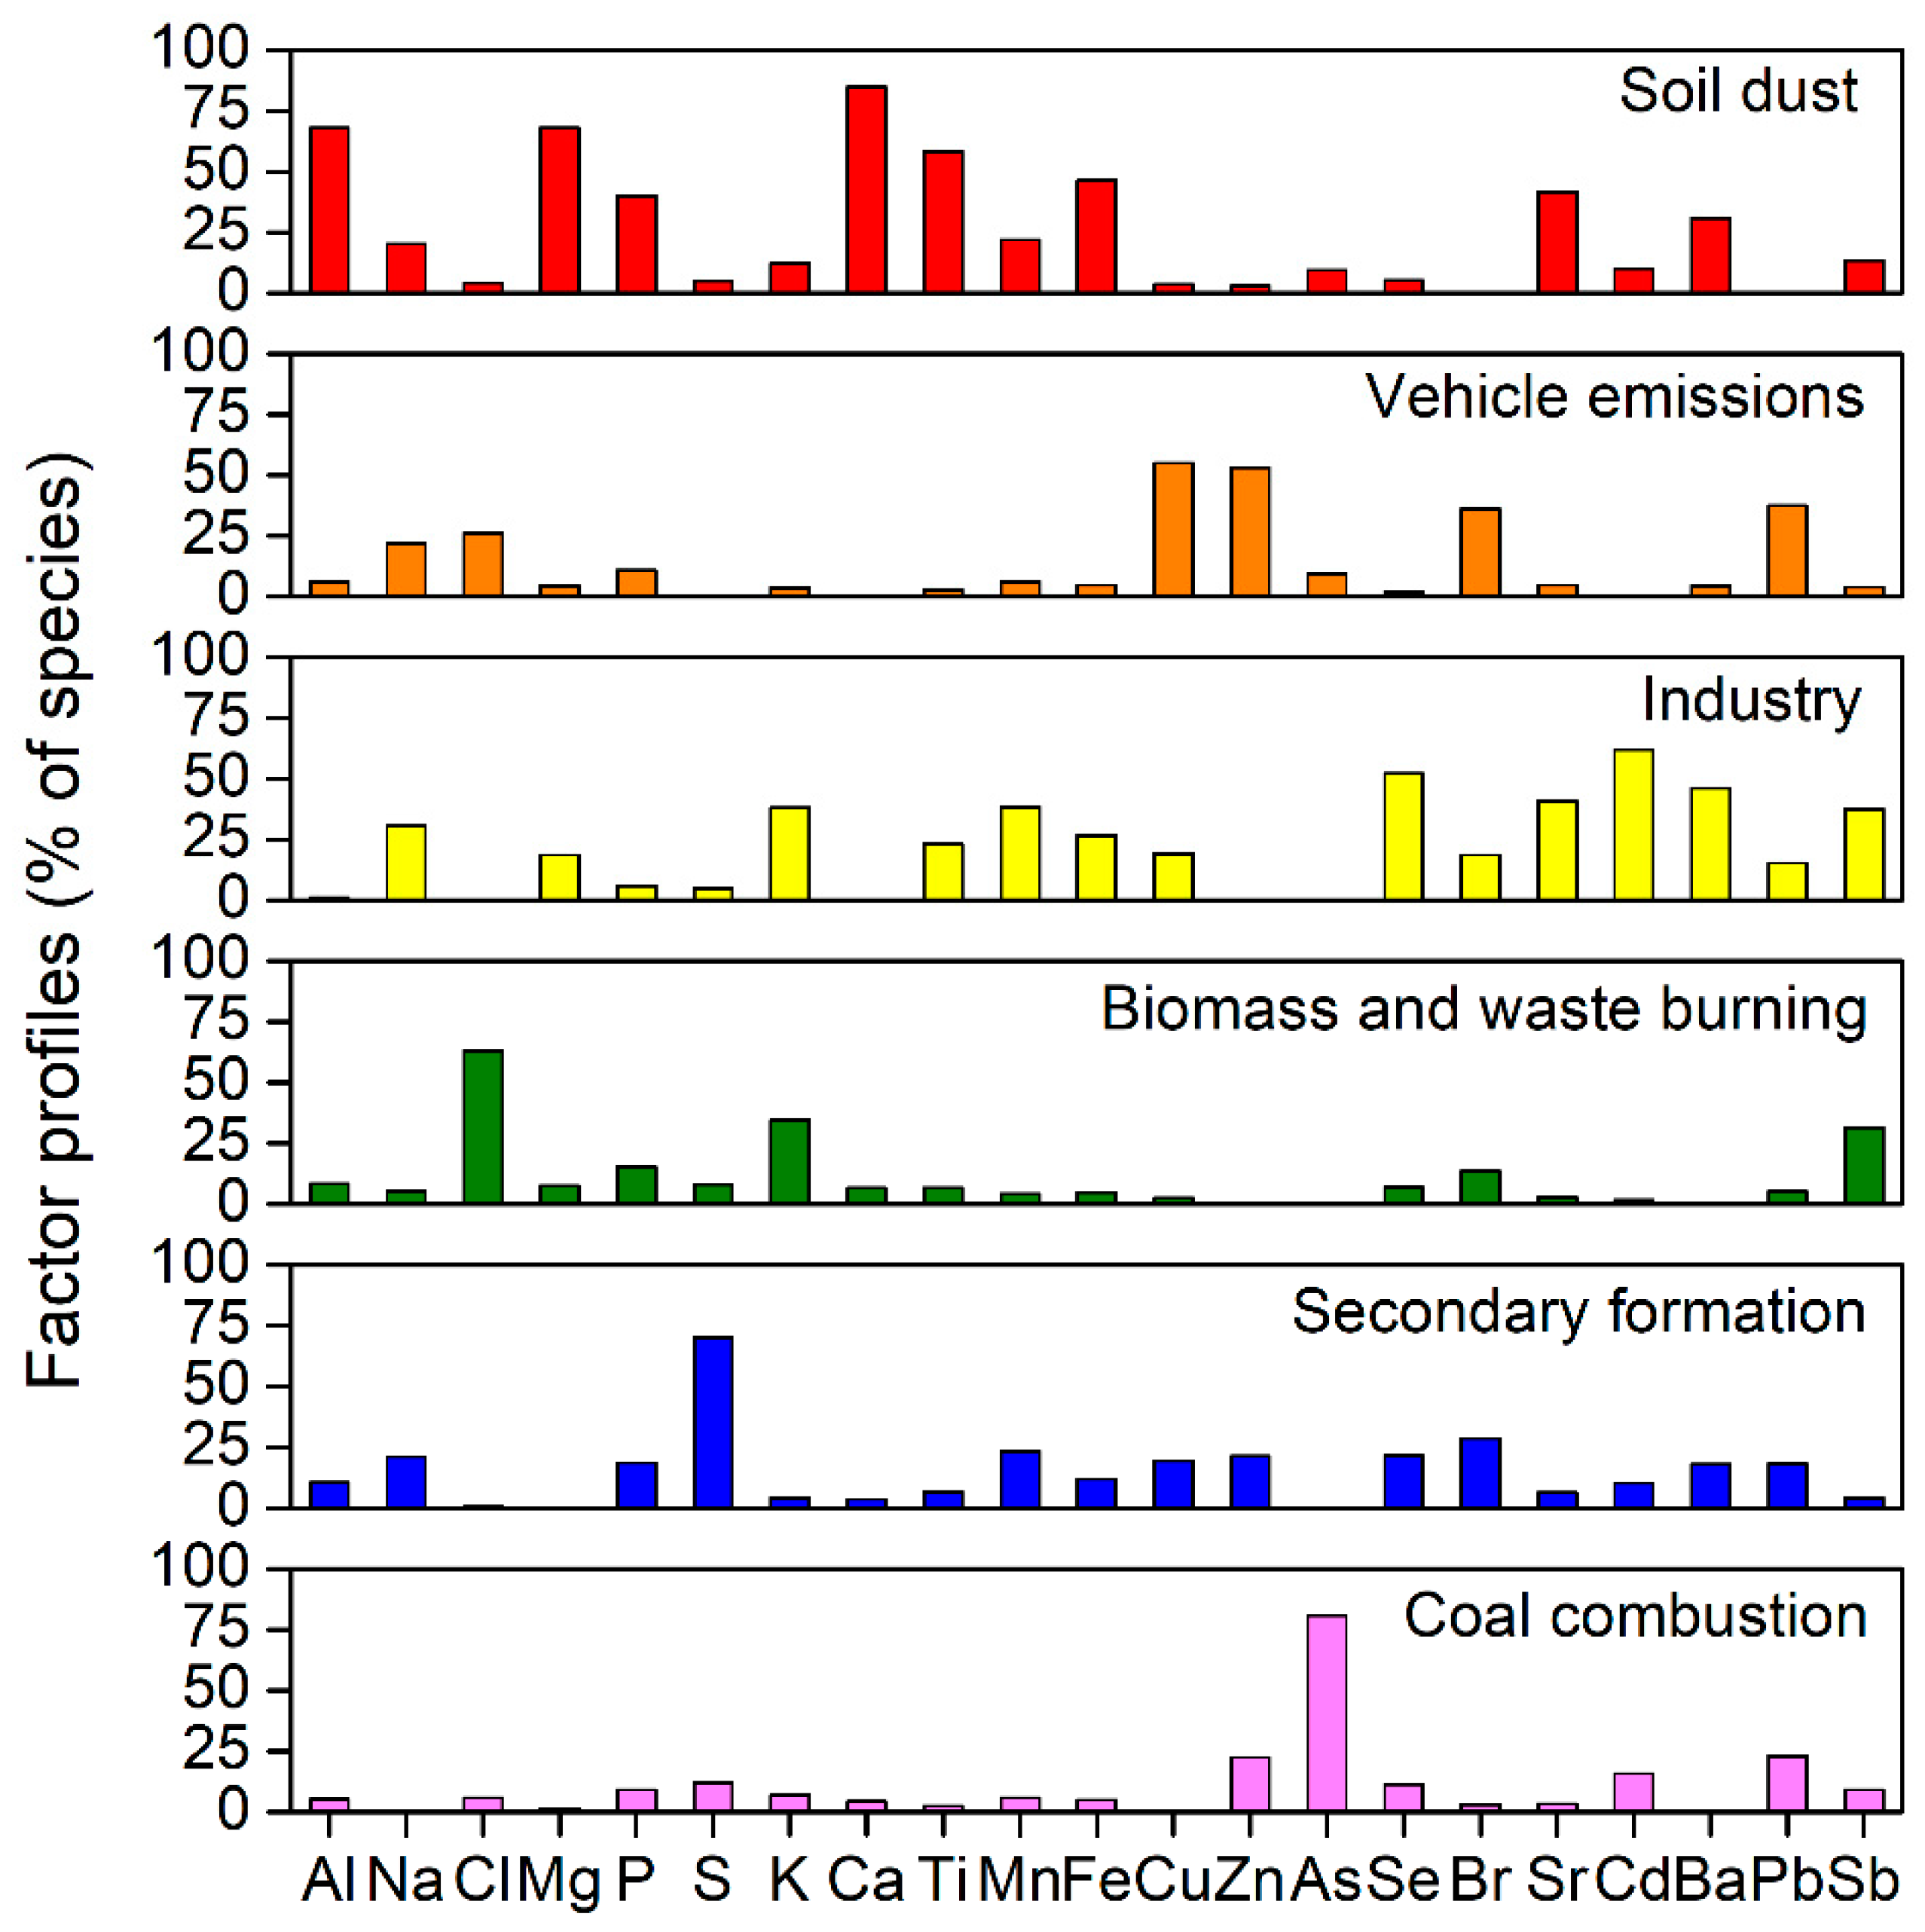
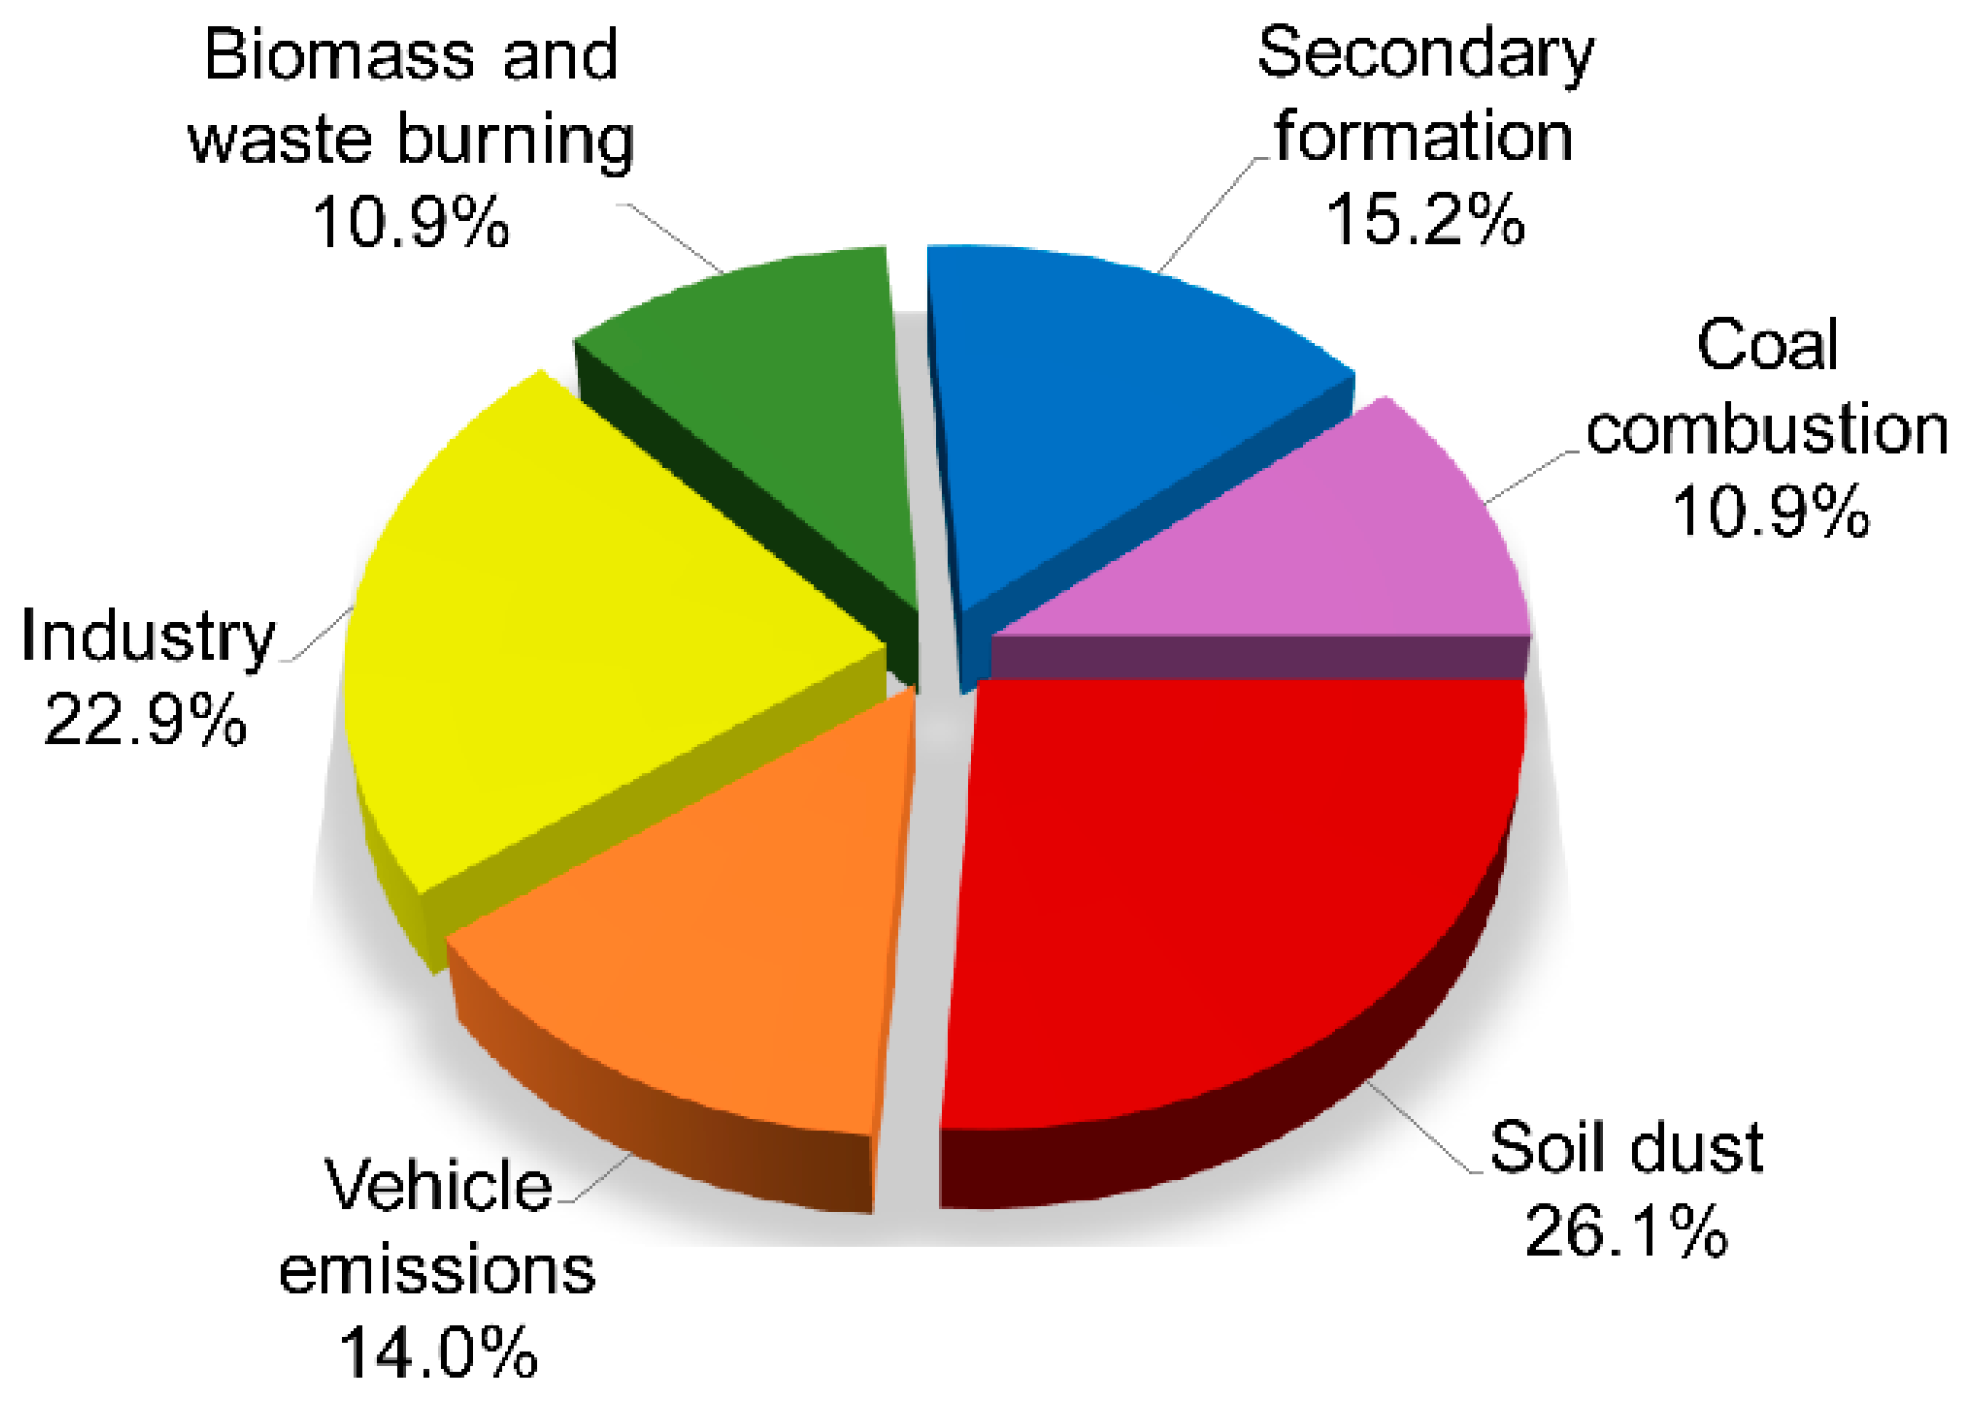
3.2. Source Apportionment

On the basis of the PMF modeling results, six factors were identified, namely soil dust, vehicle emissions, industry, biomass and waste burning, secondary formation, and coal combustion. The source profiles are shown in Figure 5, and the relative contributions from each source to PM2.5 are illustrated in Figure 6.
The first factor, soil dust, is characterized by high loadings of Ca (85.09%), Al (68.24%), Mg (68.00%), Ti (58.35%), and Fe (46.50%). These typical crustal elements may be derived from natural and anthropogenic sources, including natural mineral dust from desert, arid and semiarid regions, the resuspension of road dust by vehicles, and dust generated by agricultural and construction activities [35]. This factor comprised a major proportion (26.1%) of PM2.5.
The second factor, vehicle emissions, results in high percentages of Cu (55.13%), Zn (53.03%), Pb (37.59%), and Br (36.11%). The contribution of this source to PM2.5 was 14.0%. Cu is a key tracer of brake-wear particle emissions [36]. Zn is associated with tire wear. It is employed in tires as an activator for vulcanization, and it is also released from additives in lubricating oils for engines [37]. Motor vehicle exhaust was previously the largest source of Pb and Br emissions [38] until leaded gasoline use was banned and the Pb concentration in unleaded gasoline was limited to below 0.005 g L−1 in China in 2000 (GB17930-1999). Since then, Pb emissions from motor vehicle gasoline have substantially declined, but vehicular exhaust emissions remain an important source of Pb emissions [15], owing to the sustained increase in the number of automobiles.
The third factor, industry sources, results in an abundance of Cd (62.09%), Se (52.37%), Ba (46.30%), Sr (40.92%), and Mn (38.35%), which originate from steel metallurgy and nonferrous metal production [9,39,40,41]. The contribution of this factor to PM2.5 was 22.9%.
The fourth factor, biomass and waste burning, is represented by high levels of Cl (63.12%), K (34.61%), and Sb (31.45%). Cl is released during the combustion of high-chlorine biomass, such as straw, grass, wood barks, and grains [42,43]. K, another element with a high concentration in natural biomass, has been extensively used as a tracer element for biomass burning [44]. In the NCP, some rural households still use agriculture and forestry residue, including crop residues, weeds, branches, and leaves, as biomass fuel for cooking or heating [45]. Furthermore, studies have demonstrated that Cl is related to waste incineration [46,47]. Chlorinated plastics, such as polyvinylchloride, chlorinated polyethylene, and polyvinyl dichloride, and chloride salts in food residue, are the main sources of Cl in waste burning [48]. Refuse incinerators are often major sources of Sb [49]. This factor accounted for 10.9% of PM2.5.
The fifth factor, secondary formation, is dominated by a high concentration of S (69.96%) [50,51], accounting for 15.2% of PM2.5 emissions. S is related to secondary sulfates, which are likely generated by the homogeneous or heterogeneous reaction of the precursor gas SO2 emitted from coal burning [13]. Secondary formation is affected by meteorological conditions, such as temperature, humidity, and solar radiation.
The sixth factor, coal combustion, is typified by an abundance of As (80.79%) and Pb (23.07%); the contribution of this factor to PM2.5 was 10.9%. Coal is the major energy source in China [52]. The main consumers of coal include industry and power plants, and it is also used in small amounts for heating residences and for other purposes [53]. As is recognized as a tracer of coal combustion [54]. Coal combustion was found to be the predominant source of Pb emissions after the phasing out of leaded gasoline [55]. Exposure to these toxic elements may cause serious harm to human health, especially to children, due to their larger absorption rate and intake and higher frequency of engaging in hand-to-mouth activities [56].
The PMF modeling results were compared with previous studies. In this work, factors could be interpreted as a mixture of soil dust, vehicle emissions, industry, biomass burning, waste burning, secondary formation, and coal combustion, which were similar to previous studies in Beijing [25,57] and Baoding [30], and the contributions were found to be reasonable.

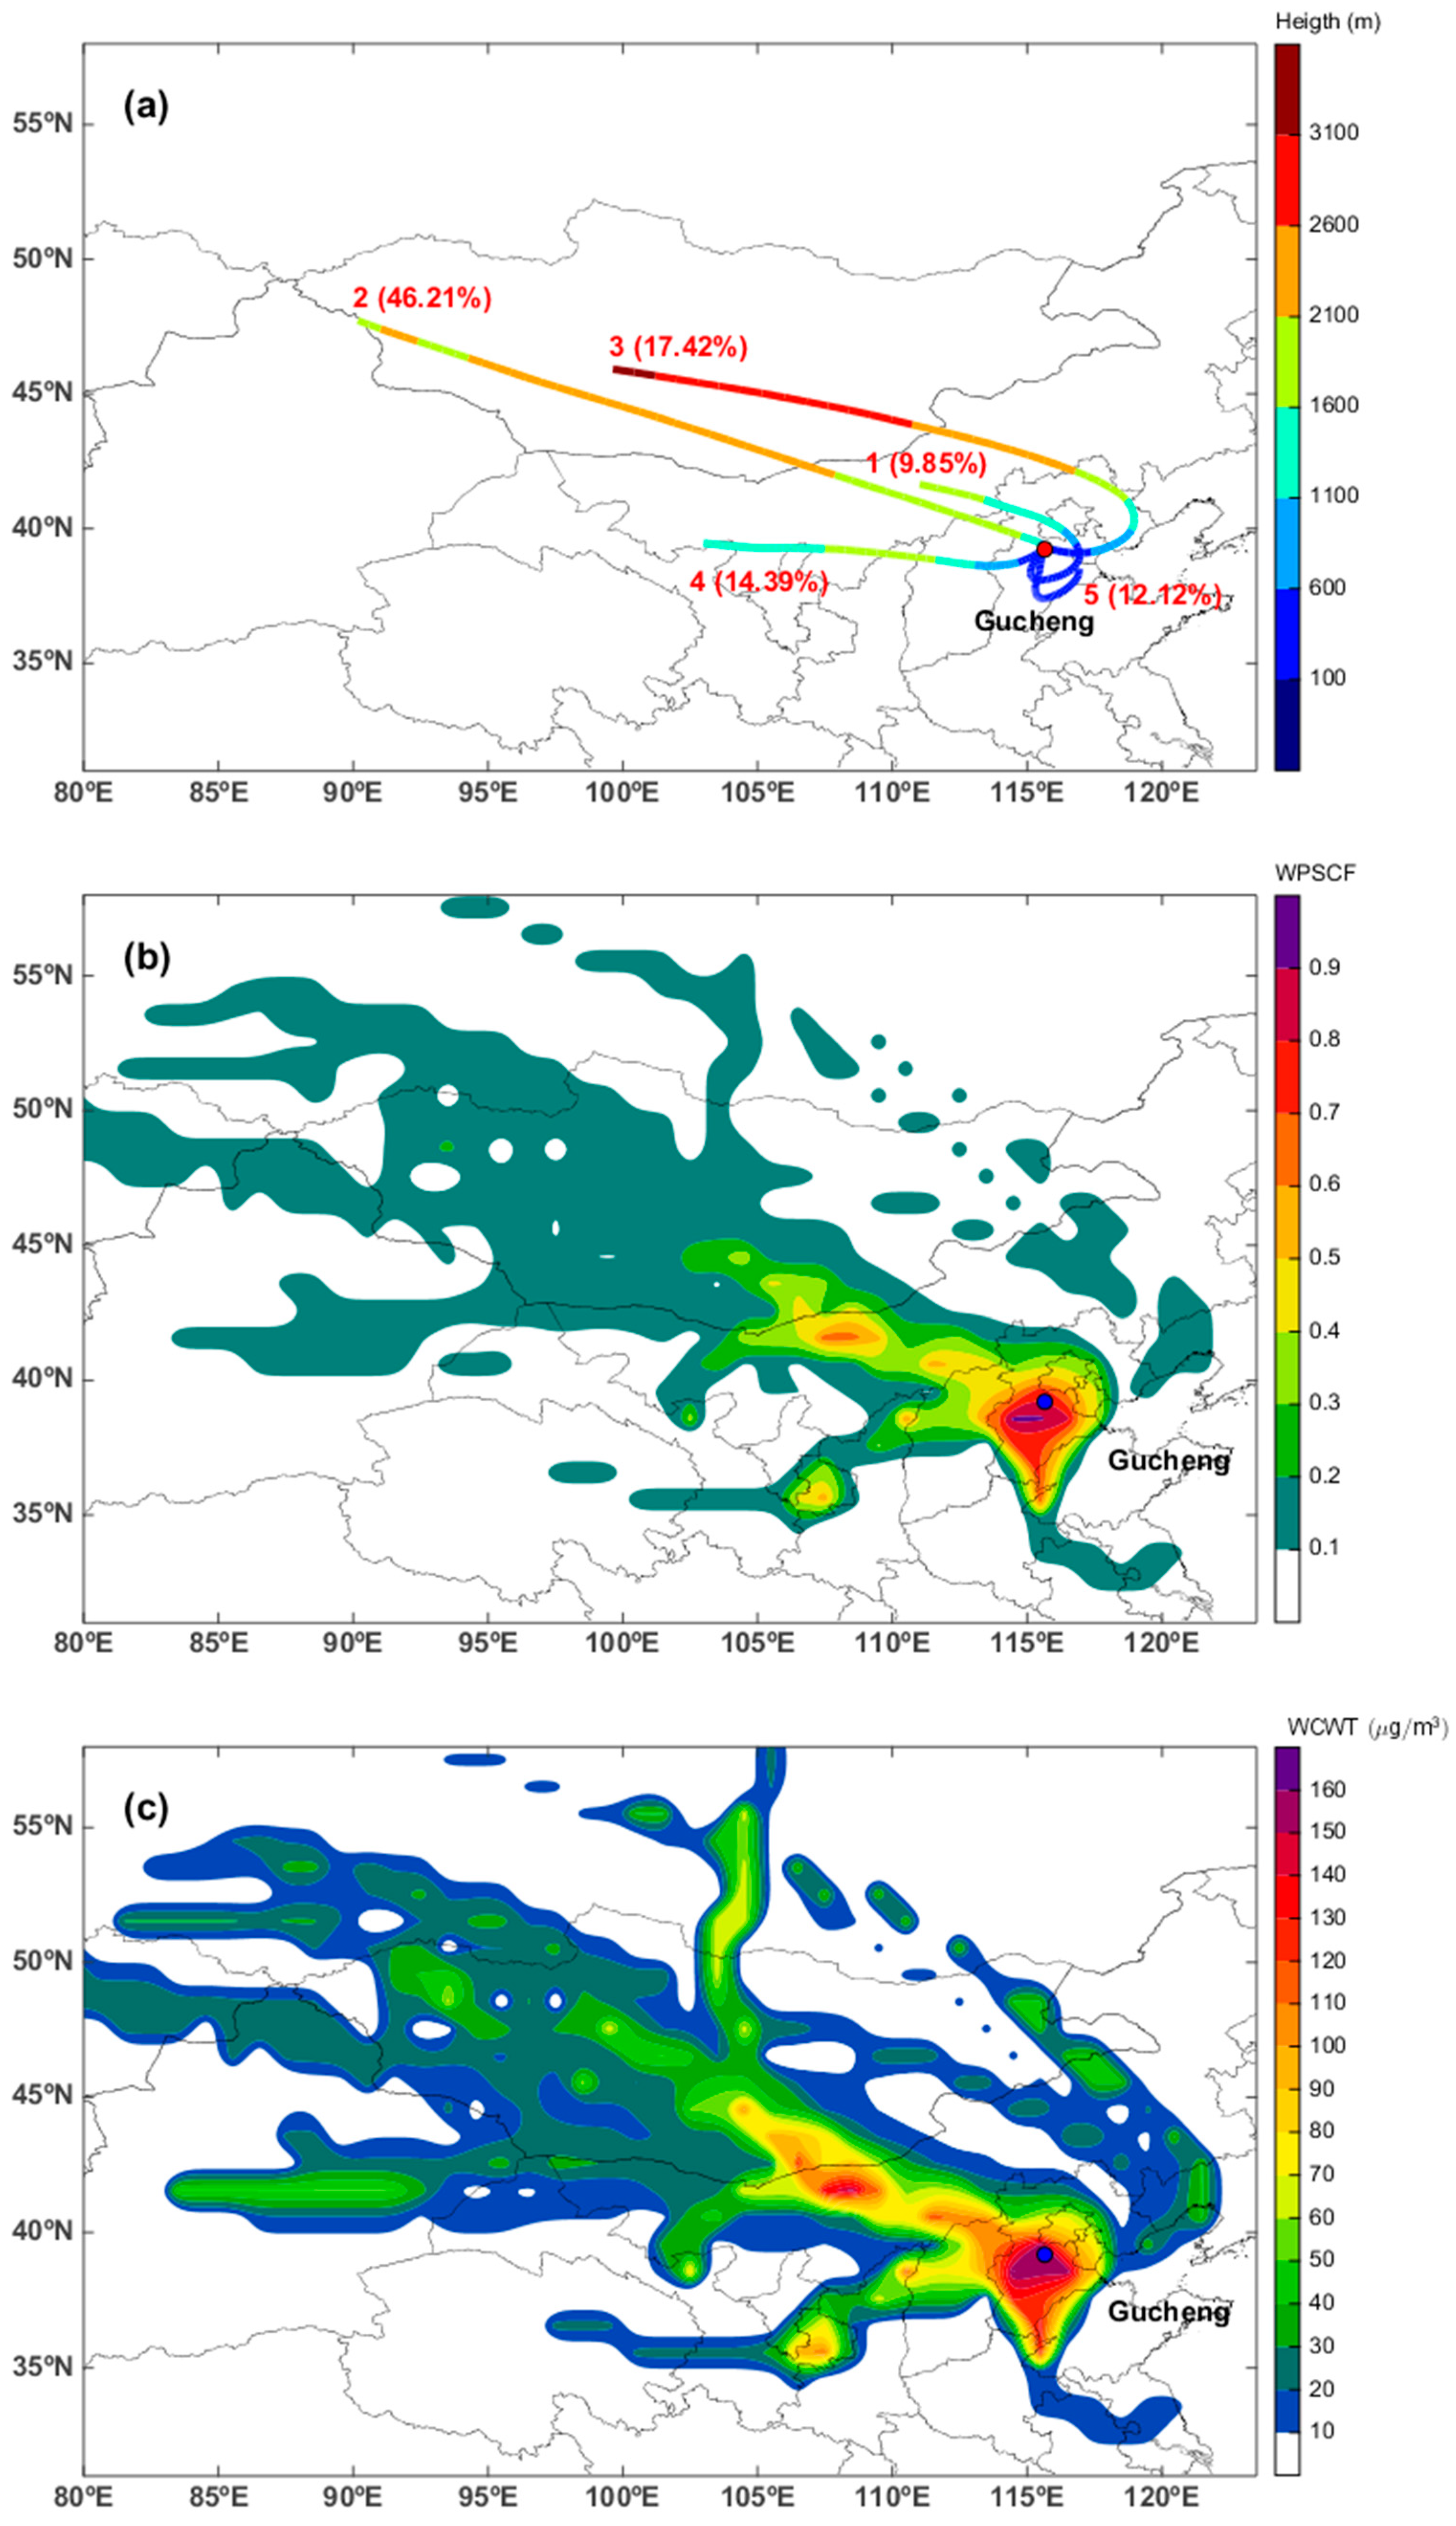
3.3. Cluster and Source Regions

Air mass back trajectories were grouped into five clusters, with clustering pathways illustrated in Figure 7a. Cluster 1, 2, 3, 4, and 5 accounted for 9.85%, 46.21%, 17.42%, 14.39%, and 12.12% of the total trajectories, respectively. Cluster 1 gathered air mass trajectories from Inner Mongolia, across the northeast of Shanxi Province, the northwest of Hebei Province, the southwest of Beijing, and the west of Tianjin before arriving at Gucheng. Cluster 2 was characterized by trajectories originating from the west of Mongolia, passing through Inner Mongolia and the north of Shanxi Province, and then reaching Gucheng. This represented fast-moving trajectories and long-range transport. Cluster 3 began in Mongolia and traveled through Inner Mongolia, the northeast of Hebei Province, and Tianjin before arriving at Gucheng. Cluster 4 originated from the west of Inner Mongolia, passed though Gansu, Ningxia, Shaanxi, and Shanxi Province, and finally reached Gucheng. Cluster 5 originated from the east of Hebei Province and passed through the northwest of Shandong Province to Gucheng, indicating low speed and short-range transport. Air masses from Mongolia and Inner Mongolia may deliver dust from the Gobi Desert, then mix with industrial emissions on their pathways though industrial areas in Tianjin and Hebei Province, or carry combustion pollutants from Shanxi Province, which is an important coal consumption and power generation region in China.
The weighted PSCF (WPSCF) map and the weighted CWT (WCWT) map of PM2.5 is shown in Figure 7b,c. The central and southern Hebei Province were identified as the primary source regions, with the highest WPSCF and WCWT values. The southwest of Beijing, the west of Tianjin, the northwest of Shandong Province, the northeast of Shanxi Province, and Inner Mongolia were potentially the main source areas, with WPSCF values greater than 0.5 and WCWT values greater than 110 μg m−3. Therefore, local emissions, as well as regional and long-range transport processes, had a substantial role in PM2.5 pollution in the studied area.

4. Conclusions

The NCP is one of the most polluted regions in China. This study investigated the concentrations of trace elements in PM2.5 collected at Gucheng, a rural site in the NCP, from 22 October to 23 November 2016. Cl, S, and K were the most abundant elements. Among noncrustal trace metal elements, Zn had the highest concentration, followed by Sb and Pb. SEM was employed for the morphological observation of PM2.5. The shape of the particles was predominantly spherical, chain-like, and irregular. An EF analysis indicated that most of the trace elements in PM2.5 were related to anthropogenic sources. The PMF model identified six sources, namely soil dust, industry, secondary formation, vehicle emissions, biomass and waste burning, and coal combustion (in descending order). Cluster, PSCF, and CWT analyses revealed that local emissions from Hebei Province, as well as regional transport from Beijing, Tianjin, Shandong, and Shanxi Province, and long-range transport from Inner Mongolia, contributed mainly to PM2.5. Therefore, strict and coordinated regional air pollution prevention and control measures should be adopted, such as strengthening the regulation of dust, industrial emissions, high-emission vehicles, bulk coal and waste combustion, adjusting the industrial structure, and promoting the use of clean energy. The results of this study will help researchers better understand the characteristics and sources of trace elements in PM2.5 in the studied area and provide a reference for emission reduction measures, which are important for improving air quality and reducing the effects of air pollution on human health.

Author Contributions

Conceptualization, L.L. (Lei Liu); methodology, L.L. (Lei Liu), L.L. (Linlin Liang); writing—original draft preparation, L.L. (Lei Liu); writing—review and editing, L.L. (Lei Liu), Y.L., W.W., L.L. (Linlin Liang), X.M., J.J., K.G.; funding acquisition, L.L. (Lei Liu), W.W., L.L. (Linlin Liang). All authors have read and agreed to the published version of the manuscript.

Funding

This research was funded by the National Natural Science Foundation of China (21806183 and 51808549), Chinese Academy of Meteorological Sciences Foundation (2017Z011, 2018Y001), Beijing Natural Science Foundation (8192055), State Environmental Protection Key Laboratory of Sources and Control of Air Pollution Complex (SCAPC201701).

Acknowledgments

We thank Yaqiang Wang and Xianyi Yang of the Chinese Academy of Meteorological Sciences for their technical assistance in using TrajStat.

Conflicts of Interest

The authors declare no conflict of interest.

References

  1. Quan, J.; Zhang, Q.; He, H.; Liu, J.; Huang, M.; Jin, H. Analysis of the formation of fog and haze in North China Plain (NCP). Atmos. Chem. Phys. 2011, 11, 8205–8214. [Google Scholar] [CrossRef] [Green Version]
  2. An, Z.; Huang, R.-J.; Zhang, R.; Tie, X.; Li, G.; Cao, J.; Zhou, W.; Shi, Z.; Han, Y.; Gu, Z.; et al. Severe haze in northern China: A synergy of anthropogenic emissions and atmospheric processes. Proc. Natl. Acad. Sci. USA 2019, 116, 8657. [Google Scholar] [CrossRef] [Green Version]
  3. Lelieveld, J.; Evans, J.S.; Fnais, M.; Giannadaki, D.; Pozzer, A. The contribution of outdoor air pollution sources to premature mortality on a global scale. Nature 2015, 525, 367. [Google Scholar] [CrossRef]
  4. Kim, K.-H.; Kabir, E.; Kabir, S. A review on the human health impact of airborne particulate matter. Environ. Int. 2015, 74, 136–143. [Google Scholar] [CrossRef] [PubMed]
  5. Zhang, T.; Gao, B.; Zhou, Z.; Chang, Y. The movement and deposition of PM2.5 in the upper respiratory tract for the patients with heart failure: An elementary CFD study. Biomed. Eng. Online 2016, 15, 138. [Google Scholar] [CrossRef] [PubMed] [Green Version]
  6. Sameenoi, Y.; Koehler, K.; Shapiro, J.; Boonsong, K.; Sun, Y.; Collett, J.; Volckens, J.; Henry, C.S. Microfluidic electrochemical sensor for on-line monitoring of aerosol oxidative activity. J. Am. Chem. Soc. 2012, 134, 10562–10568. [Google Scholar] [CrossRef] [Green Version]
  7. Charrier, J.G.; Anastasio, C. Rates of hydroxyl radical production from transition metals and quinones in a surrogate lung fluid. Environ. Sci. Technol. 2015, 49, 9317–9325. [Google Scholar] [CrossRef] [PubMed] [Green Version]
  8. Park, J.; Park, E.H.; Schauer, J.J.; Yi, S.-M.; Heo, J. Reactive oxygen species (ROS) activity of ambient fine particles (PM2.5) measured in Seoul, Korea. Environ. Int. 2018, 117, 276–283. [Google Scholar] [CrossRef]
  9. Querol, X.; Viana, M.; Alastuey, A.; Amato, F.; Moreno, T.; Castillo, S.; Pey, J.; de la Rosa, J.; Sánchez de la Campa, A.; Artíñano, B.; et al. Source origin of trace elements in PM from regional background, urban and industrial sites of Spain. Atmos. Environ. 2007, 41, 7219–7231. [Google Scholar] [CrossRef]
  10. Wåhlin, P.; Berkowicz, R.; Palmgren, F. Characterisation of traffic-generated particulate matter in Copenhagen. Atmos. Environ. 2006, 40, 2151–2159. [Google Scholar] [CrossRef]
  11. Shen, Z.; Sun, J.; Cao, J.; Zhang, L.; Zhang, Q.; Lei, Y.; Gao, J.; Huang, R.-J.; Liu, S.; Huang, Y.; et al. Chemical profiles of urban fugitive dust PM2.5 samples in northern Chinese cities. Sci. Total Environ. 2016, 569–570, 619–626. [Google Scholar] [CrossRef] [PubMed]
  12. Cesari, D.; Merico, E.; Grasso, F.; Decesari, S.; Belosi, F.; Manarini, F.; Rinaldi, M.; Nuntiis, P.; Volpi, F.; Gambaro, A.; et al. Source apportionment of PM2.5 and of its oxidative potential in an industrial suburban site in south Italy. Atmosphere 2019, 10, 758. [Google Scholar] [CrossRef] [Green Version]
  13. Yao, L.; Yang, L.; Yuan, Q.; Yan, C.; Dong, C.; Meng, C.; Sui, X.; Yang, F.; Lu, Y.; Wang, W. Sources apportionment of PM2.5 in a background site in the North China Plain. Sci. Total Environ. 2016, 541, 590–598. [Google Scholar] [CrossRef] [PubMed]
  14. Lin, W.; Xu, X.; Ge, B.; Zhang, X. Characteristics of gaseous pollutants at Gucheng, a rural site southwest of Beijing. J. Geophys. Res. Atmos. 2009, 114. [Google Scholar] [CrossRef] [Green Version]
  15. Lin, W.L.; Xu, X.B.; Ma, Z.Q.; Zhao, H.R.; Liu, X.W.; Wang, Y. Characteristics and recent trends of sulfur dioxide at urban, rural, and background sites in North China: Effectiveness of control measures. J. Environ. Sci. China 2012, 24, 34–49. [Google Scholar] [CrossRef]
  16. Chi, X.Y.; He, P.Z.; Jiang, Z.; Yu, X.W.; Yue, F.G.; Wang, L.Q.; Li, B.K.; Kang, H.; Liu, C.; Xie, Z.Q. Acidity of aerosols during winter heavy haze events in Beijing and Gucheng, China. J. Meteorol. Res. 2018, 32, 14–25. [Google Scholar] [CrossRef]
  17. Shen, X.J.; Sun, J.Y.; Zhang, X.Y.; Zhang, Y.M.; Wang, Y.Q.; Tan, K.Y.; Wang, P.; Zhang, L.; Qi, X.F.; Che, H.C.; et al. Comparison of submicron particles at a rural and an urban site in the North China Plain during the December 2016 heavy pollution episodes. J. Meteorol. Res. 2018, 32, 26–37. [Google Scholar] [CrossRef]
  18. Duan, F.K.; He, K.B.; Ma, Y.L.; Yang, F.M.; Yu, X.C.; Cadle, S.H.; Chan, T.; Mulawa, P.A. Concentration and chemical characteristics of PM2.5 in Beijing, China: 2001–2002. Sci. Total Environ. 2006, 355, 264–275. [Google Scholar] [CrossRef]
  19. State Environmental Protection Administration of China. Background Contents on Elements of Soils in China; State Environmental Protection Administration of China: Beijing, China, 1990.
  20. Paatero, P.; Tapper, U. Positive matrix factorization: A non-negative factor model with optimal utilization of error estimates of data values. Environmetrics 1994, 5, 111–126. [Google Scholar] [CrossRef]
  21. Paatero, P. Least squares formulation of robust non-negative factor analysis. Chemom. Intell. Lab. Syst. 1997, 37, 23–35. [Google Scholar] [CrossRef]
  22. Norris, G.; Duvall, R.; Brown, S.; Bai, S. Epa Positive Matrix Factorization (PMF) 5.0 Fundamentals and User Guide; U.S. Environmental Protection Agency Office of Research and Development: Washington, DC, USA, 2014.
  23. Wang, Y.Q.; Zhang, X.Y.; Draxler, R.R. Trajstat: Gis-based software that uses various trajectory statistical analysis methods to identify potential sources from long-term air pollution measurement data. Environ. Model. Softw. 2009, 24, 938–939. [Google Scholar] [CrossRef]
  24. Hao, T.; Cai, Z.; Chen, S.; Han, S.; Yao, Q.; Fan, W. Transport pathways and potential source regions of PM2.5 on the west coast of Bohai Bay during 2009–2018. Atmosphere 2019, 10, 345. [Google Scholar] [CrossRef] [Green Version]
  25. Zhang, Y.; Lang, J.; Cheng, S.; Li, S.; Zhou, Y.; Chen, D.; Zhang, H.; Wang, H. Chemical composition and sources of PM1 and PM2.5 in Beijing in autumn. Sci. Total Environ. 2018, 630, 72–82. [Google Scholar] [CrossRef] [PubMed]
  26. Gunchin, G.; Manousakas, M.; Osan, J.; Karydas, A.G.; Eleftheriadis, K.; Lodoysamba, S.; Shagjjamba, D.; Migliori, A.; Padilla-Alvarez, R.; Streli, C.; et al. Three-year long source apportionment study of airborne particles in Ulaanbaatar using X-ray fluorescence and positive matrix factorization. Aerosol Air Qual. Res. 2019, 19, 1056–1067. [Google Scholar] [CrossRef] [Green Version]
  27. Pokorná, P.; Schwarz, J.; Krejci, R.; Swietlicki, E.; Havránek, V.; Ždímal, V. Comparison of PM2.5 chemical composition and sources at a rural background site in central Europe between 1993/1994/1995 and 2009/2010: Effect of legislative regulations and economic transformation on the air quality. Environ. Pollut. 2018, 241, 841–851. [Google Scholar] [CrossRef]
  28. Squizzato, S.; Cazzaro, M.; Innocente, E.; Visin, F.; Hopke, P.K.; Rampazzo, G. Urban air quality in a mid-size city—PM2.5 composition, sources and identification of impact areas: From local to long range contributions. Atmos. Res. 2017, 186, 51–62. [Google Scholar] [CrossRef] [Green Version]
  29. Grivas, G.; Cheristanidis, S.; Chaloulakou, A.; Koutrakis, P.; Mihalopoulos, N. Elemental composition and source apportionment of fine and coarse particles at traffic and urban background locations in Athens, Greece. Aerosol Air Qual. Res. 2018, 18, 1642–1659. [Google Scholar] [CrossRef] [Green Version]
  30. Gao, J.; Wang, K.; Wang, Y.; Liu, S.; Zhu, C.; Hao, J.; Liu, H.; Hua, S.; Tian, H. Temporal-spatial characteristics and source apportionment of PM2.5 as well as its associated chemical species in the Beijing-Tianjin-Hebei region of China. Environ. Pollut. 2018, 233, 714–724. [Google Scholar] [CrossRef]
  31. Xie, R.K.; Seip, H.M.; Leinum, J.R.; Winje, T.; Xiao, J.S. Chemical characterization of individual particles (PM10) from ambient air in Guiyang city, China. Sci. Total Environ. 2005, 343, 261–272. [Google Scholar] [CrossRef]
  32. Shi, Z.; Shao, L.; Jones, T.P.; Whittaker, A.G.; Lu, S.; Bérubé, K.A.; He, T.; Richards, R.J. Characterization of airborne individual particles collected in an urban area, a satellite city and a clean air area in Beijing, 2001. Atmos. Environ. 2003, 37, 4097–4108. [Google Scholar] [CrossRef]
  33. Wang, J.; Hu, Z.; Chen, Y.; Chen, Z.; Xu, S. Contamination characteristics and possible sources of PM10 and PM2.5 in different functional areas of Shanghai, China. Atmos. Environ. 2013, 68, 221–229. [Google Scholar] [CrossRef]
  34. Yue, W.; Li, X.; Liu, J.; Li, Y.; Yu, X.; Deng, B.; Wan, T.; Zhang, G.; Huang, Y.; He, W.; et al. Characterization of PM2.5 in the ambient air of Shanghai city by analyzing individual particles. Sci. Total Environ. 2006, 368, 916–925. [Google Scholar] [CrossRef] [PubMed]
  35. Zhan, Y.; Ginder-Vogel, M.; Shafer, M.M.; Rudich, Y.; Pardo, M.; Katra, I.; Katoshevski, D.; Schauer, J.J. Changes in oxidative potential of soil and fly ash after reaction with gaseous nitric acid. Atmos. Environ. 2018, 173, 306–315. [Google Scholar] [CrossRef]
  36. Hagino, H.; Oyama, M.; Sasaki, S. Laboratory testing of airborne brake wear particle emissions using a dynamometer system under urban city driving cycles. Atmos. Environ. 2016, 131, 269–278. [Google Scholar] [CrossRef] [Green Version]
  37. Lin, Y.C.; Tsai, C.J.; Wu, Y.C.; Zhang, R.; Chi, K.H.; Huang, Y.T.; Lin, S.H.; Hsu, S.C. Characteristics of trace metals in traffic-derived particles in Hsuehshan Tunnel, Taiwan: Size distribution, potential source, and fingerprinting metal ratio. Atmos. Chem. Phys. 2015, 15, 4117–4130. [Google Scholar] [CrossRef] [Green Version]
  38. Huang, X.; Olmez, I.; Aras, N.K.; Gordon, G.E. Emissions of trace elements from motor vehicles: Potential marker elements and source composition profile. Atmos. Environ. 1994, 28, 1385–1391. [Google Scholar] [CrossRef]
  39. Tauler, R.; Viana, M.; Querol, X.; Alastuey, A.; Flight, R.M.; Wentzell, P.D.; Hopke, P.K. Comparison of the results obtained by four receptor modelling methods in aerosol source apportionment studies. Atmos. Environ. 2009, 43, 3989–3997. [Google Scholar] [CrossRef]
  40. Owoade, K.O.; Hopke, P.K.; Olise, F.S.; Ogundele, L.T.; Fawole, O.G.; Olaniyi, B.H.; Jegede, O.O.; Ayoola, M.A.; Bashiru, M.I. Chemical compositions and source identification of particulate matter (PM2.5 and PM2.5–10) from a scrap iron and steel smelting industry along the Ife–Ibadan highway, Nigeria. Atmos. Pollut. Res. 2015, 6, 107–119. [Google Scholar] [CrossRef]
  41. Dai, Q.-L.; Bi, X.-H.; Wu, J.-H.; Zhang, Y.-F.; Wang, J.; Xu, H.; Yao, L.; Jiao, L.; Feng, Y.-C. Characterization and source identification of heavy metals in ambient PM10 and PM2.5 in an integrated iron and steel industry zone compared with a background site. Aerosol Air Qual. Res. 2015, 15, 875–887. [Google Scholar] [CrossRef] [Green Version]
  42. Andreae, M.O.; Atlas, E.; Harris, G.W.; Helas, G.; de Kock, A.; Koppmann, R.; Maenhaut, W.; Manø, S.; Pollock, W.H.; Rudolph, J.; et al. Methyl halide emissions from savanna fires in southern Africa. J. Geophys. Res. Atmos. 1996, 101, 23603–23613. [Google Scholar] [CrossRef] [Green Version]
  43. Vassilev, S.V.; Baxter, D.; Andersen, L.K.; Vassileva, C.G. An overview of the chemical composition of biomass. Fuel 2010, 89, 913–933. [Google Scholar] [CrossRef]
  44. Cheng, Y.; Engling, G.; He, K.B.; Duan, F.K.; Ma, Y.L.; Du, Z.Y.; Liu, J.M.; Zheng, M.; Weber, R.J. Biomass burning contribution to Beijing aerosol. Atmos. Chem. Phys. 2013, 13, 7765–7781. [Google Scholar] [CrossRef] [Green Version]
  45. Chen, J.; Li, C.; Ristovski, Z.; Milic, A.; Gu, Y.; Islam, M.S.; Wang, S.; Hao, J.; Zhang, H.; He, C.; et al. A review of biomass burning: Emissions and impacts on air quality, health and climate in China. Sci. Total Environ. 2017, 579, 1000–1034. [Google Scholar] [CrossRef] [PubMed] [Green Version]
  46. Chen, G.; Zhang, N.; Ma, W.; Rotter, V.S.; Wang, Y. Investigation of chloride deposit formation in a 24 MWe waste to energy plant. Fuel 2015, 140, 317–327. [Google Scholar] [CrossRef]
  47. Lu, P.; Huang, Q.; Bourtsalas, A.C.; Themelis, N.J.; Chi, Y.; Yan, J. Review on fate of chlorine during thermal processing of solid wastes. J. Environ. Sci. 2019, 78, 13–28. [Google Scholar] [CrossRef] [PubMed]
  48. Ma, W.; Hoffmann, G.; Schirmer, M.; Chen, G.; Rotter, V.S. Chlorine characterization and thermal behavior in MSW and RDF. J. Hazard. Mater. 2010, 178, 489–498. [Google Scholar] [CrossRef]
  49. Gordon, G.E. Receptor models. Environ. Sci. Technol. 1988, 22, 1132–1142. [Google Scholar] [CrossRef]
  50. Cohen, D.D.; Crawford, J.; Stelcer, E.; Bac, V.T. Characterisation and source apportionment of fine particulate sources at Hanoi from 2001 to 2008. Atmos. Environ. 2010, 44, 320–328. [Google Scholar] [CrossRef]
  51. Yu, L.; Wang, G.; Zhang, R.; Zhang, L.; Song, Y.; Wu, B.; Li, X.; An, K.; Chu, J. Characterization and source apportionment of PM2.5 in an urban environment in Beijing. Aerosol Air Qual. Res. 2013, 13, 574–583. [Google Scholar] [CrossRef] [Green Version]
  52. You, C.F.; Xu, X.C. Coal combustion and its pollution control in China. Energy 2010, 35, 4467–4472. [Google Scholar] [CrossRef]
  53. Tian, H.; Cheng, K.; Wang, Y.; Zhao, D.; Lu, L.; Jia, W.; Hao, J. Temporal and spatial variation characteristics of atmospheric emissions of Cd, Cr, and Pb from coal in China. Atmos. Environ. 2012, 50, 157–163. [Google Scholar] [CrossRef]
  54. Tian, H.Z.; Wang, Y.; Xue, Z.G.; Cheng, K.; Qu, Y.P.; Chai, F.H.; Hao, J.M. Trend and characteristics of atmospheric emissions of Hg, As, and Se from coal combustion in China, 1980–2007. Atmos. Chem. Phys. 2010, 10, 11905–11919. [Google Scholar] [CrossRef] [Green Version]
  55. Li, Q.; Cheng, H.; Zhou, T.; Lin, C.; Guo, S. The estimated atmospheric lead emissions in China, 1990–2009. Atmos. Environ. 2012, 60, 1–8. [Google Scholar] [CrossRef]
  56. Cao, S.; Duan, X.; Zhao, X.; Ma, J.; Dong, T.; Huang, N.; Sun, C.; He, B.; Wei, F. Health risks from the exposure of children to As, Se, Pb and other heavy metals near the largest coking plant in China. Sci. Total Environ. 2014, 472, 1001–1009. [Google Scholar] [CrossRef] [PubMed]
  57. Zhang, R.; Jing, J.; Tao, J.; Hsu, S.C.; Wang, G.; Cao, J.; Lee, C.S.L.; Zhu, L.; Chen, Z.; Zhao, Y.; et al. Chemical characterization and source apportionment of PM2.5 in Beijing: Seasonal perspective. Atmos. Chem. Phys. 2013, 13, 7053–7074. [Google Scholar] [CrossRef] [Green Version]
Figure 1. Location of the Gucheng site.
Atmosphere 11 00179 g001
Figure 2. Proportion of days with different pollution levels.
Atmosphere 11 00179 g002
Figure 3. SEM image of PM2.5 collected on a quartz fiber filter.
Atmosphere 11 00179 g003
Figure 4. Enrichment factors (EFs) of 21 trace elements relative to Al for the PM2.5 samples.
Atmosphere 11 00179 g004
Figure 5. Source profiles of trace elements in PM2.5 obtained through positive matrix factorization (PMF) analysis.
Atmosphere 11 00179 g005
Figure 6. Contribution of each source to the PM2.5.
Atmosphere 11 00179 g006
Figure 7. (a) Air mass back trajectory clusters, (b) weighted potential source contribution function (WPSCF) map, and (c) weighted concentration weighted trajectory (WCWT) map for PM2.5 during the sampling period.
Atmosphere 11 00179 g007
Table 1. Concentrations of PM2.5 (μg m−3) and trace elements (ng m−3) during the sampling period.
MinMaxMeanSD a
PM2.523.29319.46149.8676.55
Al30.631027.10319.84217.54
Na98.10473.61244.59101.11
Cl118.884638.962077.661397.08
Mg56.19548.20184.50110.04
P6.3393.8740.6319.83
S276.674335.591748.781069.64
K254.902748.631287.07545.83
Ca87.513450.03922.57715.54
Ti24.77167.5668.0131.89
V0.5015.478.853.57
Cr13.7430.9921.324.97
Mn18.76111.5460.6220.99
Fe204.271562.88677.31307.17
Co0.2510.915.502.70
Ni11.1325.0117.703.00
Cu6.58152.8241.8733.78
Zn36.451602.96397.74408.74
As0.00150.9026.5531.25
Se5.0628.2013.675.72
Br9.38119.7250.6328.66
Sr8.6138.7919.756.69
Cd5.7932.8616.866.98
Ba30.33107.5771.4119.70
Pb25.82543.66184.52140.40
Sb60.24604.86299.20120.34
a SD: Standard deviation.
Table 2. Concentrations of PM2.5 (μg m−3) and trace elements (ng m−3) in other studies.
Beijing, China (Urban) [25]Baoding, China (Urban) [30]Ulaanbaatar, Mongolia (Urban) [26]Košetice, Czech (Rural) [27]Treviso, Italy (Urban) [28]Athens, Greece (Urban) [29]
Study period10 October to 4 November 2016October 20142014–2016October 2009 to October 201021 December 2012 to 21 February 2013May 2011 to April 2012
PM2.595.4719292.813.64414.2
Al39085073716.575782.4
Na1070930391--254.7
Cl-4317.5-41.9
Mg300450251-8333.4
S3700778017401011.69381409.9
K-1920259103.9688148.9
Ca670134056712.6442114.9
Ti40.84-381.68.94.2
V--20.41.43.1
Cr76.454050.1-1.0
Mn41.0280181.85.33.5
Fe1100169045523.2155149.6
Ni18.894030.26.12.2
Cu26.3811050.911.85.0
Zn2008104514.557.825.6
As-20280.70.7-
Se-10-0.4--
Br---2.0-4.4
Sr4.15--0.6--
Cd-10--0.4-
Ba---0.8-27.6
Pb130220114.514.96.9

