Article

A Stratospheric Intrusion-Influenced Ozone Pollution Episode Associated with an Intense Horizontal-Trough Event

1
School of Atmospheric Sciences, Nanjing University, Nanjing 210023, China
2
Department of Atmospheric Science, China University of Geosciences, Wuhan 430074, China
*
Author to whom correspondence should be addressed.
Atmosphere 2020, 11(2), 164; https://doi.org/10.3390/atmos11020164
Submission received: 15 December 2019 / Revised: 28 January 2020 / Accepted: 28 January 2020 / Published: 4 February 2020
(This article belongs to the Special Issue Ozone Evolution in the Past and Future)

Abstract

:
Ozone pollution is currently a serious issue in China. As an important source of tropospheric ozone, the stratospheric ozone has received less concern. This study uses a combination of ground-based ozone measurements, the latest ERA5 reanalysis data as well as chemistry-climate model and Lagrangian Particle Dispersion Modeling (LPDM) simulations to investigate the potential impacts of stratospheric intrusion (SI) on surface ozone pollution episodes in eastern China. Station-based observations indicate that severe ozone pollution occurred from 27 April to 28 April 2018 in eastern China, with maximal values over 140 ppbv. ERA5 meteorological and ozone data suggest that a strong horizontal-trough exists at the same time, which leads to an evident SI event and brings ozone-rich air from the stratosphere to the troposphere. Using a stratospheric ozone tracer defined by NCAR’s Community Atmosphere Model with Chemistry (CAM-Chem), we conclude that this SI event contributed about 15 ppbv (15%) to the surface ozone pollution episode during 27–28 April in eastern China. The potential impacts of SI events on surface ozone variations should be therefore considered in ozone forecast and control.

1. Introduction

Tropospheric ozone is an important greenhouse gas contributing to global warming [1,2] and also a main pollutant harmful to human health and crop productivity [3,4]. A significant decrease of ozone concentrations has been observed in the eastern United States and parts of Europe due to precursor emission controls [2,5,6]. At the same time, although the Chinese government has strictly controlled industrial emissions since 2011, ozone concentrations in eastern China have increased over the past years [7,8]. Ozone pollution episodes have been reported frequently in eastern China, and ozone pollution is now a serious issue in China [6,7,9]. Surface ozone is related to complex photochemical reactions involving anthropogenic and biogenic emitted volatile organic compounds (VOCs) and nitrogen oxides (NOx) [10,11,12]. While the anthropogenic emitted NOx decreased significantly due to government control and the VOCs emissions changed little [7,8,12], the exact reason for elevated ozone and frequently occurring ozone pollution episodes in eastern China are still not clear.
Besides chemical production, tropospheric ozone can also be transported from the stratosphere through the process of stratospheric intrusion (SI) [13,14,15,16,17]. As another important source of tropospheric ozone, SI contributes 20%–30% to the tropospheric ozone budget in the mid-latitudes of the Northern Hemisphere [14,18,19]. In cases of intense SIs, the stratospheric ozone-rich air may be transported rapidly from the lower stratosphere to the lower troposphere and near the surface [20,21,22,23]. Such deep SI events may cause a steep ozone increase near the surface and lead to ground-level ozone pollution [24,25,26,27,28]. Whether such deep SI events contribute to the recently reported ozone pollution episodes in eastern China is an important question waiting to be answered. Quantifying the relative contribution of SI events to the elevated ozone is important for surface ozone forecasting and control in eastern China.
In the extratropics, SIs always form near the vicinity of extratropical cyclones or baroclinic eddies, through processes like tropopause folding, wave-breaking or cut-off lows [13,29,30]. SIs are often associated with westerly jet stream or frontal activities [17,31,32]. Most of these SI processes occur in areas with high latitudes or high altitudes [33,34,35]. In East Asia, studies of STE mainly focus on the Qinghai-Tibet Plateau and northeast China [15,36,37,38,39]. The potential effects of SI events on surface ozone in eastern China, however, has been less investigated. A recent study found that SI events occur frequently during the summer and contribute about 10 ppbv to surface ozone in eastern China [40]. This poses a question about the potential impacts of SI events on surface ozone variations in eastern China, whereas human activities are particularly active and heavy air pollution happens frequently [6,9,41].
This study investigates a severe ozone pollution episode that occurred during 28–29 April 2018 using the station-based surface ozone measurements as well as the latest ERA5 reanalysis ozone data. In particular, the potential contribution of SIs to surface ozone in the spring season (MAM ) is estimated with the aid of a stratospheric ozone tracer of the CAM-Chem model. The transport mechanism is also analyzed using the ERA5 meteorological reanalysis data.

2. Data and Model Description

2.1. Observational Data Sets

Hourly surface ozone and CO concentrations for the year 2018 were obtained from the public website of the China Ministry of Ecology and Environment: beijingair.sinaapp.com/. The network has had 1500 monitoring stations since 2017 including about 330 cities.

2.2. ERA5 Reanalysis

ERA5 (the fifth generation of ECMWF atmospheric reanalysis) [42] ozone and meteorological data are used in this study for analyzing the ozone and meteorological conditions during the SI events. ERA5 was produced using 4D-Var data assimilation in CY41R2 of ECMWF’s Integrated Forecast System (IFS), with 137 hybrid sigma/pressure (model) levels from the surface to 0.01 hPa. The horizontal resolution of ERA5 for the high resolution realisation (HRES) is about 31 km, 0.28125 degrees. More details of the ERA5 data can be found at its website https://confluence.ecmwf.int/display/CKB/ERA5%3A+data+documentation. Within the framework of the Copernicus Atmosphere Monitoring Service (CAMS) atmospheric composition forecast, IFS was found capable of predicting ozone increases in the troposphere during deep SI events [17]. ERA5 assimilated many ozone observations (satellite and in-situ) including MLS (Microwave Limb Sounder), OMI (Ozone Monitoring Instrument) ozone data, which is of great importance to the determination of STE (Stratosphere Troposphere Exchange). ERA5 ozone shows good agreement with in-situ and satellite measurements in the upper troposphere and lower stratosphere [40]. However, its accuracy in the lower troposphere is relatively poor [40]. That is because the chemical scheme of ozone in ERA5 is completely dependent on the parameterization of ozone source/sink (https://www.ecmwf.int/en/elibrary/16648-part-iv-physical-processes). In addition, due to the lack of in-situ and satellite observations, the tropospheric ozone in ERA5 is not well constrained.

2.3. CAM-Chem Simulations

The Community Atmosphere Model with Chemistry (CAM-Chem) simulation used in this study is performed by NCAR, which is publicly available at https://www.acom.ucar.edu/cam-chem/cam-chem.shtml. It is driven by specified dynamics, with meteorological fields from MERRA2 reanalysis. It is run at 0.9 ° × 1.25 ° horizontal resolution with 56 vertical levels. The chemistry mechanism used is the MOZART-T1. In particular, the O3S variable, a stratospheric ozone tracer relative to the tropopause, is defined by the CAM-Chem model to estimate the stratospheric contribution to tropospheric ozone. O3S is set to the ozone mixing ratio in the stratosphere and is destroyed below the tropopause at the same rate as ozone [43]. More details of the simulation are described on the website https://wiki.ucar.edu/display/camchem/CESM2.1%3ACAM-chem+as+Boundary+Conditions.

2.4. LPDM Simulations

LPDM (Lagrangian Particle Dispersion Modeling) is conducted using the HYSPLIT (Hybrid Single-Particle Lagrangian Integrated Trajectory) model [9,44]. In the model, the residence time and position of particles released at a receptor can be calculated according to the meteorological field. In this study, the model was run 24-h backwards with 3000 particles released at an altitude of 100 m above Hangzhou at 16:00 (local time) on 27 April 2018. The residence time of particles was used to identify the “footprint” retroplume. More details of the LPDM can be found in Ding et al. [45].

3. Results

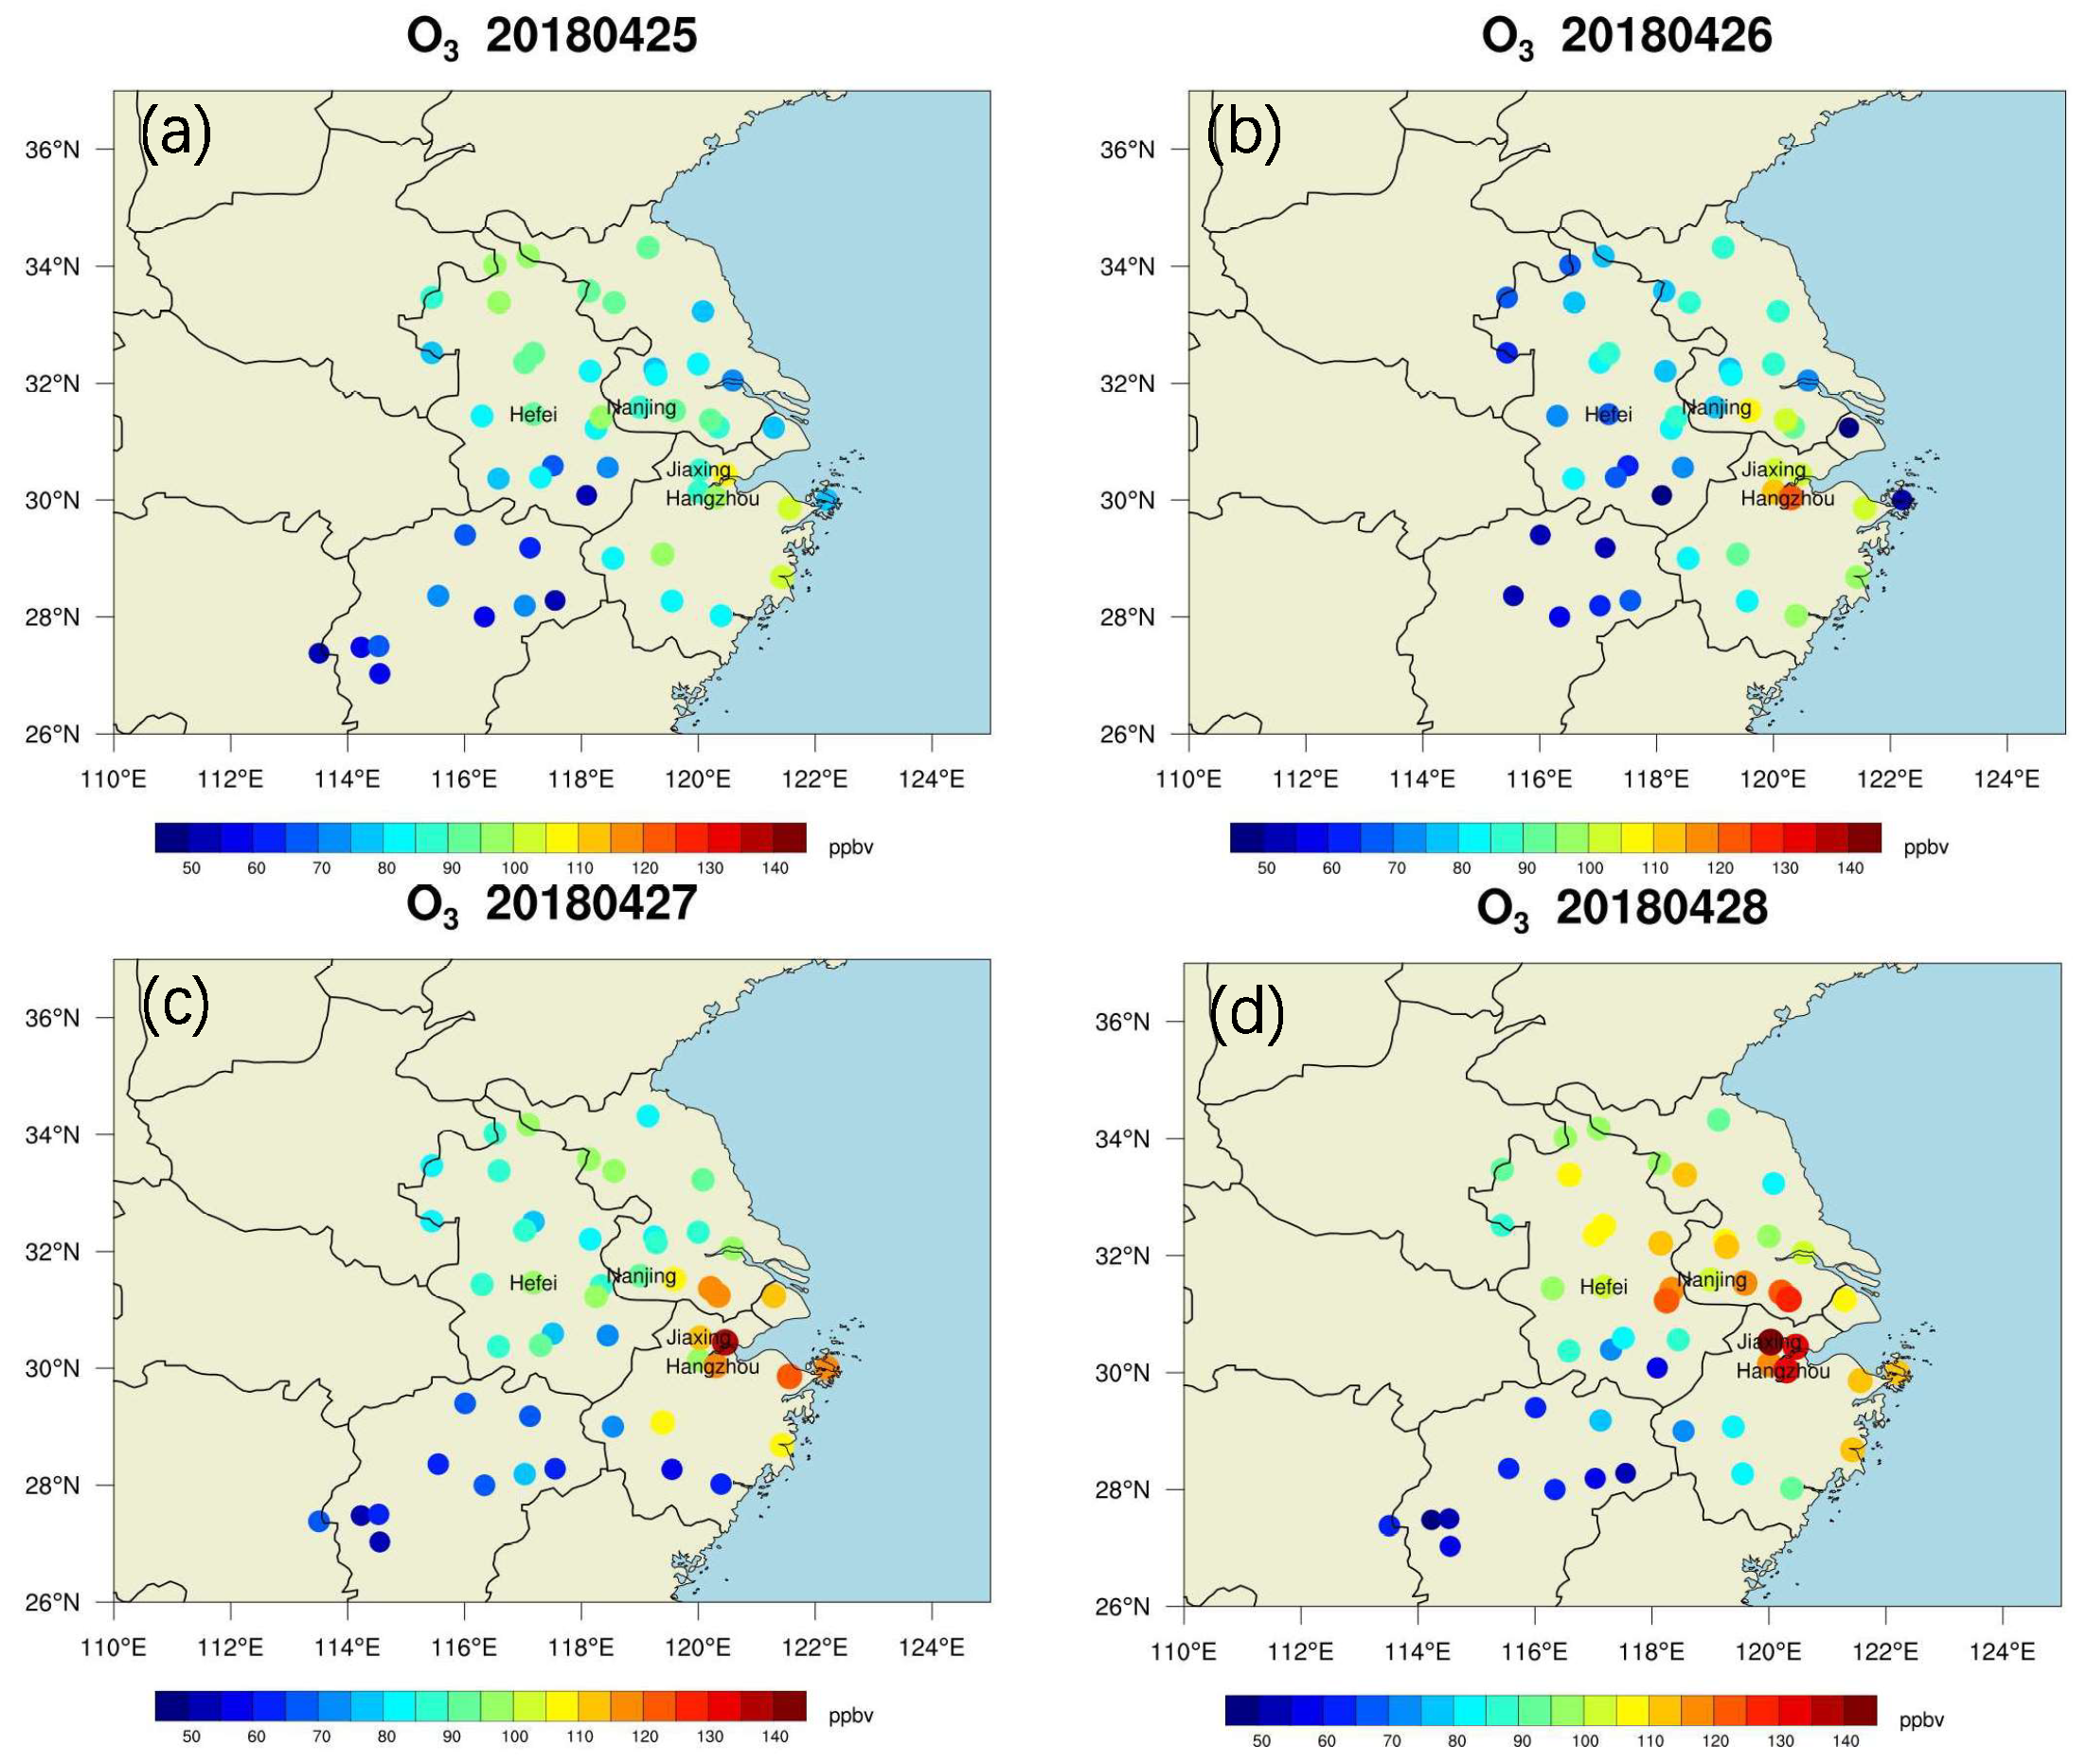
3.1. Surface Ozone Pollution during 25–28 April 2018

Figure 1 shows the horizontal distribution of observed surface ozone concentration in eastern China (from the China Ministry of Ecology and Environment observations). High ozone concentrations can be seen in the cross-region between Jiangsu, Zhejiang and Anhui provinces. In particular, severe ozone pollution occurred on 27 April 2018 and 28 April 2018, with maximal ozone concentrations over 100 ppbv in the cross-region and over 140 ppbv in the Jiaxing City.
The time evolution of surface ozone in the cities of Nanjing (the capital of Jiangsu Province), Hangzhou (the capital of Zhejiang province), Hefei (the capital of Anhui province) and Jiaxing (the city shows the highest ozone concentration) is shown in Figure 2. In Nanjing, ozone concentration exceeded 100 ppbv on 27–28 April 2018, with maximum values of 110 ppbv on 28 April 2018. In Hangzhou, ozone pollution (> 100 ppbv) occurred on 26–28 April 2018, with maximum values of 120 ppbv on 26 April 2018. Severe ozone pollution occurs from 25 April 2018 to 30 April 2018 in Jiaxing, with ozone concentration exceeds 140 ppbv on 27 and 28 April 2018. Hefei also shows high ozone concentrations above 100 ppbv on 25, 27 and 28 April 2018, with a maximum of 114 ppbv on 28 April 2018.
Figure 3 shows the mean diurnal cycle of ozone and CO averaged over the month (April 2018, solid lines) and of the severe ozone pollution days (27–28 April 2018, dashed lines) in the cities of Nanjing, Hangzhou, Hefei and Jiaxing. The maximal ozone concentration of the monthly mean diurnal cycle is no more than 75 ppbv in all four cities, while the ozone peak exceeded 100 ppbv on 27–28 April 2018. In normal conditions (mean of the month), ozone in selected cities show a clear diurnal cycle with a daily maximum of about 16:00 (local time) due to the photochemical production of ozone. On 27–28 April 2018, a delayed secondary peak of ozone is evident in all the four selected cities (Figure 2 and Figure 3). This indicates an extra mechanism besides the normal photochemical production. At the same time, concentrations of CO are relatively low and anti-correlated with ozone on the ozone polluted days (27–28 April 2018). While low values of CO are a tracer for air of stratospheric origin, this suggests that the ozone pollution episode on 27–28 April 2018 might be related to stratospheric intrusion.

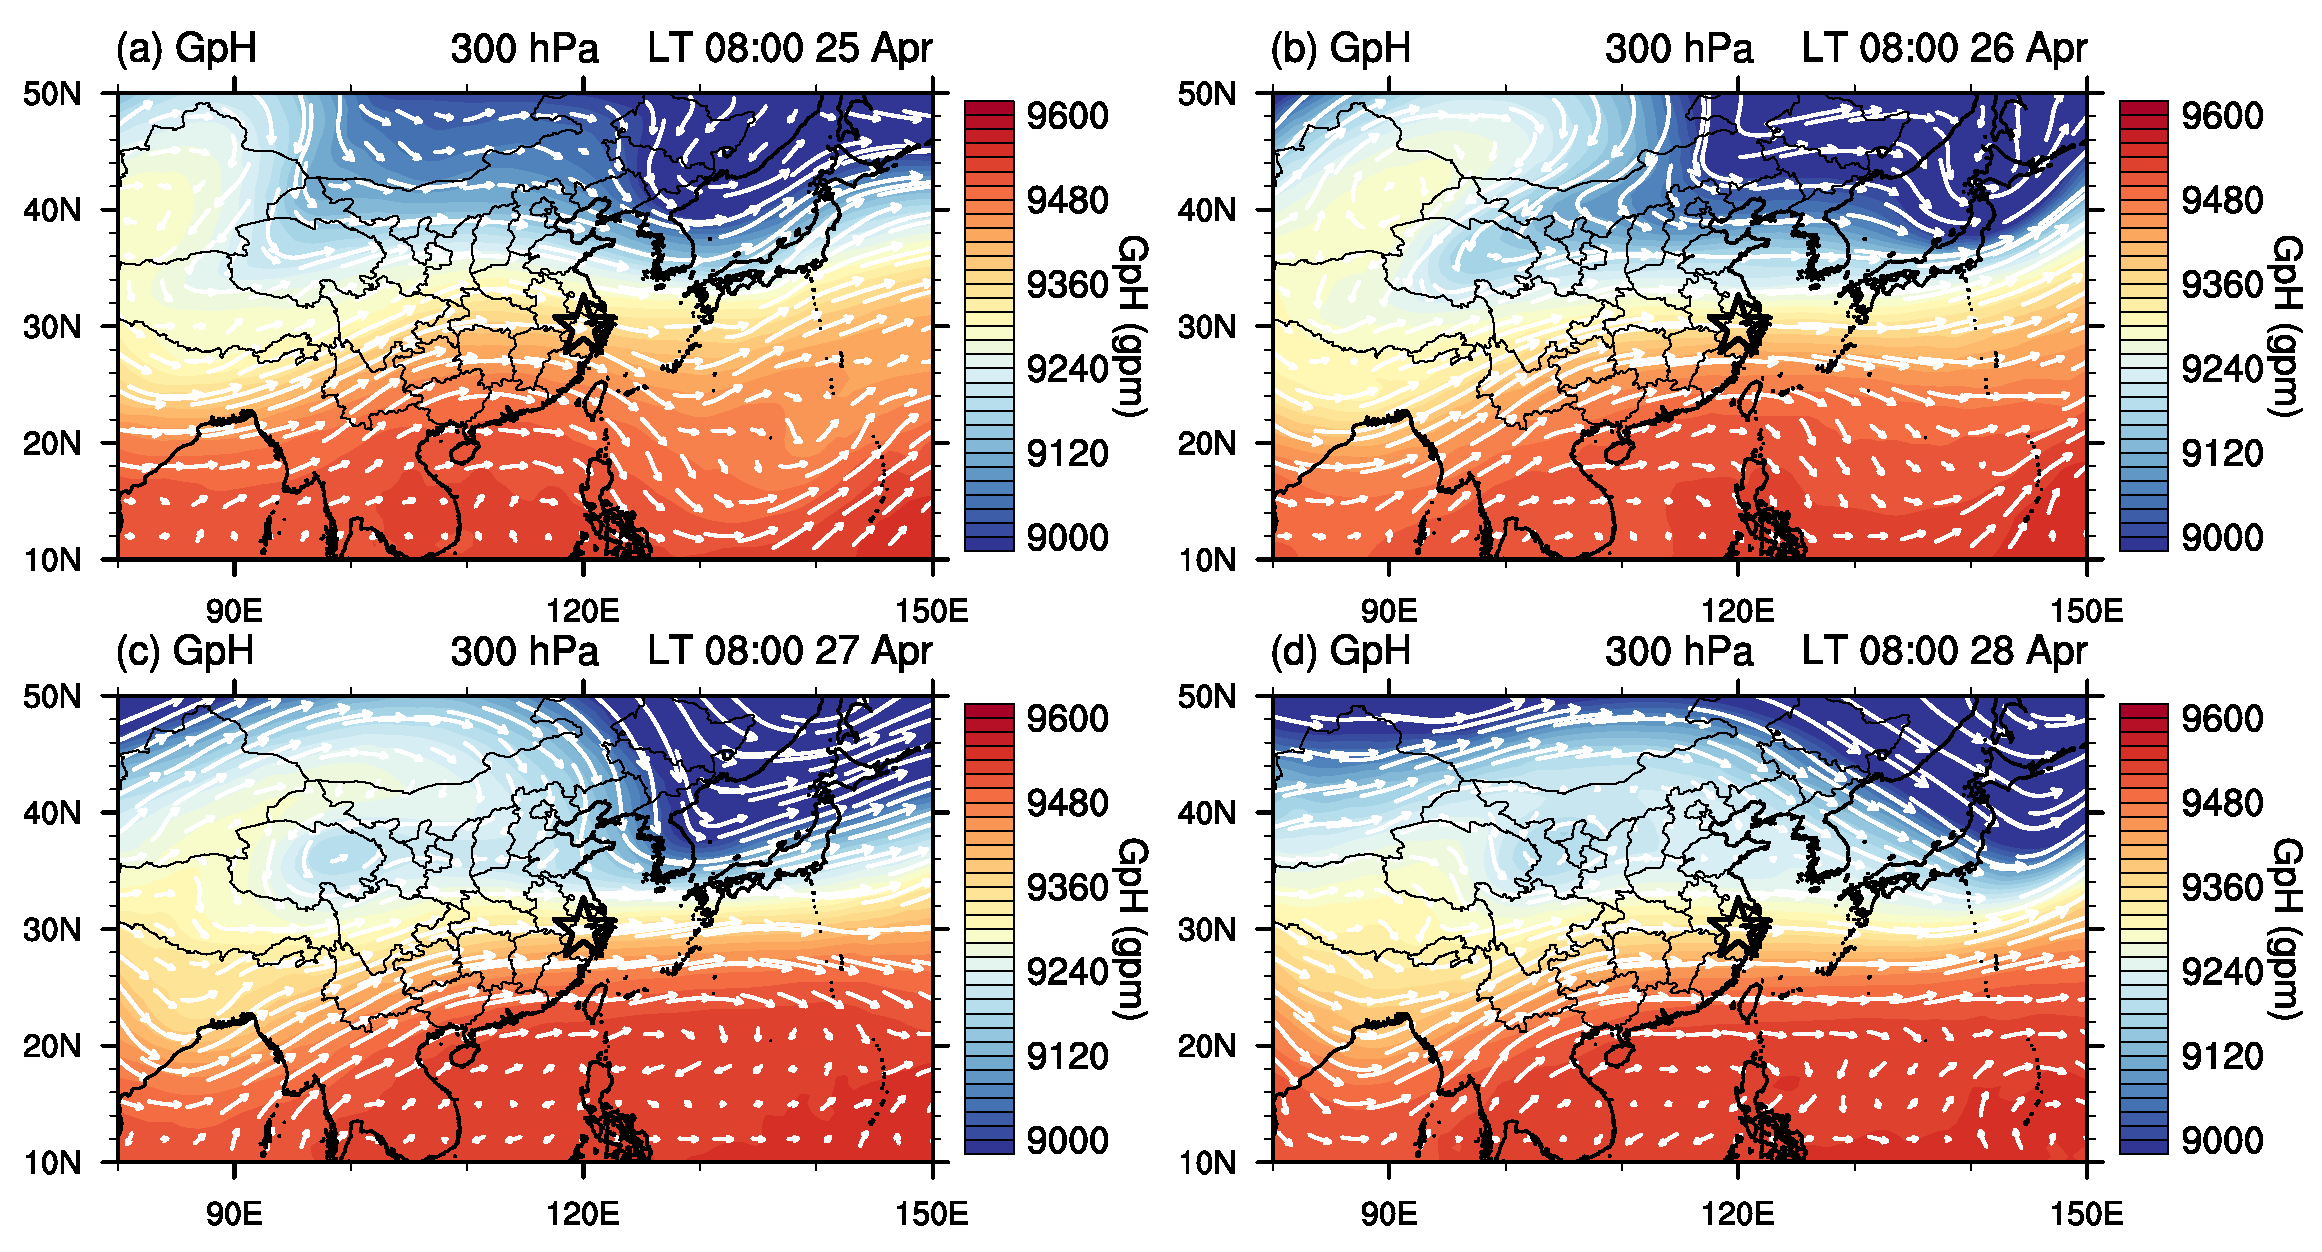
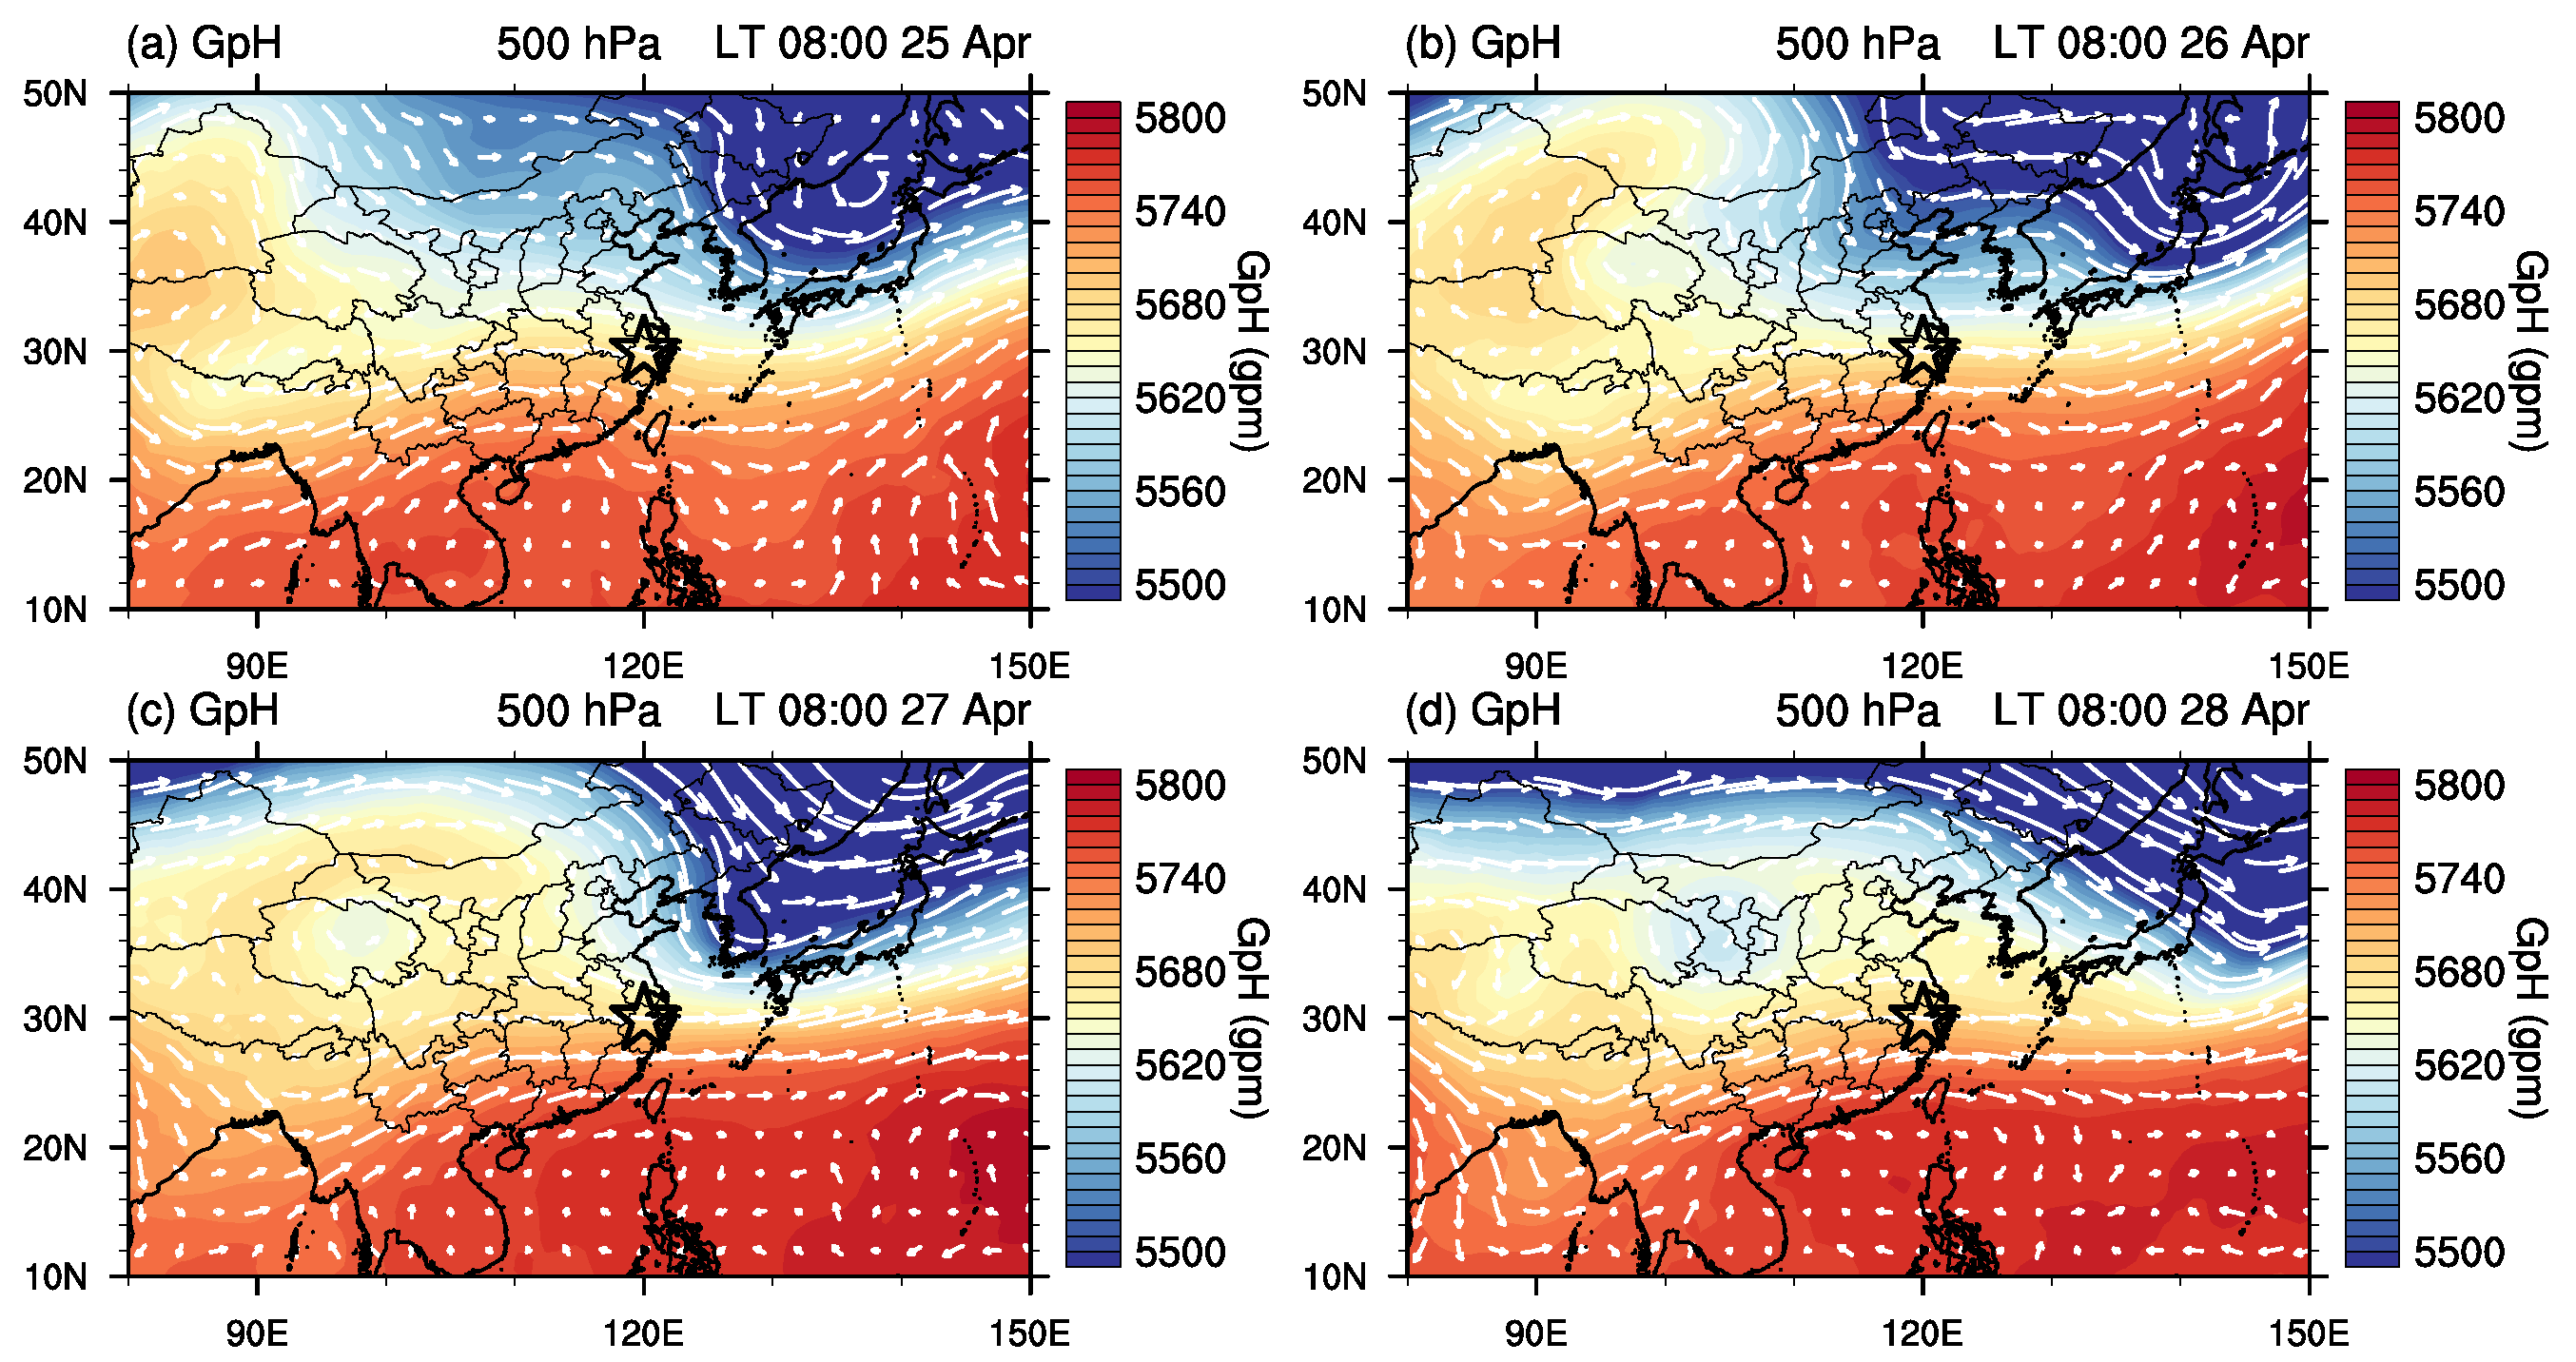
3.2. Meteorological Conditions

The synoptic conditions over east Asia in the upper atmosphere (at 300 hPa) are shown in Figure 4. On 25 April 2018, two upper-level troughs are evident with one shallow trough over Mongolia and north China and the other deep trough over the region between northeastern China and Japan. The shallow trough moves faster than the deep one and catches up with the deeper trough. Subsequently, the two upper-level troughs combine together and formed an intense horizontal-trough on 26 April 2018. On 27 April 2018, the centre of the two upper-level trough merged completely and the connection between the centre and the western part of the horizontal-trough became weaker. Later, the centre of the deep trough moved eastward and the western part formed a cut-off low on 28 April 2018. The area of interest is on the south edge of the deep trough (see figure on 27 April 2018), which brings air from high latitudes.
Figure 5 shows the synoptic conditions over east Asia at 500 hPa. Consistent with the upper-level conditions shown in Figure 4, two troughs can be seen at 500 hPa on 25 April 2018 with an earlier strong one over the region between northeastern China and Japan and a later weak one over Mongolia and north China. The later one moved faster and was enhanced during its moving. From 26 April to 27 April 2018, the two troughs merged together and formed a very deep trough. On 27 April 2018, the area of interest was right behind and influenced by the deep trough, which brought air from higher latitudes.
Figure 6 shows the spacial distribution of potential vorticity (PV) at 300 hPa. In the absence of friction and heat sources, PV is conserved along trajectories, which allows it to be used as a tracer in upper-level dynamics. In particular, PV is broadly used to separate the stratospheric and tropospheric air masses due to the significant difference of the static stability between them. Following previous studies [40], we used 2 PVU to mark the dynamical tropopause. On 25 April 2018, high PV values can be seen over Mongolia and north China as well as the region between northeastern China and Japan, associated with the two upper-level troughs as seen in Figure 3. Along with the horizontal-trough development, a broad quasi-horizontal band of high PV values can be seen from the west to the east of China on 26 and 27 April 2018. It is noteworthy that there are two belts in this high PV band, with one between 30° and 40° N and the other between 20° and 30° N. The later one crossed the area of interest in this study. This suggests a potential impact of stratospheric ozone intrusion on the tropospheric ozone over the area of interest.

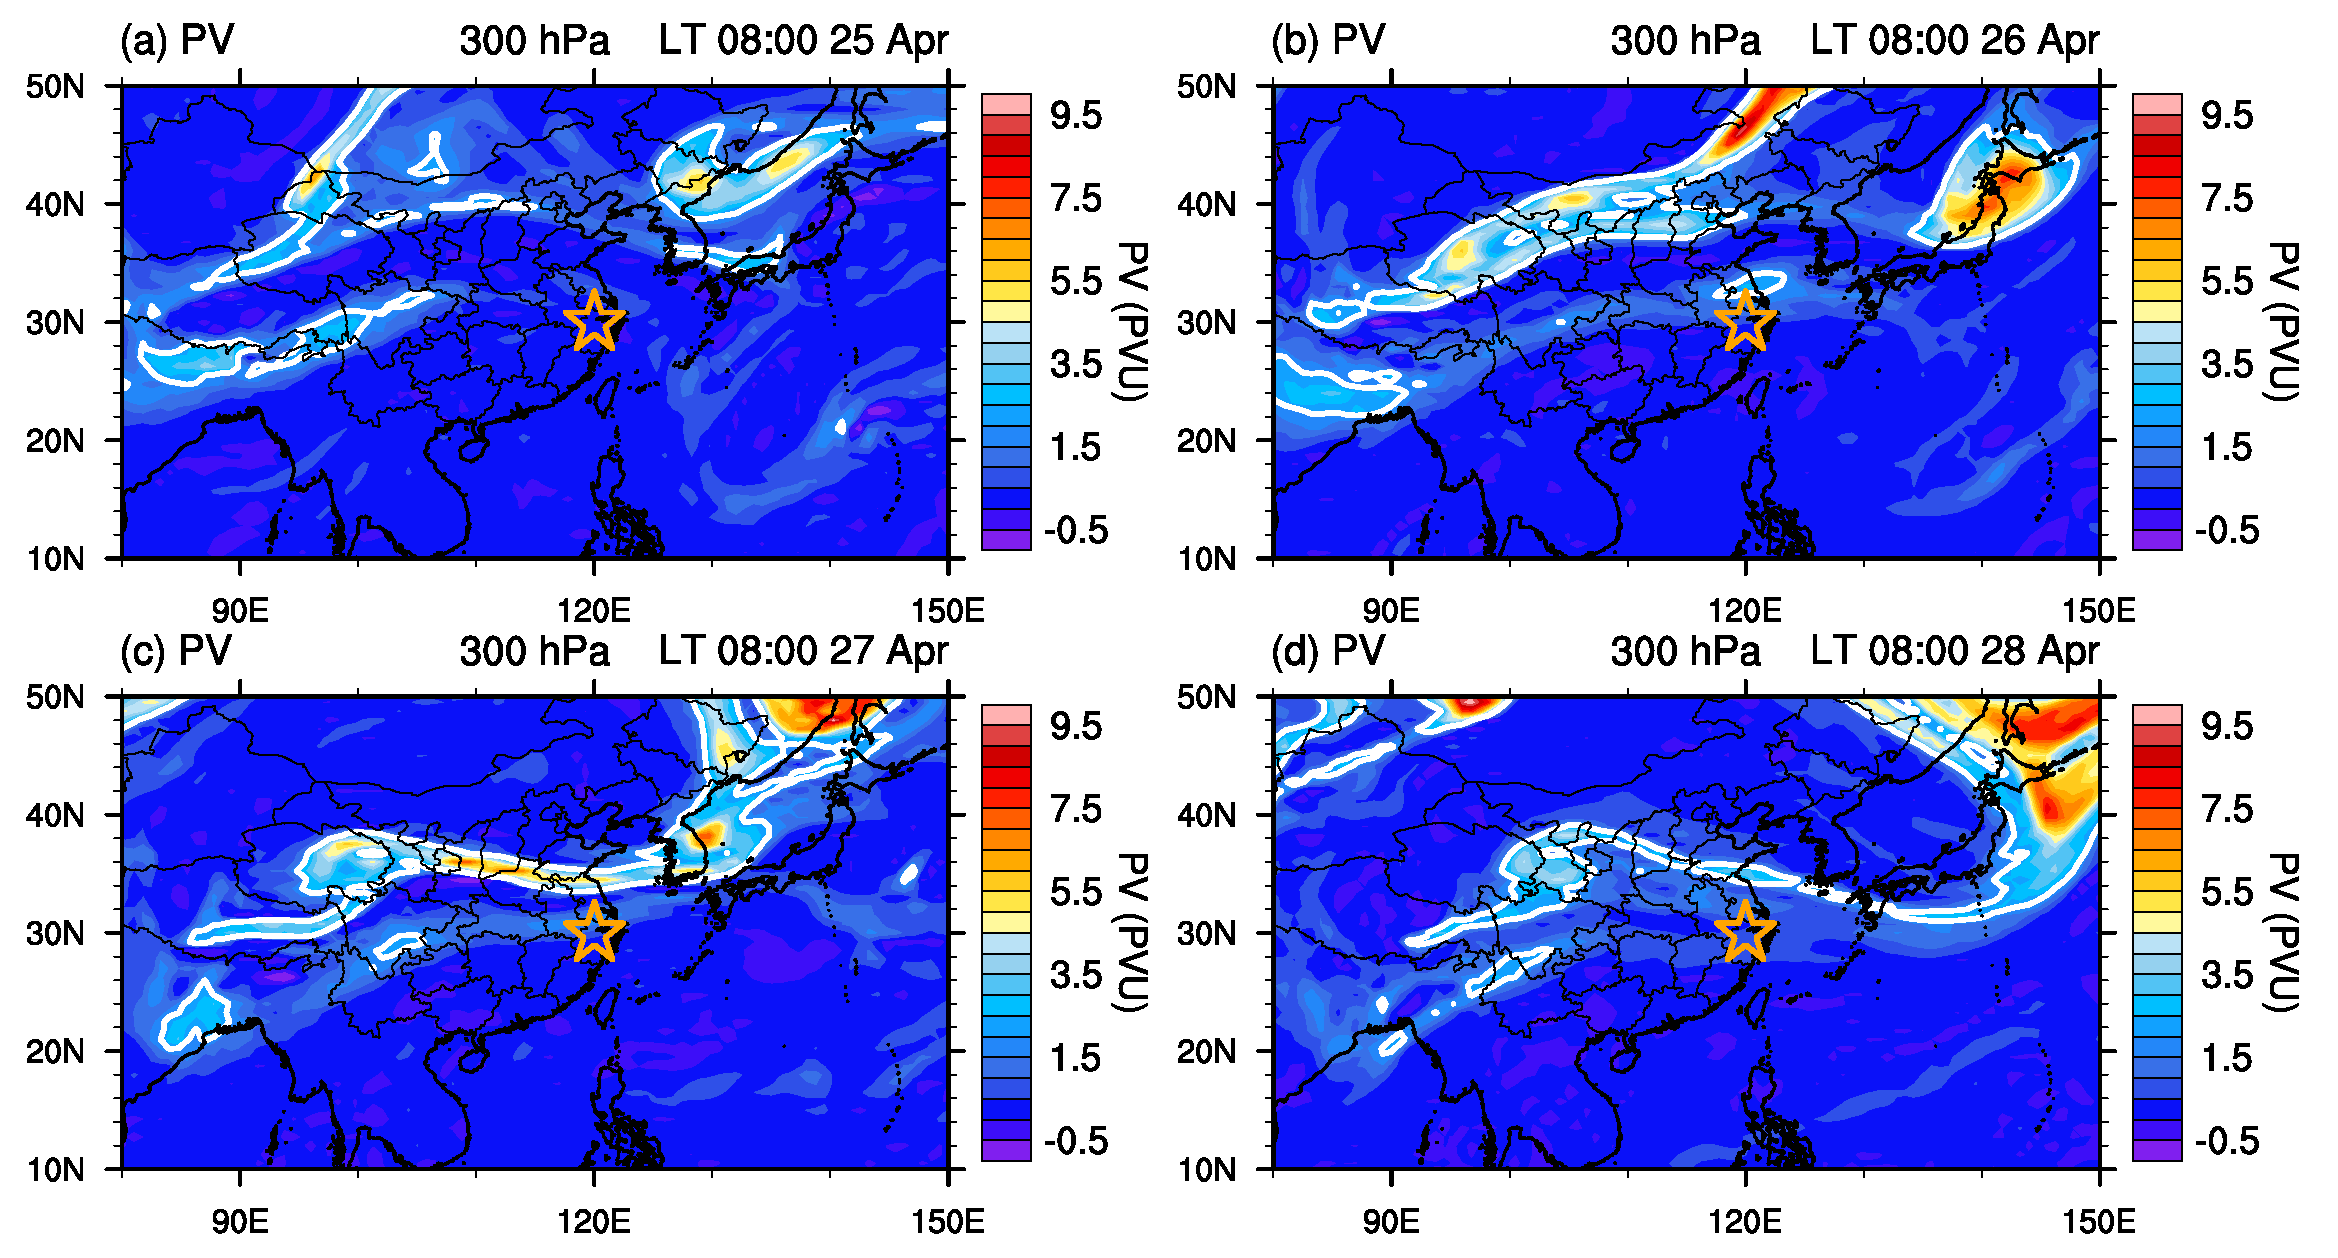
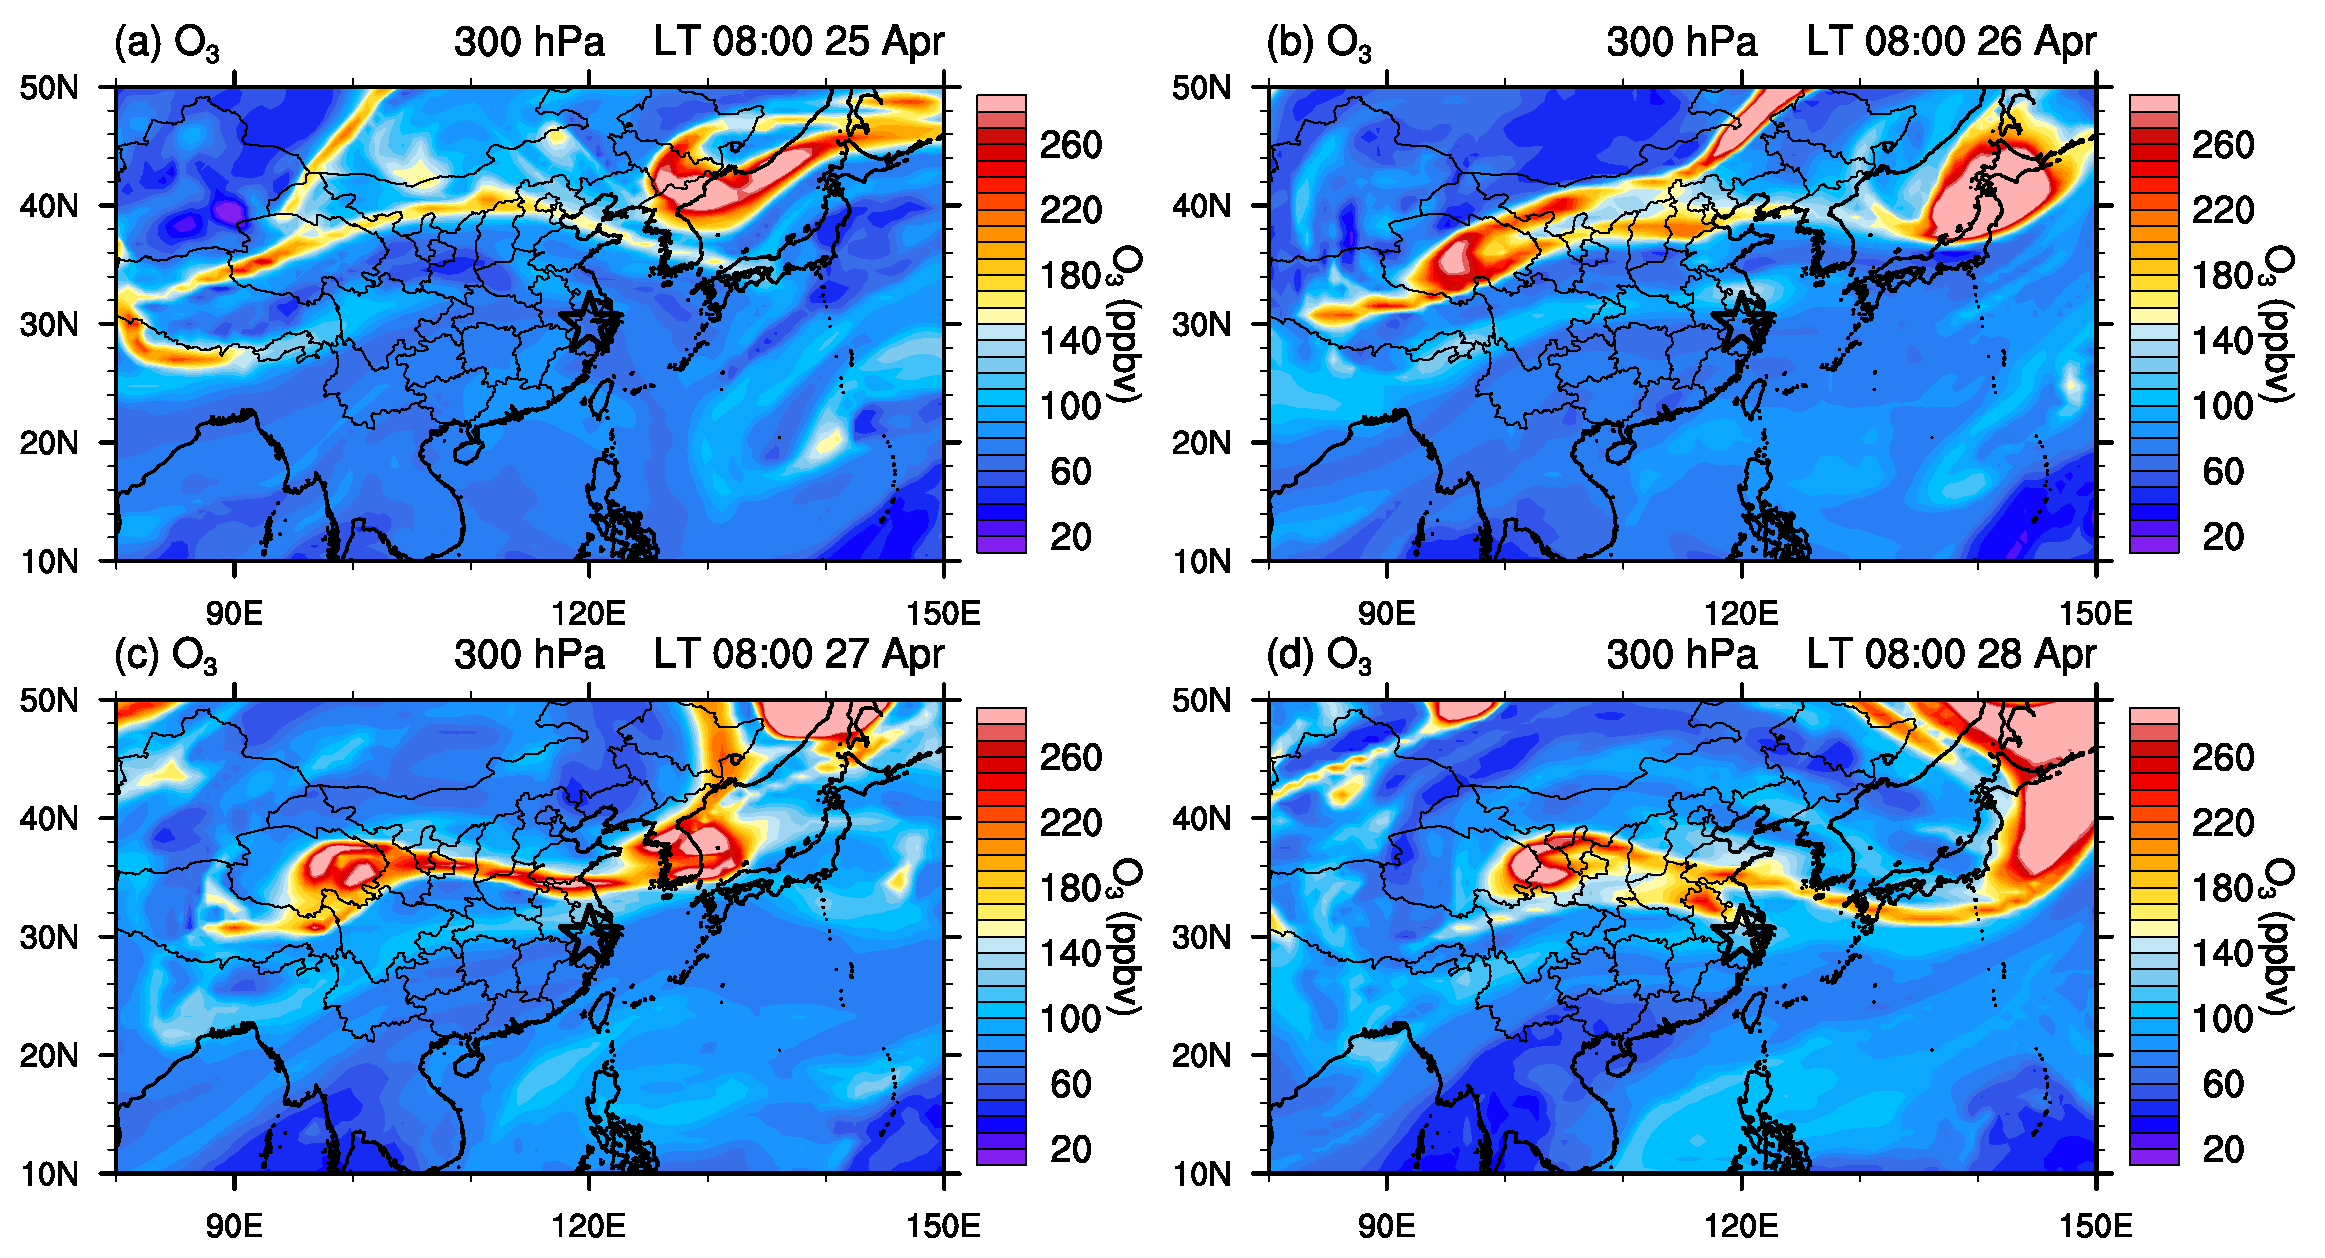
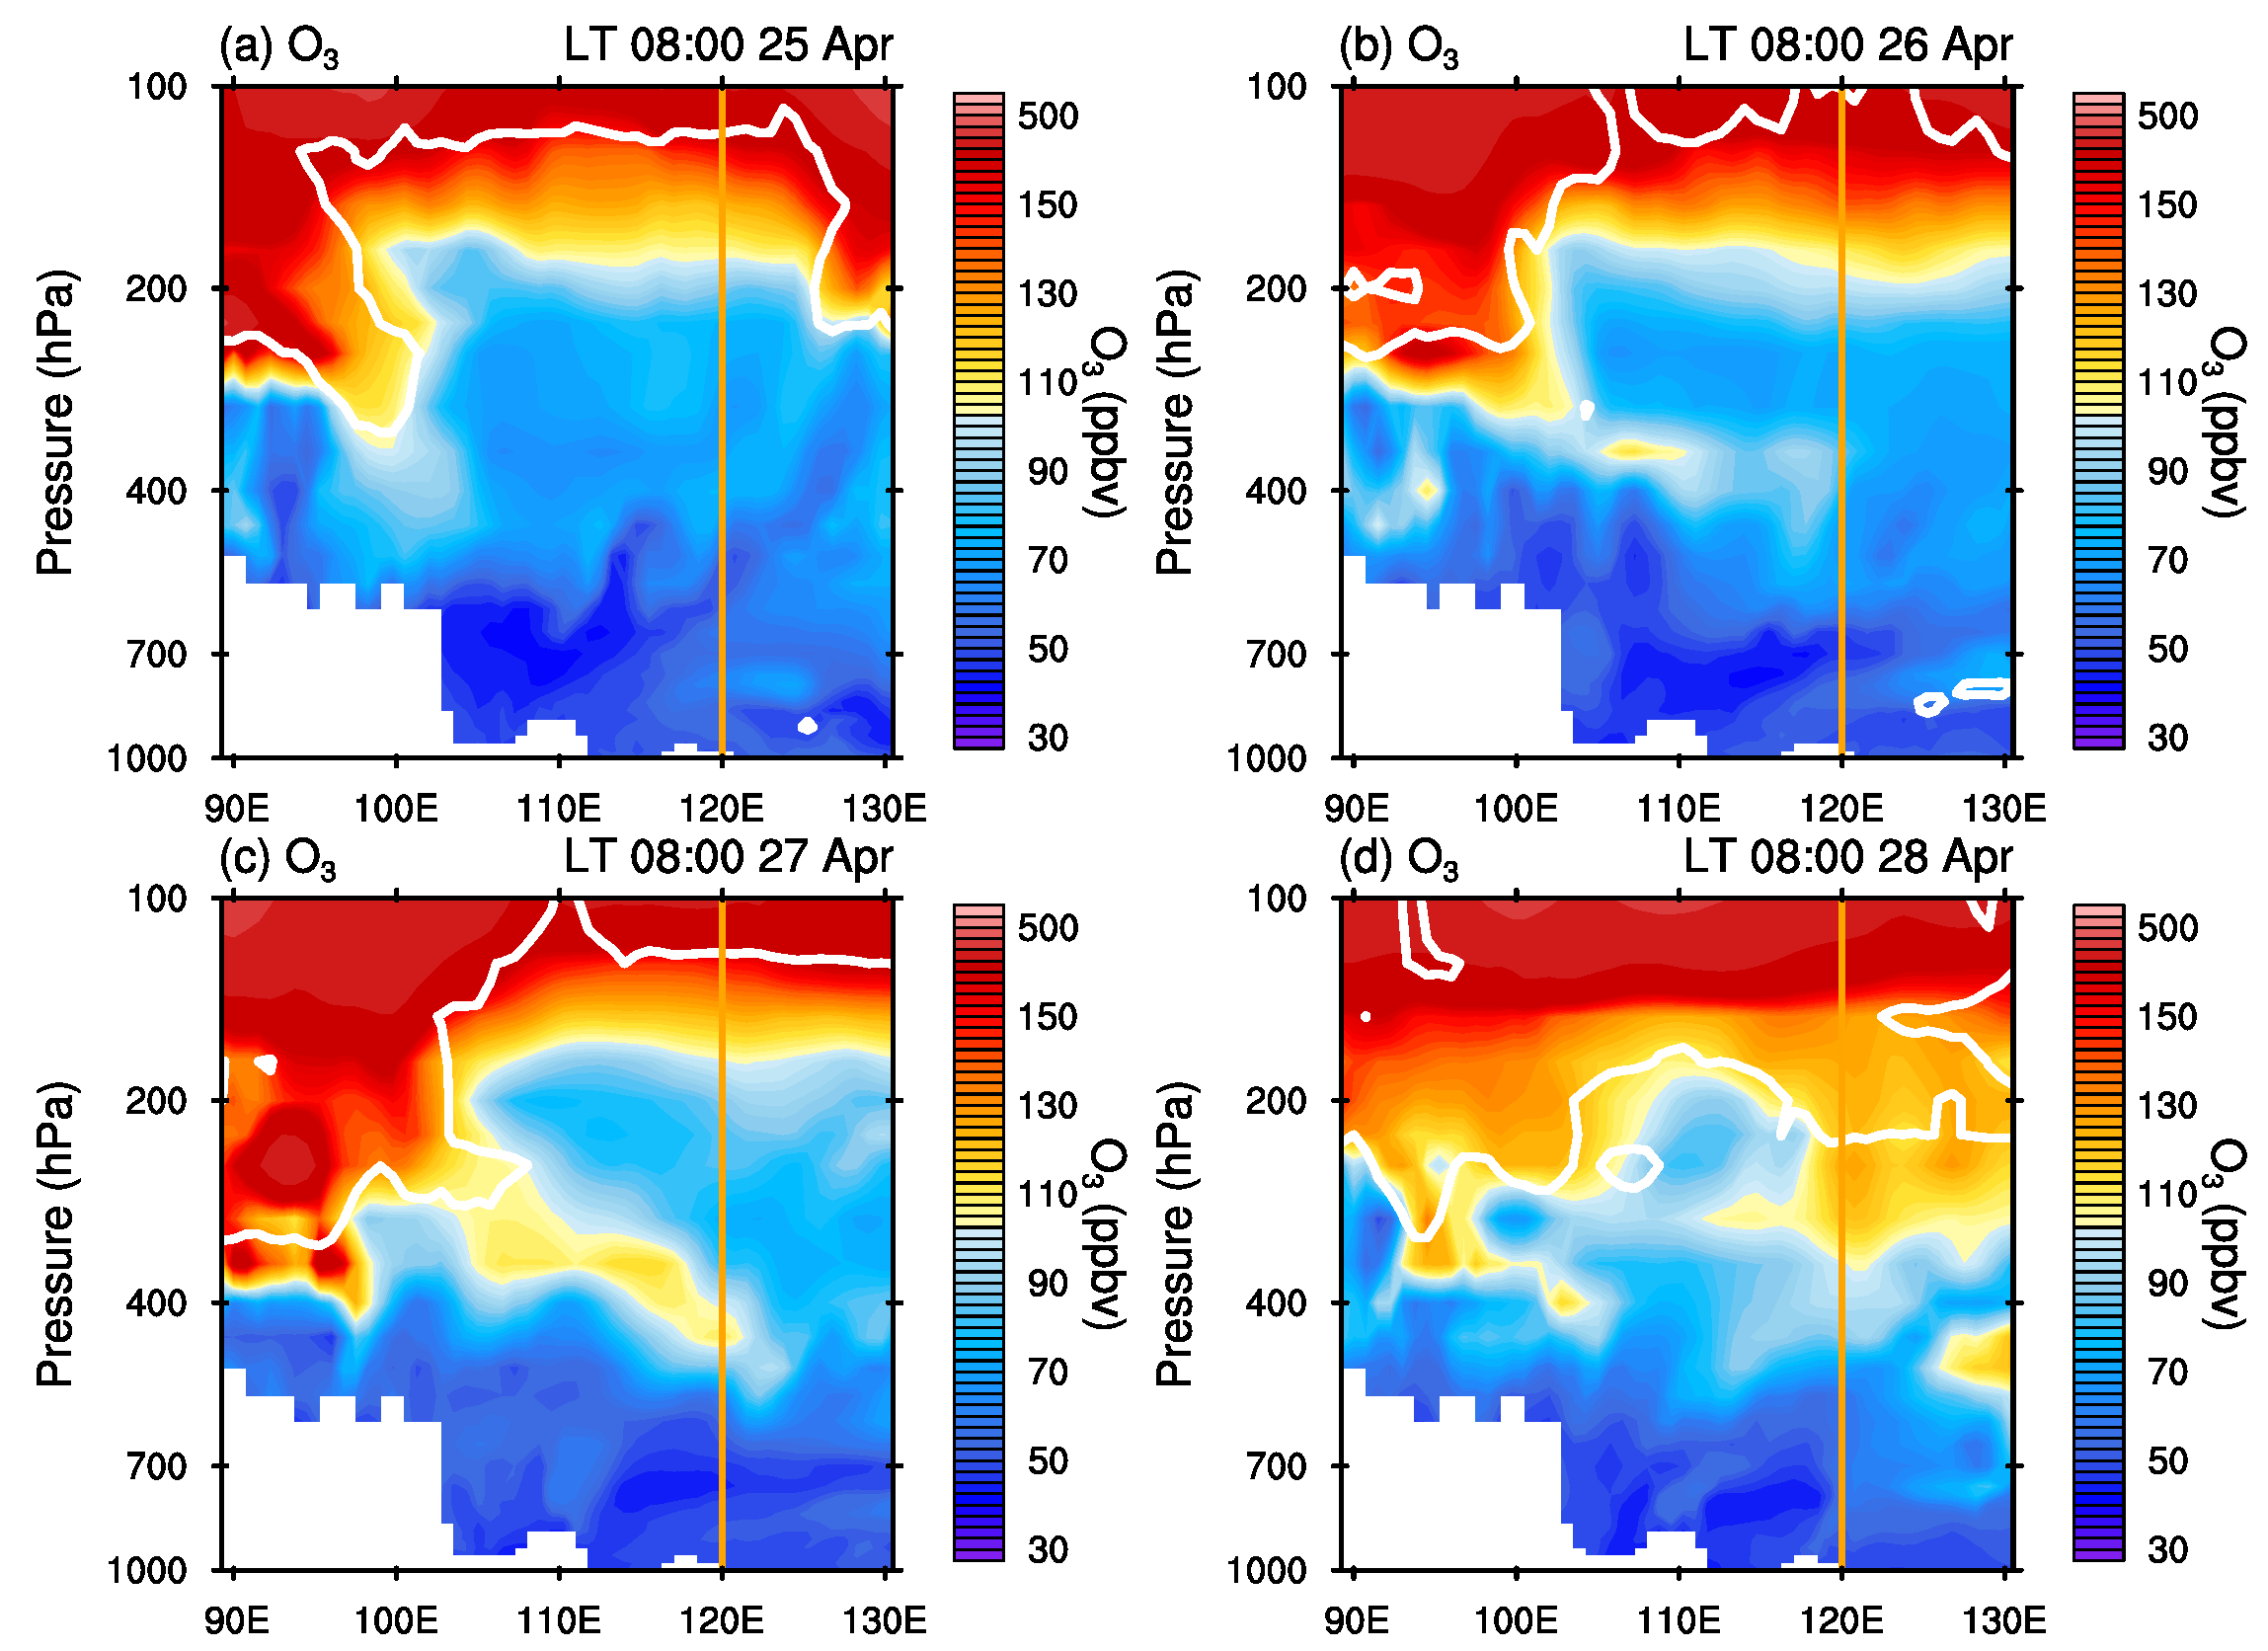
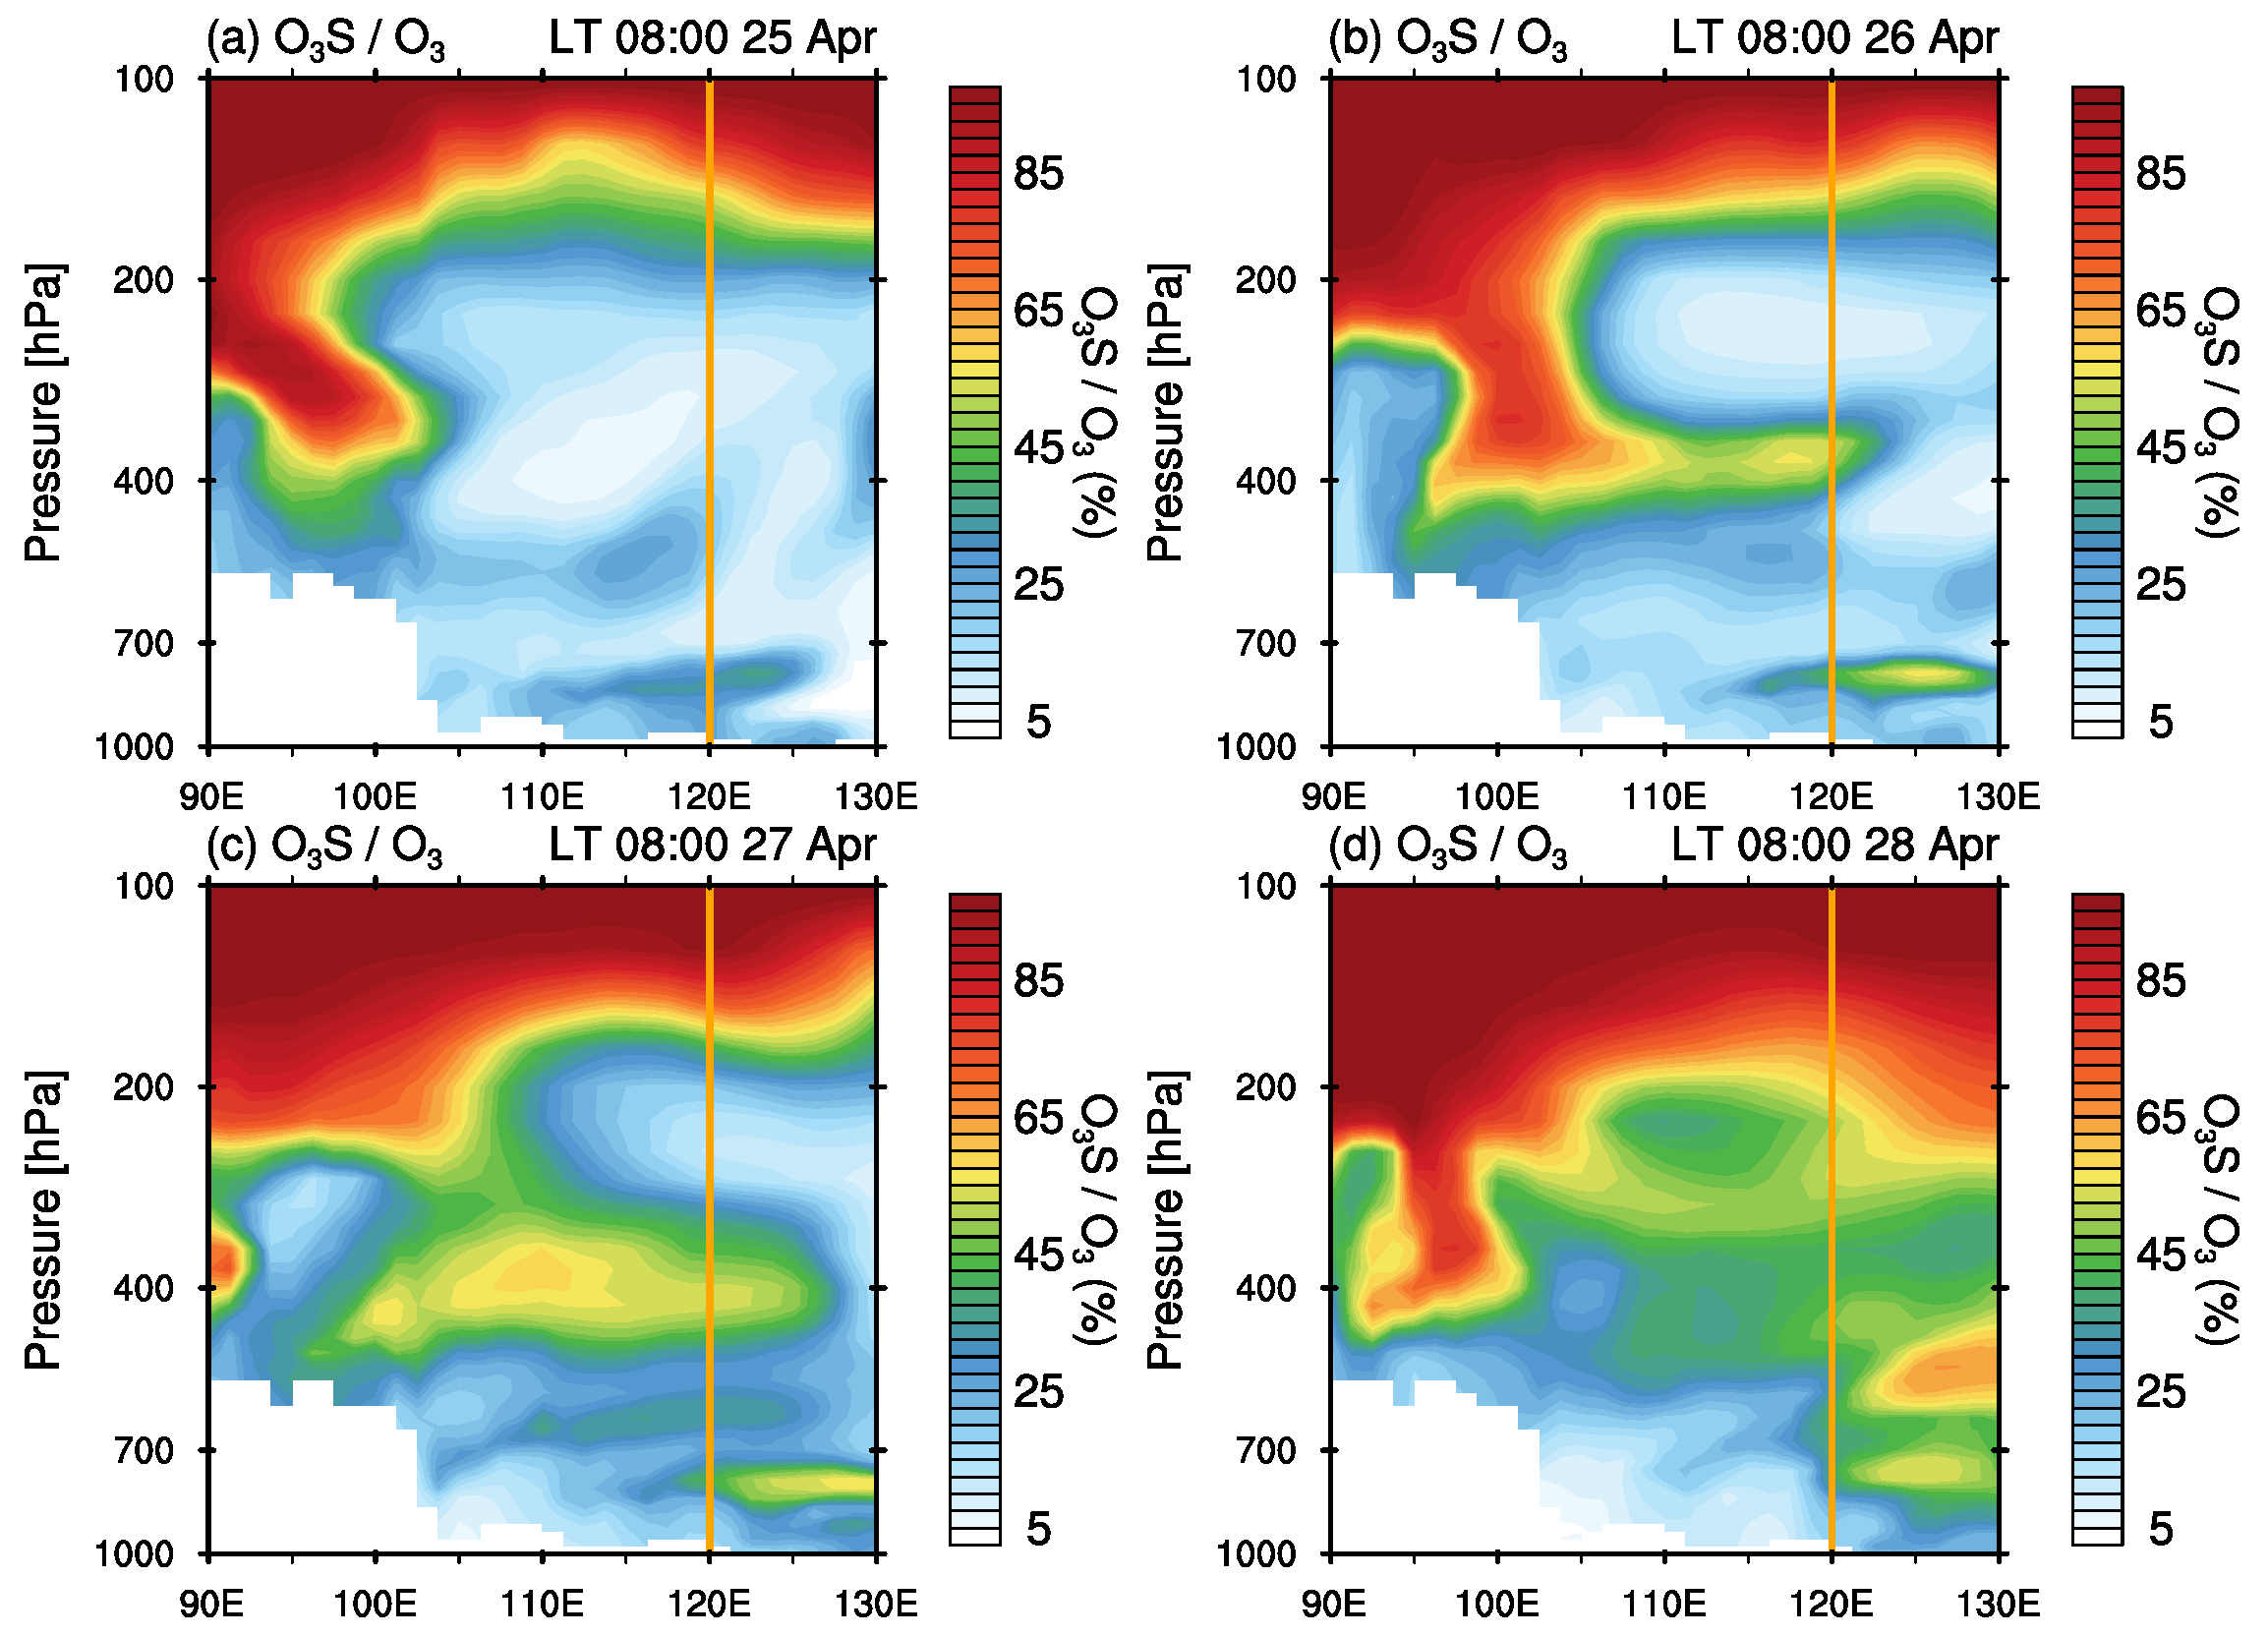
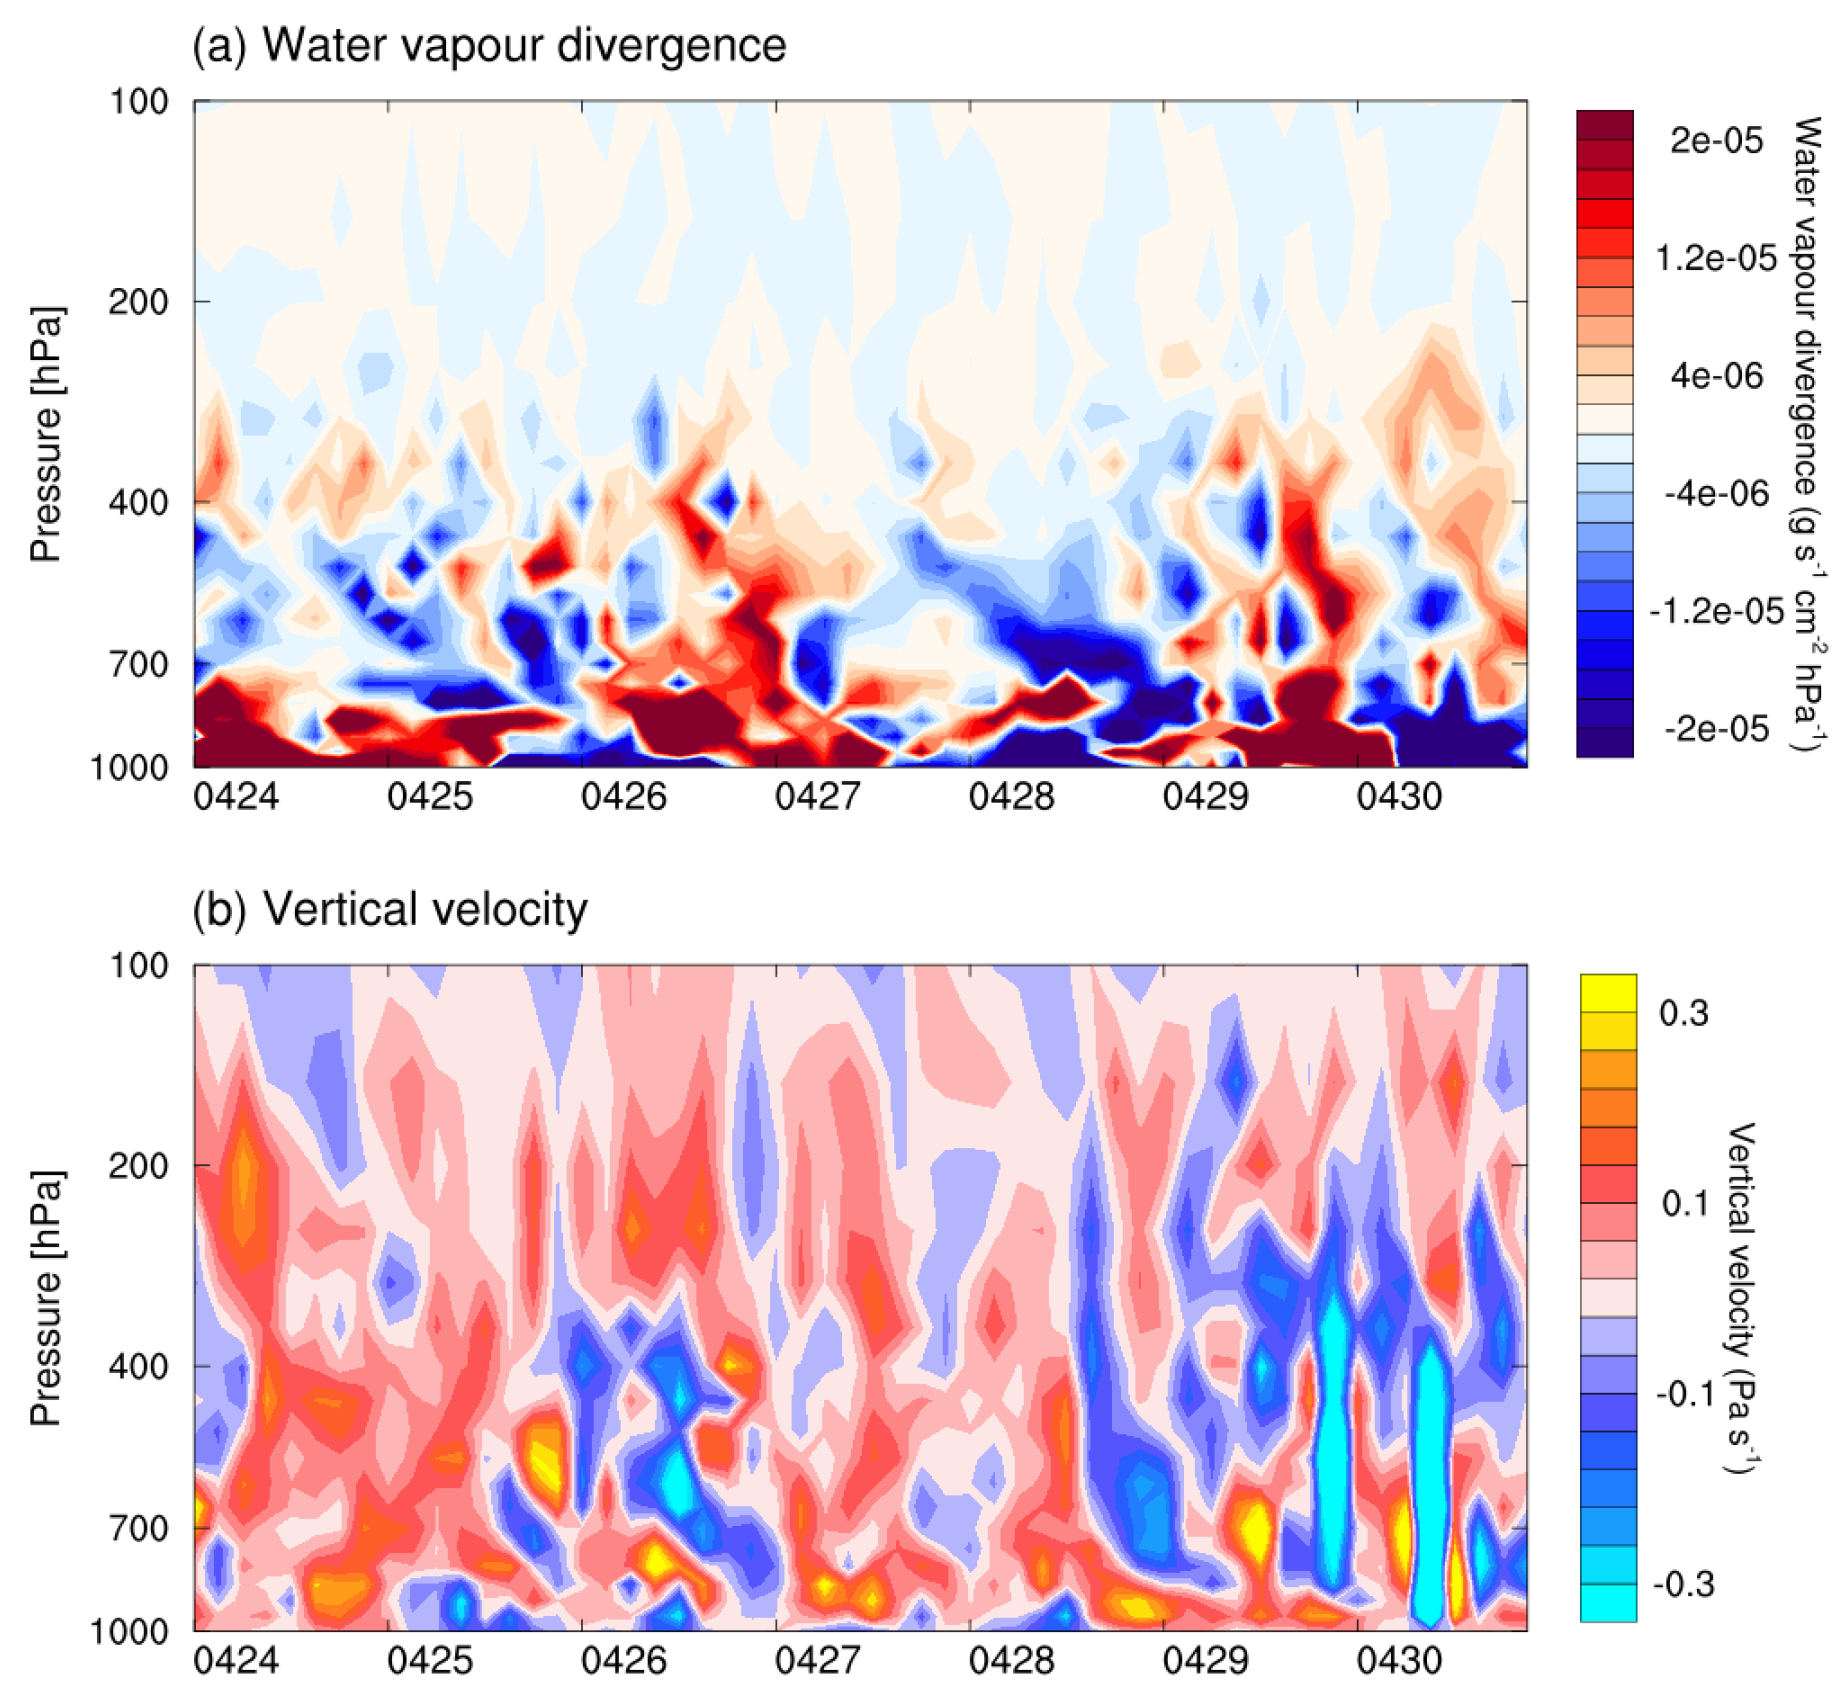
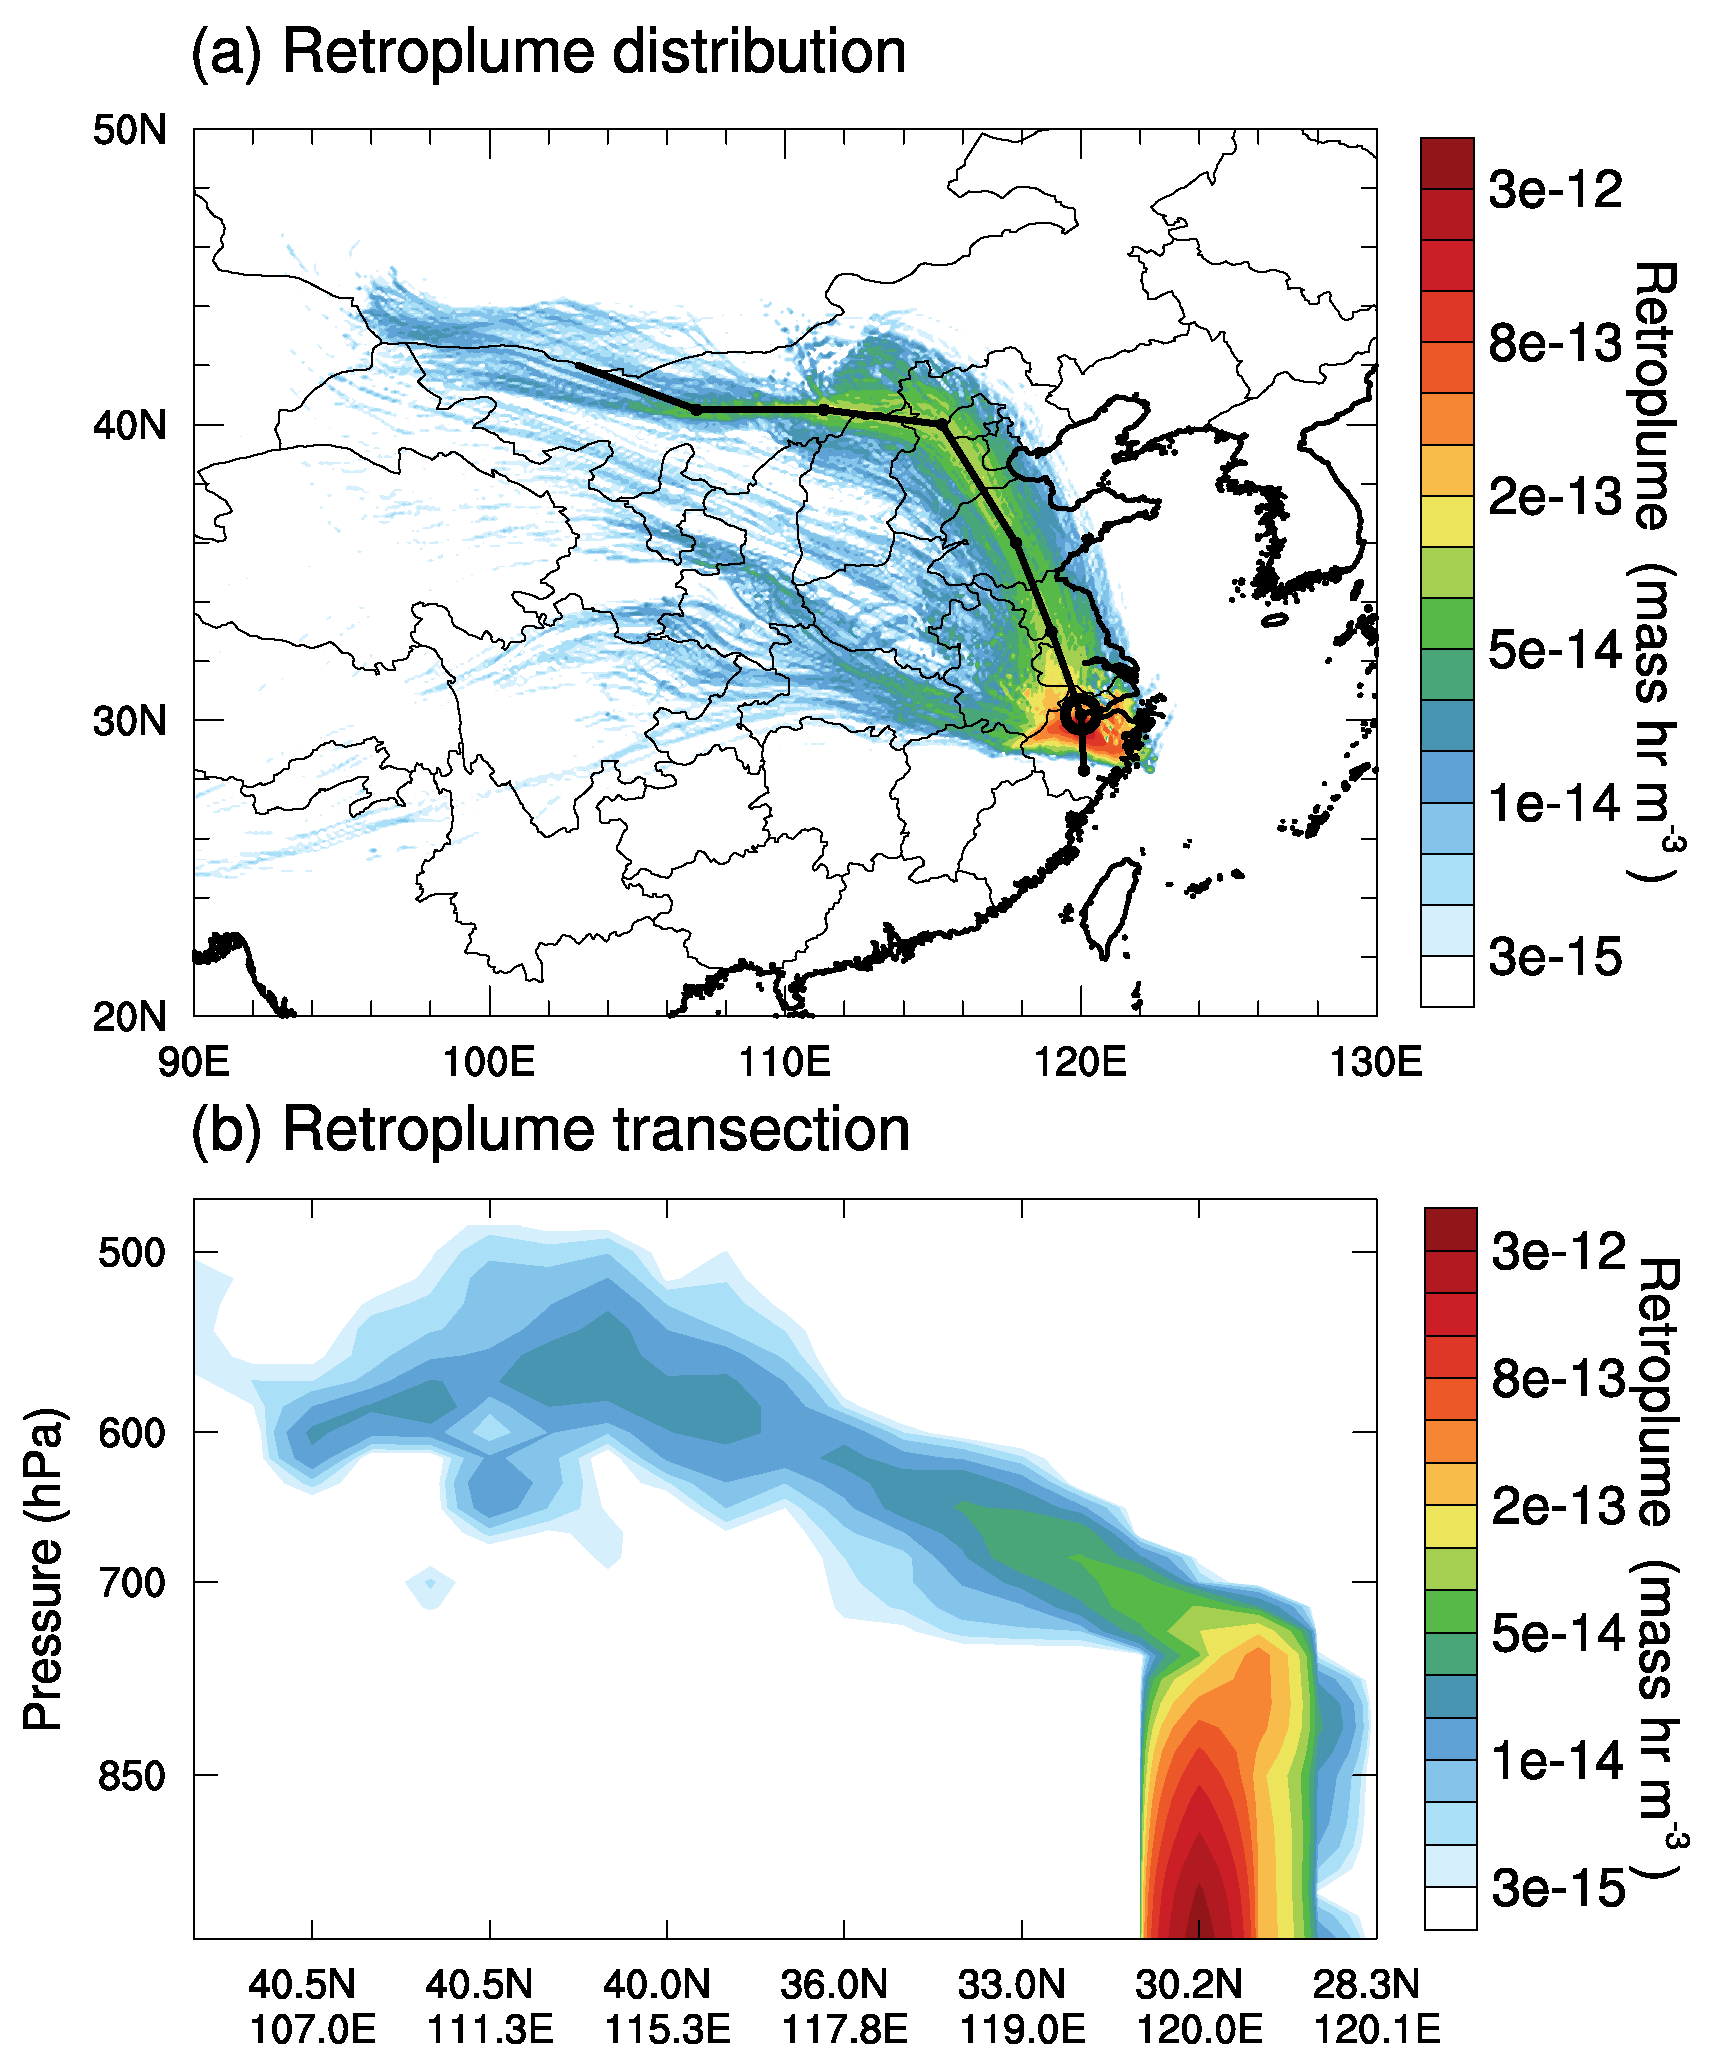
3.3. Stratospheric Ozone Intrusion to the Troposphere

To illustrate the downward transport, the ERA5 ozone data are used for analysing the ozone distribution in the upper troposphere and lower stratosphere (UTLS) region. Figure 7 shows the horizontal distribution of ozone at 300 hPa from 25 April 2018 to 28 April 2018. The spatial pattern of high ozone values is very similar to the PV pattern shown in Figure 5. This confirms the transport of ozone-rich air from the stratosphere to the troposphere associated with the upper-level trough development (Figure 3). The area of interest is on the edge of the high ozone concentration band on 25–26 April 2018 and near the centre of this high ozone concentration band on 27–28 April 2018.
The downward transport of the stratospheric ozone-rich air is illustrated in Figure 8. On 25 April 2018, the stratospheric ozone-rich air penetrated to about 300 hPa at the longitude of 100° E. Later, the ozone-rich air appeared eastward and further down to the troposphere accompanying the eastward movement of the upper-level trough (Figure 3). On 27 April, the ozone-rich air reached the area of interest and extended to 400 hPa deeper in the troposphere. Ozone-rich air persisted above the area of interest at about 400 hPa on 28 April 2018.
The transport of ozone-rich air from the stratosphere to the troposphere is also confirmed by the O3S tracer. Figure 9 shows the longitude-height cross-section of the O3S/O3 ratio from the CAM-Chem simulation. Consistent with ERA5 ozone shown in Figure 8, high values of O3S/O3 are seen from the stratosphere to about 400 hPa at the longitude of 100° E on 25 April 2018. As the up-level trough moves eastward, high values of O3S/O3 inject deeper in the troposphere and get to the area of interest on 27 April 2018. A centre of high O3S/O3 ratios is evident around 700 hPa over the longitude from 120° E to 130° E on 27 and 28 April 2018.

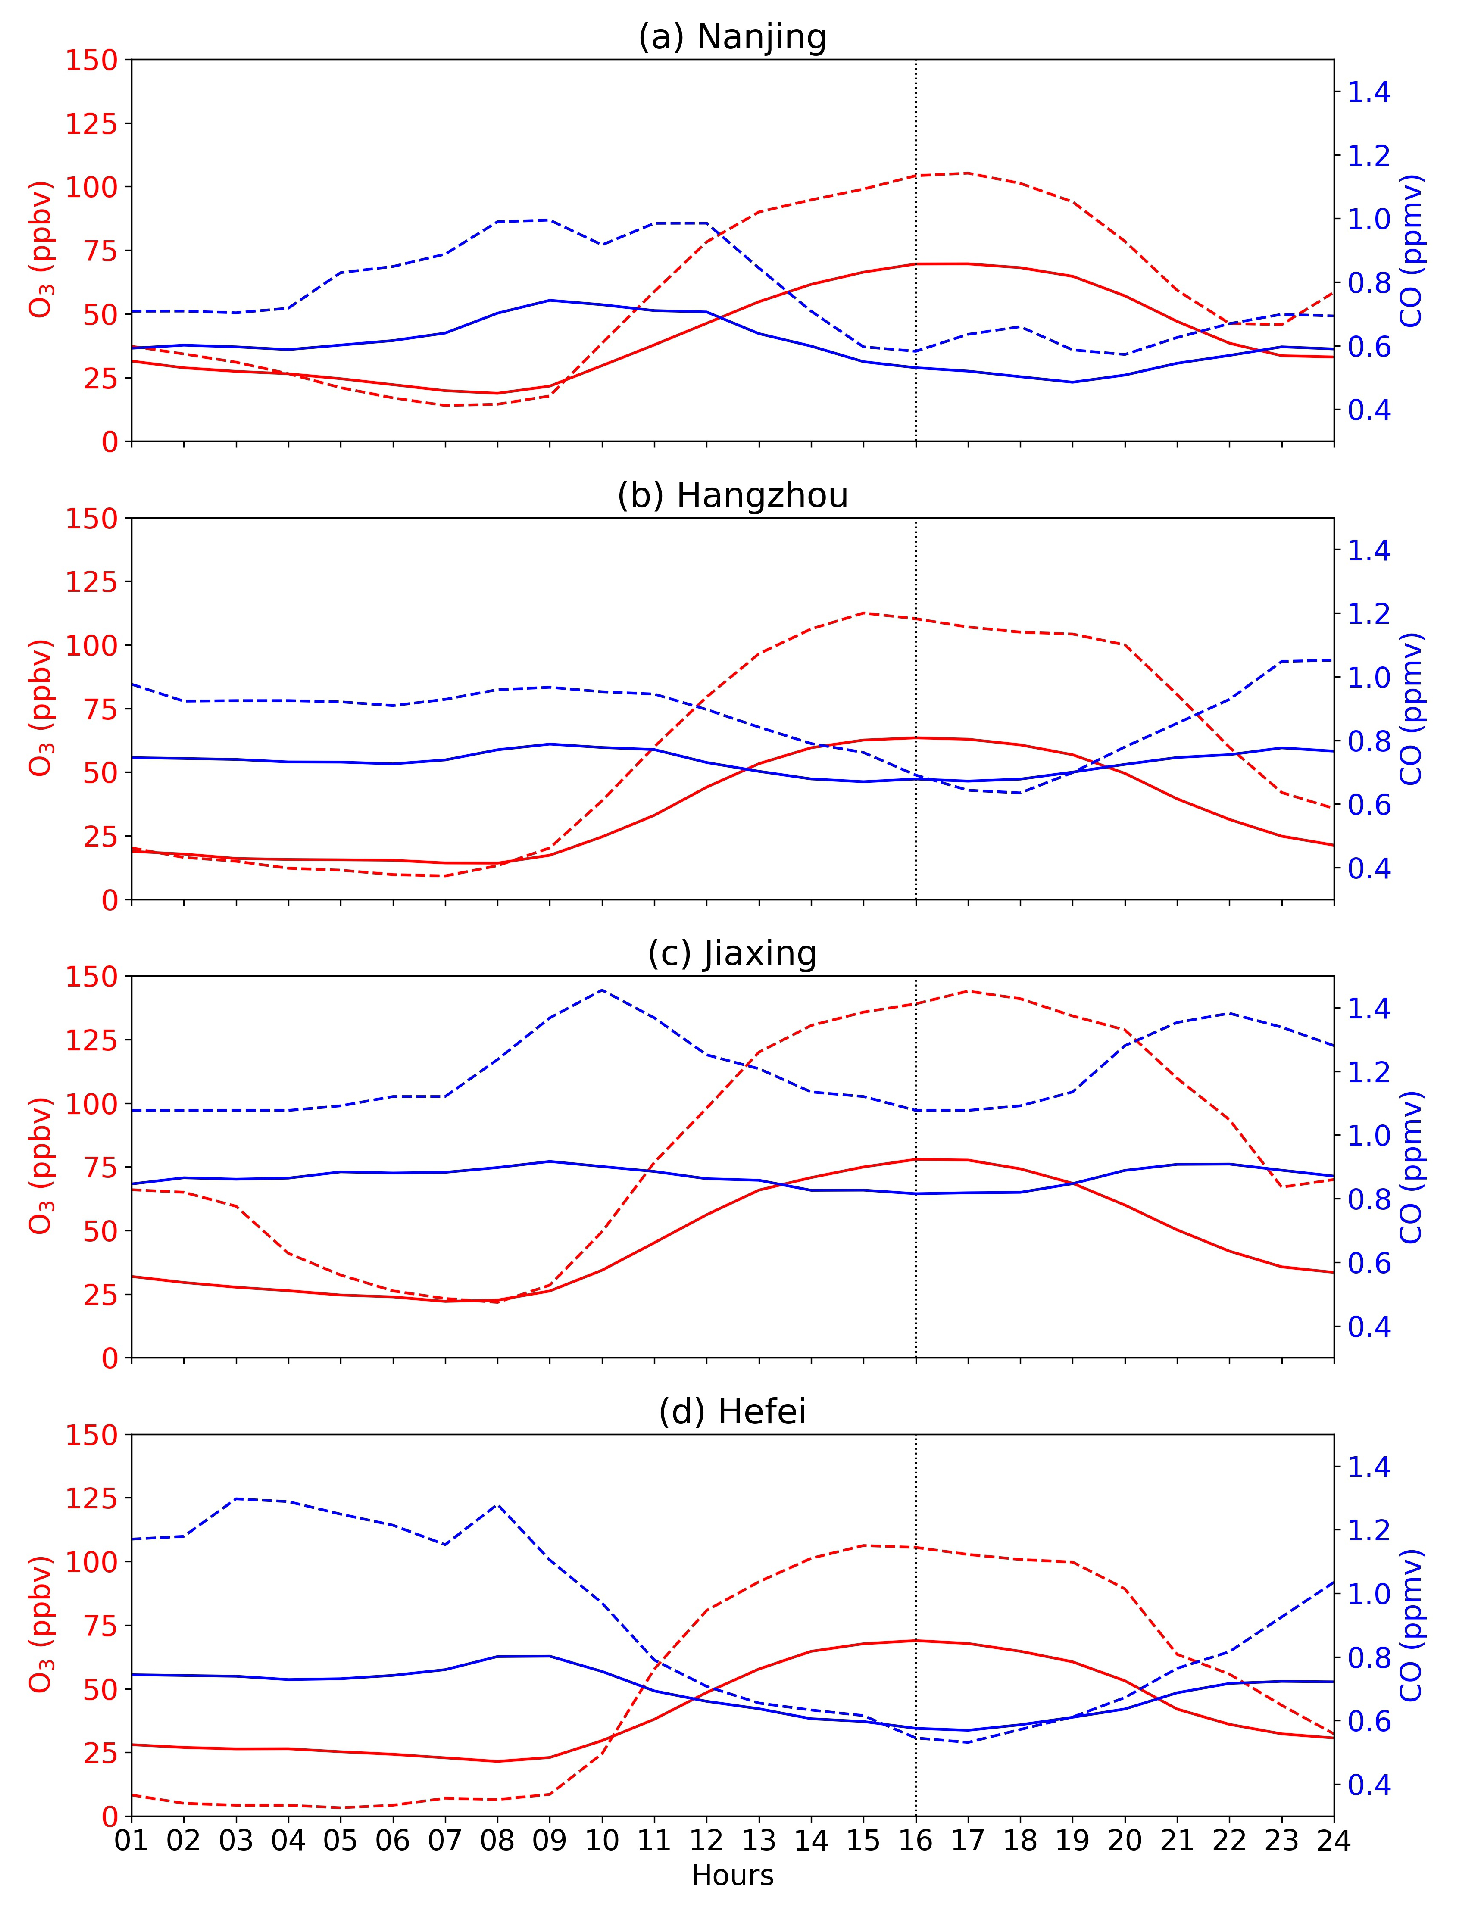
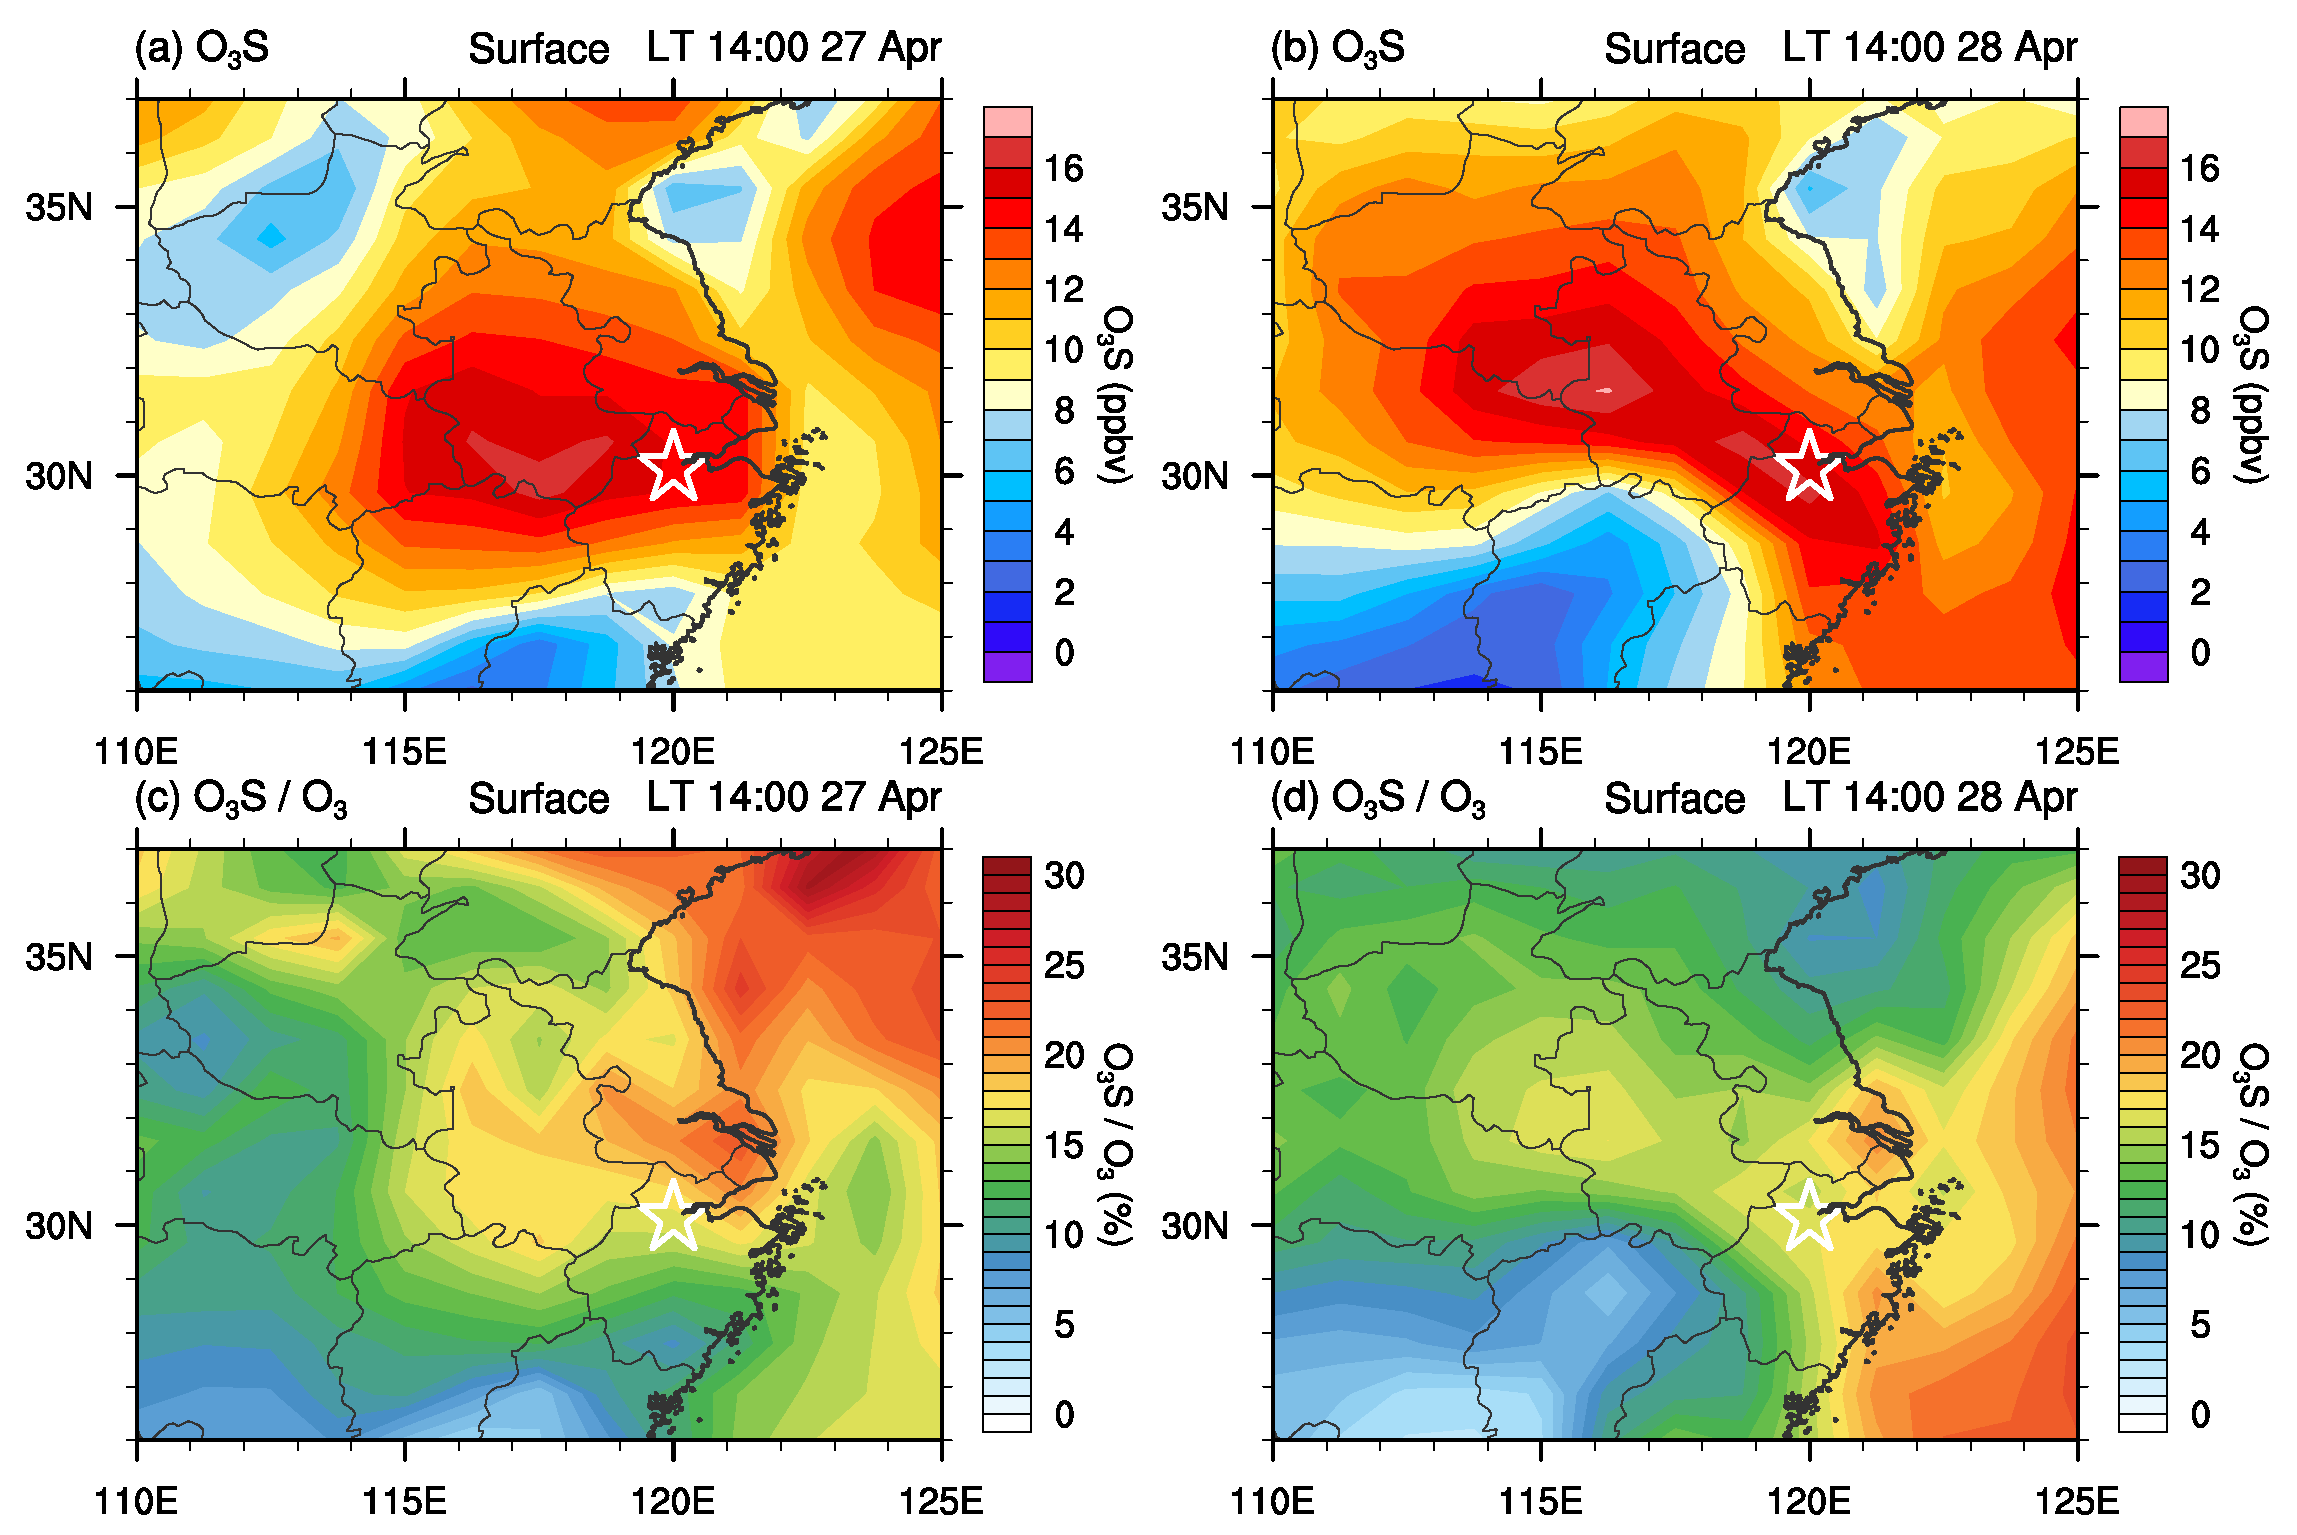
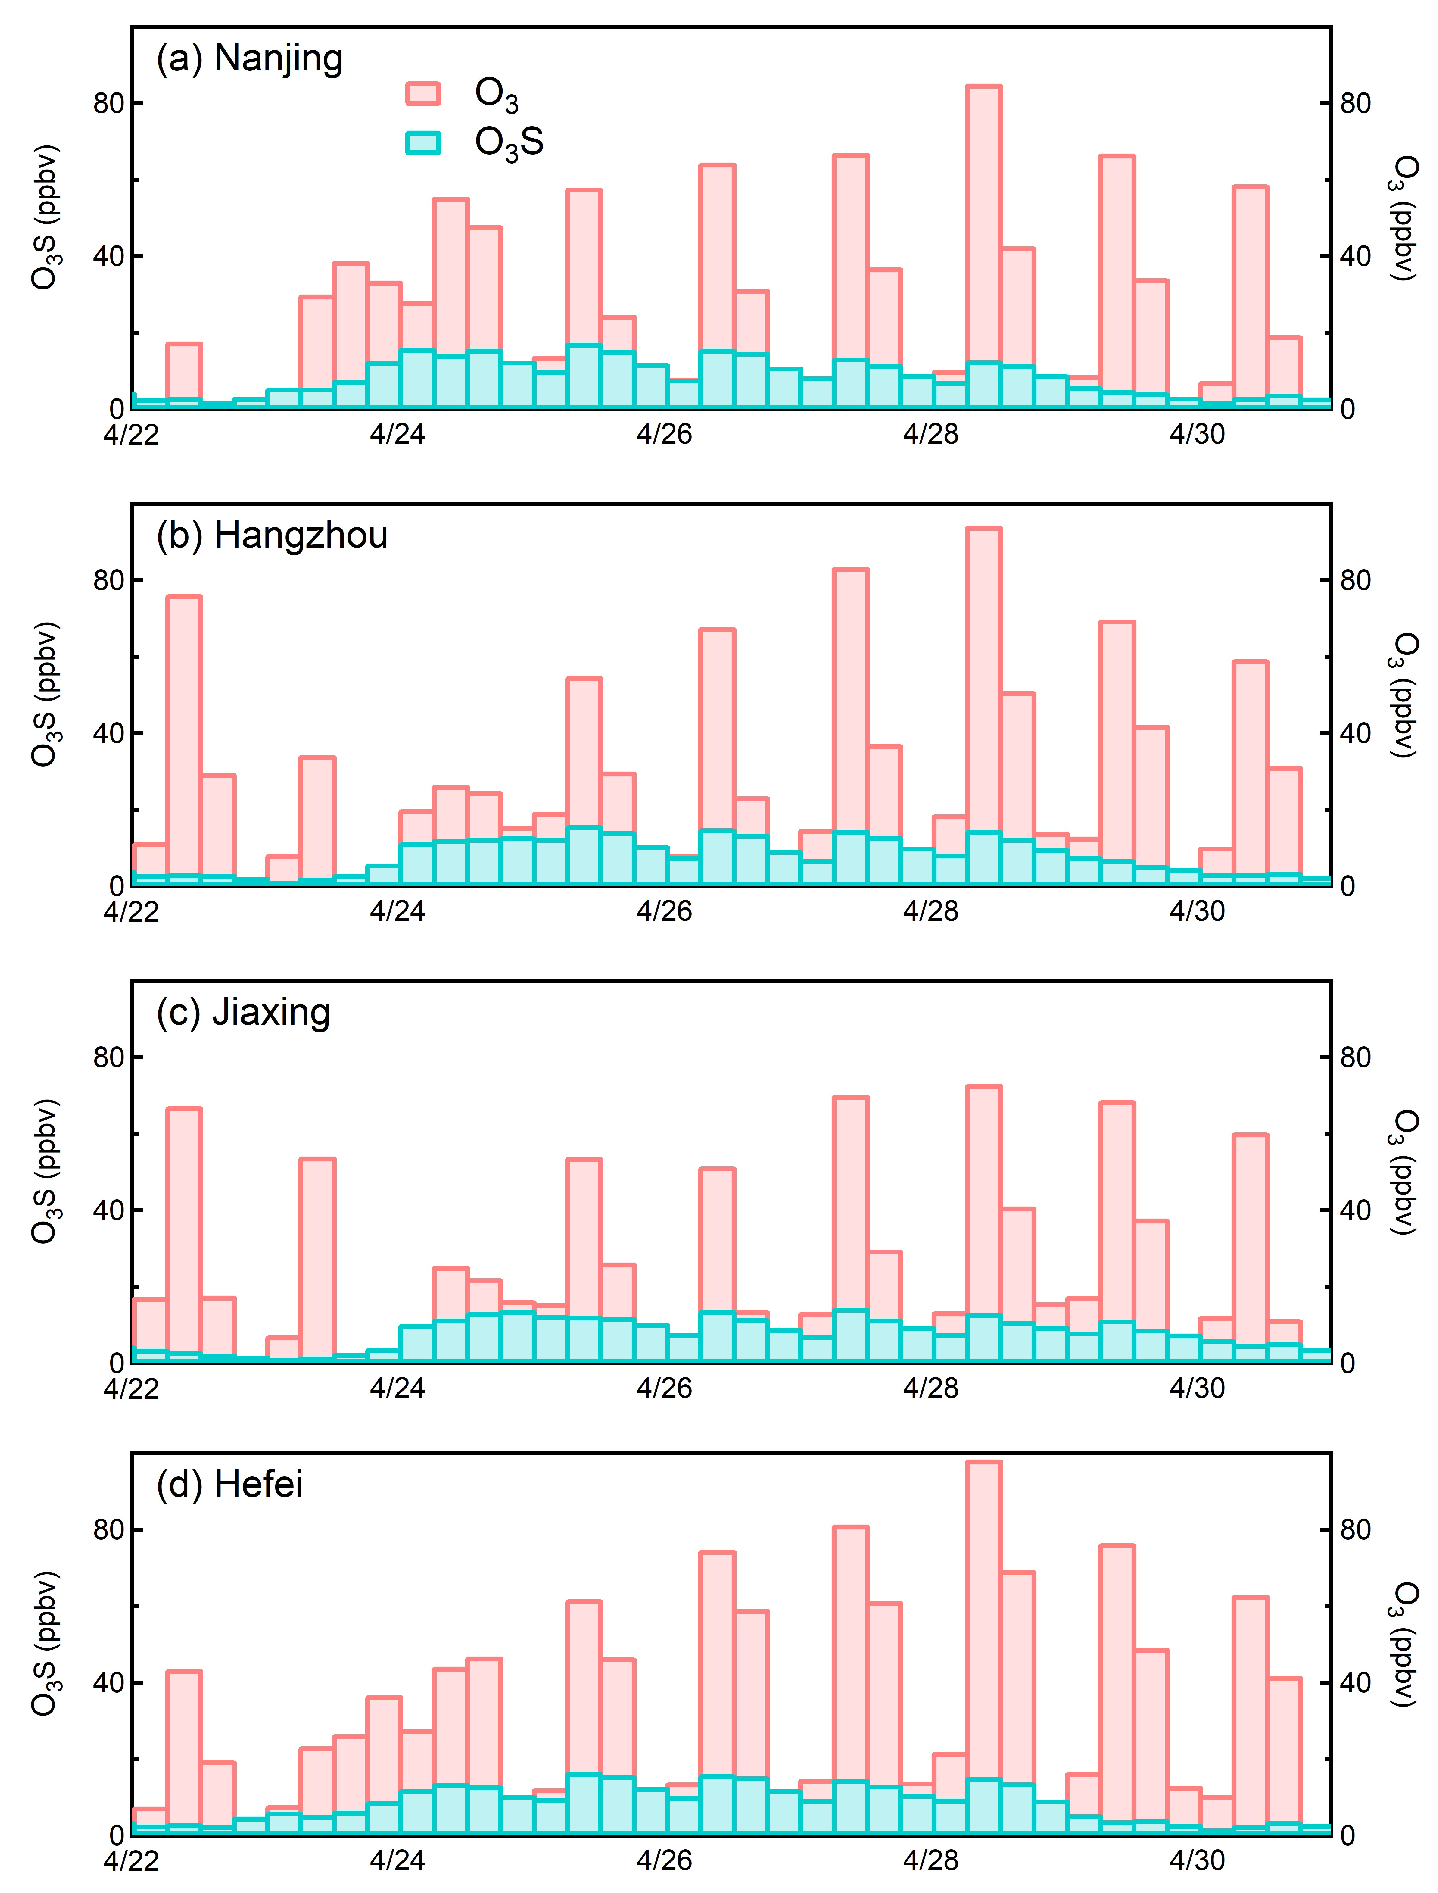
3.4. SI Impacts on Surface Ozone

So far, we find that the severe ozone pollution episode from 27 to 28 April 2018 might be related to an SI event. From the discussion above, the SI event is evident and the transport of ozone-rich air from the lower stratosphere to the troposphere is clear. The stratospheric ozone-rich air reached the middle troposphere below 400 hPa. However, whether such enhanced ozone concentrations in the troposphere can be mixed with the planetary boundary layer (PBL) and influence the surface is still not clear.
To illustrate the vertical mixing between the free troposphere and the PBL, the divergence of water vapour as well as the vertical velocity are shown in Figure 10. Positive values of water vapour divergence dominated from 26 to 27 April 2018. In particular, a strong divergence centre from 600 hPa down to the surface can be seen on 26 and 27 April 2018, which indicates the sink of the dry air. This suggests that the ozone-rich and dry air may move further down from the middle troposphere to the lower troposphere. On 28 April 2018, weak convergence occurred in the lower troposphere, which indicates a possible vertical mixing between the PBL and the upper levels.
Consistent with the water vapour divergence, downward motion of air masses is evident from 27 to 28 April 2018 as shown in the vertical distribution of vertical velocity. In particular, positive values of vertical velocity (indicating sink of air) can be seen from 400 hPa to the lower troposphere from 27 April to the morning of 28 April 2018. This strengthens the case that the ozone-rich and dry air is transported from the upper troposphere down to the PBL. On the afternoon of 28 April 2018, upward motion can be seen indicating unstable conditions and subsequent vertical mixing between the PBL and upper levels.
The vertical mixing between the free troposphere and the PBL can also be confirmed by the ‘footprint’ of air mass as shown by LPDM simulations. A 24-h backward integration of LPDM indicates that particles released at 16:00 (local time) in Hangzhou mainly originated from northern China (Figure 11a). Vertically, seen from the northwest-southeast transect of the retroplume (Figure 11b), the particles originated from up to 5 km (close to 500 hPa). Especially, the retroplume distributes vertically from the surface to about 700 hPa, which indicates strong vertical-mixing between the PBL and the free troposphere. The stratospheric ozone-rich air was therefore transported from the free troposphere to the surface.
To quantify the potential contribution of SI events to surface ozone, Figure 12 shows the horizontal distribution of O3S (the stratospheric ozone tracer) over eastern China on 27 and 28 April 2018, at 14:00 (local time). A centre of high O3S values exists on 27 and 28 April 2018 in the area of interest. The SI event contributes about 15 ppbv to the surface ozone in the cross region between Jiangsu, Zhejiang and Anhui provinces. In particular, the centre with highest O3S values of 17 ppbv reached Hangzhou on 28 April 2018. As reported by previous studies, O3S gives an upper limit to the stratospheric ozone contribution [43]. The relative contribution of O3S to the CAM-Chem simulated ozone concentration (O3S/O3) is also analysed. Figure 11a,b show the horizontal distribution of O3S/O3 ratio over eastern China on 27 and 28 April 2018, at 14:00 (local time). The O3S/O3 ratio is also relatively high in the area of interest. O3S is over 15% of ozone in the area of interest on 27 and 28 April 2018.
The time series of ozone concentration, as well as O3S from the CAM-Chem simulation in Najing, Hangzhou, Jiaxing and Hefei from 22 to 30 April 2018, are presented in Figure 13. The CAM-Chem model simulates the ozone pollution episode relatively well, although the absolute value is lower than observations. According to the CAM-Chem simulation, the stratospheric ozone intrusion contributes about 15 ppbv (15%) to the ozone pollution episode from 27 to 28 April 2018. Such a significant contribution cannot be neglected and should be considered in surface ozone forecasting and developing emission control strategies.

4. Conclusions and Discussion

Ozone pollution has been reported frequently and has become a serious issue in China [6,9,11]. Currently, most of the research has focused on anthropogenic and biogenic emitted ozone precursors from the surface [7,8,12], while the stratospheric ozone intrusion, another important source of tropospheric ozone, has been less studied. A recent study poses the question of to what extent do the SI events influence the surface ozone at relatively lower latitudes, that is, in eastern China [40]. This study is a follow-up work of a previous study [40], and investigates the potential contribution of SI events to surface ozone pollution episodes in eastern China during spring using ground-based measurements, the latest ERA5 reanalysis data as well as chemistry-climate model simulations.
Results indicate that a strong SI event occurred, associated with a horizontal-trough that brings ozone-rich air from the lower stratosphere to the surface and contributes to severe ozone pollution, during the period from 27 April to 28 April 2018 in eastern China. According to a CAM-Chem simulation, SI contributed about 15 ppbv (15%) to this surface ozone pollution episode in eastern China. Although such a contribution may not fully explain the mechanism of this severe ozone pollution episode, this study highlights the importance of SI events to the surface ozone variations. The potential impacts of SI events on tropospheric and surface ozone should be considered in ozone variation attribution and surface ozone forecasting.

Author Contributions

Y.W. initiated the study and did the analysis of meteorological conditions; H.W. analyzed the ozone transport. W.W. contributes to validation, project administration and wrote the original draft. All the authors contribute to interpretation, discussion, review and editing the manuscript. All authors have read and agreed to the published version of the manuscript.

Funding

This work was funded by the National Natural Science Foundation of China (Grant No. 41705023 and 41875095).

Acknowledgments

We thank the ECMWF for the ERA5 reanalysis data, China Ministry of Ecology and Environment for the ground-based ozone measurements and NCAR for the CAM-Chem simulations. We are grateful to the High Performance Computing Center (HPCC) of Nanjing University for doing the numerical calculations in this paper on its blade cluster system.

Conflicts of Interest

The authors declare no conflict of interest.

References

  1. Stocker, T. SBSTA-IPCC Special Event Climate Change 2013: The Physical Science Basis; UNFCCC: New York, NY, USA, 2013. [Google Scholar]
  2. Schultz, M.G.; Schröder, S.; Lyapina, O.; Cooper, O.; Galbally, I.; Petropavlovskikh, I.; von Schneidemesser, E.; Tanimoto, H.; Elshorbany, Y.; Naja, M.; et al. Tropospheric Ozone assessment report: Database and metrics data of global surface Ozone observations. Elem. Sci. Anthr. 2017, 5, 58–84. [Google Scholar] [CrossRef] [Green Version]
  3. Mills, G.; Sharps, K.; Simpson, D.; Pleijel, H.; Frei, M.; Burkey, K.; Emberson, L.; Uddling, J.; Broberg, M.; Feng, Z.; et al. Closing the global ozone yield gap: Quantification and cobenefits for multistress tolerance. Glob. Chang. Biol. 2018, 24, 4869–4893. [Google Scholar] [CrossRef] [PubMed] [Green Version]
  4. Young, P.J.; Naik, V.; Fiore, A.M.; Gaudel, A.; Guo, J.; Lin, M.Y.; Neu, J.L.; Parrish, D.D.; Rieder, H.E.; Schnell, J.L.; et al. Tropospheric Ozone Assessment Report:Assessment of global-scale model performance for global and regional ozone distributions, variability, and trends. Elem. Sci. Anthr. 2018, 6, 265. [Google Scholar]
  5. Cooper, O.R.; Parrish, D.D.; Ziemke, J.; Cupeiro, M.; Galbally, I.E.; Gilge, S.; Horowitz, L.; Jensen, N.R.; Lamarque, J.F.; Naik, V.; et al. Global Distribution and Trends of Tropospheric Ozone: An Observation-Based Review. Elem. Sci. Anthr. 2014, 2, 29. [Google Scholar] [CrossRef]
  6. Wang, T.; Xue, L.; Brimblecombe, P.; Lam, Y.F.; Li, L.; Zhang, L. Ozone pollution in China: A review of concentrations, meteorological influences, chemical precursors, and effects. Sci. Total Environ. 2017, 575, 1582–1596. [Google Scholar] [CrossRef]
  7. Li, K.; Jacob, D.J.; Liao, H.; Shen, L.; Zhang, Q.; Bates, K.H. Anthropogenic drivers of 2013–2017 trends in summer surface ozone in China. Proc. Natl. Acad. Sci. USA 2019, 116, 422–427. [Google Scholar] [CrossRef] [Green Version]
  8. Shen, L.; Jacob, D.J.; Liu, X.; Huang, G.; Li, K.; Liao, H.; Wang, T. An evaluation of the ability of the Ozone Monitoring Instrument (OMI) to observe boundary layer ozone pollution across China: Application to 2005–2017 ozone trends. Atmos. Chem. Phys. 2019, 19, 6551–6560. [Google Scholar] [CrossRef] [Green Version]
  9. Ding, A.J.; Fu, C.B.; Yang, X.Q.; Sun, J.N.; Zheng, L.F.; Xie, Y.N.; Herrmann, E.; Nie, W.; Petäjä, T.; Kerminen, V.M.; et al. Ozone and fine particle in the western Yangtze River Delta: An overview of 1 yr data at the SORPES station. Atmos. Chem. Phys. 2013, 13, 5813–5830. [Google Scholar] [CrossRef] [Green Version]
  10. Simpson, D.; Arneth, A.; Mills, G.; Solberg, S.; Uddling, J. Ozone—The persistent menace; interactions with the N cycle and climate change. Curr. Opin. Environ. Sustain. 2014, 9, 9–19. [Google Scholar] [CrossRef] [Green Version]
  11. Xu, Z.; Huang, X.; Nie, W.; Shen, Y.; Zheng, L.; Xie, Y.; Wang, T.; Ding, K.; Liu, L.; Zhou, D.; et al. Impact of biomass burning and vertical mixing of residual-layer aged plumes on ozone in the Yangtze River Delta, China: A tethered-balloon measurement and modeling study of a multiday ozone episode. J. Geophys. Res. 2018, 123, 11786–11803. [Google Scholar] [CrossRef]
  12. Wang, N.; Lyu, X.; Deng, X.; Huang, X.; Jiang, F.; Ding, A. Aggravating O3 pollution due to NOx emission control in eastern China. Sci. Total Environ. 2019, 677, 732–744. [Google Scholar] [CrossRef] [PubMed]
  13. Holton, J.R.; Haynes, P.H.; McIntyre, M.E.; Douglass, A.R.; Rood, R.B.; Pfister, L. Stratosphere-troposphere exchange. Rev. Geophys. 1995, 33, 403–439. [Google Scholar] [CrossRef]
  14. Lelieveld, J.; Dentener, F.J. What controls tropospheric ozone. J. Geophys. Res. 2000, 105, 3531–3551. [Google Scholar] [CrossRef]
  15. Ding, A.; Wang, T. Influence of stratosphere-to-troposphere exchange on the seasonal cycle of surface ozone at Mount Waliguan in western China. Geophys. Res. Lett. 2006, 33. [Google Scholar] [CrossRef] [Green Version]
  16. Zhang, J.; Tian, W.; Xie, F.; Chipperfield, M.P.; Feng, W.; Son, S.W.; Abraham, N.L.; Archibald, A.T.; Bekki, S.; Butchart, N.; et al. Stratospheric ozone loss over the Eurasian continent induced by the polar vortex shift. Nat. Commun. 2018, 9, 206. [Google Scholar] [CrossRef] [Green Version]
  17. Akritidis, D.; Katragkou, E.; Zanis, P.; Pytharoulis, I.; Melas, D.; Flemming, J.; Inness, A.; Clark, H.; Plu, M.; Eskes, H. A deep stratosphere-to-troposphere ozone transport event over Europe simulated in CAMS global and regional forecast systems: Analysis and evaluation. Atmos. Chem. Phys. 2018, 18, 15515–15534. [Google Scholar] [CrossRef] [Green Version]
  18. Liang, Q.; Rodriguez, J.M.; Douglass, A.R.; Crawford, J.H.; Olson, J.R.; Apel, E.; Bian, H.; Blake, D.R.; Brune, W.; Chin, M.; et al. Reactive nitrogen, ozone and ozone production in the Arctic troposphere and the impact of stratosphere-troposphere exchange. Atmos. Chem. Phys. 2011, 11, 13181–13199. [Google Scholar] [CrossRef] [Green Version]
  19. Emmons, L.K.; Hess, P.; Klonecki, A.; Tie, X.; Horowitz, L.; Lamarque, J.F.; Kinnison, D.; Brasseur, G.; Atlas, E.L.; Browell, E.; et al. Budget of tropospheric ozone during TOPSE from two chemical transport models. J. Geophys. Res. 2003, 108. [Google Scholar] [CrossRef] [Green Version]
  20. Stohl, A.; Wernli, H.; James, P.; Bourqui, M.; Forster, C.; Liniger, M.A.; Seibert, P.; Sprenger, M. A new perspective of stratosphere-troposphere exchange. Bull. Am. Meteorol. Soc. 2003, 84, 1565–1573. [Google Scholar] [CrossRef]
  21. Cooper, O.R.; Stohl, A.; Hübler, G.; Hsie, E.Y.; Parrish, D.D.; Tuck, A.F.; Kiladis, G.N.; Oltmans, S.J.; Johnson, B.J.; Shapiro, M.; et al. Direct transport of midlatitude stratospheric ozone into the lower troposphere and marine boundary layer of the tropical Pacific Ocean. J. Geophys. Res. 2005, 110. [Google Scholar] [CrossRef] [Green Version]
  22. Akritidis, D.; Zanis, P.; Pytharoulis, I.; Mavrakis, A.; Karacostas, T. A deep stratospheric intrusion event down to the earth’s surface of the megacity of Athens. Meteorol. Atmos. Phys. 2010, 109, 9–18. [Google Scholar] [CrossRef]
  23. Langford, A.O.; Brioude, J.; Cooper, O.R.; Senff, C.J.; Alvarez, R.J.; Hardesty, R.M.; Johnson, B.J.; Oltmans, S.J. Stratospheric influence on surface ozone in the Los Angeles area during late spring and early summer of 2010. J. Geophys. Res. 2012, 117. [Google Scholar] [CrossRef]
  24. Lin, M.; Fiore, A.M.; Cooper, O.R.; Horowitz, L.W.; Langford, A.O.; Levy, H.; Johnson, B.J.; Naik, V.; Oltmans, S.J.; Senff, C.J. Springtime high surface ozone events over the western United States: Quantifying the role of stratospheric intrusions. J. Geophys. Res. 2012, 117. [Google Scholar] [CrossRef] [Green Version]
  25. Lefohn, A.S.; Wernli, H.; Shadwick, D.; Limbach, S.; Oltmans, S.J.; Shapiro, M. The importance of stratospheric–tropospheric transport in affecting surface ozone concentrations in the western and northern tier of the United States. Atmos. Environ. 2011, 45, 4845–4857. [Google Scholar] [CrossRef]
  26. Lefohn, A.S.; Wernli, H.; Shadwick, D.; Oltmans, S.J.; Shapiro, M. Quantifying the importance of stratospheric-tropospheric transport on surface ozone concentrations at high- and low-elevation monitoring sites in the United States. Atmos. Environ. 2012, 62, 646–656. [Google Scholar] [CrossRef]
  27. Yates, E.L.; Iraci, L.T.; Roby, M.C.; Pierce, R.B.; Johnson, M.S.; Reddy, P.J.; Tadić, J.M.; Loewenstein, M.; Gore, W. Airborne observations and modeling of springtime stratosphere-to-troposphere transport over California. Atmos. Chem. Phys. 2013, 13, 12481–12494. [Google Scholar] [CrossRef] [Green Version]
  28. Xu, W.; Lin, W.; Xu, X.; Tang, J.; Huang, J.; Wu, H.; Zhang, X. Long-term trends of surface ozone and its influencing factors at the Mt Waliguan GAW station, China—Part 1: Overall trends and characteristics. Atmos. Chem. Phys. 2015, 16, 6191–6205. [Google Scholar] [CrossRef] [Green Version]
  29. Li, D.; Bian, J.; Fan, Q. A deep stratospheric intrusion associated with an intense cut-off low event over East Asia. Sci. China Earth Sci. 2015, 58, 116–128. [Google Scholar] [CrossRef]
  30. Zhang, J.; Tian, W.; Wang, Z.; Xie, F.; Wang, F. The Influence of ENSO on Northern Midlatitude Ozone during the Winter to Spring Transition. J. Clim. 2015, 28, 4774–4793. [Google Scholar] [CrossRef]
  31. Baray, J.L.; Pointin, Y.; Baelen, J.V.; Lothon, M.; Campistron, B.; Cammas, J.P.; Masson, O.; Colomb, A.; Hervier, C.; Bezombes, Y.; et al. Case study and climatological analysis of upper tropospheric jet stream and stratosphere-troposphere exchanges using VHF profilers and radionuclide measurements in France. J. Appl. Meteorol. Climatol. 2017, 56, 3081–3097. [Google Scholar] [CrossRef]
  32. Zhao, X.R.; Sheng, Z.; Li, J.W.; Yu, H.; Wei, K.J. Determination of the “wave turbopause” using a numerical differentiation method. J. Geophys. Res. 2019, 124, 10592–10607. [Google Scholar] [CrossRef]
  33. Chen, X.L.; Ma, Y.M.; Kelder, H.; Su, Z.; Yang, K. On the behaviour of the tropopause folding events over the Tibetan Plateau. Atmos. Chem. Phys. 2010, 11, 22993–23016. [Google Scholar] [CrossRef] [Green Version]
  34. Knowland, K.E.; Ott, L.E.; Duncan, B.N.; Wargan, K. Stratospheric Intrusion-Influenced Ozone Air Quality Exceedances Investigated in the NASA MERRA-2 Reanalysis. Geophys. Res. Lett. 2017, 44, 10691–10701. [Google Scholar] [CrossRef]
  35. He, Y.; Sheng, Z.; He, M. Spectral Analysis of Gravity Waves from Near Space High-Resolution Balloon Data in Northwest China. Atmosphere 2020, 11, 133. [Google Scholar] [CrossRef] [Green Version]
  36. Chen, X.; Añel, J.A.; Su, Z.; de la Torre, L.; Kelder, H.; van Peet, J.; Ma, Y. The Deep Atmospheric Boundary Layer and Its Significance to the Stratosphere and Troposphere Exchange over the Tibetan Plateau. PLoS ONE 2013, 8. [Google Scholar] [CrossRef]
  37. Chen, D.; Lü, D.; Chen, Z. Simulation of the stratosphere-troposphere exchange process in a typical cold vortex over Northeast China. Sci. China Earth Sci. 2014, 57, 1452–1463. [Google Scholar] [CrossRef]
  38. Liang, M.C.; Mahata, S. Oxygen anomaly in near surface carbon dioxide reveals deep stratospheric intrusion. Sci. Rep. 2015, 5, 11352. [Google Scholar] [CrossRef] [Green Version]
  39. Zhang, J.; Tian, W.; Xie, F.; Tian, H.; Luo, J.; Zhang, J.; Liu, W.; Dhomse, S. Climate warming and decreasing total column ozone over the Tibetan Plateau during winter and spring. Tellus B Chem. Phys. Meteorol. 2014, 66, 23415. [Google Scholar] [CrossRef]
  40. Wang, H.; Wang, W.; Huang, X.; Ding, A. Impacts of stratosphere-to-troposphere-transport on summertime surface ozone over eastern China. Chin. Sci. Bull. 2019. [Google Scholar] [CrossRef] [Green Version]
  41. Xu, Z.; Huang, X.; Nie, W.; Chi, X.; Xu, Z.; Zheng, L.; Sun, P.; Ding, A. Influence of synoptic condition and holiday effects on VOCs and ozone production in the Yangtze River Delta region, China. Atmos. Environ. 2017, 168, 112–124. [Google Scholar] [CrossRef]
  42. Copernicus Climate Change Service (C3S), ERA5: Fifth Generation of ECMWF Atmospheric Reanalyses of the Global Climate. Copernicus Climate Change Service Climate Data Store (CDS). 2017. Available online: https://cds.climate.copernicus.eu/cdsapp#!/home (accessed on 29 January 2020).
  43. Emmons, L.K.; Hess, P.G.; Lamarque, J.F.; Pfister, G.G. Tagged ozone mechanism for MOZART-4, CAM-chem and other chemical transport models. Geosci. Model Dev. 2012, 5, 1531–1542. [Google Scholar] [CrossRef] [Green Version]
  44. Stein, A.F.; Draxler, R.R.; Rolph, G.D.; Stunder, B.J.B.; Cohen, M.D.; Ngan, F. NOAA’s HYSPLIT Atmospheric Transport and Dispersion Modeling System. Bull. Am. Meteorol. Soc. 2015, 96, 2059–2077. [Google Scholar] [CrossRef]
  45. Ding, A.; Wang, T.; Fu, C. Transport characteristics and origins of carbon monoxide and ozone in Hong Kong, South China. J. Geophys. Res. 2013, 118, 9475–9488. [Google Scholar] [CrossRef]
Figure 1. Spacial distribution of ground-level ozone concentration in eastern China, including Jiangsu, Zhejiang, Anhui, Jiangxi provinces and Shanghai, from 25 April 2018 to 28 April 2018.
Atmosphere 11 00164 g001
Figure 2. Time series of ground-level ozone (red lines) and CO (blue lines) concentration in eastern China from 24 April 2018 to 30 April 2018. (a) Nanjing, (b) Hangzhou, (c) Jiaxing and (d) Hefei. The horizontal red dashed line indicates the value of 100 ppbv of ozone concentration. The vertical black dotted lines indicate 16:00 of each day (local time), which is approximately the time of the maximal values of the diurnal cycle.
Atmosphere 11 00164 g002
Figure 3. Mean diurnal cycle of ozone (red) and CO (blue) averaged over the month (April 2018, solid lines) and for the severe ozone pollution days (27–28 April 2018, dashed lines). (a) Nanjing, (b) Hangzhou, (c) Jiaxing and (d) Hefei. The vertical black dotted lines indicate 16:00 of local time, which is approximately the peak of the diurnal cycle.
Atmosphere 11 00164 g003
Figure 4. Spacial distribution of geopotential height (shading) and horizontal winds (arrows) at 300 hPa over east Asia from 25 April 2018 to 28 April 2018. The geopotential height and horizontal winds data are from ERA5. The black star in each panel indicates the area of interest in this study.
Atmosphere 11 00164 g004
Figure 5. Spatial distribution of geopotential height (shading) and horizontal winds (arrows) at 500 hPa over east Asia from 25 April 2018 to 28 April 2018. The geopotential height and horizontal winds data are from ERA5. The black star in each panel indicates the area of interest of this study.
Atmosphere 11 00164 g005
Figure 6. Spatial distribution of potential vorticity (PV) at 300 hPa over east Asia from 25 April 2018 to 28 April 2018. PV is calculated based on ERA5 data. The white contour line indicates the dynamical tropopause of 2 PVU (1 PVU = 10 6 m 2 s 1 K kg 1 ). The red star in each panel indicates the area of interest in this study.
Atmosphere 11 00164 g006
Figure 7. Spatial distribution of ERA5 ozone at 300 hPa over east Asia from 25 April 2018 to 28 April 2018. The black star in each panel indicates the area of interest in this study.
Atmosphere 11 00164 g007
Figure 8. Longitude-height cross sections of ERA5 ozone at 30° N from 25 April 2018 to 28 April 2018. (a) 25 April, (b) 26 April, (c) 27 April and (d) 28 April 2018. The white line indicates the dynamical tropopause (2 PVU). The vertical line indicates the longitude (120° E) of Hangzhou.
Atmosphere 11 00164 g008
Figure 9. Longitude-height cross sections of O3S/O3 ratio at 30° N from CAM-Chem simulation for the period 25–28 April 2018. (a) 25 April, (b) 26 April, (c) 27 April and (d) 28 April 2018. The vertical line indicates the longitude (120° E) of the area of interest.
Atmosphere 11 00164 g009
Figure 10. Time evolution of vertical distributions of water vapour divergence (a, g s 1 cm 2 hPa 1 ) and vertical velocity (b, Pa/s), at Hangzhou (120 E, 30.2 N) from 24 April 2018 to 30 April 2018. The water vapour divergence and vertical velocity are calculated by ERA5 data.
Atmosphere 11 00164 g010
Figure 11. (a) 24-h backward column retroplume (integrated for all levels) of particles released at the altitude of 100 m above Hangzhou (120 E, 30.2 N) at 16:00 (local time) on 28 April 2018. (b) Vertical distribution of particle retroplume along the air path as indicated by the black dotted line in Figure 11a.
Atmosphere 11 00164 g011
Figure 12. Spacial distribution of the CAM-Chem simulated O3S (a,b) and O3S/O3 ratio (c,d) in eastern China at surface on 27 and 28 April 2018. The white star in each panel indicates the location of Hangzhou.
Atmosphere 11 00164 g012
Figure 13. Time evolution of CAM-Chem simulated ozone (red) and O3S (turquoise) in eastern China from 22 April 2018 to 30 April 2018. (a) Nanjing, (b) Hangzhou, (c) Jiaxing and (d) Hefei.
Atmosphere 11 00164 g013

