Article

Aqueous-Phase Brown Carbon Formation from Aromatic Precursors under Sunlight Conditions

Department of Analytical Chemistry, National Institute of Chemistry, Hajdrihova 19, SI-1000 Ljubljana, Slovenia
*
Authors to whom correspondence should be addressed.
Atmosphere 2020, 11(2), 131; https://doi.org/10.3390/atmos11020131
Submission received: 22 November 2019 / Revised: 19 December 2019 / Accepted: 22 January 2020 / Published: 24 January 2020
(This article belongs to the Special Issue Atmospheric Aqueous-Phase Chemistry)

Abstract

:
At present, there are still numerous unresolved questions concerning the mechanisms of light-absorbing organic aerosol (brown carbon, BrC) formation in the atmosphere. Moreover, there is growing evidence that chemical processes in the atmospheric aqueous phase can be important. In this work, we investigate the aqueous-phase formation of BrC from 3-methylcatechol (3MC) under simulated sunlight conditions. The influence of different HNO2/NO2 concentrations on the kinetics of 3MC degradation and BrC formation was investigated. Under illumination, the degradation of 3MC is faster (k2nd(global) = 0.075 M−1·s−1) in comparison to its degradation in the dark under the same solution conditions (k2nd = 0.032 M−1·s−1). On the other hand, the yield of the main two products of the dark reaction (3-methyl-5-nitrocatechol, 3M5NC, and 3-methyl-4-nitrocatechol, 3M4NC) is low, suggesting different degradation pathways of 3MC in the sunlight. Besides the known primary reaction products with distinct absorption at 350 nm, second-generation products responsible for the absorption above 400 nm (e.g., hydroxy-3-methyl-5-nitrocatechol, 3M5NC-OH, and the oxidative cleavage products of 3M4NC) were also confirmed in the reaction mixture. The characteristic mass absorption coefficient (MAC) values were found to increase with the increase of NO2/3MC concentration ratio (at the concentration ratio of 50, MAC is greater than 4 m2·g−1 at 350 nm) and decrease with the increasing wavelength, which is characteristic for BrC. Yet, in the dark, roughly 50% more BrC is produced at comparable solution conditions (in terms of MAC values). Our findings reveal that the aqueous-phase processing of 3MC in the presence of HNO2/NO2, both under the sunlight and in the dark, may significantly contribute to secondary organic aerosol (SOA) light absorption.

1. Introduction

The existence of light-absorbing organic aerosols in the atmosphere, also termed as brown carbon (BrC), has become increasingly evident in recent years [1,2,3]. In contrast to black carbon (BC), which strongly absorbs light in the entire spectral range [4], BrC typically absorbs in the near-UV (300–400 nm) and blue-to-green visible ranges (400–550 nm) [1,2,5]. BrC impacts radiative forcing directly by absorbing solar irradiation and also indirectly by influencing the cloud formation [6,7]. In addition, its components can take part in different (photo)chemical reactions in the atmosphere and can also have harmful effects on the environment and living organisms [1,8].
BrC is largely observed in areas influenced by biomass and biofuel burning and is often attributed to primary emissions [1,9]. However, there is more and more evidence that secondary transformations of primarily emitted volatile organic compounds (VOCs), in the gas and/or in the atmospheric aqueous phase, also contribute to BrC formation [10,11,12]. Important precursors to BrC are aromatic compounds, which contribute significantly to the budget of atmospheric pollution [13]; among those, substituted aromatics are especially important [14]. A class of aromatics with strong absorption in the near UV and visible are nitrophenols (NP), which are frequently determined in atmospheric particulate matter (PM), with elevated concentrations in winter PM and being primarily associated with biomass burning (BB) [15,16,17,18,19]. It has recently been shown that several nitroaromatic pollutants, such as NP, nitrocatechols (NC), and methylnitrocatechols (MNC), can be formed via (photo)chemical oxidation of preferentially gas-phase precursors in the atmosphere [20,21]. Moreover, evidence exists that their formation can take place in the atmospheric aqueous phase, which additionally contributes to the atmospheric abundance of these compounds [11,22,23].
At present, there are numerous open questions concerning the mechanisms of BrC formation, particularly those in cloud droplets and aqueous particles. However, there is rising evidence that chemical processes in the atmospheric condensed phase can efficiently contribute to organic aerosol aging, and thus eventually also to light-absorbing secondary organic aerosol (SOA) formation [24,25]. Yellow-colored MNC have been recognized as essential constituents of BB SOA and further also proposed as suitable tracer compounds [15,16,22,26]. Their complex formation mechanisms under nighttime conditions in the atmospheric aqueous phase have recently been extensively studied [27,28]. Moreover, it has been demonstrated that under sunlight conditions, the formation of nitroguaiacols (nitrated 2-methoxyphenols, NG) and their aging in the atmospheric aqueous phase are even more complex [11,23]. In general, nitrophenols have been shown to be susceptible to direct photolysis and to photo-oxidation [29,30,31]; as a result, the light-absorbing properties of BrC can change significantly during atmospheric aging [32,33]. Hems and Abbatt [33] have recently investigated the mechanism of color enhancement and fate of nitrophenols (NC, NG, and dinitrophenol) during aqueous-phase photo-oxidation. They have found out that the initially fast-formed nitrophenols, being functionalized with additional OH groups, likely lead to the increased absorption in the visible range, whereas further reactions lead to product formation with poor or no visible absorption (i.e., in the process called bleaching).
In this work, aqueous-phase transformations of 3-methylcatechol (3MC) as an important precursor to light-absorbing MNC were investigated under atmospheric sunlight conditions. The main goal was to find out how photochemical processing affects the kinetics of 3MC degradation at different HNO2/NO2 concentrations, and how the absorptive properties of the reaction mixture change during the aging. Although NO3 is the prevailing nitrogen species in atmospheric aerosols, HNO2/NO2 is known for its much higher reactivity at ambient conditions, at least in the dark, and is thus considered important for SOA formation and aging. Special attention was paid to the main dark BrC products, 3-methyl-5-nitrocatechol (3M5NC), and 3-methyl-4-nitrocatechol (3M4NC), and to the possible formation of absorbing second-generation products, such as hydroxy-3-methyl-5-nitrocatechol (3M5NC-OH). In addition, the influence of different reaction conditions on BrC formation/decomposition was quantified by a cumulative parameter, mass absorption coefficient (MAC in m2 g−1), which was used to describe the evolution of BrC during the solution aging.

2. Materials and Methods

2.1. Materials

3-methylcatechol (3MC) (purity ≥98%) and sodium nitrite (NaNO2, ACS reagent, ≥97.0%), both from Sigma-Aldrich were used for the reaction mixture preparation in high purity water (18.2 MΩ cm), supplied by a Milli-Q water purification system. Standards of two reaction products, 3M5NC and 3M4NC, were prepared in the laboratory by the procedures adopted from Palumbo [34] and Kitanovski [35]. Sulfuric acid 98% (H2SO4, EMSURE, p.a. grade) was used for the pH adjustment.
For the quantification of 3MC, NaNO2 and first-generation reaction products (3M5NC and 3M4NC), acetonitrile (Sigma-Aldrich, St. Louis, MO, USA, gradient grade, for HPLC >99.9%) and formic acid (Kemika, Zagreb, Croatia) were used for mobile phase preparation. For the second-generation product identification, methanol (Fluka, Chromosolv LC-MS grade, ≥99.9%) and an ion-pair reagent for LC-MS Dibutylammonium Acetate-DBAA (Tokyo Chemical Industry, Tokyo, Japan, 0.5 mol·L−1) were used.

2.2. Laboratory Experiments

The photolysis of 3MC in mildly acidic (pH = 4–5, adjusted with H2SO4) aqueous solutions of sodium nitrite (NaNO2;) was investigated at ambient temperature (25 °C). The reactions were carried out in a custom-built reactor, which is a modified rotating evaporator (Büchi, Flawil, Switzerland) equipped with a thermostated bath [36]. Only briefly, a low-volume condenser was installed to prevent significant evaporation from the solution ensuring a closed physical system. The reaction mixture (100 mL) was continuously mixed by rotation (50 rpm) of a round-bottom flask made of the DURAN glass (transparent one for daytime experiments and amber glass for dark reactions). For illumination, a LOT-QuantumDesign Europe solar simulator (L.O.T.-Oriel GmbH & Co. KG, Darmstadt, Germany) equipped with a xenon short-arc lamp (300 W, ozone free) was used. According to the specifications, the simulator produces irradiation equivalent to approximately one sun at the working distance of 180 mm. Moreover, the cut-off of the DURAN glass at 300 nm resembles the absorption of the stratospheric ozone, which allows us to mimic ambient conditions very well. The concentrations of 3MC and H2SO4 were fixed at 0.1 and 0.05 mM, respectively. The influence of NaNO2 concentration was investigated at 0.1, 0.5, 1.0, 2.0, and 5.0 mM. Samples (1.5 mL aliquots) were taken from the reaction mixture according to the predefined time protocol (usually each hour). In addition, a control experiment of the direct photolysis of 3MC without the addition of NaNO2/H2SO4, and the dark nitration of 3MC in acidic NaNO2 (1 and 2 mM) solutions were performed.
An ultra-high pressure liquid chromatography (UltiMate 3000 UHPLC System; Thermo Fischer Scientific, Waltham, MA, USA) coupled with a diode array detector (DAD) or a triple quadrupole/linear ion trap mass spectrometer (4000 Q TRAP LC-MS/MS System; Applied Biosystems/MDS Sciex) was used for the detection of reactants and products. For the quantification of 3MC, NaNO2, and first-generation products (3M5NC and 3M4NC), an isocratic elution program with acetonitrile/0.1% formic acid (70/30, V/V) at the flow rate of 0.6 mL·min−1 was applied, assuring the separation of components on an Atlantis T3 column (3.0 × 150 mm2, 3 μm particle size; Waters, Milford, MA, USA). The injection volume and the column temperature were 10 μL and 30 °C. The detection wavelengths used in the case of HPLC-DAD measurements were 275 nm for 3MC, 345 nm for MNC, and 355 nm for NaNO2. For the second-generation product identification (m/z 182 and 184), different chromatographic conditions were used: a Hypersil GOLD aQ column (2.1 × 150 mm2, 3 μm particle size; Thermo Scientific, Waltham, MA, USA) and an isocratic elution with methanol/50 mM DBAA (10/90, V/V) at the flow rate of 0.3 mL·min−1. The injection volume and the column temperature were again 10 μL and 30 °C. The detection wavelength used in this case was 388 nm.
Absorption spectra of the reaction solution were measured offline in a 1 cm quartz cuvette with a UV-Vis spectrometer (Lambda 25, PerkinElmer, Waltham, MA, USA) immediately after sampling. The absorbance was monitored in a broad spectral range from 200 to 700 nm.

2.3. Kinetic Analysis

The experimentally obtained 3MC photolysis profiles were first treated by a pseudo-first-order kinetics:
c t = k app · c ,
where c is the concentration of 3MC, t denotes time, and kapp is the apparent pseudo-first-order kinetic rate constant (in s−1) of 3MC degradation. The integrated form of Equation (1a) was fitted to the experimental data points, c0 being the initial concentration of 3MC in the reaction mixture.
c = c 0 · e k app · t .
Referring to the direct photolysis of 3MC, which is negligible (see the control experiment), we postulated that the degradation of 3MC be dependent on the concentration of NaNO2.
c t =   k 2 nd · c ( NaNO 2 ) · c .
Except for the condition where the initial concentrations of 3MC and NaNO2 were equal (i.e., 0.1 mM; experiment 1), we further assumed constant NaNO2 concentration in the reaction mixture throughout the course of experiment. Second-order kinetic rate constants (k2nd in M−1·s−1) were thus estimated from kapp as:
k app = k 2 nd ·   c ( NaNO 2 ) 0 .
c(NaNO2)0 being the initial concentration of NaNO2 in the reaction mixture. Note, however, that one cannot assume constant NaNO2 concentration during experiment 1. Therefore, a second-order kinetic treatment was applied in this case, taking into account the measured c(NaNO2) at each time of the experiment.
c t =   k 2 nd · c ( NaNO 2 ) t · c ,
where c(NaNO2)t represents the concentration of NaNO2 at the reaction time t.
The experimental data for which the assumption of a pseudo-first-order is valid (c(NaNO2) = 0.5, 1.0, 2.0, and 5.0 mM) were further treated simultaneously by the following function:
c t =   k 2 nd ( global ) · c ( NaNO 2 ) 0 · c .
This gave us a global second-order kinetic rate constant, k2nd(global) representing all treated experimental conditions. Note that parameters obtained by accounting for the data at different experimental conditions at once tend to be more universally applied.
OriginPro 2018 was used for the fitting of the model functions to the experimental data (i.e., measured concentration and absorption profiles).

2.4. Determination of Absorption Properties

The obtained k2nd(global) (Equation (4)) was further used to quantitatively describe the influence of the studied reaction conditions on BrC formation. In the case of experiment 1 (Table 1), k2nd(global) is not valid; therefore, kapp (Equation (1a)) was used instead. According to the Beer–Lambert Law, the measured absorbance of a sample at a distinct wavelength, Atot is dependent on the characteristic mass absorption coefficient of contained species i at this wavelength, MACi, and their concentrations, ci; l is the absorption path length characteristic of the used cuvette.
A tot = i MAC i · c i · l .
By definition, BrC absorbs in the near-UV and visible ranges, so we attributed Atot measured above 300 nm to the BrC formation (note that 3MC does not absorb in this range). Equation (5a) can be thus expressed as:
A tot ( > 300   nm ) = MAC BrC · m BrC · l .
MACBrC (in m2·g−1) being the mass absorption coefficient characteristic of the formed BrC and mBrC is its mass concentration in g m−3.
By combining Equation (5b) with the expression for the pseudo-first-order product formation and taking into account the law of conservation of mass (i.e., assuming that all consumed 3MC was converted to BrC; m0 is the initial 3MC mass concentration):
m BrC = m 0 ( 1 e k 2 nd ( global ) · c ( NaNO 2 ) 0 · t ) .
One can describe the evolution of Atot with time with the following function:
A tot = MAC BrC · m 0 ( 1 e k 2 nd ( global ) · c ( NaNO 2 ) 0 · t ) · l .
The derived function was fitted to the experimental data points, and characteristic MACBrC values for the investigated experimental conditions were obtained. Note that in the case of experiment 1 Table 1), kapp was used instead of the product of k2nd(global) and c(NaNO2)0.

3. Results and Discussion

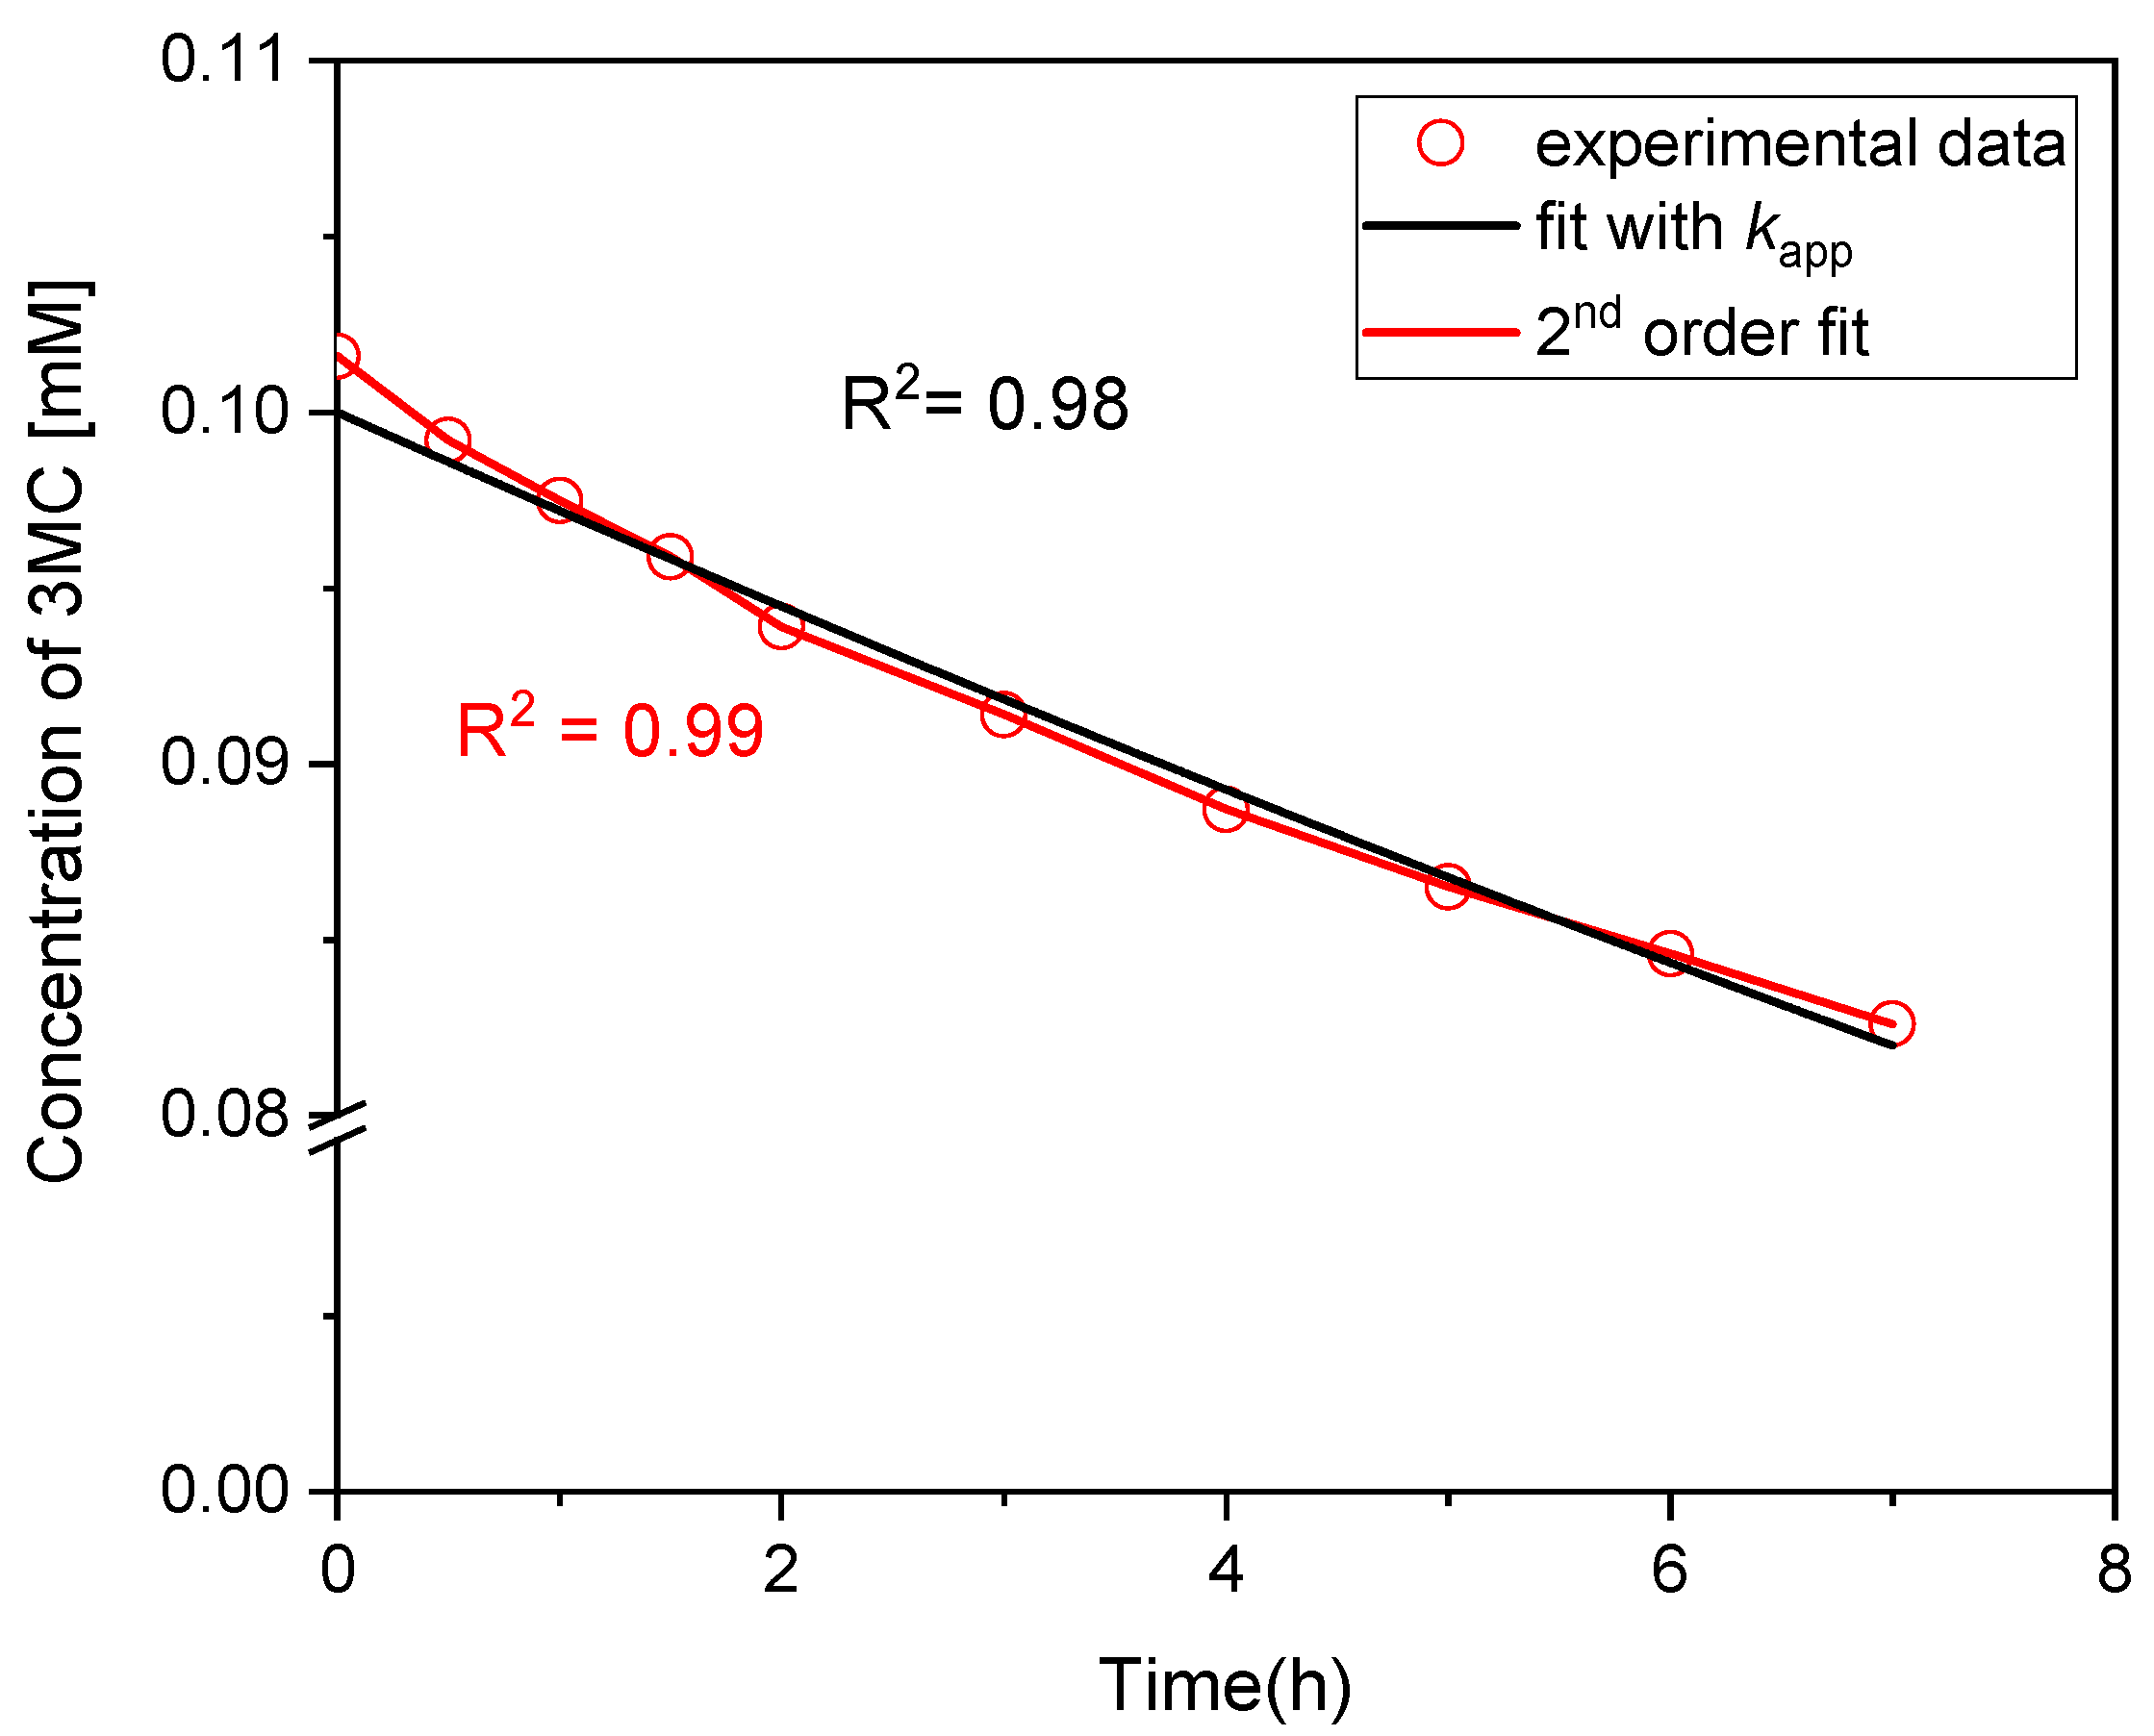
3.1. Kinetic Analysis of 3MC Photolysis in Mildly Acidic NaNO2 Solution

In the dark reaction of 3MC and NaNO2, two main reaction products have been recently quantified, i.e., 3M5NC and 3M4NC; they accounted for 70–100% of the reacted 3MC at similar reaction conditions as used in this study [27]. In addition, the ratio of 3M5NC to 3M4NC was constant during the dark reaction and dependent only on the concentration of HNO2 [27].
Under sunlight conditions, dark reaction mechanisms also exist; thus, 3M5NC and 3M4NC were expected to be formed in this study as well. The performed experiments under illumination are listed in Table 1 together with the corresponding 3M5NC/3M4NCratios and product yields determined after 8 h of reaction. The product yield was calculated as the sum of concentrations of target reaction products divided by the concentration of the reacted 3MC.
Product   yield = Σ [ M N C ] 8 h [ 3 M C ] 0 h [ 3 M C ] 8 h .
Under the sunlight, the cumulative yield of identified MNC products was only up to about 45%. The ratio (and the yield) of 3M5NC to 3M4NC were additionally found to be dependent on the initial concentration of NaNO2 (Table 1). The low product yield and the variable product ratio suggest the existence of different oxidation pathways of 3MC, and formation and/or degradation pathways of MNC products in comparison to the dark reaction.
During the photolysis of HNO2, diverse reactive species are formed (e.g., OH, NO, NO2), which are possible sinks of 3MC [37]. In general, OH radicals react with aromatics with high (near-diffusion controlled) rate constants in the order of 1010 L·mol−1·s−1 at 298 K [38,39]. The reactivity of aromatics with NO2 is still relatively high (in the order of 108–109 L mol−1·s−1), whereas NO seems to be too weak to react with aromatic compounds directly [23]. In summary, other degradation pathways of MNC, i.e., initiated by radicals, are very likely under illumination [33].
Under illumination, also the decay of 3MC was greatly dependent on the applied conditions (Table 2). In general, kapp increased as the NaNO2 concentration increased. Note, however, that in the cases where NaNO2 was in excess, k2nd slightly decreased with NaNO2 addition. This may be due to unaccounted 3MC degradation pathways, independent of (or indirectly dependent on) the NaNO2 concentration.

3.1.1. Kinetic Analysis at Low NaNO2 Concentrations

The time-dependent concentrations of 3MC (0.1 mM initial concentration) in 0.1 mM NaNO2 solution under sunlight conditions are shown in Figure 1. In the investigated time range, kapp (7.88 × 10⁻⁶ s−1) describes the behavior of this reaction reasonably well and is comparable with the reaction in the dark (8.33 × 10⁻⁶ s−1) [27]. However, the yield of identified MNC under sunlight is barely 17% after 8 h (Table 1), pointing to different degradation and/or formation pathways of 3MC and MNC, respectively.
Second-order kinetics was also applied to this set of experimental data, and the comparison of both models (Equations (1a) and (3)) is shown in Figure 1. As kapp describes experimental data adequately in the investigated time range, we used it in further calculations with a fair amount of confidence.

3.1.2. Kinetic Analysis at High NaNO2 Concentrations

Time-dependent concentrations of 3MC in the presence of different initial NaNO2 concentrations (i.e., from 0.5 to 5 mM) are shown in Figure 2a–d. The lines are the calculated concentration profiles according to the two proposed model functions (Equations (1a) and (4)). By using kapp, the experimental data are represented well in all cases; thus, its values were further used to derive k2nd according to Equation (2b) for each experiment individually (see Table 2). Yet, a global fit was also performed to get a more reliable second-order rate constant, k2nd(global), by which the kinetics of 3MC decay at all treated conditions is still well described (black lines in Figure 2).
The rate constant for 3MC decay in the simulated sunlight (k2nd(global) = 0.075 M−1·s−1) is twice as high as in the dark (k2nd = 0.032 M−1·s−1) under similar initial conditions (Table 2). As mentioned above, several different degradation mechanisms are possible in the sunlight that are prevented in the dark. Similarly, under the sunlight, k2nd for the 3MC decay at the lowest NaNO2 concentration (0.1 mM) is almost twice as that at higher NaNO2 concentrations (0.5–5 mM). The reason might be in the competition between NO2 and 3MC for OH radicals and other reactive species at these experimental conditions. When HNO2/NO2 is in excess, OH radicals preferentially react with NO2, whereas only a minor fraction reacts with 3MC, which results in its slower degradation [37,39].

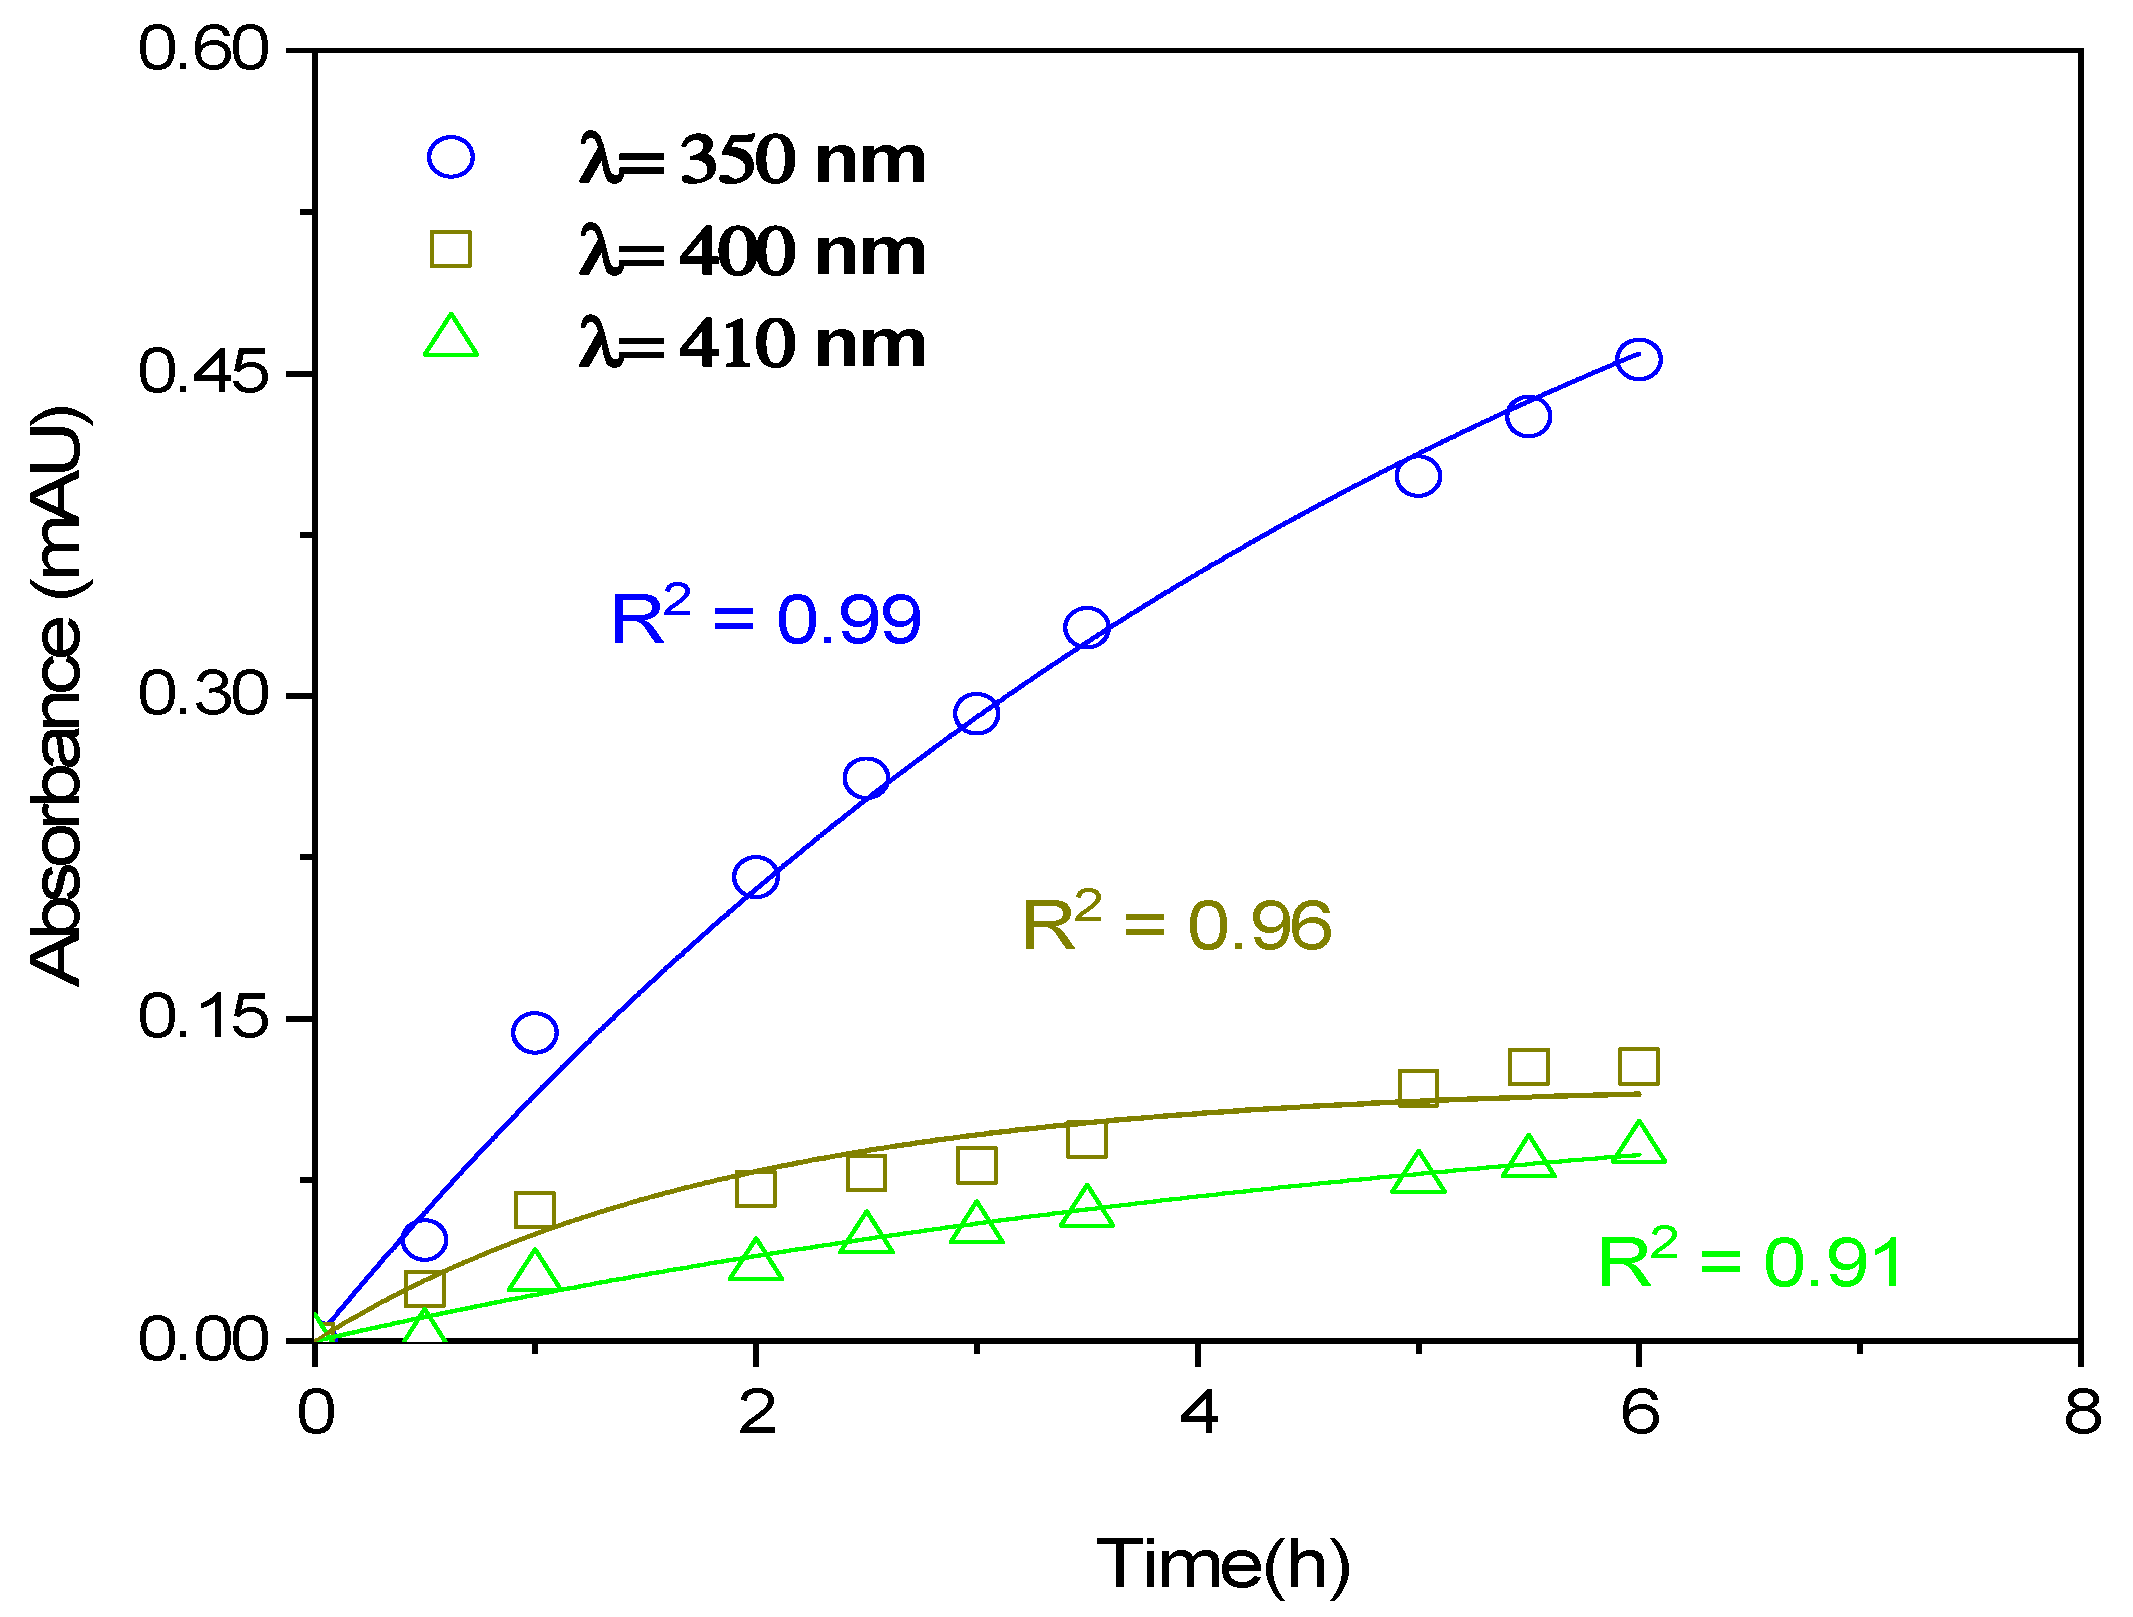
3.2. Absorption Spectra and BrC Formation

3.2.1. Low NaNO2 Concentrations

As has recently been reported in our previous study on the nighttime aqueous-phase formation of MNC, the two identified products, i.e., 3M5NC and 3M4NC, strongly absorb in the near UV range, whereas the reaction mixture also exhibited notable absorption in the visible range, which are all characteristic of BrC [27]. Moreover, in the dark, the enhanced absorption in the visible range can be attributed to MNC degradation by hydroxylation and oxidative cleavage by water addition [28].
Figure 3a–f shows the time evolution of absorption spectra during the aging of 3MC in mildly acidic NaNO2 solutions under illumination. The dependence of absorbance on the initial concentration ratio of 3MC to NaNO2 was investigated. Compared to the photolysis of 3MC only (without the addition of NaNO2), where we did not observe any change in the absorption spectrum over the reaction time scale (Figure 3a), the spectrum noticeably evolves already at low NaNO2 concentration (i.e., 0.1 mM, Figure 3b). The absorption around 350 nm increases with time and corresponds to the formation of first-generation products, 3M5NC and 3M4NC [27]. Nevertheless, only a slight increase in the absorption is in agreement with the ascertainment that at low NOx, BrC formation by nitration is not preferred [40,41]. Note also the low product yield at the lowest NO2 concentration (Table 1).
The time evolution of absorbance at 350, 400, and 410 nm, measured experimentally, and modeled using Equation (7), is presented in Figure 4. The predicted absorption describes the experimental data fairly well; a somewhat weaker correlation can be explained by extensive scattering of data due to unreliable measurements at low absorbance (below 0.2). The developed absorption above 400 nm at long reaction times may, among others, correspond to hydroxylated and ring cleavage products formed from MNC, the same as in the dark [28]. See further discussion for justification.

3.2.2. High NaNO2 Concentrations

At higher NaNO2/3MC concentration ratios, the absorption at 350 nm is substantially enhanced in comparison to the experiment with equimolar amounts of both reactants, resulting in the appearance of a distinctive peak with the maximum at this wavelength (Figure 3c–e). In addition, the absorption above 400 nm becomes more pronounced. The enhancement in absorption at examined wavelengths is the fastest at the highest NaNO2 concentration (Figure 3f).
As already mentioned before, the two products, 3M5NC and 3M4NC with a pronounced absorption peak at 350 nm can react further, forming second-generation products, which can be responsible for the development of absorption in the visible region. According to our recent study [28], the secondary products can be 3M5NC-OH and the oxidative cleavage products of 3M4NC. Their spectroscopic characteristics (both exhibit the absorption maxima at cca. 400 nm and the latter another one at around 500 nm [28]) are in agreement with the presented results and were also confirmed in one of the investigated reaction mixtures by comparison with the recently published data. The chromatogram of the reaction mixture is shown in Figure 5 and mass spectra corresponding to the characteristic peaks were additionally analyzed by an LC-MS/MS experiment. The peak at 2.5 min showed the m/z ratio of 183 corresponding to 3M5NC-OH, while the peak at 4.5 min with the m/z of 184 corresponds to the oxidative cleavage products of 3M4NC, which additionally confirmed the identity of investigated compounds.
The time evolution of absorbance, experimentally measured and modeled by using Equation (7), is presented in Figure 6 for all remaining four experimental conditions. At the initial concentrations of 0.5 and 1 mM NaNO2, the experimental data are very well fitted with the applied absorption model (Figure 6a,b). However, at higher NaNO2 concentrations, the exponential shape of absorbance changes into the sigmoidal one, which is most noticeable at 5 mM NaNO2 in the visible range (Figure 6c,d). This behavior could be attributed to the formation of the second-generation products, which are particularly responsible for the enhanced absorption above 400 nm (e.g., 3M5NC-OH and the oxidative cleavage products of 3M4NC). As the proposed absorption model only considers the one-step transformation of 3MC into BrC, it fails to precisely reproduce such complex behavior of the experimental system. Furthermore, at the highest NO2 concentration, 3MC is completely consumed during the experiment; therefore, primary reaction products, 3M5NC and 3M4NC, stopped forming already before the end of the experiment. Consequently, the decay of absorbance is observed in the second part of the experiment, and the predicting ability of the absorption model is even worse in this case because it does not account for any of the explained phenomena.
In contrast to the illuminated experiments, the model describes the experimental data of dark reactions very well, also at high NaNO2 concentrations (0.1 mM 3MC and 2 mM NaNO2; Figure 7). These results additionally support our discussion that under the sunlight, the formed BrC species undergo secondary reactions substantially.
From characteristic MAC values at 350, 400, and 410 nm listed in Table 3 one can see that with increasing NaNO2 concentration, higher MAC values are obtained corresponding to more BrC production; i.e., the highest was in the order of 4 m2 g−1 for 5 mM NaNO2 at 350 nm. It should be emphasized that in the dark (experiments 6 and 7), roughly 50% more BrC is produced at comparable solution conditions. This is consistent with the finding that under the sunlight, BrC degradation, and so the solution bleaching, may proceed via the reactions with OH radicals leading to products with poor absorption in the visible region [33].
MAC values for the photolysis of 3MC in aqueous NaNO2 solutions (from ca. 0.4 m2·g−1 at 410 nm for 0.1 mM NO2 to ca. 4 m2·g−1 at 350 nm for 5 mM NO2, see Table 3) are of the same order of magnitude as reported in the literature [42]. Liu et al. [43] found out that MAC of SOA, especially those produced from aromatic precursors, are much higher for high-NOx conditions than for low NOx. In high-NOx, SOA from toluene was largely composed of nitroaromatic compounds (e.g., NC, dinitrocatechol, and NP), the total absorbance of which accounted for 60% and 41% of the overall absorbance in the ranges of 300–400 and 400–500 nm, respectively [44]. Jiang et al. [45] has recently reported on MAC values of SOA from unsaturated heterocyclic organic compounds; for example, for pyrrole SOA from nighttime NO3 oxidation, the value of (MAC)290–700nm was 0.34 ± 0.07 m2·g−1. In addition, MAC values of water-soluble organic aerosols from different environments have been reported [42]; MAC of 0.3 m2·g−1 at 532 nm was found for water-soluble Humic-like-substances(HULIS) fraction of BB aerosol (BBA) in Amason basin [46] and 0.5–1.5 m2·g−1 at 404 nm for ambient BB organic aerosol (BBOA) in Boulder, Colorado [47]. Based on our results, we can conclude that during the reaction of 3MC and NaNO2, both in the sunlight and in the dark, light-absorbing components are formed, largely MNC, which efficiently absorb light in the range characteristic of BrC. For comparison, in the aqueous reaction of 3MC at low NaNO2 concentration (experiment 1), for a factor of more than 2 more BrC is formed (MAC is ca. 1.8 m2·g−1 at 350 nm) than from toluene at high-NOx conditions at moderate RH (MAC, 0.8 m2·g−1 at 365 nm) [43].

4. Conclusions

This study demonstrates that aqueous-phase transformations of 3MC in the presence of HNO2/NO2 under atmospheric sunlight conditions importantly contribute to the secondary BrC formation. The two primary products, 3M5NC and 3M4NC, which have been identified as the main products of nighttime processing and shown to strongly absorb in the near UV range [27], are also formed under the sunlight. However, their cumulative yield is only up to about 45% under illumination and was additionally found to be dependent on the initial concentration of NO2. When NO2 is in excess with respect to 3MC, the rate constant of 3MC degradation (k2nd(global) = 0.075 M−1·s−1) is twice as high as in the dark (k2nd = 0.032 M−1·s−1) under the same initial conditions. Several different degradation mechanisms are possible in the sunlight. Besides the non-radical nitration reaction, which has already been studied in the dark, different reactive species can be formed during the photolysis of HNO2 (e.g., OH, NO, NO2), which are also possible sinks of 3MC.
The dependence of absorbance evolution on the initial NO2/3MC concentration ratio during the photolysis showed that when the ratio is 1, the absorption around 350 nm increases with time, which corresponds to the formation of identified first-generation products (3M5NC and 3M4NC). At higher concentration ratios, the absorption at this wavelength substantially increases, and the absorption above 400 nm becomes pronounced as well. The second-generation products, i.e., 3M5NC-OH and the oxidative cleavage products of 3M4NC, were confirmed to be responsible for the absorption in the visible region.
With higher NO2 concentrations, the characteristic MAC values (up to more than 4 m2·g−1 at 350 nm for 5 mM NO2) increase due to more BrC formation. We believe that the aqueous-phase reaction of 3MC in the presence of HNO2/NO2, either under the sunlight or in the dark, may significantly contribute to SOA light absorption. This is supported by the fact that MNC and secondary hydroxylated/ring cleavage products produced from 3MC significantly absorb light in the range characteristic of BrC. Our conclusions are also supported by recent field measurements of aerosol particles, where MNC have been identified as significant contributors to atmospheric BrC [15,16,17,18,19,22].

Author Contributions

K.V. performed the experiments, conducted the research, and helped to write the manuscript; M.Š. helped in product identification; A.K. contributed to the data analysis and writing process; and I.G. wrote the manuscript. All authors have read and agreed to the published version of the manuscript.

Funding

This research received no external funding.

Acknowledgments

We acknowledge the financial support from the Slovenian Research Agency (research core funding No. P1-0034). We thank Luka Nunar for his help with experimental work.

Conflicts of Interest

The authors declare no competing financial interests.

References

  1. Laskin, A.; Laskin, J.; Nizkorodov, S.A. Chemistry of Atmospheric Brown Carbon. Chem. Rev. 2015, 115, 4335–4382. [Google Scholar] [CrossRef] [Green Version]
  2. Teich, M.; van Pinxteren, D.; Wang, M.; Kecorius, S.; Wang, Z.B.; Muller, T.; Mocnik, G.; Herrmann, H. Contributions of nitrated aromatic compounds to the light absorption of water-soluble and particulate brown carbon in different atmospheric environments in Germany and China. Atmos. Chem. Phys. 2017, 17, 1653–1672. [Google Scholar] [CrossRef] [Green Version]
  3. Xie, M.J.; Chen, X.; Hays, M.D.; Holder, A.L. Composition and light absorption of N-containing aromatic compounds in organic aerosols from laboratory biomass burning. Atmos. Chem. Phys. 2019, 19, 2899–2915. [Google Scholar] [CrossRef] [Green Version]
  4. Bond, T.C. Spectral dependence of visible light absorption by carbonaceous particles emitted from coal combustion. Geophys. Res. Lett. 2001, 28, 4075–4078. [Google Scholar] [CrossRef] [Green Version]
  5. Feng, Y.; Ramanathan, V.; Kotamarthi, V.R. Brown carbon: A significant atmospheric absorber of solar radiation? Atmos. Chem. Phys. 2013, 13, 8607–8621. [Google Scholar] [CrossRef] [Green Version]
  6. Andreae, M.O.; Gelencser, A. Black carbon or brown carbon? The nature of light-absorbing carbonaceous aerosols. Atmos. Chem. Phys. 2006, 6, 3131–3148. [Google Scholar] [CrossRef] [Green Version]
  7. Saleh, R.; Robinson, E.S.; Tkacik, D.S.; Ahern, A.T.; Liu, S.; Aiken, A.C.; Sullivan, R.C.; Presto, A.A.; Dubey, M.K.; Yokelson, R.J. Brownness of organics in aerosols from biomass burning linked to their black carbon content. Nat. Geosci. 2014, 7, 647–650. [Google Scholar] [CrossRef]
  8. Pflieger, M.; Kroflič, A. Acute toxicity of emerging atmospheric pollutants from wood lignin due to biomass burning. J. Hazard. Mater. 2017, 338, 132–139. [Google Scholar] [CrossRef]
  9. Wang, L.; Wang, X.; Gu, R.; Wang, H.; Yao, L.; Wen, L.; Zhu, F.; Wang, W.; Xue, L.; Yang, L. Observations of fine particulate nitrated phenols in four sites in northern China: concentrations, source apportionment, and secondary formation. Atmos. Chem. Phys. 2018, 18, 4349–4359. [Google Scholar] [CrossRef] [Green Version]
  10. Saleh, R.; Hennigan, C.J.; McMeeking, G.R.; Chuang, W.K.; Robinson, E.S.; Coe, H.; Donahue, N.M.; Robinson, A.L. Absorptivity of brown carbon in fresh and photo-chemically aged biomass-burning emissions. Atmos. Chem. Phys. 2013, 13, 7683–7693. [Google Scholar] [CrossRef] [Green Version]
  11. Kroflič, A.; Grilc, M.; Grgić, I. Unraveling Pathways of Guaiacol Nitration in Atmospheric Waters: Nitrite, A Source of Reactive Nitronium Ion in the Atmosphere. Environ. Sci. Technol. 2015, 49, 9150–9158. [Google Scholar] [CrossRef]
  12. McNeill, V.F. Aqueous Organic Chemistry in the Atmosphere: Sources and Chemical Processing of Organic Aerosols. Environ. Sci. Technol. 2015, 49, 1237–1244. [Google Scholar] [CrossRef]
  13. Harrison, M.A.J.; Barra, S.; Borghesi, D.; Vione, D.; Arsene, C.; Olariu, R.L. Nitrated phenols in the atmosphere: a review. Atmos. Environ. 2005, 39, 231–248. [Google Scholar] [CrossRef]
  14. Hoffmann, E.H.; Tilgner, A.; Wolke, R.; Boge, O.; Walter, A.; Herrmann, H. Oxidation of substituted aromatic hydrocarbons in the tropospheric aqueous phase: Kinetic mechanism development and modelling. Phys. Chem. Chem. Phys. 2018, 20, 10960–10977. [Google Scholar] [CrossRef]
  15. Claeys, M.; Vermeylen, R.; Yasmeen, F.; Gomez-Gonzalez, Y.; Chi, X.G.; Maenhaut, W.; Meszaros, T.; Salma, I. Chemical characterisation of humic-like substances from urban, rural and tropical biomass burning environments using liquid chromatography with UV/vis photodiode array detection and electrospray ionisation mass spectrometry. Environ. Chem. 2012, 9, 273–284. [Google Scholar] [CrossRef] [Green Version]
  16. Kitanovski, Z.; Grgić, I.; Vermeylen, R.; Claeys, M.; Maenhaut, W. Liquid chromatography tandem mass spectrometry method for characterization of monoaromatic nitro-compounds in atmospheric particulate matter. J. Chromatogr. A 2012, 1268, 35–43. [Google Scholar] [CrossRef]
  17. Kahnt, A.; Behrouzi, S.; Vermeylen, R.; Shalamzari, M.S.; Vercauteren, J.; Roekens, E.; Claeys, M.; Maenhaut, W. One-year study of nitro-organic compounds and their relation to wood burning in PM10 aerosol from a rural site in Belgium. Atmos. Environ. 2013, 81, 561–568. [Google Scholar] [CrossRef]
  18. Chow, K.S.; Huang, X.H.H.; Yu, J.Z. Quantification of nitroaromatic compounds in atmospheric fine particulate matter in Hong Kong over 3 years: Field measurement evidence for secondary formation derived from biomass burning emissions. Environ. Chem. 2016, 13, 665–673. [Google Scholar] [CrossRef] [Green Version]
  19. Wang, X.F.; Gu, R.R.; Wang, L.W.; Xu, W.X.; Zhang, Y.T.; Chen, B.; Li, W.J.; Xue, L.K.; Chen, J.M.; Wang, W.X. Emissions of fine particulate nitrated phenols from the burning of five common types of biomass. Environ. Pollut. 2017, 230, 405–412. [Google Scholar] [CrossRef]
  20. Pereira, K.L.; Hamilton, J.F.; Rickard, A.R.; Bloss, W.J.; Alam, M.S.; Camredon, M.; Ward, M.W.; Wyche, K.P.; Munoz, A.; Vera, T.; et al. Insights into the Formation and Evolution of Individual Compounds in the Particulate Phase during Aromatic Photo-Oxidation. Environ. Sci. Technol. 2015, 49, 13168–13178. [Google Scholar] [CrossRef] [Green Version]
  21. Yuan, B.; Liggio, J.; Wentzell, J.; Li, S.-M.; Stark, H.; Roberts, J.M.; Gilman, J.; Lerner, B.; Warneke, C.; Li, R. Secondary formation of nitrated phenols: Insights from observations during the Uintah Basin Winter Ozone Study (UBWOS) 2014. Atmos. Chem. Phys. 2016, 16, 2139–2153. [Google Scholar] [CrossRef] [Green Version]
  22. Frka, S.; Šala, M.; Kroflič, A.; Huš, M.; Čusak, A.; Grgić, I. Quantum Chemical Calculations Resolved Identification of Methylnitrocatechols in Atmospheric Aerosols. Environ. Sci. Technol. 2016, 50, 5526–5535. [Google Scholar] [CrossRef] [PubMed]
  23. Kroflič, A.; Huš, M.; Grilc, M.; Grgić, I. Underappreciated and Complex Role of Nitrous Acid in Aromatic Nitration under Mild Environmental Conditions: The Case of Activated Methoxyphenols. Environ. Sci. Technol. 2018, 52, 13756–13765. [Google Scholar] [CrossRef] [PubMed]
  24. Lim, Y.B.; Tan, Y.; Perri, M.J.; Seitzinger, S.P.; Turpin, B.J. Aqueous chemistry and its role in secondary organic aerosol (SOA) formation. Atmos. Chem. Phys. 2010, 10, 10521–10539. [Google Scholar] [CrossRef] [Green Version]
  25. Ervens, B.; Turpin, B.J.; Weber, R.J. Secondary organic aerosol formation in cloud droplets and aqueous particles (aqSOA): A review of laboratory, field and model studies. Atmos. Chem. Phys. 2011, 11, 11069–11102. [Google Scholar] [CrossRef] [Green Version]
  26. Iinuma, Y.; Boge, O.; Grafe, R.; Herrmann, H. Methyl-Nitrocatechols: Atmospheric Tracer Compounds for Biomass Burning Secondary Organic Aerosols. Environ. Sci. Technol. 2010, 44, 8453–8459. [Google Scholar] [CrossRef]
  27. Vidović, K.; Jurković, D.L.; Šala, M.; Kroflič, A.; Grgić, I. Nighttime Aqueous-Phase Formation of Nitrocatechols in the Atmospheric Condensed Phase. Environ. Sci. Technol. 2018, 52, 9722–9730. [Google Scholar] [CrossRef]
  28. Vidović, K.; Kroflič, A.; Jovanovič, P.; Šala, M.; Grgić, I. Electrochemistry as a Tool for Studies of Complex Reaction Mechanisms: The Case of the Atmospheric Aqueous-Phase Aging of Catechols. Environ. Sci. Technol. 2019, 53, 11195–11203. [Google Scholar] [CrossRef] [Green Version]
  29. Albinet, A.; Minero, C.; Vione, D. UVA irradiation induces direct phototransformation of 2, 4-dinitrophenol in surface water samples. Chemosphere 2010, 80, 759–763. [Google Scholar] [CrossRef]
  30. Zhao, S.F.; Ma, H.J.; Wang, M.; Cao, C.Q.; Xiong, J.; Xu, Y.S.; Yao, S.D. Study on the mechanism of photo-degradation of p-nitrophenol exposed to 254 nm UV light. J. Hazard. Mater. 2010, 180, 86–90. [Google Scholar] [CrossRef]
  31. Slade, J.H.; Knopf, D.A. Heterogeneous OH oxidation of biomass burning organic aerosol surrogate compounds: Assessment of volatilisation products and the role of OH concentration on the reactive uptake kinetics. Phys. Chem. Chem. Phys. 2013, 15, 5898–5915. [Google Scholar] [CrossRef] [PubMed]
  32. Zhao, R.; Lee, A.K.Y.; Huang, L.; Li, X.; Yang, F.; Abbatt, J.P.D. Photochemical processing of aqueous atmospheric brown carbon. Atmos. Chem. Phys. 2015, 15, 6087–6100. [Google Scholar] [CrossRef] [Green Version]
  33. Hems, R.F.; Abbatt, J.P.D. Aqueous Phase Photo-oxidation of Brown Carbon Nitrophenols: Reaction Kinetics, Mechanism, and Evolution of Light Absorption. ACS Earth Space Chem. 2018, 2, 225–234. [Google Scholar] [CrossRef]
  34. Palumbo, A.; Napolitano, A.; d’Ischia, M. Nitrocatechols versus nitrocatecholamines as novel competitive inhibitors of neuronal nitric oxide synthase: Lack of the aminoethyl side chain determines loss of tetrahydrobiopterin-antagonizing properties. Bioorg. Med. Chem. Lett. 2002, 12, 13–16. [Google Scholar] [CrossRef]
  35. Kitanovski, Z.; Grgić, I.; Yasmeen, F.; Claeys, M.; Čusak, A. Development of a liquid chromatographic method based on ultraviolet-visible and electrospray ionization mass spectrometric detection for the identification of nitrocatechols and related tracers in biomass burning atmospheric organic aerosol. Rapid Commun. Mass Spectrom. 2012, 26, 793–804. [Google Scholar] [CrossRef]
  36. Kitanovski, Z.; Čusak, A.; Grgić, I.; Claeys, M. Chemical characterization of the main products formed through aqueous-phase photonitration of guaiacol. Atmos. Meas. Tech. 2014, 7, 2457–2470. [Google Scholar] [CrossRef] [Green Version]
  37. Vione, D.; Maurino, V.; Minero, C.; Pelizzetti, E. Phenol photonitration upon UV irradiation of nitrite in aqueous solution I: Effects of oxygen and 2-propanol. Chemosphere 2001, 45, 893–902. [Google Scholar] [CrossRef]
  38. He, L.; Schaefer, T.; Otto, T.; Kroflič, A.; Herrmann, H. Kinetic and Theoretical Study of the Atmospheric Aqueous-Phase Reactions of OH Radicals with Methoxyphenolic Compounds. J. Phys. Chem. A 2019, 123, 7828–7838. [Google Scholar] [CrossRef]
  39. Kroflič, A.; Schaefer, T.; Huš, M.; Phuoc Le, H.; Otto, T.; Herrmann, H. OH radicals reactivity towards phenol-related pollutants in water: temperature dependence of the rate constants and novel insights into the [OH–phenol]˙ adduct formation. Phys. Chem. Chem. Phys. 2020, 22, 1324–1332. [Google Scholar] [CrossRef]
  40. Nakayama, T.; Sato, K.; Matsumi, Y.; Imamura, T.; Yamazaki, A.; Uchiyama, A. Wavelength and NOx dependent complex refractive index of SOAs generated from the photooxidation of toluene. Atmos. Chem. Phys. 2013, 13, 531–545. [Google Scholar] [CrossRef] [Green Version]
  41. Li, Y.J.; Huang, D.D.; Cheung, H.Y.; Lee, A.K.Y.; Chan, C.K. Aqueous-phase photochemical oxidation and direct photolysis of vanillin—A model compound of methoxy phenols from biomass burning. Atmos. Chem. Phys. 2014, 14, 2871–2885. [Google Scholar] [CrossRef] [Green Version]
  42. Bluvshtein, N.; Lin, P.; Flores, J.M.; Segev, L.; Mazar, Y.; Tas, E.; Snider, G.; Weagle, C.; Brown, S.S.; Laskin, A.; et al. Broadband optical properties of biomass-burning aerosol and identification of brown carbon chromophores. J. Geophys. Res. Atmos. 2017, 122, 5441–5456. [Google Scholar] [CrossRef]
  43. Liu, J.M.; Lin, P.; Laskin, A.; Laskin, J.; Kathmann, S.M.; Wise, M.; Caylor, R.; Imholt, F.; Selimovic, V.; Shilling, J.E. Optical properties and aging of light-absorbing secondary organic aerosol. Atmos. Chem. Phys. 2016, 16, 12815–12827. [Google Scholar] [CrossRef] [Green Version]
  44. Lin, P.; Liu, J.M.; Shilling, J.E.; Kathmann, S.M.; Laskin, J.; Laskin, A. Molecular characterization of brown carbon (BrC) chromophores in secondary organic aerosol generated from photo-oxidation of toluene. Phys. Chem. Chem. Phys. 2015, 17, 23312–23325. [Google Scholar] [CrossRef]
  45. Jiang, H.H.; Frie, A.L.; Lavi, A.; Chen, J.Y.; Zhang, H.F.; Bahreini, R.; Lin, Y.H. Brown Carbon Formation from Nighttime Chemistry of Unsaturated Heterocyclic Volatile Organic Compounds. Environ. Sci. Technol. Lett. 2019, 6, 184–190. [Google Scholar] [CrossRef]
  46. Hoffer, A.; Gelencser, A.; Guyon, P.; Kiss, G.; Schmid, O.; Frank, G.P.; Artaxo, P.; Andreae, M.O. Optical properties of humic-like substances (HULIS) in biomass-burning aerosols. Atmos. Chem. Phys. 2006, 6, 3563–3570. [Google Scholar] [CrossRef] [Green Version]
  47. Lack, D.A.; Richardson, M.S.; Law, D.; Langridge, J.M.; Cappa, C.D.; McLaughlin, R.J.; Murphy, D.M. Aircraft Instrument for Comprehensive Characterization of Aerosol Optical Properties, Part 2: Black and Brown Carbon Absorption and Absorption Enhancement Measured with Photo Acoustic Spectroscopy. Aerosol Sci. Technol. 2012, 46, 555–568. [Google Scholar] [CrossRef]
Figure 1. 3-methylcatechol (3MC) degradation in aqueous solution at 0.1 mM initial concentrations of 3MC and NaNO2 (pH = 3.9, T = 25 °C). Experimental data (symbols) and calculated time-dependent concentration profiles (lines) for the pseudo-first order (kapp) and second order (k2nd) kinetics.
Atmosphere 11 00131 g001
Figure 2. 3-methylcatechol (3MC) degradation in aqueous solution at different initial concentrations of NaNO2 (pH = 4.5–5, T = 25 °C). The concentrations of NaNO2 were 0.5 (a), 1.0 (b), 2.0 (c), and 5.0 mM (d). Experimental data (symbols) and calculated time-dependent concentration profiles (lines) for the pseudo-first order (kapp) and global second order (k2nd (global)) fits.
Atmosphere 11 00131 g002
Figure 3. Absorption spectra of the reaction mixture during the photolysis of 3-methylcatechol (3MC) in aqueous NaNO2 solutions (pH = 4–5, T = 25 °C) at different initial concentrations of NaNO2. The concentration of 3MC was always 0.1 mM, while the concentrations of NaNO2 were 0 (a), 0.1 (b), 0.5 (c), 1 (d), 2 (e), and 5 mM (f). The discontinuation in the absorption spectra (d,f) is due to the issues with the instrument and does not affect the results in any way.
Atmosphere 11 00131 g003
Figure 4. Brown carbon (BrC) formation in 0.1 mM 3-methylcatechol and 0.1 mM NaNO2 under sunlight conditions. Experimentally measured (symbols) and modeled absorbance (solid lines) at different wavelengths representative of BrC.
Atmosphere 11 00131 g004
Figure 5. Chromatogram recorded at 388 nm for the reaction mixture of 0.1 mM 3MC and 1 mM NaNO2 under sunlight conditions is comparable to the one from our previous study [28]. The peak at 2.5 min with the m/z ratio of 183 corresponds to 3MC5NC-OH, while the peak at 4.5 min with the m/z of 184 corresponds to oxidative cleavage products of 3M4NC.
Atmosphere 11 00131 g005
Figure 6. BrC formation in the reaction mixture of 0.1 mM 3-methylcatechol and (a) 0.5, (b) 1, (c) 2, and (d) 5 mM NaNO2 under sunlight conditions. Experimentally measured (symbols) and modelled absorbance (solid lines) at different wavelengths, representative of BrC are shown.
Atmosphere 11 00131 g006
Figure 7. BrC formation in the reaction mixture of 0.1 mM 3-methylcatechol and 2 mM NaNO2 in the dark. Experimentally measured (symbols) and modelled absorbance (solid lines) at different wavelengths, representative of BrC are shown.
Atmosphere 11 00131 g007
Table 1. Ratios and yields of quantified 3-methyl-5-nitrocatchol (3M5NC) and 3-methyl-4-nitrocatechol (3M4NC) at different NaNO2 concentrations under sunlight conditions after 8 h of reaction.
Experiment3MC [mM]NaNO2 [mM]3M5NC/3M4NCpHMNC Product Yield after 8 h
10.10.153.90.17
20.10.564.50.45
30.11.0964.60.40
40.12.0984.90.36
50.15.06350.27
Table 2. Kinetic rate constants (apparent pseudo-first-order, kapp; second-order, k2nd; and global second-order, k2nd(global)) of the photolysis of 3-methylcatechol (3MC) in aqueous solution (pH = 4.5–5, T = 25 °C) at different initial concentrations of NaNO2 under simulated sunlight conditions (YES) and in the dark (NO). The initial concentration of 3MC was always 0.1 mM.
ExperimentNaNO2 [mM]Sunlightkapp (s−1)k2nd (M−1s−1)k2nd(global) (M−1·s−1)
10.1YES7.88 × 10−60.168
20.5YES4.47 × 10−50.0890.075
31.0YES7.30 × 10−50.073
42.0YES1.30 × 10−40.065
55.0YES2.40 × 10−40.048
61.0NO4.26 × 10−50.0430.032
72.0NO5.03 × 10−50.025
Table 3. Wavelength-dependent mass absorption coefficients (MAC350, MAC400, and MAC410) for BrC formation during the photolysis of 3-methylcatechol in aqueous NaNO2 solutions (pH 4–5, T = 25 °C) at different initial concentrations of NaNO2 under simulated sunlight (YES) and in the dark (NO). The concentration of 3MC was always 0.1 mM.
ExperimentNaNO2 (mM)SunlightMACBrC(350nm) (m2/g)MACBrC(400nm) (m2/g)MACBrC(400nm) (m2/g)
10.1YES1.800.870.43
20.5YES3.101.260.94
31YES3.441.341.02
42YES3.771.541.17
55YES4.091.741.42
61NO5.411.731.75
72NO5.631.901.38

