1. Introduction
Water supply and its effective management is a global challenge, affecting a nations’ ability to achieve sustainable development [
1]. Water is essential for human well-being [
2], but less than one percent of freshwater is easily available for human use. Moreover, owing to the interwoven complexities of human-induced climate change, population growth, urbanization and socio-economic development, freshwater resources have become increasingly scarce as a result of proportional and distributional access [
1]. Global freshwater challenges potentially destabilize a country’s economy, and pose a risk to public health, poverty reduction efforts, food security, industrial development, political systems and ecosystem services [
3,
4,
5].
As a developing region, Caribbean Small Island Developing States (SIDS) have largely been considered as vulnerable to climate change owing to the impacts of sea level rise and increasing temperatures which lead to increasing disaster occurrences and water shortages in the region [
6]. While these remain constant concerns for the Caribbean, the impact of climate change is far-reaching for small islands’ economies, lifestyles, activities, practices, and operational cycles [
7]. Because of this, important sectors for the Caribbean including tourism, agriculture, water supply and energy, among others are often severely threatened by climate-induced impacts [
7,
8]. More specifically, the water resources of the Caribbean SIDS are not only impacted by the complexities of climate change [
9], but their availability is further influenced by population growth, urbanization, and socio-economic development [
1]. Considering all the interlinkages, complexities and challenges of water management, this study addresses domestic water supply vulnerability and risk in Caribbean SIDS, focussing particularly on Kingston, Jamaica, and explores the social and technical potential of alternative water sources as a means to augment domestic water supplies to enhance resilience and diversity of water supply. In particular, within the context of at-risk SIDS, this research investigates the potential of rainwater harvesting in an urban context which presents a dynamic that is not practiced on a large-scale or researched in some Caribbean islands.
As the population of Caribbean SIDS continues to increase, water planners and national authorities need to improve water supply services to meet the growing demands of expanding urban centres [
10]. Technical measures including leak detection, metering, and local alternative water sources have played a role in augmenting conventional water supplies [
11]. In terms of alternative water sources, rainwater harvesting (RWH) in Grenada, and solar-powered desalination in Antigua and Barbuda [
10] have been adopted. However, the options are utilized at varying degrees and are implemented at different levels based on a country’s water resources availability, accessibility, costs, and water governance [
10,
12,
13].
In Jamaica, piped water is the main source of drinking water for all regions, with Kingston and St. Andrew (KSA) having 95% access through in-house connections, yard connections and standpipes [
14]. In extended dry or drought periods, the challenge of water supply is prevalent in Kingston. This situation is compounded by other issues including high levels of non-revenue water, high energy consumption, poor infrastructure, inadequate storage capacities, financial constraints, and water pollution [
15]. Other factors include the limited implementation of strategies to manage available water surplus in the wet seasons in an effort to ensure adequate supply to meet water demand in the dry seasons [
12].
This research focuses on the climate vulnerability of domestic water supply systems that serve the Kingston Basin, Jamaica, and assesses the potential of decentralized RWH for non-potable uses within households. It also explores the policy measures in place to support an integrated scheme with Kingston’s conventional water supply system as a general demand management measure. The work therefore contributes new information for decentralised RWH planning in Kingston considering current and potential future conditions, including the influence of climate change. Particularly important is the local level of the study. Rather than drawing generalised conclusions from a national or regional level study, this research is local to the Kingston Basin, offering specifically relevant knowledge. Suggestions towards a more robust water supply system in Kingston can thus be formulated with this new information.
2. Study Area
Jamaica (
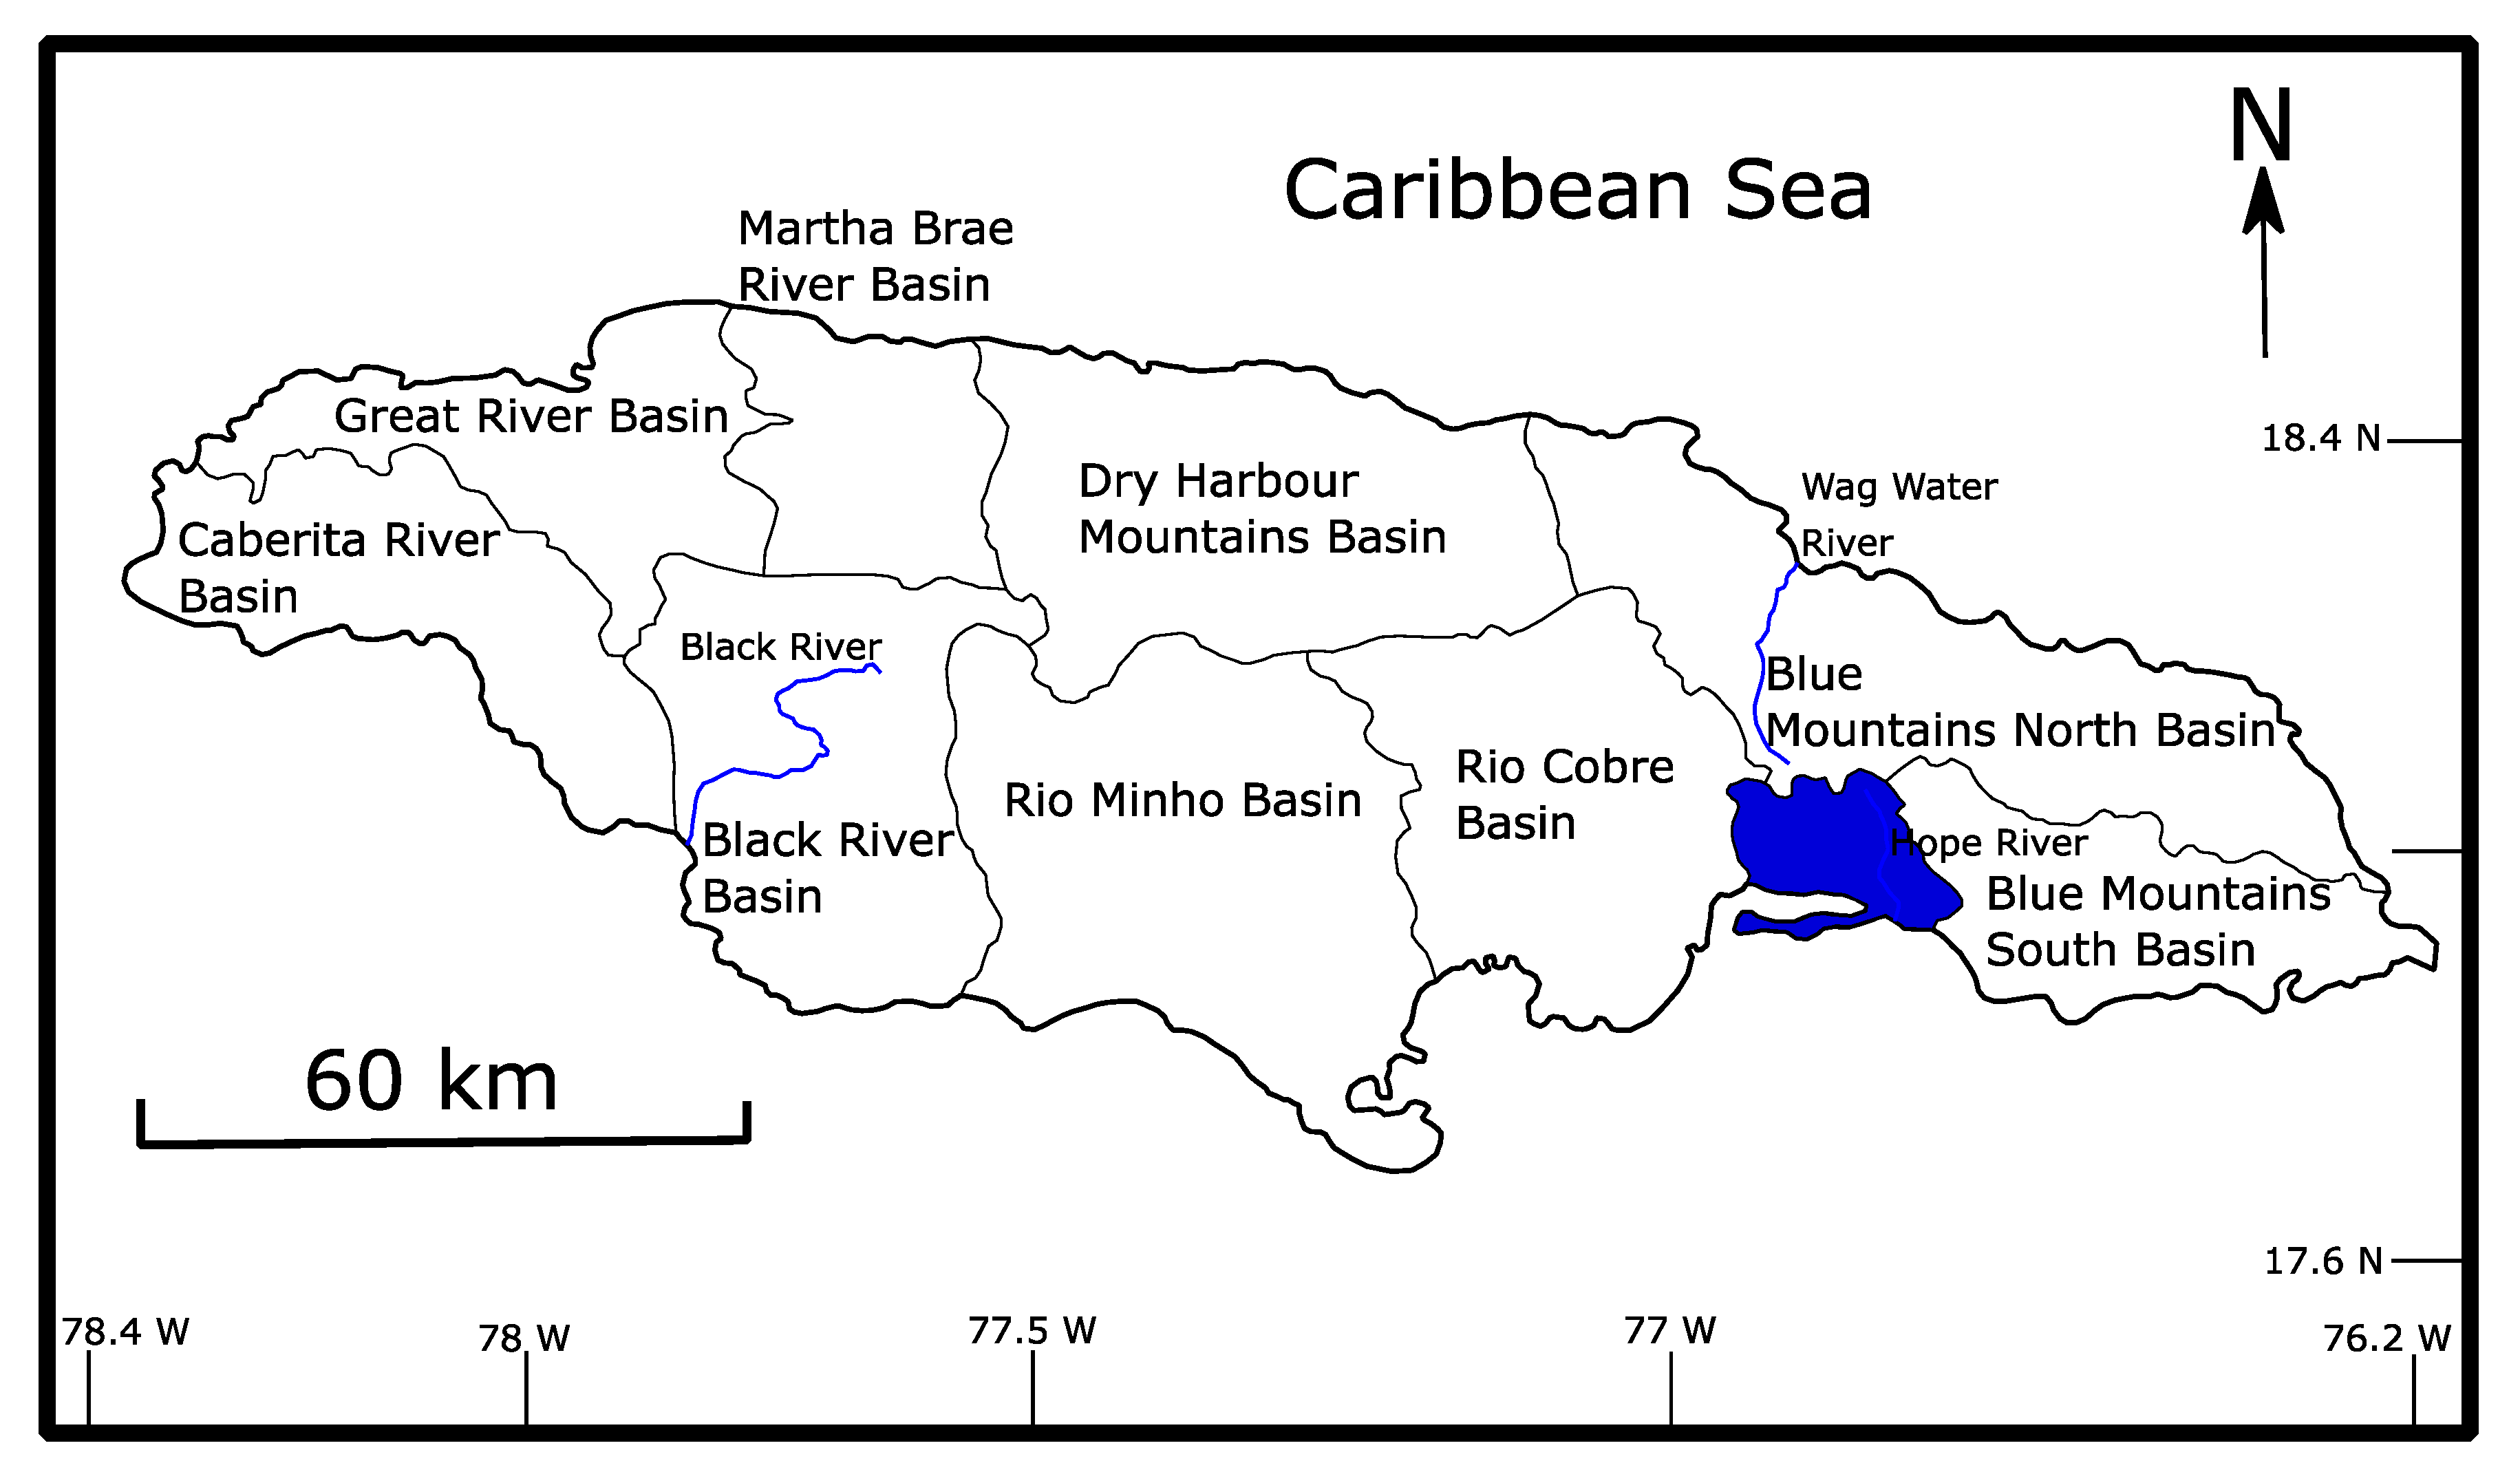
Figure 1) is characterised by a tropical climate with warm temperatures and humid conditions year-round. On average, Jamaica receives about 2000 mm of rain annually, however due to an uneven spatial rainfall distribution, the Kingston Basin (
Figure 1) receives approximately 760 mm yr
−1, making it a relatively water scarce area [
16,
17]. The island has a bimodal rainfall pattern with the primary rainfall season beginning in October and a secondary rainfall season in May. Approximately 25% of Jamaica’s population lives in KSA [
18] representing the largest urban area on the island.
The Kingston Basin is one of 10 hydrological basins in Jamaica, and is situated in the southeastern part of the island [
16] (
Figure 1). In this study, the assessment of domestic water supply vulnerability to potential climate change impacts and the quantification of alternative water resources for meeting household water demand was investigated within the urban center of Kingston, which is the political, cultural and financial hub of Jamaica [
14,
19]. The specific communities considered in this study were Mona and August Town, both of which are served by the Hope Water Supply System. According to [
18], the number of households in the communities were 1891 and 1902 in Mona and August Town respectively.
Seventy-five percent of KSA water supply is obtained from surface water sources. The main river sources are the Morsham, Wag Water, and Hope Rivers. In addition, a significant amount of raw water is abstracted from the rural parishes of St. Thomas (from the Yallah’s and Negro Rivers) as well as from St. Catherine (from the Rio Cobre River) as part of an inter-basin transfer scheme to augment supplies to KSA [
14]. The overall Kingston and St. Andrew Water Supply System is divided into twelve ‘water demand zones’, named from the water supply sub-system that serves the communities located within the borders for domestic and commercial uses [
14]. The population in the Hope Demand Zone, serving both Mona and August Town, represents approximately 7% of the population in the parish [
14].
3. Data and Methodology
This research used quantitative and qualitative analytical methods to process and analyze data. The methods of analysis utilized include:
Data on current potable water production;
Time series (multiple) regression analysis and climate forecasting of streamflow and rainfall data;
Rooftop and rainfall analysis and QGIS application to determine harvestable rainfall potentials;
Statistical analysis of data from household surveys;
Content evaluation of water, housing and climate change policies in Kingston.
3.1. Current Potable Water Production
About 75% of KSA water supply is from surface water resources, with the Mona and Hope systems providing most of this (system design capacities are 60,500 and 30,200 m
3 d
−1 respectively). Between 2010 and 2019, average monthly water production for KSA was c. 6 Mm
3. Over this period, non-revenue water (NRW) has exceeded billed water volumes, with NRW values at about 57% [
14]. A large proportion of citizens are supplied with improved water supply (95%, including piped connections, wells, and standpipes).
3.2. Quantification of Water Supply Sources and Vulnerability to Climate Change
From the secondary data obtained from local sources in Kingston, historical precipitation data were obtained for the Kingston Basin for 1970–2018 with a monthly resolution from ground-based observations. Specifically, based on the water systems in the Kingston Basin, the Hope Demand Zone was selected and streamflow data for the Hope River supplying the water system were obtained (also at monthly resolution) to establish a relationship between rainfall and streamflow in the study area. Using time series regression analysis and regional climate forecasting from the Caribbean Community Climate Change Centre (5C) Regional database (
http://clearinghouse.caribbeanclimate.bz/), the impact of climate change on water supply in 2030 and 2050 was assessed. The 5C is the overarching body for regional climate action and policy in the Caribbean [
20], and provides up to date, Caribbean-specific climate data and forecasting. The data are provided at 25 km spatial resolution. Downscaling techniques have been employed using regional climate models (RCM) for the Caribbean from the Hadley Centre HadRM3P model, which is the RCM within the Providing Regional Climates for Impacts Studies (PRECIS) model that has delivered RCM derived future climates for the Caribbean region [
7,
21].
3.2.1. Time Series Multiple Regression Rainfall-Runoff Model and Climate Impact Assessment
Using multiple linear regression analysis, the “Rainru” spreadsheet-based model (developed at IHE Delft by HHG Savenije and M de Groen, and updated by P van der Zaag) was developed for water resource management. This model was used to determine the correlation between rainfall and runoff in the Kingston Basin for the years 1999–2018 (the historical rainfall record was truncated to match the period in the runoff record). The derived model equation was used to forecast streamflow from future rainfall estimations projected under two Representative Concentration Pathways (RCPs 2.6 and 8.5; [
22]) for 2030 and 2050 obtained from the 5C precipitation dataset. It was assumed that the relationship described by the model for historic conditions does not change over time (i.e., assumed hydrological stationarity). The rainfall-runoff model equation is
where
Qt = modelled runoff in month
t (mm month
−1),
a = constant (mm month−1),
m = memory of the model, i.e., the number of months that the rainfall-runoff model takes into account for each month (month),
bi = best fit/correlation values for the ith month before month t (−),
Pt−i = observed precipitation in month t − i (mm month−1),
D = interception threshold constant determined by trial and error (mm month−1).
3.2.2. Quantification of Rainwater Harvesting Potential and Feasibility
Using QGIS (
qgis.org/en/site/) and OpenStreetMap (
www.openstreetmap.org), building footprint data were obtained for two socially different communities (i.e., Mona and August Town Communities). The rooftop areas were calculated in QGIS and an approximation made for the average potential rainfall that could be harvested in the baseline using historical data. This was estimated again for the short- and long-term futures (2030 and 2050) using future rainfall estimates from the 5C dataset.
3.2.3. Rooftop Analysis
Using historical rainfall data, monthly means were determined and an appropriate rooftop runoff coefficients (
Table 1) determined [
23,
24].
To calculate the maximum potential RWH (m
3 month
−1) for the baseline period and the future (2030 and 2050), the following equation was applied, where
A represents rooftop area (m
2),
P represents monthly mean rainfall (mm) and
C represents the rooftop runoff coefficient (-) [
23,
24].
The overall rainwater harvesting potential was multiplied by an uptake fraction which was determined based on the willingness of respondents in the survey to adopt the practice of rainwater harvesting.
3.3. Household Survey: Knowledge, Attitudes, and Practices Assessment
Using household surveys in the two communities, a knowledge attitudes and practice assessment in the form of a questionnaire was administered. The survey was administered face to face in August Town and via an online Google Form in Mona due to face to face participation and home access issues (e.g., gates and security). By using the Google form, data collection was not hampered, and a good level of response was obtained. The same questions were asked in both communities. Information on water use in 100 households across all socio-economic groups was acquired. The knowledge and perception of homeowners to practice rainwater harvesting for non- potable household uses and the quantity required for rainwater storage was assessed.
4. Results
4.1. Hydrological Trends and Variability
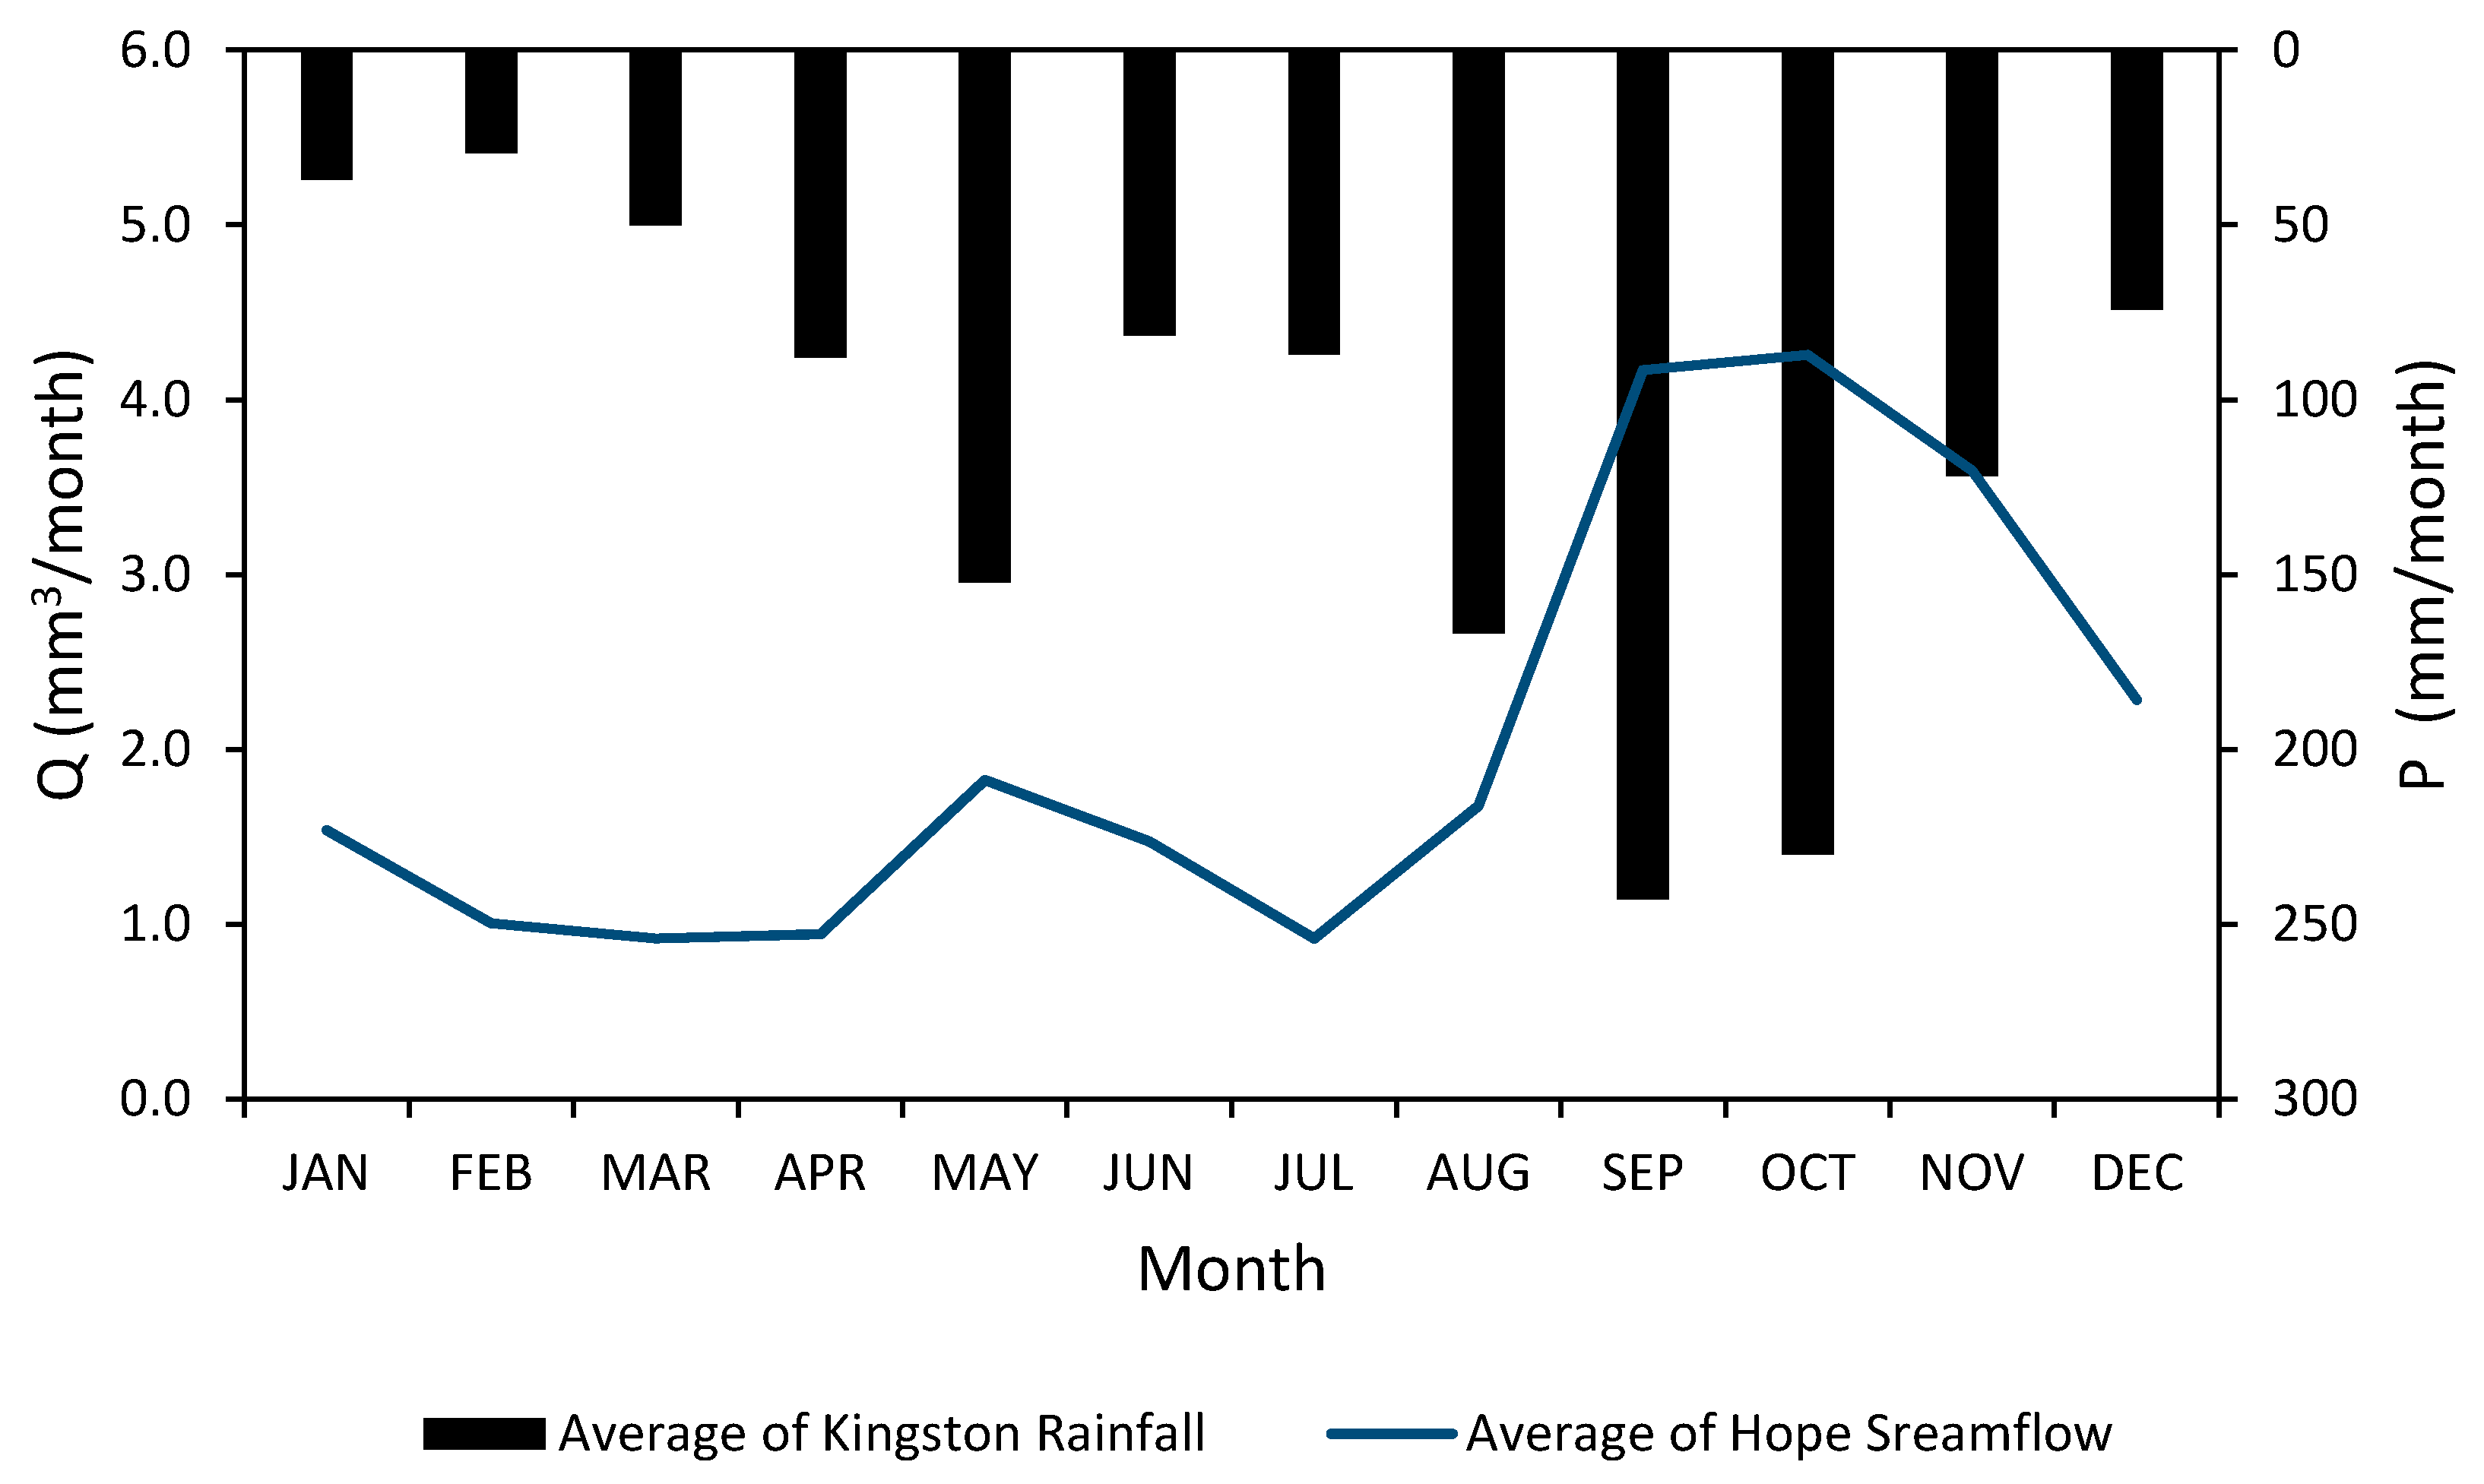
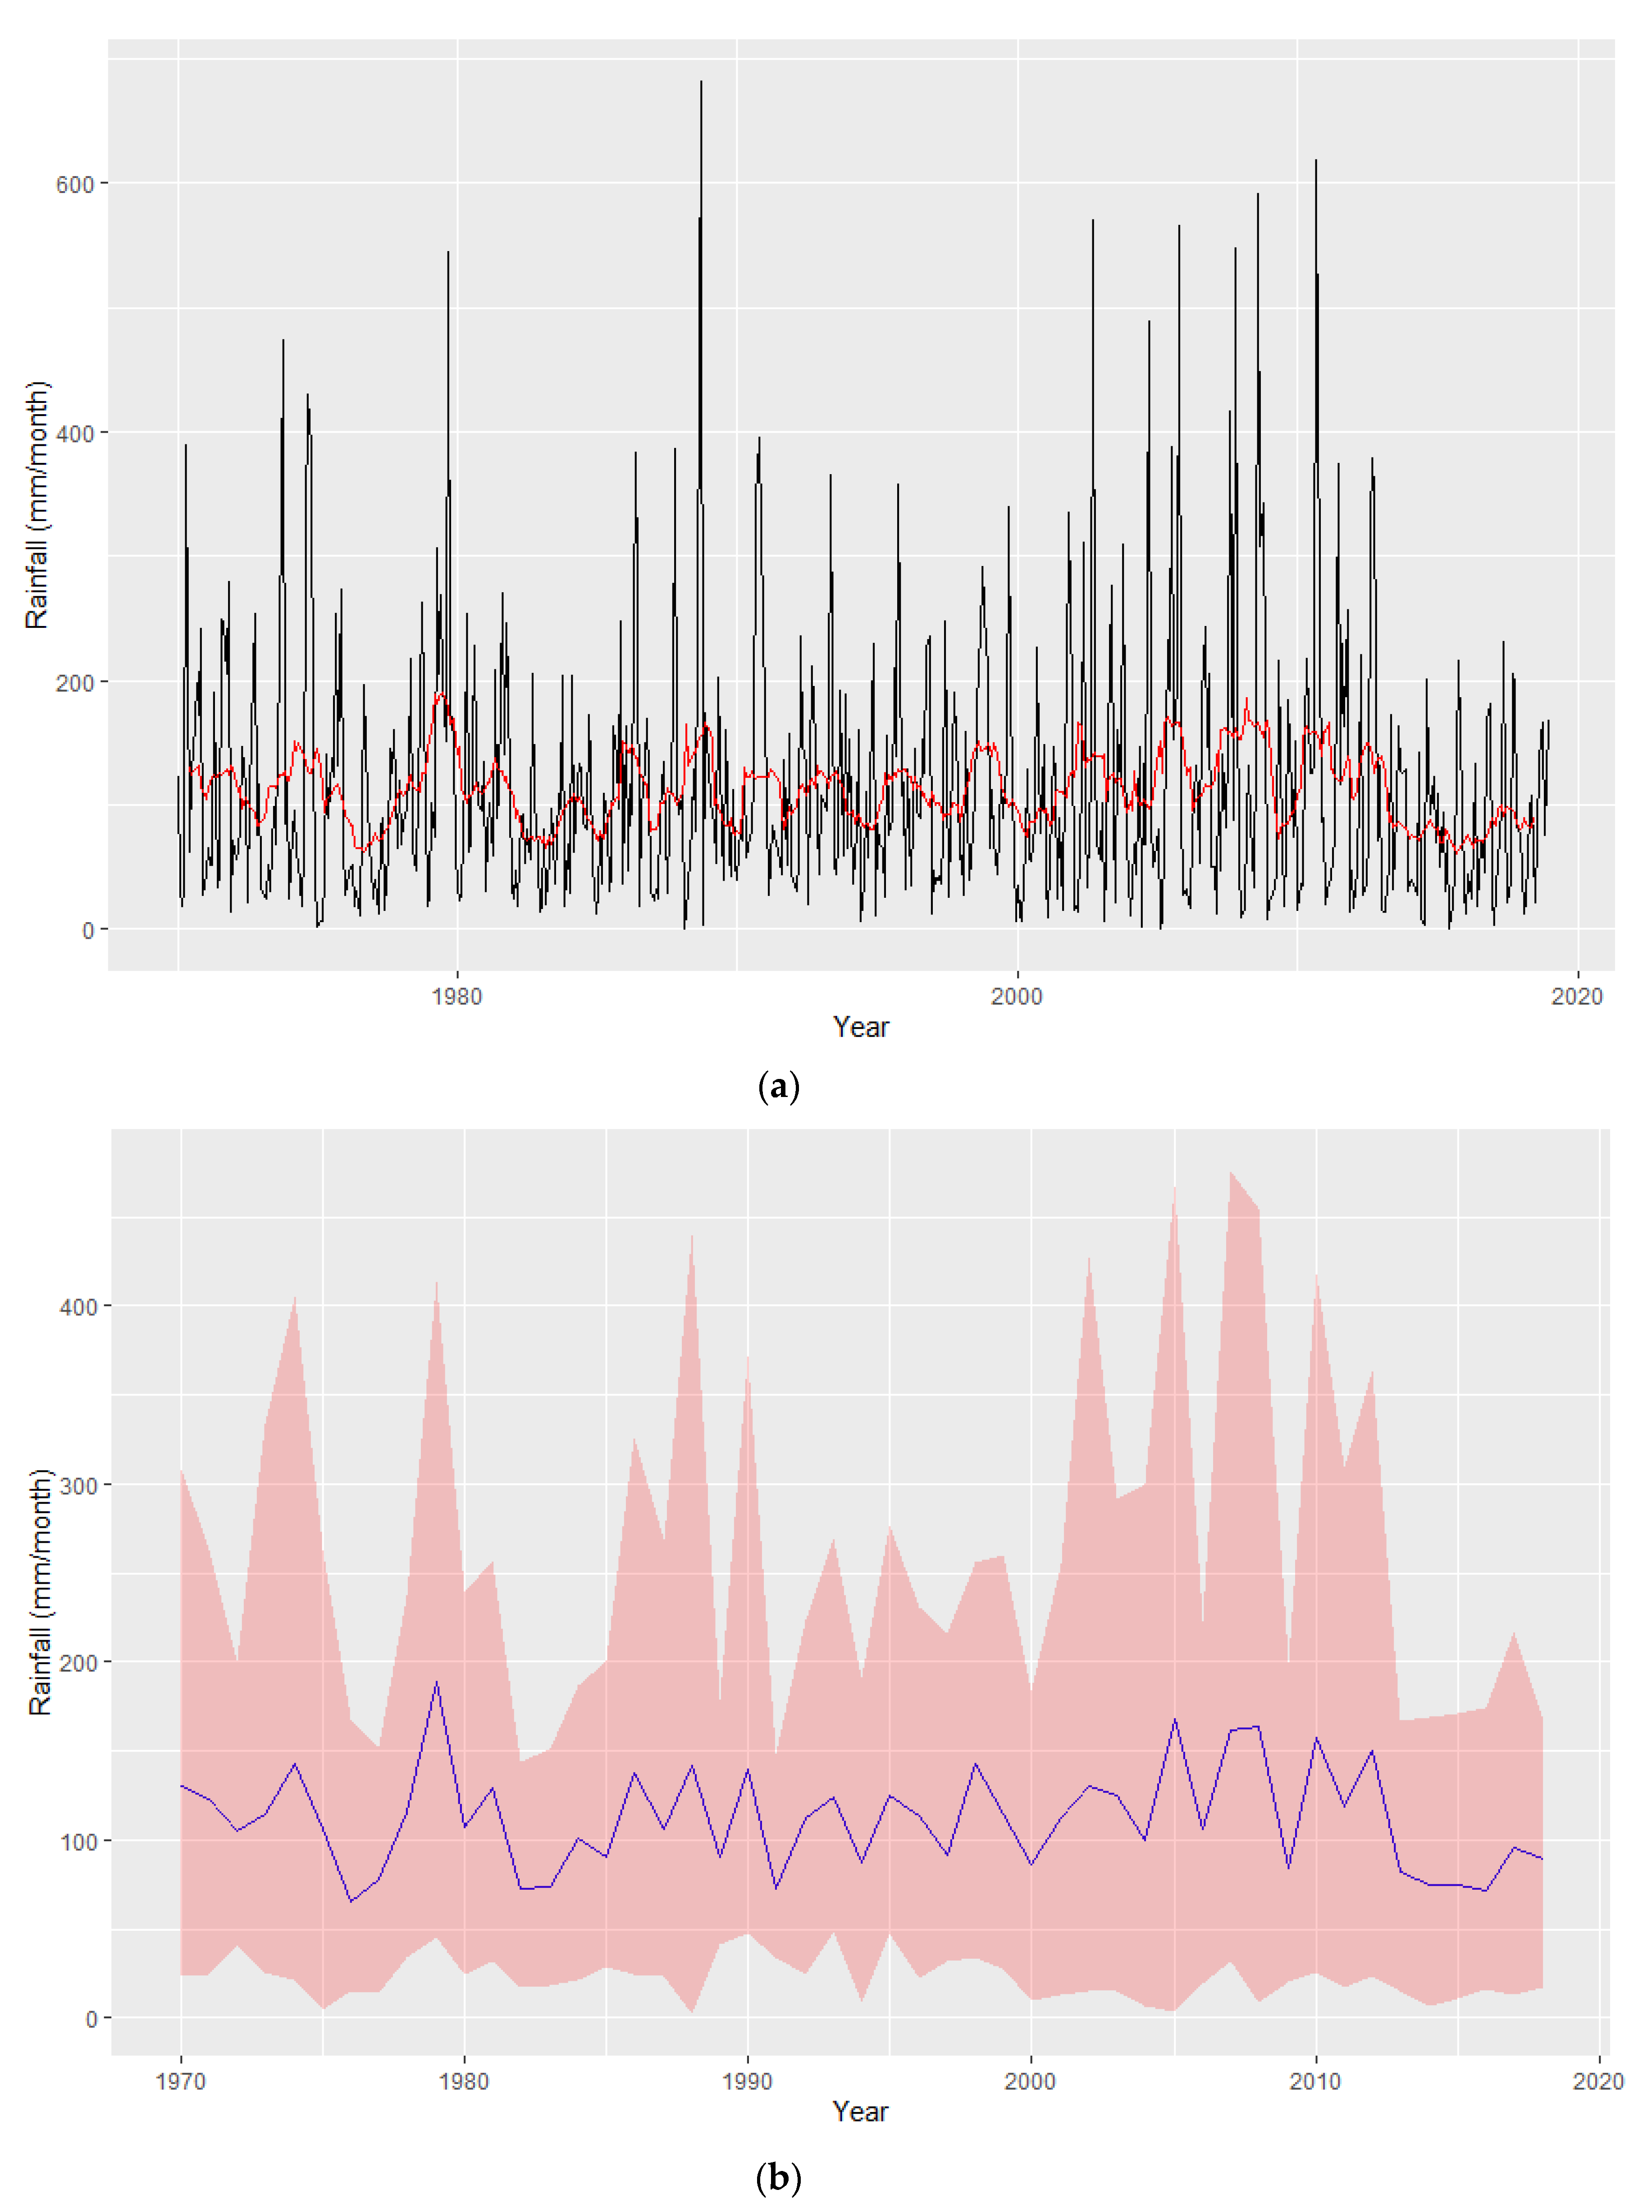
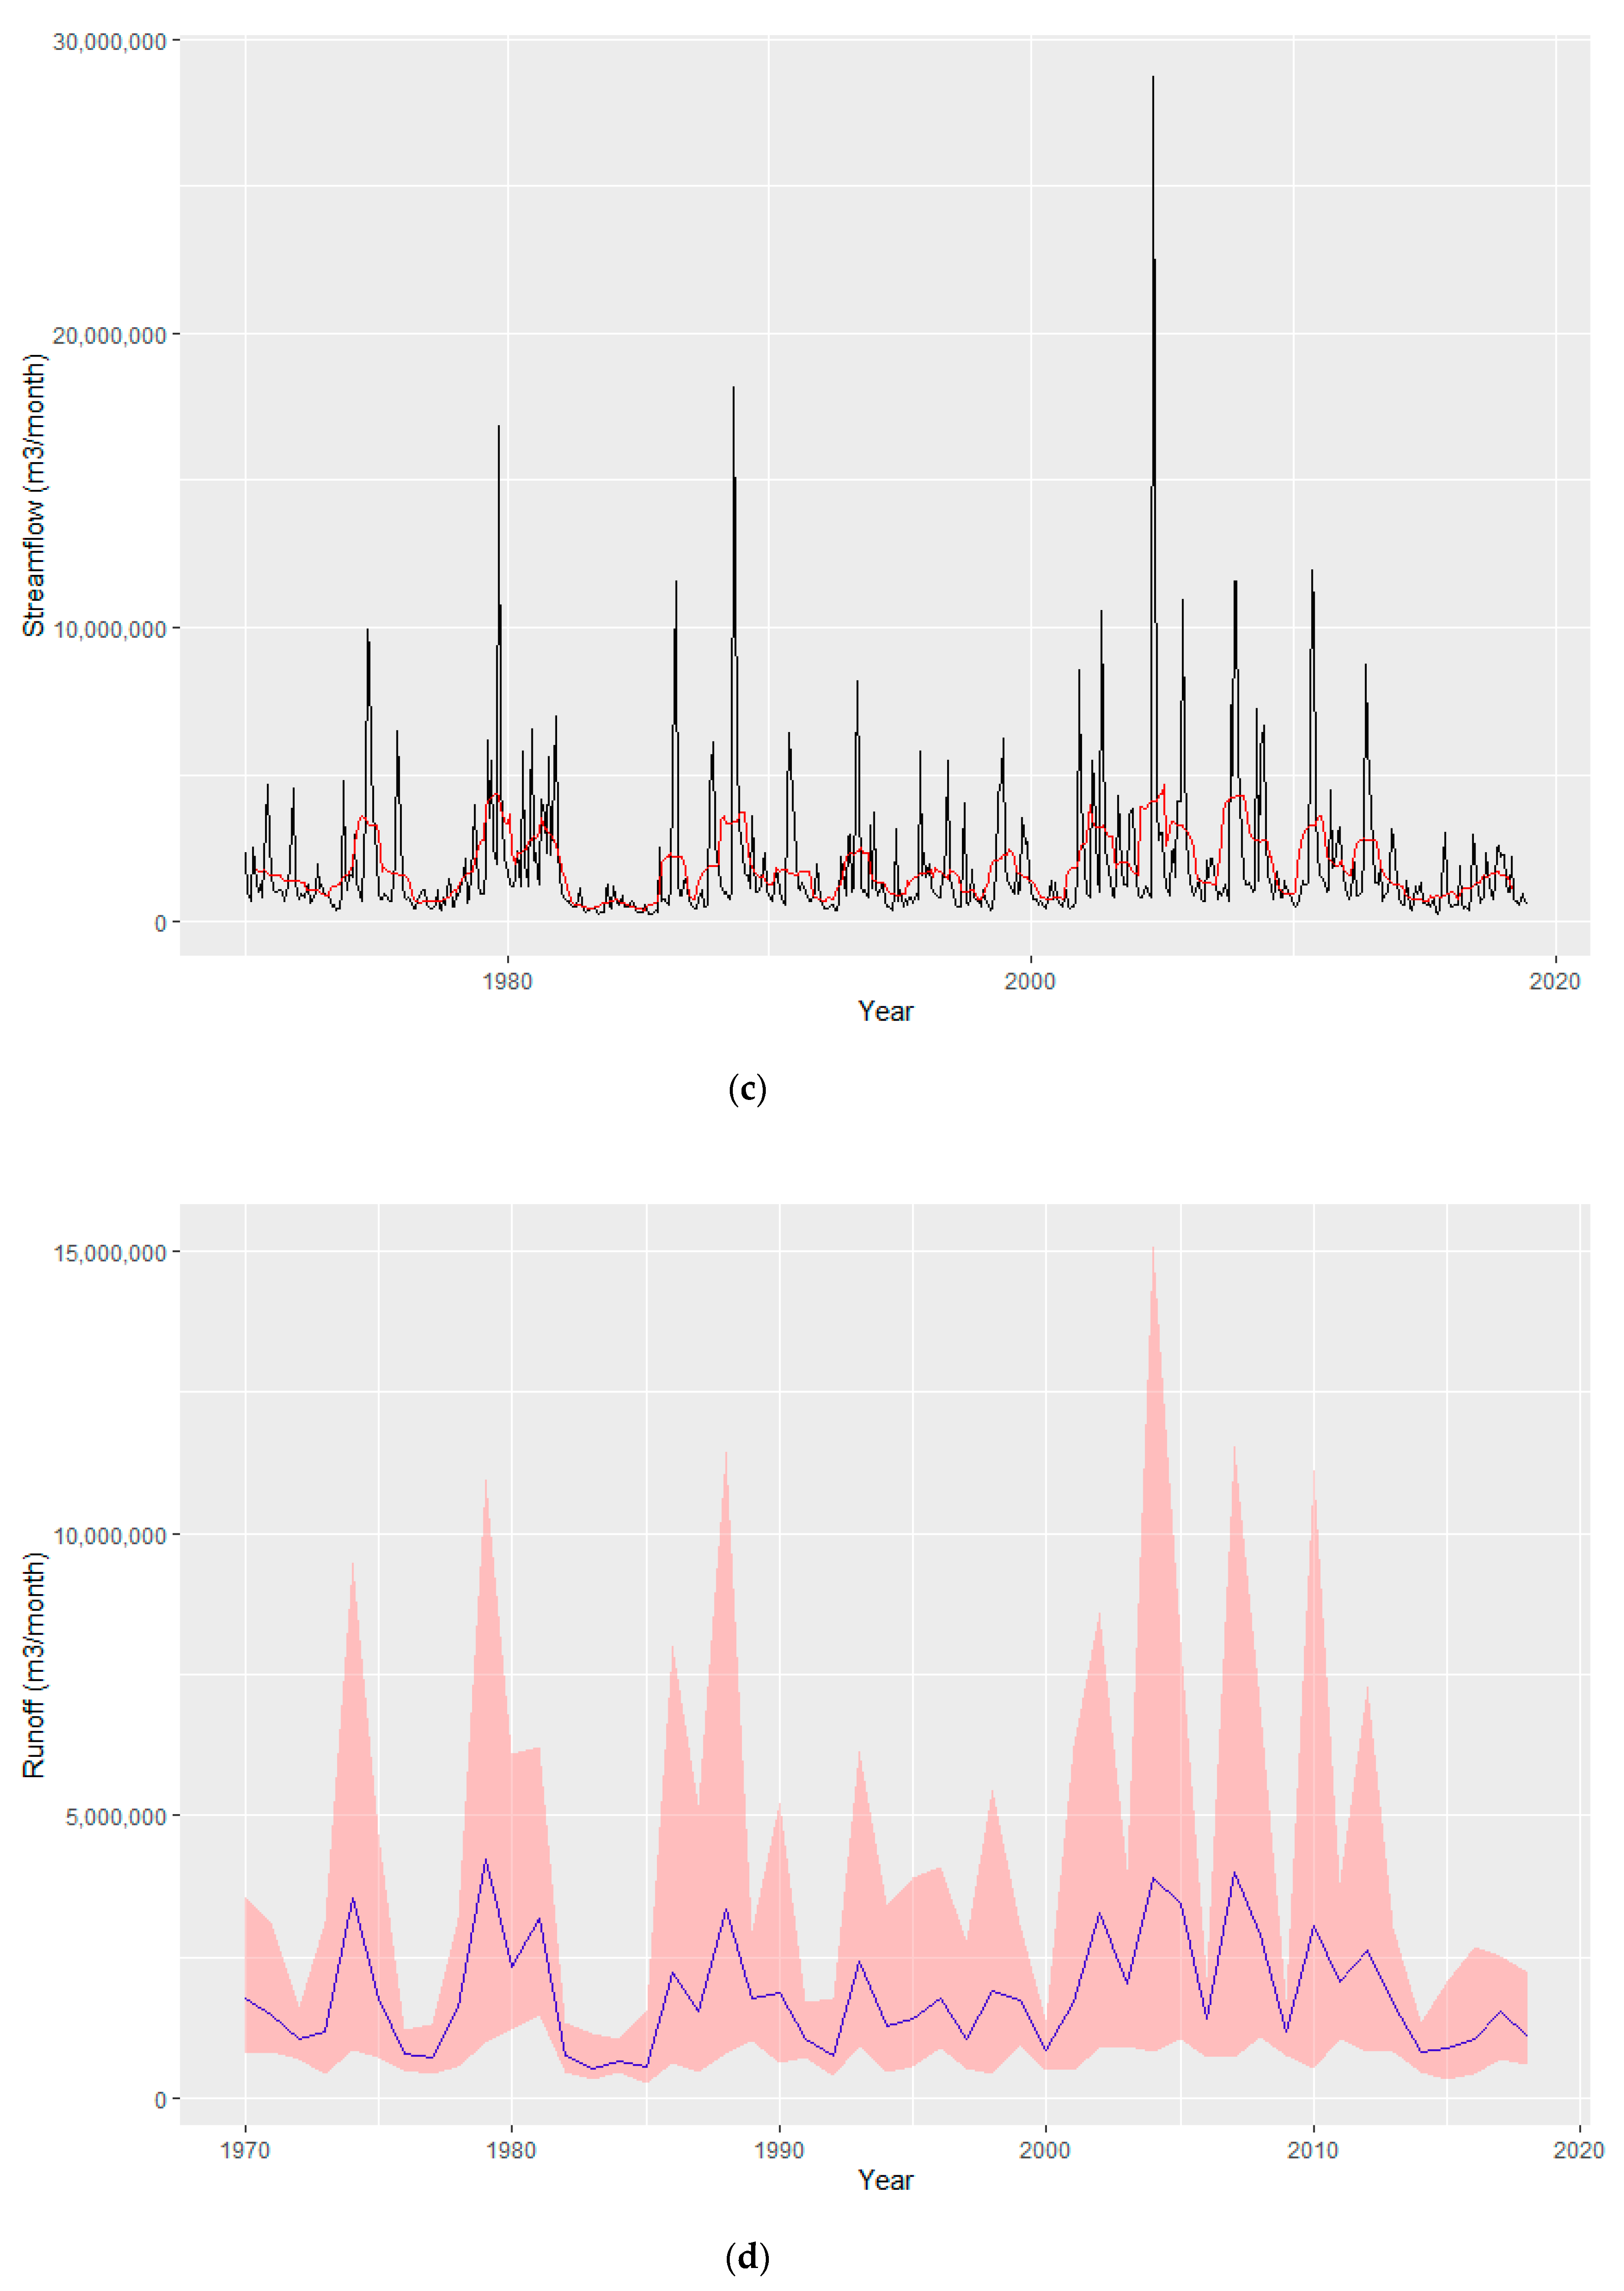
The monthly precipitation data for Kingston and the daily stream flow data for the Hope River were analysed in the entire Hope Demand Zone (including Mona and August Town).
Figure 2 shows the historical rainfall trends as well as the monthly hydrological variability during the period 1999–2018.
The average annual rainfall in the Hope Demand Zone was 1360 mm. The average monthly rainfall derived from the 19-year period closely resembles the general rainfall patterns for Jamaica, showing the primary and secondary wet seasons. The months with the lowest average rainfall were January (37 mm) and February (29 mm) while September received the highest rainfall with 242 mm followed by October with 230 mm. There is a decline in precipitation from October through to January. Rainfall then increases from January to May with 152 mm of rainfall, which is representative of the secondary wet season. The average annual streamflow of the Hope River was 25.2 Mm
3/year. Over the historical period (1970–2018), both rainfall and streamflow show high variability (
Figure 3).
4.2. Rainfall-Runoff Model
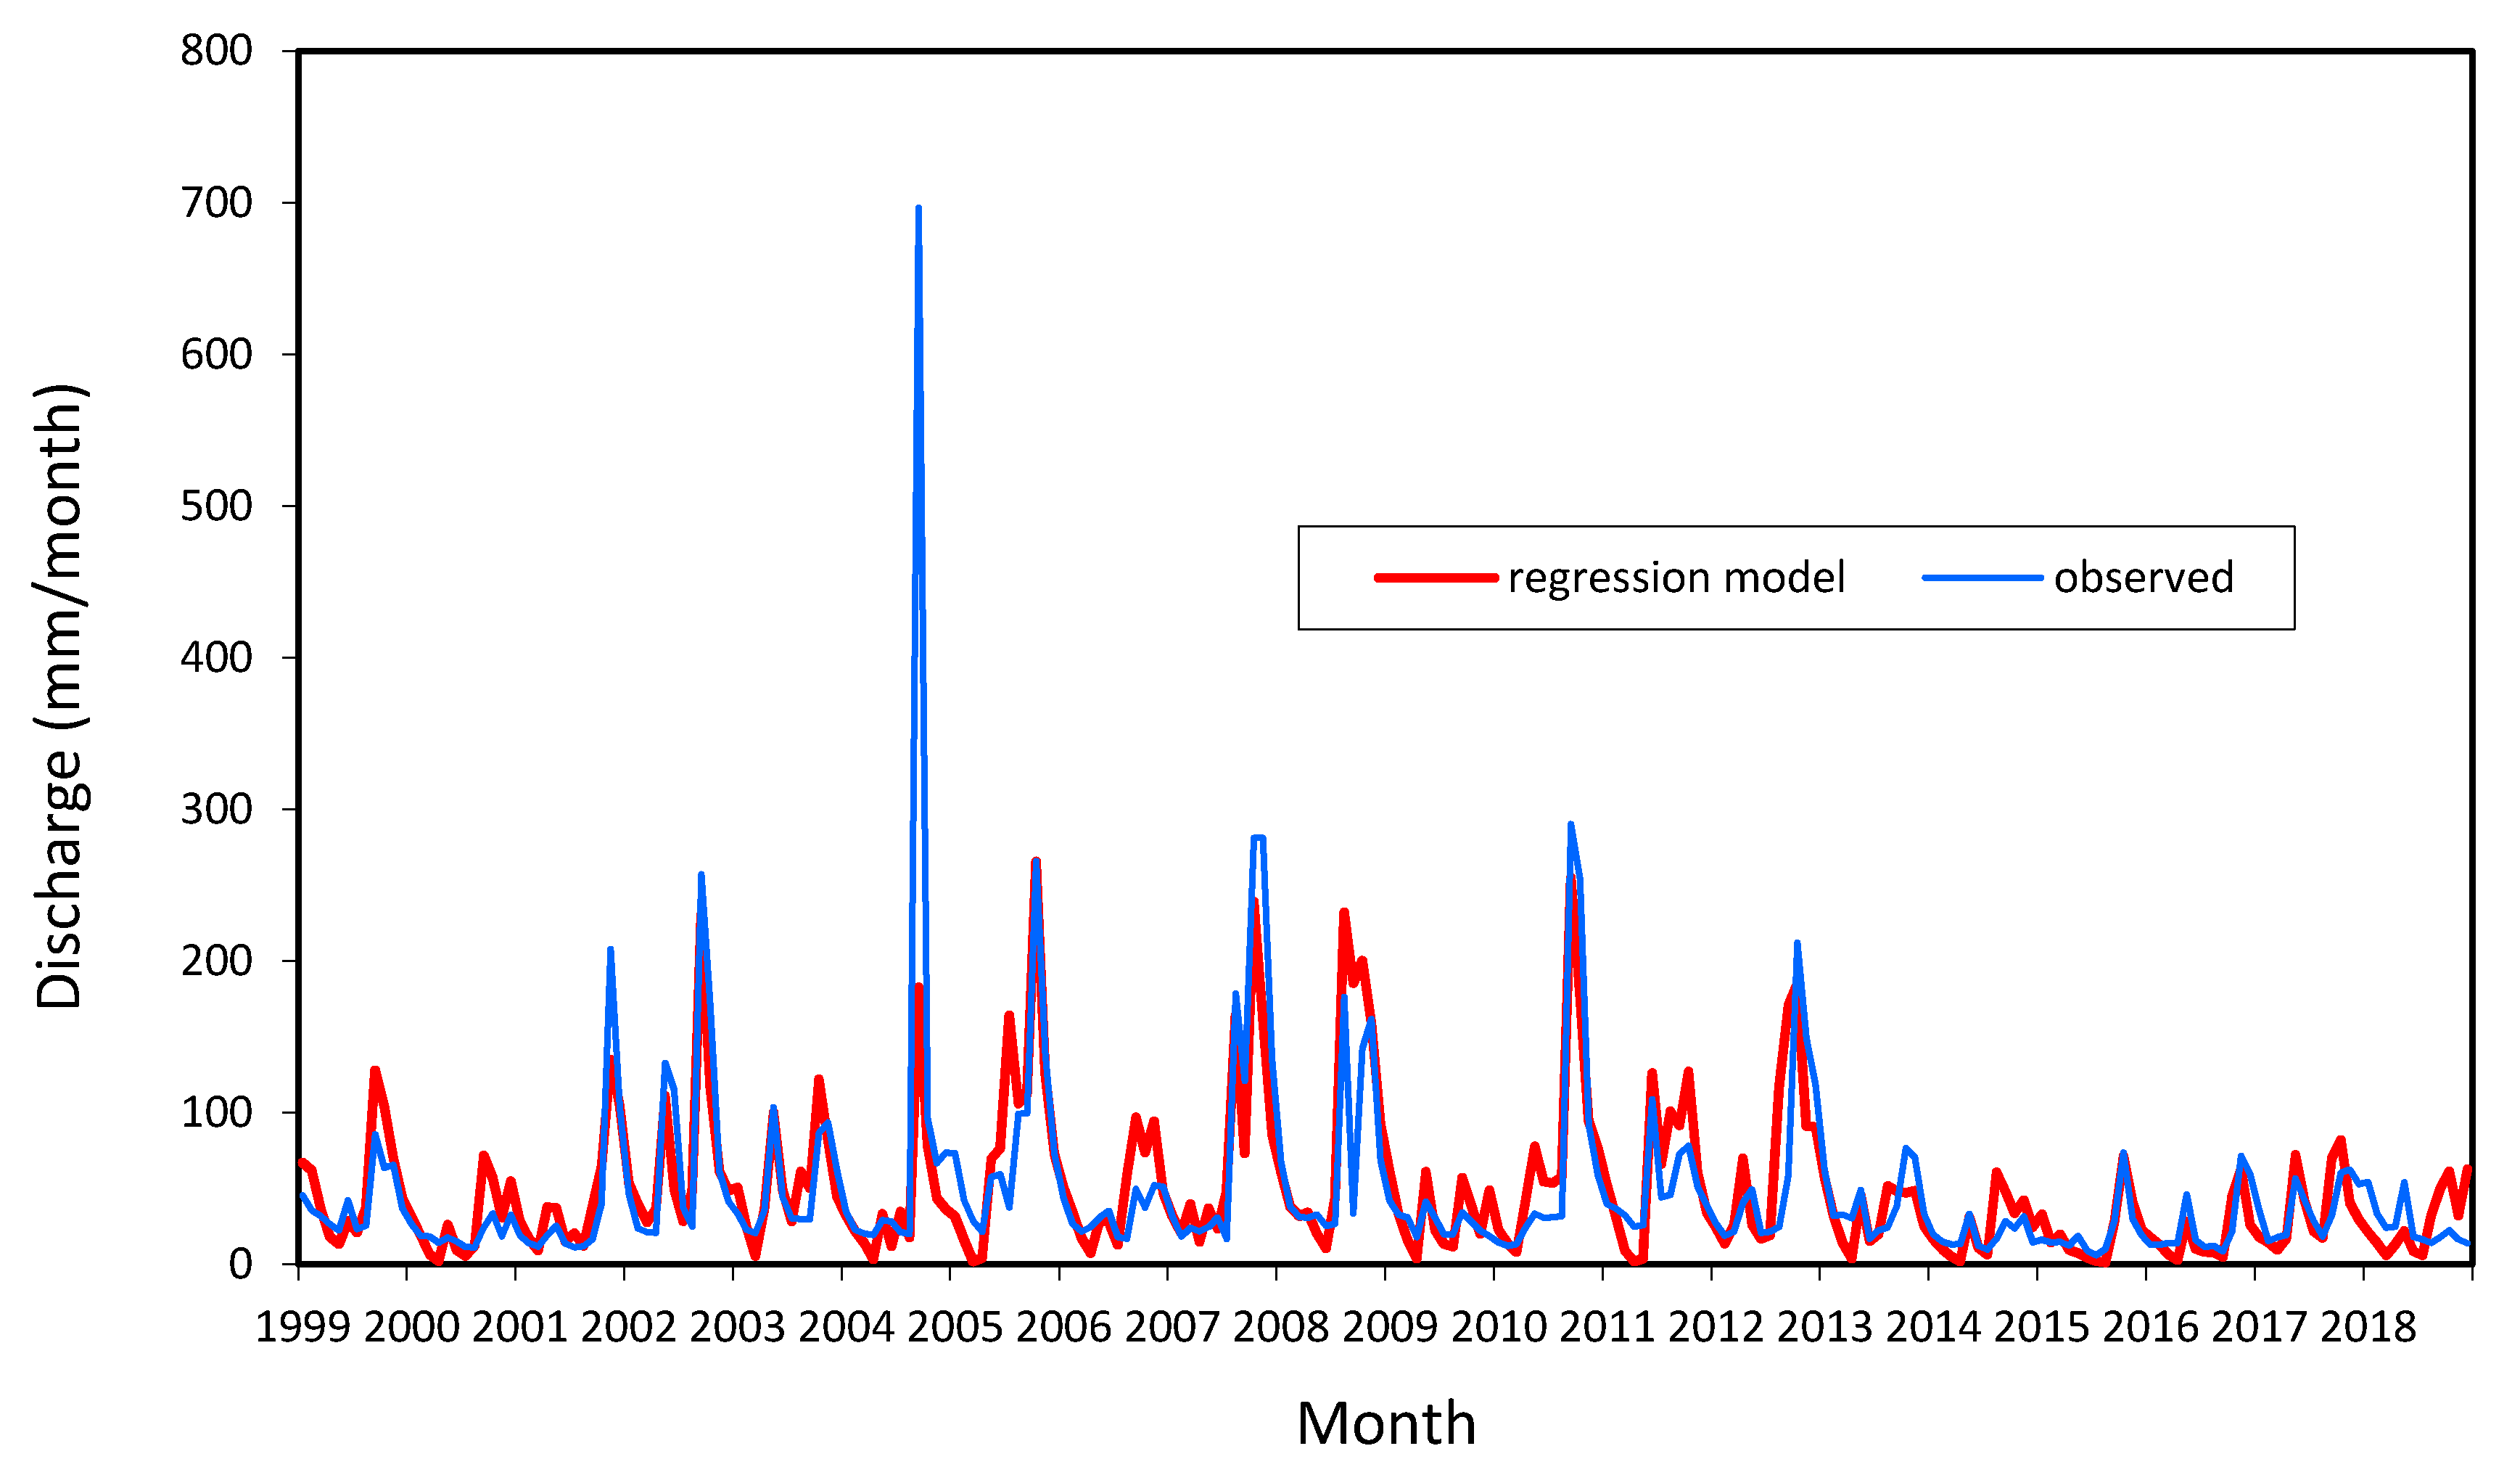
The best fit of the Rainru model achieved a coefficient of determination (R
2) between observed and modelled runoff of 0.56. This was obtained by selecting a memory
m = 5 months, and an interception threshold constant
D = 65 month
−1 (
Figure 4; Equation (
1)).
Table 2 shows the model parameter values that were obtained.
Figure 4 demonstrates that the model reasonably captures the observed runoff in terms of both the timing and magnitude of normal flow events through the historical record. The large uncaptured flow peak in 2004 was caused by a passing hurricane (Hurricane Ivan, September 2004), with the model being unable to reproduce the concomitant flow increase of such an extreme event. This reduced the overall R
2 value. Due to the goodness of fit for normal flow events, this model configuration was used for estimating future streamflow based on predicted rainfall from 5C.
4.3. Future Projections under Climate Scenarios
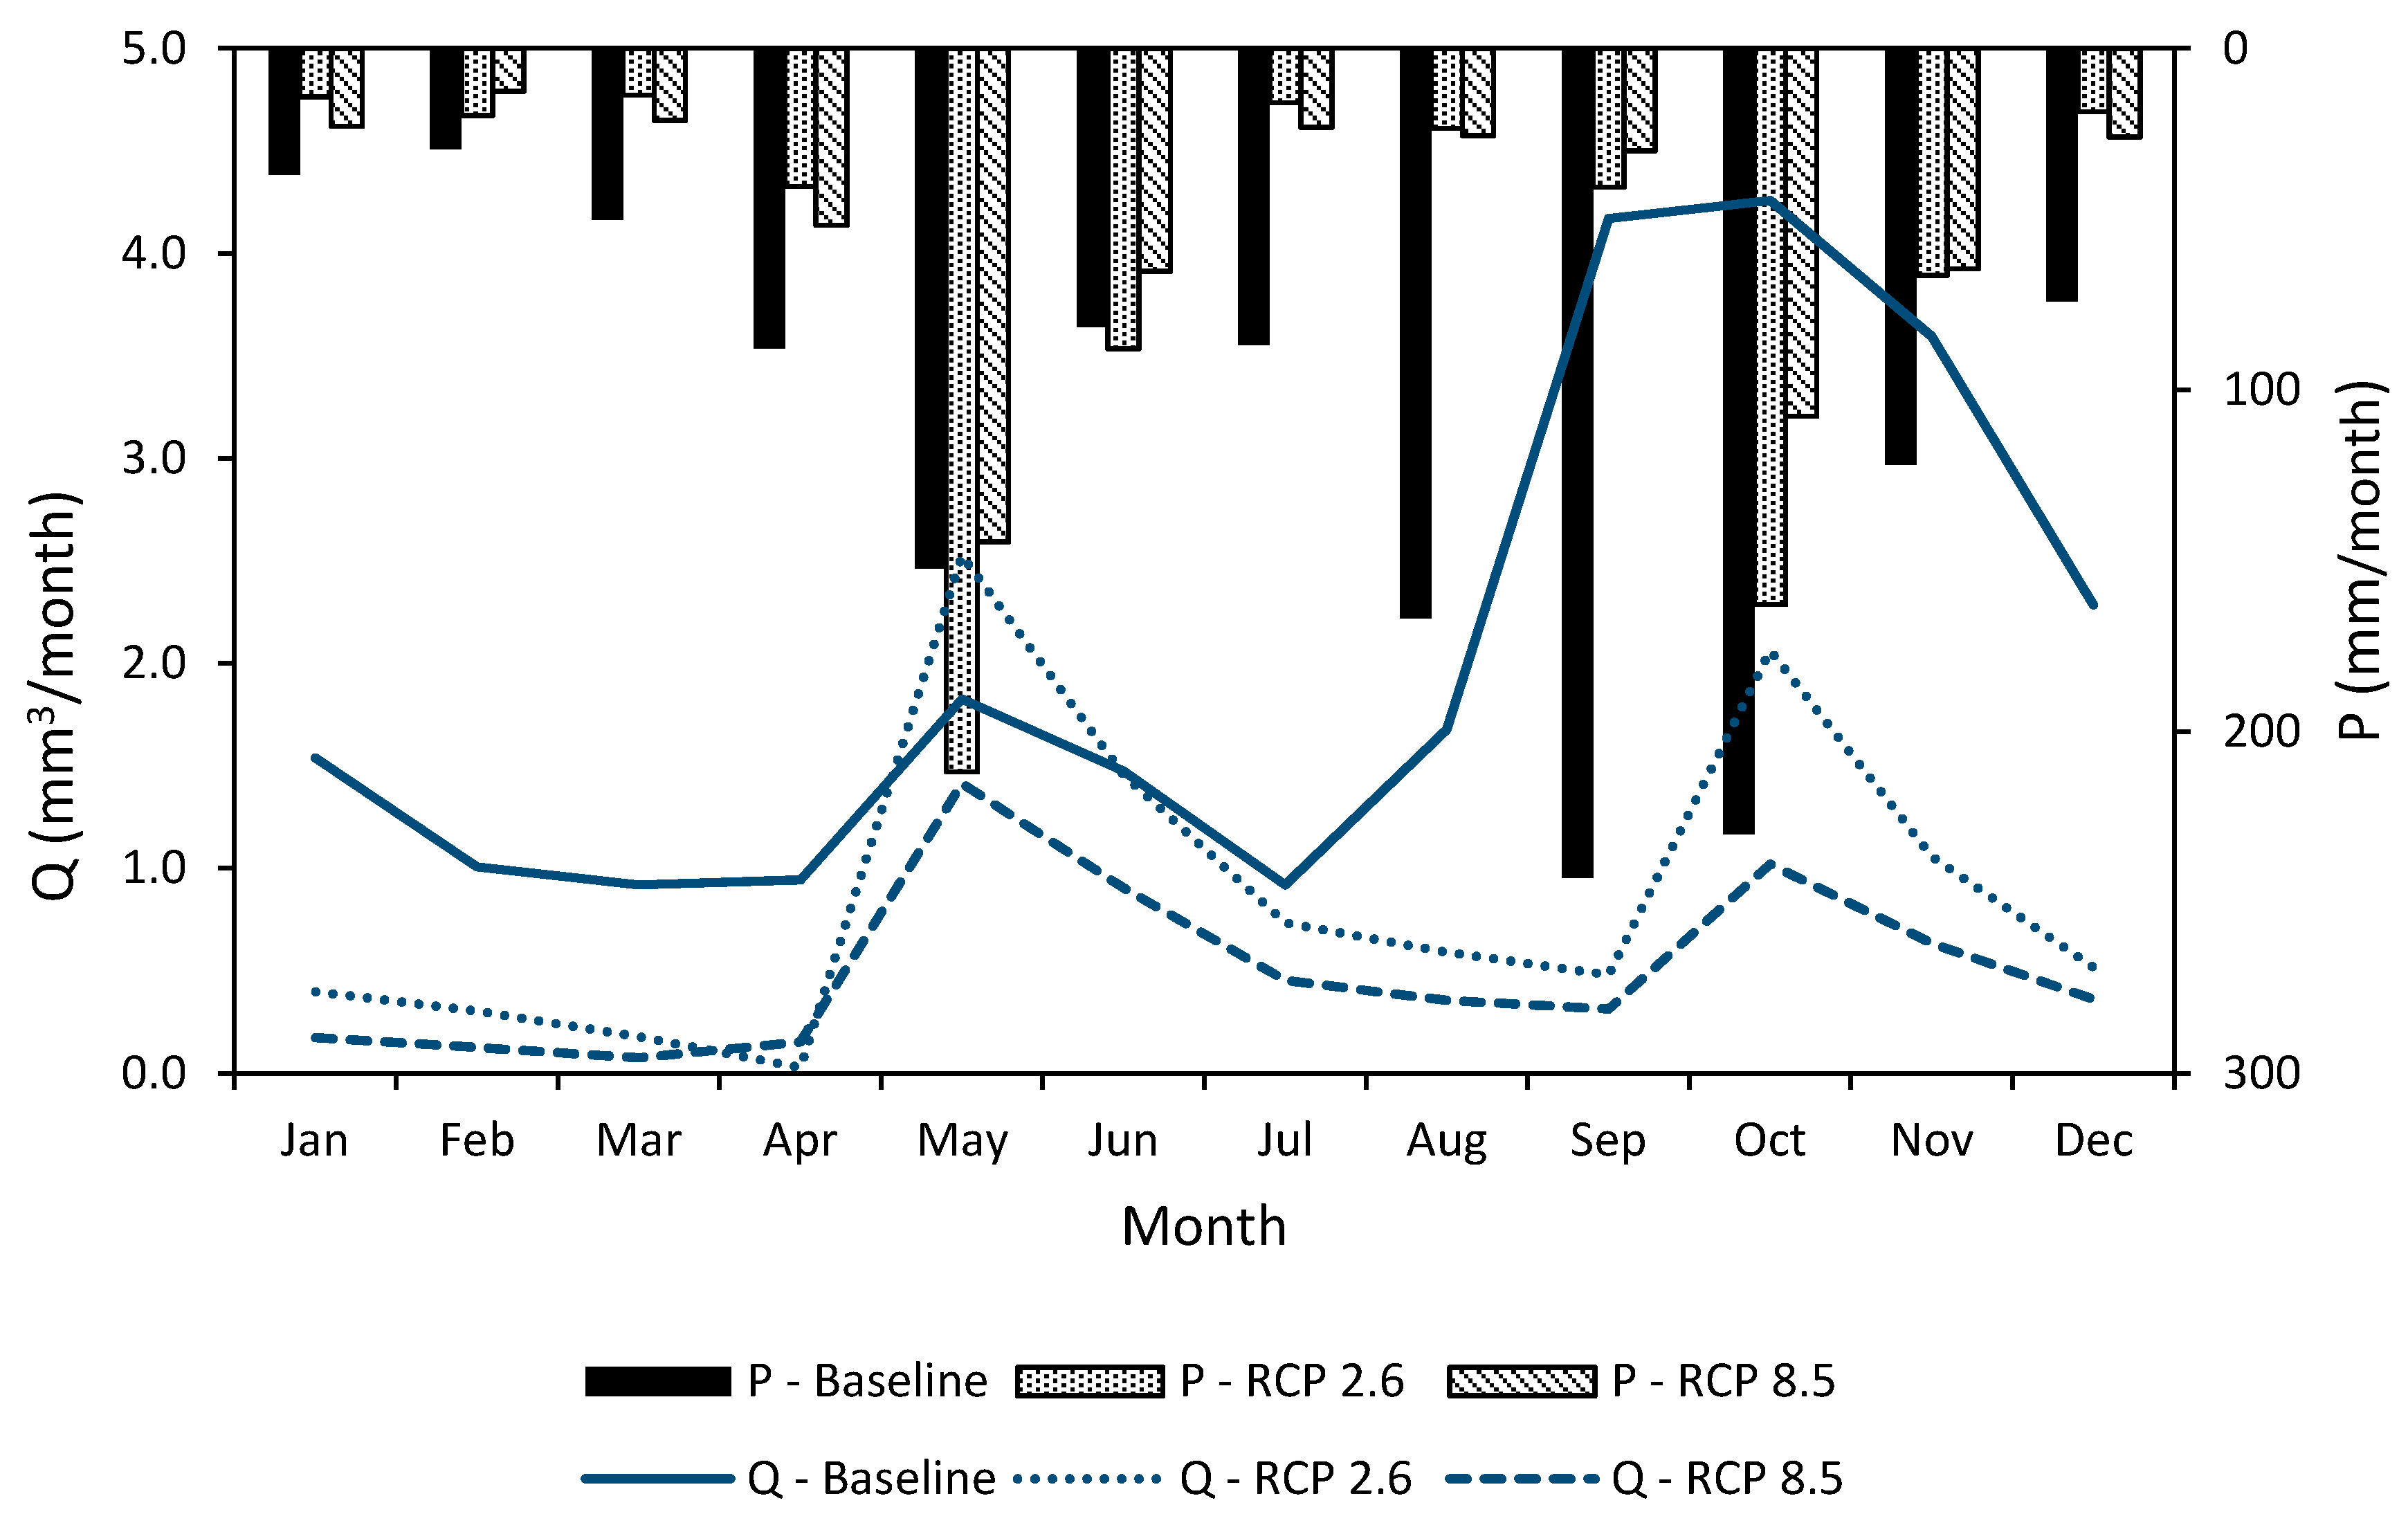
In 2030, under both RCPs there will be an overall significant decrease in average monthly rainfall and streamflow in comparison to the historical period.
Figure 5 shows that under RCP 2.6, average annual rainfall reduces to 715 mm (47% reduction), and average annual runoff more than halves to 10.34 Mm
3. This projection suggests a change in historical rainfall patterns, where the secondary wet month (usually May) is projected to be the month with the most rainfall and October (usually the primary wet month) is projected with lower rainfall by the 2030s. Under RCP 8.5, average annual rainfall reduces further to 595 mm. The changes in monthly precipitation and streamflow under the two RCPs are not very significant. The major hydrological changes are seen in the switching of the two wet seasons of May and October, along with the significantly reduced rainfall totals.
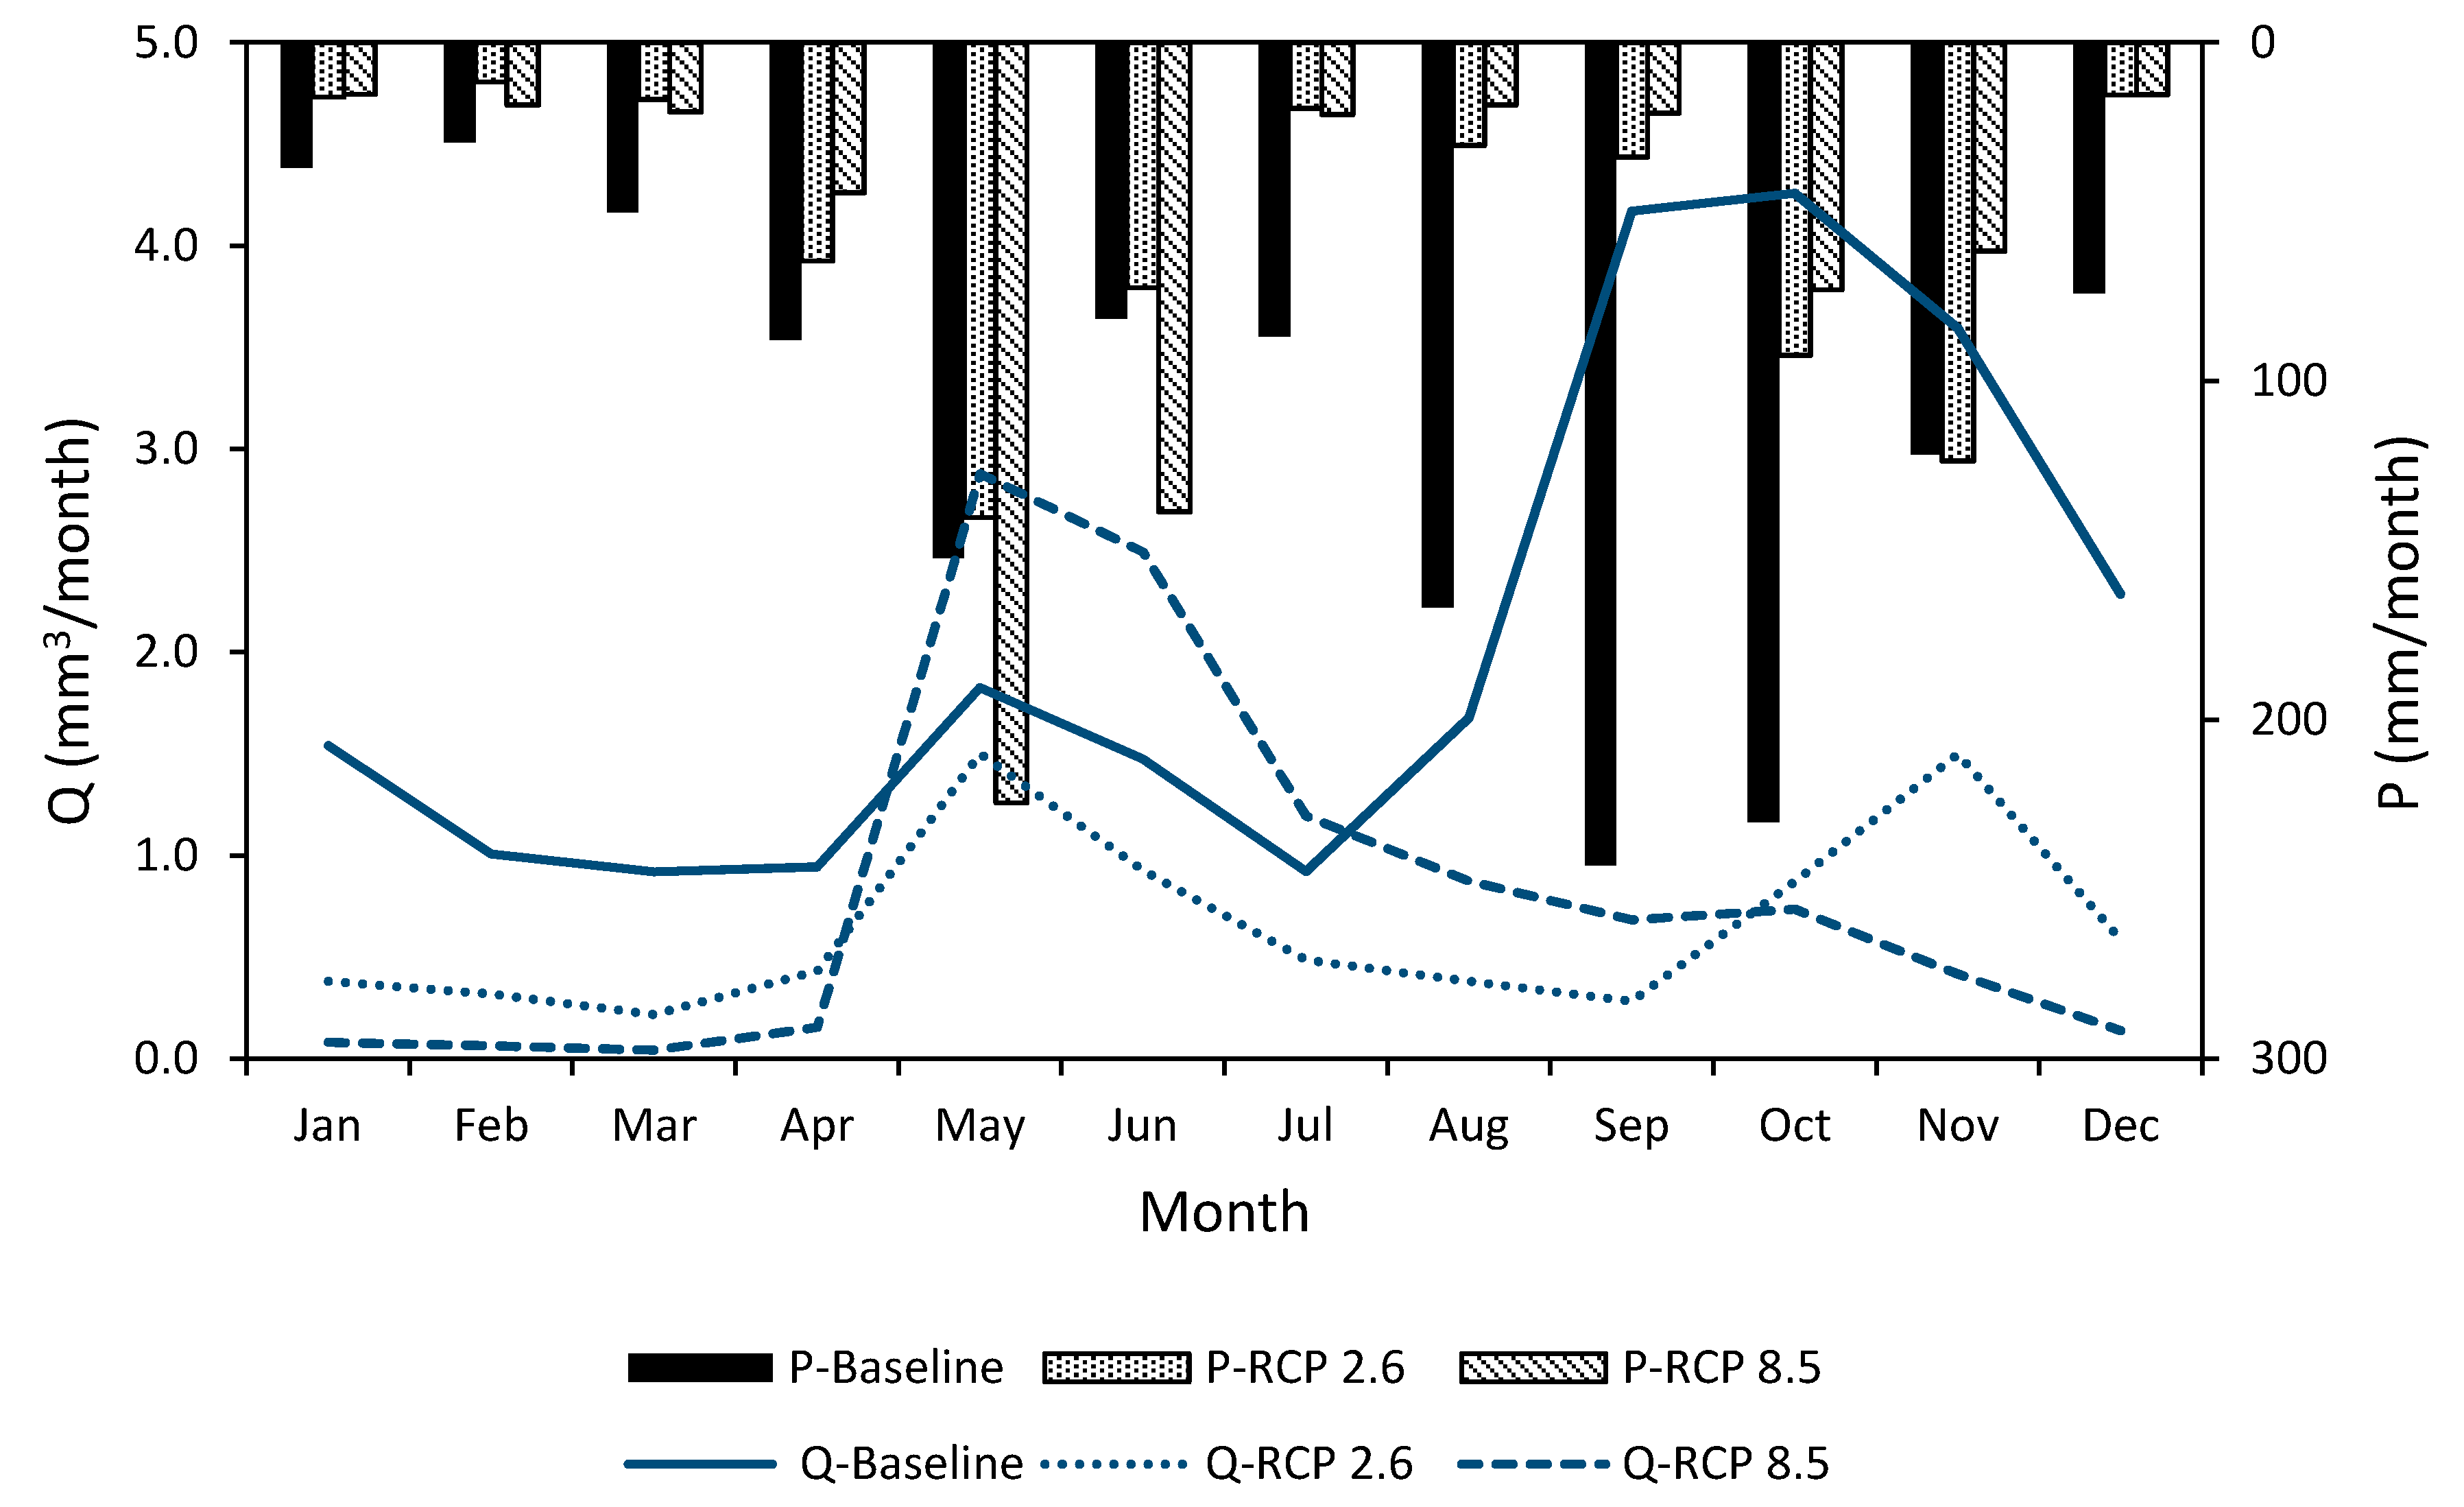
For long term (i.e., 2050) climate impacts,
Figure 6 depicts a similar trend in the rainfall and streamflow variations compared with the 2030s. Overall, there is a decrease in the rainfall and streamflow estimated in the 2050s under both pathways when compared with the historical baseline. Under RCP 2.6, average annual rainfall reduces to 637 mm, and average annual runoff to 7.88 Mm
3. Under RCP 8.5, average annual rainfall slightly increases to 672 mm (compared to under RCP 2.6), and average annual runoff to 9.76 Mm
3. Surprisingly, rainfall and runoff during May and June are projected to increase compared to the historical average, but dramatically decrease in the remaining months.
Table 3 gives a summary of the projected short- and long-term changes in rainfall and streamflow under climate change based on RCP 2.6 and RCP 8.5.
4.4. Implications for Decentralized Rooftop Rainwater Harvesting in Mona and August Town
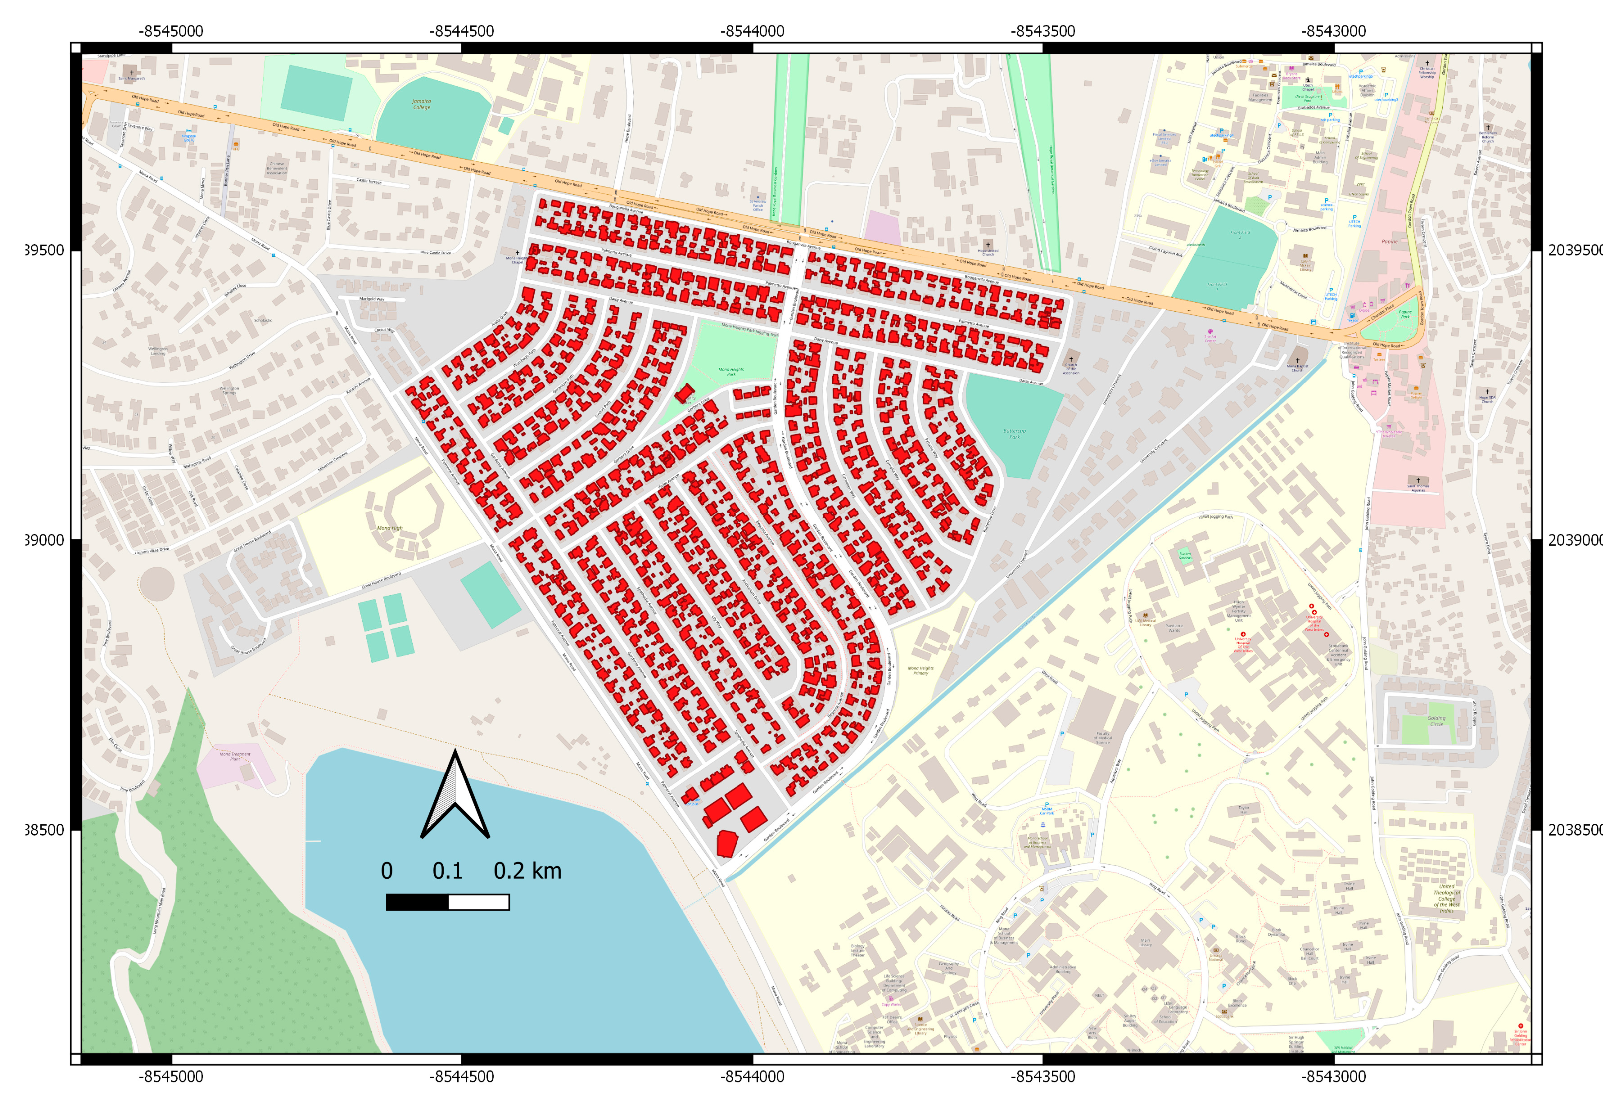
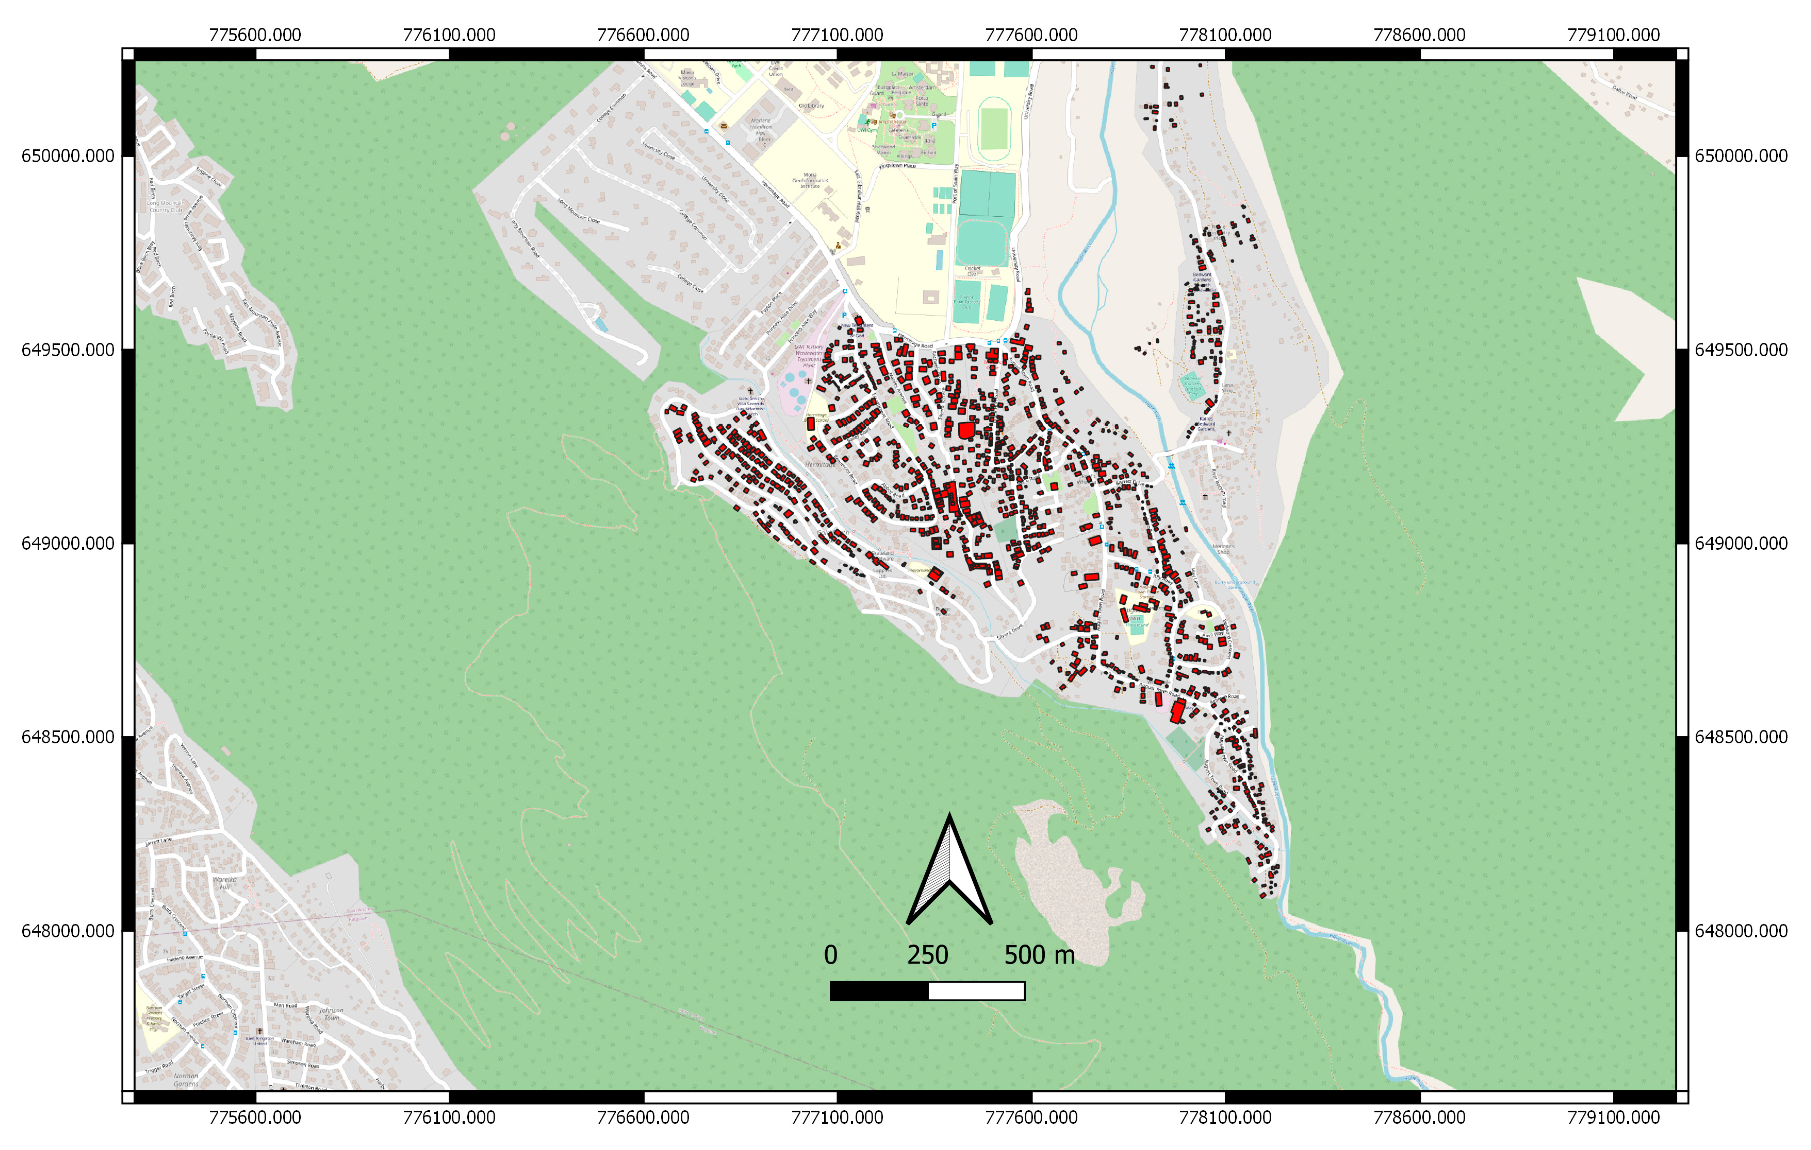
RWH is premised on the potential capacity of rooftops (
Figure 7 and
Figure 8) in the urban area to collect rainfall to augment existing water supply based on average monthly historical rainfall patterns. In both the Mona and August Town Communities, the rooftop types observed were typically galvanized sheets, and as such the rooftop coefficient used was 0.90 (
Table 1). An uptake fraction (defined as the proportion of households in principle willing to implement RWH in the absence of barriers) was determined based on the household surveys as an average of 85% willingness to adopt RWH. The total rooftop area for Mona was 234,426 m
2 and August Town was 134,640 m
2. In both communities, the majority of the buildings were houses, however infant schools and churches were also identified. With respect to building distribution, it was observed that the Mona Community was denser compared to the August Town Community that also contains squatter settlements.
Based on the average monthly historical rainfall and the 85% potential uptake fraction, the potential contribution from decentralized rainwater harvesting was calculated.
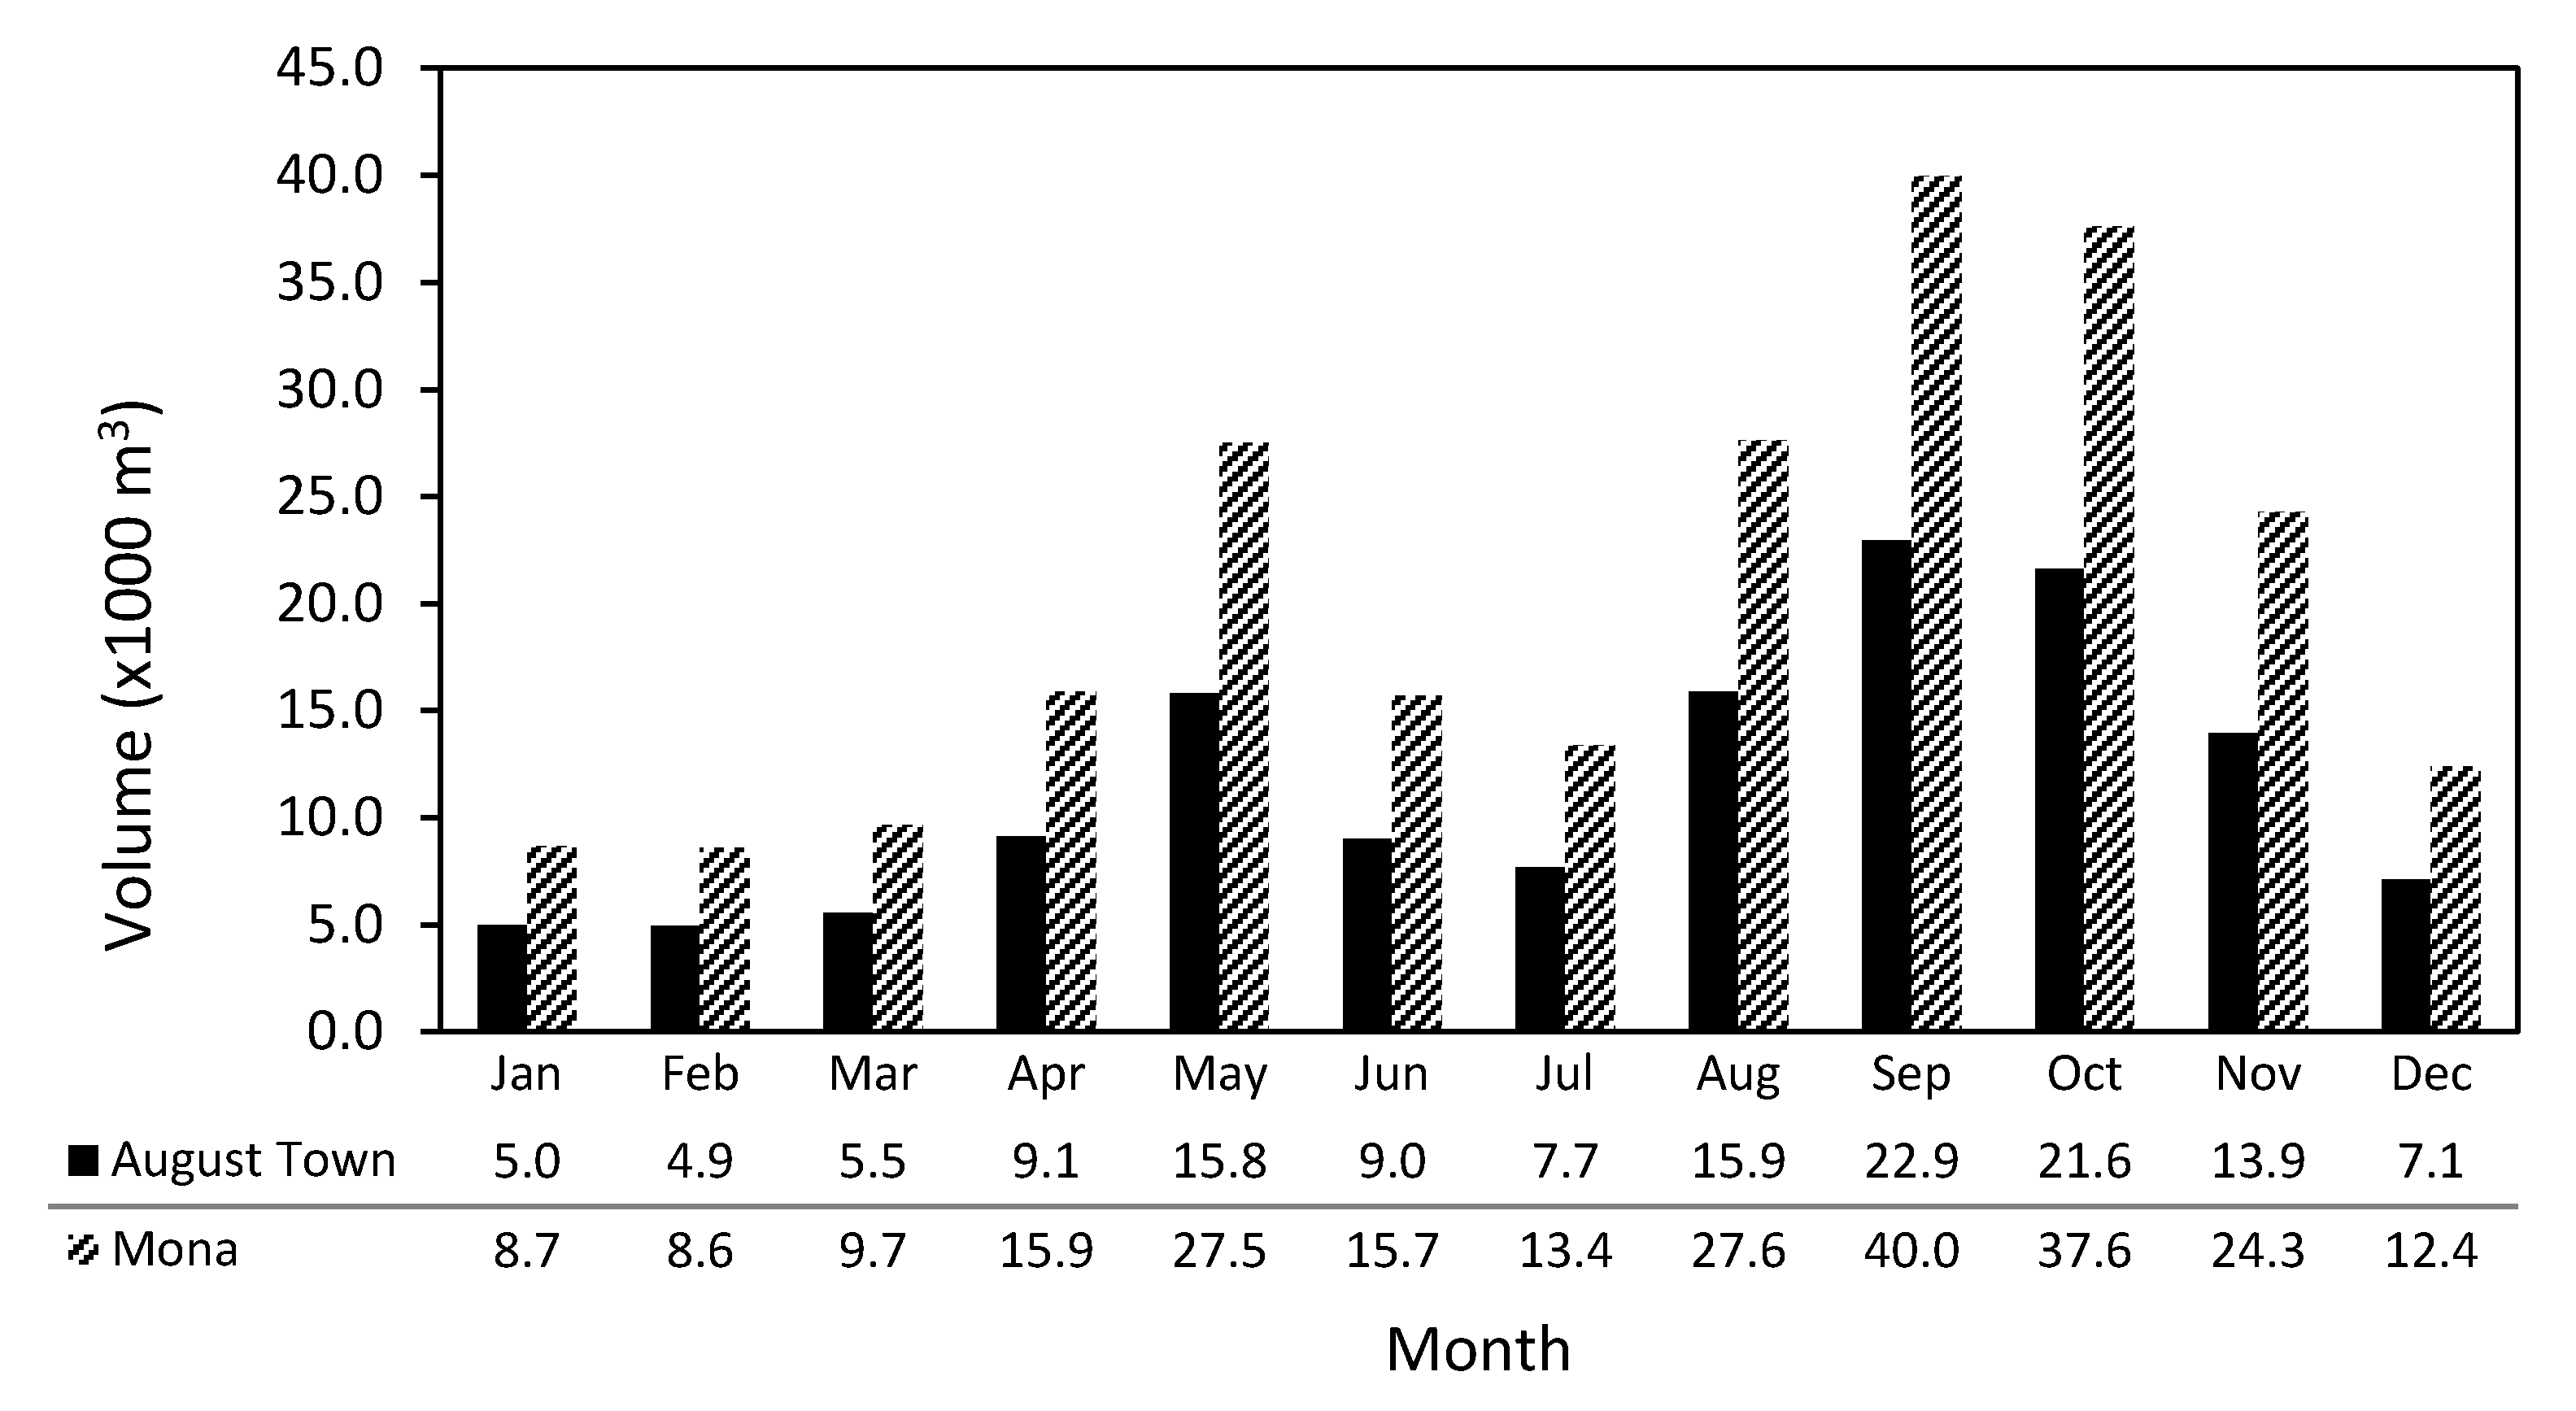
Figure 9 shows the potential contributions from rooftop rainwater harvesting in the Mona and August Town Communities to water supply. The month with the highest rainwater harvesting potential was September with 62,900 m
3. As expected, January and February had the least rainwater harvesting potential of approximately 13,600 m
3. For the baseline, the annual rainwater harvesting potential is 379,862 m
3 with a monthly average of 31,655 m
3 from the two communities.
4.5. Assessment of Potential Water Contribution from RWH in 2030 and 2050
Based on the climate change impact studies on rainfall patterns within the Caribbean region, the estimated potentials of RWH contribution was reassessed under future rainfall conditions.
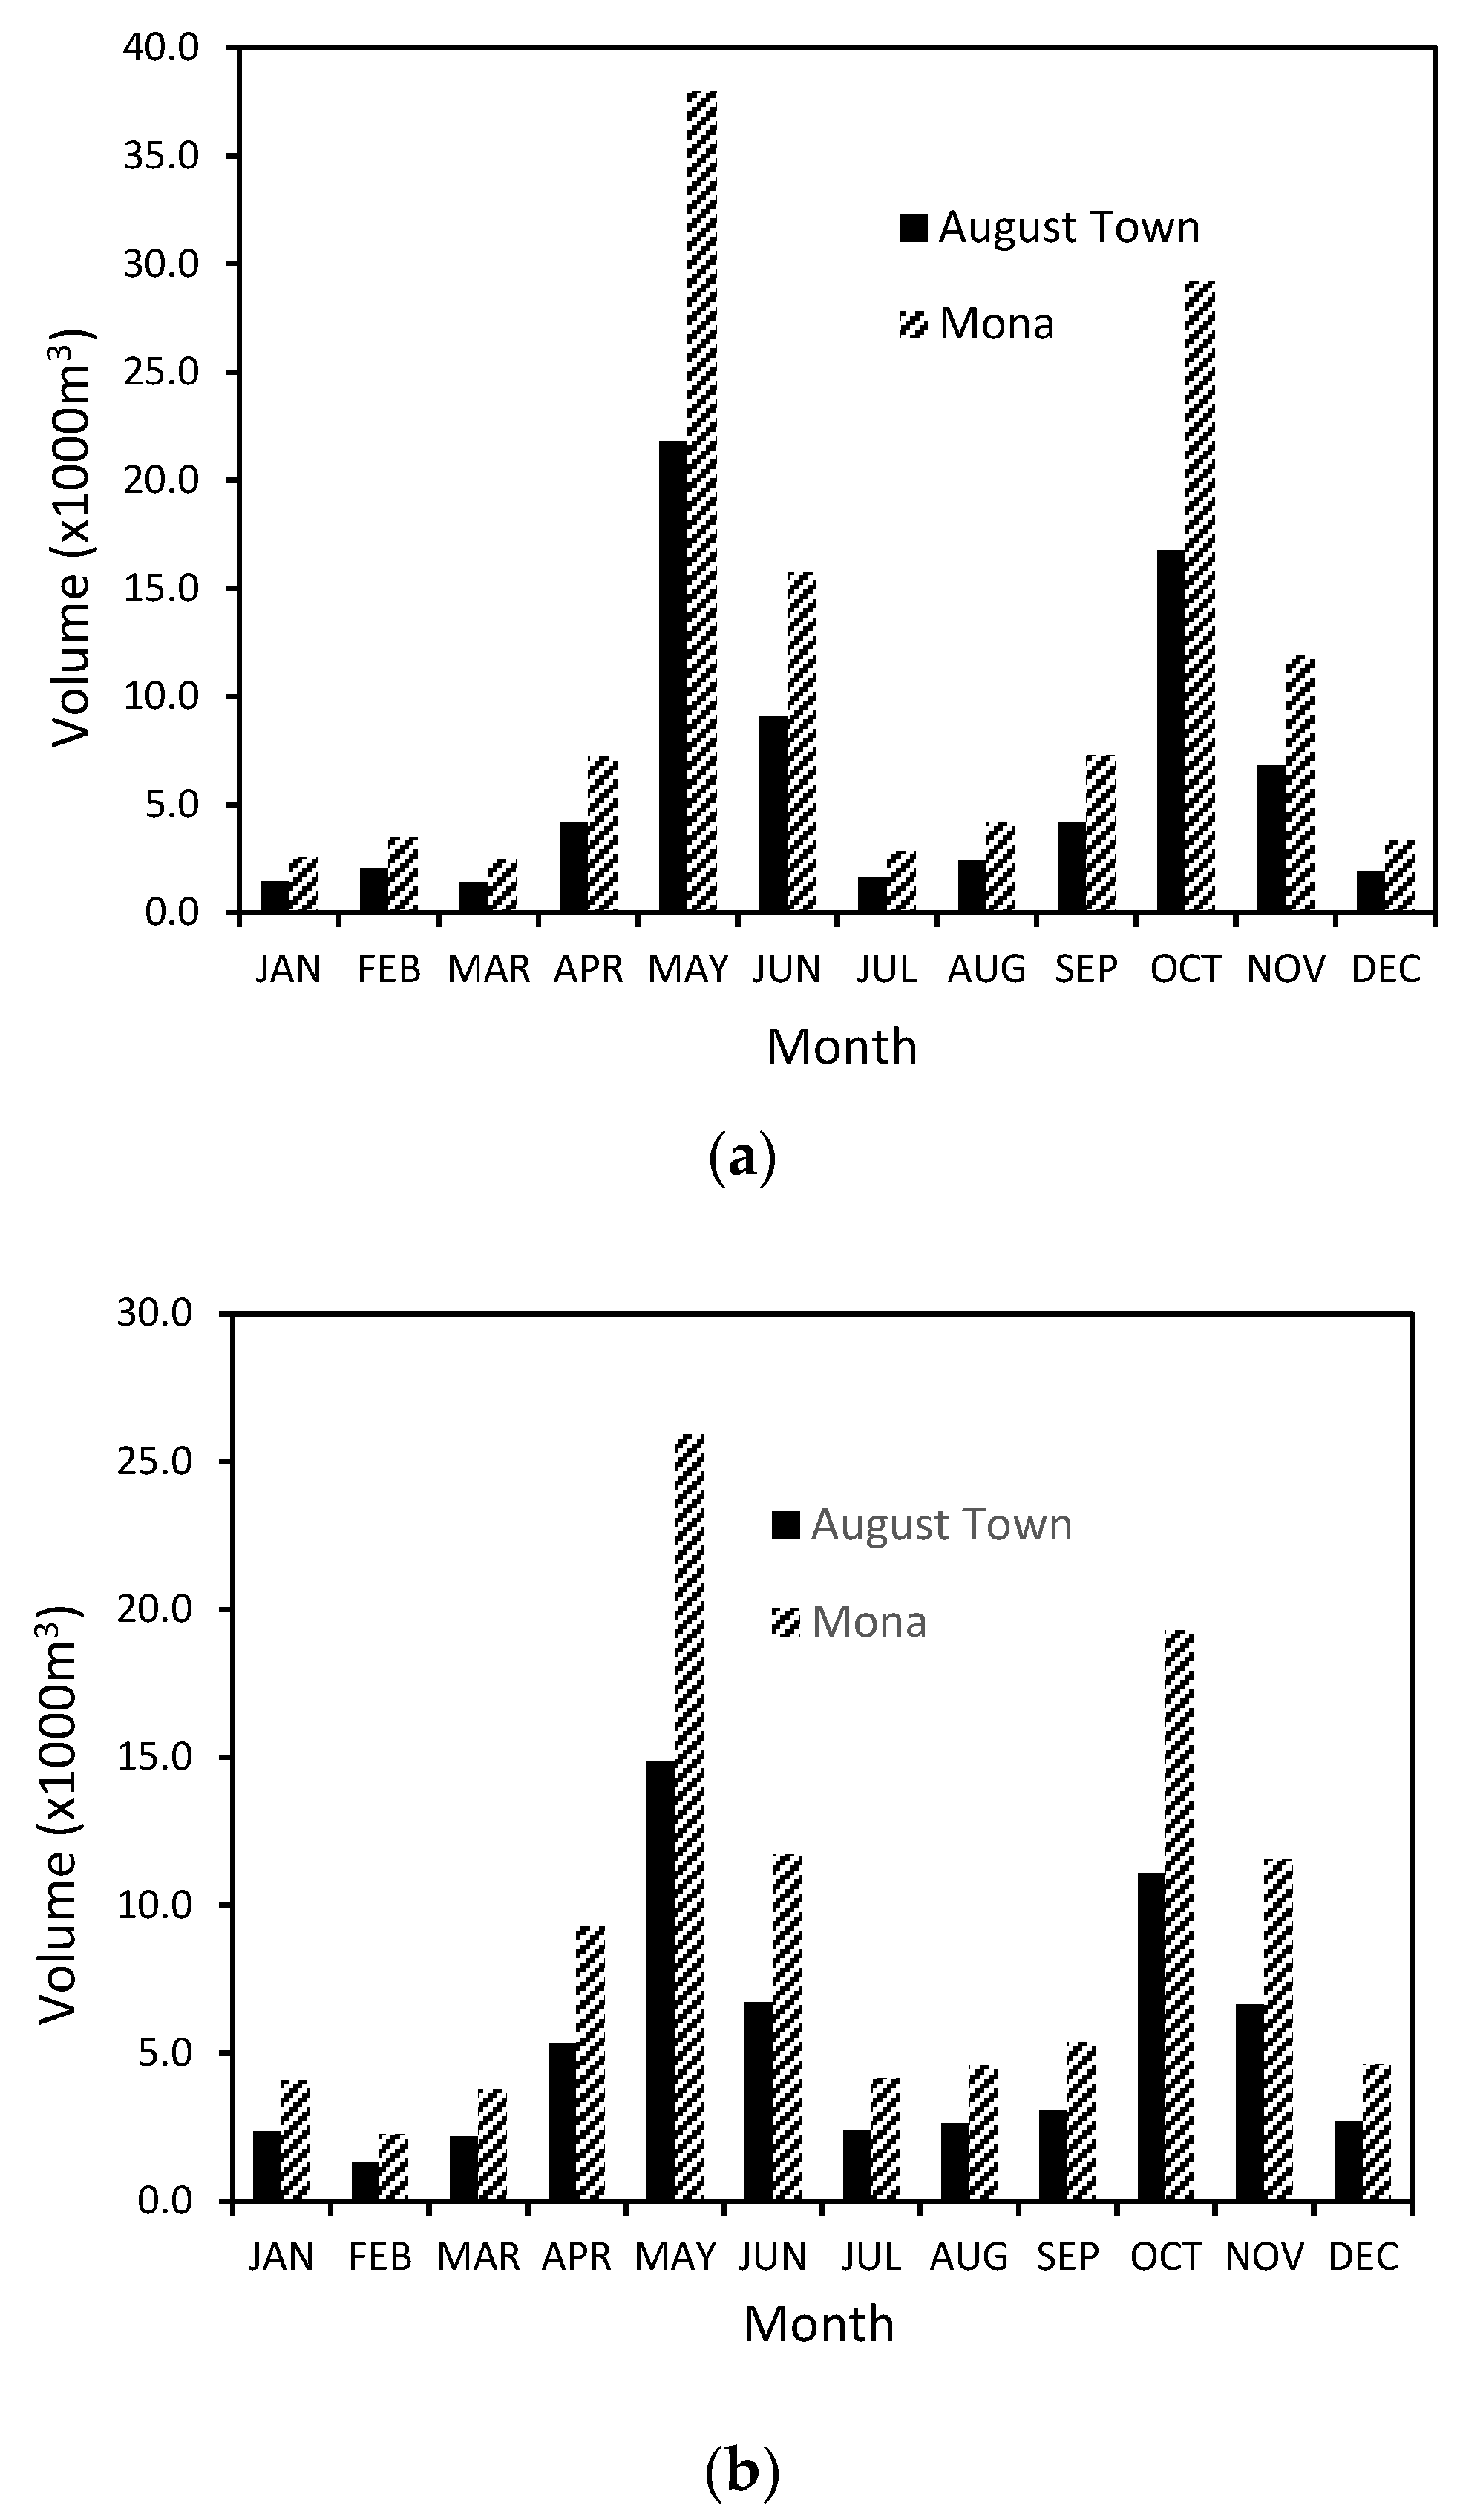
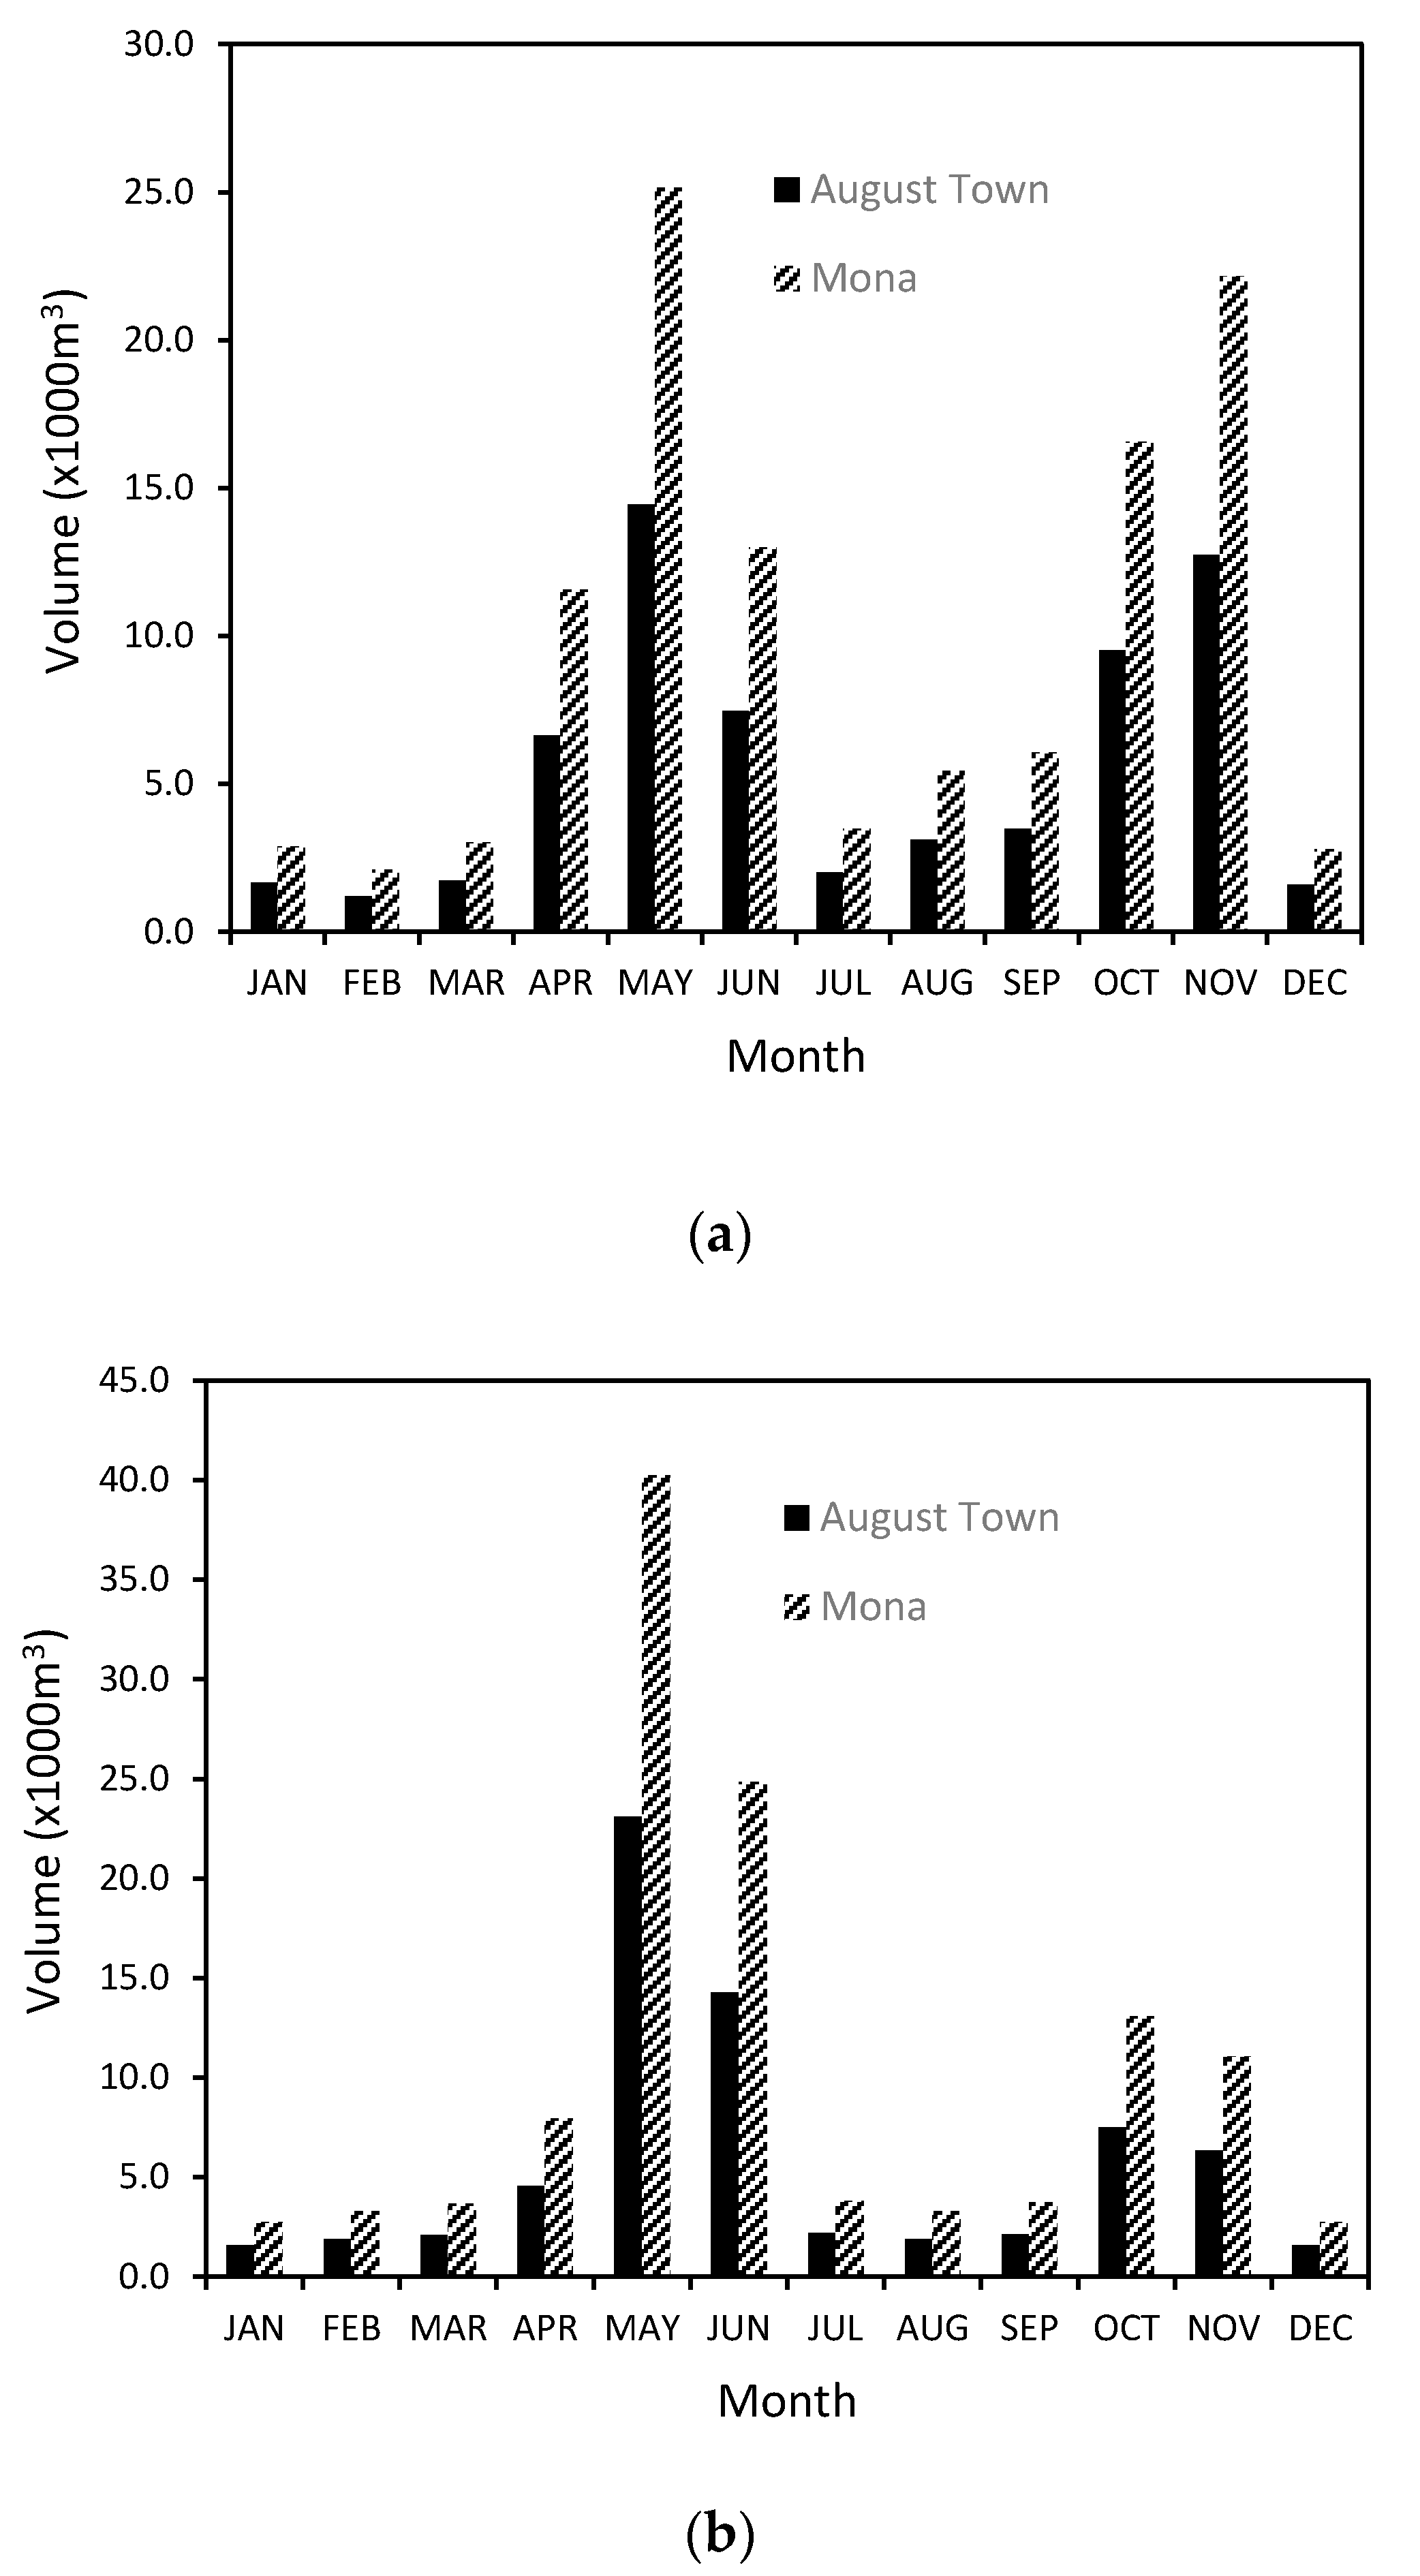
Figure 10 and
Figure 11 show the potential RWH contributions in the communities of Mona and August Town under RCPs 2.6 and 8.5 assuming the rooftop areas and percentage uptake for rainwater harvesting technology remain the same as the baseline.
Under RCP 2.6 in 2030, the two communities had an annual RWH potential of 201,974 m3 (46% reduction) and a monthly average of 16,831 m3. Under RCP 8.5, annual rainwater harvesting potential is 167,921 m3 (56% reduction) with a monthly average of 13,993 m3. This represents a significant reduction on the baseline.
Under RCP 2.6 in 2050, there is a predicted lower annual rainwater harvesting potential of 179,875 m3 (52% reduction compared with the baseline) and a monthly average contribution of 14,990 m3. Under RCP 8.5, there is a higher projection compared with RCP 2.6 with an annual rainwater harvesting potential of 189,831 m3 (50% reduction) and a monthly average contribution of 15,819 m3.
4.6. Contribution of RWH to Augment Water Supply in the Hope Demand Zone
Using the calculated contributions of RWH in the two communities, a baseline water balance (defined for 2018) was calculated for the entire Hope Demand Zone, which includes both the Mona and August Town Communities. To do this, assumptions and estimations were made regarding Demand Zone population, water system production and total water demand (domestic and commercial demand) using data from the Kingston Basin. The 2018 population of the Hope Demand Zone was calculated with the assumption that the percentage population distribution within the Kingston Basin remained unchanged from 2010 [
14]. As such, the population in the Hope Demand Zone was considered to be 6.9% of the total population in the Kingston Basin, giving a population of 46,214 in the entire Hope Demand Zone. In addition, the water production from the Hope Demand Zone was estimated as a percentage contribution of the Kingston Basin which was taken as 15% based on dry season conditions [
14]. The total domestic demand (actual consumption in the home, not accounting for network losses and inefficiencies) was determined using the value for the ‘high’ level per-capita determined by [
25], which is 0.25 m
3 d
−1 to give a ‘worst case’ demand, and commercial demand was approximated as 25% of the domestic demand [
14]. Similar to the Kingston Basin, the baseline water balance was estimated for the Hope Demand Zone and gave a supply deficit of 2425 m
3 d
−1 without the contribution of rainwater harvesting. The potential RWH contribution from Mona and August Town was estimated as a percent of the total water supply to the Hope Demand Zone.
The potential baseline monthly RWH contribution from Mona and August Town (31,655 m
3) was 1055 m
3 d
−1. This gives the contribution of RWH from the Mona and August Town Communities relative to the whole Hope Demand Zone. When this contribution was incorporated in the Demand Zone water balance, the daily supply deficit potentially reduced from 2425 m
3 to 1370 m
3 with a 7% water supply contribution to the total Hope Demand Zone water supply from RWH sources (
Table 4) relative to total water supply (not including NRW losses). It is noted that this assumes the potential RWH volumes are captured in their entirety, which is rarely ever the case.
The above calculations were repeated to determine the contribution of rainwater harvesting in the medium (2030) and long term (2050;
Table 5), not accounting for the effects of population growth. Assuming climate change impacts on the Kingston Basin, precipitation decreases of 44 to 53% of the historical values depending on the time frame and RCP are expected (
Table 3). Unaccounted water losses were assumed to decrease based on infrastructural improvement ambitions being met (reduced from 57% to 40% in 2030 and 30% in 2050; [
14]). While ambitious, even if met, NRW totals are still significant. The annual water production used for the Kingston Basin was 73.9 Mm
3, from which daily production values for the Hope Demand Zone were derived. According to the calculation, in 2030 a potential water supply deficit of approximately 3950 m
3 d
−1 will result, with a 6% water contribution from RWH technology to total water production from Mona and August Town. Similarly, in 2050, a potential supply deficit of approximately 3335 m
3 d
−1 will result, also with a 6% water contribution.
4.7. Household Storage Capacity Required in the Mona and August Town Communities
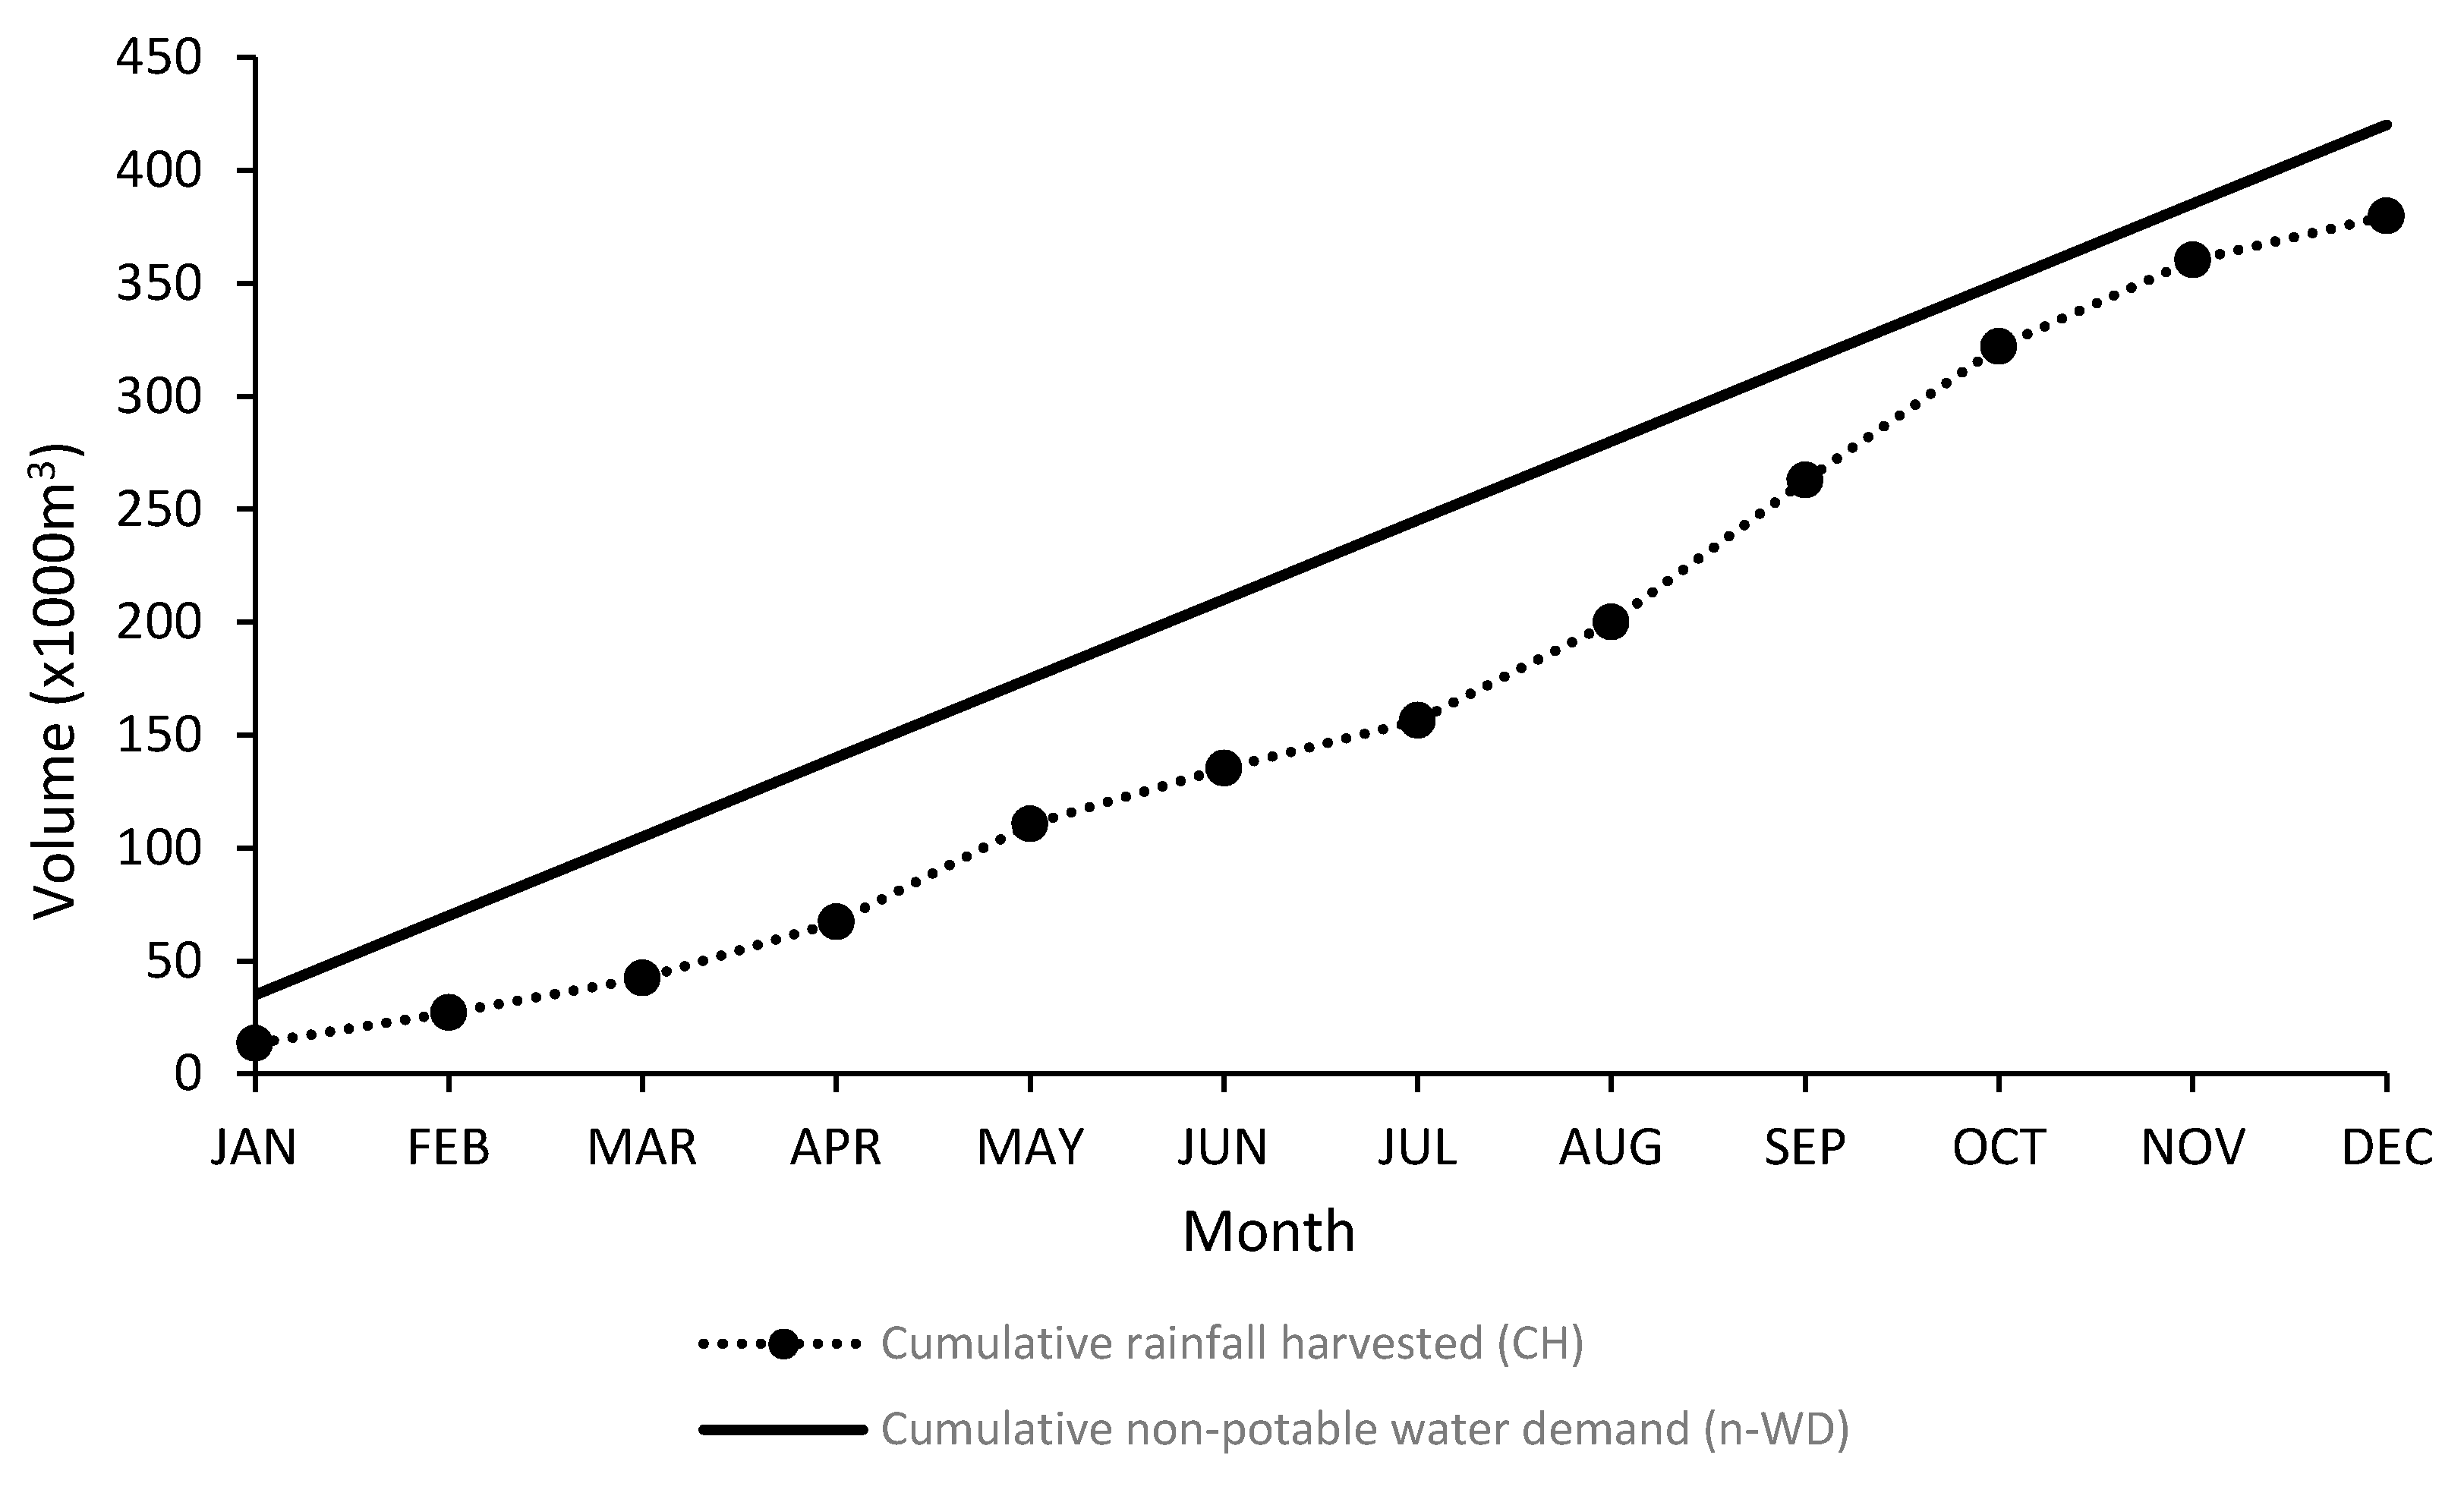
To assess required household storage requirements to fully utilise captured RWH for non-potable demand, the historical rainfall and water demand patterns were derived for the two surveyed communities using baseline data. It is assumed that the total potential RWH volumes estimated are captured, which is rarely the case. In reality, space, cost, treatment, personal motivation, institutional/governance policies, and knowledge tend to prohibit potential volumes being realised [
24]. An estimate of storage requirements was done using the mass curve technique [
22,
26]. In this method, the cumulative rainfall runoff and cumulative household water demand in Mona and August Town for the baseline period were calculated. Thereafter, the sum of the maximum difference observed between the rainfall (i.e., supply) curve and water demand curve was used to determine the capacity of water storage required to meet this maximum difference [
26]. According to the 2011 Population Census conducted in Jamaica, the total number of households in August Town and Mona communities were 1902 and 1891 respectively with an average number of three persons per household [
18].
When non-potable demand is considered [
25], estimated that in a typical household in Kingston and St. Andrew, 40% of total water use was allocated to toilet flushing which is one of the main non-potable uses of potable water supplied to the Kingston Basin. As shown in
Figure 12, the cumulative non-potable household demand (solid line) is consistently higher than the RWH that can be harvested each month (dashed line; i.e., demand exceeds possible supply). This cumulative difference divided by the number of households (i.e., 3793) gives the storage necessary to meet non-potable water demand. Assuming 40% allocation to non-potable demand, the maximum difference between non-potable demand and harvested rainwater, and thus monthly rainwater storage required was determined to be 88,687 m
3 (in July) from both communities (
Figure 12) which represents about 1 m
3 per household to satisfy daily non-potable water demand in this dry month in these two communities.
5. Discussion
This study presents findings that contribute to the assessment of domestic water supply vulnerability to climate change, and the quantification and evaluation of the potential of rainwater harvesting as an alternative water supply source for the Kingston Basin in Jamaica. The baseline water balance shows a supply deficit largely due to factors of poor water infrastructure resulting in large unaccounted for water losses (56%) along with the expected impacts of climate change. The Caribbean regional climate model (5C), under two RCPs (2.6 and 8.5), suggests an average monthly rainfall decrease of approximately 45–50% and a decrease in streamflow by 60–77% in the 2030s and 2050s compared to the historical period (1999–2018). The results also highlighted projected shifts in rainfall patterns. These results indicate the potential of climate change impacts to present major consequences for water supply security in the Hope Demand Zone and the Kingston Basin in Jamaica. Climate change could lead to lower water outputs from rivers and reservoirs at critical times of the year when demand is highest, threatening water supply to residents, farming, and business. Lower stream flows in the wet seasons will compound losses in terms of volume outputs for production systems and reduced rainfall totals will reduce future rainwater harvesting potential. Diversifying supply sources and reducing demand are therefore both required to adapt to, and mitigate, the expected impacts of climate change in the basin.
The empirical evidence suggests that with 85% household uptake of rainwater harvesting technology, the two communities studied could contribute 380,000 m3 to annual water production in the Hope Demand Zone. This water is likely to be used for non-potable uses, which currently makes up at least 40% of water demand in Kingston. This could lessen the overall supply deficit in the study area, and offers a 7% contribution to total Demand Zone water production. In the future, this reduces to 6% of total water production due to rainfall decreases. The percentage contribution of rainwater harvesting to domestic demand will not completely fill the total supply-demand gap in the Hope Demand Zone, yet it could contribute significantly to satisfying domestic non-potable demand, relieving pressure on the traditional water sources used for potable supply to a growing population. RWH could therefore be seen as a crucial component to climate change adaptation and mitigation in Kingston, ‘freeing up’ the current non-potable water demand for potable water supply purposes. The RWH contribution could increase with greater uptake of the technology throughout the Kingston Basin, and should be seen as part of a suite of urban water efficiency measures, including demand side measures. However, implementing RWH is not without major barriers and obstacles at the local level compounded by climate change related impacts over the short and long terms. It is important to note however that climate change induced reductions to rainfall totals vastly counteract the impact of installing RWH in Kingston and the effects of measures to reduced NRW in the Hope Demand Zone. It is therefore suggested that urgent and widespread climate adaptation and mitigation measures are required throughout Kingston and indeed in Jamaica as a whole.
With respect to storage capacity, the maximum storage required for RWH to meet total water demand from Mona and August Town for non-potable water supply (assumed to be 40% of total domestic demand) is approximately 1 m
3 per-household. This would cover daily non-potable household supply in July, when demand is the highest. This is feasible volume of storage. Commercially available rainwater tanks with capacities upwards of 200 L (0.2 m
3) are readily available, taking up little ground footprint, and can easily be connected to downpipes on houses, sheds, or garages. From this analysis, promoting RWH in Kingston offers a cheap and potentially effective means to complement existing water supplies for predominantly non-potable uses, and thereby offers a simple, easily accessible climate change adaptation and mitigation option for urban water supply without the need for widespread major infrastructure upgrades that come at significant expense. Depending on the desired end-use of the rainwater, separate household supply lines may need to be installed. If the water is to be used solely for non-potable applications, separate lines can be very simple. The whole system can be isolated from supplied water. For example, downpipes from rooftops can be diverted into storage tanks of various sizes. Simple filters for coarse matter can be installed. For supply, a line or tap from the tank is installed and the water directly used for non-potable application (e.g., garden watering). Such systems are cheap and are widely used (e.g., [
27]). Despite the simplicity of such systems, even the basic costs, sometimes <USD 100, may be unaffordable to poor communities [
28]. It is noted that during household surveys, one citizen had installed a comprehensive household RWH system for non-potable use in Kingston. For more complex systems aimed at potable applications, more robust treatment technologies are required, and separate in-home supply lines must be connected. While technically feasible, the cost soon becomes prohibitive (>USD 1000; cf. [
29]).
There is a general content-related integration in Jamaican policies concerning water, housing, and climate change (i.e., the content of relevant policies does demonstrate synergy and integration). There is also apparent public willingness (from the citizen survey results carried out in November/December 2019) to practice rainwater harvesting as a government–directed strategic policy and climate adaptation solution. There are however challenges and barriers in the urban setting that would present technical setbacks for rainwater harvesting to be adopted, thereby reducing the volumes captured from the potential maxima assessed here. Challenges include the space needed for RWH tank installation and the costs associated with acquiring and installing tanks, which were the major concern for survey respondents. Proper treatment when necessary was also cited as a water quality concern, especially if the water is stored for longer time periods before use. Greater attention is required for specific and direct subsidies measures for climate actions at the local level to overcome these barriers of cost and storage. Also, an expanded promotion of alternative water supply as a secondary source for sustainability through mandatory housing policy measures and the integration of centralized and decentralized water supply options should be explored (e.g., mandating RWH systems are incorporated in new housing developments). Alongside these measures, reducing the significant NRW to more acceptable levels should be considered as a complementary urban water sustainability strategy. While a strategy exists aiming to reduce NRW from 56% to 30%, this still leaves NRW at very high levels, which could be further reduced.
Implications for Water Policy Planning
In Jamaica, there are comprehensive policy instruments that inform the water, housing and climate change. The major synergies among all policies are that:
Stakeholders’ partnerships are integrated across sectors to achieve policy objectives;
Retrofitting of housing solutions to bolster resilience to climate change is encouraged;
The vulnerability to disaster risk with respect to sea level rise (particularly with housing on coastlines) is highlighted to emphasize the need to build climate resilient housing;
Drought mitigation through demand side water management by way of reduction in losses and non-revenue water is targeted.
In relation to alternative sources of water, rainwater harvesting is promoted as a conservation programme in areas with adequate rainfall and where groundwater and surface water are inadequate. Challenges and conflicts exist, highlighting that while areas with adequate rainfall are targeted, there is no explicit policy measure for the provision of subsidies toward climate actions taken in the form of the use of alternative water sources, especially in urban areas, and in those areas with lower rainfall totals such as Kingston. Likewise, with a central focus for the provision of affordable housing, this will compromise the extent to which retrofitting or new housing solutions with integrated alternative water sources can be provided that also meet the affordable criteria. Another challenge is the limited emphasis on public education to overcome social perceptions that is particularly geared towards the use of ‘fit for purpose’ alternative water supplies (i.e., for non-potable use).
While this research focused on climate change as one factor contributing to water supply vulnerability, another factor of significance is poor water infrastructure that supply utility areas in Jamaica. While they both continue to impact negatively on water supply zones, deciphering the most significant contributor to water insecurity in the Kingston Basin has not been achieved [
30,
31]. Nonetheless, from a water policy and strategic planning perspective, the two factors are different in terms of climate change being an external driver associated with high uncertainty and which should be managed, adapted to, and mitigated against, and the second factor, the quality of infrastructure, being an internal driver also with high impact, but one that can be more reliably managed and controlled. The implication on planning decisions will favour addressing infrastructure needs and upgrades as a more stable and certain route to tackle water supply vulnerability as a no-regret option. Making climate investments addresses longer term activities that affect water supply vulnerability, and will contribute to longer term robustness of the urban water supply system.
With the improvement in climate research in the Caribbean (in terms of both research capacity and research output regarding better resolution data from regional-specific models), as well as the variability and reduction in rainfall patterns for the short and long term future, an integration of specific measures will be needed to capture and manage available water surplus in the very wet seasons, to be able to sustain through to very dry seasons [
12], while also dealing with likely reductions in rainfall totals and shifts in seasonal rainfall patterns. This will benefit from urban water governance measures that integrate centralized and decentralized mechanisms in an effort to meet water sustainability objectives. Further processes to augment water supply and reduce demand will also have to integrate the technical measures that reduce infrastructure losses and promote conservation as part of the integrated approach to water demand and supply management [
31] to achieve sustainability.
In terms of the scientific contribution, this study has demonstrated the applicability of a simple yet robust rainfall-runoff model (Rainru) for assessing future streamflow based on climate projection data. It also shows the significant climate impact projected in the Caribbean region and highlights the need for further studies to inform climate adaptation and mitigation measures to future water shortages in the region.
6. Conclusions
Human and environmental systems are impacted by climate change, and Caribbean SIDS have an inescapable mandate to mitigate and adapt to the risks associated with it. From this research, it is evident that climate change impacts are experienced down to the demand zone (local) levels. As such, whilst the island of Jamaica is generally ‘water rich’, the case for the Kingston Basin is different. As a result of the complex water supply systems within the basin, each water demand zone will have their own measure of vulnerability which calls for tailored climate adaptation measures and water augmentation measures to be adopted at the local, decentralized levels to sustain water supply.
This work has shown that water supply in the Hope Demand Zone, Kingston, is largely underestimated due to large inefficiencies in the supply network, with high NRW rates. Current supply is unable to meet demand in the two communities studied here. Population growth and climate change are likely to exacerbate the current situation. Analysis of projected rainfall over the basin using Caribbean-specific climate modelling, coupled with a rainfall-runoff model validated against historical observations, reveals the extent of climate impacts on water supply. It is shown that rainfall totals are expected to significantly decrease in 2030 and 2050, and under RCPs 2.6 and 8.5, relative to historical conditions. More than this, the timing of the traditional main rainy season is expected to shift from October to May, potentially having implications for water supply security due to concomitant decreases in runoff volume.
Analysis of the potential of decentralised rainwater harvesting shows that it could contribute to closing current water supply-demand deficits in the demand zone, potentially contributing to 7% of total water supply. If only non-potable water uses are considered, the potential is even greater, and household storage required to meet expected non-potable demand is about 1 m3. This level of household storage is feasible for many properties, in terms of space, technical requirements, or cost. RWH could therefore play a critical role in supplying water for non-potable use which represents up to 40% of water demand in Kingston. It has the potential to augment existing supply, freeing up traditional water normally used from non-potable applications for potable-only supply, offering a no-regret climate change mitigation and adaptation strategy. However, climate change impacts will reduce RWH volumes, which should be recognised. In addition, demand-side savings (i.e., homes, businesses), especially reducing the high non-revenue water losses but also including installing low-flow appliances and changing water-use behaviour, along with policies, incentives, and campaigns to raise awareness on water use issues are urgently needed to promote uptake of RWH in existing households and to integrate RWH technology into new developments.
Author Contributions
J.S. and D.A.T. designed the research. D.A.T. carried out fieldwork, surveys, and analysis. Methodology, D.A.T. and P.v.d.Z.; Writing—review & editing, D.A.T., J.S. and P.v.d.Z. All authors have read and agreed to the published version of the manuscript.
Funding
This research was funded by DUPC2, the programmatic cooperation between the Directorate-General for International Cooperation of the Dutch Ministry of Foreign Affairs and IHE Delft in the period 2016–2020 for contribution towards research, fieldwork, and the writing of this manuscript.
Acknowledgments
D.A.T. acknowledges survey respondents in the August Town and Mona Communities, the National Water Commission, Water Resources Authority, Meteorological Office of Jamaica, Ministry of Economic Growth and Job Creation, National Housing Trust, and the University of the West Indies for assistance with fieldwork and data collection. This research was funded by DUPC2, the programmatic cooperation between the Directorate-General for International Cooperation of the Dutch Ministry of Foreign Affairs and IHE Delft in the period 2016–2020 for contribution towards research, fieldwork, and the writing of this manuscript. We gratefully acknowledge two anonymous reviewers for their efforts in improving the quality of this manuscript.
Conflicts of Interest
The authors declare no conflict of interest.
References
- Kundzewicz, Z.W.; Mata, L.J.; Arnell, N.W.; Döll, P.; Jimenez, B.; Miller, K.; Shiklomanov, I. The implications of projected climate change for freshwater resources and their management. Hydrol. Sci. J. 2008, 53, 3–10. [Google Scholar] [CrossRef]
- UNDESA. Water and Sustainable Development. United Nation Department of Economic and Social Affairs. 2015. Available online: https://www.un.org/waterforlifedecade/water_and_sustainable_development.shtml (accessed on 20 October 2019).
- Lorey, D.E. Global Environmental Challenges of the Twenty-First Century: Resources, Consumption, and Sustainable Solutions; Rowman and Littlefield Publishers: Lanham, MD, USA, 2002. [Google Scholar]
- Sušnik, J.; van der Zaag, P. Correlation and causation between the UN Human Development Index and national and personal wealth and resource exploitation. Econ. Res. Ekon. Istraživanja 2017, 30, 1705–1723. [Google Scholar] [CrossRef]
- WWAP. The United Nations World Water Development Report 2015: Water for Sustainable World; UNESCO Publishing: Paris, France, 2015. [Google Scholar]
- UN-OHRLLS. Small Island Developing States in Numbers-Climate Change Edition. 2015. Available online: https://sustainabledevelopment.un.org/content/documents/2189SIDS-IN-NUMBERS-CLIMATE-CHANGE-EDITION_2015.pdf (accessed on 30 November 2019).
- Taylor, M.A.; Stephenson, T.S.; Chen, A.A.; Stephenson, K.A. Climate change and the Caribbean: Review and Response. Caribb. Stud. 2012, 40, 169–200. [Google Scholar] [CrossRef]
- Sookram, S. The impact of climate change on the tourism sector in selected Caribbean countries. Caribb. Dev. Rep. 2009, 2, 204–225. [Google Scholar]
- Karnauskas, K.B.; Donnelly, J.P.; Anchukaitis, K.J. Future freshwater stress for island populations. Nat. Clim. Change 2016. [Google Scholar] [CrossRef]
- Cashman, A. Water security and services in the Caribbean. Water 2014, 6, 1187–1203. [Google Scholar] [CrossRef]
- Butler, D.; Memon, F.A. Water Demand Management; IWA Publishing: London, UK, 2006; ISBN 1843390787. [Google Scholar]
- Ekwue, E. Management of water demand in the Caribbean region: Current practices and future needs. West Indian J. Eng. 2010, 32, 28–35. [Google Scholar]
- Scalley, T.H. Freshwater resources in the Insular Caribbean: An environmental perspective. Caribb. Stud. 2012, 40, 63–93. [Google Scholar] [CrossRef]
- NWC. Kingston and St. Andrew Water Supply Plans; National Water Commission: Canberra, NSW, Australia, 2011. [Google Scholar]
- MEGJC. National Water Sector Policy and Implementation Plan; Ministry of Economic Growth and Job Creation: Kingston, Jamaica, 2019. [Google Scholar]
- Food and Agriculture Organization. Aquastat. 2019. Available online: http://www.fao.org/nr/water/aquastat/countries_regions/JAM/print1.stm (accessed on 19 September 2019).
- Lester, S. Assessing urban household vulnerability at the climate-water-health nexus in Jamaica: A case study of the August Town community. Caribb. Geogr. 2015, 20, 74–90. [Google Scholar]
- STATIN. Population and Housing Census. 27 September 2019. Available online: https://statinja.gov.jm (accessed on 30 November 2019).
- PIOJ. Jamaica Voluntary National Review Report on the Implementation of the 2030 Agenda for Sustainable Development. 2018. Available online: https://sustainabledevelopment.un.org/content/documents/19499JamaicaMain_VNR_Report.pdf (accessed on 30 November 2019).
- Scobie, M. Policy coherence in climate governance in Caribbean Small Island Developing States. Environ. Sci. Policy 2016, 58, 16–28. [Google Scholar] [CrossRef]
- Campbell, J.D.; Taylor, M.A.; Stephenson, T.S.; Watson, R.A.; Whyte, F.S. Future climate of the Caribbean from a regional climate model. Int. J. Climatol. 2011, 31, 1866–1878. [Google Scholar] [CrossRef]
- Van Vuuren, D.P.; Edmonds, J.; Kainuma, M.; Riahi, K.; Thomson, A.; Hibbard, K.; Hurtt, G.C.; Kram, T.; Krey, V.; Lamarque, J.-F.; et al. The representative concentration pathways: An overview. Clim. Chang. 2011, 109, 5. [Google Scholar] [CrossRef]
- Dadhich, G.; Mathur, P. A GIS based analysis for rooftop rain water harvesting. Int. J. Comput. Sci. Eng. Technol. 2016, 7, 129–143. [Google Scholar]
- Jussah, O.; Orabi, M.O.M.; Sušnik, J.; Bichai, F.; Zevenbergen, C. Assessment of the potential contribution of alternative water supply systems in two contrasting locations: Lilongwe, Malawi and Sharm El-Sheikh, Egypt. J. Water Clim. Change 2018. [Google Scholar] [CrossRef]
- Water Project JA. Homeowners’ Guide to Water Use Efficiency. 2018. Available online: www.waterprojectja.com (accessed on 30 November 2019).
- Sharma, S. Rainwater Harvesting Lecture Presentation. Department of Water Supply Engineering. IHE Delft Institute for Water Education. 2017. Available online: https://slideplayer.com/slide/1519628/ (accessed on 14 January 2020).
- Kellagher, R.; Andres, J.G. Rainwater harvesting for domestic water demand and stormwater management. In Alternative Water Supply Systems; Memon, F.A., Ward, S., Eds.; IWA Publishing: London, UK, 2015; ISBN 9781780405506. [Google Scholar]
- Thayil-Blanchard, J.; Mihelcic, J.R. Assessing domestic rainwater harvesting storage cost and geographic availability in Uganda’s Rakai District. In Alternative Water Supply Systems; Memon, F.A., Ward, S., Eds.; IWA Publishing: London, UK, 2015; ISBN 9781780405506. [Google Scholar]
- Memon, F.A.; Ward, S. Alternative Water Supply Systems; IWA Publishing: London, UK, 2015; ISBN 9781780405506. [Google Scholar]
- Jensen, O.; Wu, H. Urban water security indicators: Development and pilot. Environ. Sci. Policy 2018, 83, 33–45. [Google Scholar] [CrossRef]
- Kenney, D.S.; Goemans, C.; Klein, R.; Lowrey, J.; Reidy, K. Residential Water Demand Management: Lessons from Aurora, Colorado1. J. Am. Water Resour. Assoc. 2008, 44, 192–207. [Google Scholar] [CrossRef]
| Publisher’s Note: MDPI stays neutral with regard to jurisdictional claims in published maps and institutional affiliations. |
© 2020 by the authors. Licensee MDPI, Basel, Switzerland. This article is an open access article distributed under the terms and conditions of the Creative Commons Attribution (CC BY) license (http://creativecommons.org/licenses/by/4.0/).
