Abstract
Mercury (Hg) is a ubiquitous environmental toxicant that has caused global concern due to its persistence and bioaccumulation in the environment. Wet deposition is a crucial Hg input for both terrestrial and aquatic environments and is a significant indicator for evaluating the effectiveness of anthropogenic Hg control. Rainwater samples were collected from May 2014 to October 2018 in Chongming Island to understand the multi-year Hg wet deposition characteristics. The annual Hg wet deposition flux ranged from 2.6 to 9.8 μg m−2 yr−1 (mean: 4.9 μg m−2 yr−1). Hg wet deposition flux in Chongming was comparable to the observations at temperate and subtropical background sites (2.0–10.2 μg m−2 yr−1) in the northern hemisphere. Hg wet deposition flux decreased from 8.6 μg m−2 yr−1 in 2014–2015 to 3.8 μg m−2 yr−1 in 2016 and was attributed to a decrease in the volume-weighted mean (VWM) Hg concentration (−4.1 ng L−1 yr−1). The reduced VWM Hg was explained by the decreasing atmospheric Hg and anthropogenic emissions reductions. The annual Hg wet deposition flux further decreased from 3.8 μg m−2 in 2016 to 2.6 μg m−2 in 2018. The reduction of warm season (April–September) rainfall amounts (356–845 mm) mainly contributed to the Hg wet deposition flux reduction during 2016–2018. The multi-year monitoring results suggest that long-term measurements are necessary when using wet deposition as an indicator to reflect the impact of anthropogenic efforts on mercury pollution control and meteorological condition variations.
1. Introduction
Mercury (Hg) is a pollutant of global concern due to its long residence time and neurotoxicity. Once emitted in the atmosphere, Hg can be transported in long distances and cause ecological damage globally [1]. Atmospheric Hg exists in three forms: gaseous elemental mercury (GEM), gaseous oxidized mercury (GOM), and particulate-bound mercury (PBM). GEM contributes to 95–99% of atmospheric Hg with a residence time of 0.5–2 years [2]. Although GOM and PBM represent less than 5% of atmospheric Hg, they impact the global Hg cycling by rapid dry deposition and wet scavenging such as rainfall [3,4]. Hg deposition could represent its pollution characteristics and help us understand Hg cycling. To date, Hg dry deposition is often estimated using measured atmospheric speciated mercury and meteorological parameters due to a lack of direct and accurate measurement methodologies [5,6]. The uncertainties of estimated Hg dry deposition can reach 50–200% or more, while the measurement of Hg wet deposition was thought to be relatively accurate with only experimental bias [6,7]. Thus, the investigation of Hg deposition on terrestrial and aquatic surfaces is often based on wet deposition measurements [8].
Hg wet deposition measurement has been conducted by the National Atmospheric Deposition Program (NADP) and Global Mercury Observation System (GMOS) in Europe and North America since the 1990s [9]. In 2015, GMOS and NADP have conducted ground-based monitoring at 35 and >50 stations around the world, respectively [10]. Previous studies have suggested that meteorological condition and anthropogenic emissions are the most important factors affecting Hg wet deposition flux [8,9]. The spatial difference of 17 GMOS sites in Hg wet deposition flux highlights the importance of rainfall amounts [9]. Long-term Hg wet deposition flux has demonstrated a significant decreasing trend since the 1990s at most European and North American observation sites [11,12]. The observed atmospheric Hg deposition downward trends have been explained by reduced anthropogenic Hg emissions and commercial product releases [12,13]. The similar trend of anthropogenic emission, atmospheric Hg concentrations, and Hg wet deposition illustrates the importance of anthropogenic emissions on Hg wet deposition [12].
Hg wet deposition flux in China has been observed since 2000 at various remote and urban sites, such as Bayinbuluk, Mt. Changbai, Shangri’La, and Nanjing [8,14]. However, most previous observations in China generally aimed to estimate the wet deposition flux in a relatively short period (e.g., one year) [8]. Recently, with the entry into force of the Minamata Convention on Mercury, it is possible that Hg wet deposition flux will be one indicator to evaluate the anthropogenic emission control effect of atmospheric mercury. Anthropogenic Hg emissions in China have also shown a decreasing trend during the past several years [15,16,17]. Therefore, we are interested to know how wet deposition flux of Hg responds to emission variations, which should be based on multi-year measurements.
In this study, we collected four years of rainwater samples on Chongming Island of Shanghai and calculated the Hg wet deposition flux. The latitudinal and seasonal patterns of Hg wet deposition flux distribution were studied to understand their spatiotemporal variation characteristics. The influences of anthropogenic emissions were investigated by analyzing backward trajectories and volume-weighted mean (VWM) Hg concentrations during different periods. In addition, rainfall and large-scale circulation were investigated to explain the trend of Hg wet deposition flux during 2016–2018 and reflect the impact of meteorological conditions.
2. Methodology
2.1. Site Description
The observation site is located at the top of the weather station at the Dongtan Birds National Natural Reserve, Chongming Island (31.52° N, 121.96° E, 10 m above sea level) (Figure S1). Chongming Island is located at the easternmost of the Yangtze River Delta (YRD) region, which comprised 240 million people and was responsible for 24% of China’s GDP in 2018 [18]. Chongming Island has a subtropical monsoon climate with hot, humid summers and cold, dry winters. The dominant land-surface types in the surrounding 20 km are farmlands and wetlands. The downtown area of Shanghai is 50 km southwest of the sampling site. Thus, the wet deposition flux here could reflect the background concentrations of the YRD region and many atmospheric observations have been conducted at this station over the years due to its remote environment [19].
2.2. Rainwater Sampling and Hg Analysis
The collection of rainwater samples at Chongming in this study started in June 2014 and ended in October 2018. We encountered operational problems between June 2015 and February 2016, with no rainwater collected. The rainwater samples were collected every day from 08:00 to 08:00 LST (Local Sidereal Time) using an automated rain collector (Hengda Company, type ZJV-3). The rainwater was collected in a PTFE (Polytetrafluoroethylene) bottle with a Teflon tube and placed in a refrigerator. The bottles were acid-cleaned and rinsed with deionized water before use. A 10 mL 3% HCl solution was placed into a bottle before sampling to store the Hg (II). Normally, we replaced 8 rainwater bottles every two weeks and recorded the data. The sampled bottles were transferred into the refrigerator until analysis. We prepared a whole experimental process blank to reduce experimental error by pouring deionized water into the rain collector and transferring it to the laboratory. The method recovery rate of 98.2 ± 8.2% was calculated by injecting 100 mL 100 ng L−1 HgNO3 into the PTFE bottle and analyzing after two weeks.
The total Hg in the rainwater was analyzed by dual-gold-trap amalgamation and cold vapor atomic fluorescence spectrometry after BrCl oxidation, hydroxylamine hydrochloride neutralization, and SnCl2 reduction. The analysis instrument was a Tekran 2600 using the EPA 1631 method. The detection limit of the Tekran 2600 was 0.1 ng L−1. To confirm the consistency of the instrument, the HgNO3 standards were used to prepare a five-point calibration (0, 5, 20, 50, 100 ng L−1). The calibration curve is shown in Figure S2, with a regression coefficient of 0.997. All of the samples obtained results after subtracting the whole experimental process blank (0.2±0.4 ng L−1).
2.3. Hg Wet Deposition Flux
The Hg wet deposition flux was calculated based on the mean VWM concentration and the total rainwater amount collected during the sampling period. The VWM concentration was calculated using the following equation:
where Ci is the Hg concentration for a daily rainfall event (ng L−1), and Vi is the rainfall depth (mm). The wet deposition of Hg during a certain period was calculated by multiplying the sum of the rainfall depth during the calculation period by VWM concentration according to Equation (2):
where Fw is the Hg wet deposition flux during a certain period. The monthly and annual Hg wet deposition flux was calculated based on monthly and annual rainfall depth and VWM concentrations to avoid the impact of missing values in daily rain events.
2.4. Analysis Method and Data Acquisition
To identify the influence of airmasses from different transport pathways, 48 h backward trajectories were estimated at 00:00 and 12:00 LST each rainy day using the Hybrid Single Particle Lagrangian Integrated Trajectory (HYSPLIT) model [20]. The 1° × 1° gridded meteorological data from the Global Data Assimilation System were used in this study. The endpoint was set at the sampling site with a height of 500 m above sea level, representing the center of the boundary layer [19].
Cluster analysis was used in the backward trajectories. In the procedure, each trajectory was coupled with the sampling concentrations (rainwater Hg and rainfall amounts) on that day. All of the calculation processes were carried out in the Meteoinfo software and ArcMap 10.2. More details about cluster analysis can be found in Dorling, et al. [21].
Atmospheric Hg data were obtained from the Tekran 2537X/1130/1135 speciation unit at the sampling site. The working conditions, quality assurance and quality control procedure of the instrument were described in Tang, et al. [22]. The total gaseous mercury (TGM) was the annual average during the sampling period, and Sen’s slope was used to calculate the decreasing trend via the monthly VWM Hg data from the “mblm” package in R 4.0.2. To avoid the influence of missing values on interannual investigation, the Sen’s slope of Apr–Sep and Oct–Mar were calculated and averaged for the total Sen’s slope [23].
3. Results and Discussion
3.1. Characteristics of Hg Wet Deposition Flux
The daily VWM Hg concentrations ranged from 0.1 to 37.3 ng L−1 during the sampling period (Figure 1). The arithmetic mean value of VWM Hg concentrations (7.6 ng L−1) was higher than the median value (5.7 ng L−1), indicating the occurrence of episodic high concentration events. The highest frequencies were in the range from 2.0 to 6.0 ng L−1. Our daily mean rainwater Hg data (7.5 ng L−1) were within the range of values measured at other subtropical and temperate background monitoring sites in East Asia, such as Mt. Damei (3.7 ng L−1), Mt. Ailao (3.7 ng L−1), Mt. Changbai (7.4 ng L−1), and Lulin (9.2 ng L−1) (Table 1).
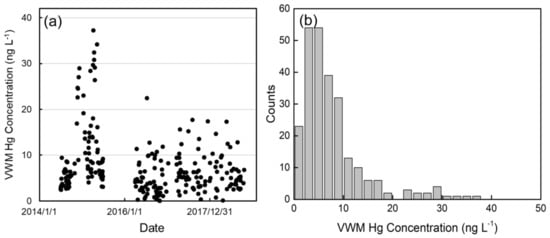
Figure 1.
(a) Times series of rainy events and its volume-weighted mean (VWM) Hg concentrations. (b) The frequency distribution of VWM Hg concentrations.

Table 1.
Summary of Hg wet deposition flux at various sites worldwide.
The annual wet deposition during the sampling period ranged from 2.6 to 9.8 μg m−2 yr−1, with a multi-year annual average of 4.9 μg m−2 yr−1. The Hg wet deposition flux in Chongming was lower than that at tropical background stations, such as Pengjiayu (10.2 μg m−2 yr−1), Puerto Rico (27.9 μg m−2 yr−1), Mt. Lulin (32.3 μg m−2 yr−1), and Mt. Ailao (7.2 μg m−2 yr−1), and higher than that at temperate background stations such as Mt. Waliguan (2.0 μg m−2 yr−1), Pallas (1.2 μg m−2 yr−1), Ny-Alesund (2.5 μg m−2 yr−1), and Bayinbuluk (2.0 μg m−2 yr−1) (Table 1). The rainfall depths were thought to be the main drivers of the different Hg wet deposition flux amounts [8]. The rainfall amount differences were attributed to variations of latitude and temperate regions have lower rainfall amounts than the subtropical and tropical regions (Figure S3). In addition, the Hg wet deposition flux amount in Chongming was lower than that at the urban areas in the YRD, such as Nanjing (56.5 μg m−2 yr−1) and Shanghai (304 μg m−2 yr−1) [14]. The VWM concentration in Chongming was lower than that at Nanjing and Shanghai (10.1–30.7 ng L−1) and the annual rainfall depth in Chongming (834 mm) was lower than that of the downtown area of Shanghai (1100–1400 mm) due to the urban heat island effect [31]. The lower rainfall amounts and VWM Hg concentration both contributed to relatively low Hg wet deposition flux amounts in Chongming. Compared to the Hg wet deposition measurement in 2008–2009 in Chongming, the VWM Hg concentration showed a significant reduction from 62 ng L−1 in 2008–2009 to 7.6 ng L−1 in 2014–2018 [24]. The reduction of rainwater Hg concentrations suggests the atmospheric Hg concentrations declined in recent decades in Chongming, which is similar to the long-term variation of anthropogenic atmospheric Hg emissions in China [15,32].
Seasonal Hg wet deposition flux reached a maximum in summer and a minimum during winter, a pattern that is similar to the seasonal rainfall variation (Figure 2). Such seasonal patterns have been observed in eastern China, such as at Mt. Changbai, Qingdao, and Mt. Damei [8,28]. The air mass is transported from the Pacific Ocean to eastern China under the impact of the Asian summer monsoon with a significant amount of rainfall during summer [33]. The enhanced rainfall contributes to GEM oxidation and GOM dissolution in cloud water, leading to elevated Hg wet deposition flux during summer [34,35,36]. The VWM Hg concentrations were at minimum values in July and at maximum values in January. Anthropogenic emissions and rainfall amounts were the dominant factors in the VWM Hg concentrations. The anthropogenic atmospheric Hg emissions increased in the YRD region due to enhanced energy consumption during the winter [37]. The high PM2.5 concentrations resulted in more GEM oxidation with higher GOM/PBM concentrations [19,38]. Meanwhile, airmass from northern China and Mongolia resulted in cold and dry weather with less rainfall in Chongming during winter. The enhanced PBM and lower rainfall amounts contributed to elevated VWM Hg concentrations during the winter.
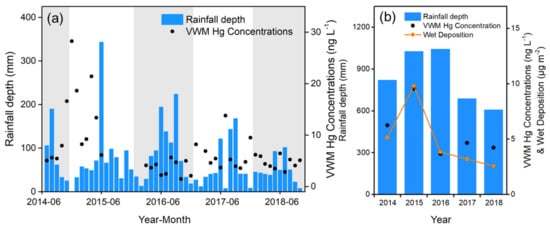
Figure 2.
Time series of (a) monthly and (b) annual precipitation amounts and VWM Hg concentrations from June 2014 to October 2018. The alternate grey-white blocks represent different years. The missing black dots from June 2015 to February 2016 were due to instrument problems.
3.2. Impacts of Anthropogenic Emissions on Hg Wet Deposition Flux
To identify the major source regions of Hg in rainfall and investigate the influence of anthropogenic emissions, 48 h backward trajectories of 251 rainfall events were simulated during the sampling period. Chongming Island is affected by a subtropical monsoon climate, with 80% percent of rainfall occurring during the warm season (April–September). Thus, the 502 backward trajectories were divided into two parts by warm (April–September) and cold (October–March) seasons (Figure 2). During the warm season, cluster 1, cluster 2, and cluster 3 showed the airmass pathway from the Pacific Ocean, contributing to 65% of the rainfall events. The airmass from the Pacific Ocean during the warm season (clusters 1,2,3) contained a large amount of rainwater (13.92 mm) with relatively low VWM Hg concentrations (5.83 ng L−1). Cluster 4 originated from northern China and contained less rainfall (9.38 mm) with enhanced VWM Hg concentration (7.91 ng L−1). Figure 3b shows backward trajectories during the cold season. Clusters 2, 3, and 4 mainly originated from northern China and the Mongolia Plateau with 6.63 mm rainfall and 7.5 ng L−1 Hg concentration in airmass. The airmass from industrial area, such as the north China plain region and YRD region, could impact Hg wet deposition by scavenging atmospheric Hg into rainwater. Given that Hg wet deposition in Chongming was impacted by the airmass from eastern and northern China, the multi-year wet flux observation could reflect the effect of anthropogenic emission reduction in these areas.
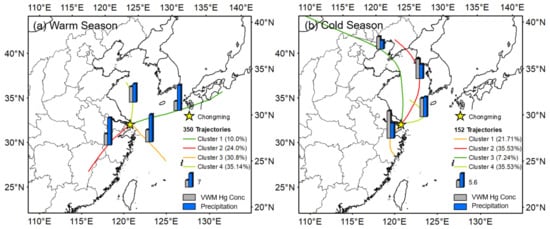
Figure 3.
Forty-eight hour backward trajectories during the warm season (April–September) and cold season (October–March) in Chongming. The bar plot shows the mean rainfall depth and VWM Hg concentrations during the warm and cold season.
During the sampling period, the annual Hg wet deposition flux decreased from 8.6 μg m−2 in 2014–2015 to 3.8 μg m−2 in 2016. From June 2014 to December 2016, the decreasing trend (Sen’s slope) of the VWM Hg concentration was 4.09 ng L−1 yr−1 (42% yr−1) (Figure 4). In East Asia, previous long-term observations have mainly focused on atmospheric Hg concentrations instead of Hg wet deposition flux. Recent atmospheric Hg observation studies have also shown significant reductions in South Korea and Japan [39,40]. The decreasing trend of TGM in Chongming was 29.8% yr−1 from 2014 to 2016, which is similar to the significant reduction in the VWM Hg concentration during the sampling period [22] (Figure 4). The PBM decreased from 24.51 pg m−3 in 2014 to 19.79 pg m−3 in 2018, whereas GOM increased from 15.41 pg m−3 in 2014 to 20.08 pg m−3 in 2018 (Figure S4). The slight variation (39.86–41.05 pg m−3) of reactive mercury (GOM+PBM) demonstrated the importance of GEM oxidation and dissolution, which is a dominant rainwater Hg source in the marine boundary layer due to GEM oxidation via bromine [34,36,41]. The VWM Hg reduction during the cold season (from 12.4 ng L−1 in 2014 to 4.6 ng L−1 in 2018) was more pronounced than the reduction in the warm season (from 5.4 ng L−1 in 2014 to 2.7 ng L−1 in 2018). After considering the rainout effect of VWM Hg concentration (Figure S5), the seasonal variation of Hg concentration suggests that the airmass from northern China had greater VWM Hg reductions than the airmass from overseas [16,42]. Many previous observations and modeling results have shown that the TGM/GEM reduction in China can be explained by reduced anthropogenic emissions in China [16,22,42]. Hg emissions decreased more quickly in the winter due to the changing of residential heating methods [16]. Therefore, the decreasing VWM Hg concentrations in Chongming between 2014 and 2016 were caused by atmospheric Hg concentration reductions, which could be attributed to the decline in Chinese anthropogenic Hg emissions in recent years [12].
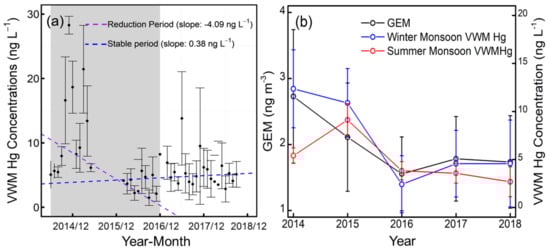
Figure 4.
(a) The decreasing trend (Sen’s slope) of the VWM Hg concentrations from June 2014 to December 2016 (reduction period, in grey panel) and from March 2016 to October 2018 (stable period, in white panel). (b) Comparison of gaseous elemental mercury (GEM) and the annual seasonal trend of VWM Hg from 2014 to 2018. The error bars indicate the standard error of the calculated monthly and annual VWM Hg concentrations and GEM.
From 2016 to 2018, the GEM and VWM Hg concentrations both remained at a relatively stable level with a slight increase of 0.38 ng L−1 (Sen’s slope) in VWM Hg concentration. The average VWM Hg concentration during 2016–2018 (4.0±1.7 ng L−1) was lower than that of the most subtropical remote background sites in east Asia (3.7–9.2 ng L−1), whereas the TGM (1.7±0.1 ng m−3) was only slightly higher than that of the background concentrations in the northern hemisphere (1.3–1.5 ng m−3) [43]. The estimated annual Hg wet deposition flux further decreased from 2016 to 2018 under stable VWM Hg concentrations, which could be attributed to the interannual rainfall variation.
3.3. Impact of Meteorological Conditions on Hg Wet Deposition
Meteorological conditions have been found to be an important influential factor on Hg wet deposition flux [25,44,45]. A significant positive correlation between the daily rainfall depth and Hg wet deposition flux was observed (Figure 5, R2 = 0.55, p < 0.01). This explained variation was slightly lower than that of the previous studies in temperate and subtropical remote regions (R2 ranging from 0.6 to 0.8), which may be attributed to the influence of anthropogenic emissions [8,25,30,46]. Furthermore, the relationship between the VWM Hg concentration and wet deposition was not pronounced (R2 = 0.05), which highlights the importance of rainfall amounts on Hg wet deposition flux in Chongming.
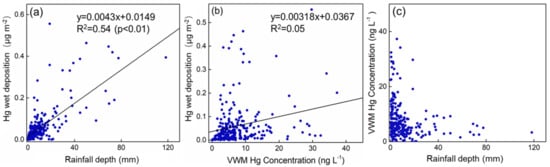
Figure 5.
The correlation between (a) rainfall depth and (b) VWM Hg concentration and wet deposition of Hg. The fitted line was calculated by the least-squares method. (c) The scatter plot between rainfall depth and VWM Hg concentrations.
A pronounced rainout effect was observed in Chongming, where the VWM Hg decreased with the increased rainfall amounts (Figure 5). Rainfall type is thought to be an important influential factor on rainwater Hg concentration and to affect the rainout effect of rainwater mercury [35,45,47]. Convective rain can enhance GOM and PBM solutions, leading to more Hg wet deposition compared to non-convective rain [35,45,47]. Under the control of a cold high-pressure system, almost no convective rain occurs in October–March in Chongming. Nearly all of the convective weather occurs during April–September, about 15 times per year [48]. The correlation between VWM Hg concentration and rainfall depth showed little difference between the warm season (R2 = 0.04, p = 0.012) and cold season (R2 = 0.05, p = 0.10), suggesting the rain type was not an important factor in Chongming (Figure S5).
Between 2016 and 2018, the Hg wet deposition flux decreased from 3.8 to 2.5 μg m−2 with a stable VWM Hg concentration. The annual rainfall depth decreased from 1027 mm in 2014 to 608 mm in 2018, with the variation in the warm season being more pronounced (845–356 mm) than that in the cold season (163–320 mm) (Figure 6). The reduction of rainfall depth in the warm season from 845 mm in 2016 to 356 mm in 2018 dominated the Hg wet deposition flux reduction. The interannual rainfall depth variation in the warm season reflected the variation of large-scale circulation, such as monsoon activity [49]. The East Asian Summer Monsoon Index (EASMI) demonstrates the dominant wind variation from winter to summer at 850 hPa in East Asia and has been widely used in previous meteorological studies [49,50]. When the EASMI <0, it means the dominant wind direction during summer was reversed compare to the wind direction during winter. When the EASMI >0, it means the dominant wind direction during summer was similar to the wind direction during winter. The EASMI has a good correlation (R2 = 0.40, p = 0.25, Figure S6) with the warm season rainfall in Chongming, and is comparable with the previous meteorological studies in the YRD region (R2 = 0.3~0.5) [50]. The EASMI verified the interannual variation of rainfall amounts in the warm season during the sampling period. Thus, the large-scale meteorological circulation could impact wet deposition in Chongming by increasing or decreasing rainfall depth, and thus lead to the Hg wet deposition reduction from 2016 to 2018.
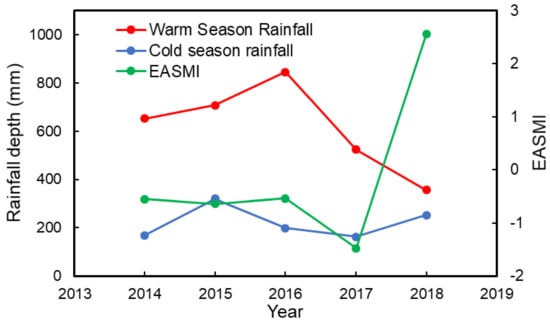
Figure 6.
The annual variation in rainfall depth of warm and cold seasons and the East Asian Summer Monsoon Index (EASMI) index of the warm season during the sampling period.
4. Conclusions
In this study, multi-year daily rainfall events were collected and measured in Chongming from 2014 to 2018. During the sampling period, the mean VWM Hg concentration (7.6 ng L−1) in Chongming was within the range of temperate and subtropical background observation sites in East Asia (3.7–9.2 ng L−1) and lower than the urban site of YRD region (10.1–30.7 ng L−1), reflecting the relatively clean environment in Chongming. The annual Hg wet deposition flux ranged from 2.6 to 9.8 μg m−2 yr−1 with a mean value of 4.9 μg m−2 yr−1. The seasonal variation of Hg wet deposition flux was characterized by a maximum in June and a minimum in December, induced by the variation of rainfall amounts.
During the sampling period, a pronounced Hg wet reduction was observed from 8.6 μg m−2 in 2014–2015 to 2.6 μg m−2 in 2018, with an annual average of 4.9 μg m−2. The Hg wet deposition reduction was attributed to the decreasing VWM Hg concentrations and reduction in the interannual rainfall. The Hg wet deposition flux decreased from 8.6 μg m−2 in 2014–2015 to 3.8 μg m−2 in 2016, with the VWM Hg concentration decreasing by 4.1 ng L−1 yr−1. The reduced VWM Hg concentrations were driven by anthropogenic Hg emissions reductions, which were verified by the reduced atmospheric Hg concentrations. A further reduction in Hg wet deposition flux was observed under stable VWM Hg concentrations from 2016 to 2018. The interannual variation of the Asian summer monsoon activity resulted in the reduction in the rainfall from 845 mm in 2016 to 356 mm in 2018 during the warm season. These multi-year Hg wet deposition flux measurements could provide insights into the impact of Hg emissions reductions and interannual meteorological variations. Thus, we recommend using long-term Hg wet deposition flux values to evaluate the impact of anthropogenic emissions reductions and interannual meteorological conditions in future mercury assessment programs.
Supplementary Materials
The following are available online at https://www.mdpi.com/2073-4433/11/12/1301/s1, Figure S1: (a,b) Location of Chongming background observation station; (c) the photo of sampling weather station; Figure S2: Calibration plot for analysis of mercury by Tekran 2600; Figure S3: The (a) latitude (b) altitude (c) rainfall amount vs. wet Hg deposition in selected monitoring station of northern hemisphere; Figure S4: The annual GOM and PBM concentration in Chongming from 2014 to 2018. The Tekran 2537/1130/1135 encounter operation problem in 2015 and 2017, making it difficult to use annual mean concentration directly; Figure S5: Correlation between VWM Hg concentration and rainfall depth during (a) warm season and (b) cold season; Figure S6. Correlation of warm season rainfall depth and East Asia Summer Monsoon Index during sampling period.
Author Contributions
Y.T. and Q.W. designed the research. Y.T., W.G. and J.L. performed the research. Y.T. analyzed the data. Y.T., Q.W., S.W., K.L., Z.L. and D.H. wrote the manuscript with contributions from all other co-authors. All authors have read and agreed to the published version of the manuscript.
Funding
This research was funded by National Natural Science Foundation of China (21625701) and the Samsung Advanced Institute of Technology. Youth Program of National Natural Science Foundation of China: Grant No. 42007190. National Postdoctoral innovative talent program: Grant No. BX20190169; Tsinghua University “Shuimu Scholar” project: No. 2019SM061; China Postdoctoral Science Foundation Funded Project, Grant No. 2019M660672. National Key R&D Program of China (No. 2016YFC0201900). Dr. Shuxiao Wang acknowledges the support from the Tencent Foundation through the XPLORER PRIZE.
Conflicts of Interest
The authors declare no conflict of interest.
References
- Lin, C.J.; Pehkonen, S.O. The chemistry of atmospheric mercury: A review. Atmos. Environ. 1999, 2067–2079. [Google Scholar] [CrossRef]
- Schroeder, W.H.; Munthe, J. Atmospheric mercury—An overview. Atmos. Environ. 1998, 32, 809–822. [Google Scholar] [CrossRef]
- Lindberg, S.; Bullock, R.; Ebinghaus, R.; Engstrom, D.; Feng, X.; Fitzgerald, W.; Pirrone, N.; Prestbo, E.; Seigneur, C. A synthesis of progress and uncertainties in attributing the sources of mercury in deposition. Ambio 2007, 36, 19. [Google Scholar] [CrossRef]
- Amos, H.M.; Jacob, D.J.; Holmes, C.D.; Fisher, J.A.; Wang, Q.; Yantosca, R.M.; Corbitt, E.S.; Galarneau, E.; Rutter, A.P.; Gustin, M.S.; et al. Gas-particle partitioning of atmospheric Hg(II) and its effect on global mercury deposition. Atmos. Chem. Phys. 2012, 12, 591–603. [Google Scholar] [CrossRef]
- Gustin, M.S.; Huang, J.; Miller, M.B.; Peterson, C.; Jaffe, D.A.; Ambrose, J.; Finley, B.D.; Lyman, S.N.; Call, K.; Talbot, R.; et al. Do we understand what the mercury speciation instruments are actually measuring? Results of RAMIX. Environ. Sci. Technol. 2013, 47, 7295–7306. [Google Scholar] [CrossRef]
- Zhang, L.; Wu, Z.; Cheng, I.; Wright, L.P.; Olson, M.L.; Gay, D.A.; Risch, M.R.; Brooks, S.; Castro, M.S.; Conley, G.D.; et al. The Estimated Six-Year Mercury Dry Deposition Across North America. Environ. Sci. Technol. 2016, 50, 12864–12873. [Google Scholar] [CrossRef]
- Zhang, L.; Lyman, S.; Mao, H.; Lin, C.-J.; Gay, D.A.; Wang, S.; Sexauer Gustin, M.; Feng, X.; Wania, F. A synthesis of research needs for improving the understanding of atmospheric mercury cycling. Atmos. Chem. Phys. 2017, 17, 9133–9144. [Google Scholar] [CrossRef]
- Fu, X.; Yang, X.; Lang, X.; Zhou, J.; Zhang, H.; Yu, B.; Yan, H.; Lin, C.-J.; Feng, X. Atmospheric wet and litterfall mercury deposition at urban and rural sites in China. Atmos. Chem. Phys. 2016, 16, 11547–11562. [Google Scholar] [CrossRef]
- Sprovieri, F.; Pirrone, N.; Bencardino, M.; D’Amore, F.; Angot, H.; Barbante, C.; Brunke, E.-G.; Arcega-Cabrera, F.; Cairns, W.; Comero, S.; et al. Five-year records of mercury wet deposition flux at GMOS sites in the Northern and Southern hemispheres. Atmos. Chem. Phys. 2017, 17, 2689–2708. [Google Scholar] [CrossRef]
- UNEP. Global Mercury Assessment 2018. Available online: https://www.unenvironment.org/resources/publication/global-mercury-assessment-2018 (accessed on 30 November 2020).
- Prestbo, E.M.; Gay, D.A. Wet deposition of mercury in the U.S. and Canada, 1996–2005: Results and analysis of the NADP mercury deposition network (MDN). Atmos. Environ. 2009, 43, 4223–4233. [Google Scholar] [CrossRef]
- Zhang, Y.; Jacob, D.J.; Horowitz, H.M.; Chen, L.; Amos, H.M.; Krabbenhoft, D.P.; Slemr, F.; St Louis, V.L.; Sunderland, E.M. Observed decrease in atmospheric mercury explained by global decline in anthropogenic emissions. Proc. Natl. Acad. Sci. USA 2016, 113, 526. [Google Scholar] [CrossRef] [PubMed]
- Horowitz, H.M.; Jacob, D.J.; Amos, H.M.; Streets, D.G.; Sunderland, E.M. Historical Mercury releases from commercial products: Global environmental implications. Environ. Sci. Technol. 2014, 48, 10242–10250. [Google Scholar] [CrossRef] [PubMed]
- Zhu, J.L.; Wang, T.J.; Talbot, R.; Mao, H.T.; Yang, X.; Fu, C.; Sun, J.; Zhuang, B.; Li, S.; Han, Y.; et al. Characteristics of atmospheric mercury deposition and size-fractionated particulate mercury in urban Nanjing, China. Atmos. Chem. Phys. 2014, 14, 2233–2244. [Google Scholar] [CrossRef]
- Wu, Q.R.; Wang, S.X.; Li, G.L.; Liang, S.; Lin, C.J.; Wang, Y.; Cai, S.Y.; Liu, K.Y.; Hao, J.M. Temporal Trend and Spatial Distribution of Speciated Atmospheric Mercury Emissions in China During 1978–2014. Environ. Sci. Technol. 2016, 50, 13428–13435. [Google Scholar] [CrossRef]
- Liu, K.Y.; Wu, Q.R.; Wang, L.; Wang, S.X.; Liu, T.H.; Ding, D.; Tang, Y.; Li, G.L.; Tian, H.Z.; Duan, L.; et al. Measure-Specific Effectiveness of Air Pollution Control on China’s Atmospheric Mercury Concentration and Deposition during 2013–2017. Environ. Sci. Technol. 2019, 53, 8938–8946. [Google Scholar] [CrossRef]
- Wu, Q.; Li, G.; Wang, S.; Liu, K.; Hao, J. Mitigation options of atmospheric Hg emissions in China. Environ. Sci. Technol. 2018, 52, 12368–12375. [Google Scholar] [CrossRef]
- National Bureau of Statiatics of China. China Statistical Yearbook. 2019. Available online: http://www.stats.gov.cn/tjsj/ndsj/2019/indexeh.htm (accessed on 30 November 2020).
- Zhang, L.; Wang, L.; Wang, S.; Dou, H.; Li, J.; Li, S.; Hao, J. Characteristics and Sources of Speciated Atmospheric Mercury at a Coastal Site in the East China Sea Region. Aerosol. Air Qual. Res. 2017, 17, 2913–2923. [Google Scholar] [CrossRef]
- Draxler, R.R.; Hess, G.D. An overview of the hysplit-4 modeling system for trajectories. Aust. Meteorol. Mag. 1998, 47, 295–308. [Google Scholar]
- Dorling, S.R.; Davis, T.D.; Pierce, C.E. Cluster analysis: A technique for estimating the synoptic meteorological controls on air and precipitation chemistry—Method and applications. Atmos. Environ. 1992, 26, 2581–2585. [Google Scholar] [CrossRef]
- Tang, Y.; Wang, S.; Wu, Q.; Liu, K.; Wang, L.; Li, S.; Gao, W.; Zhang, L.; Zheng, H.; Li, Z.; et al. Recent decrease trend of atmospheric mercury concentrations in East China: The influence of anthropogenic emissions. Atmos. Chem. Phys. 2018, 18, 8279–8291. [Google Scholar] [CrossRef]
- Cole, A.S.; Steffen, A.; Pfaffhuber, K.A.; Berg, T.; Pilote, M.; Poissant, L.; Tordon, R.; Hung, H. Ten-year trends of atmospheric mercury in the high Arctic compared to Canadian sub-Arctic and mid-latitude sites. Atmos. Chem. Phys. 2013, 13, 1535–1545. [Google Scholar] [CrossRef]
- Shi, G.; Chen, Z.; Teng, J.; Li, Y. Spatio-temporal variation of total mercury in precipitation in the largest industrial base in China: Impacts of meteorological factors and anthropogenic activities. Tellus B Chem. Phys. Meteorol. 2015, 67, 25660. [Google Scholar] [CrossRef]
- Nguyen, L.S.P.; Sheu, G.-R. Four-year Measurements of Wet Mercury Deposition at a Tropical Mountain Site in Central Taiwan. Aerosol Air Qual. Res. 2019, 19, 2043–2055. [Google Scholar] [CrossRef]
- Sheu, G.-R.; Lin, N.-H. Characterizations of wet mercury deposition to a remote islet (Pengjiayu) in the subtropical Northwest Pacific Ocean. Atmos. Environ. 2013, 77, 474–481. [Google Scholar] [CrossRef]
- Huang, J.; Kang, S.; Wang, S.; Wang, L.; Zhang, Q.; Guo, J.; Wang, K.; Zhang, G.; Tripathee, L. Wet deposition of mercury at Lhasa, the capital city of Tibet. Sci. Total Environ. 2013, 447, 123–132. [Google Scholar] [CrossRef]
- Chen, L.; Li, Y.; Liu, C.; Guo, L.; Wang, X. Wet deposition of mercury in Qingdao, a coastal urban city in China: Concentrations, fluxes, and influencing factors. Atmos. Environ. 2018, 174, 204–213. [Google Scholar] [CrossRef]
- Seo, Y.-S.; Han, Y.-J.; Choi, H.-D.; Holsen, T.M.; Yi, S.-M. Characteristics of total mercury (TM) wet deposition: Scavenging of atmospheric mercury species. Atmos. Environ. 2012, 49, 69–76. [Google Scholar] [CrossRef]
- Sakata, M.; Marumoto, K. Wet and dry deposition fluxes of mercury in Japan. Atmos. Environ. 2005, 39, 3139–3146. [Google Scholar] [CrossRef]
- Voogt, J.A.; Oke, T.R. Thermal remote sensing of urban climates. Remote Sens. Environ. 2003, 86, 370–384. [Google Scholar] [CrossRef]
- Zhang, L.; Wang, S.X.; Wang, L.; Wu, Y.; Duan, L.; Wu, Q.R.; Wang, F.Y.; Yang, M.; Yang, H.; Hao, J.M.; et al. Updated emission inventories for speciated atmospheric mercury from anthropogenic sources in China. Environ. Sci. Technol. 2015, 49, 3185–3194. [Google Scholar] [CrossRef]
- Fu, X.W.; Zhang, H.; Yu, B.; Wang, X.; Lin, C.J.; Feng, X.B. Observations of atmospheric mercury in China: A critical review. Atmos. Chem. Phys. 2015, 15, 9455–9476. [Google Scholar] [CrossRef]
- Horowitz, H.M.; Jacob, D.J.; Zhang, Y.; Dibble, T.S.; Slemr, F.; Amos, H.M.; Schmidt, J.A.; Corbitt, E.S.; Marais, E.A.; Sunderland, E.M. A new mechanism for atmospheric mercury redox chemistry: Implications for the global mercury budget. Atmos. Chem. Phys. Discuss. 2017, 1–33. [Google Scholar] [CrossRef]
- Holmes, C.D.; Krishnamurthy, N.P.; Caffrey, J.M.; Landing, W.M.; Edgerton, E.S.; Knapp, K.R.; Nair, U.S. Thunderstorms Increase Mercury Wet Deposition. Environ. Sci. Technol. 2016, 50, 9343–9350. [Google Scholar] [CrossRef] [PubMed]
- Holmes, C.D.; Jacob, D.J.; Corbitt, E.S.; Mao, J.; Yang, X.; Talbot, R.; Slemr, F. Global atmospheric model for mercury including oxidation by bromine atoms. Atmos. Chem. Phys. 2010, 10, 12037–12057. [Google Scholar] [CrossRef]
- Liu, K.Y.; Wang, S.X.; Wu, Q.R.; Wang, L.; Ma, Q.; Zhang, L.; Li, G.L.; Tian, H.Z.; Duan, L.; Hao, J.M. A Highly Resolved Mercury Emission Inventory of Chinese Coal-Fired Power Plants. Environ. Sci. Technol. 2018, 52, 2400–2408. [Google Scholar] [CrossRef]
- Hong, Y.W.; Chen, J.S.; Deng, J.J.; Tong, L.; Xu, L.L.; Niu, Z.C.; Yin, L.Q.; Chen, Y.T.; Hong, Z.Y. Pattern of atmospheric mercury speciation during episodes of elevated PM2.5 levels in a coastal city in the Yangtze River Delta, China. Environ. Pollut. 2016, 218, 259–268. [Google Scholar] [CrossRef]
- Kim, K.-H.; Brown, R.J.C.; Kwon, E.; Kim, I.-S.; Sohn, J.-R. Atmospheric mercury at an urban station in Korea across three decades. Atmos. Environ. 2016, 131, 124–132. [Google Scholar] [CrossRef]
- Marumoto, K.; Suzuki, N.; Shibata, Y.; Takeuchi, A.; Takami, A.; Fukuzaki, N.; Kawamoto, K.; Mizohata, A.; Kato, S.; Yamamoto, T.; et al. Long-Term Observation of Atmospheric Speciated Mercury during 2007–2018 at Cape Hedo, Okinawa, Japan. Atmosphere 2019, 10, 362. [Google Scholar] [CrossRef]
- Wang, S.; McNamara, S.M.; Moore, C.W.; Obrist, D.; Steffen, A.; Shepson, P.B.; Staebler, R.M.; Raso, A.R.W.; Pratt, K.A. Direct detection of atmospheric atomic bromine leading to mercury and ozone depletion. Proc. Natl. Acad. Sci. USA 2019, 116, 14479–14484. [Google Scholar] [CrossRef]
- Wu, Q.; Tang, Y.; Wang, S.; Li, L.; Deng, K.; Tang, G.; Liu, K.; Ding, D.; Zhang, H. Developing a statistical model to explain the observed decline of atmospheric mercury. Atmos. Environ. 2020, 243, 117868. [Google Scholar] [CrossRef]
- Sprovieri, F.; Pirrone, N.; Bencardino, M.; D’Amore, F.; Carbone, F.; Cinnirella, S.; Mannarino, V.; Landis, M.; Ebinghaus, E.; Weigelt, A.; et al. Atmospheric mercury concentrations observed at ground-based monitoring sites globally distributed in the framework of the GMOS network. Atmos. Chem. Phys. 2016, 16, 11915–11935. [Google Scholar] [CrossRef] [PubMed]
- Mao, H.; Ye, Z.; Driscoll, C. Meteorological effects on Hg wet deposition in a forested site in the Adirondack region of New York during 2000–2015. Atmos. Environ. 2017, 168, 90–100. [Google Scholar] [CrossRef]
- Shanley, J.B.; Engle, M.A.; Scholl, M.; Krabbenhoft, D.P.; Brunette, R.; Olson, M.L.; Conroy, M.E. High Mercury Wet Deposition at a “Clean Air” Site in Puerto Rico. Environ. Sci. Technol. 2015, 49, 12474–12482. [Google Scholar] [CrossRef] [PubMed]
- Nguyen, L.S.P.; Sheu, G.R.; Lin, D.W.; Lin, N.H. Temporal changes in atmospheric mercury concentrations at a background mountain site downwind of the East Asia continent in 2006–2016. Sci. Total Environ. 2019, 686, 1049–1056. [Google Scholar] [CrossRef]
- Kaulfus, A.S.; Nair, U.; Holmes, C.D.; Landing, W.M. Mercury Wet Scavenging and Deposition Differences by Precipitation Type. Environ. Sci. Technol. 2017, 51, 2628–2634. [Google Scholar] [CrossRef]
- Yang, L.H.; Yin, H.P.; Wang, H.; Tao, L. Statistical analysis of severe convective weather in shanghai area during period of recent 10 years. Atmos. Sci. Res. Appl. 2007, 2, 84–91. [Google Scholar]
- Li, J.; Wu, Z.; Jiang, Z.; He, J. Can Global Warming Strengthen the East Asian Summer Monsoon? J. Clim. 2010, 23, 6696–6705. [Google Scholar] [CrossRef]
- Li, J.P.; Zeng, Q.C. A new monsoon index and the geographical distribution of the global monsoons. Adv. Atmos. Sci. 2003, 20, 299–302. [Google Scholar]


Publisher’s Note: MDPI stays neutral with regard to jurisdictional claims in published maps and institutional affiliations. |
© 2020 by the authors. Licensee MDPI, Basel, Switzerland. This article is an open access article distributed under the terms and conditions of the Creative Commons Attribution (CC BY) license (http://creativecommons.org/licenses/by/4.0/).