Association between the Concentration and the Elemental Composition of Outdoor PM2.5 and Respiratory Diseases in Schoolchildren: A Multicenter Study in the Mediterranean Area

 , ,
, ,  , , and
Abstract
1. Introduction
2. Methods
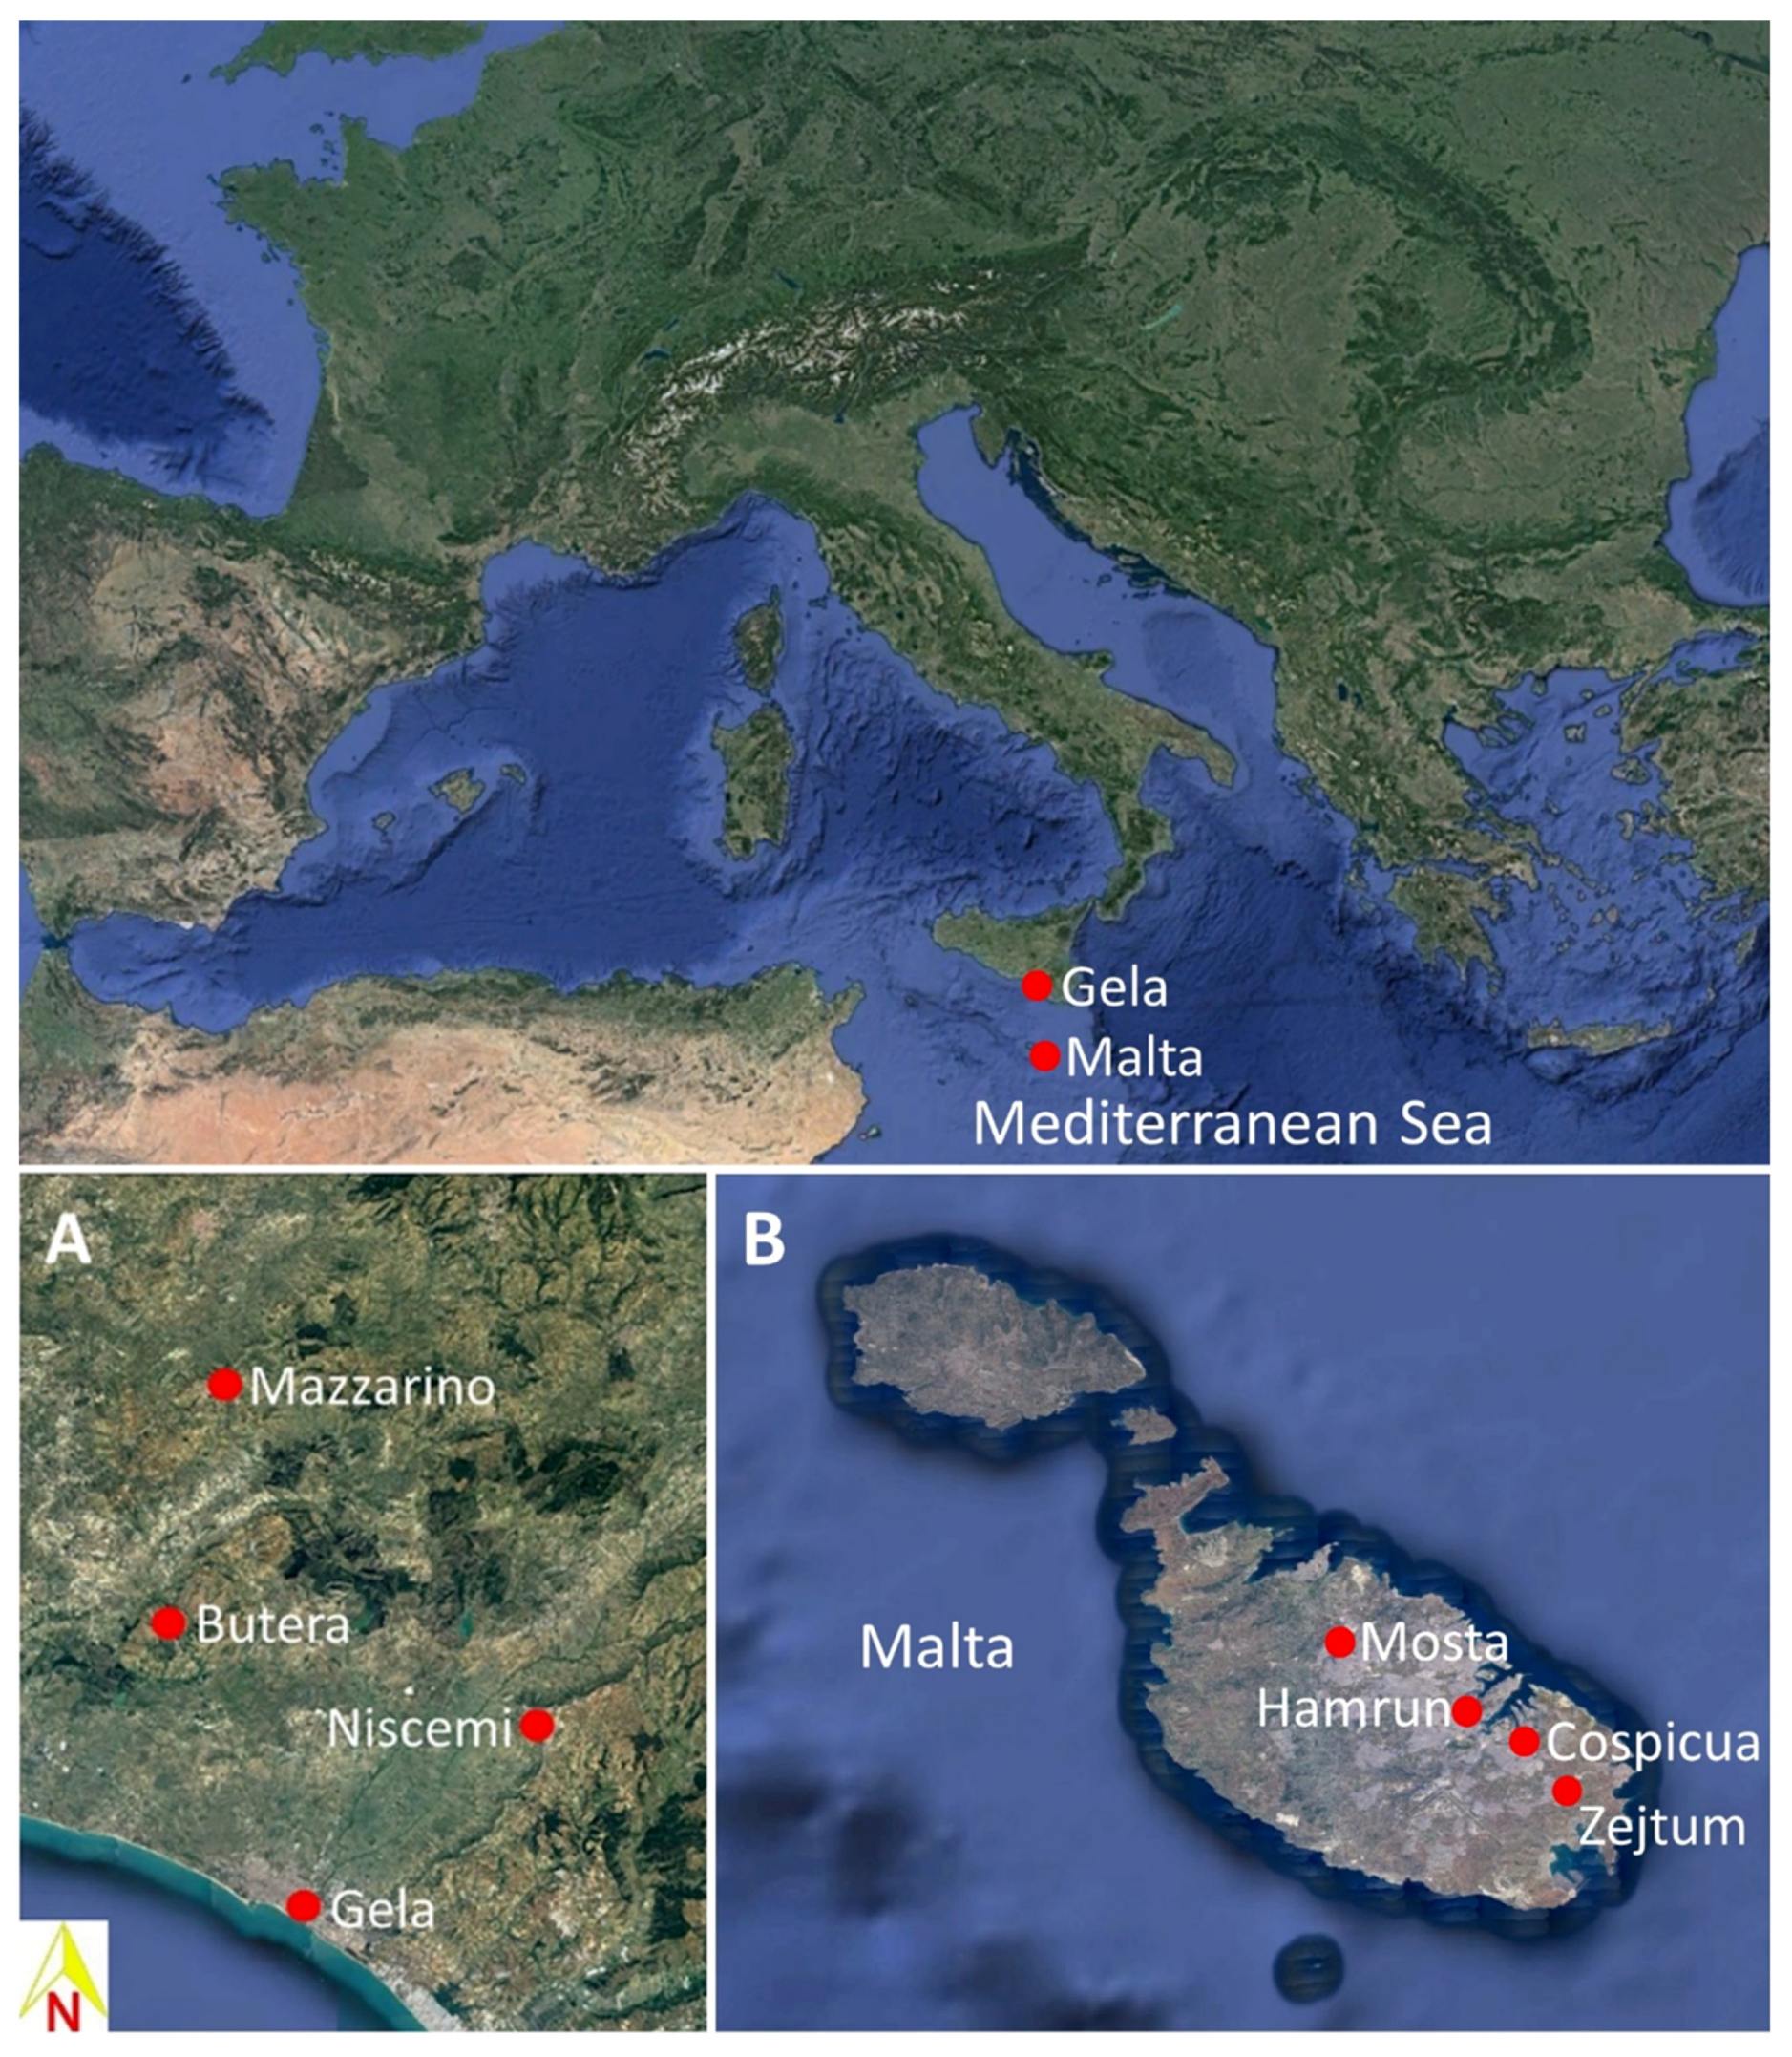
2.1. Study Design
2.2. Questionnaires
2.3. PM2.5 Sampling
2.4. Elemental Analysis
2.5. Statistical Analyses
3. Results
4. Discussion
Supplementary Materials
Author Contributions
Funding
Acknowledgments
Conflicts of Interest
References
- Global Initiative for Asthma—Global Strategy for Asthma Management and Prevention Updated 2020. Available online: http://www.ginasthma.org (accessed on 29 November 2020).
- Akinbami, L.J.; Simon, A.E.; Rossen, L.M. Changing Trends in Asthma Prevalence among Children. Pediatrics 2016, 137. [Google Scholar] [CrossRef]
- Drago, G.; Ruggieri, S.; Cuttitta, G.; La Grutta, S.; Ferrante, G.; Cibella, F. Determinants of Allergic Sensitization, Asthma and Lung Function: Results from a Cross-Sectional Study in Italian Schoolchildren. Int. J. Environ. Res. Public Health 2020, 17, 5087. [Google Scholar] [CrossRef] [PubMed]
- Guarnieri, M.; Balmes, J.R. Outdoor air pollution and asthma. Lancet 2014, 383, 1581–1592. [Google Scholar] [CrossRef]
- Iskandar, A.; Andersen, Z.J.; Bønnelykke, K.; Ellermann, T.; Andersen, K.K.; Bisgaard, H. Coarse and fine particles but not ultrafine particles in urban air trigger hospital admission for asthma in children. Thorax 2012, 67, 252–257. [Google Scholar] [CrossRef] [PubMed]
- Ambient Air Pollution: A Global Assessment of Exposure and Burden of Disease. Available online: http://apps.who.int/iris/bitstream/handle/10665/250141/9789241511353-eng.pdf (accessed on 29 November 2020).
- Ranzi, A.; Freni Sterrantino, A.; Forastiere, F.; Sartini, C.; Casale, G.; Cavallini, R.; De Togni, A.; Gallo, L.; Lauriola, P. Asthmatic symptoms and air pollution: A panel study on children living in the Italian Po Valley. Geospat Health 2015, 10, 366. [Google Scholar] [CrossRef] [PubMed]
- Dunea, D.; Iordache, S.; Pohoata, A. Fine Particulate Matter in Urban Environments: A Trigger of Respiratory Symptoms in Sensitive Children. Int. J. Environ. Res. Public Health 2016, 13, 1246. [Google Scholar] [CrossRef] [PubMed]
- Chen, C.H.; Chan, C.C.; Chen, B.-Y.; Cheng, T.-J.; Guo, Y.L. Effects of particulate air pollution and ozone on lung function in non-asthmatic children. Environ. Res. 2015, 137, 40–48. [Google Scholar] [CrossRef] [PubMed]
- Chiang, T.Y.; Yuan, T.H.; Shie, R.H.; Chen, C.F.; Chan, C.C. Increased incidence of allergic rhinitis, bronchitis and asthma, in children living near a petrochemical complex with SO2 pollution. Environ. Int. 2016, 96, 1–7. [Google Scholar] [CrossRef] [PubMed]
- Liao, M.F.; Liao, M.N.; Lin, S.N.; Chen, J.Y.; Huang, J.L. Prevalence of allergic diseases of schoolchildren in central Taiwan. From ISAAC surveys 5 years apart. J. Asthma 2009, 46, 541–545. [Google Scholar] [CrossRef]
- Wichmann, F.A.; Müller, A.; Busi, L.E.; Cianni, N.; Massolo, L.; Schlink, U.; Porta, A.; Sly, P.D. Increased asthma and respiratory symptoms in children exposed to petrochemical pollution. J. Allergy Clin. Immunol. 2009, 123, 632–638. [Google Scholar] [CrossRef]
- Requia, W.J.; Adams, M.D.; Koutrakis, P. Association of PM2.5 with diabetes, asthma, and high blood pressure incidence in Canada: A spatiotemporal analysis of the impacts of the energy generation and fuel sales. Sci. Total Environ. 2017, 584–585, 1077–1083. [Google Scholar] [CrossRef]
- Middleton, N.; Kolokotroni, O.; Lamnisos, D.; Koutrakis, P.; Yiallouros, P.K. Prevalence of asthma and respiratory symptoms in 15–17 year-old Greek-Cypriots by proximity of their community of residence to power plants: Cyprus 2006-07. Public Health 2014, 128, 288–296. [Google Scholar] [CrossRef] [PubMed]
- Asher, M.I.; Keil, U.; Anderson, H.R.; Beasley, R.; Crane, J.; Martinez, F.; Mitchell, E.A.; Pearce, N.; Sibbald, B.; Stewart, A.W.; et al. International Study of Asthma and Allergies in Childhood (ISAAC): Rationale and methods. Eur. Respir. J. 1995, 8, 483–491. [Google Scholar] [CrossRef] [PubMed]
- Melki, I.S.; Beydoun, H.A.; Khogali, M.; Tamim, H.; Yunis, K.A.; National Collaborative Perinatal Neonatal Network (NCPNN). Household crowding index: A correlate of socioeconomic status and inter-pregnancy spacing in an urban setting. J. Epidemiol. Community Health 2004, 58, 476–480. [Google Scholar] [CrossRef] [PubMed]
- Canepari, S.; Pietrodangelo, A.; Perrino, C.; Astolfi, M.L.; Marzo, M.L. Enhancement of source traceability of atmospheric PM by elemental chemical fractionation. Atmos. Environ. 2009, 43, 4754–4765. [Google Scholar] [CrossRef]
- Schifano, P.; Asta, F.; Dadvand, P.; Davoli, M.; Basagana, X.; Michelozzi, P. Heat and air pollution exposure as triggers of delivery: A survival analysis of population-based pregnancy cohorts in Rome and Barcelona. Environ. Int. 2016, 88, 153–159. [Google Scholar] [CrossRef]
- Automobile Club d’Italia. Available online: http://www.aci.it/laci/studi-e-ricerche/dati-e-statistiche/annuario-statistico/annuario-statistico-2019.html (accessed on 29 November 2020).
- Transport Statistics at Regional Level. Available online: https://ec.europa.eu/eurostat/statistics-explained/index.php?title=Transport_statistics_at_regional_level#Road_transport (accessed on 29 November 2020).
- Montefort, S.; Lenicker, H.M.; Caruna, S.; Agius Muscat, H. Asthma, rhinitis and eczema in Maltese 13–15 year-old schoolchildren: Prevalence, severity and associated factors [ISAAC]. International Study of Asthma and Allergies in Childhood. Clin. Exp. Allergy 1998, 28, 1089–1099. [Google Scholar] [CrossRef]
- Montefort, S.; Agius Muscat, H.; Caruana, S.; Lenicker, H. Allergic conditions in 5–8-year-old Maltese schoolchildren: Prevalence, severity, and associated risk factors [ISAAC]. Pediatr. Allergy Immunol. 2002, 13, 98–104. [Google Scholar] [CrossRef]
- Montefort, S.; Ellul, P.; Montefort, M.; Caruana, S.; Agius Muscat, H. Increasing prevalence of asthma, allergic rhinitis but not eczema in 5- to 8-yr-old Maltese children (ISAAC). Pediatr. Allergy Immunol. 2009, 20, 67–71. [Google Scholar] [CrossRef]
- Ruggieri, S.; Longo, V.; Perrino, C.; Canepari, S.; Drago, G.; L’Abbate, L.; Balzan, M.; Cuttitta, G.; Scaccianoce, G.; Minardi, R.; et al. Indoor air quality in schools of a highly polluted south Mediterranean area. Indoor Air 2019, 29, 276–290. [Google Scholar] [CrossRef]
- Perrino, C.; Canepari, S.; Cardarelli, E.; Catrambone, M.; Sargolini, T. Inorganic constituents of urban air pollution in the Lazio region (Central Italy). Environ. Monit. Assess. 2007, 128, 133–151. [Google Scholar] [CrossRef] [PubMed]
- Astolfi, M.L.; Canepari, S.; Catrambone, M.; Perrino, C.; Pietrodangelo, A. Improved characterisation of inorganic components in airborne particulate matter. Environ. Chem. Lett. 2006, 3, 186–191. [Google Scholar] [CrossRef]
- Canepari, S.; Perrino, C.; Astolfi, M.L.; Catramboneb, M.; Perreta, D. Determination of soluble ions and elements in ambient air suspended particulate matter: Inter-technique comparison of XRF, IC and ICP for sample-by-sample quality control. Talanta 2009, 77, 1821–1829. [Google Scholar] [CrossRef] [PubMed]
- Karanasiou, A.; Querol, X.; Alastuey, A.; Perez, N.; Pey, J.; Perrino, C.; Berti, G.; Gandini, M.; Poluzzi, V.; Ferrari, S.; et al. Particulate matter and gaseous pollutants in the Mediterranean Basin: Results from the MED-PARTICLES project. Sci. Total Environ. 2014, 488–489, 297–315. [Google Scholar] [CrossRef] [PubMed]
- Viana, M.; Kuhlbusch, T.A.J.; Querolr, X.; Alastuey, A.; Harrison, R.M.; Hopke, P.K.; Winiwarter, W.; Vallius, M.; Szidat, S.; Prévôt, A.S.H.; et al. Source apportionment of particulate matter in Europe: A review of methods and results. J. Aerosol Sci. 2008, 39, 827–849. [Google Scholar] [CrossRef]
- Begum, B.A.; Akhter, S.; Sarker, L.; Biswas, S.K. Gravimetric analysis of air filters and quality assurance in weighing. Nucl. Sci. Appl. 2006, 15, 36–41. [Google Scholar]
- Song, Y.; Zhang, Y.; Xie, S.; Zeng, L.; Zheng, M.; Salmon, L.G.; Shao, M.; Slanina, S. Source apportionment of PM2.5 in Beijing by positive matrix factorization. Atmos. Environ. 2006, 40, 1526–1537. [Google Scholar] [CrossRef]
- Sharma, S.K.; Mandal, T.K.; Saxena, M.; Sharma, A.; Datta, A.; Saud, T. Variation of OC, EC, WSIC and trace metals of PM10 in Delhi. J. Atmos. Sol. Terr. Phys. 2014, 113, 10–22. [Google Scholar] [CrossRef]
- Tauler, R.; Viana, M.; Querol, X.; Alastuey, A.; Flight, R.M.; Wentzell, P.D.; Hopke, P.K. Comparison of the results obtained by four receptor modelling methods in aerosol source apportionment studies. Atmos. Environ. 2009, 43, 3989–3997. [Google Scholar] [CrossRef]
- Moreno, T.; Querol, X.; Alastuey, A.; Viana, M.; Salvador, P.; Sa‘nchez de la Campa, A.; Artinˇano, B.; De la rosa, J.; Gibbons, W. Variations in atmospheric PM trace metal content in Spanish towns: Illustrating the chemical complexity of the inorganic urban aerosol cocktail. Atmos. Environ. 2006, 40, 6791–6803. [Google Scholar] [CrossRef]
- Birmili, W.; Allen, A.G.; Bary, F.; Harrison, R.M. Trace metal concentrations and water solubility in size-fractionated atmospheric particles and influence of road traffic. Environ. Sci. Technol. 2006, 40, 1144–1153. [Google Scholar] [CrossRef] [PubMed]
- Salvador, P.; Artinˇano, B.; Querol, X.; Alastuey, A.; Costoya, M. Characterisation of local and external contributions of atmospheric particulate matter at a background coastal site. Atmos. Environ. 2007, 41, 1–17. [Google Scholar] [CrossRef]
- Gauderman, W.J.; Avol, E.; Gilliland, F.; Vora, H.; Thomas, D.; Berhane, K.; McConnell, R.; Kuenzli, N.; Lurmann, F.; Rappaport, E.; et al. The Effect of Air Pollution on Lung Development from 10 to 18 Years of Age. N. Engl. J. Med. 2004, 351, 1057–1067. [Google Scholar] [CrossRef] [PubMed]
- Islam, T.; Gauderman, W.J.; Berhane, K.; McConnell, R.; Avol, E.; Peters, J.M.; Gilliland, F.D. Relationship between air pollution, lung function and asthma in adolescents. Thorax 2007, 62, 957–963. [Google Scholar] [CrossRef] [PubMed]
- Gauderman, W.J.; Urman, R.; Avol, E.; Berhane, K.; McConnell, R.; Rappaport, E.; Chang, R.; Lurmann, F.; Gilliland, F. Association of Improved Air Quality with Lung Development in Children. N. Engl. J. Med. 2015, 372, 905–913. [Google Scholar] [CrossRef] [PubMed]
- Pope, C.A.; Dockery, D.W. Health effects of fine particulate air pollution: Lines that connect. J. Air Waste Manag. 2006, 56, 709–742. [Google Scholar] [CrossRef]
- Integrated Science Assessment (ISA) for Particulate Matter (Final Report, Dec 2009); Environmental Protection Agency: Washington, DC, USA, 2009.
- Keet, C.A.; Keller, J.P.; Peng, R.D. Long-Term Coarse Particulate Matter Exposure Is Associated with Asthma among Children in Medicaid. Am. J. Respir. Crit. Care Med. 2018, 197, 737–746. [Google Scholar] [CrossRef]
- Park, S.; Lee, E.H.; Kho, Y. The association of asthma, total IgE, and blood lead and cadmium levels. J. Allergy Clin. Immunol. 2016, 138, 1701–1703. [Google Scholar] [CrossRef]
- Rabito, F.A.; Horter, L.; Langlois, E.C.; Carlson, J.C.; White, L.E.; Schwartz, K.; Osman, P.; Rice, J.C. Blood lead and pediatric asthma. Epidemiology 2013, 24, 474–476. [Google Scholar] [CrossRef]
- Jedrychowski, W.; Perera, F.; Maugeri, U.; Miller, R.L.; Rembiasz, M.; Flak, E.; Mroz, E.; Majewska, R.; Zembala, M. Intrauterine exposure to lead may enhance sensitization to common inhalant allergens in early childhood: A prospective prebirth cohort study. Environ. Res. 2011, 111, 119–124. [Google Scholar] [CrossRef]
- Gray, D.L.; Wallace, L.A.; Brinkman, M.C.; Buehler, S.S.; La Londe, C. Respiratory and cardiovascular effects of metals in ambient particulate matter: A critical review. Respiratory and cardiovascular effects of metals in ambient particulate matter: A critical review. Rev. Environ. Contam. Toxicol. 2015, 234, 135–203. [Google Scholar] [CrossRef] [PubMed]
- Samir, M.; Magdy, S.; Fetoh, A.A. Air pollution in relation to allergic and nonallergic rhinitis. Arch. Otolaryngol. Head Neck Surg. 1997, 123, 746–748. [Google Scholar] [CrossRef] [PubMed]
- Behrendt, H.; Alessandrini, F.; Buters, J.; Kramer, U.; Koren, H.; Ring, J. Environmental pollution and allergy: Historical aspects. Chem. Immunol. Allergy 2014, 100, 268–277. [Google Scholar] [PubMed]
- Chien, L.C.; Chen, Y.A.; Yu, H.L. Lagged Influence of Fine Particulate Matter and Geographic Disparities on Clinic Visits for Children’s Asthma in Taiwan. Int. J. Environ. Res. Public Health 2018, 15, 829. [Google Scholar] [CrossRef]
- Gauderman, W.J.; Avol, E.; Lurmann, F.; Kuenzli, N.; Gilliland, F.; Peters, J.; McConnell, R. Childhood asthma and exposure to traffic and nitrogen dioxide. Epidemiology 2005, 16, 737–743. [Google Scholar] [CrossRef]


| Malta (n = 860) | Italy (n = 1190) | ||||||
|---|---|---|---|---|---|---|---|
| Hamrun Urban/Industrial (n = 341) | Cospicua/Zejtun Industrial (n = 235) | Mosta Rural (n = 284) | Gela Industrial (n = 593) | Niscemi Rural (n = 314) | Butera Rural (n = 119) | Mazzarino Rural (n = 164) | |
| General Characteristics | |||||||
| Age Years, mean (± SD) | 12.9 (±0.7) | 12.5 (±0.7) | 12.1 (±0.5) | 11.8 (±1.1) | 11.7 (±1.1) | 11.9 (±1.1) | 12.0 (±1.1) |
| Male/Female (n) | 157/184 | 101/134 | 120/164 | 296/297 | 154/160 | 61/58 | 83/81 |
| Parental atopy, n (%) | 41 (12.0%) | 30 (12.8%) | 29 (10.2%) | 59 (10.0%) | 32 (10.1%) | 9 (7.6%) | 8 (4.9%) |
| Crowding index > 1, n (%) | 147 (43.1%) | 88 (37.4%) | 108 (66.2%) | 179 (30.2%) | 78 (24.8%) | 37 (31.1%) | 55 (33.5%) |
| Respiratory Health | |||||||
| Acute respiratory disease in the first 2 years, n (%) | 43 (12.6%) | 33 (14.0%) | 40 (14.1%) | 168 (28.3%) | 102 (32.5%) | 24 (20.2%) | 59 (36.0%) |
| Doctor-diagnosed asthma, n (%) | 63 (18.5%) | 48 (20.4%) | 44 (15.5%) | 57 (9.6%) | 22 (7.0%) | 3 (2.5%) | 7 (4.3%) |
| Current asthma, n (%) | 28 (8.2%) | 18 (7.7%) | 21 (7.4%) | 22 (3.7%) | 8 (2.5%) | 2 (1.7%) | 3 (1.8%) |
| Asthma medication in last 12 months, n (%) | 40 (11.7%) | 36 (15.3%) | 28 (9.9%) | 40 (6.7%) | 15 (4.8%) | 1 (0.8%) | 2 (1.2%) |
| Rhinitis in last 12 months, n (%) | 106 (31.1%) | 61 (26.0%) | 68 (23.9%) | 171 (28.8%) | 61 (19.4%) | 18 (15.1%) | 30 (18.3%) |
| Home Exposures | |||||||
| Dampness exposure, n (%) | 81 (23.8%) | 20 (8.5%) | 47 (16.5%) | 73 (12.3%) | 34 (10.8%) | 14 (11.7%) | 20 (12.2%) |
| Domestic exposure to tobacco smoke, n (%) | 77 (22.6%) | 37 (15.7%) | 52 (18.3%) | 101 (17.0%) | 88 (28.0%) | 25 (21.0%) | 27 (16.4%) |
| Pets, n (%) | 204 (59.8%) | 145 (61.7%) | 157 (55.3%) | 145 (24.4%) | 47 (15.0%) | 14 (11.8%) | 37 (22.6%) |
| Traffic, n (%) | 97 (28.4%) | 44 (18.7%) | 59 (20.8%) | 178 (30.0%) | 56 (17.8%) | 13 (10.9%) | 33 (20.1%) |
| Malta (n = 51) | Italy (n = 85) | p-Value * | ||||||
|---|---|---|---|---|---|---|---|---|
| Hamrun (n = 19) | Cospicua/Zejtun (n = 16) | Mosta (n = 16) | Gela (n = 41) | Niscemi (n = 22) | Butera (n = 9) | Mazzarino (n = 13) | ||
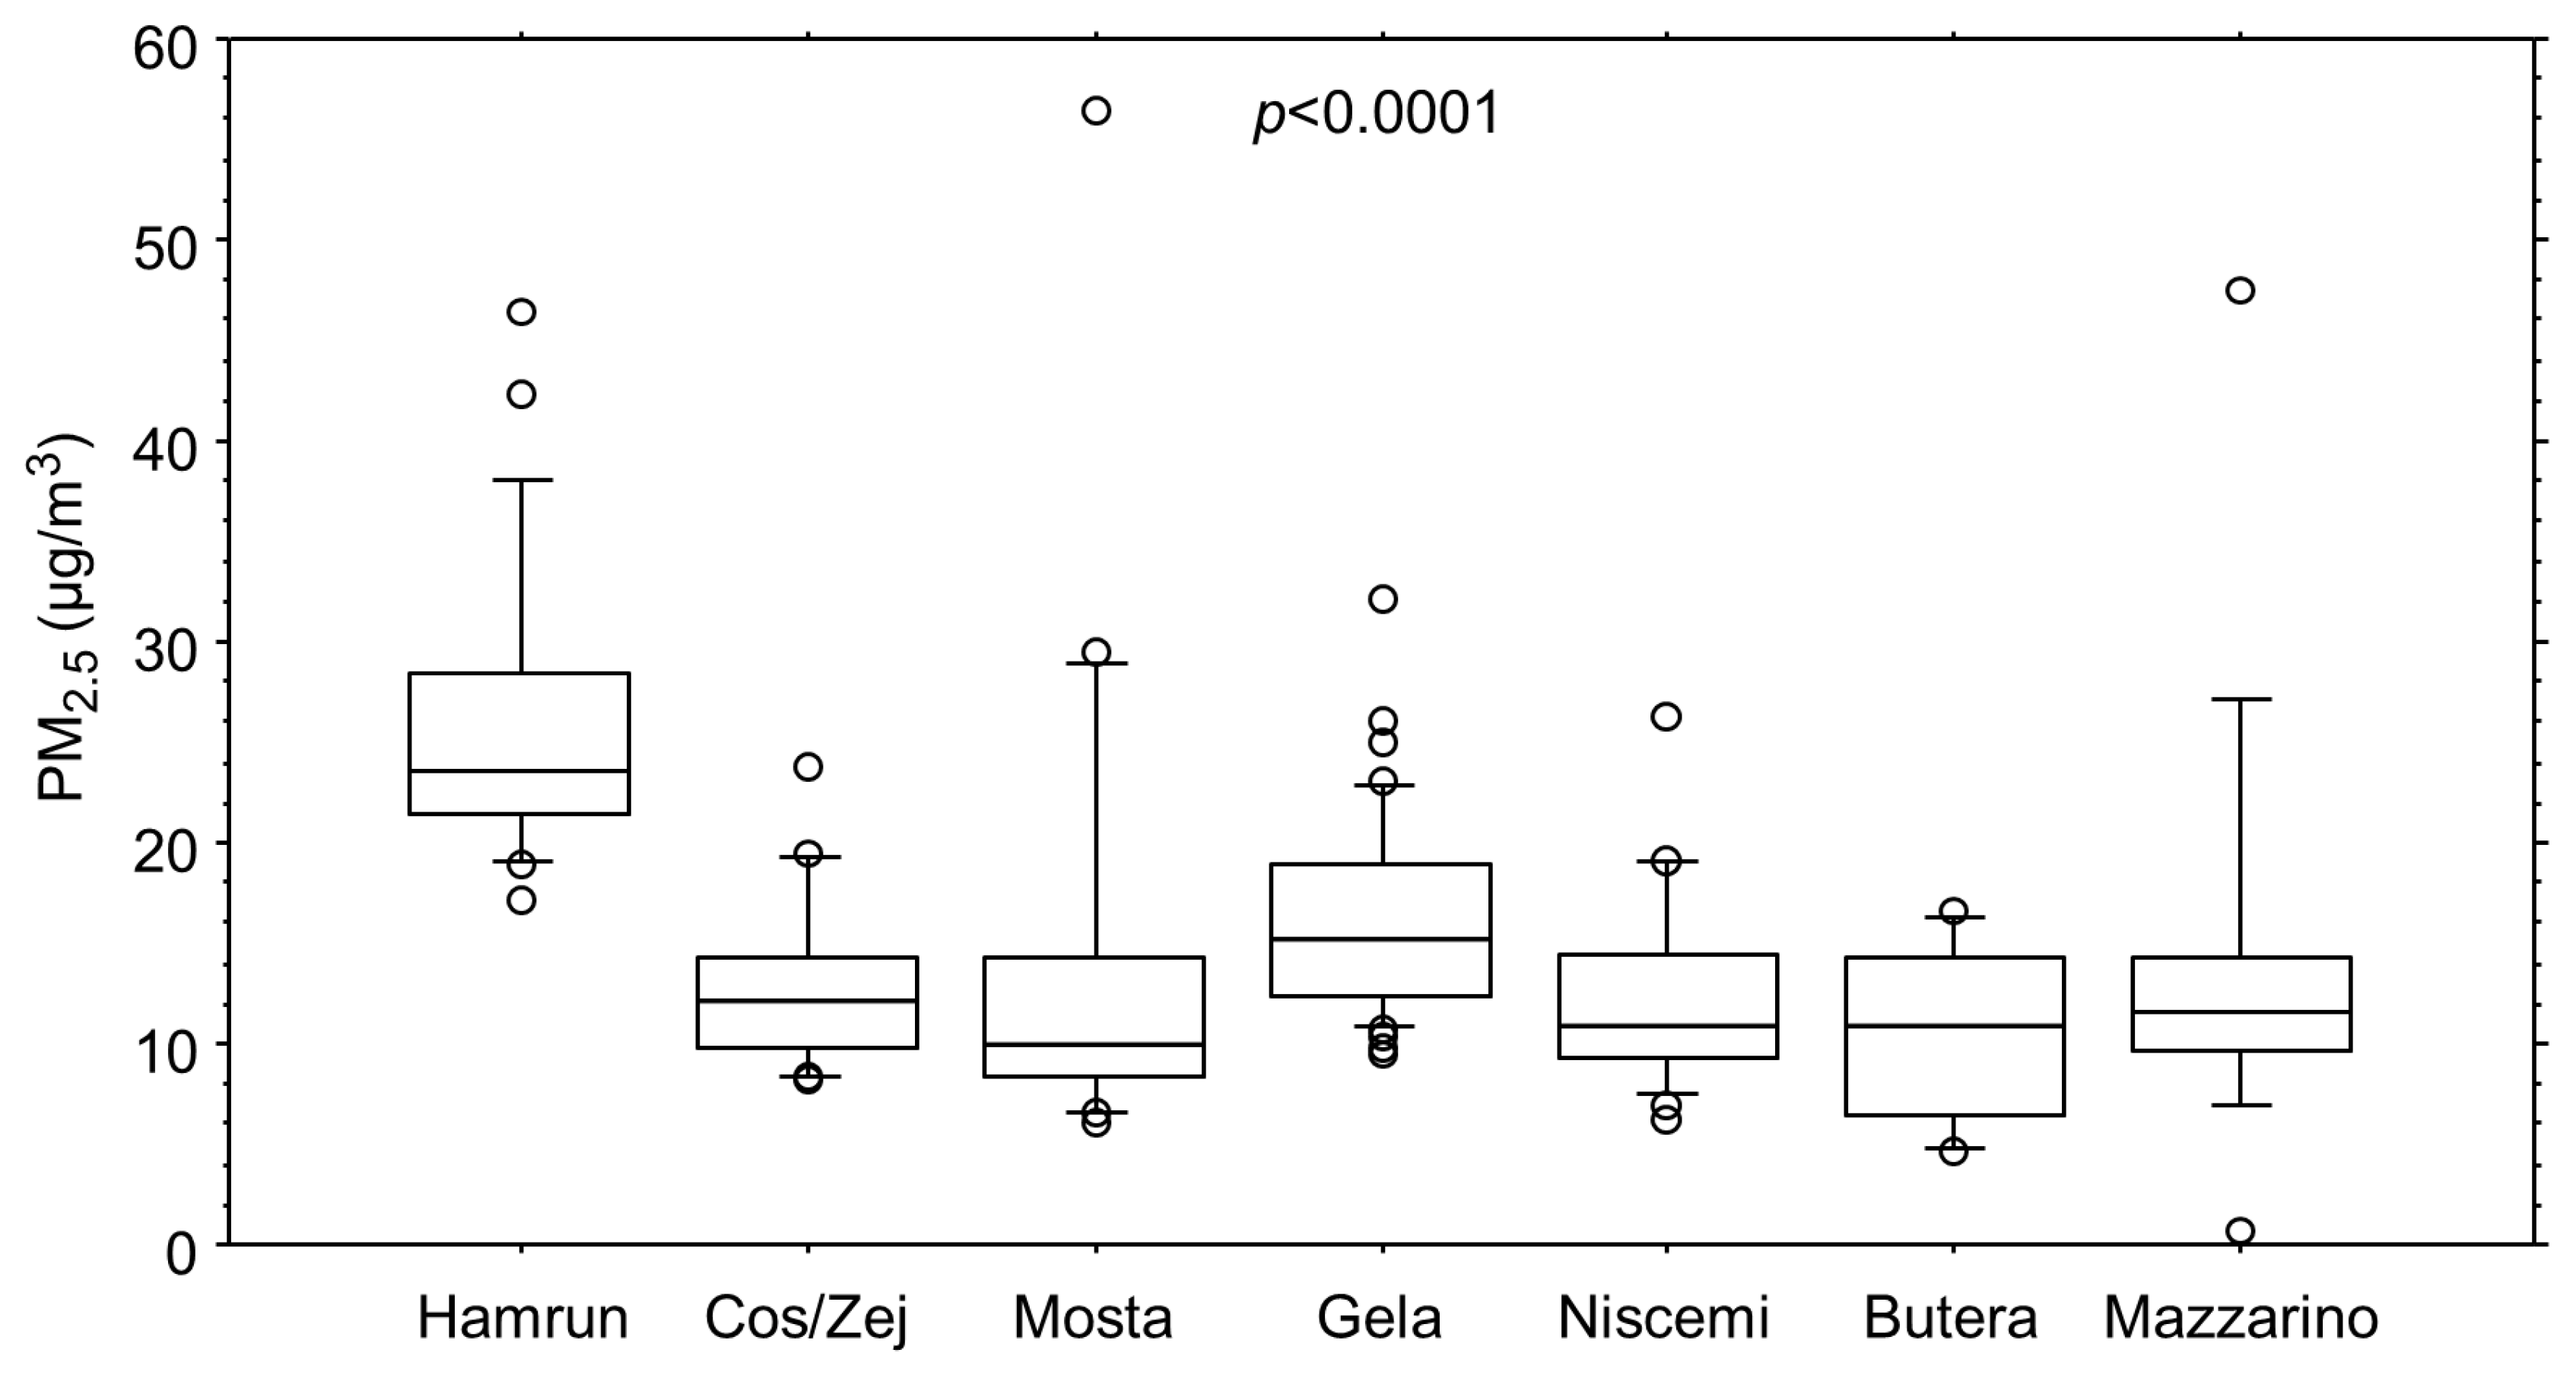
| PM2.5 (µg/m3) | 23.6 (21.5–28.5) | 12.2 (9.8–14.3) | 10.0 (8.4–14.2) | 15.2 (12.3–18.9) | 10.9 (9.2–14.4) | 10.8 (6.4–14.3) | 11.6 (9.6–14.4) | <0.0001 |
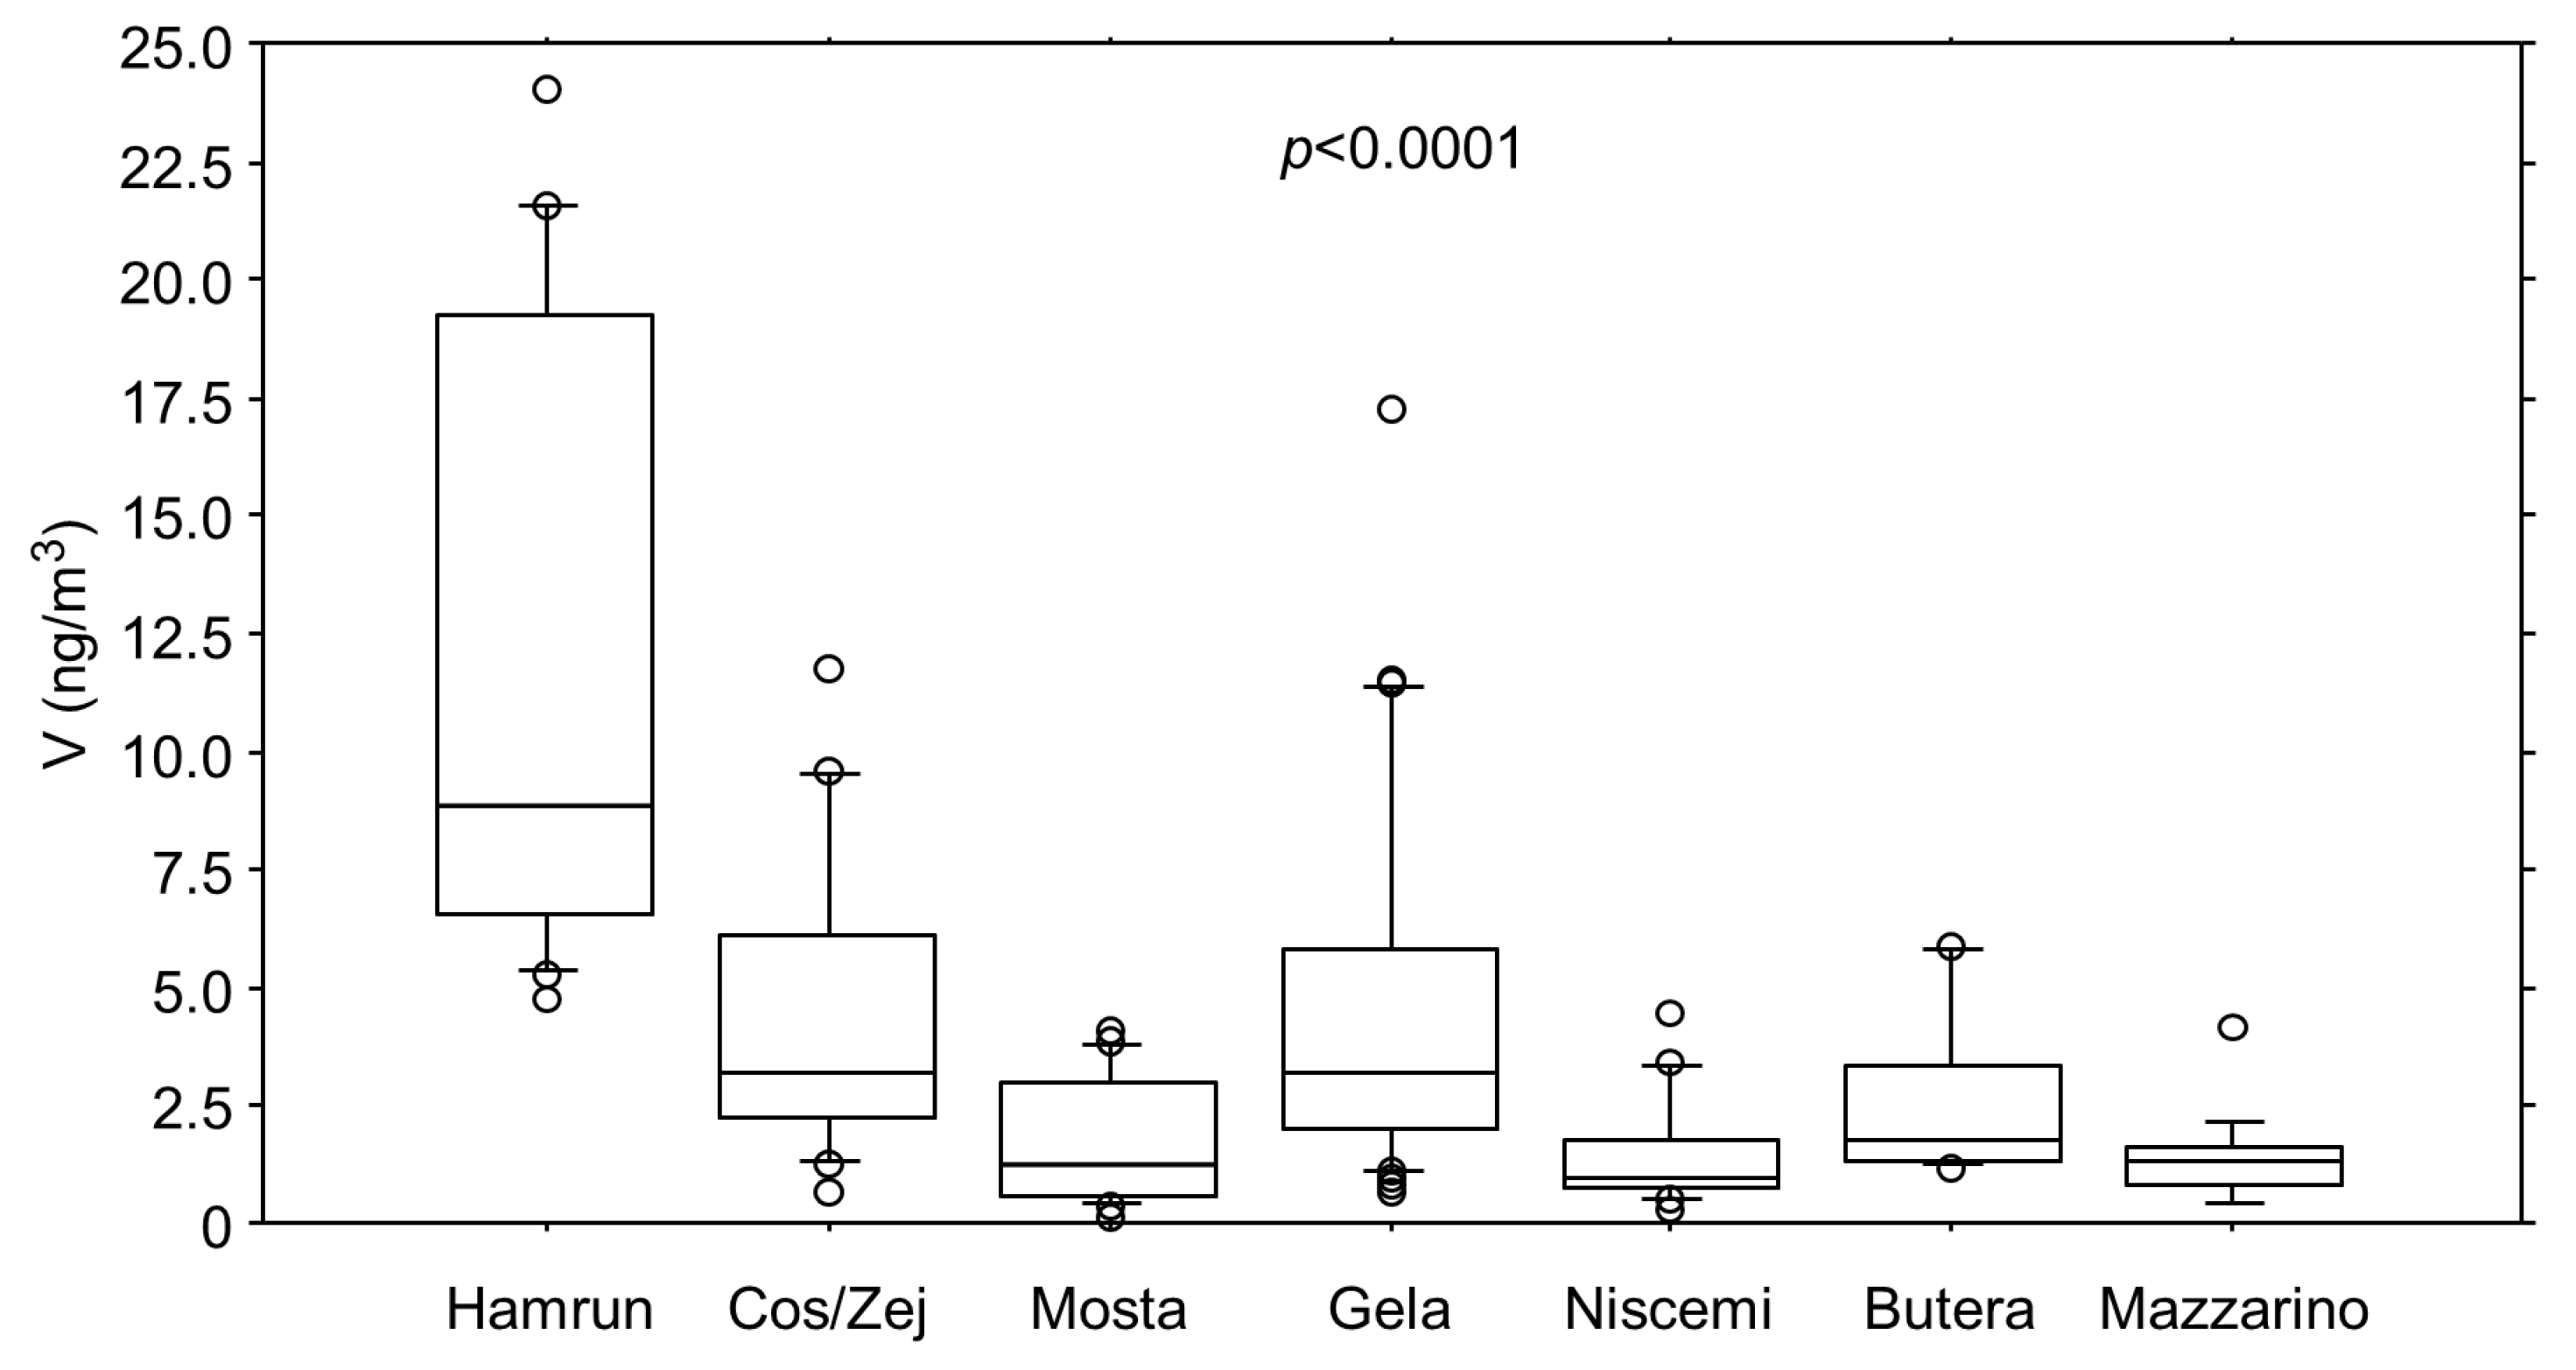
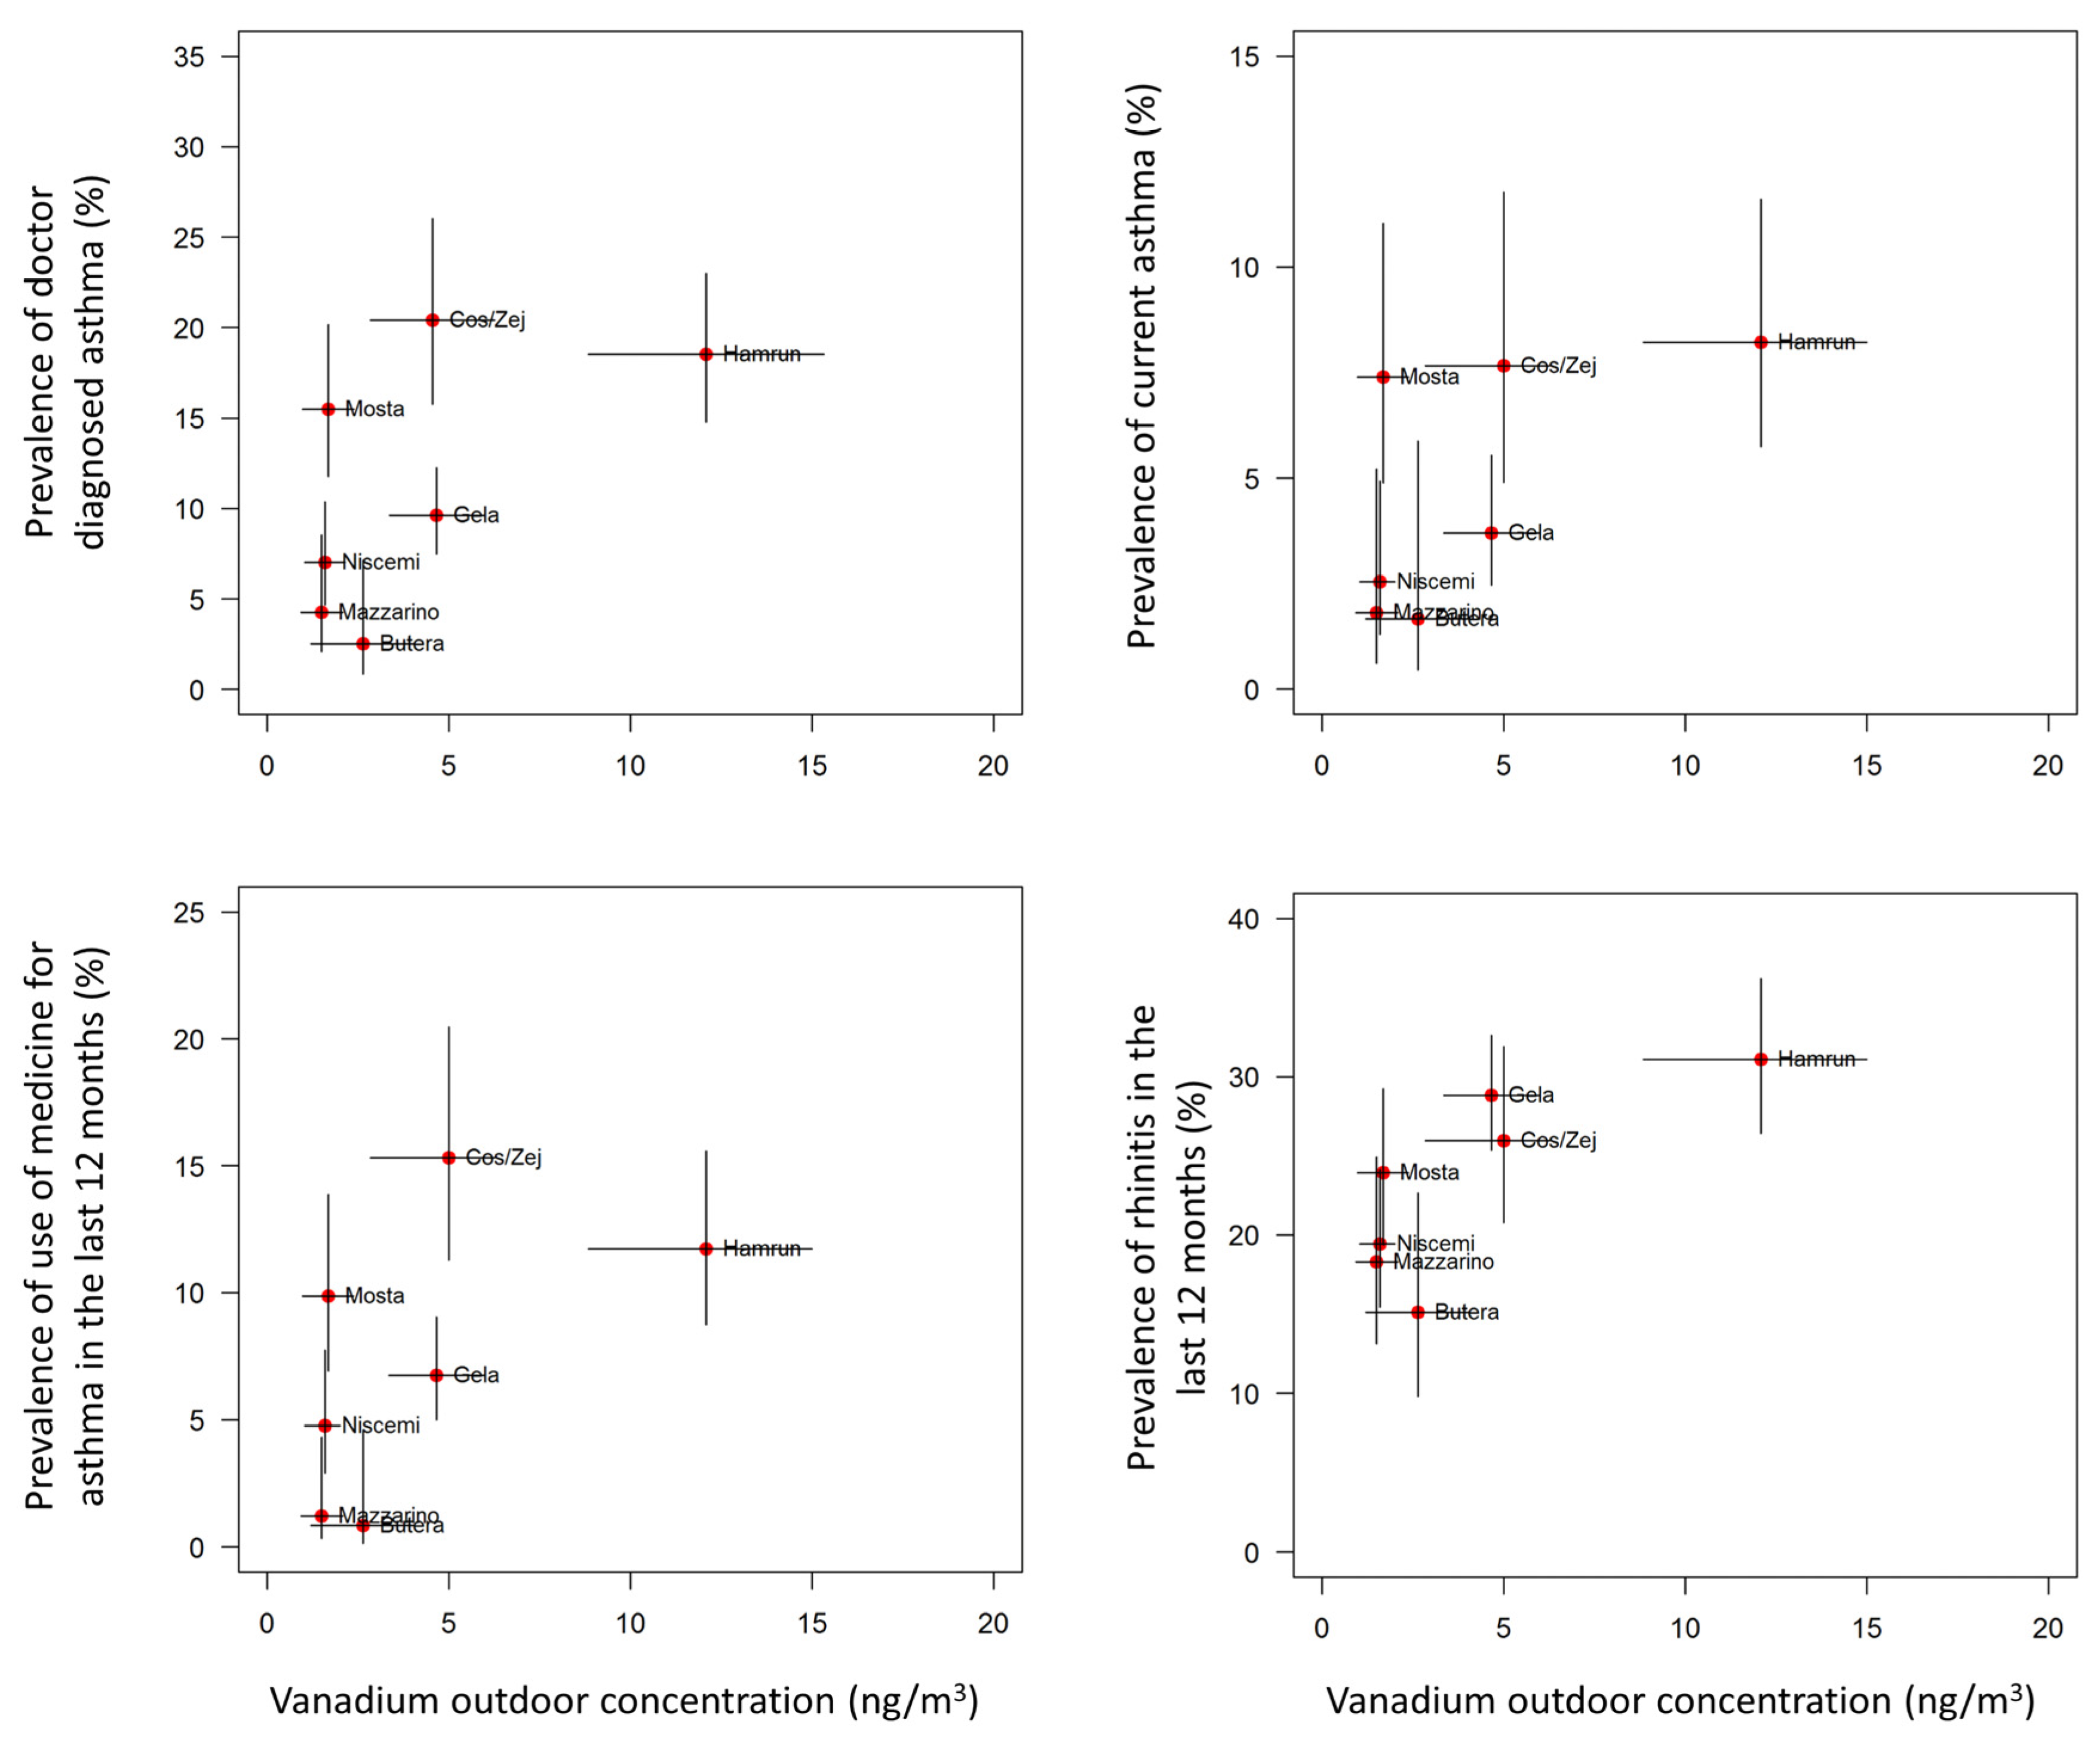
| V (ng/m3) | 8.8 (6.5–19.3) | 3.2 (2.2–6.1) | 1.3 (0.6–3.0) | 3.2 (2.0–5.8) | 0.9 (0.7–1.8) | 1.8 (1.3–3.2) | 1.3 (0.8–1.6) | <0.0001 |
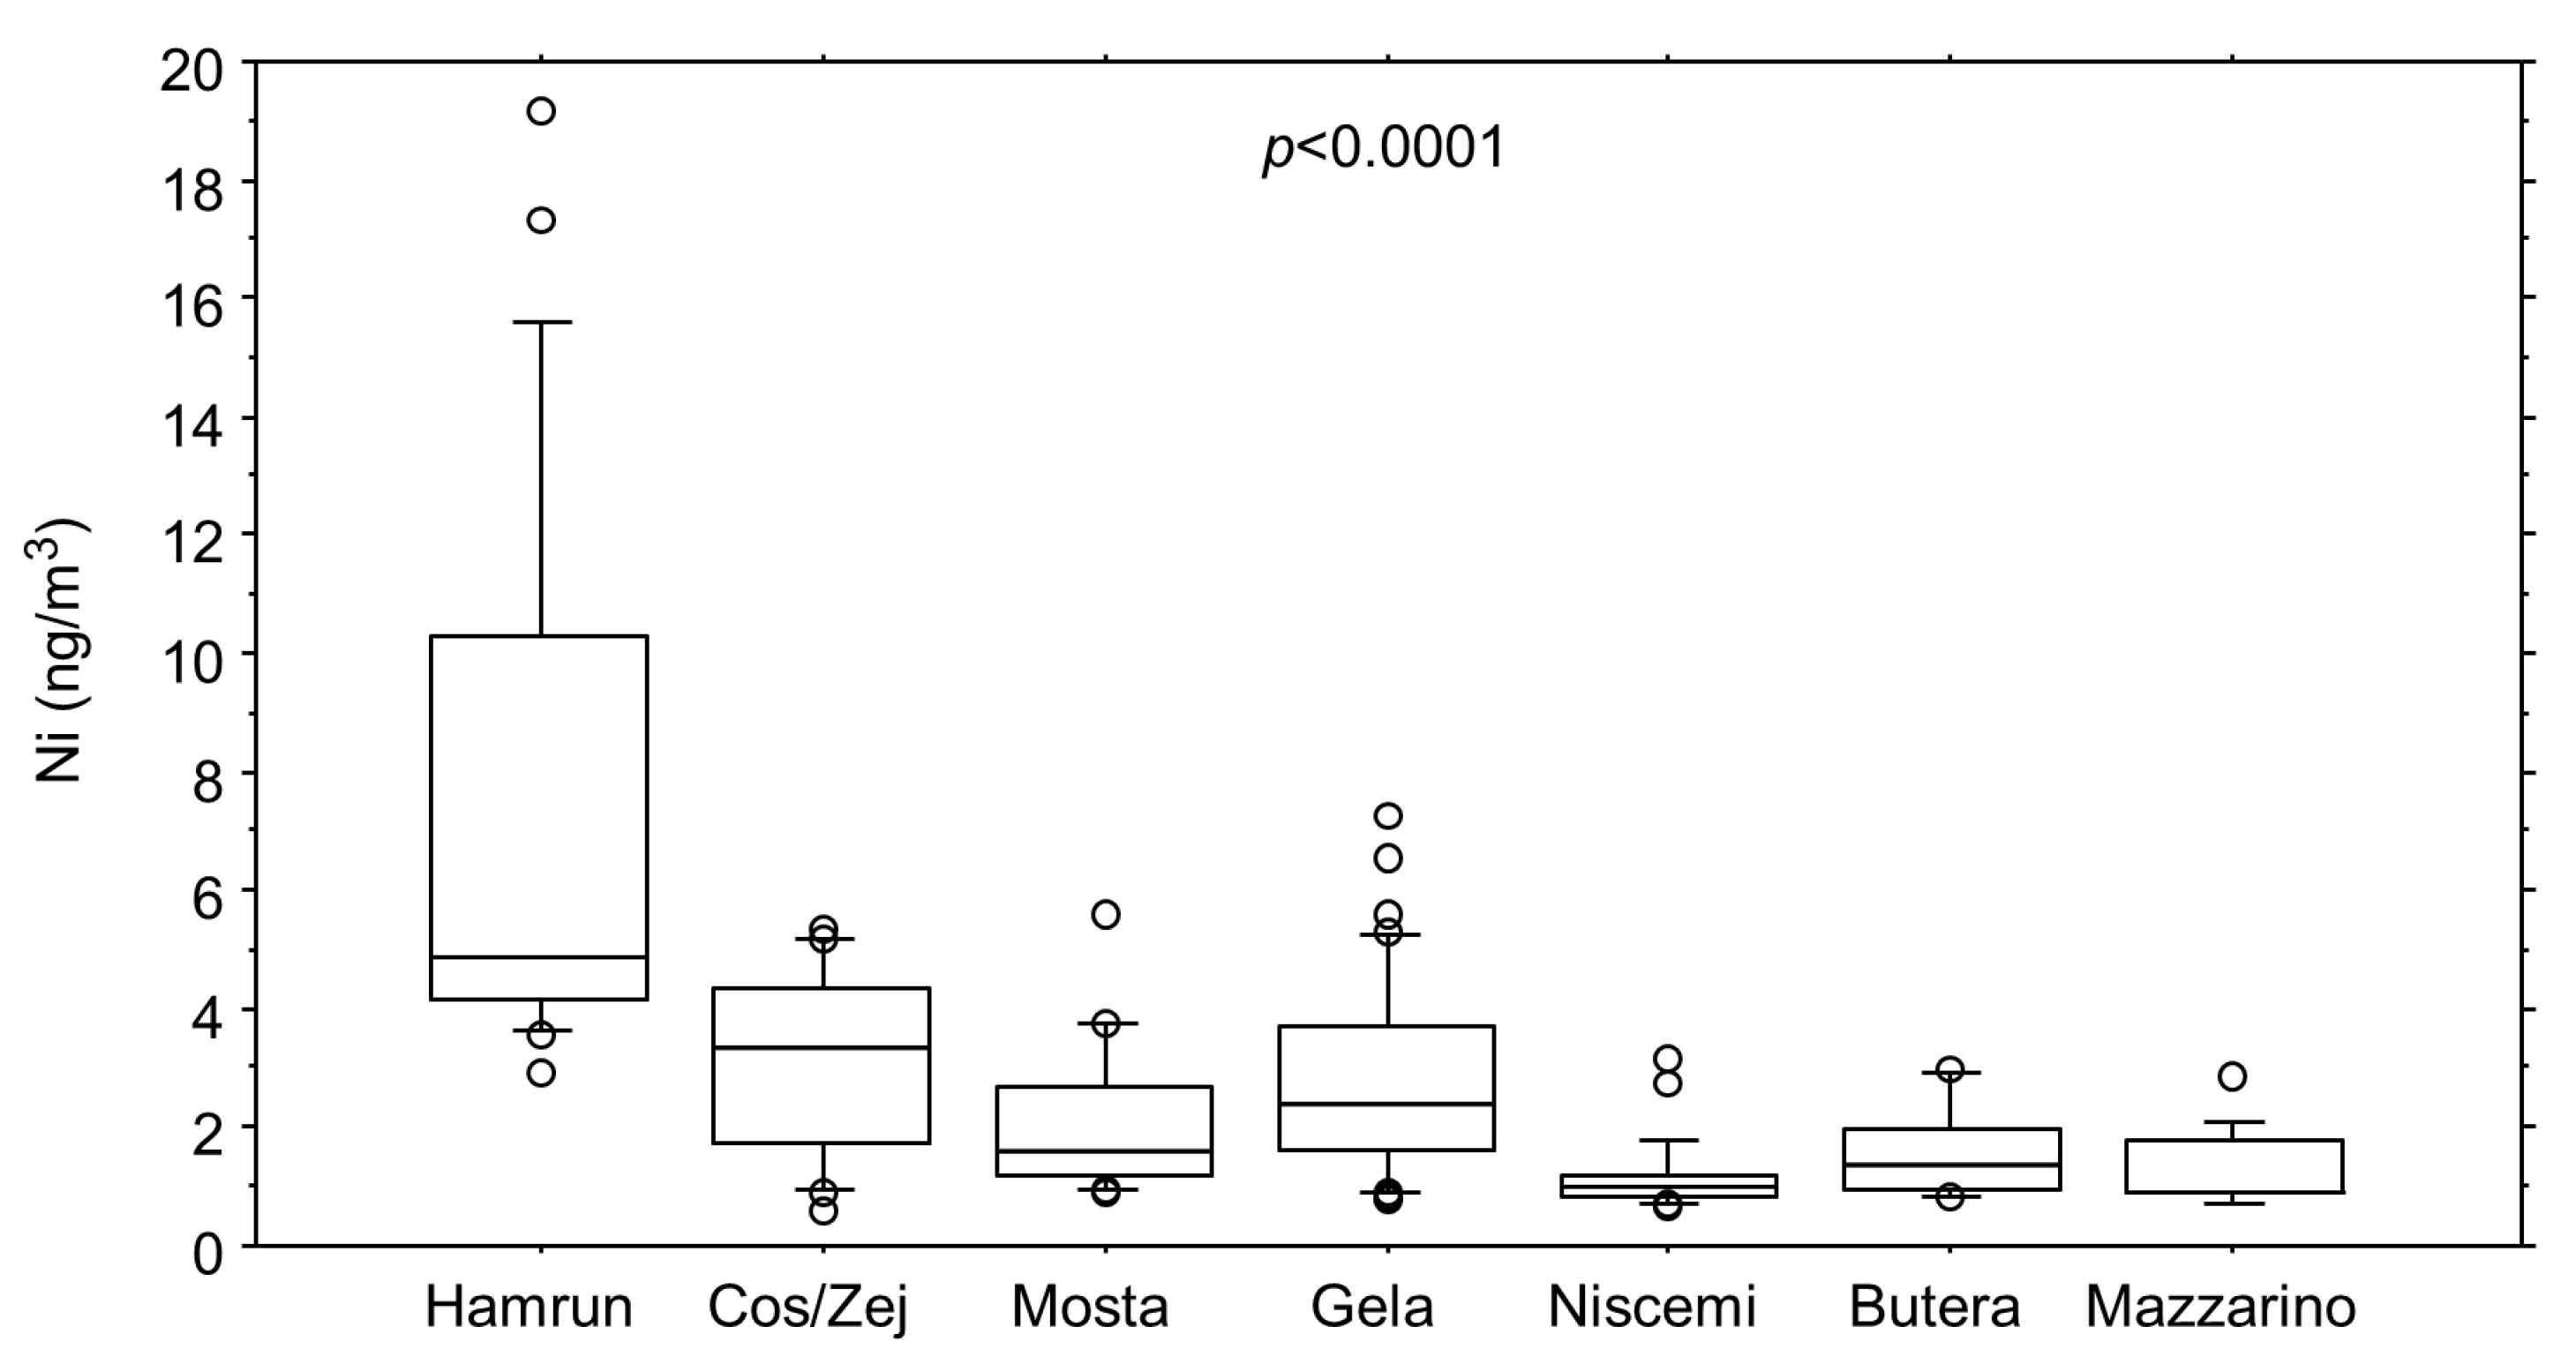
| Ni (ng/m3) | 4.9 (4.2–10.3) | 3.3 (1.7–4.3) | 1.6 (1.2–2.7) | 2.4 (1.6–3.7) | 1.0 (0.8–1.2) | 1.3 (1.0–2.0) | 0.9 (0.9–1.8) | <0.0001 |
| Cd (ng/m3) | 0.11 (0.07–0.15) | 0.07 (0.04–0.07) | 0.06 (0.06–0.07) | 0.12 (0.07–0.32) | 0.06 (0.05–0.07) | 0.06 (0.06–0.11) | 0.06 (0.05–0.07) | 0.0004 |
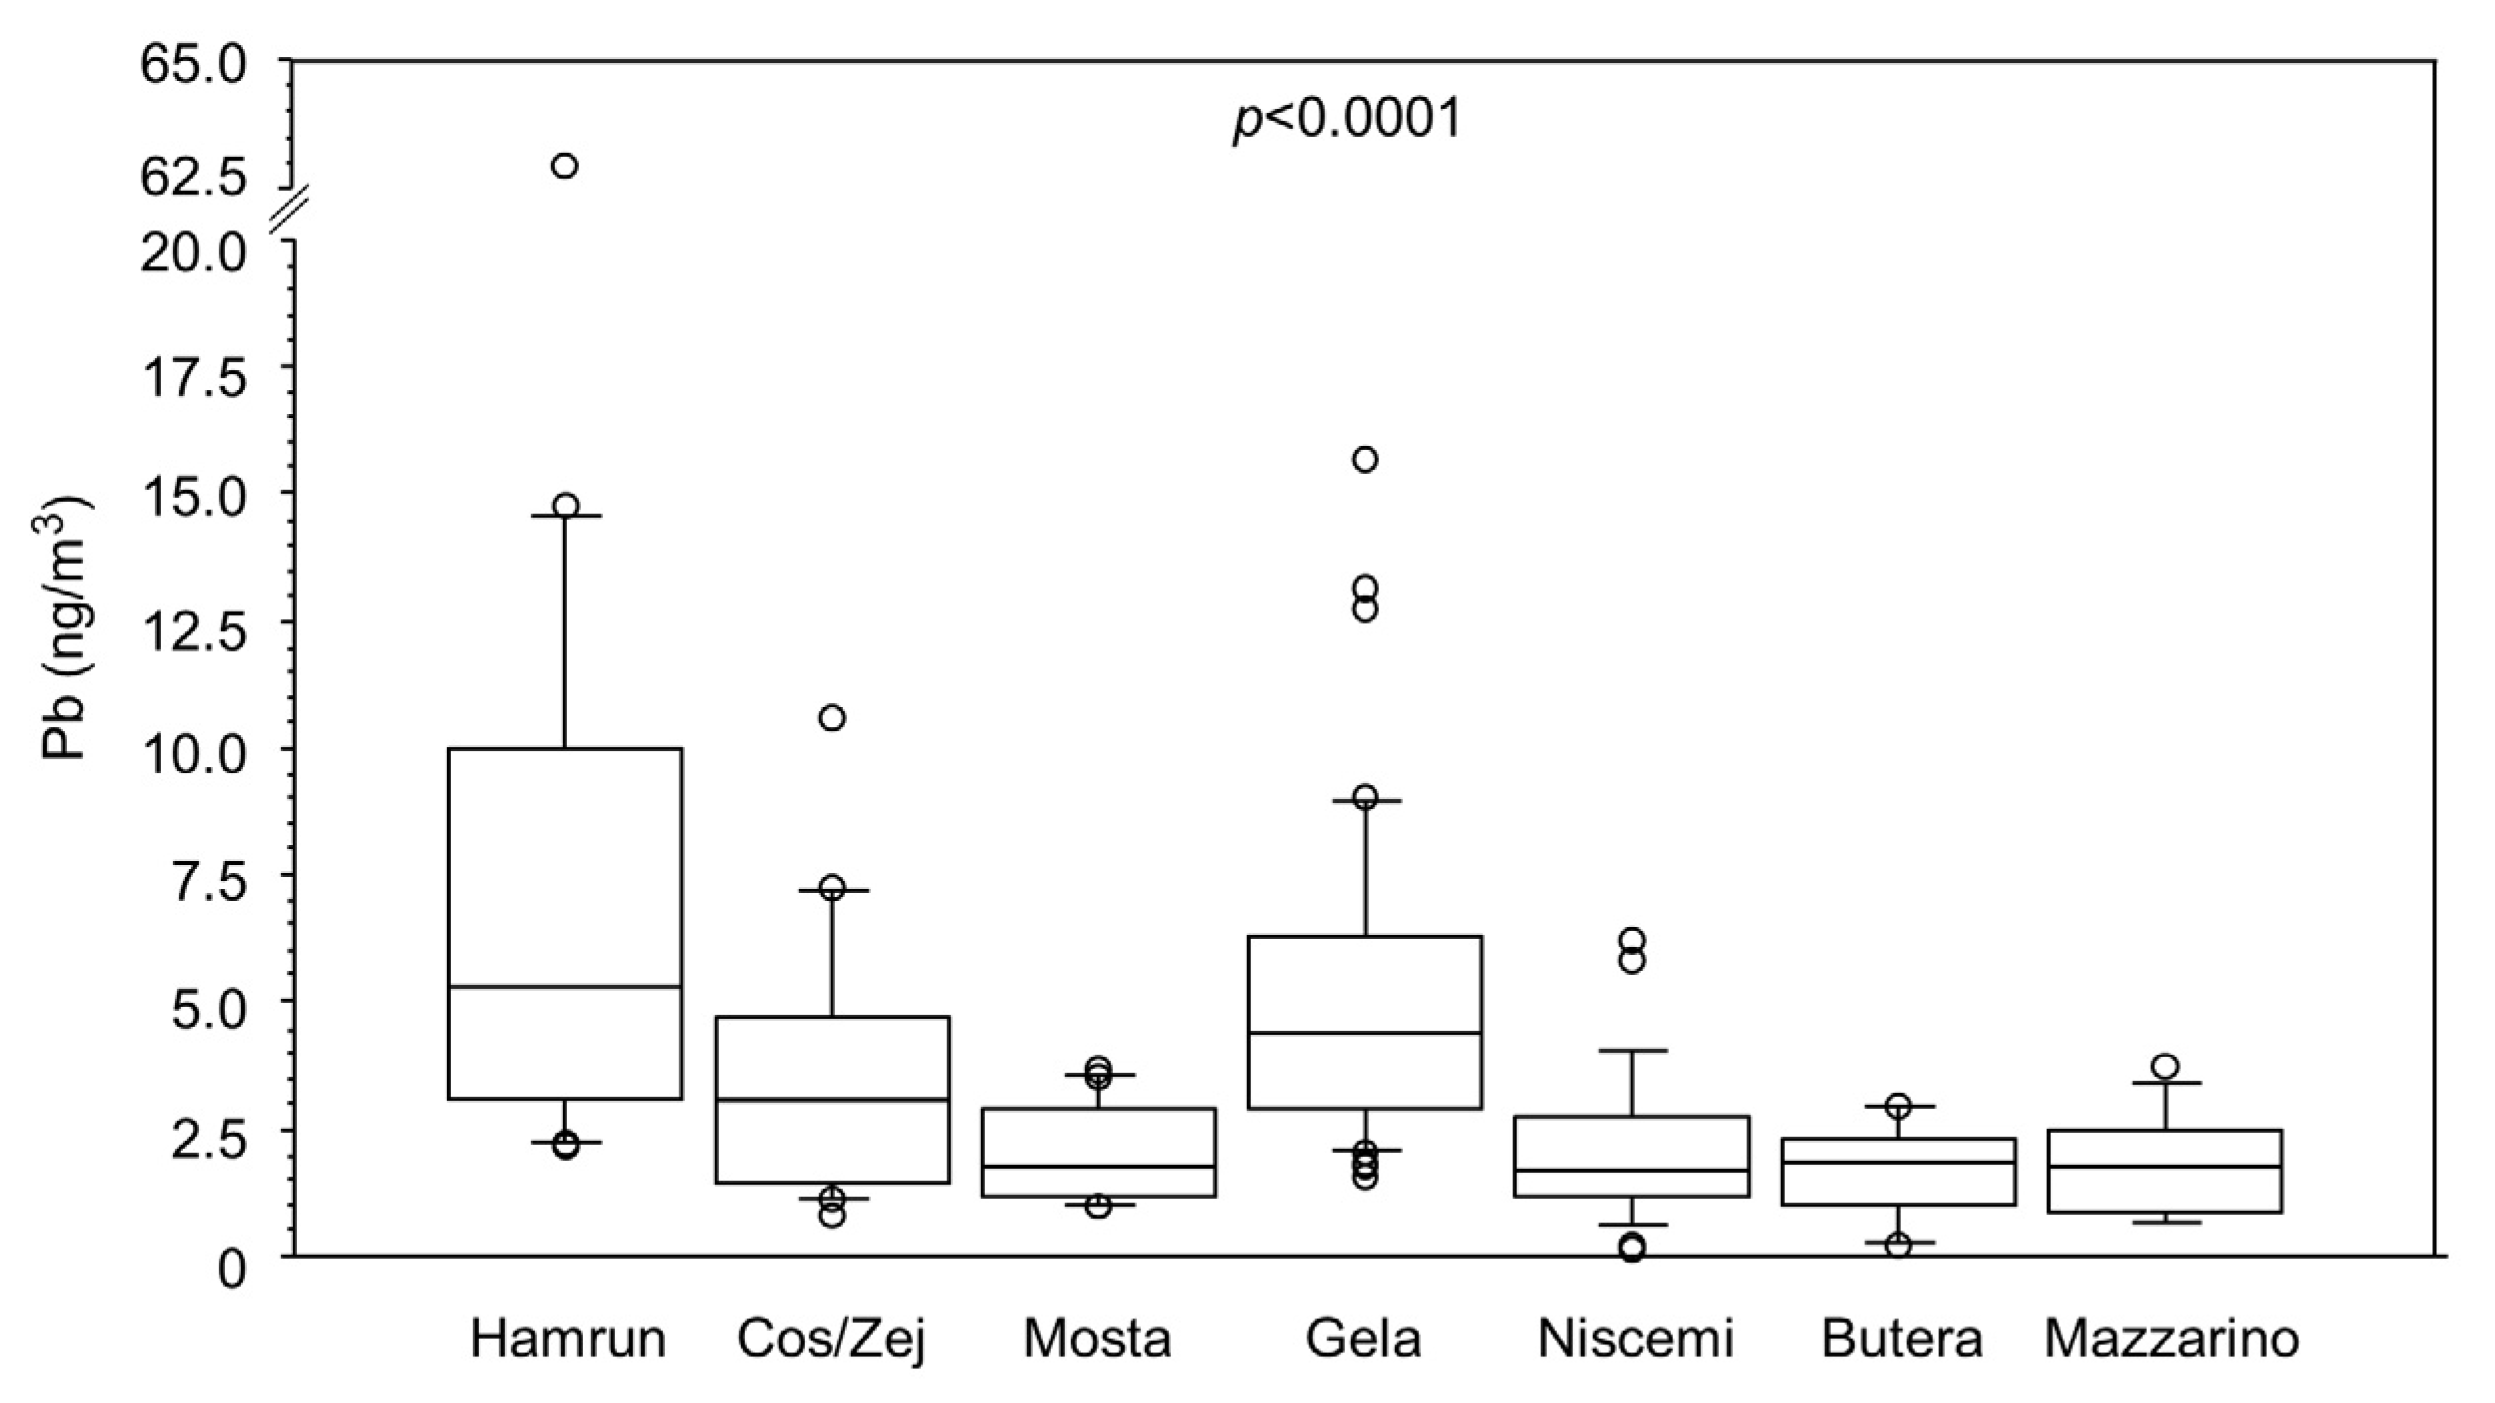
| Pb (ng/m3) | 5.3 (3.2–10.0) | 3.1 (1.5–4.7) | 1.8 (1.2–2.9) | 4.4 (2.9–6.3) | 1.7 (1.2–2.8) | 1.8 (1.0–2.3) | 1.8 (0.9–2.5) | <0.0001 |
| Mn (ng/m3) | 3.8 (2.8–4.3) | 1.7 (0.9–2.3) | 1.5 (1.2–2.2) | 3.1 (1.8–4.3) | 1.2 (0.6–1.6) | 1.7 (0.5–3.1) | 0.8 (0.5–1.7) | <0.0001 |
| Sb (ng/m3) | 0.90 (0.44–1.41) | 0.33 (0.21–0.70) | 0.18 (0.11–0.33) | 0.80 (0.61–1.74) | 0.27 (0.19–0.63) | 0.30 (0.22–0.59) | 0.24 (0.21–0.30) | <0.0001 |
| Zn (ng/m3) | 19.5 (10.6–25.7) | 17.3 (12.5–27.3) | 11.4 (6.6–13.6) | 7.0 (6.7–7.4) | 6.9 (6.8–7.2) | 7.1 (6.8–7.3) | 6.9 (6.8–7.2) | <0.0001 |
| Doctor Diagnosed Asthma | Current Asthma | Medicines for Asthma in the Last 12 Months | Rhinitis in the Last 12 Months | ||
|---|---|---|---|---|---|
| PM2.5 (µg/m3) | OR | 1.05 | 1.06 | 1.06 | 1.02 |
| 95% CI | 1.02–1.08 | 1.01–1.10 | 1.00–1.08 | 0.99–1.04 | |
| V (ng/m3) | OR | 1.08 | 1.08 | 1.06 | 1.02 |
| 95% CI | 1.03–1.12 | 1.02–1.14 | 1.01–1.11 | 0.99–1.05 | |
| Ni (ng/m3) | OR | 1.15 | 1.15 | 1.12 | 1.04 |
| 95% CI | 1.07–1.23 | 1.04–1.27 | 1.04–1.22 | 0.98–1.09 | |
| Cd (ng/m3) * | OR | 1.05 | 1.05 | 1.05 | 1.03 |
| 95% CI | 1.02–1.09 | 1.00–1.11 | 1.01–1.09 | 1.00–1.05 | |
| Pb (ng/m3) | OR | 1.10 | 1.10 | 1.09 | 1.04 |
| 95% CI | 1.04–1.15 | 1.01–1.19 | 1.01–1.16 | 0.99–1.09 | |
| Mn (ng/m3) | OR | 1.20 | 1.07 | 1.21 | 1.16 |
| 95% CI | 1.03–1.40 | 1.02–1.12 | 1.01–1.46 | 1.04–1.29 | |
| Sb (ng/m3) ** | OR | 1.07 | 1.15 | 1.07 | 1.02 |
| 95% CI | 1.04–1.11 | 1.00–1.32 | 1.03–1.11 | 0.99–1.04 | |
| Zn (ng/m3) | OR | 1.06 | 1.05 | 1.05 | 1.01 |
| 95% CI | 1.04–1.08 | 1.02–1.08 | 1.03–1.07 | 0.99–1.02 | |
Publisher’s Note: MDPI stays neutral with regard to jurisdictional claims in published maps and institutional affiliations. |
© 2020 by the authors. Licensee MDPI, Basel, Switzerland. This article is an open access article distributed under the terms and conditions of the Creative Commons Attribution (CC BY) license (http://creativecommons.org/licenses/by/4.0/).
Share and Cite
Zammit, C.; Bilocca, D.; Ruggieri, S.; Drago, G.; Perrino, C.; Canepari, S.; Balzan, M.; Montefort, S.; Viegi, G.; Cibella, F.; et al. Association between the Concentration and the Elemental Composition of Outdoor PM2.5 and Respiratory Diseases in Schoolchildren: A Multicenter Study in the Mediterranean Area. Atmosphere 2020, 11, 1290. https://doi.org/10.3390/atmos11121290
Zammit C, Bilocca D, Ruggieri S, Drago G, Perrino C, Canepari S, Balzan M, Montefort S, Viegi G, Cibella F, et al. Association between the Concentration and the Elemental Composition of Outdoor PM2.5 and Respiratory Diseases in Schoolchildren: A Multicenter Study in the Mediterranean Area. Atmosphere. 2020; 11(12):1290. https://doi.org/10.3390/atmos11121290
Chicago/Turabian StyleZammit, Christopher, David Bilocca, Silvia Ruggieri, Gaspare Drago, Cinzia Perrino, Silvia Canepari, Martin Balzan, Stephen Montefort, Giovanni Viegi, Fabio Cibella, and et al. 2020. "Association between the Concentration and the Elemental Composition of Outdoor PM2.5 and Respiratory Diseases in Schoolchildren: A Multicenter Study in the Mediterranean Area" Atmosphere 11, no. 12: 1290. https://doi.org/10.3390/atmos11121290
APA StyleZammit, C., Bilocca, D., Ruggieri, S., Drago, G., Perrino, C., Canepari, S., Balzan, M., Montefort, S., Viegi, G., Cibella, F., & on behalf of the RESPIRA Collaborative Project Group. (2020). Association between the Concentration and the Elemental Composition of Outdoor PM2.5 and Respiratory Diseases in Schoolchildren: A Multicenter Study in the Mediterranean Area. Atmosphere, 11(12), 1290. https://doi.org/10.3390/atmos11121290