Article

Regional Inhaled Deposited Dose of Indoor Combustion-Generated Aerosols in Jordanian Urban Homes

1
Department of Physics, The University of Jordan, Amman 11942, Jordan
2
Institute for Atmospheric and Earth System Research (INAR/Physics), University of Helsinki, FI-00014 Helsinki, Finland
3
Department Material Analysis and Indoor Chemistry, Fraunhofer WKI, D-38108 Braunschweig, Germany
4
Lyles School of Civil Engineering, Purdue University, West Lafayette, IN 47907, USA
5
Ray W. Herrick Laboratories, Center for High Performance Buildings, Purdue University, West Lafayette, IN 47907, USA
6
Department of Design Sciences, Lund University, P.O. Box 118, SE-221 00 Lund, Sweden
*
Author to whom correspondence should be addressed.
Atmosphere 2020, 11(11), 1150; https://doi.org/10.3390/atmos11111150
Submission received: 4 September 2020 / Revised: 21 October 2020 / Accepted: 22 October 2020 / Published: 25 October 2020
(This article belongs to the Special Issue Air Quality and Health in the Mediterranean)

Abstract

:
Indoor combustion processes associated with cooking, heating, and smoking are a major source of aerosols in Jordanian dwellings. To evaluate human exposure to combustion-generated aerosols in Jordanian indoor environments, regional inhaled deposited dose rates of indoor aerosols (10 nm to 25 µm) were determined for different scenarios for adult occupants. The inhaled deposited dose rate provides an estimate of the number or mass of inhaled aerosol that deposits in each region of the respiratory system per unit time. In general, sub-micron particle number (PN1) dose rates ranged from 109 to 1012 particles/h, fine particle mass (PM2.5) dose rates ranged from 3 to 216 µg/h, and coarse particle mass (PM10) dose rates ranged from 30 to 1600 µg/h. Dose rates were found to be dependent on the type and intensity of indoor combustion processes documented in the home. Dose rates were highest during cooking activities using a natural gas stove, heating via natural gas and kerosene, and smoking (shisha/tobacco). The relative fraction of the total dose rate received in the head airways, tracheobronchial, and alveolar regions varied among the documented indoor combustion (and non-combustion) activities. The significant fraction of sub-100 nm particles produced during the indoor combustion processes resulted in high particle number dose rates for the alveolar region. Suggested approaches for reducing indoor aerosol dose rates in Jordanian dwellings include a reduction in the prevalence of indoor combustion sources, use of extraction hoods to remove combustion products, and improved ventilation/filtration in residential buildings.

1. Introduction

Inhalation exposure to indoor air pollution is a significant factor affecting human respiratory and cardiovascular health. As people spend the majority of their time in indoor environments, it is important to conduct comprehensive assessments of indoor air quality and exposure [1,2,3]. This is especially needed in many urban areas of the world that lack reliable indoor air pollution data for evaluation of human health outcomes. In general, particulate and gaseous indoor air pollutant concentrations depend on the dynamic relationship between pollutant source and loss processes within buildings. Source processes include: (1) the transport of outdoor air pollution, which can be high in urban areas [4], into the indoor environment via ventilation and infiltration; and (2) indoor emission sources, which include solid and liquid fuel combustion, electronic appliances, cleaning, consumer products, occupants, pets, and volatilization of chemicals from building materials and furnishings [5,6,7,8,9,10,11]. Loss processes include: (1) ventilation and exfiltration; (2) deposition to indoor surfaces; (3) filtration and air cleaning; and (4) pollutant transformations in the air (i.e., coagulation, gas-phase reactions). Indoor emission sources often generate substantial increases in indoor air pollutant concentrations, exceeding contributions from the transport of outdoor air pollutants to the indoor environment. Concentrations of indoor-generated pollutants can be further augmented due to poor building ventilation.
Understanding the health effects of inhaled indoor aerosols can be evaluated through the following approach: (1) evaluation of indoor exposure levels and particle characteristics; (2) calculation of the inhaled deposited dose in the human respiratory tract; and (3) toxicity analysis and biological response [7,12]. Quantitative analysis of the inhaled deposited dose of indoor aerosols in the respiratory tract provides an extra layer of information beyond reporting of exposure levels. The International Commission on Radiological Protection (ICRP) model has been the most widely used to calculate regional respiratory deposition rates of aerosols [13], and more recently, the Multiple Path Particle Dosimetry (MPPD) model has also been used [14]. However, inhaled deposited dose analysis of indoor aerosols has been given limited attention in many parts of the world, especially in Middle Eastern dwellings [15,16,17,18].
The objective of this study is to evaluate the regional deposited dose (number, mass) of inhaled combustion-generated aerosols in Jordanian indoor environments during the winter season. The dose analysis is based on measured particle number size distributions (0.01–25 µm) associated with fossil fuel combustion processes (kerosene and natural gas) that are commonly used for heating and cooking, as well as indoor smoking. Both number and mass dose rates were estimated; the latter is derived from particle mass size distributions estimated using aerosol effective densities. This is the first study, to the authors’ knowledge, to report inhaled deposited dose rates for indoor aerosols in Middle Eastern indoor environments.

2. Methodology

2.1. Inhaled Deposited Dose Rate of Indoor Combustion-Generated Aerosols

The ICRP and MPPD models divide the respiratory tract into three regions: head/throat, tracheobronchial (TB), and pulmonary/alveolar (P/Alv). Following our previous methodology as described by Hussein et al. [7,19,20], we can calculate the regional inhaled deposited dose for a specific particle diameter range (Dp1Dp2) during a one-hour exposure period as a dose rate:
Dose   Rate   =   D P 1 D P 2 V E · D F ( D P ) · n N 0 ( D P ) · f dlog ( D P )
where VE is the minute ventilation (volume of air breathed as reported by Holmes [21], Table S1), DF(Dp) is the aerosol deposition fraction in a particular region of the respiratory tract (Figure S1 as reported by Löndahl et al. [22]), nN0(Dp) (particles/cm3) is the particle number size distribution (i.e., dN/dlog(Dp)), and f is a metric conversion for the aerosol concentration (i.e., it is 1 for particle number and for particle mass = ρpDp3π/6, where ρp is the particle effective density). The deposition fraction (DF) and the particle number size distribution (n) are functions of particle diameter (Dp). Dose rates were calculated for adult male and female occupants reflecting different activity levels (resting, exercising, housework) and exposures to different indoor combustion sources (heating, cooking, smoking). The combination of subjects, activities, and combustion processes reflect common exposure scenarios in Jordanian dwellings during the winter. The indoor aerosol exposure assessment was adopted from our prior observations reported for eight homes in Amman, Jordan.

2.2. Indoor Aerosol Concentrations and Size Distributions in Jordanian Urban Homes

Particle number size distributions were adopted from a previous field measurement campaign reported by Hussein et al. [23] for eight homes from 23 December 2018 to 12 January 2019 (i.e., winter season) in Amman, Jordan (Figure S2, Table S2). Indoor aerosol measurements were made using two portable condensation particle counters (CPC 3007 and P-Trak 8525, TSI Inc., Minnesota, USA) and a handheld optical particle counter (AeroTrak 9306-V2, TSI Inc., Minnesota, USA); see Table S3. The use of this combination of portable aerosol instrumentation provides a basis to derive the particle number size distribution (0.01–25 µm) with 8 bins or size fractions [20,23,24,25,26,27,28,29,30,31]. The particle effective density is needed when converting a particle number size distribution to a particle mass size distribution. Here, we assumed the effective density to be similar to what was reported for urban air in Asian cities [32] as we are investigating exposure to aerosols originating from fossil fuel combustion, i.e., natural gas heaters and stoves. The calculation of size-fractionated particle number and mass concentrations (i.e., PN1, PM2.5, and PM10) are described in the Supplementary Material.

3. Results and Discussion

3.1. Overview of Indoor Exposure to Combustion-Generated Aerosols in Jordanian Urban Homes

3.1.1. Indoor Aerosol Concentrations during Background Periods

Investigating aerosol concentrations during periods without indoor activities (i.e., no active indoor emission sources) is necessary to benchmark the background conditions in each dwelling. We identified such periods and calculated the mean, median, and quartiles for total particle number (PN) and mass (PM2.5 and PM10) concentrations (Table 1 and Table 2 and Figure 1). Each of these periods was characterized during the nighttime when occupants were asleep. For background PN concentrations (Table 1), the lowest was found in home apartment A1 (mean 4000 ± 300 cm−3) and the highest in ground floor apartment GFA2 (mean 15,800 ± 5800 cm−3). The corresponding PM2.5 and PM10 concentrations were the highest in home H2 (approximately 21.7 ± 21.2 µg/m3 and 82.4 ± 90.8 µg/m3, respectively) and the lowest in A1 (approximately 4.1 ± 0.1 µg/m3 and 5.3 ± 0.5 µg/m3, respectively) (Table 2). In general, indoor aerosol concentrations during these periods reflect outdoor concentrations as the primary indoor aerosol source is infiltration via indoor-outdoor air exchange.
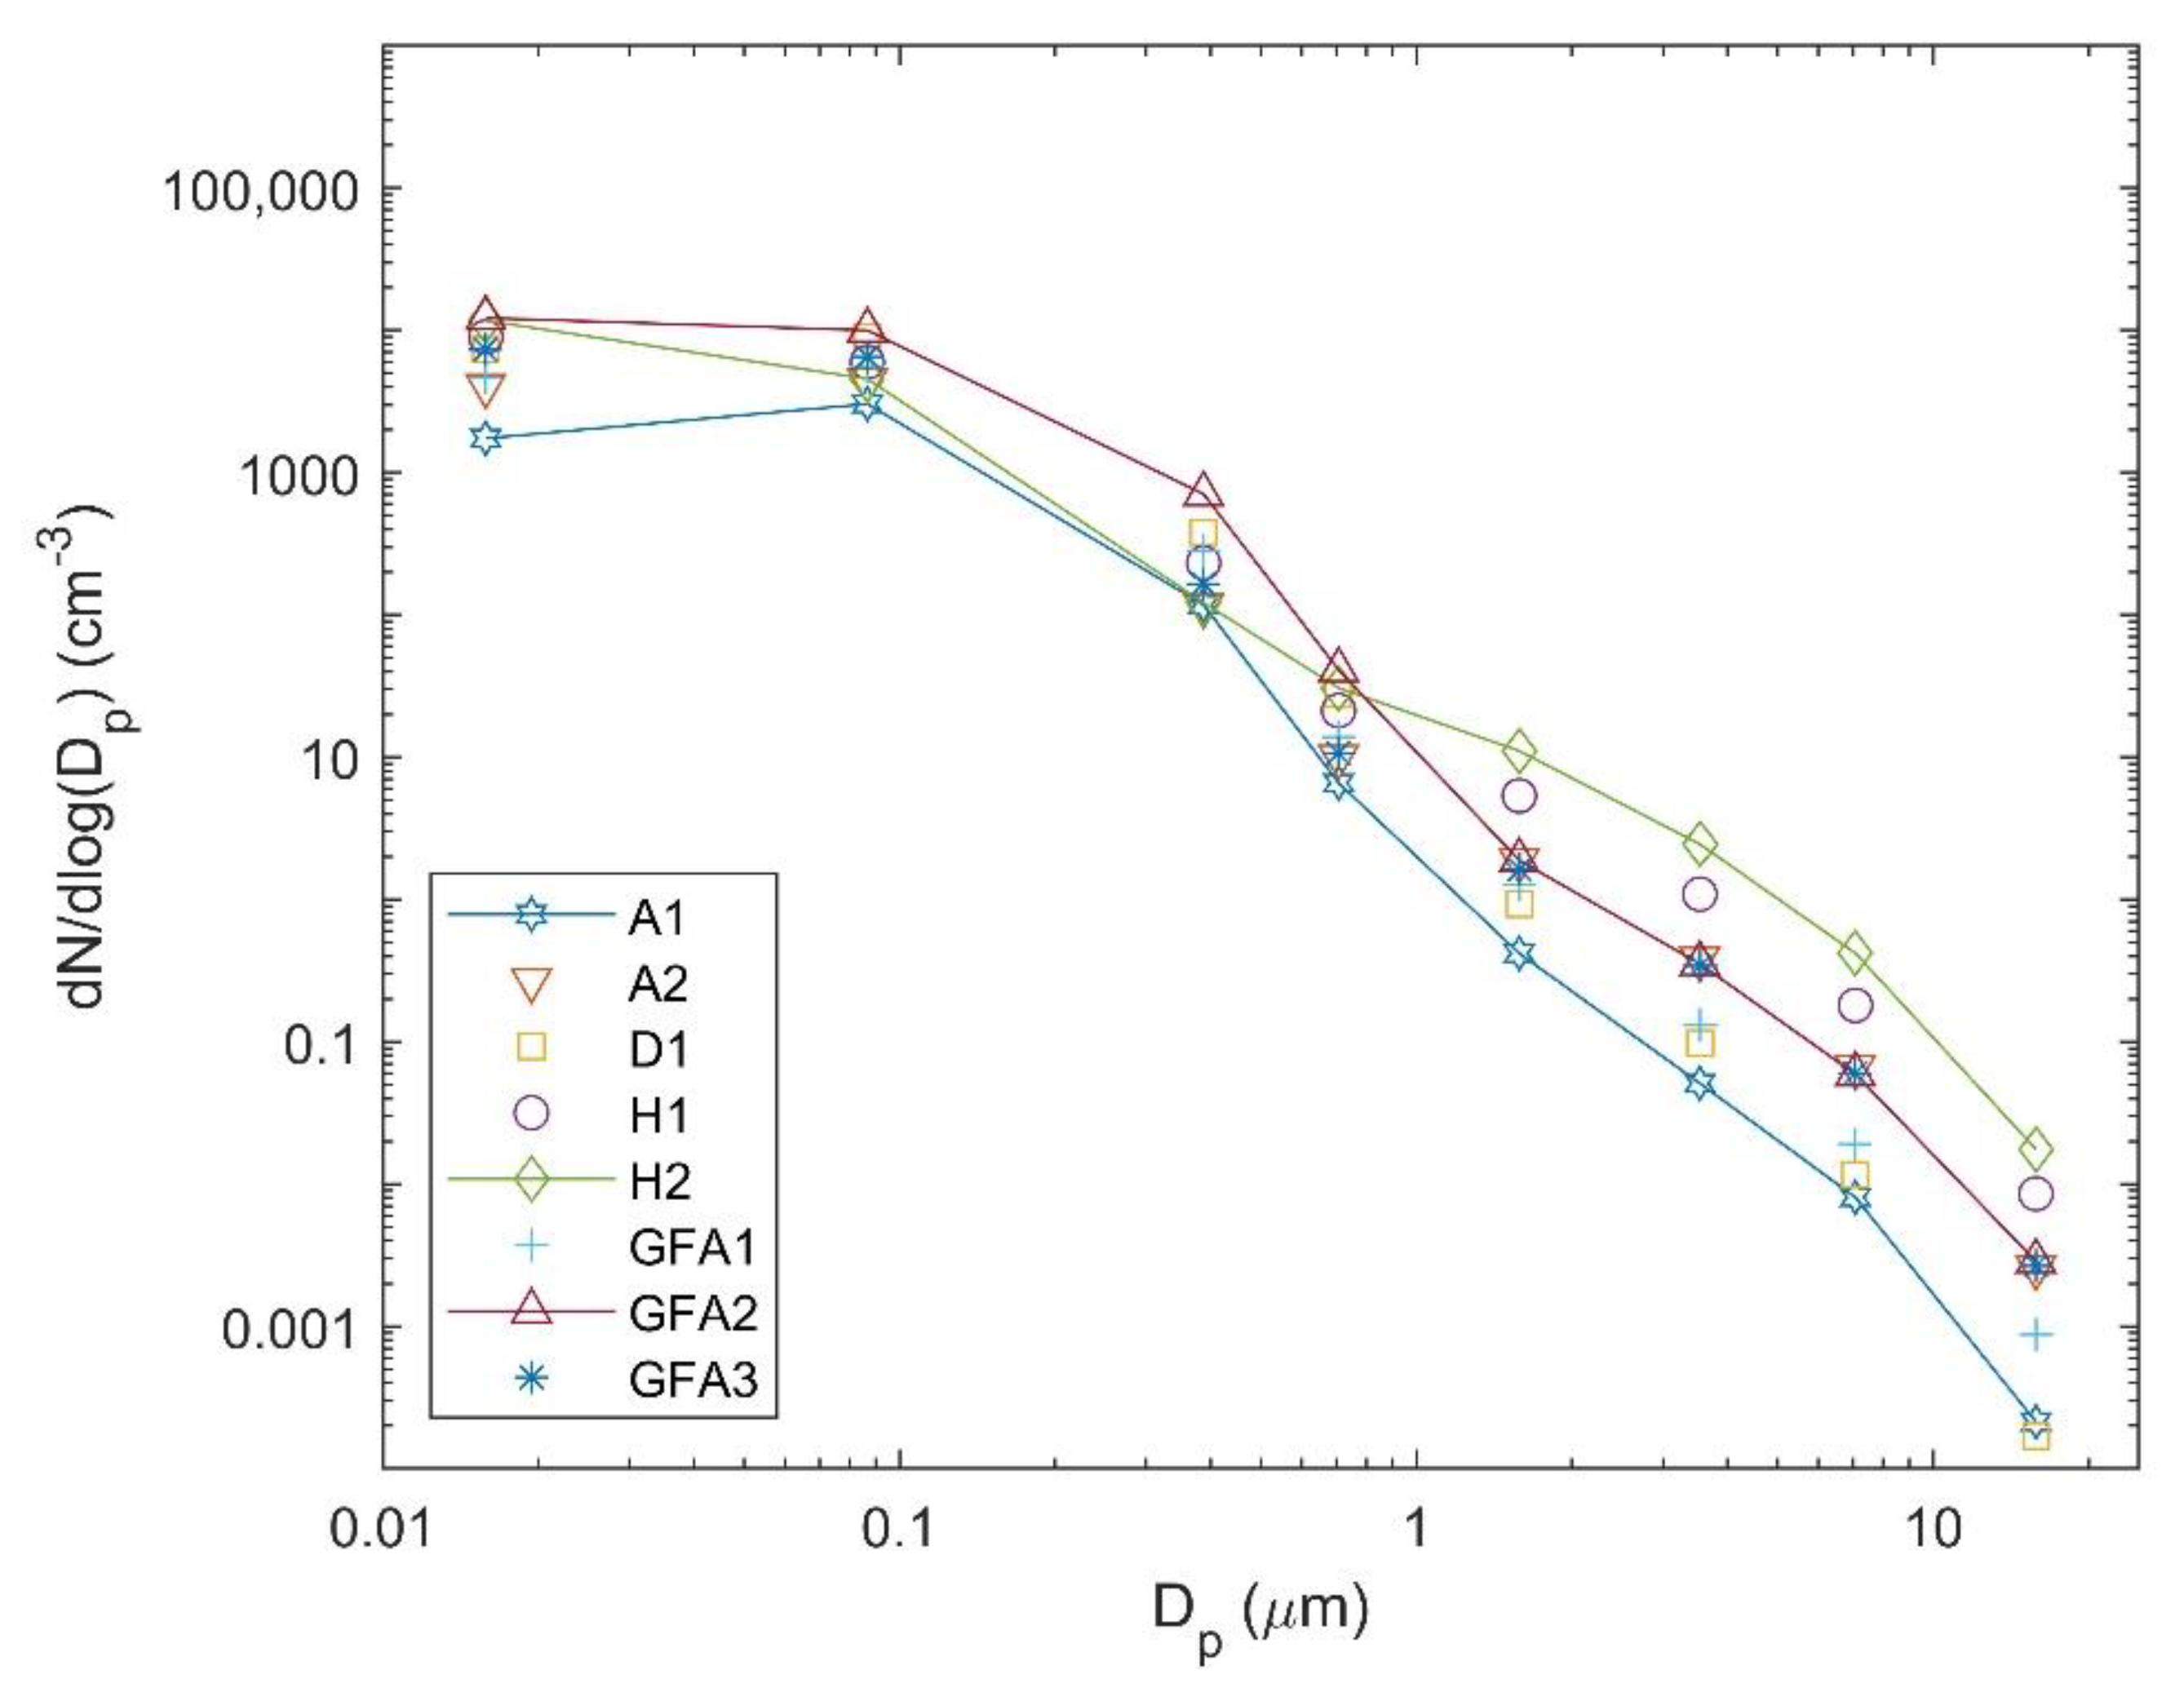
Variations in the magnitude of the mean indoor particle number size distributions during background conditions were observed among the eight homes (Figure 2). This is due in part to variations in outdoor particle size distributions at each site, infiltration and ventilation rates, and prevalence of indoor emission sources prior to the background periods during the nighttime. The mean particle number size distributions generally exhibit similarity in shape, with pronounced nucleation and Aitken modes. Ultrafine particles (Dp ≤ 0.1 µm) dominate the number size distributions for each home. Homes duplex D1, house H1, and GFA2 were associated with the highest sub-micron particle concentrations, likely due to indoor smoking activities that occurred prior to the background periods. Accumulation mode aerosols emitted during smoking typically have a low deposition rate to indoor surfaces, and thus, have a long residence time in indoor air.

3.1.2. Indoor Activity Categories for Inhaled Deposited Dose Analysis

We selected the following activities for the inhaled deposited dose analysis: heating (kerosene, natural gas, central heating system, air conditioning split unit (AC)), cooking (microwave, water heater jug, combustion using natural gas stove), and smoking (shisha, tobacco). The activity-specific aerosol concentrations are listed in Table S5 and the mean particle number size distributions categorized per event and home are presented in Figure S3. The events are categorized as follows:
  • TYPE I: Non-combustion cooking activities (i.e., microwave, water heater jug).
  • TYPE II: Intensive cooking activities by combustion (i.e., natural gas stove) combined with non-combustion heating (central or AC).
  • TYPE III: Cooking activities by combustion (i.e., natural gas stove) combined with combustion heating (kerosene or natural gas).
  • TYPE IV: Cooking activities by combustion (i.e., natural gas stove) combined with combustion heating (kerosene or natural gas) and smoking (shisha and/or tobacco).
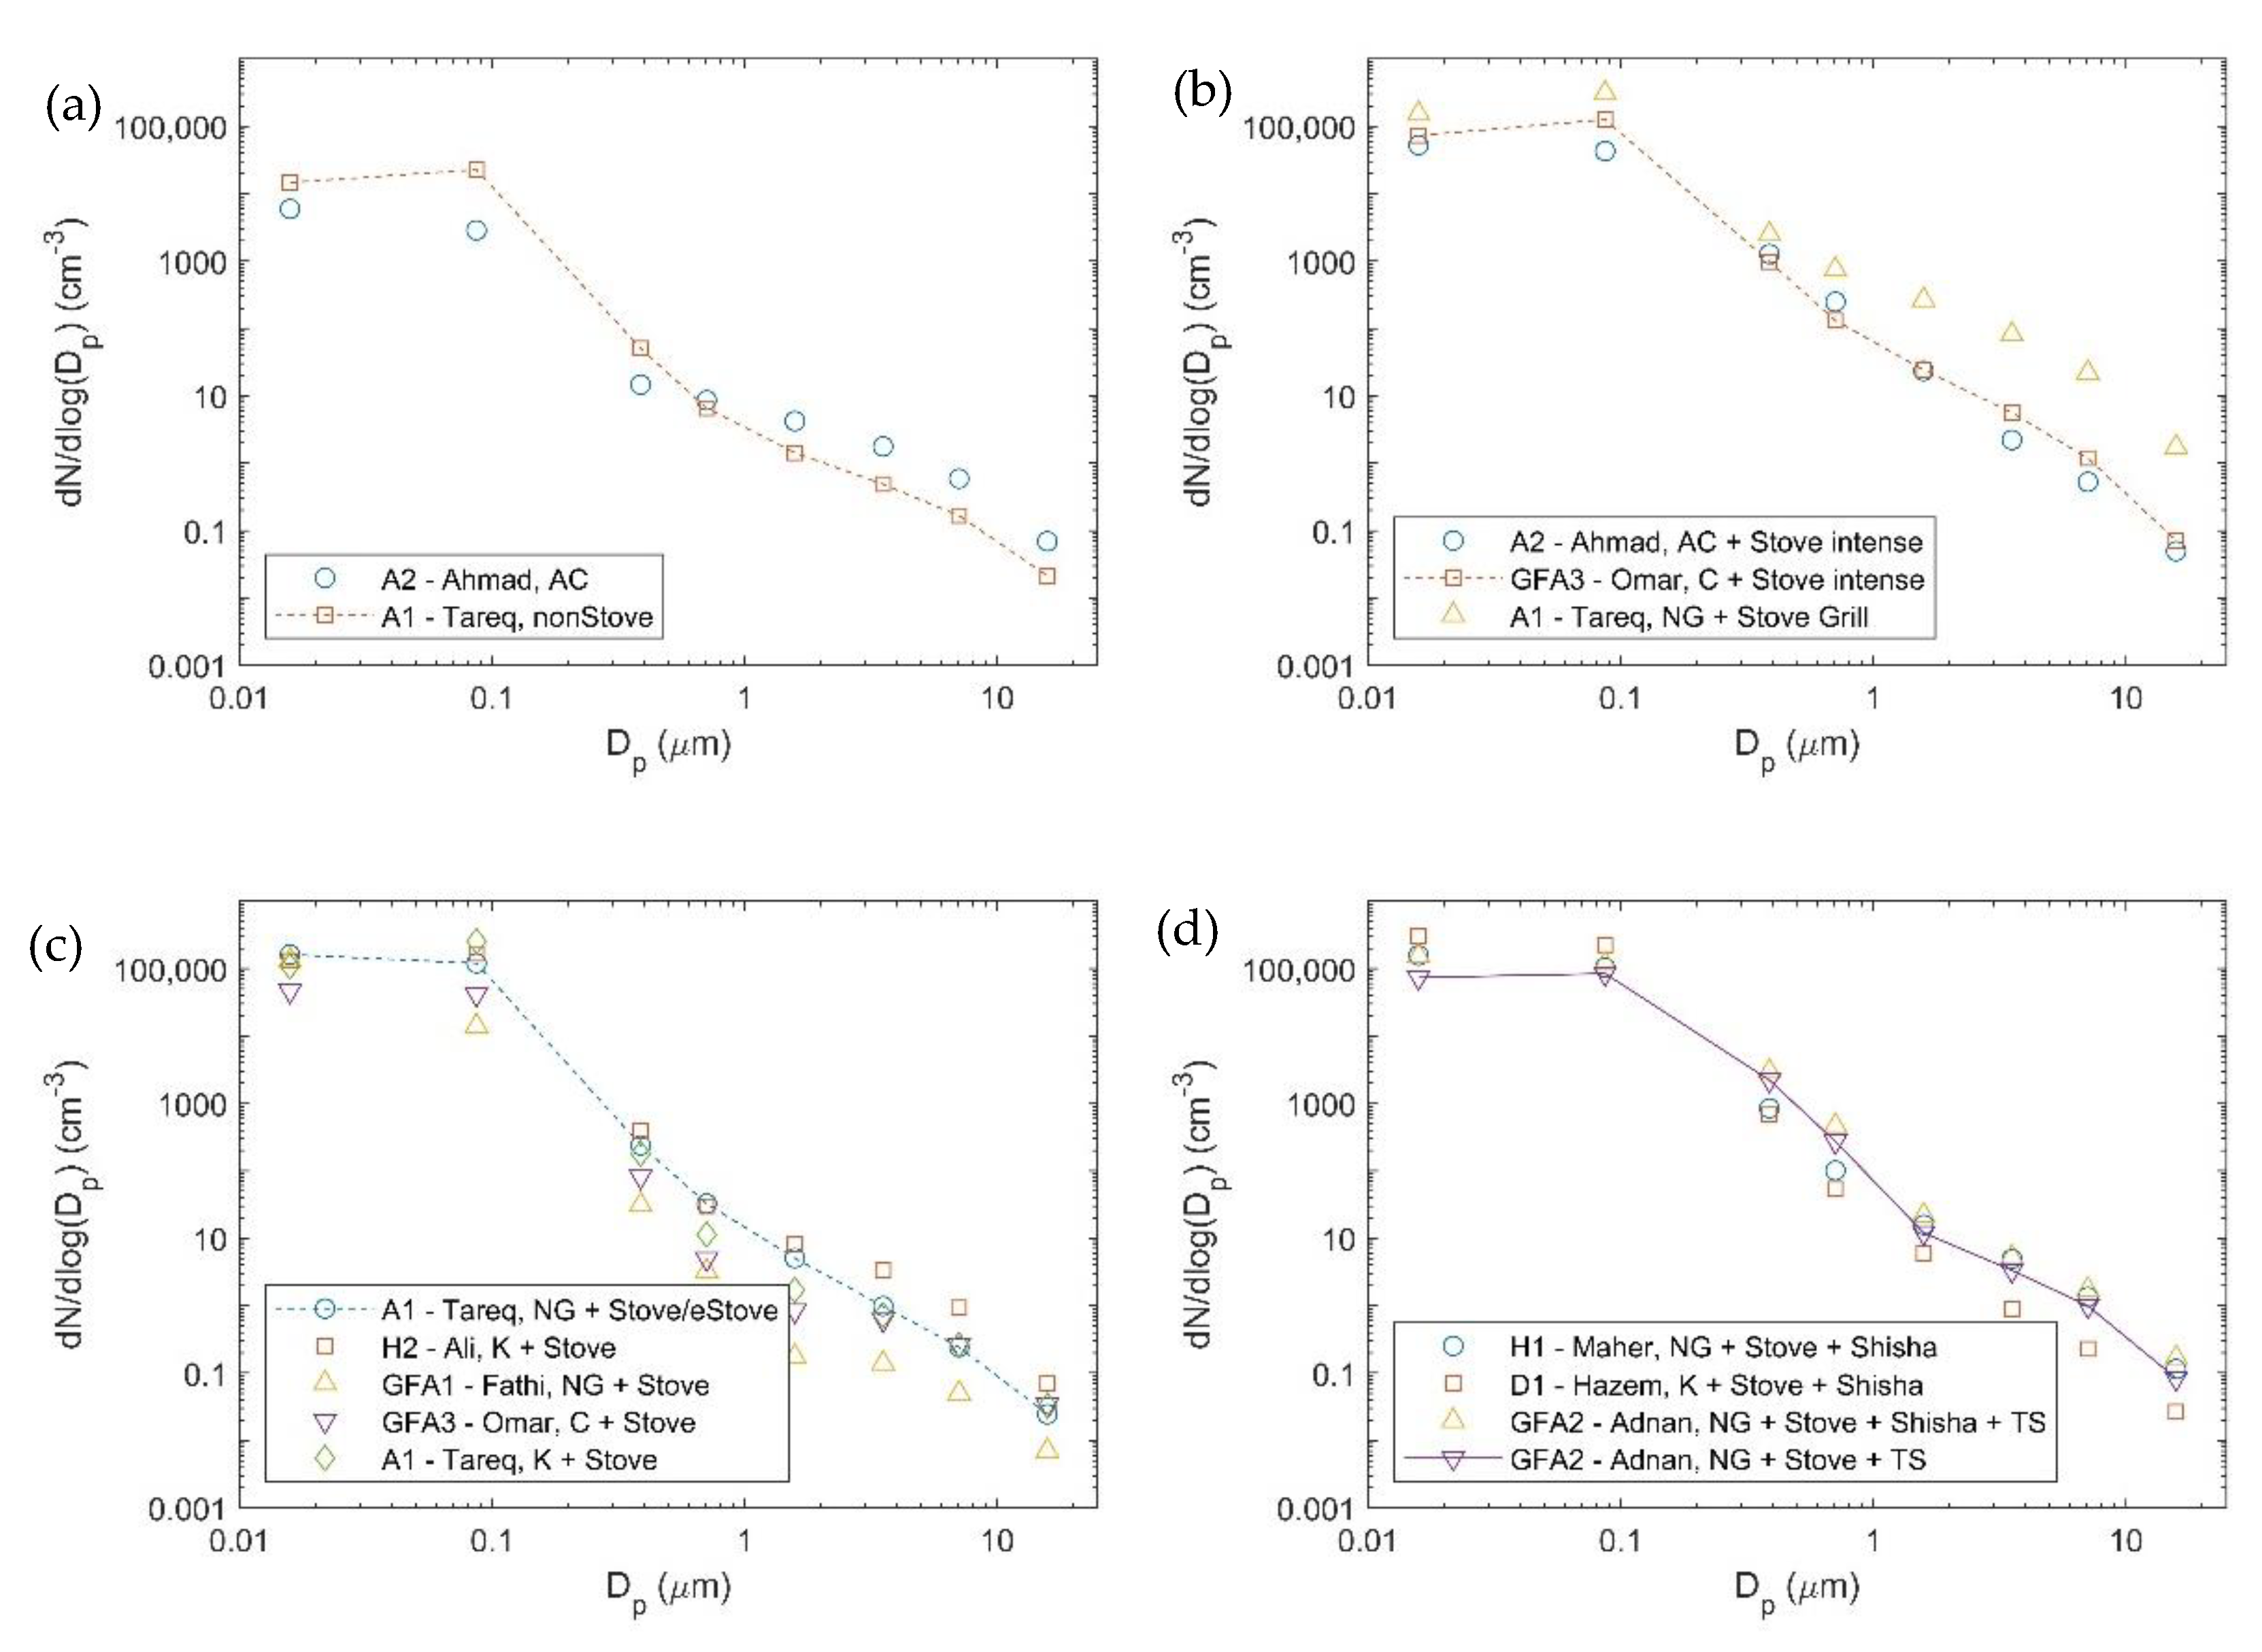
The overall mean size-fractionated particle number concentrations for each category and background conditions are listed in Tables S6–S10 and the particle concentrations are presented in Figure 3 and Table 3. The corresponding particle number size distributions are presented in Figure 4. Particle concentrations were the lowest for TYPE I indoor activities (Table S7 and Table 3), which did not include any combustion processes. The overall mean PN concentrations were approximately 16,400 ± 17,200 cm−3 and the corresponding PM2.5 and PM10 concentrations were 16 ± 11 µg/m3 and 82 ± 53 µg/m3, respectively. This was slightly higher than the overall mean background concentrations for all homes with PN = 9900 ± 4900 cm−3, PM2.5 = 13 ± 15 µg/m3, and PM10 = 33 ± 53 µg/m3.
TYPE II activities included intensive cooking (natural gas stove) and different heating processes. It was found to have a measurable impact on indoor air quality with overall mean concentrations of 1.5 × 10⁵ ± 1.0 × 105 cm−3, 121 ± 67 µg/m3, and 260 ± 124 µg/m3; respectively for PN, PM2.5, and PM10 (Table S8 and Table 3). TYPE II activities included three indoor activities with respect to heating type: AC in home A1 (7.4 × 10⁴ ± 3.2 × 104 cm−3, 99 ± 36 µg/m3, 176 ± 75 µg/m3; respectively), central heating system in GFA3 (1.8 × 10⁵ ± 9.8 × 104 cm−3, 130 ± 65 µg/m3, 296 ± 104 µg/m3; respectively), and a natural gas heater in A1 (4.7 × 10⁵ ± 8.9 × 104 cm−3, 1400 ± 320 µg/m3, 10,400 ± 3900 µg/m3; respectively). These results demonstrate the impact of using natural gas combustion for cooking and heating in an enclosed indoor environment with poor ventilation during the winter.
The overall mean concentrations for TYPE III indoor activities (Table S9 and Table 3) were 2.9 × 10⁵ ± 1.9 × 105 cm−3, 170 ± 135 µg/m3, 661 ± 715 µg/m3; respectively for PN, PM2.5, and PM10. Home GFA3 (central heating system) had the lowest mean particle concentrations (1.0 × 10⁵ ± 7.1 × 104 cm−3, 49 ± 16 µg/m3, 171 ± 44 µg/m3; respectively for PN, PM2.5, and PM10). As for activities in homes A1 and GFA1 (natural gas heaters), the mean particle concentrations were in the range of 1.6 × 10⁵–2.0 × 104 cm−3, 36–79 µg/m3, 65–111 µg/m3; respectively. The highest mean particle concentrations were found in homes A1 and H2 (kerosene heater) with values in the range 3.1 × 10⁵–3.7 × 105 cm−3, 152–193 µg/m3, 254–772 µg/m3; respectively. This suggests that kerosene heaters may have a more pronounced impact on elevating indoor particle concentrations as compared to natural gas heaters.
The highest particle concentrations were found during cooking (natural gas stove) combined with combustion heating (natural gas or kerosene heaters) and smoking (shisha and/or tobacco) (Table S10 and Table 3). The mean particle concentrations were in the range of 1.8 × 10⁵–5.5 × 105 cm−3, 215–493 µg/m3, 317–1200 µg/m3; respectively for PN, PM2.5, and PM10.

3.2. Inhaled Deposited Dose Scenarios

The primary goal of this study was to quantify the regional deposited dose rate of combustion-generated aerosols in the respiratory tract for exposure during four indoor activity types (TYPEs I, II, III, IV) and background conditions. Such analyses have yet to be made for indoor environments in the Middle East, which include a mixture of western and eastern living styles with respect to heating, cooking, and other indoor activities. The dose rate calculations were made for the following scenarios:
  • Housework activities: effort equivalent to yardwork.
  • Moving activities: effort corresponding to running at 8 km/h and walking at 4 km/h.
  • Resting activities: standing and sitting.

3.2.1. Regional Inhaled Deposited Dose Rates for Background Condition Scenarios

The regional inhaled deposited dose rate calculated based on exposure to mean sub-micron particle number concentrations (i.e., PN1) was the highest in the alveolar region and the lowest in the head airways during indoor background conditions (Table 4 and Figure 5). The total PN1 dose rate was in the range of 2.9 × 10⁹–1.9 × 10¹⁰ particles/h for an adult male and 2.3 × 10⁹–1.7 × 10¹⁰ particles/h for an adult female. The highest dose rate was received during running (i.e., indoor exercising) and the lowest during sitting due to a higher minute ventilation at increased effort for the former. Approximately 75% of the total PN1 dose rate was received in the alveolar region and approximately 7.5% was received in the head region for adult males performing running, walking, and working activities. As for standing and sitting, adult males received approximately 62% of the total PN1 dose rate in the alveolar region and approximately 14% in the head region. When compared to an adult male, an adult female received a slightly lower PN1 dose rate fraction in the alveolar region (about 73%) and a slightly higher dose rate fraction in the head region (about 8%) during running, walking, and working activities. Adult females received 53% of the total PN1 dose rate in the alveolar region and 16% in the head region for standing and sitting.
The regional dose rate for mean fine particle mass (i.e., PM2.5) followed a similar pattern as that for sub-micron particle number (i.e., PN1). For example, the PM2.5 dose rate was the highest in the alveolar region (range: 1.3–9 µg/h for adult males and 0.9–7.7 µg/h for adult females) and the lowest in the head region (range: 0.4–1 µg/h for adult males and 0.3–0.8 µg/h for adult females). The highest PM2.5 dose rate was received during running and the lowest during sitting (Table 4 and Figure 5). An adult male performing running, walking, and working activities would receive approximately 75% of the total PM2.5 dose rate in the alveolar region and about 8% in the head region. As for standing and sitting, adult males received approximately 50% of the total PM2.5 dose rate in the alveolar region and about 38% in the head region. When compared to an adult male, an adult female received rather similar fractions in the head region. However, the fractions were slightly lower for the alveolar region (about 46% during standing and sitting and about 74% during running, walking, and working).
The PM10 regional dose rate pattern was different than those for PN1 and PM2.5. However, the pattern was similar for adult males and females. For example, the PM10 dose rate fraction was approximately 35% in the head region during yardwork, running, and walking and it was about 68% during standing and sitting. The corresponding fraction in the alveolar region was about 32% and 22%, respectively. The total PM10 dose rate in the head region was in the range of 8–24 µg/h for adult males and 6–21 µg/h for adult females. As for the alveolar region, the dose rate was in the range of 3–22 µg/h for adult males and 2–20 µg/h for adult females (Table 4 and Figure 5). The higher dose rate in the head airways for particles larger than 2.5 µm is explained by a higher deposition efficiency via impaction and gravitational settling for large particles.

3.2.2. Regional Inhaled Deposited Dose Rates for TYPE I Scenarios

This category of indoor activities includes indoor aerosol emissions during non-combustion processes. In general, the dose rates received during TYPE I indoor activities were 1.6-, 1.4-, and 2.9-fold higher than what was received during indoor background conditions; respectively for PN1, PM2.5, and PM10. Adult females received lower aerosol dose rates than adult males, primarily due to a lower minute ventilation (Table 5 and Figure 6).
PN1 and PM2.5 regional deposition patterns (fractions in each respiratory region) were similar as that received during indoor background conditions. The total PN1 dose rate received in the head region was in the range of 4.6 × 10⁹–3.1 × 10¹⁰ particles/h for an adult male and 3.6 × 10⁹–2.7 × 10¹⁰ particles/h for an adult female. The corresponding total PM2.5 mass dose rate was in the range of 4–17 µg/h and 3–15 µg/h; respectively for adult males and females. In contrast to PN1 and PM2.5, the PM10 deposition pattern was different from that received during background conditions. Specifically, the PM10 dose rate fraction was approximately 42% in the head region during yardwork, running, and walking and it was about 75% during standing and sitting. The corresponding fraction in the alveolar region was approximately 24% and 16%, respectively. The change in the PM10 dose pattern was expected because during TYPE I scenarios, concentrations of coarse mode particles increased in part due to human movement-driven settled dust resuspension. The total PM10 dose rate was in the range of 35–210 µg/h and 27–183 µg/h; respectively for adult males and females. For adult males, the dose rate received was 26–87 µg/h in the head region and 6–50 µg/h in the alveolar region; with lower values during sitting and higher values during indoor exercising. For adult females, the corresponding values in the head and alveolar regions were 20–78 µg/h and 4–44 µg/h, respectively.

3.2.3. Regional Inhaled Deposited Dose Rates for Combustion Scenarios (TYPEs II, II, IV)

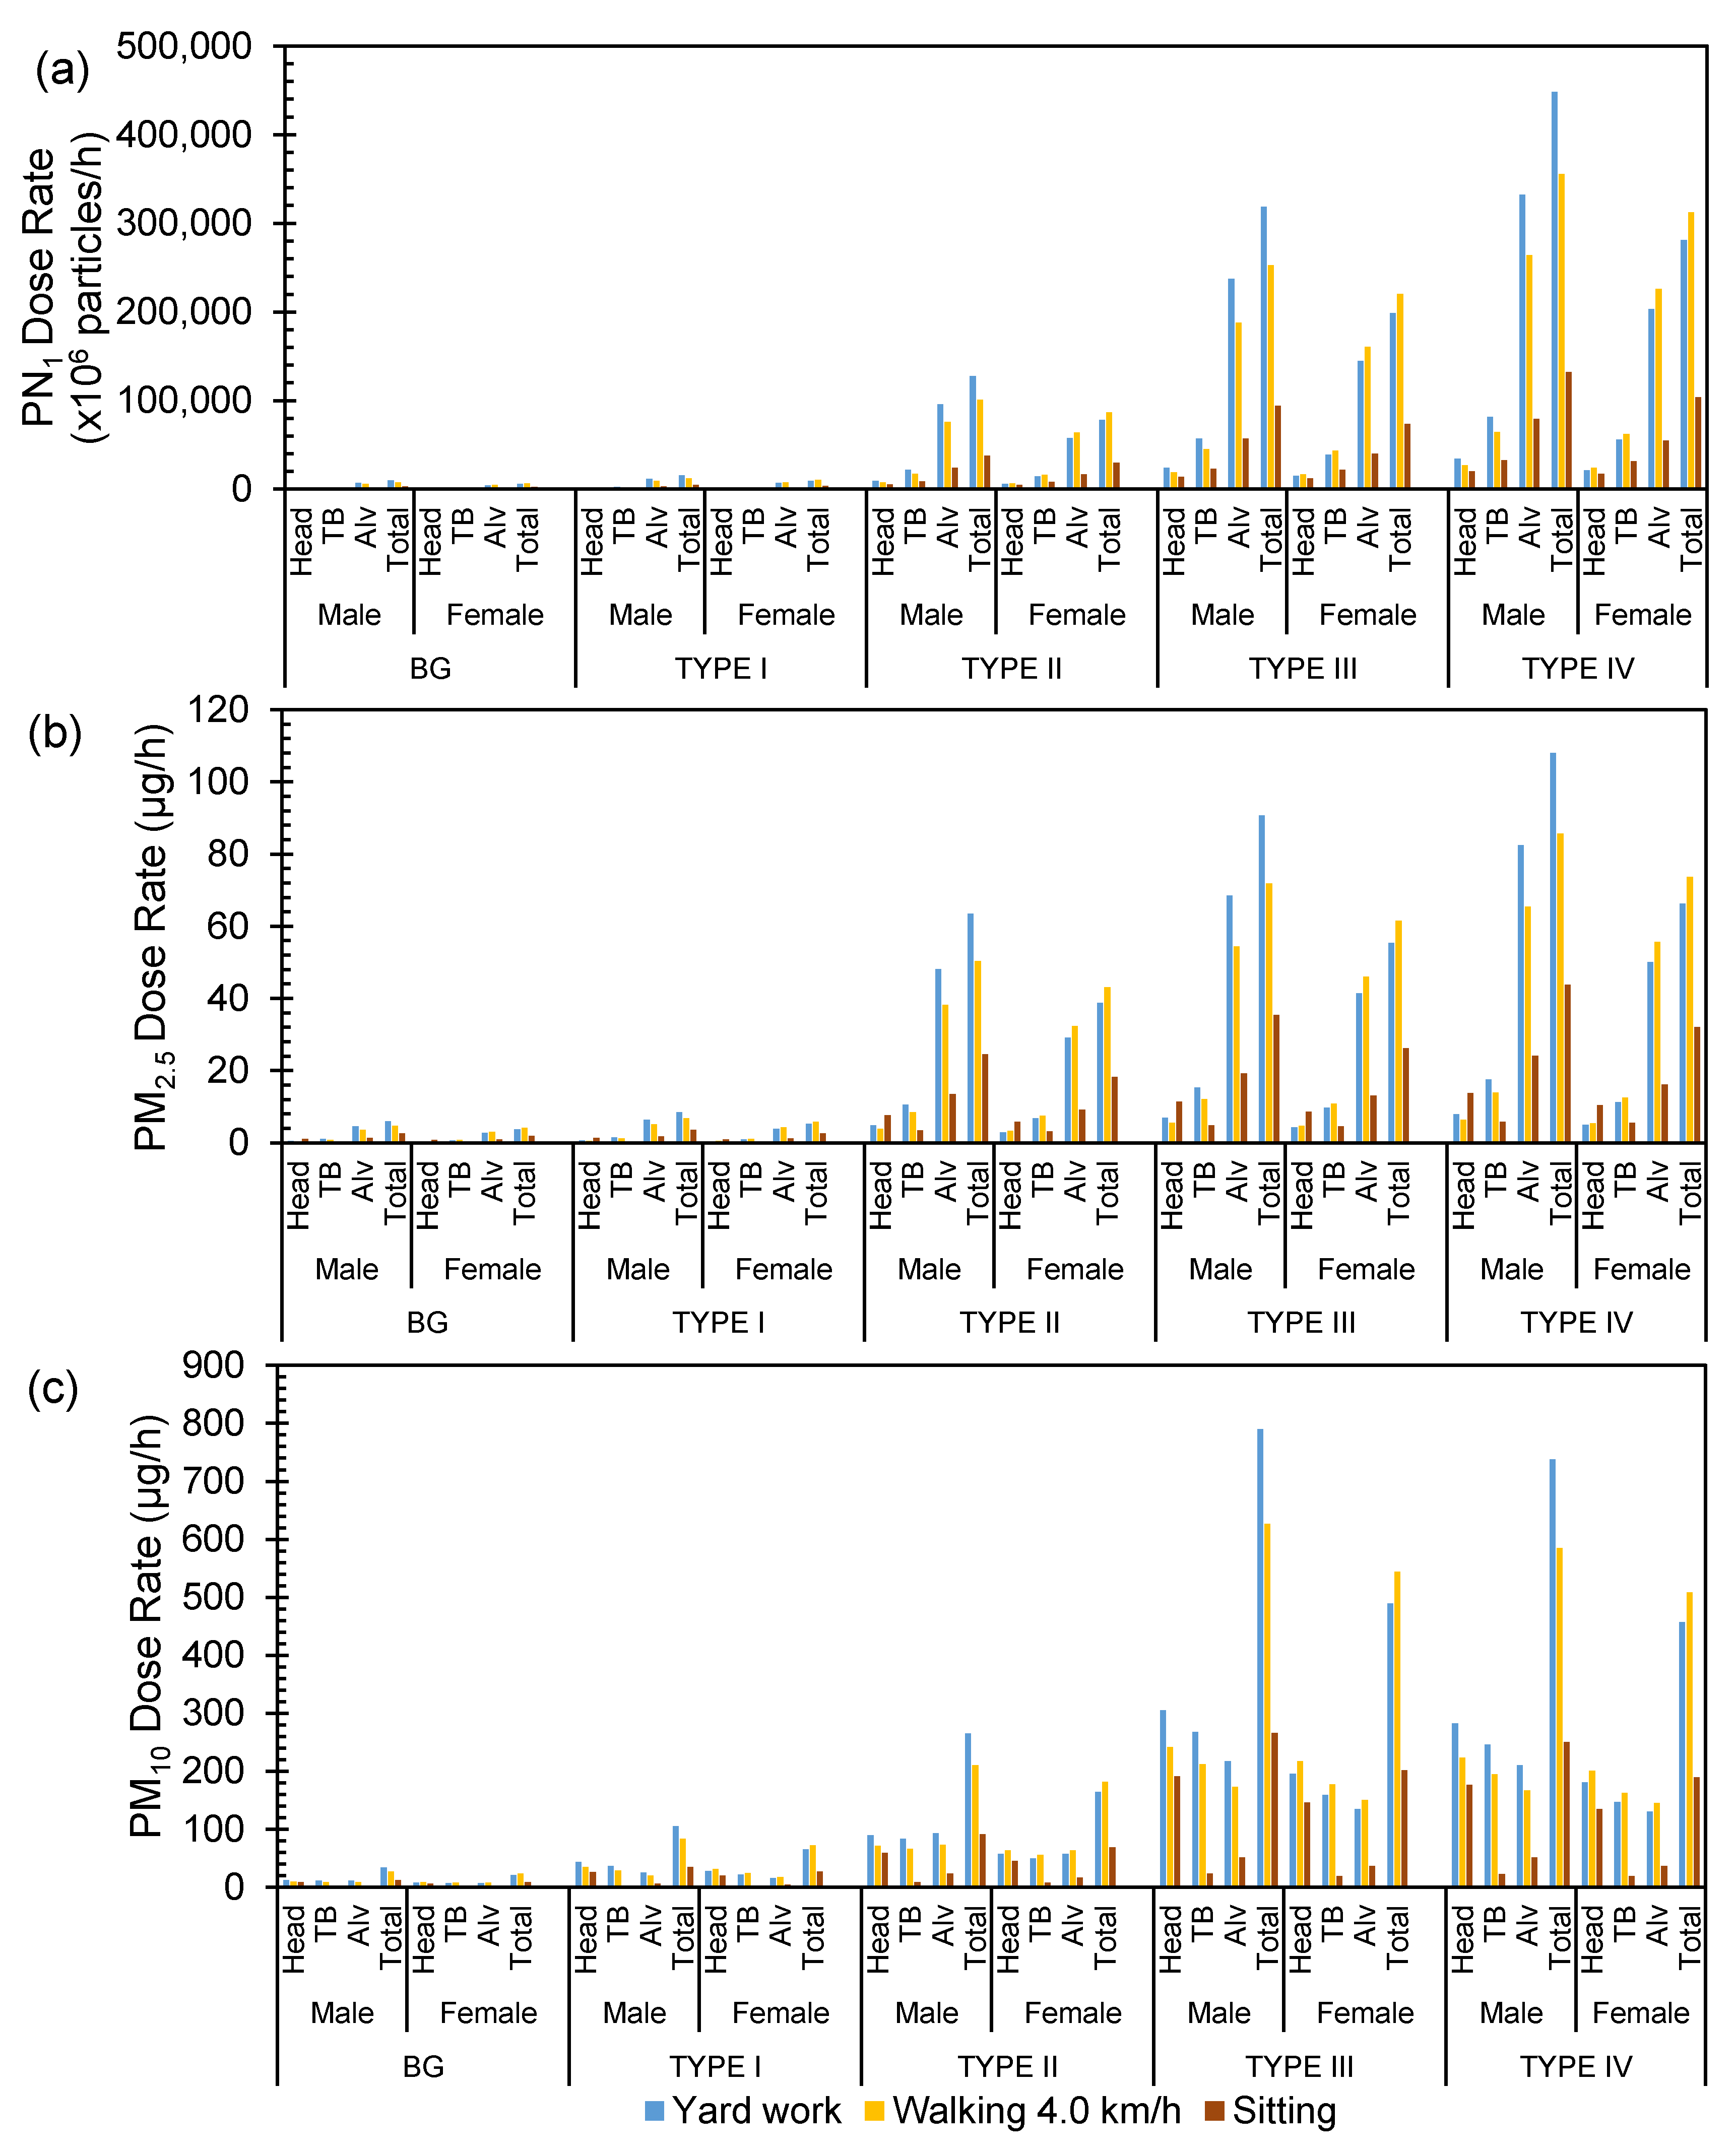
For these categories of indoor activities, fine particle number concentrations were much higher than what was observed during the background conditions and TYPE I activities (Table 3 and Figure 3 and Figure 4). This was reflected in the dose rate calculations. For instance, the dose rates received during TYPE II indoor activities were 7.9-, 10.2-, and 12.9-fold higher than what was received during indoor background conditions (Table 6 and Figure 6) respectively for PN1, PM2.5, and PM10. As for TYPE III indoor activities, the corresponding ratios were 22.6, 14.6, and 32.9 (Table 7 and Figure 6), respectively. Smoking activities (shisha, tobacco) were associated with ratios of 21.3, 17.5, and 46.6 (Table 8 and Figure 6), respectively. Adult females received lower dose rates in all regions and scenarios as compared to adult males. Interestingly, the impact of combustion processes was more pronounced for the PM10 dose rates than for the PN1 and PM2.5 dose rates, as determined from the ratios relative to background scenarios.
TYPE II scenarios represented intensive cooking activities (Table 6). The total PN1 (and PM2.5) dose rates were 3.4 × 10¹⁰–2.6 × 10¹¹ particles/h (24.5–126.9 µg/h) and 3.0 × 10¹⁰–2.2 × 10¹¹ particles/h (18.2–108.7 µg/h), respectively for adult males and females. The corresponding total PM10 dose rates were in the range of 91.2–530 µg/h and 68.8–460 µg/h, respectively. TYPE IV scenarios were an extension of TYPE III scenarios that include smoking (Table 8). The total PN1 (and PM2.5) dose rates were 1.3 × 10¹¹–9.0×10¹¹ particles/h (43.8–216 µg/h) and 1.0 × 10¹¹–7.9 × 10¹¹ particles/h (32–185.9 µg/h) respectively for adult males and females. The corresponding total PM10 dose rates were in the range of 0.3–1.6 mg/h and 0.2–1.3 mg/h, respectively. In practice, the PM10 dose rates observed during TYPE III scenarios were comparable to those during TYPE IV scenarios. Two combustion processes (i.e., cooking and heating) were combined in TYPE III scenarios (Table 7). The total PN1 (and PM2.5) dose rates were 9.4 × 10¹⁰–6.4 × 10¹¹ particles/h (35.3–181 µg/h) and 7.4 × 10¹⁰–5.6×10¹¹ particles/h (26.1–155 µg/h) respectively for adult males and females. The corresponding total PM10 dose rates were in the range of 0.3–1.6 mg/h and 0.2–1.4 mg/h, respectively.

3.3. Regional Inhaled Deposited Dose Rates Based on Median Particle Number Size Distributions

Measured indoor particle concentrations were not normally distributed and had periods with high peak values (see Table S7–S10 in the Supplementary Material). Thus, the mean concentration values were typically higher than median values for the exposure scenarios. Since air quality guidelines are based on mean values, most of our dose rate analysis is based on mean particle number and mass concentrations. Mean values are also the relevant measure for calculation of the inhaled aerosol dose over time. Nevertheless, it is important to compare the mean and the median particle concentrations in order to assess the influence of concentration peaks on the overall dose rate analysis. As presented in Table 1 and Table 2 (also Figure 1) for background concentrations inside each dwelling individually, the percentage difference between the mean and the median values for the number concentrations was between 1.5% and 3.8% for the first six dwellings; only dwellings GFA2 and GFA3 had large difference between the mean and the median (23% and 25%, respectively). As for PM2.5, the difference between the mean and the median values was less than 9% for all dwellings, aside from the fifth and eighth dwellings (H2 and GFA3). For PM10, the difference between the mean and the median values was less than 7% for all dwellings, aside from the fifth and seventh dwellings (H2 and GFA2).
The particle size distributions used in the dose rate calculations (i.e., for all scenarios including background conditions) were combined from the data obtained across all eight dwellings. Therefore, differences between the mean and the median concentrations were more significant (Table 3 and Figure 3). For instance, the difference in the number concentrations was between 3% and 27%. The differences in PM2.5 and PM10 ranged from 17%–41% and 5%–61%, respectively. Thus, the inhaled dose rates were recalculated based on the median particle size distributions and reported in the Supplementary Material (Section S5). The calculated dose rates were generally lower when using the median values. Considering the total inhaled deposited dose rate for PN1 for adult males and females, it was lower by approximately 9%, 28%, 21%, 8%, and 14%, respectively during background conditions and TYPEs I–IV scenarios. The corresponding difference in PM2.5 dose rates was lower by 44%, 21%, 18%, 14%, and 23%, respectively. The largest variation in the difference was found in the PM10 dose rates as 69%, 16%, 0%, 41%, and 10%, respectively. Periods with very high particle concentrations can therefore have a significant impact on the estimated dose rates.

4. Conclusions

In this study, regional inhaled deposited dose rates of indoor combustion-generated aerosols were evaluated based on mean indoor particle number size distributions (0.01–25 µm) measured in Jordanian dwellings. Dose rates were also calculated in terms of PM2.5 and PM10 based on mean particle mass size distributions, which were estimated from the particle number size distributions. An important outcome of this investigation is extending dose rate calculations to common exposure scenarios inside Jordanian dwellings. Exposure was classified according to four activity types: TYPE I for non-combustion cooking activities (i.e., microwave), TYPE II for intensive cooking activities by combustion (i.e., natural gas stove) combined with non-combustion heating (central or AC), TYPE III for cooking activities by combustion (i.e., natural gas stove) combined with combustion heating (kerosene or natural gas), and TYPE IV for cooking activities by combustion (i.e., natural gas stove) combined with combustion heating (kerosene or natural gas) and smoking (shisha, tobacco). The activities were classified into three main categories: yardwork equivalent activities, moving activities (running at 8 km/h and walking at 4 km/h), and resting activities (standing and sitting).
The indoor aerosol dose rate calculations were based on: (1) characteristics of particle number size distributions, (2) activity type (exercise versus rest), (3) gender, and (4) particle concentration metric (number versus mass) and the particle diameter range (PN1, PM2.5, PM10). Regardless of gender, the PM10 dose rate fraction during rest was mostly in the head airways (~70%) and the least in the tracheobronchial region (~9%). When exercising, the fraction in the head airways was ~38%, whereas that in the tracheobronchial region was ~33%. The PM2.5 fractions were the least in the head airways (~8% when exercising) and the most in the alveolar region (~75% when exercising).
Based on the mean values, the inhaled dose rates during TYPE I exposure scenarios revealed that the PN1 and PM2.5 regional deposition patterns were as follows: PN1 dose rate was 1010–1011 particles/h, PM2.5 dose rate was 3–17 µg/h, and PM10 dose rate was 27–210 µg/h. During TYPE II exposure scenarios, the PN1 dose rate was 1010–1011 particles/h, PM2.5 dose rate was 18–127 µg/h, and the PM10 dose rate was 69–530 µg/h. High dose rate values were obtained during TYPE III and TYPE IV exposure scenarios: the PN1 dose rate was 1011–1012 particles/h, PM2.5 dose rate was 26–216 µg/h, and PM10 dose rate was in the range 200–1600 µg/h.
Based on the median concentrations, the regional inhaled dose rate was generally lower than that obtained based on the mean concentrations. For fine particles, it was lower by 8–29% (PN1) and 12–46% (PM2.5). For PM10, it was lower by up to 69%. While this study provided estimates of regional inhaled deposited dose rates, which were made for the first time for Jordanian dwellings, the methodology has a few limitations. First, we used aerosol data measured during an extensive campaign with portable instruments that have limitations in particle size classification. Second, the particle number size distributions were derived from aerosol concentrations in different particle size fractions measured with instruments that operate with different principles. Third, we assumed effective particle density for ambient urban aerosols, which might not be representative for indoor aerosols. Finally, we considered certain scenarios of human residential activities that we believe can be representative for many cases in urban Jordanian dwellings in Amman.

Supplementary Materials

The following are available online at https://www.mdpi.com/2073-4433/11/11/1150/s1: tables and figures illustrating the materials required for the calculations of the regional inhaled deposited dose rates.

Author Contributions

Conceptualization, T.H. and J.L.; methodology, T.H. and J.L.; validation, T.H., J.L., and B.E.B.; formal analysis, T.H.; investigation, T.H.; resources, T.H.; data curation, T.H.; writing—original draft preparation, T.H.; writing—review and editing, T.H., J.L., and B.E.B.; visualization, T.H.; supervision, T.H.; project administration, T.H.; funding acquisition, T.H. All authors have read and agreed to the published version of the manuscript.

Funding

This research was funded by Scientific Research Support Fund and Innovation (SRF, project number WE-2-2-2017) at the Jordanian Ministry of Higher Education and the Deanship of Academic Research (DAR, project number 1516) at the University of Jordan. This research was part of a collaboration between the University of Jordan and the Institute for Atmospheric and Earth System Research (INAR/Physics, University of Helsinki) via the Center of Excellence in Atmospheric Sciences and NanoBioMass (project number 1307537). Grants were also received from the Swedish Research Council: FORMAS (project number 2018-00693) and FORTE (project number 2017-00690). Open access funding was provided by the University of Helsinki.

Acknowledgments

This study and other urban research by the Aerosol Laboratory of the University of Jordan was recommended by the World Health Organization regional office in Amman. Open access funding provided by University of Helsinki.

Conflicts of Interest

The authors declare no conflict of interest.

References

  1. World Health Organization (WHO). Household Air Pollution and Health. 2018. Available online: https://www.who.int/news-room/fact-sheets/detail/household-air-pollution-and-health (accessed on 28 September 2020).
  2. World Health Organization (WHO). The Right to Healthy Indoor Air. 2000. Available online: http://www.euro.who.int/en/health-topics/environment-and-health/air-quality/publications/pre2009/the-right-to-healthy-indoor-air (accessed on 3 December 2019).
  3. Klepeis, N.E.; Nelson, W.C.; Ott, W.R.; Robinson, J.P.; Tsang, A.M.; Switzer, P.; Behar, J.V.; Hern, S.C.; Engelmann, W.H. The National Human Activity Pattern Survey (NHAPS): A resource for assessing exposure to environmental pollutants. J. Expo. Sci. Environ. Epidemiol. 2001, 11, 231–252. [Google Scholar] [CrossRef] [PubMed] [Green Version]
  4. Jones, A. Chapter 3. Indoor air quality and health. Alberta Oil Sands 2002, 33, 57–115. [Google Scholar] [CrossRef]
  5. Abadie, M.O.; Blondeau, P. PANDORA database: A compilation of indoor air pollutant emissions. HVAC R Res. 2011, 17, 602–613. [Google Scholar]
  6. Chen, C.; Zhao, B. Review of relationship between indoor and outdoor particles: I/O ratio, infiltration factor and penetration factor. Atmos. Environ. 2011, 45, 275–288. [Google Scholar] [CrossRef]
  7. Hussein, T.; Wierzbicka, A.; Löndahl, J.; Lazaridis, M.; Hänninen, O. Indoor aerosol modeling for assessment of exposure and respiratory tract deposited dose. Atmos. Environ. 2015, 106, 402–411. [Google Scholar] [CrossRef]
  8. Morawska, L.; He, C.; Johnson, G.; Jayaratne, R.; Salthammer, T.; Wang, H.; Uhde, E.; Bostrom, T.; Modini, R.; Ayoko, G.; et al. An investigation into the characteristics and formation mechanisms of particles originating from the operation of laser printers. Environ. Sci. Technol. 2009, 43, 1015–1022. [Google Scholar] [CrossRef]
  9. Sangiorgi, G.; Ferrero, L.; Ferrini, B.; Porto, C.L.; Perrone, M.; Zangrando, R.; Gambaro, A.; Lazzati, Z.; Bolzacchini, E. Indoor airborne particle sources and semi-volatile partitioning effect of outdoor fine PM in offices. Atmos. Environ. 2013, 65, 205–214. [Google Scholar] [CrossRef] [Green Version]
  10. He, C.; Morawska, L.; Hitchins, J.; Gilbert, D. Contribution from indoor sources to particle number and mass concentrations in residential houses. Atmos. Environ. 2004, 38, 3405–3415. [Google Scholar] [CrossRef]
  11. Afshari, A.; Matson, U.; Ekberg, L.E. Characterization of indoor sources of fine and ultrafine particles: A study conducted in a full-scale chamber. Indoor Air 2005, 15, 141–150. [Google Scholar] [CrossRef]
  12. Ferron, G.; Gebhart, J. Estimation of the lung deposition of aerosol particles produced with medical nebulizers. J. Aerosol Sci. 1988, 19, 1083–1086. [Google Scholar] [CrossRef]
  13. ICRP. Annals of the International Commission on Radiological Protection ICRP Publication 66: Human Respiratory Tract Model. for Radiological Protection; International Commission on Radiological Protection: Ottawa, ON, Canada, 1994. [Google Scholar]
  14. Anjilvel, S.; Asgharian, B. A multiple-path model of particle deposition in the rat lung. Fundam. Appl. Toxicol. 1995, 28, 41–50. [Google Scholar] [CrossRef] [Green Version]
  15. Madanat, H.; Barnes, M.D.; Cole, E.C. Knowledge of the effects of indoor air quality on health among women in Jordan. Heal. Educ. Behav. 2006, 35, 105–118. [Google Scholar] [CrossRef] [PubMed]
  16. Hussein, T. Particle size distributions inside a university office in Amman, Jordan. Jordan J. Phys. 2014, 7, 73–83. [Google Scholar]
  17. Hussein, T.; Dada, L.; Juwhari, H.; Faouri, D. Characterization, fate, and re-suspension of aerosol particles (0.3–10 µm): The effects of occupancy and carpet use. Aerosol Air Qual. Res. 2015, 15, 2367–2377. [Google Scholar] [CrossRef] [Green Version]
  18. Hussein, T. Indoor-to-outdoor relationship of aerosol particles inside a naturally ventilated apartment-A comparison between single-parameter analysis and indoor aerosol model simulation. Sci. Total. Environ. 2017, 321–330. [Google Scholar] [CrossRef] [PubMed]
  19. Hussein, T.; Löndahl, J.; Paasonen, P.; Koivisto, A.J.; Petäjä, T.; Hämeri, K.; Kulmala, M. Modeling regional deposited dose of submicron aerosol particles. Sci. Total. Environ. 2013, 458, 140–149. [Google Scholar] [CrossRef] [PubMed]
  20. Hussein, T.; Saleh, S.S.A.; Dos Santos, V.N.; Boor, B.E.; Koivisto, A.J.; Löndahl, J. Regional inhaled deposited dose of urban aerosols in an Eastern Mediterranean city. Atmosphere 2019, 10, 530. [Google Scholar] [CrossRef] [Green Version]
  21. Holmes, J.R. How much air do we breath? California Environmental Protection Agency: Sacramento, CA, USA, 1994; Research note 94–11.
  22. Löndahl, J.; Massling, A.; Pagels, J.; Swietlicki, E.; Vaclavik, E.; Loft, S. Size-resolved respiratory-tract deposition of fine and ultrafine hydrophobic and hygroscopic aerosol particles during rest and exercise. Inhal. Toxicol. 2007, 19, 109–116. [Google Scholar] [CrossRef]
  23. Hussein, T.; Alameer, A.; Jaghbeir, O.; Albeitshaweesh, K.; Malkawi, M.; Boor, B.E.; Koivisto, A.J.; Löndahl, J.; Alrifai, O.; Al-Hunaiti, A. Indoor particle concentrations, size distributions, and exposures in middle eastern microenvironments. Atmosphere 2019, 11, 41. [Google Scholar] [CrossRef] [Green Version]
  24. Wang, Y.; Xing, Z.; Zhao, S.; Zheng, M.; Mu, C.; Du, K. Are emissions of black carbon from gasoline vehicles overestimated? Real-time, in situ measurement of black carbon emission factors. Sci. Total. Environ. 2016, 547, 422–428. [Google Scholar] [CrossRef]
  25. Jiang, R.; Acevedo-Bolton, V.; Cheng, K.-C.; Klepeis, N.E.; Ott, W.; Hildemann, L.M. Determination of response of real-time SidePak AM510 monitor to secondhand smoke, other common indoor aerosols, and outdoor aerosol. J. Environ. Monit. 2011, 13, 1695–1702. [Google Scholar] [CrossRef] [PubMed]
  26. Matson, U.; Ekberg, L.E.; Afshari, A. Measurement of ultrafine particles: A comparison of two handheld condensation particle counters. Aerosol Sci. Technol. 2004, 38, 487–495. [Google Scholar] [CrossRef]
  27. Hussein, T.; Boor, B.E.; Dos Santos, V.N.; Kangasluoma, J.; Petäjä, T.; Lihavainen, H. Mobile aerosol measurement in the Eastern Mediterranean-A utilization of portable instruments. Aerosol Air Qual. Res. 2017, 17, 1875–1886. [Google Scholar] [CrossRef] [Green Version]
  28. Hussein, T.; Saleh, S.S.A.; Dos Santos, V.N.; Abdullah, H.; Boor, B.E. Black carbon and particulate matter concentrations in Eastern Mediterranean urban conditions: An assessment based on integrated stationary and mobile observations. Atmosphere 2019, 10, 323. [Google Scholar] [CrossRef] [Green Version]
  29. Maricq, M.M. Monitoring motor vehicle PM emissions: An evaluation of three portable low-cost aerosol instruments. Aerosol Sci. Technol. 2013, 47, 564–573. [Google Scholar] [CrossRef] [Green Version]
  30. Chen, L.-W.A.; Chancellor, G.; Evenstad, J.; Farnsworth, J.E.; Hase, A.; Olson, G.M.; Sreenath, A.; Agarwal, J.K. A novel optical instrument for estimating size segregated aerosol mass concentration in real time. Aerosol Sci. Technol. 2009, 43, 939–950. [Google Scholar] [CrossRef]
  31. Viana, M.; Rivas, I.; Reche, C.; Fonseca, A.S.; Pérez, N.; Querol, X.; Alastuey, A.; Álvarez-Pedrerol, M.; Sunyer, J. Field comparison of portable and stationary instruments for outdoor urban air exposure assessments. Atmos. Environ. 2015, 123, 220–228. [Google Scholar] [CrossRef]
  32. Wu, T.; Boor, B.E. Urban aerosol size distributions: A global perspective. Atmos Chem Phys. Discuss. 2020, 2020, 1–83. [Google Scholar] [CrossRef] [Green Version]
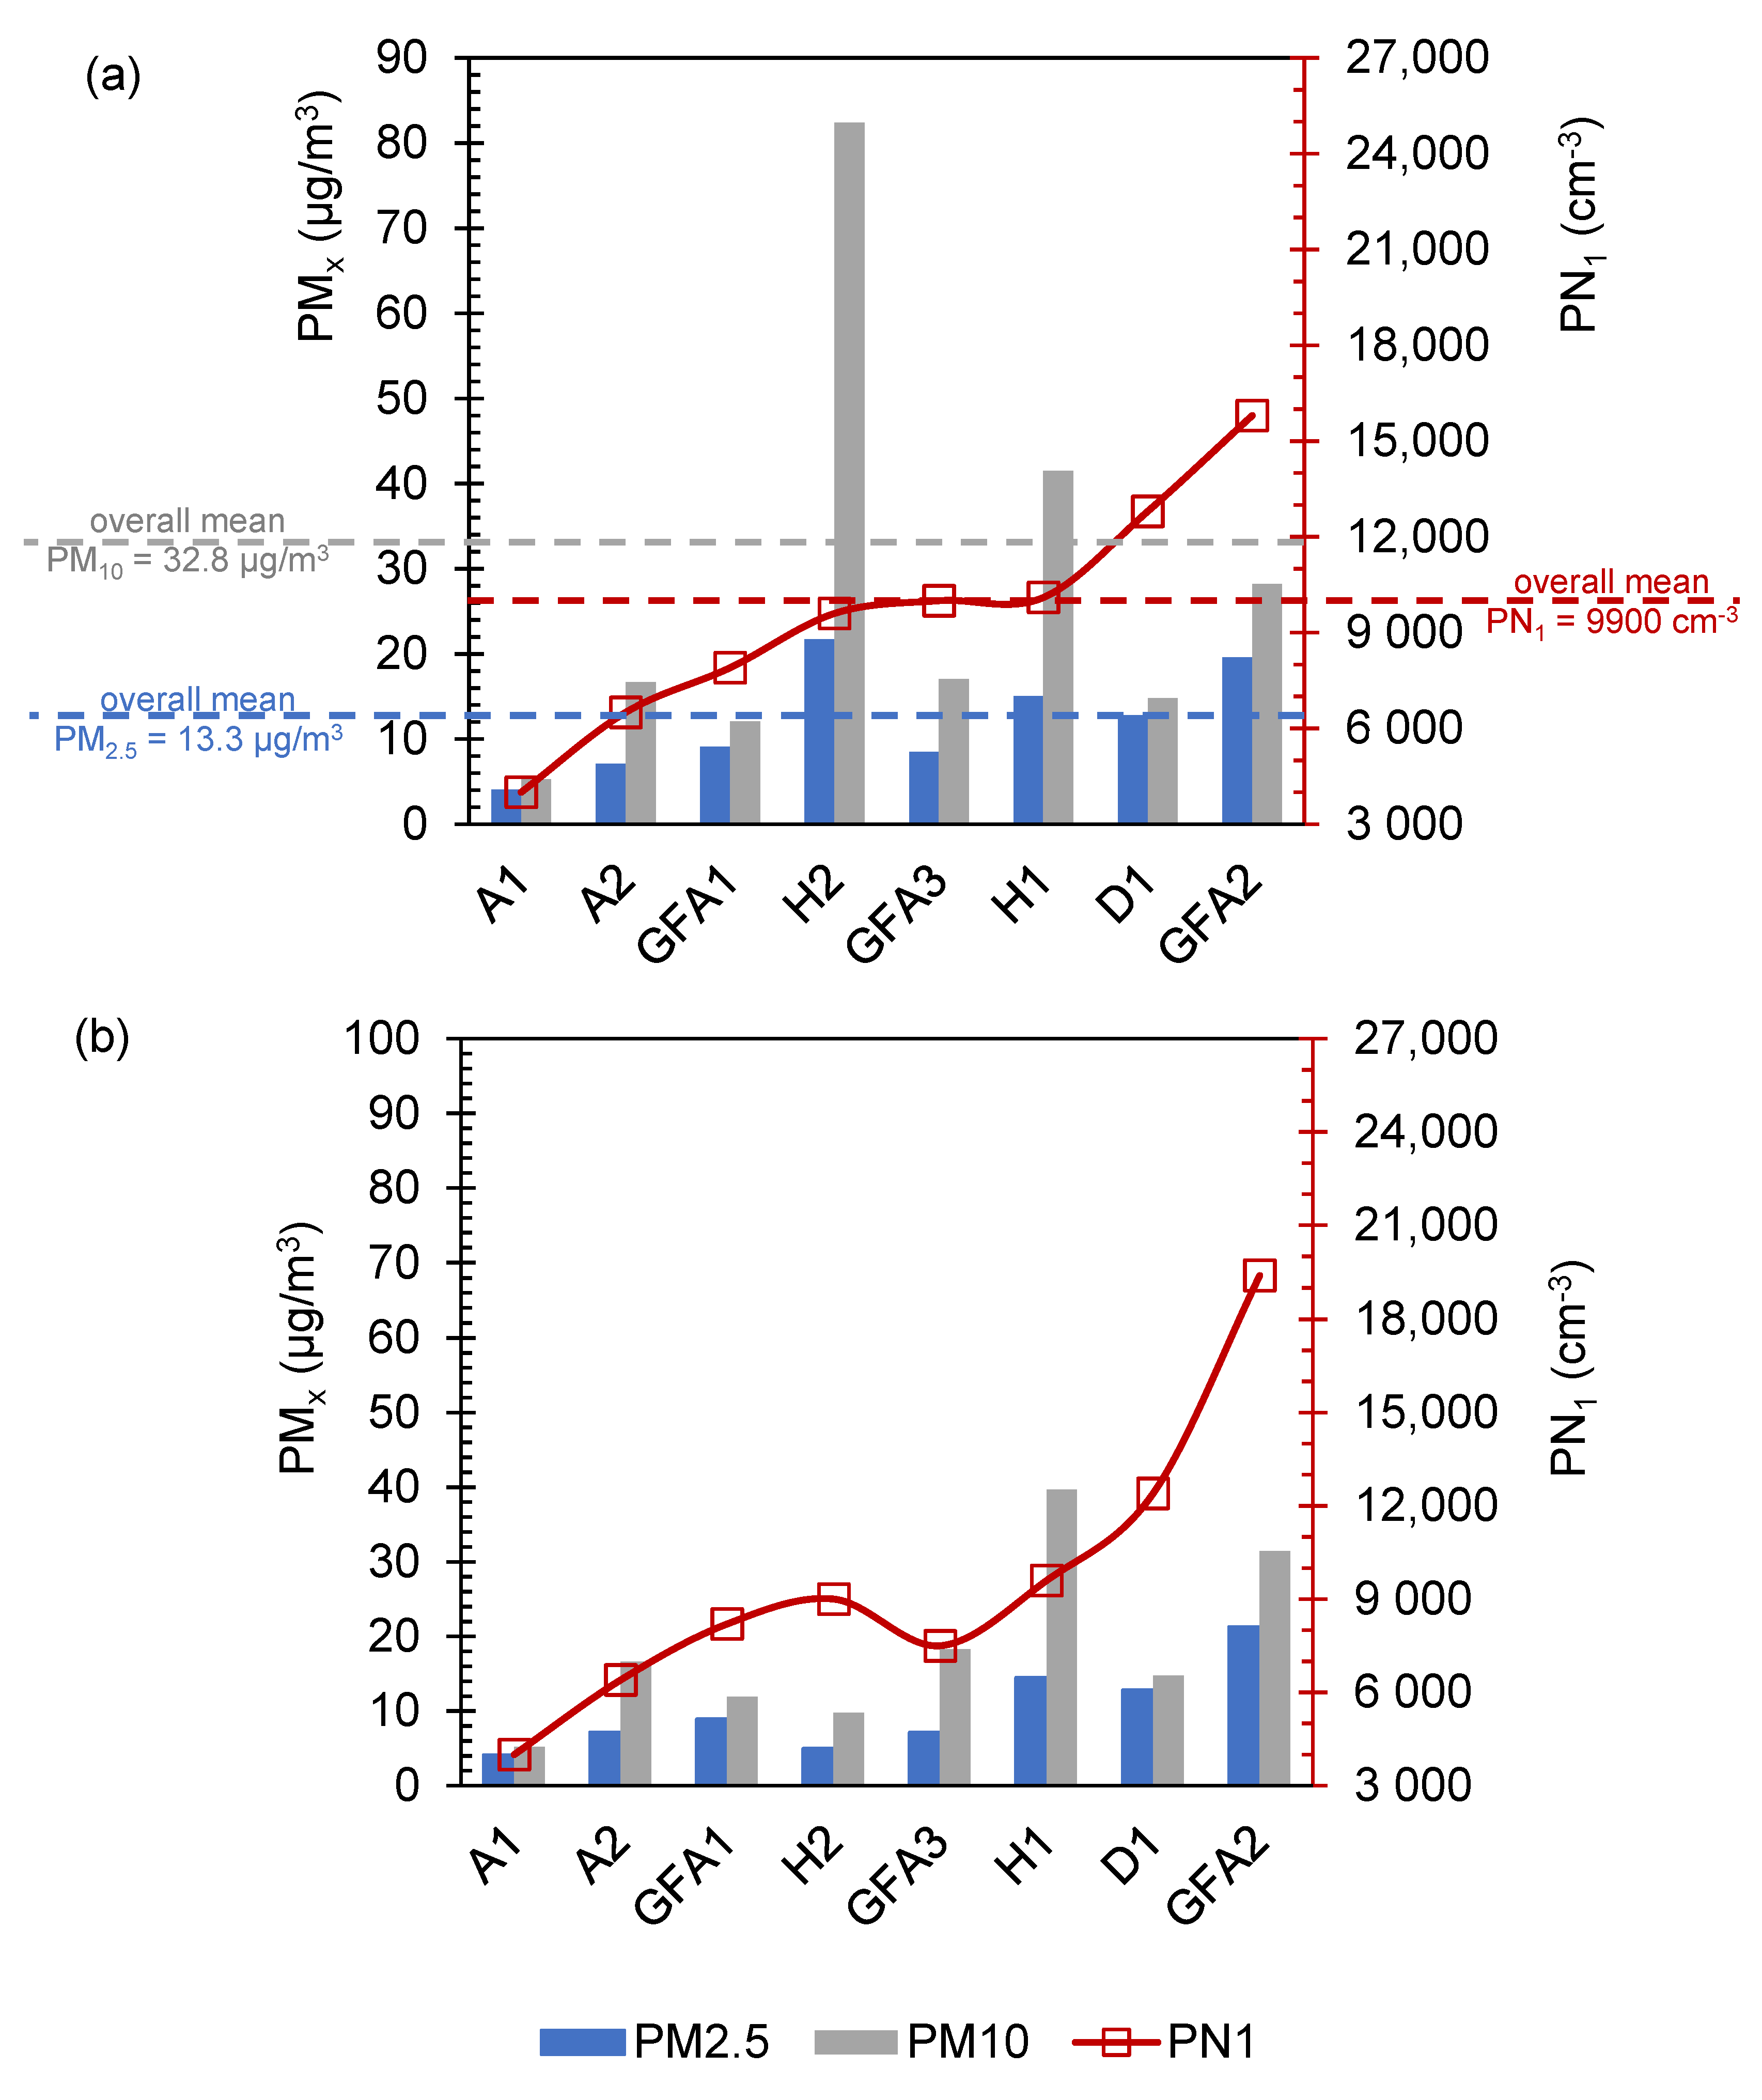
Figure 1. Indoor particle number and mass concentrations in Jordanian homes during background periods: (a) mean and (b) median.
Atmosphere 11 01150 g001
Figure 2. Mean indoor particle number size distributions during background periods for each home. The legend refers to the home ID.
Atmosphere 11 01150 g002
Figure 3. Indoor particle number and mass concentrations in Jordanian homes for background periods (BG) and the categorized indoor activities (TYPEs I, II, III, IV): (a) mean and (b) median.
Atmosphere 11 01150 g003
Figure 4. Mean particle number size distributions during selected indoor activities categorized by activity type: (a) Type I (non-combustion), (b) TYPE II (intensive cooking with different heating types), (c) TYPE III (combustion: heating and cooking), and (d) TYPE IV (combustion: heating, cooking, and smoking). Heating type: natural gas heater (NG), kerosene heater (K), central heating system (C), and air conditioning split unit (AC). Smoking type: shisha (SH) and tobacco smoking (TS). Cooking was reported on either a stove (natural gas) or using non-combustion appliances (i.e., water jug heater, microwave, etc.); the cooking intensity was indicated. The legend refers to the home ID and indoor activities.
Atmosphere 11 01150 g004
Figure 5. Regional inhaled deposited dose rates calculated for different activities during indoor background conditions for: (a) sub-micron particle number concentrations (PN1) and (b,c) particle mass concentrations (PM2.5 and PM10). The color legend is: blue—head airways (head), red—tracheobronchial (TB), and gray—alveolar (Alv). Exposure is based on mean concentrations. Note that yardwork is assumed to be equivalent to housework and running is equivalent to indoor exercising.
Atmosphere 11 01150 g005
Figure 6. Regional inhaled deposited dose rates calculated for each activity type (TYPEs I, II, III, IV) and background conditions for: (a) sub-micron particle number concentrations (PN1) and (b,c) particle mass concentrations (PM2.5 and PM10). The color legend is: blue—yardwork equivalent activities, yellow—walking activities, and red—sitting and resting.
Atmosphere 11 01150 g006
Table 1. Mean indoor particle number concentrations in Jordanian homes during background periods. Additional details on each home are found in the Supplementary Material: Figure S2 and Table S2. Home IDs: apartments (A1/A2), duplex (D1), houses (H1/H2), ground floor apartments (GFA1/GFA2/GFA3).
Home
ID
PN (cm−3)
Mean ± SD25%Median75%
A14000 ± 300380040004200
A26500 ± 900570064007100
D112,800 ± 130012,00012,40013,400
H110,100 ± 14009100960011,300
H29600 ± 23007600900011,800
GFA17900 ± 29004800820010,800
GFA215,800 ± 580010,00019,40020,800
GFA310,000 ± 38006800750014,100
Table 2. Mean indoor particle mass concentrations in Jordanian homes during background periods.
Home
ID
PM2.5 (µg/m3)PM10 (µg/m3)
Mean ± SD25%Median75%Mean ± SD25%Median75%
A14.1 ± 0.14.04.14.25.3 ± 0.55.05.25.6
A27.1 ± 0.46.87.17.416.7 ± 1.515.516.617.9
D112.8 ± 0.712.312.813.414.8 ± 1.213.914.815.6
H115.0 ± 2.612.714.517.841.5 ± 6.736.139.747.1
H221.7 ± 21.24.44.946.782.4 ± 90.87.69.7190.5
GFA19.1 ± 1.18.18.910.212.0 ± 1.610.811.913.6
GFA219.6 ± 4.415.521.322.928.2 ± 8.020.531.434.9
GFA38.5 ± 3.55.37.112.217.1 ± 7.88.918.324.4
Table 3. Particle number and mass concentrations for the categorized indoor activities across all homes.
MeanSD25%Median75%
PN1 (cm−3)Background990049006700880012,900
TYPE I16,40017,10079001,200016,600
TYPE II144,50097,50071,700112,200192,700
TYPE III289,200189,800151,700281,700390,600
TYPE IV371,300232,300184,600318,700532,700
PM2.5 (µg/m3)Background13.314.85.47.914.1
TYPE I16.010.710.312.920.0
TYPE II120.566.672.5100.0148.5
TYPE III169.9134.580.5139.0220.8
TYPE IV267.2237.694.4174.5409.8
PM10 (µg/m3)Background32.853.38.012.926.8
TYPE I81.752.843.868.4116.4
TYPE II259.5123.6171.2246.7320.3
TYPE III650.6714.5203.2400.8758.5
TYPE IV697.7596.5207.7575.01011.7
Table 4. Mean regional dose rates for aerosol exposure during indoor background conditions. Note that yardwork is assumed to be equivalent to housework and running is equivalent to indoor exercising.
ScenarioAdult MaleAdult Female
HeadTBAlvTotalHeadTBAlvTotal
PN1
(×106 #/h)
Yardwork700170073009700500120044006000
Running 8.0 km/h1500340014,50019,4001300320012,30016,800
Walking 4.0 km/h600140058007700500130049006700
Standing5008002200350040070014002600
Sitting4007001800290040070012002300
PM2.5(µg/h)Yardwork0.51.04.55.90.30.62.73.7
Running 8.0 km/h0.92.09.011.90.81.87.710.3
Walking 4.0 km/h0.40.83.64.70.30.73.14.1
Standing1.20.41.63.20.80.31.02.2
Sitting1.00.31.32.60.70.30.91.9
PM10
(µg/h)
Yardwork11.811.011.234.07.66.67.021.1
Running 8.0 km/h23.522.022.468.021.218.519.559.2
Walking 4.0 km/h9.38.78.927.08.47.37.723.4
Standing10.01.33.314.67.11.02.210.3
Sitting8.21.02.712.06.20.91.99.0
Table 5. Mean regional dose rates (head, tracheobronchial (TB), alveolar (Alv), and total) for aerosol exposure during TYPE I indoor activities. Note that yardwork is assumed to be equivalent to housework and running is equivalent to indoor exercising.
ScenarioAdult MaleAdult Female
HeadTBAlvTotalHeadTBAlvTotal
PN1
(×106 #/h)
Yardwork1200270011,70015,600700180070009600
Running 8.0 km/h2400540023,30031,1002000510019,70026,900
Walking 4.0 km/h9002200920012,3008002000780010,600
Standing800130035005600700120023004100
Sitting700110029004600600100020003600
PM2.5
(µg/h)
Yardwork0.61.46.48.50.40.93.95.2
Running 8.0 km/h1.32.912.716.91.12.610.914.6
Walking 4.0 km/h0.51.15.16.70.51.04.35.8
Standing1.60.52.24.31.10.41.43.0
Sitting1.30.41.83.51.00.41.22.6
PM10
(µg/h)
Yardwork43.536.525.1105.027.921.715.665.2
Running 8.0 km/h86.973.050.1210.078.160.943.8182.8
Walking 4.0 km/h34.529.019.983.330.924.117.372.4
Standing32.13.67.242.922.92.74.830.4
Sitting26.32.95.935.120.02.44.226.6
Table 6. Mean regional dose rates (head, tracheobronchial (TB), alveolar (Alv), and total) for aerosol exposure during TYPE II indoor activities. Note that yardwork is assumed to be equivalent to housework and running is equivalent to indoor exercising.
ScenarioAdult MaleAdult Female
HeadTBAlvTotalHeadTBAlvTotal
PN1
(×106 #/h)
Yardwork960021,90095,900127,500590014,60057,50078,000
Running 8.0 km/h19,30043,900191,800255,00016,40041,100161,400218,900
Walking 4.0 km/h760017,40076,100101,100650016,30063,90086,700
Standing650010,50029,40046,4005200950019,10033,800
Sitting5300860024,10038,0004600830016,70029,600
PM2.5
(µg/h)
Yardwork4.810.648.163.52.96.829.038.7
Running 8.0 km/h9.521.196.2126.98.219.081.5108.7
Walking 4.0 km/h3.88.438.250.33.37.532.343.0
Standing9.34.116.530.06.63.710.520.8
Sitting7.63.413.524.55.83.29.218.2
PM10
(µg/h)
Yardwork89.383.092.5264.857.249.756.9163.8
Running 8.0 km/h178.7166.0185.0529.7160.5139.5159.6459.6
Walking 4.0 km/h70.965.873.4210.063.655.363.2182.0
Standing72.610.728.1111.451.78.618.478.6
Sitting59.48.723.091.245.37.516.168.8
Table 7. Mean regional dose rates (head, tracheobronchial (TB), alveolar (Alv), and total) for aerosol exposure during TYPE III indoor activities. Note that yardwork is assumed to be equivalent to housework and running is equivalent to indoor exercising.
ScenarioAdult MaleAdult Female
HeadTBAlvTotalHeadTBAlvTotal
PN1
(×106 #/h)
Yardwork24,30057,200237,200318,70015,10038,900144,500198,600
Running 8.0 km/h48,700114,300474,500637,50042,500109,200405,400557,100
Walking 4.0 km/h19,30045,300188,200252,80016,80043,200160,600220,600
Standing17,10028,00070,000115,00013,80025,00045,50084,300
Sitting14,00022,90057,20094,10012,10021,80039,80073,700
PM2.5
(µg/h)
Yardwork6.915.268.590.64.29.741.455.4
Running 8.0 km/h13.830.5137.0181.311.927.3116.2155.4
Walking 4.0 km/h5.512.154.371.94.710.846.061.5
Standing13.85.923.543.29.85.214.929.9
Sitting11.34.819.235.38.64.513.026.1
PM10
(µg/h)
Yardwork304.8267.3217.7789.8195.4159.3135.0489.6
Running 8.0 km/h609.6534.6435.31579.5548.2446.8378.71373.7
Walking 4.0 km/h241.7212.0172.6626.4217.1177.0150.0544.0
Standing233.928.562.6325.0166.722.141.5230.2
Sitting191.423.351.2265.9145.819.336.3201.5
Table 8. Mean regional dose rates (head, tracheobronchial (TB), alveolar (Alv), and total) for aerosol exposure during TYPE IV indoor activities. Note that yardwork is assumed to be equivalent to housework and running is equivalent to indoor exercising.
ScenarioAdult MaleAdult Female
HeadTBAlvTotalHeadTBAlvTotal
PN1
(×106 #/h)
Yardwork34,30081,600332,400448,30021,50055,900203,600281,100
Running 8.0 km/h68,700163,100664,900896,70060,400156,900571,200788,600
Walking 4.0 km/h27,20064,700263,700355,60023,90062,100226,200312,300
Standing24,50040,20096,600161,30019,80035,70062,800118,400
Sitting20,10032,90079,100132,00017,40031,30055,000103,600
PM2.5
(µg/h)
Yardwork8.017.682.4108.04.911.350.166.3
Running 8.0 km/h15.935.2164.9216.013.831.7140.5185.9
Walking 4.0 km/h6.313.965.485.65.412.655.673.6
Standing16.97.229.453.511.86.318.536.6
Sitting13.85.924.143.810.45.516.232.0
PM10
(µg/h)
Yardwork282.0245.5210.3737.8180.7146.5130.3457.4
Running 8.0 km/h564.0491.1420.61475.7507.0410.9365.51283.4
Walking 4.0 km/h223.7194.7166.8585.2200.8162.7144.8508.3
Standing215.627.463.1306.1153.621.441.5216.4
Sitting176.422.451.6250.5134.418.736.3189.4
Publisher’s Note: MDPI stays neutral with regard to jurisdictional claims in published maps and institutional affiliations.