Article

Seasonal Variation of Carbonaceous Species of PM2.5 in a Small City in Sichuan Basin, China

1
Key Laboratory of Water Environment Evolution and Pollution Control in Three Gorges Reservoir, Chongqing Three Gorges University, Wanzhou 404100, China
2
Chongqing Institute of Green and Intelligent Technology, Chinese Academy of Sciences, Chongqing 400714, China
3
National Engineering Research Center for Flue Gas Desulfurization, Department of Environmental Science and Engineering, Sichuan University, Chengdu 610041, China
*
Authors to whom correspondence should be addressed.
Atmosphere 2020, 11(12), 1286; https://doi.org/10.3390/atmos11121286
Submission received: 22 September 2020 / Revised: 25 November 2020 / Accepted: 26 November 2020 / Published: 28 November 2020
(This article belongs to the Section Aerosols)

Abstract

:
Organic carbon (OC) and elemental carbon (EC) concentrations were measured in daily PM2.5 samples collected over four non-consecutive months representing four seasons from 2016 to 2017 in a small city in the east of Sichuan Basin. The average concentrations of OC and EC during the study periods were observed to be 15.5 ± 13.5 and 5.2 ± 4.7 μg∙m−3, respectively, both with the highest in winter. The OC and EC correlated well in fall and winter, implying that OC and EC were attributed to common emission sources. The estimated secondary OC (SOC) represented 37.2%, 46.7%, 26.9%, and 40.7% of the OC in spring, summer, fall, and winter, respectively. The highest concentration of SOC was found in winter, while the proportion of SOC/OC was highest in summer. Strong correlations were observed between OC vs. K+ and EC vs. K+ in fall and winter, suggesting that biomass burning was a significant source of carbonaceous aerosols. Four sources of OC and EC were resolved by the positive matrix factorization (PMF) model, including coal combustion (5.5% and 12.1%), building and road dust (19.7% and 18.1%), biomass burning (38.7% and 33.1%), and vehicle emission (36.1% and 36.7%), respectively. The potential source contribution function (PSCF) analysis signified that the main source areas of OC and EC were distributed in or nearby Wanzhou.

1. Introduction

Elemental carbon (EC) and organic carbon (OC) are the important components of carbonaceous aerosols. EC, also known as black carbon or soot, includes pure carbon and graphite carbon and mainly originates from primary sources such as coal burning, vehicle emissions and biomass burning [1,2]. OC consists of primary organic carbon (POC) emitted directly by the sources and secondary organic carbon (SOC) formed via the gas–particle conversion process [3]. Some components in OC have strong reactivity and oxidation, which are the basis for the occurrence of atmospheric photochemical reactions and can indirectly affect the climate by influencing the cloud condensation nuclei. EC can lead to climate change by impacting the radiative forcing of aerosols [4,5,6,7]. In addition, EC and OC can also enter human’s lungs through respiration and cause chronic respiratory diseases, and even trigger lung cancer [8,9]. Therefore, to improve atmospheric environmental quality and protect human health, the study of the mass concentration and composition characteristics of carbon components in ambient air particles, as well as analysis of their pollution sources are essential.
In recent years, studies of carbonaceous aerosol have been widely conducted in China. Most of the studies have focused on rapid development regions with serious air pollution, such as Beijing-Tianjin-Hebei region (BTH), Yangtze River Delta (YRD) and Pearl River Delta (PRD), as well as some provincial capitals [10,11,12,13,14,15,16,17,18,19,20]. Sichuan Basin, located in the southwest of China, is bounded by a plateau higher than 4 km to the west and surrounded mountains on the other three sides. The region is a typical basin area with extremely low wind speeds and persistently high relative humidity all year round [21]. The basin is characterized by a high population density, rapid urbanization and industrialization, and a prevalence of residential coal and biomass combustion, resulting in excess carbonaceous particle emissions [21,22,23]. Because of the particular topography, special meteorological conditions and heavy emissions, the characteristics of carbonaceous aerosol in Sichuan Basin are believed to be very different from those in eastern coastal China (i.e., PRD and YRD) and the North China Plain (i.e., BTH) [23,24]. Chen et al. [21] found out that organic matter (1.6 × OC) plus EC contributed about 40% of PM2.5 mass and biomass burning emissions contributed to 20–30% of the OC in Sichuan Basin. Wang et al. [25] investigated the characteristics and geographical origins of major chemical components in PM2.5 at Chengdu (CD) and Chongqing (CQ), and they showed that the carbonaceous components were higher at CQ than CD, and the potential source regions at both sites were within the basin. Yang et al. [22] analyzed the spatial and temporal variations of PM2.5 and carbonaceous aerosol at urban/rural sites in Nanchong, and found that the contributions of biomass burning to OC and EC were significantly higher at the rural site than urban sites. However, the above studies were mainly carried out in Chengdu and Chongqing, two megacities in the Sichuan Basin, or several typical cities. Because the sources of carbonaceous aerosol vary with geographical location [26], there is a need to understand the spatial and temporal distribution of carbonaceous aerosols in Sichuan Basin.
Wanzhou (30.40°–31.25° N and 107.92°–108.89° E) is located in the east of Sichuan Basin with a land area of 3457 km2 and a population of over 1.6 million inhabitants. At present, only a few studies on the carbonaceous aerosol pollution in the atmosphere of Wanzhou have been reported. For example, the seasonal characteristics of OC and EC in PM2.5 were in the order of winter > fall > spring > summer in Wanzhou [27]. Peng et al. [28] investigated the pollution characteristics and sources of PM2.5 carbonaceous aerosol during summer and winter in Wanzhou and found that motor vehicle emissions and biomass burning were the major sources of carbon components. Huang et al. [29] found that the diel concentration profile of OC and EC presented a bimodal pattern, and local sources had a big influence on PM2.5, OC, and EC concentrations in Wanzhou. Based on the previous studies, most of the air pollution research in Wanzhou was conducted before 2014 when the Chinese government had just issued and implemented the Air Pollution Prevention and Control Action Plan (APPCAP). After the implementation of this action plan, air quality improved in Wanzhou, with the annual mean PM2.5 concentrations declining from 64 μg∙m−3 in 2014 [29] to 46 μg∙m−3 in 2017 [30]. Although a decline in the PM2.5 concentrations was observed, the annual mean PM2.5 concentrations exceeded the second level (35 μg∙m−3) of Ambient Air Quality Standard (GB3095-2012) in China. As an important component of PM2.5, carbonaceous aerosols are closely associated with various combustion activities that can cause heavy PM2.5 pollution [31]. Understanding the variations of OC and EC is conducive to developing improved emission control strategies in Wanzhou. However, comprehensive studies on the carbonaceous aerosol composition and source analysis in PM2.5 at Wanzhou during four consecutive seasons after 2014 have been rarely reported. In this study, carbonaceous aerosols in PM2.5 were measured in Wanzhou in four consecutive seasons during 2016–2017. The main objectives of this study are to (1) investigate the OC and EC pollution levels and their seasonal variations in urban Wanzhou, (2) estimate the SOC concentration based on the (OC/EC)pri ratio method, (3) explore the source contribution of OC and EC by a positive matrix factorization (PMF) model, (4) reveal the geographical source regions contributing to the high OC and EC levels through PSCF analysis.

2. Materials and Methods

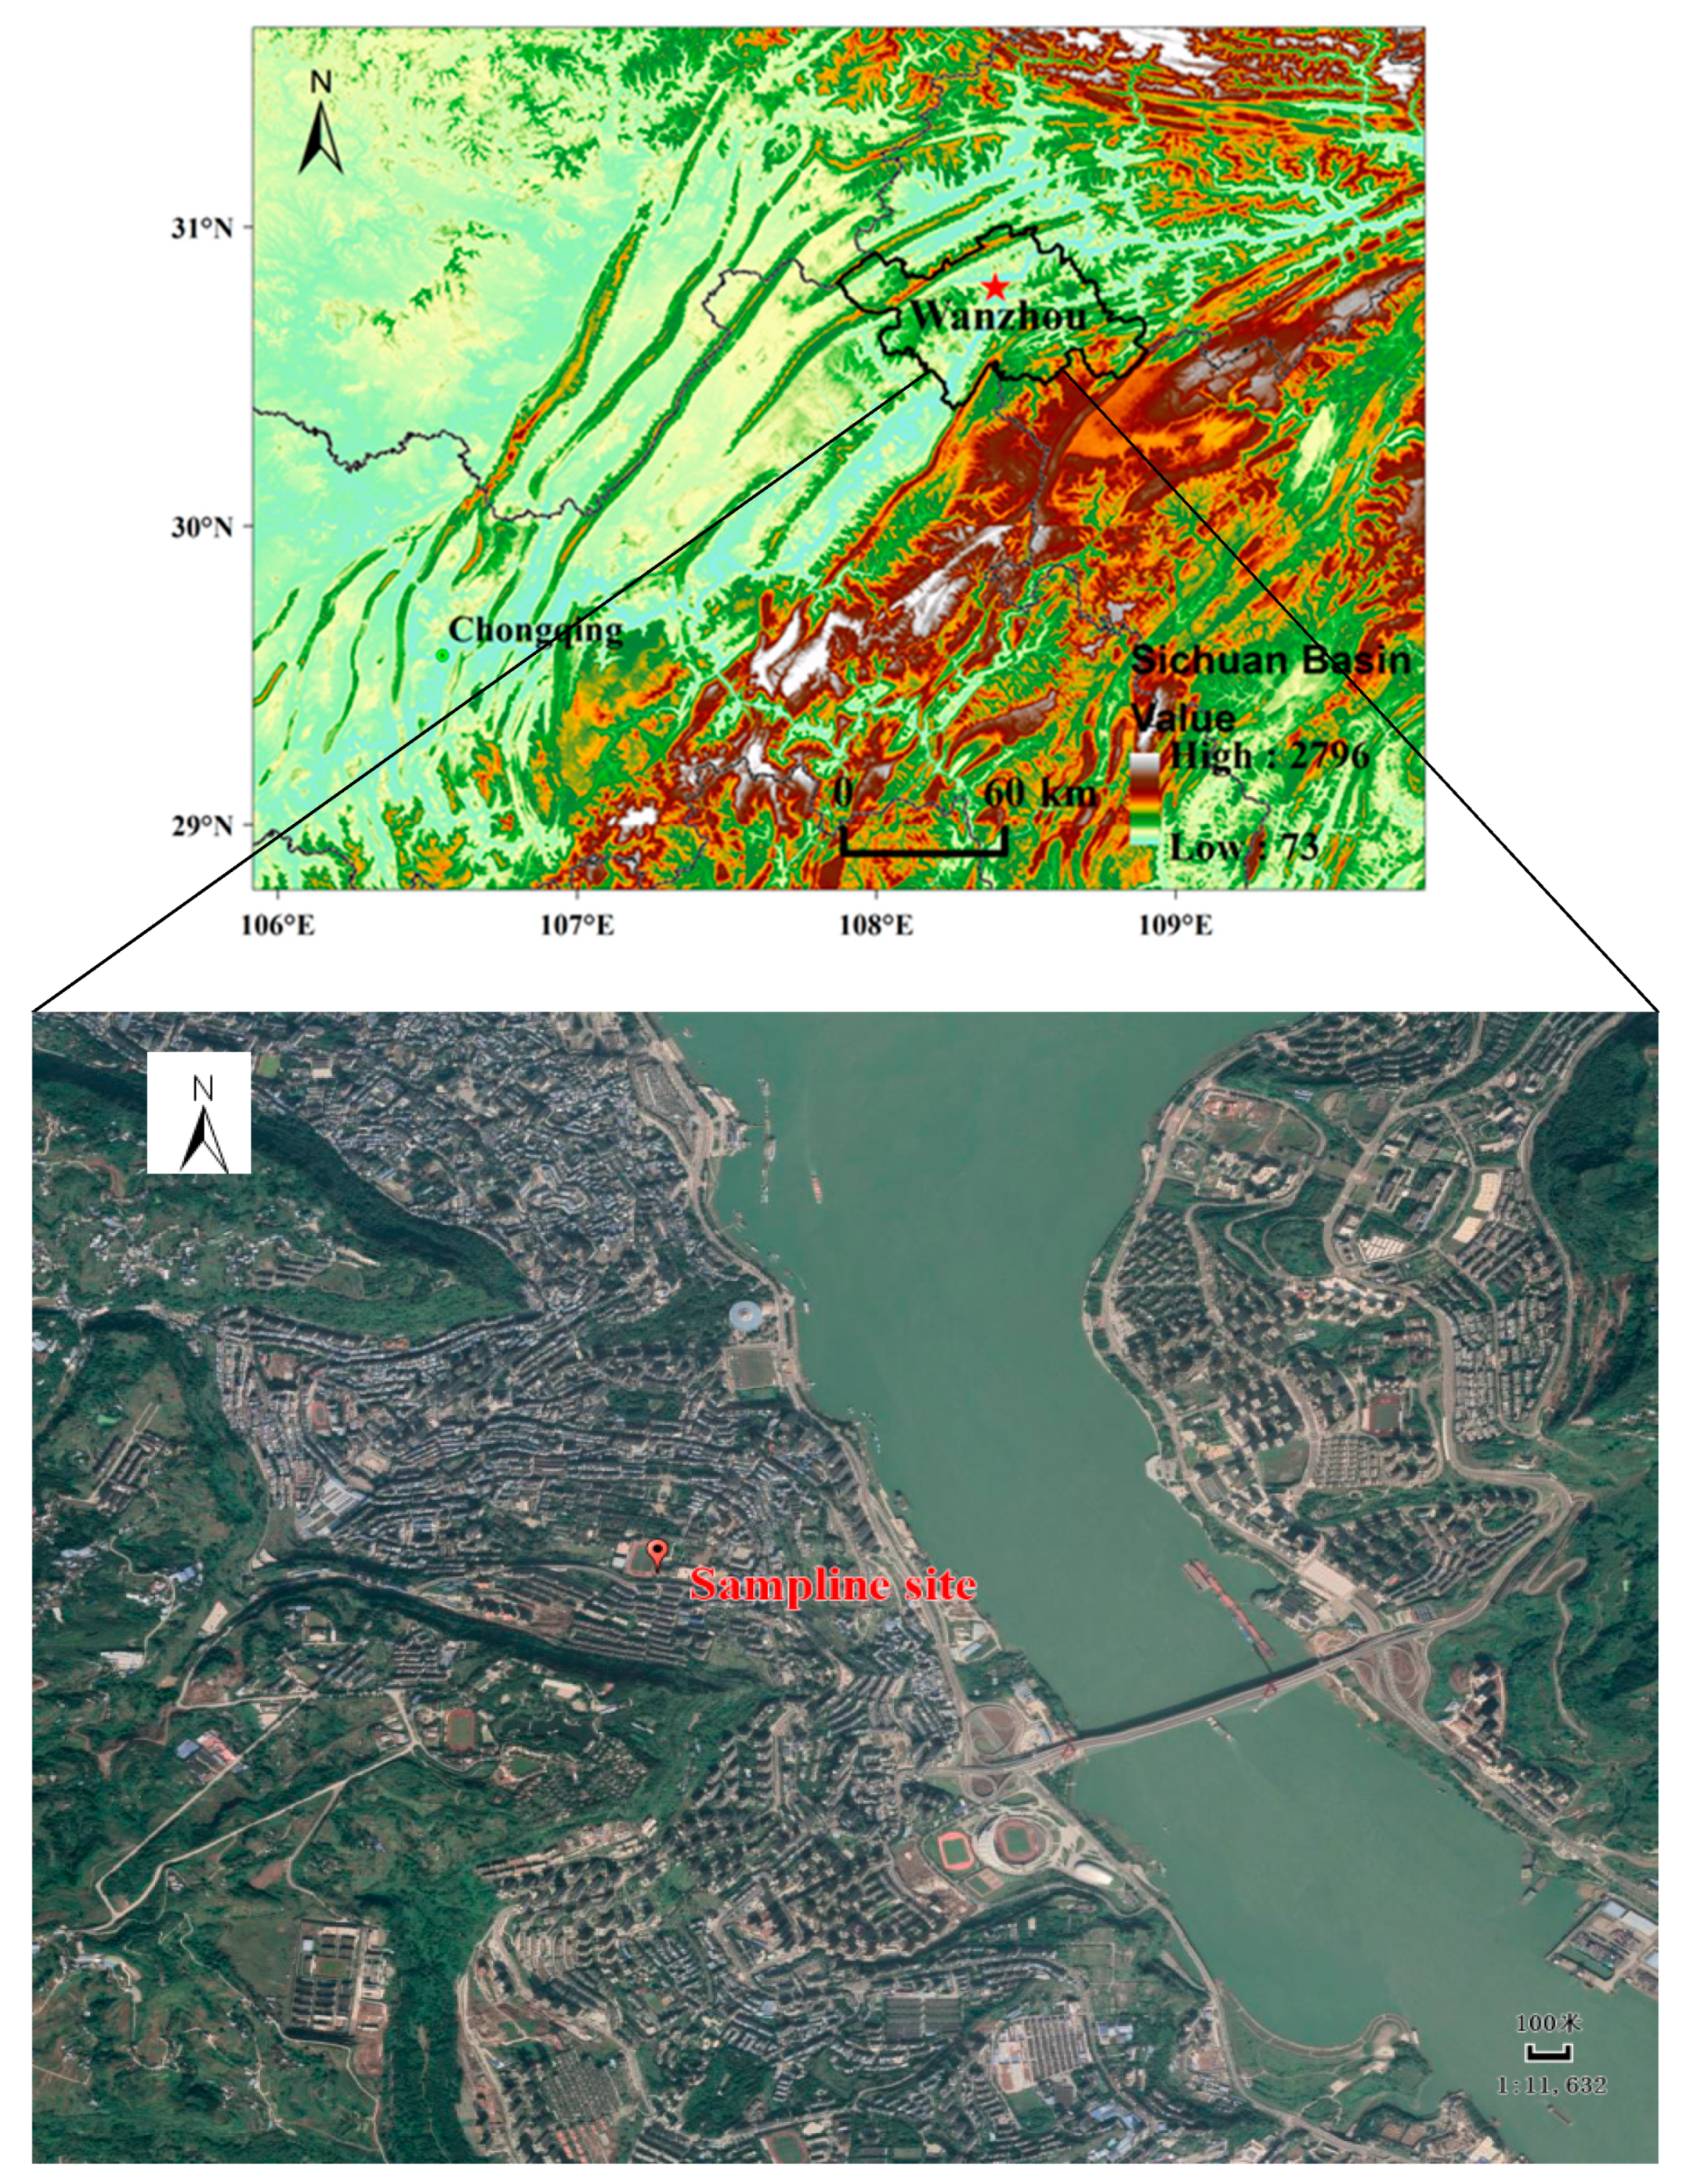
2.1. Site Description

Wanzhou, located in the hinterland of the Three Gorges Reservoir on the Yangtze River, is the second largest city in Chongqing. Wanzhou has a humid subtropical monsoon climate, with four distinct seasons, adequate rainfall and low wind speed. Sampling was performed on the rooftop of the experimental building of Chongqing Three Gorges University in Wanzhou (Figure 1), at a height of 27 m above the ground. A main road is approximately 150 m east of the sampling site. The observation point is mainly surrounded by commercial-residential areas, and without any industrial emission sources nearby, can represent a typical urban site in Wanzhou.

2.2. Sampling and Analysis

A multi-functional air pollutant sampler (URG-3000K) produced by URG company (USA) was used for this study. Air mass simultaneously passed through a Teflon filter on the left channel and a quartz filter on the right channel with a flow rate of 16.7 L min−1. The Teflon filter (Whatman, 47 mm) was used for water-soluble inorganic ions analysis, while the quartz filter (Whatman, 47 mm) was used for the determination of OC and EC in PM2.5. The quartz filters were pre-fired at 600 °C in air for a minimum of 5 h to remove residual carbon. PM2.5 samples were collected in spring (8 April to 7 May 2016), summer (7 July to 5 August 2016), fall (14 October to 12 November 2016), and winter (18 December 2016 to 16 January 2017). The sampling time for each sample was 23h (from 11:00 a.m. to 10:00 a.m. the following day), and a total of 120 samples were collected.
The OC and EC in PM2.5 were analyzed by the IMPROVE thermal/optical reflectance (TOR) method with DRI Model 2001 Thermal/Optical Carbon Analyzer [32,33]. Principles and details of the analytical procedure were given by Zhu et al. [20]. Eight water-soluble inorganic ions (Cl, NO3, SO42−, K+, Na+, Ca2+, Mg2+, NH4+) were analyzed by ion chromatograph (Dionex, Dionex 600, Sunnyvale, CA, USA). Field blank filters were also collected, and the sample results were corrected by the average of the blank concentrations.

2.3. PSCF Analysis

Potential source contribution function (PSCF) algorithm is a method to identify the source region based on the flow trajectory analysis [34]. PSCF uses backward trajectories to determine potential locations of emission sources [10,35]. Based on the Global NOAA-NCEP/NCAR Reanalysis meteorological data, the 48 h backward trajectories arriving at the sampling site were calculated for every 6 h at a height of 100 m above ground level using the Hybrid Single-Particle Lagrangian Integrated Trajectory (HYSPLIT 4) model. The PSCF is defined as:
PSCF i j = x i j / y i j
where yij is the total number of back-trajectory segment endpoints that fall into the grid cell (i, j) over the period of study. The number of endpoints for the same cell having arrival times at the sampling site corresponding to measured pollutant concentrations higher than a given criterion value is defined to be xij. Higher PSCF values indicate higher potential source contributions to the receptor site. In this study, the domain for the PSCF was set in the range of (20–45° N, 90–120° E) with the grid cell size of 0.5 × 0.5°. The 75th percentile for OC and EC in each season was used as the threshold values to calculate xij [36]. As the PSCF value is a kind of conditional possibility, when the time the air flow stays in the cell is too short, the uncertainty of the PSCF value will increase [37]. To reduce the uncertainties of PSCF values for those grid cells with a limited number of points, a weighting function Wij recommended by Polissar et al. [38] was applied to the PSCF in each season: In this case, Wij is defined as below:
W i j = { 1.00       80 < n ij 0.70       20 < n ij 80 0.42       10 < n ij 20 0.05       n ij 10 }

3. Results and Discussion

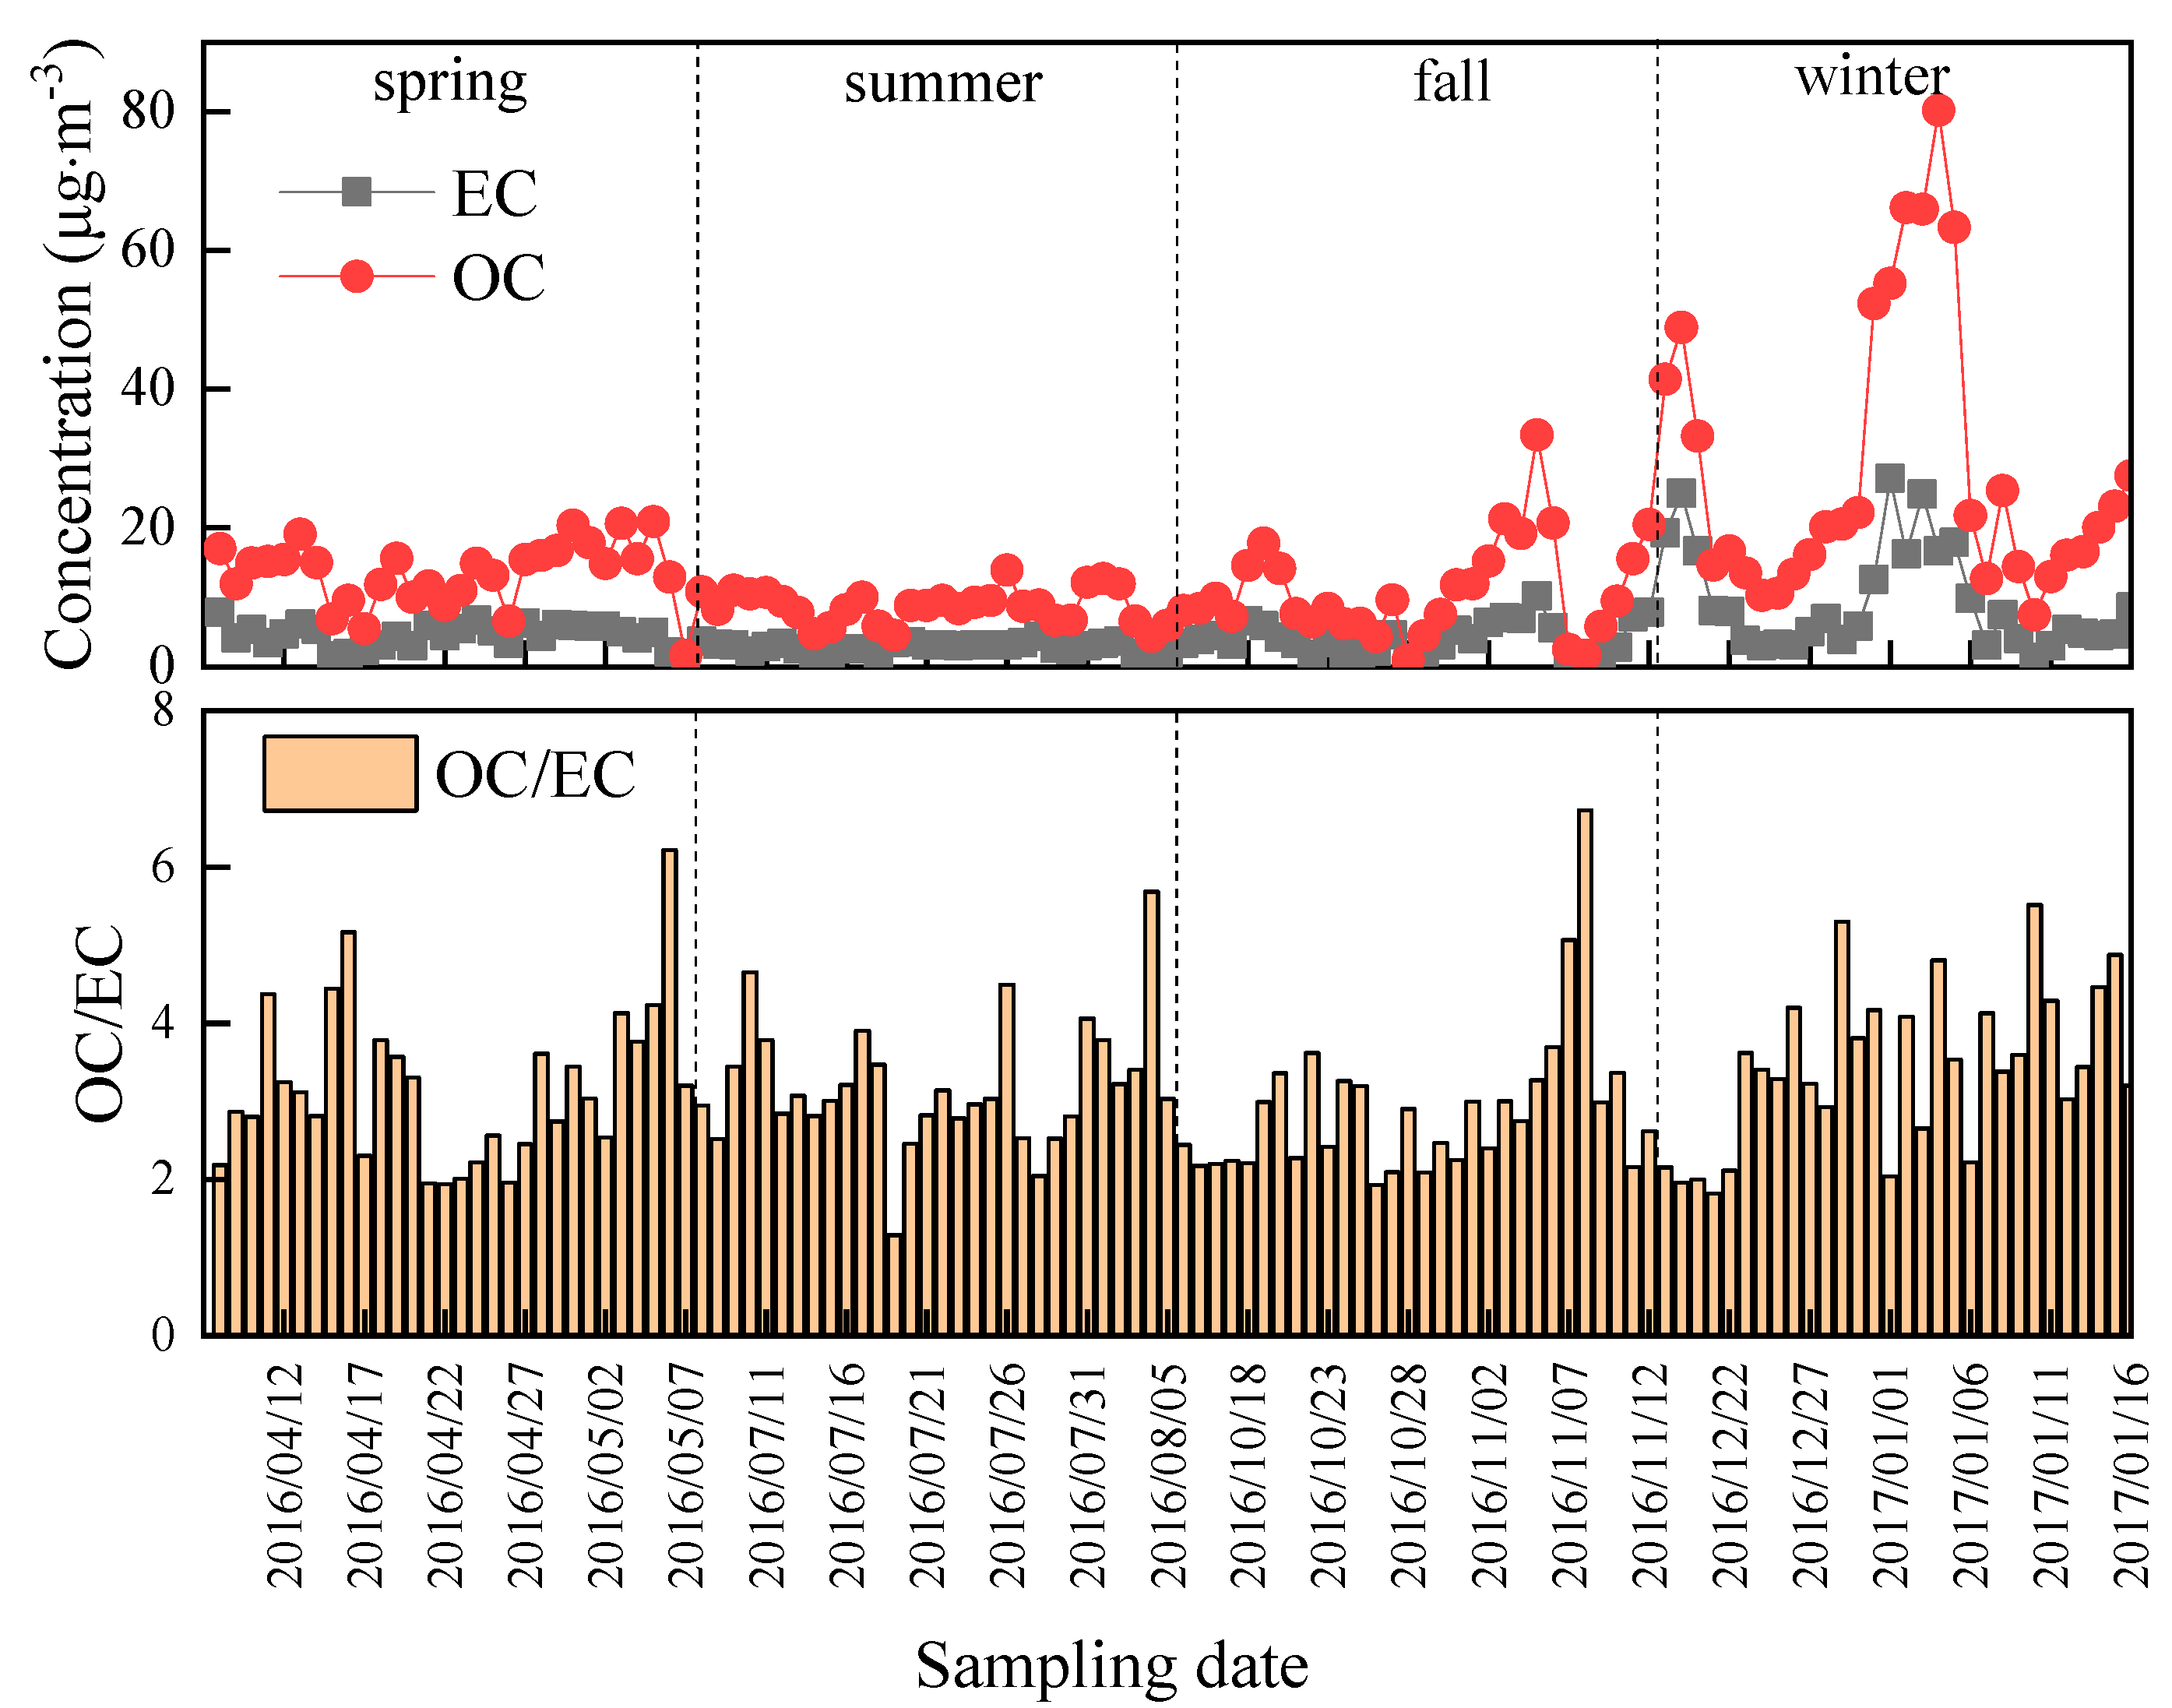
3.1. Concentration of OC and EC

As shown in Figure 2, OC and EC concentrations showed similar fluctuations and seasonal trends in Wanzhou. The daily OC concentration in PM2.5 ranged from 0.9 to 80.1 μg∙m−3 with an annual average of 15.5 ± 13.5 μg∙m−3, while the EC concentration ranged from 0.3 to 27.1 μg∙m−3 with an annual average of 5.2 ± 4.7 μg∙m−3. OC accounted for 84% of TC (= OC + EC), indicating that OC was the predominant carbon contributor. Table 1 summarizes the average concentrations of OC and EC determined in this study and the results are compared with other studies in China. It was obvious that concentrations of TC, OC and EC ranked in the similar order of winter > spring > fall > summer. The concentrations of OC and EC during winter were 3.3 and 3.4 times higher than those of summer, respectively. The seasonal differences in OC and EC concentrations were tested by one-way analysis of variance (ANOVA). The results are shown in Table 2. Significant (p < 0.05) seasonal variabilities of OC and EC with high F-ratio and low p-value were statistically different. Additionally, Tamhane test of one-way ANOVA showed that winter was significantly different from other seasons. High concentrations of OC and EC in winter were largely attributed to enhanced emissions from coal and biofuel combustion for domestic heating [39]. In addition, people in Sichuan Province and Chongqing usually burn the branches and leaves of cypress and pine to fumigate sausage and bacon at the year-end, which releases large amounts of carbonaceous particles [22,40]. Meanwhile, the poor diffusion meteorological conditions, such as stagnant air conditions with frequent calm wind and low planetary boundary layer height can also aggravate the OC and EC accumulation on the surface in winter [25,41,42]. The fossil fuel combustion activities consumed in the fields of transport and industry are important sources of carbonaceous aerosol in the other three seasons. However, these sources have almost no seasonal changes, so the differences in OC and EC concentrations among these three seasons could mostly be ascribed to the influence of weather conditions. The EC concentration in spring was comparable to fall, indicating that there was little difference between the intensity of the primary emission source in spring and fall. However, the concentration of OC was higher in spring than in fall. It is speculated that a part of OC in spring may come from secondary formation. As documented by Seinfeld et al. [43], photochemical reactions are more active in spring and summer than in fall and winter, which is favorable for SOC formation via gas-particle conversion in spring and summer. Wet scavenging was more important in summer. The precipitation in summer accounted for 60–70% of the annual rainfall (about 1181.5 mm on average) [44], which could be conducive to the removal of pollutants, resulting in the lowest summertime average OC and EC concentrations.
Compared with previous reports, the level of TC in Wanzhou was higher than the result measured from June 2013 to May 2014. It should be noted that the monitoring methods used in the two measured periods were different, TOR method was used in this study, while TOT method was used in the latter. Although we did not compare the OC and EC data measured by the methods of TOR and TOT, many other studies have found that the TC levels measured by the two methods were similar [14,45,46]. In recent years, the increase in carbonaceous aerosol concentration in Wanzhou may be related to more coal consumption and the gradual growth of the vehicle fleet. The total coal consumption was 132.1 × 10⁴ ton in 2014 and 345.0 × 10⁴ ton in 2016, while the number of automobiles was 0.21 million and 0.24 million, respectively [47]. It suggests that the government should take more stringent measures to reduce the concentration of carbonaceous aerosol in Wanzhou. As shown in Table 1, the TC concentration in Wanzhou was at a moderate level for Sichuan Basin, higher than Nanchong and Neijiang, but lower than Chengdu, and comparable with urban Chongqing. However, the level of TC in Sichuan Basin was similar or slightly lower than that in BTH, higher than most coastal cities and Western Taiwan Strait Region (WTSR). Overall, this comparison indicates that the pollution in Sichuan Basin is still serious.

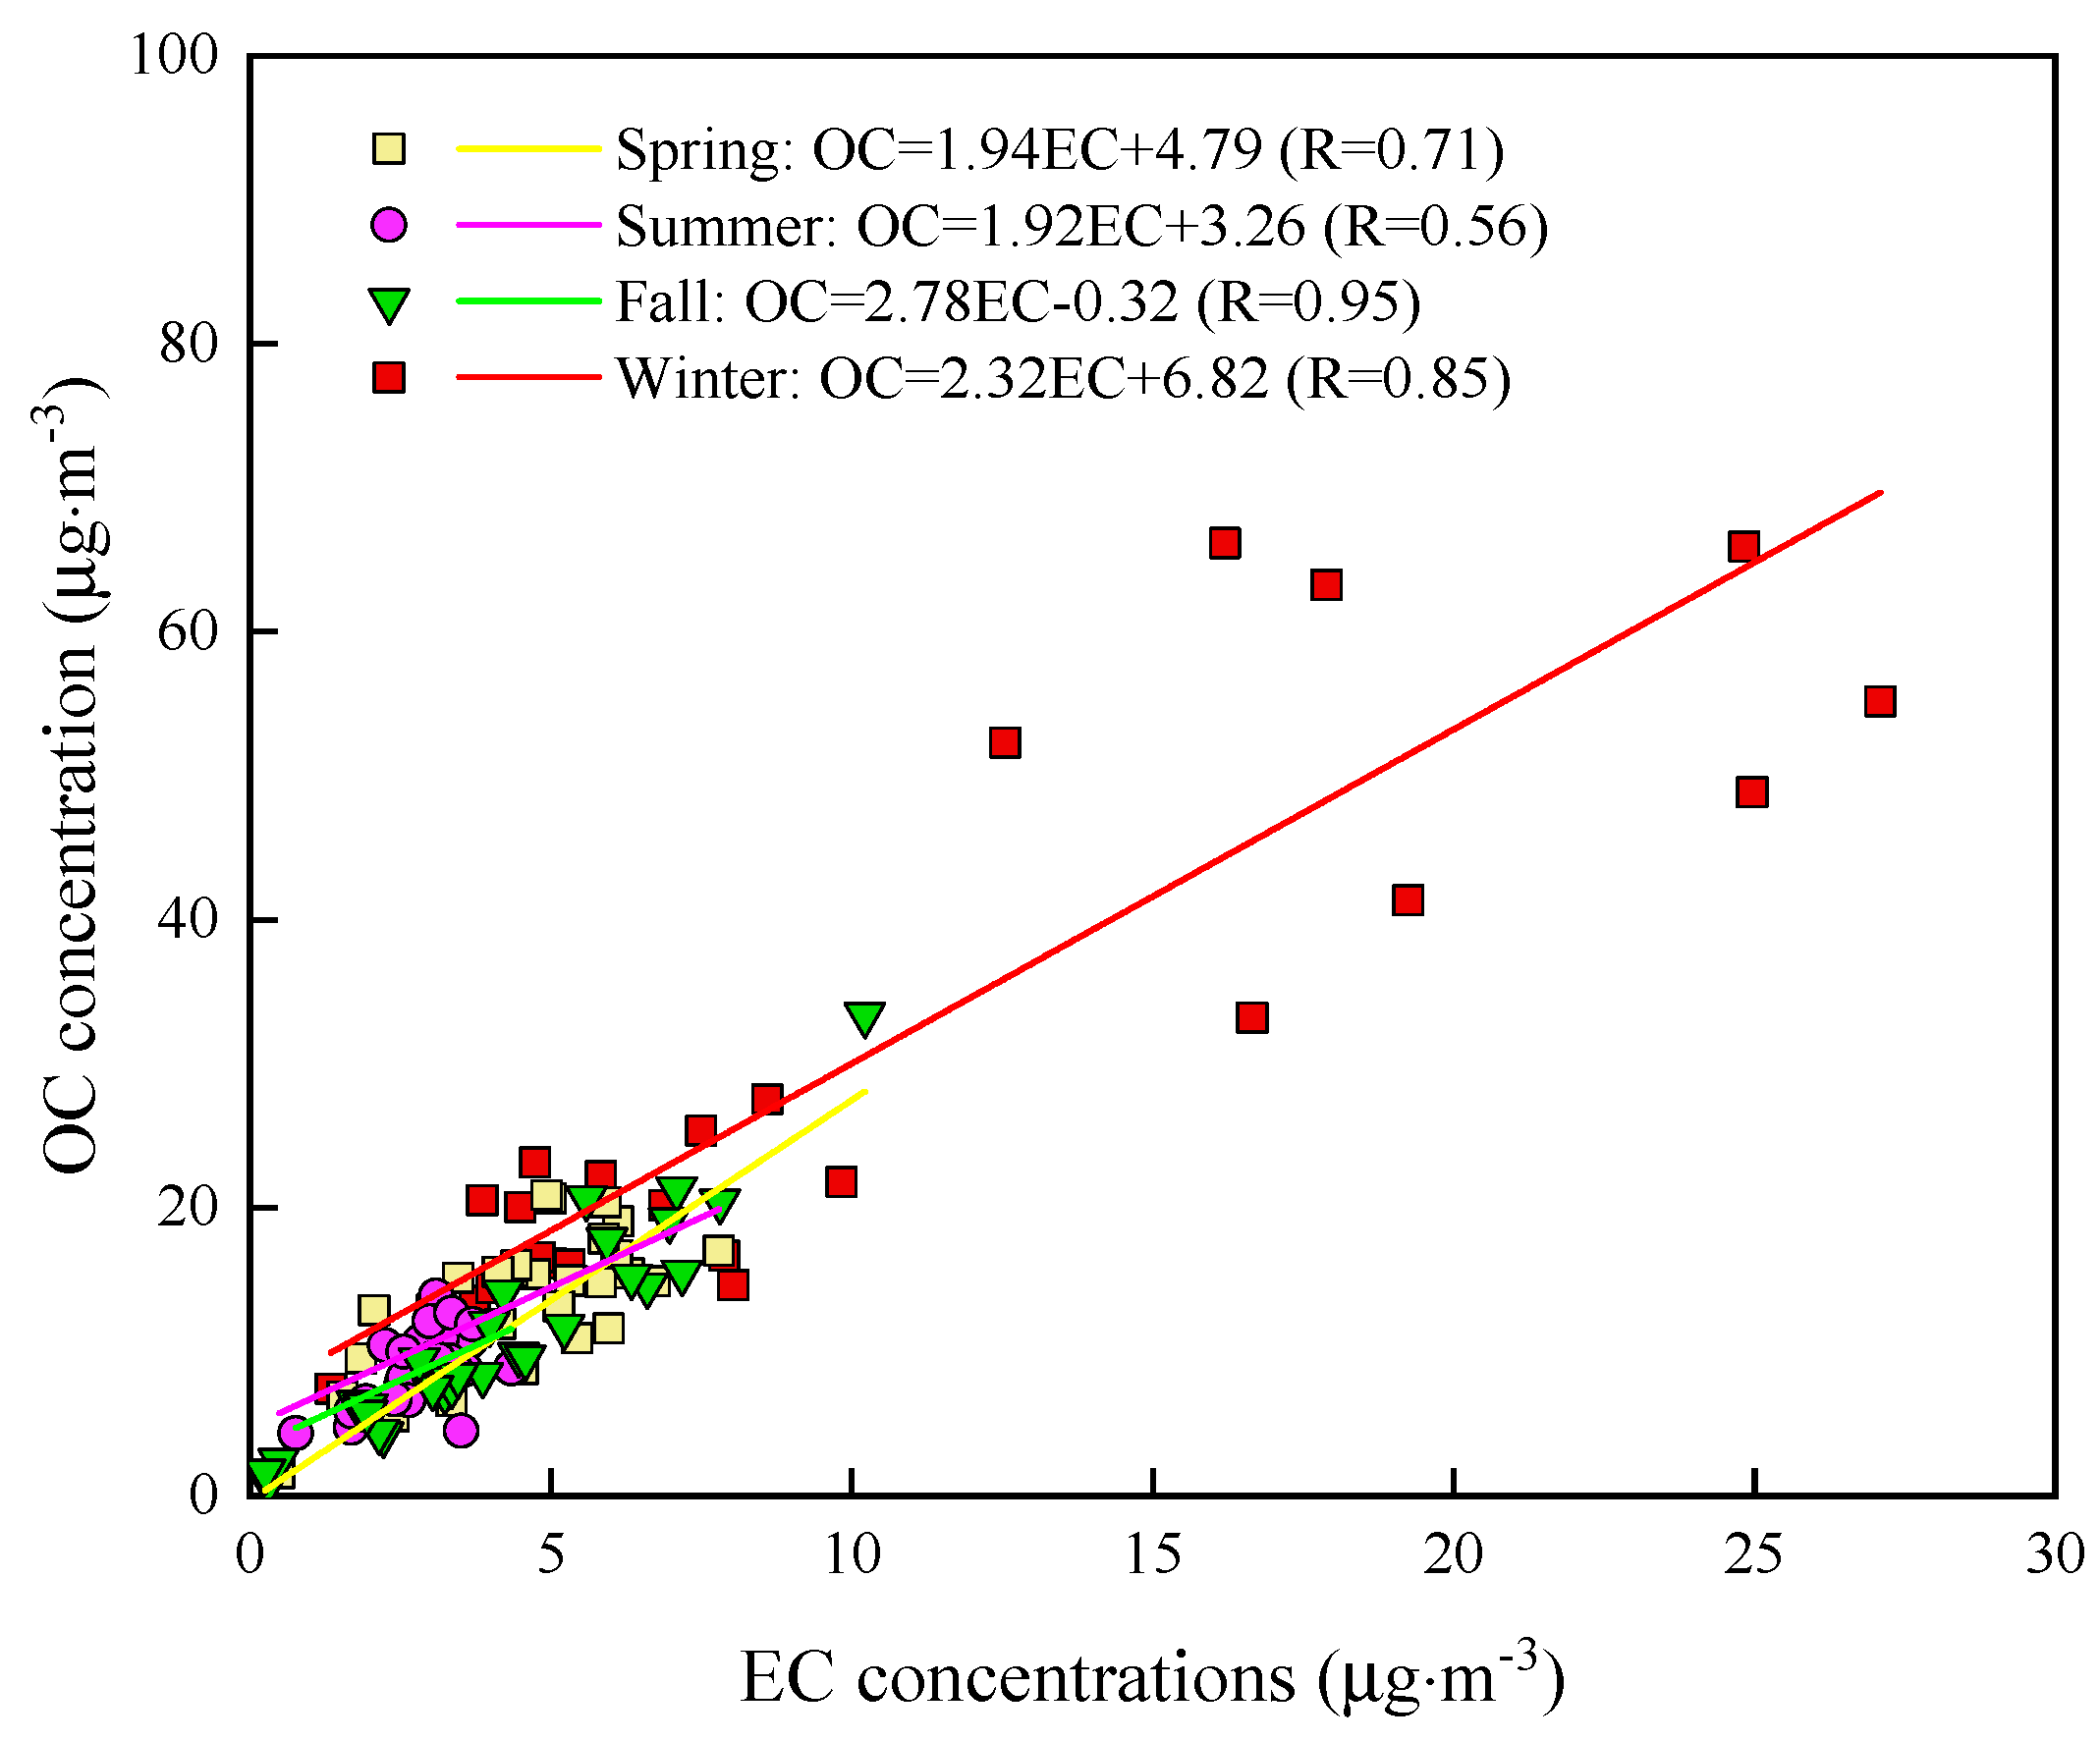
3.2. Relationship Between OC and EC

The source of OC is relatively complex, including not only POC, but also SOC. EC mainly comes from incomplete combustion. As an inert pollutant, EC has good stability, and its chemical properties remain unchanged after being discharged from the source. Thus, EC was often used as a tracer to estimate the concentrations of POC and SOC [52]. If the correlation between OC and EC concentrations is strong, it indicates that OC and EC are emitted by the dominant primary source [53]. As shown in Figure 3, the highest correlations between OC and EC were found in fall (R = 0.95) and winter (R = 0.85), indicating that there were similar primary emission sources for OC and EC such as coal combustion, vehicular exhaust, and biomass burning. The correlation in summer (R = 0.58) was significantly lower than those in the other three seasons, indicating that the sources of OC and EC in summer were relatively complex. This may be related to the following reasons: (1) OC volatilizing under high temperature and leading to the reduction in concentration; (2) high temperature in summer accelerates the chemical reaction rates and produces more SOC [12].
The slope of the regression line of OC versus EC can explain the origin of carbonaceous aerosols to some extent [17,54]. There were clear seasonal variations for the slopes, with high values in fall (2.78) and winter (2.32), low values in spring (1.94) and summer (1.92). The relatively strong correlation and high slope may be ascribed to the combined effects of coal combustion and biomass burning for domestic heating and vehicular emission because coal combustion and biomass burning are associated with high OC/EC ratios [10]. A 4.0 ratio is assumed for fossil fuel combustion and 1.1 for vehicular emission, while coal combustion and biomass burning show high OC/EC ratios of 8.5–12 and 10.0–16.3, respectively [21,55,56]. The intercept of OC versus EC is interpreted as the OC background concentration originating from noncombustion sources although it can be biased by uncertainty in carbon measurement and a relatively large slope [54,57]. From the Figure 3, the intercept was higher in winter than in spring and summer even though negative value was calculated in fall. This possibly pointed to the high percentage of secondary OC present in the background.
Since OC can originate from biomass combustion, and K+ can be used as an indicator of biomass combustion, the ratio of K+ to OC can be used to characterize the particles emitted from biomass combustion. The K+/OC ratio ranged between 0.01 and 0.16 with an average of 0.03 ± 0.02 in Wanzhou. This ratio was similar to the observed K+/OC ratio of wood burning for residential heating (0.03) [58] and farmland burning (0.04–0.13) [59], suggesting that biomass burning had an important contribution to fine carbonaceous particles in Wanzhou. The linear regression was also performed for OC, EC and K+ in Wanzhou, as showed in Figure 4. There was a strong correlation between OC, EC and K+, and the correlations in fall and winter were significantly higher than those in spring and summer, indicating that biomass combustion might be an important source for OC and EC in fall and winter. Peng et al. [28] also found that the correlation between TC and K+ was higher in winter than in summer in Wanzhou.

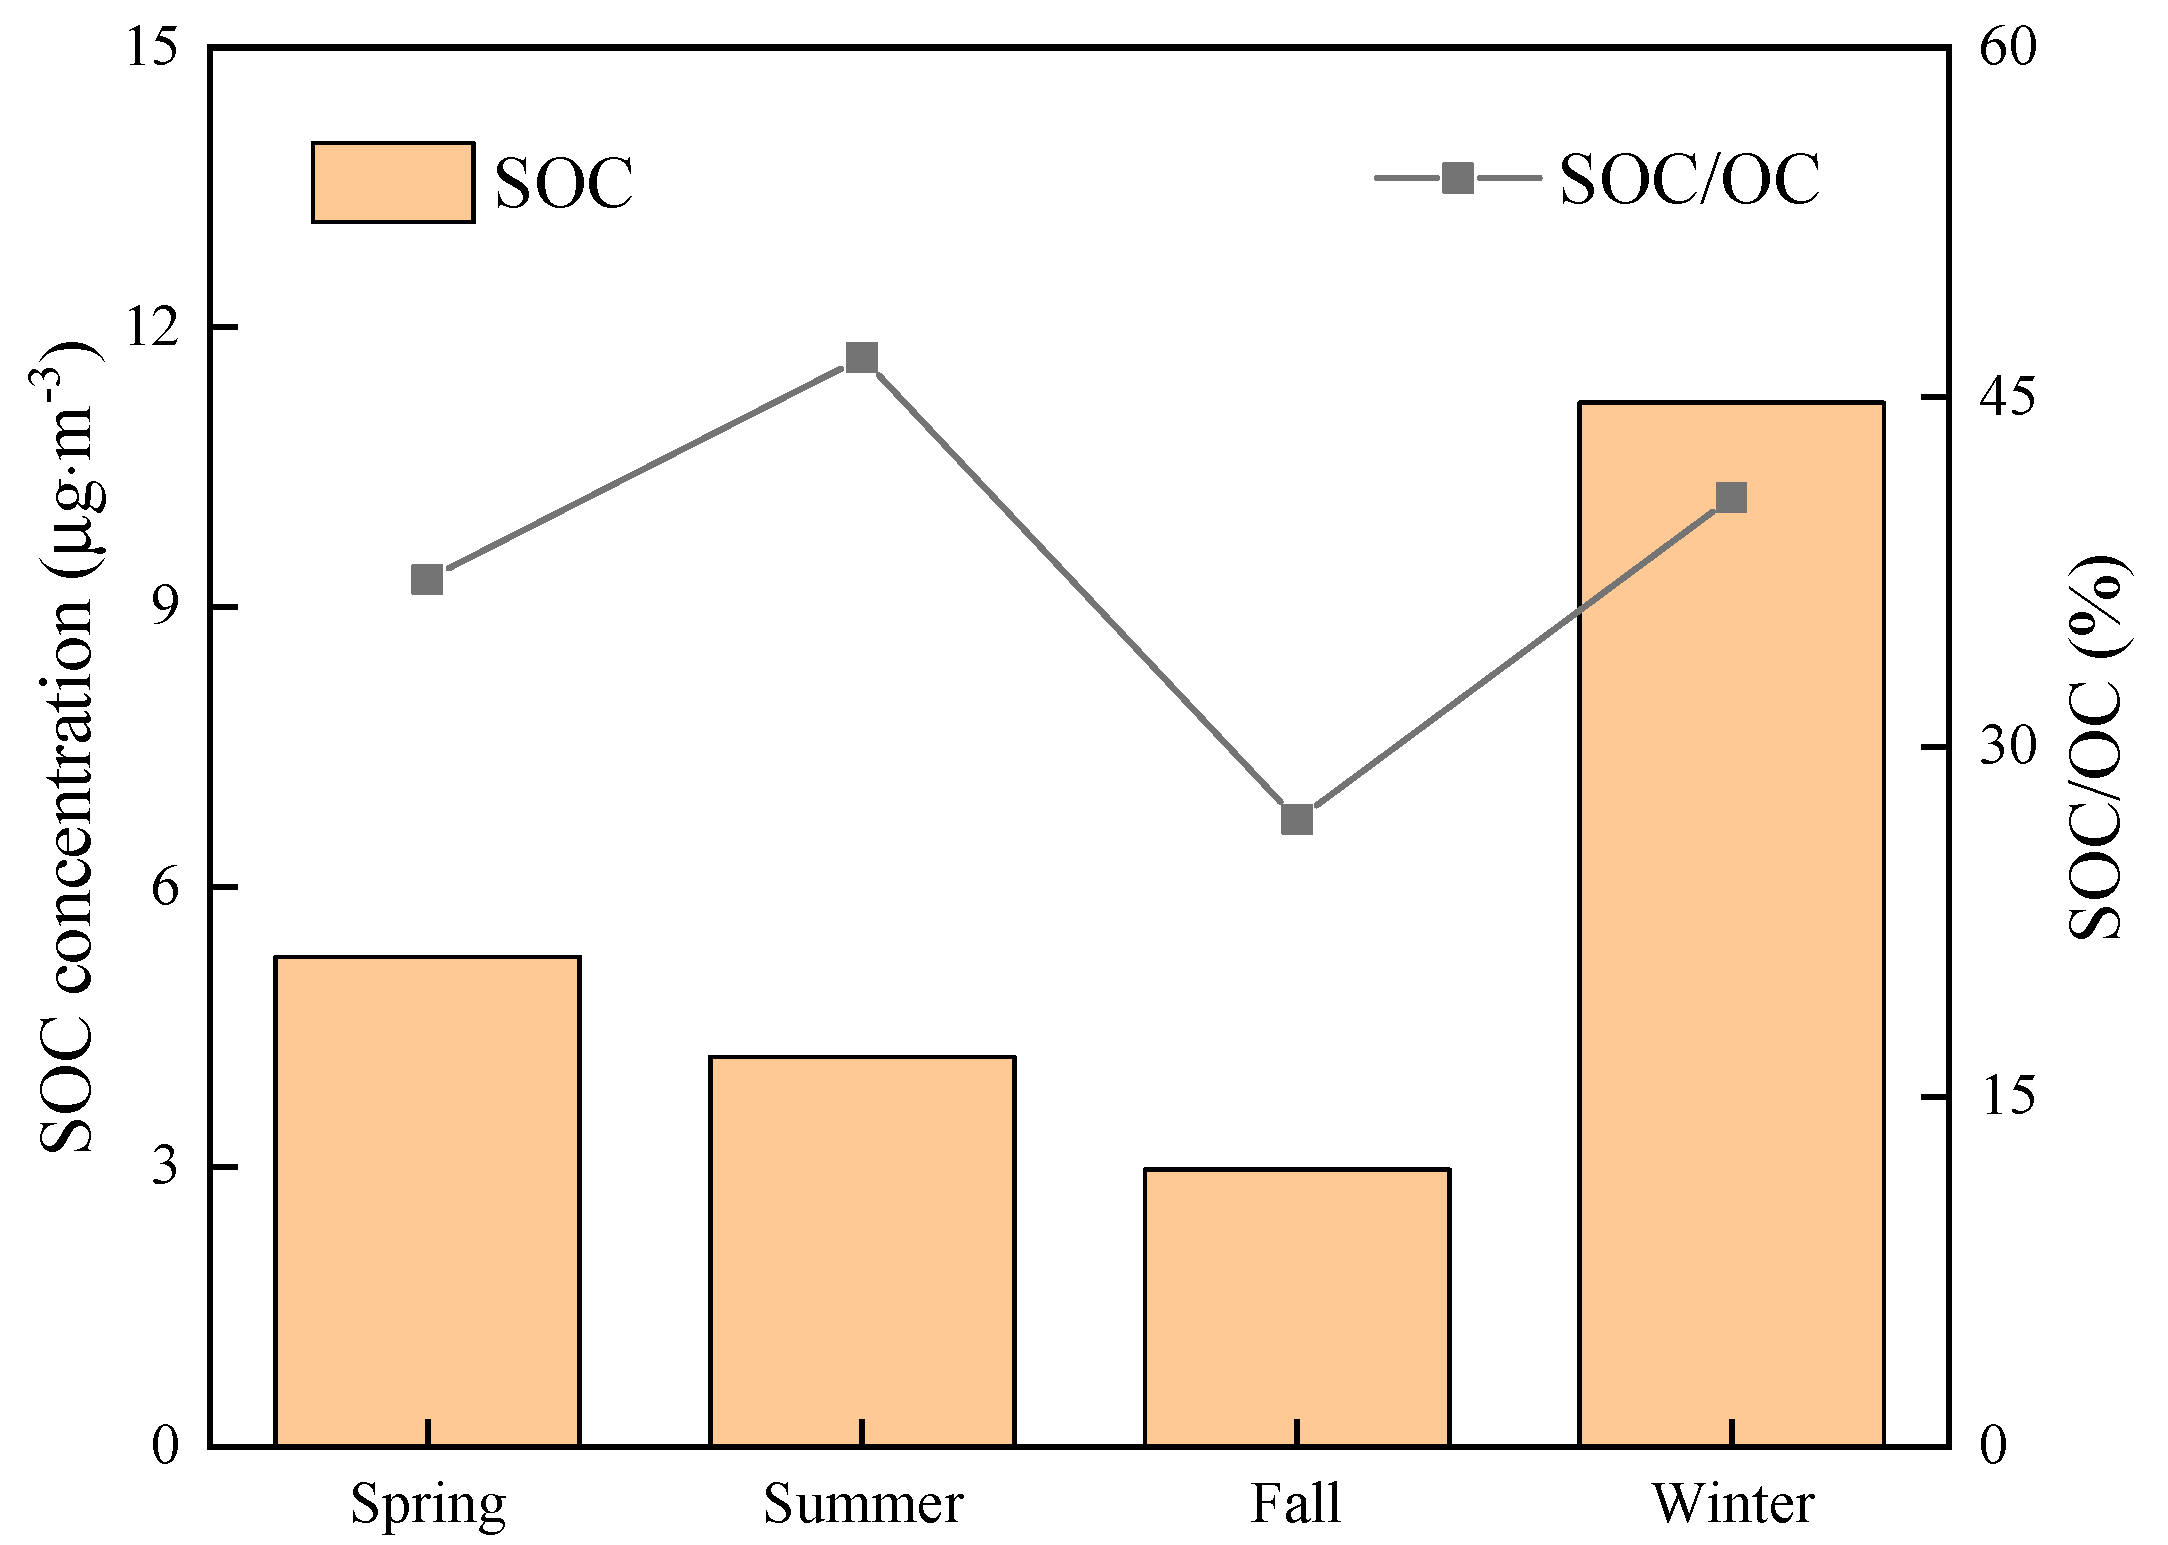
3.3. Secondary Organic Carbon

Secondary organic carbon (SOC) originates from the gas-to-particle conversion of volatile organic compounds (VOCs). The determination of SOC content is of great significance to the control of fine particulate pollution, but there is no method to directly determine the SOC content in the particles at present. Thus, several indirect methods have been applied to evaluate the formation of SOC in ambient aerosols [60,61,62]. According to Turpin et al. [60], the production of SOC can be calculated by the following formula:
SOC = OC EC × ( OC / EC ) pri
where (OC/EC)pri is the ratio of OC/EC produced during the primary emission process. However, as the value of (OC/EC)pri is related to the emission of each source, it is not easy to determine. Several studies have determined (OC/EC)pri by investigating the emission inventory or based on the minimum OC/EC value for the observation period [2,18,62,63,64]. Revisions have been made to improve the (OC/EC)pri determination in China [14,21,65]. For instance, Chen et al. [14] estimated the correlation coefficient between OC and EC at 0.95 was taken as a threshold, i.e., the observed hourly OC and EC concentrations with the correlation coefficient larger than 0.95 are selected to calculate the (OC/EC)pri. In this study, considering the different meteorological conditions and emission of pollution sources in different seasons, we selected the data in which the OC/EC ratio was in the lowest 5% in each season as the primary OC/EC ratio. The estimated SOC concentrations were 5.3, 4.2, 3.0, and 11.2 μg∙m−3, accounting for 37.2%, 46.7%, 26.9%, and 40.7% of the OC in spring, summer, fall, and winter, respectively. It illustrated that SOC was an important component of OC mass in Wanzhou, presenting a significant fraction of secondary transformation. As shown in Figure 5, the proportion of SOC in OC was the highest in summer. The relatively high SOC concentration in summer is mainly due to the enhanced photochemical activities in this season. The SOC concentration and SOC/OC ratio were both higher in spring than in fall. As mentioned in Section 3.1, photochemical reactions are more active in spring than in fall, which is more conducive to the formation of SOC. The absolute SOC concentration was highest in winter, and its abundance in the total OC was higher than in spring and fall, but smaller than that in summer. The highest SOC concentration combined with the strong correlation between OC and K+ in winter, indicates that high SOC formation from high primary emissions of biomass burning, reflecting a rather high and fast oxidation potential [66]. Both laboratory studies and field measurements have shown that high concentrations of SOC precursors and the OH radical are present in biomass burning plumes, which favors the secondary formation of OC [22,67,68]. It must be noted that the unfavorable meteorological conditions not only lead to the increase in SOC concentration, but also to the increase in primary OC concentration. That is why the absolute SOC concentration in winter was almost twice as high as in summer, but the relative contribution of SOC to OC in aerosol in winter was lower than that in summer.

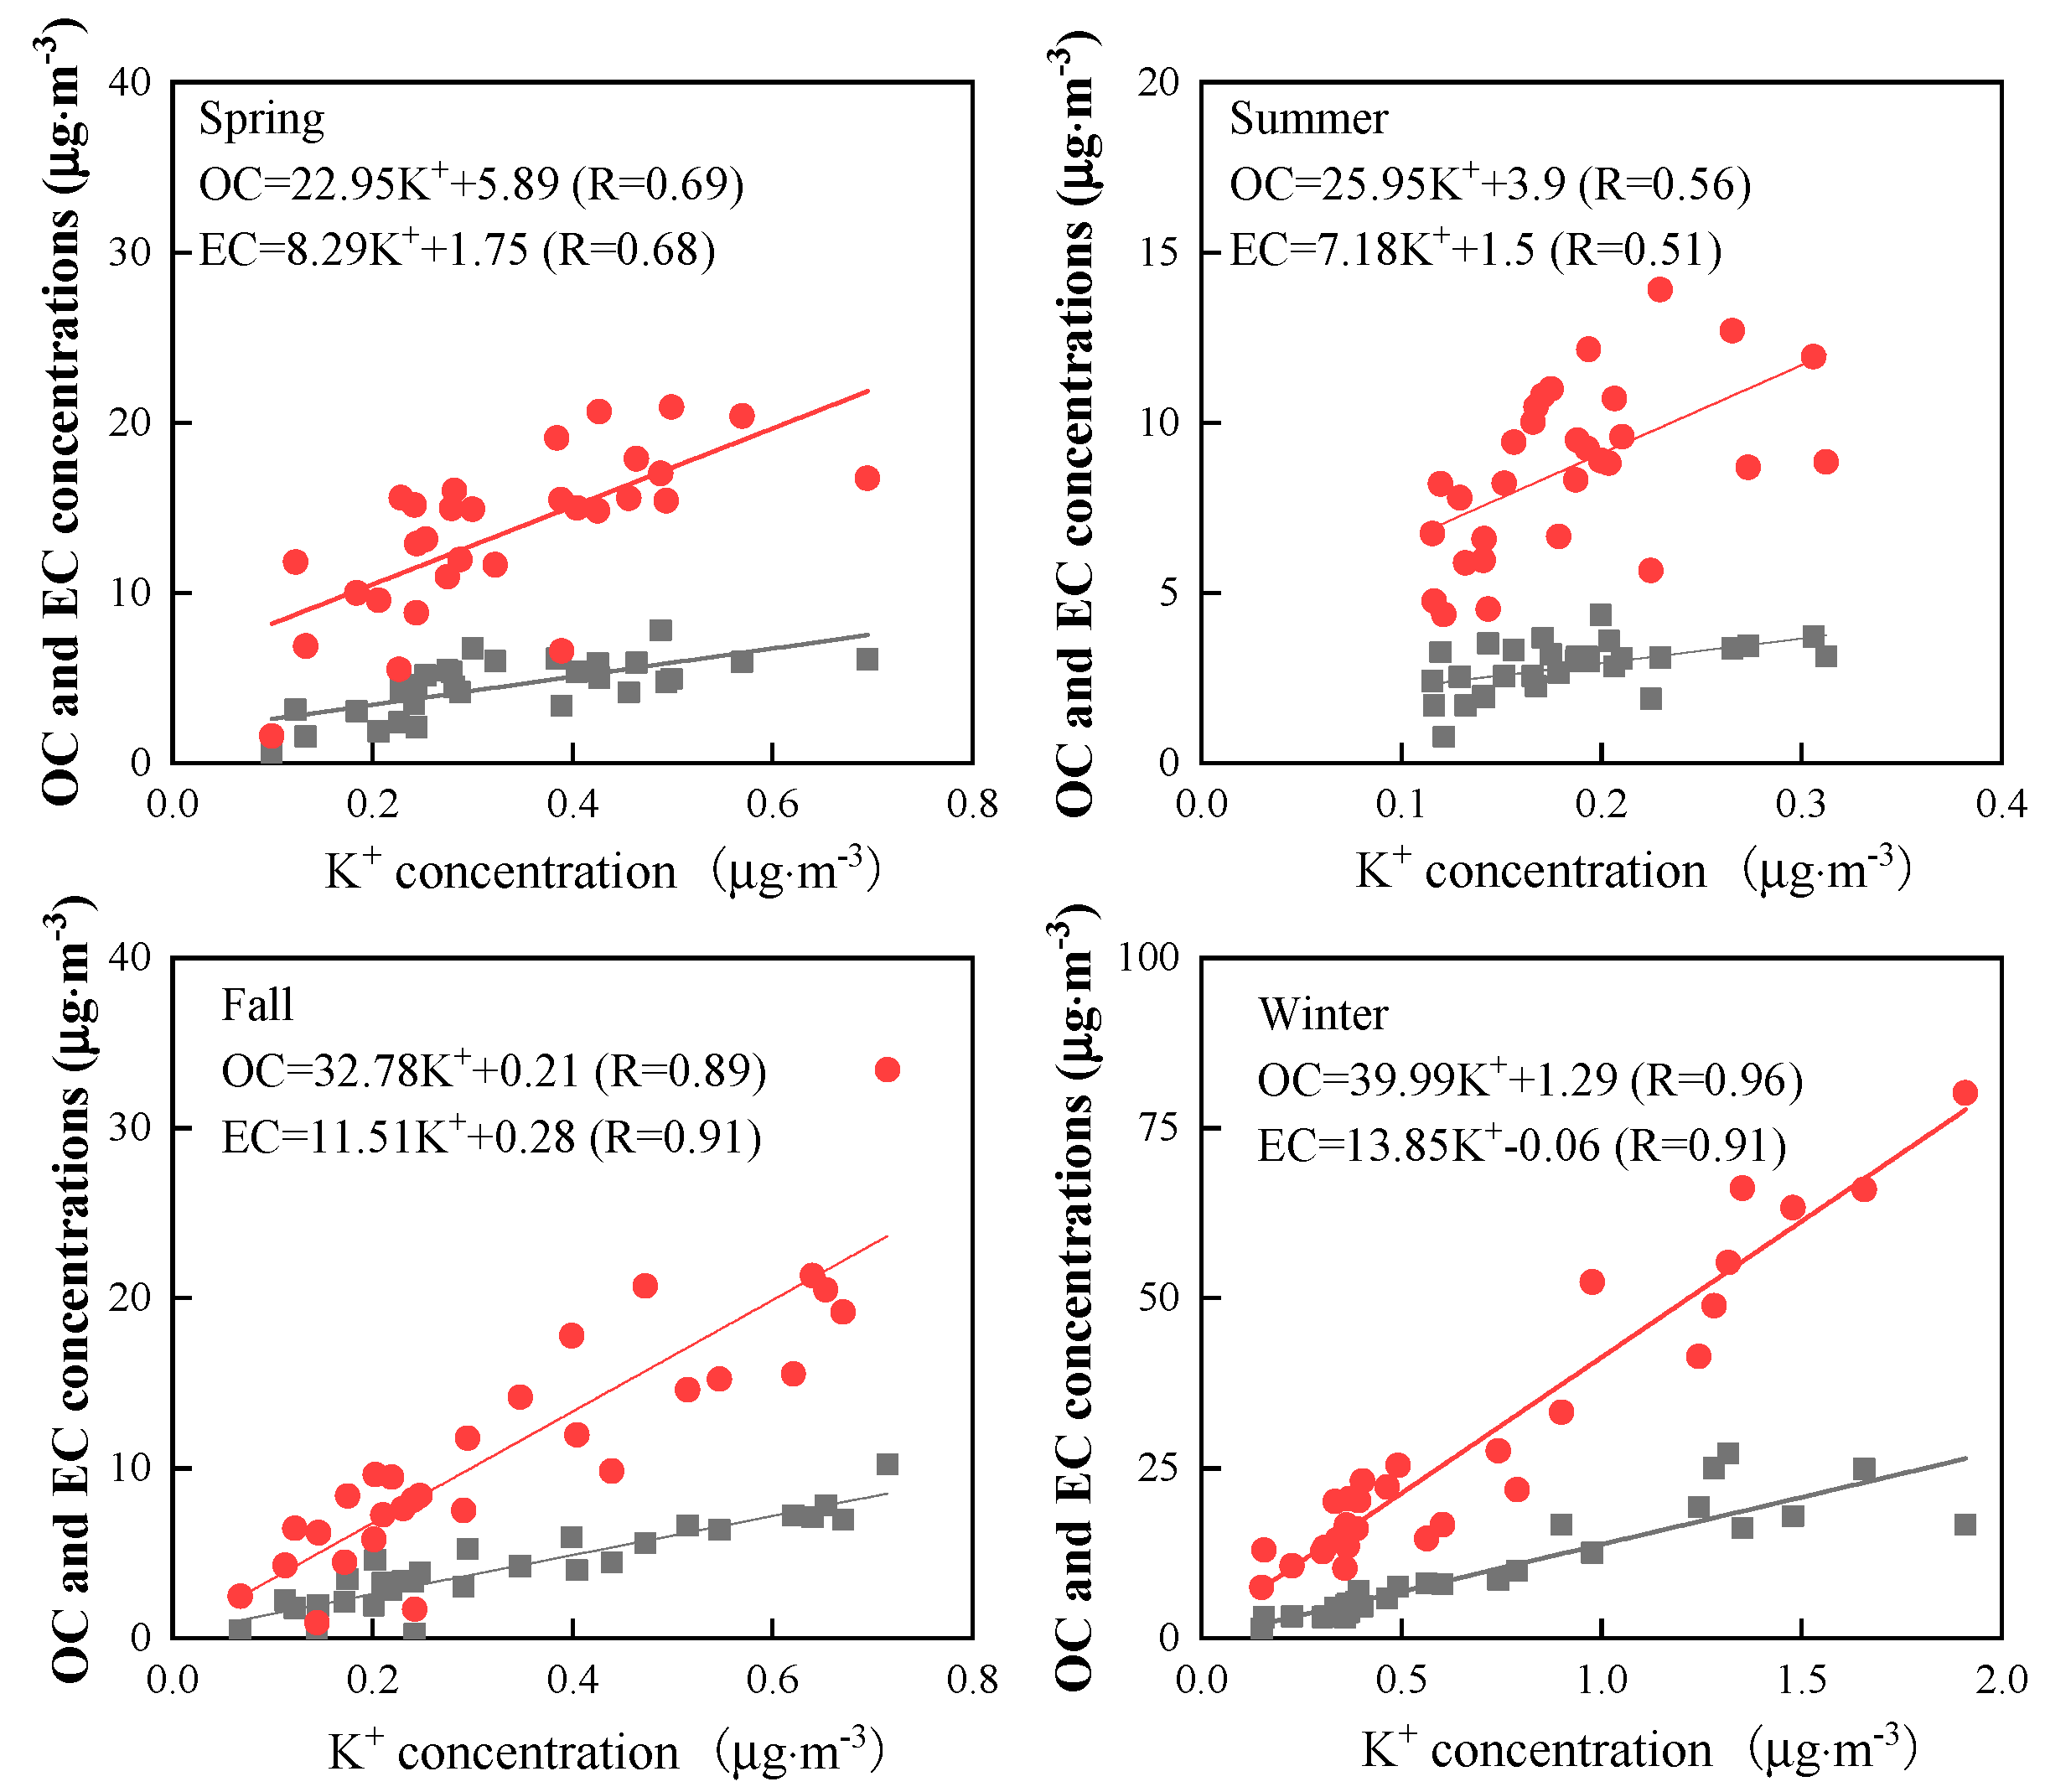
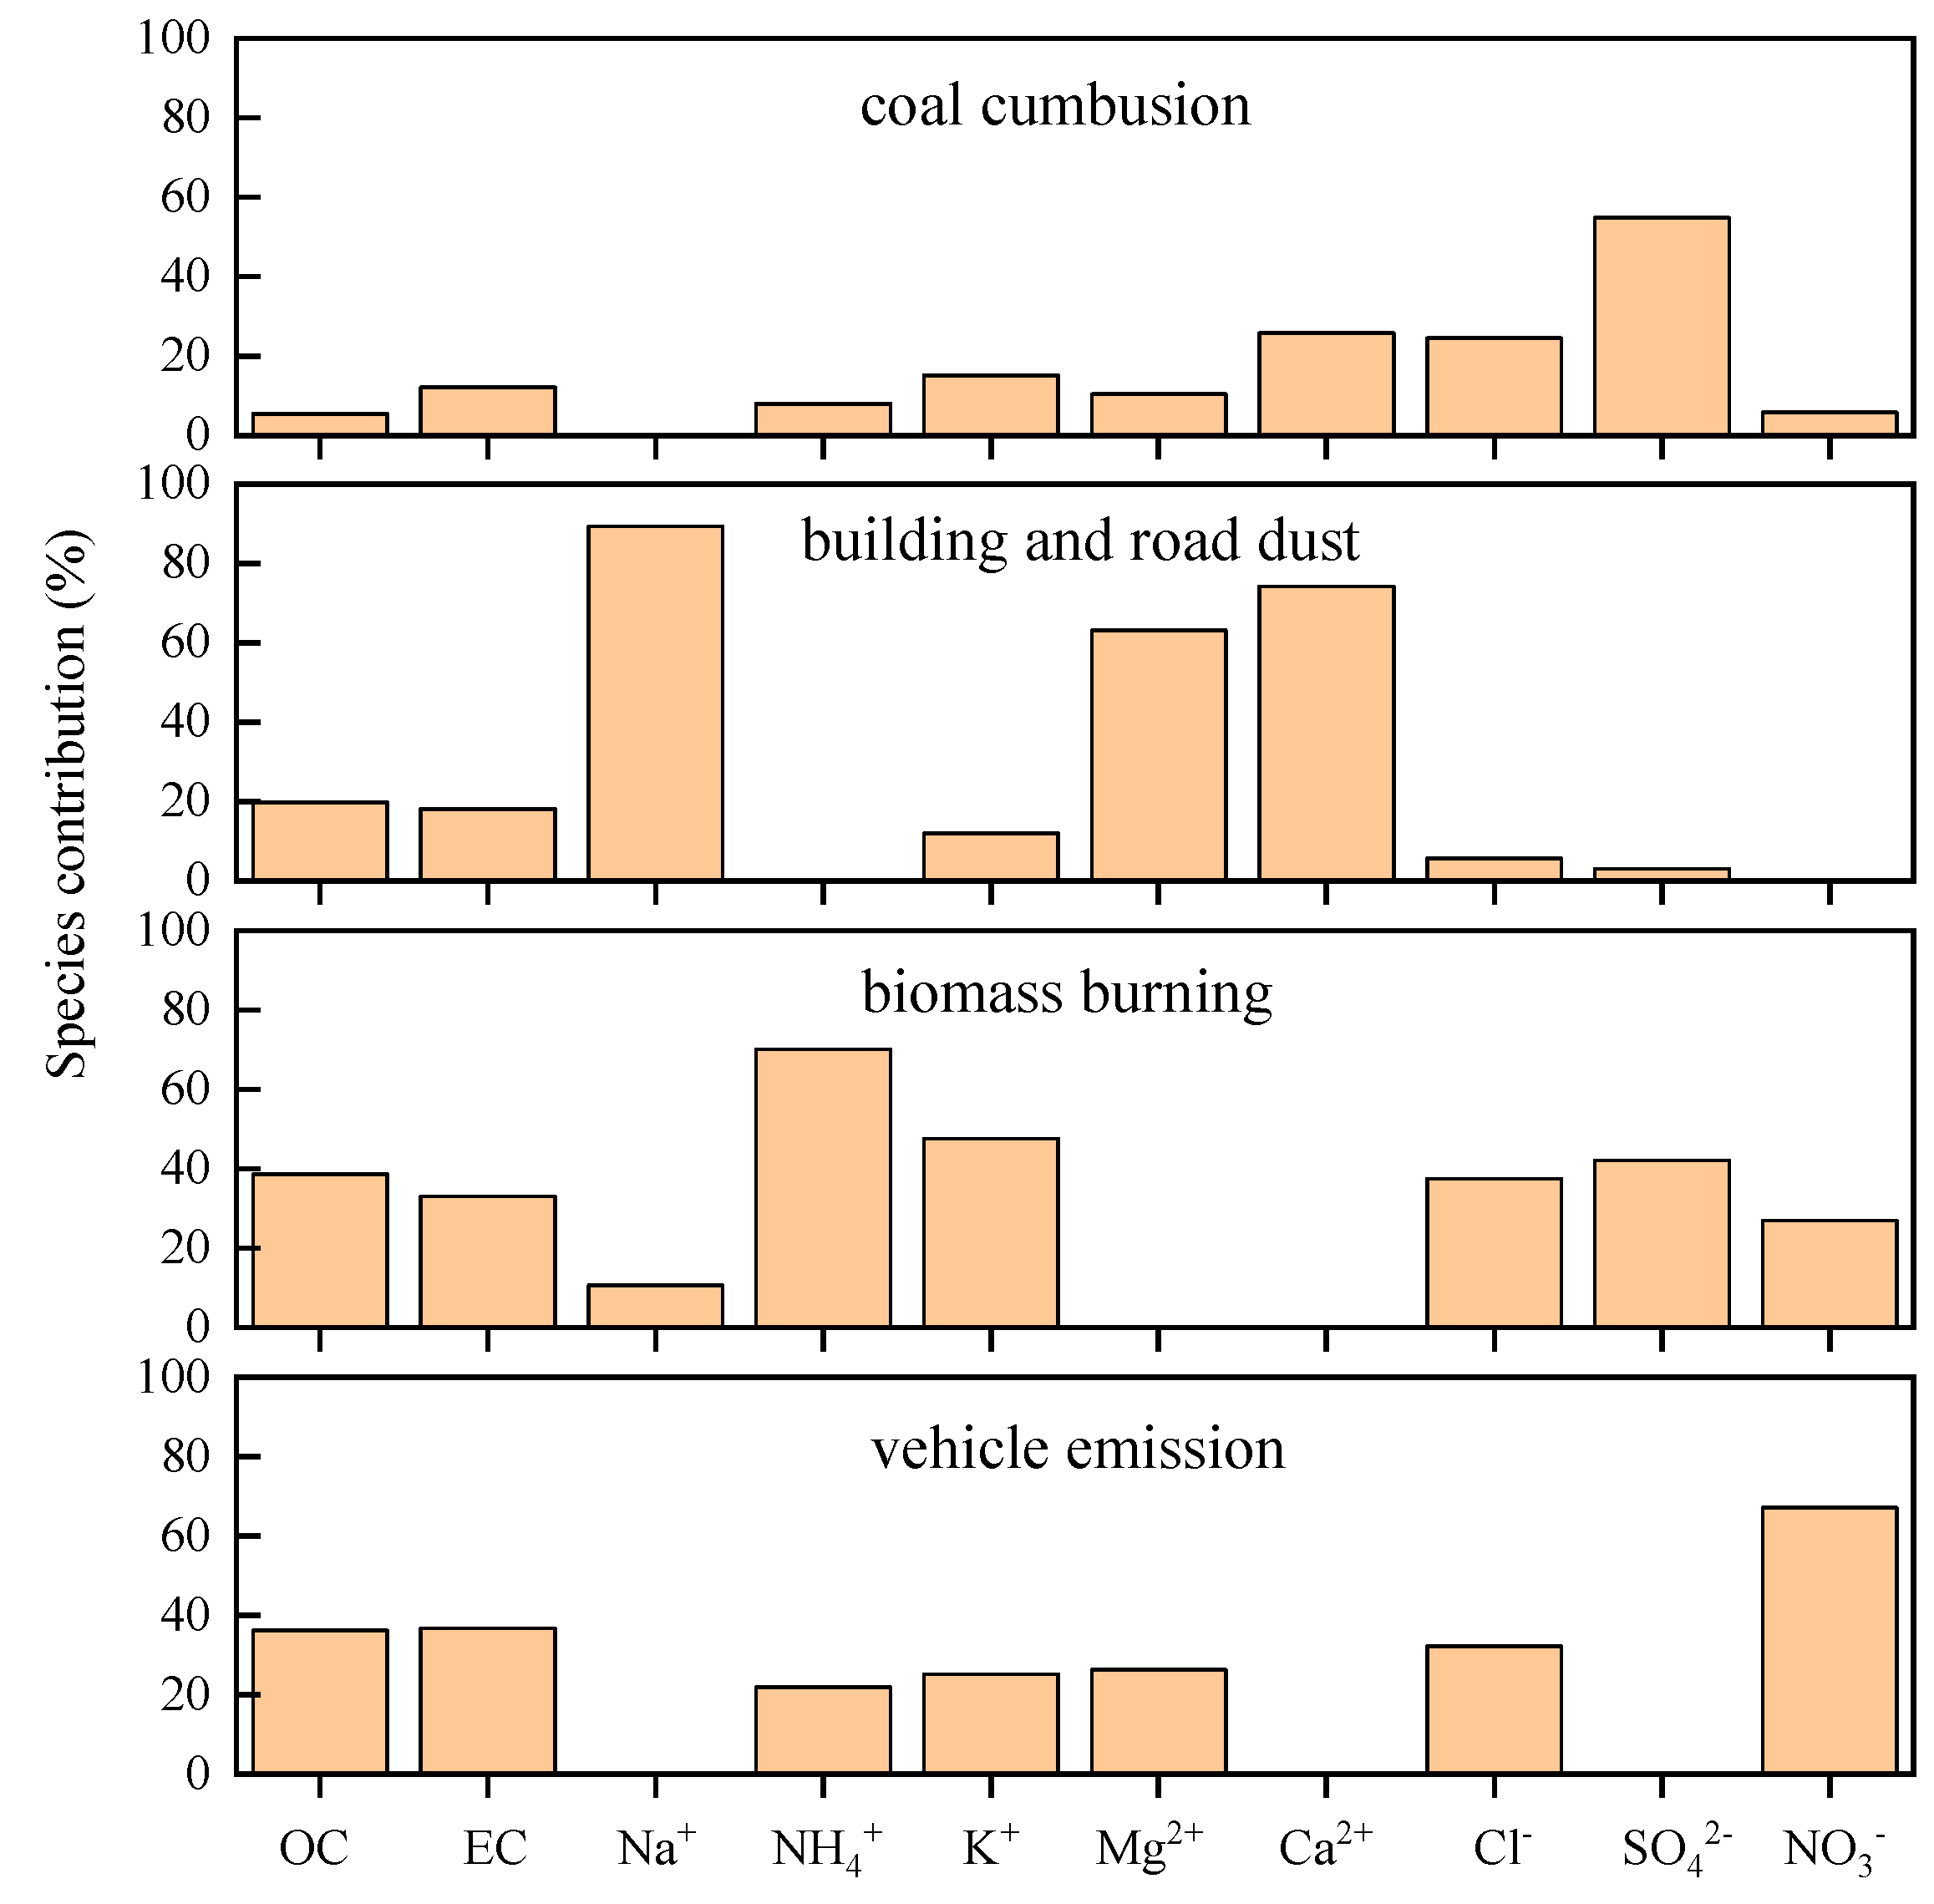
3.4. Source Apportionment of OC and EC

Based on the water-soluble inorganic ions, OC, and EC concentrations, the sources of carbonaceous aerosols were estimated quantitatively using the Environmental Protection Agency PMF 5.0 model. In this study, through running the program many times, different factor parameters and uncertain parameters were tested to find the minimum objective function value. Meanwhile, the residual matrix value was observed to make it as small as possible, so as to ensure a good correlation between the predicted and the observed results. Finally, four types of sources were obtained, as shown in Figure 6. The first factor was characterized by high loadings of SO42− (54.8%), Ca2+ (25.9%), and Cl (24.5%). Since SO42− mainly comes from the secondary transformation of SO2 generated by coal burning under the action of atmospheric oxidants, and Cl- is an important indicator of combustion source, the first factor is considered to represent the source of coal combustion. The contribution rate of coal combustion to OC and EC was 5.5% and 12.1%, respectively. The second factor was characterized by high abundances of Na+ (89.3%), Ca2+ (74.1%), and Mg2+ (63.1%), which was consistent with the characteristics of water-soluble inorganic ions in PM2.5 emitted from building and road dust. The contribution rate of factor 2 to OC and EC was 19.7% and 18.1%, respectively. In the third factor, the percentages of NH4+, SO42−, and K+ were relatively high. K+ is a tracer of biomass combustion, and NH4+ can be derived from the combustion of a large amount of biomass fuel [69]. Therefore, it is speculated that factor 3 represents biomass burning, and its contribution rate to OC and EC was 38.7% and 33.1%, respectively. The fourth factor was dominated by NO3, representing vehicle emissions, contributing 36.1% and 36.7% to OC and EC, respectively.

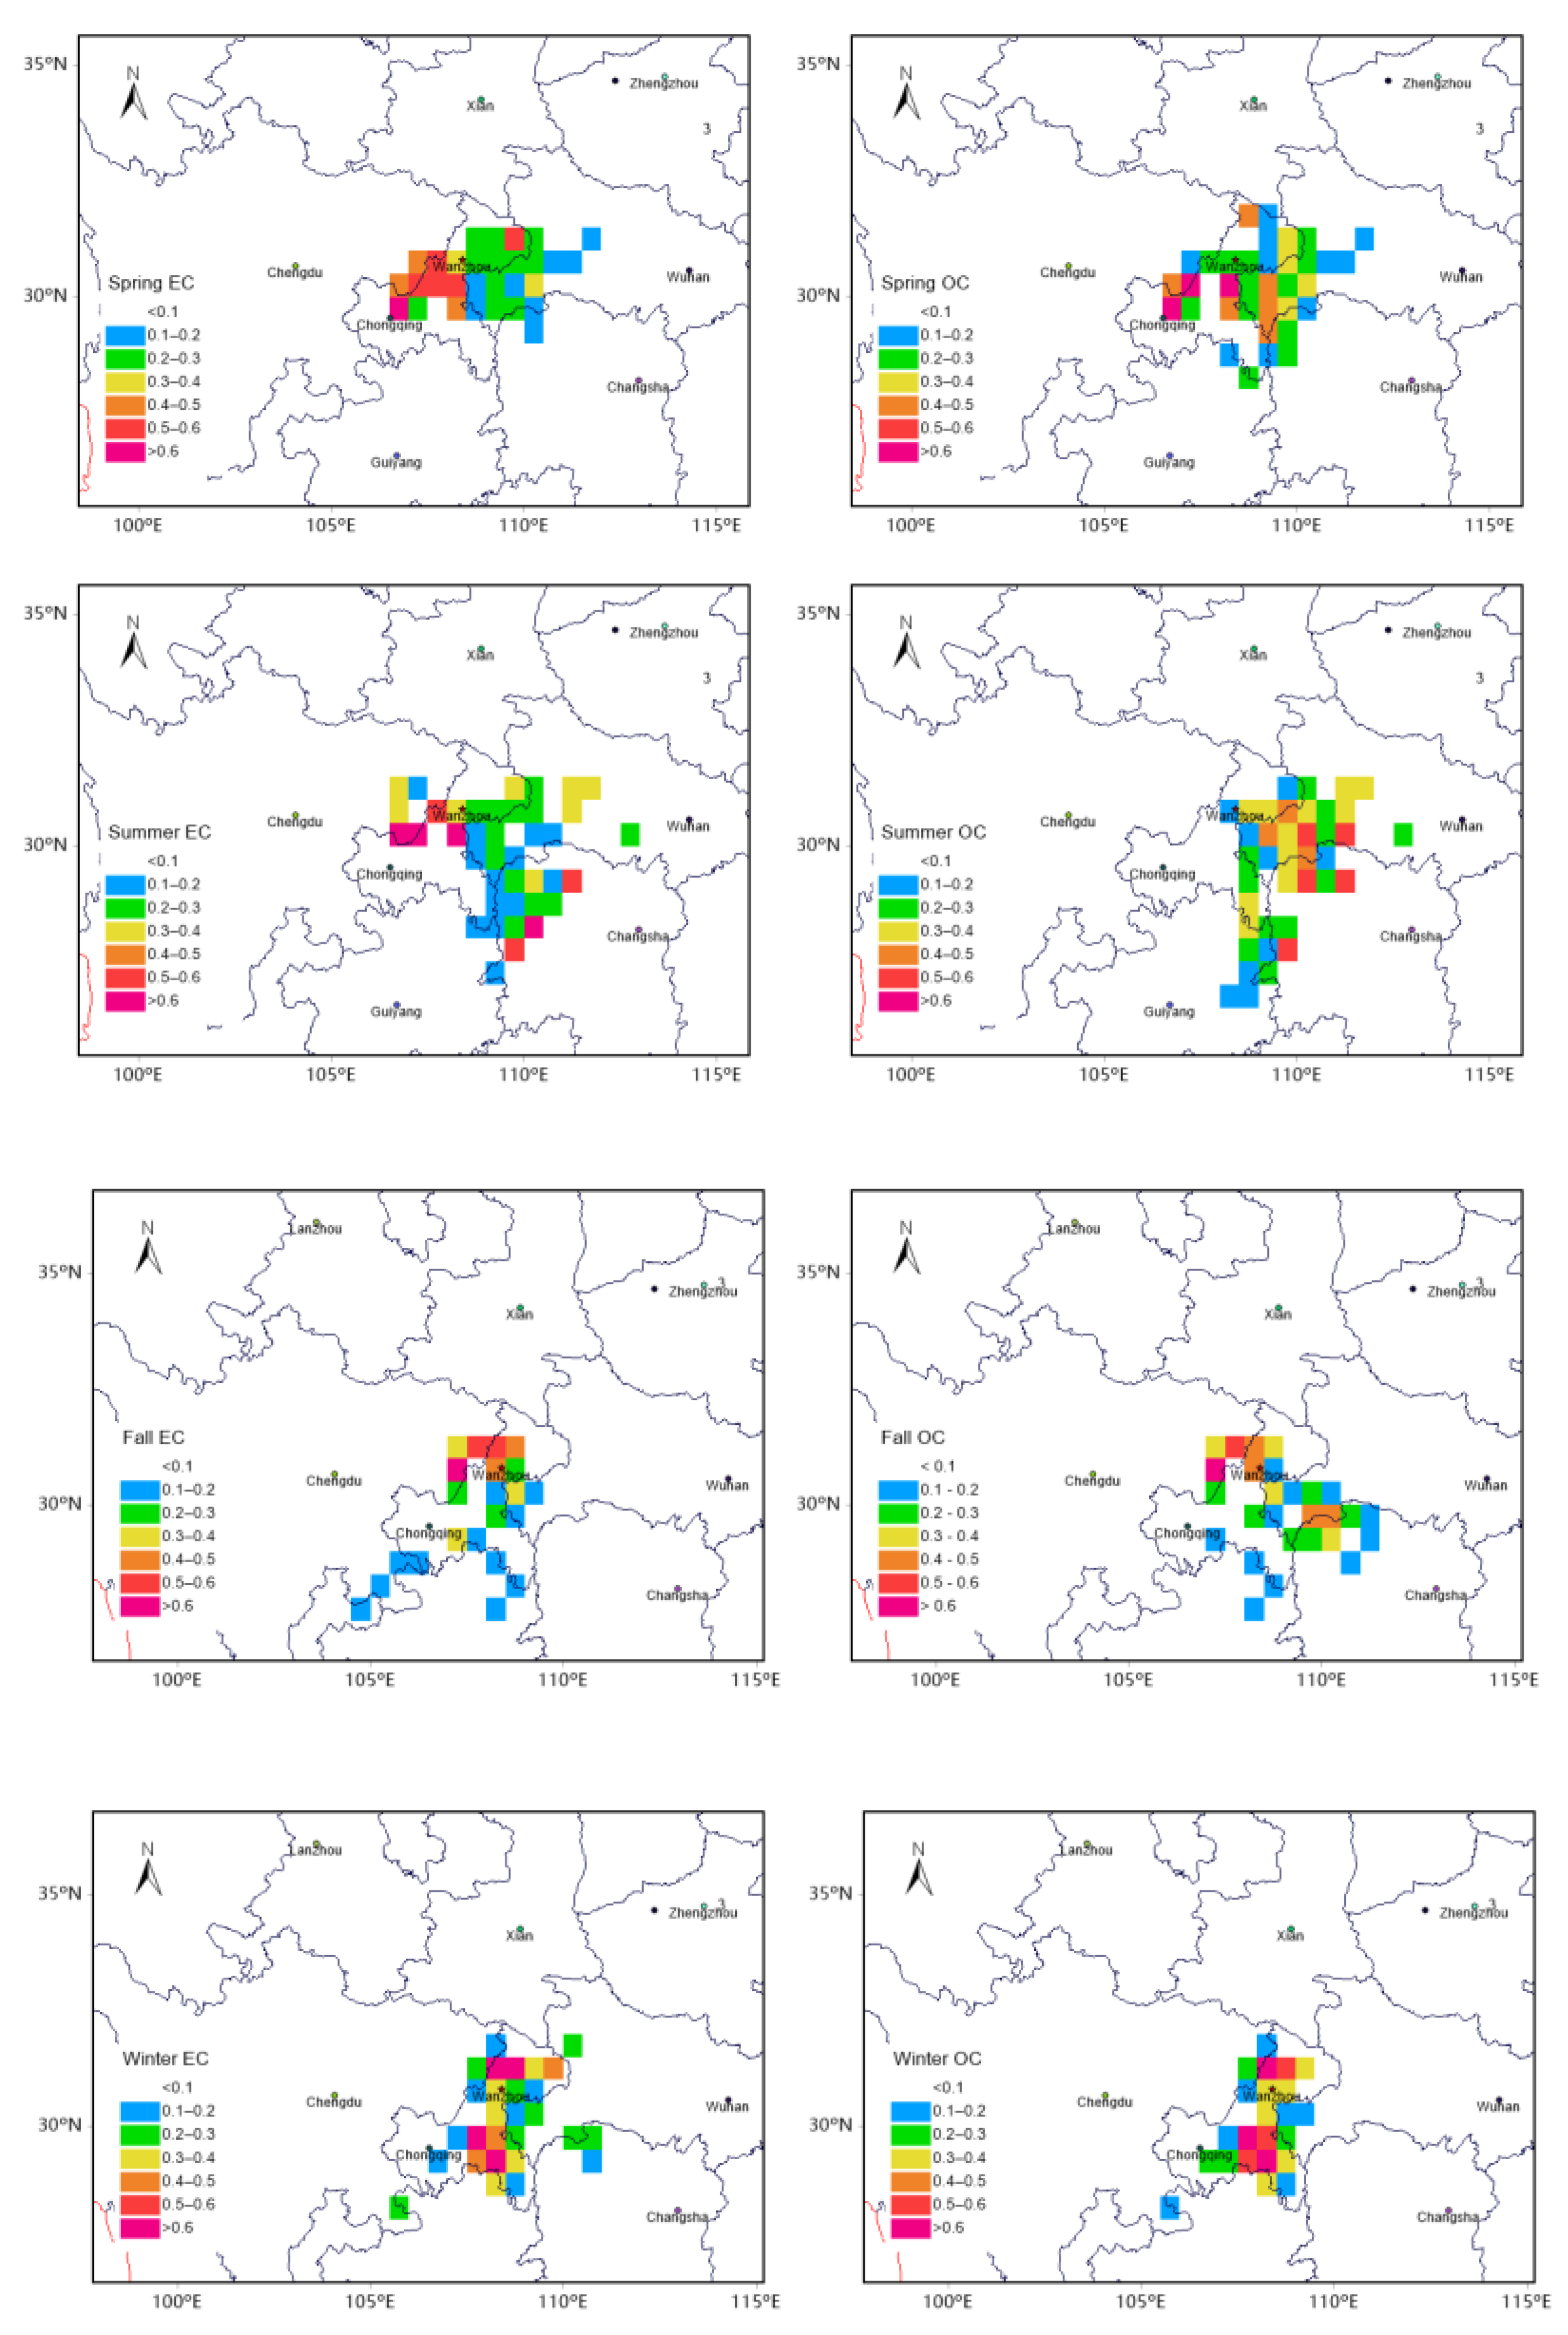
3.5. Potential Source Regions of OC and EC

PSCF analysis was applied to investigate the potential source regions contributing to high carbonaceous aerosol pollution. Figure 7 shows the calculated weighted PSCF results of OC and EC in four seasons in Wanzhou during the study period, the potential source regions of OC and EC presented clear differences in each season.
In spring, OC and EC had common high potential source areas, mainly located in the south and southwest of Wanzhou, and the main urban area of Chongqing.
In summer, the distributions of potential source regions of OC and EC were different, but both were relatively dispersed. The potential source areas of EC were located in the southwest and south of Wanzhou, and the border between western Wanzhou and Sichuan province, as well as Xiangxi Tujia and Miao autonomous prefecture and Zhangjiajie in Hunan province. The high weighted PSCF values of OC were observed in the east of Wanzhou, the southwest of Hubei province and the northwest of Hunan province.
The potential source areas for OC were similar to EC in fall, mainly located in the west of Wanzhou and the eastern margin of Sichuan basin. In addition, the potential source area of OC also included the junction of Enshi in Hubei province and Zhangjiajie in Hunan province.
In winter, OC and EC had common potential source areas, mainly distributed in the north and south of Wanzhou, including Kaizhou district, Liangping district, Fengdu county, and Pengshui country.
In general, the potential source areas of OC and EC in Wanzhou were mainly distributed in local and surrounding districts and counties, the main urban areas of Chongqing, the border between Wanzhou and Sichuan province, the southwest of Hubei province, and the northwest of Hunan province. Overall, carbonaceous pollution at Wanzhou was characterized by significant local contribution from major sources located in or nearby Wanzhou. Therefore, to reduce carbonaceous aerosol pollution in Wanzhou, the local governments will need to enact and implement more stringent measures and policies.

4. Conclusions

Carbonaceous aerosols in ambient PM2.5 were collected and characterized for four consecutive seasons in Wanzhou, a city in the east part of Sichuan Basin. The daily OC concentration in PM2.5 ranged from 0.9 to 80.1 μg∙m−3 with an annual average concentration of 15.5 ± 13.5 μg∙m−3, while the EC concentration ranged from 0.3 to 27.1 μg∙m-3 with an annual average concentration of 5.2 ± 4.7 μg∙m−3. The concentrations of OC and EC were found to be higher in winter and lower in summer. Compared with previous reports, the level of TC in Wanzhou was higher than the result measured from June 2013 to May 2014. This may be due to the more coal consumption and the gradual growth of the vehicle fleet in recent years. The TC concentration in Wanzhou was at a moderate level in Sichuan Basin. The OC and EC concentrations were lower in the spring and summer and much higher in the fall and winter. Based on the (OC/EC) pri method, the estimated SOC concentrations were 5.3, 4.2, 3.0, and 11.2 μg∙m−3, accounting for 37.2%, 46.7%, 26.9%, and 40.7% of the OC in the spring, summer, fall, and winter respectively. The correlation between OC, EC and K+ in fall and winter was significantly higher than that in spring and summer, indicating that biomass combustion may be an important source of OC and EC in fall and winter. PMF analysis indicated that the major sources of OC and EC were mainly from biomass burning and vehicle emission, followed by coal combustion, building and road dust. The potential source areas of OC and EC in Wanzhou were mainly distributed in local and surrounding districts and counties, the main urban areas of Chongqing, the border between Wanzhou and Sichuan province, the southwest of Hubei province, and the northwest of Hunan province.

Author Contributions

Methodology, L.Z. and F.Y.; formal analysis, Y.H. and L.Z.; writing—original draft preparation, Y.H. and L.Z.; supervision, Y.C. and T.L.; funding acquisition, Y.H. and L.Z.; project administration, L.Z., F.Y. and T.L. All authors have read and agreed to the published version of the manuscript.

Funding

This research was funded by the Technology Commission of Chongqing Projects (No. cstc2018jcyjAX0236), the Scientific and Technological Research Program of Chongqing Municipal Education Commission (No. KJQN202001232), Key Laboratory of Water Environment Evolution and Pollution Control in Three Gorges Reservoir (No. WEPKL2019YB-01), and Chongqing Three Gorges University project (No. 19QN03).

Conflicts of Interest

The authors declare no conflict of interest.

References

  1. Yang, F.; He, K.; Ye, B.; Chen, X.; Cha, L.; Cadle, S.H.; Chan, T.; Mulawa, P.A. One-year record of organic and elemental carbon in fine particles in downtown Beijing and Shanghai. Atmos. Chem. Phys. 2005, 5, 1449–1457. [Google Scholar] [CrossRef] [Green Version]
  2. Peng, X.; Hao, Q.; Wen, T.; Ji, D.; Liu, Z.; Wang, Y.; He, X.; Li, X.; Jiang, C. Characteristics of organic carbon and elemental carbon in atmospheric aerosols in the urban area in Beibei, a suburb of Chongqing. Aerosol Air Qual. Res. 2018, 18, 2764–2774. [Google Scholar] [CrossRef]
  3. Hallquist, M.; Wenger, J.C.; Baltensperger, U.; Rudich, Y.; Simpson, D.; Claeys, M.; Dommen, J.; Donahue, N.M.; George, C.; Goldstein, A.H.; et al. The formation, properties and impact of secondary organic aerosol: Current and emerging issues. Atmos. Chem. Phys. 2009, 9, 5155–5236. [Google Scholar] [CrossRef] [Green Version]
  4. Hansen, J.; Sato, M.; Ruedy, R.; Nazarenko, L.; Lacis, A.; Schmidt, G.A.; Russell, G.; Aleinov, I.; Bauer, M.; Bauer, S.; et al. Efficacy of climate forcings. J. Geophys. Res. 2005, 110, 1–45. [Google Scholar] [CrossRef]
  5. Galindo, N.; Yubero, E.; Clemente, A.; Nicolas, J.F.; Navarro-Selma, B.; Crespo, J. Insights into the origin and evolution of carbonaceous aerosols in a mediterranean urban environment. Chemosphere 2019, 235, 636–642. [Google Scholar] [CrossRef]
  6. Shen, Z.; Zhang, Q.; Cao, J.; Zhang, L.; Lei, Y.; Huang, Y.; Huang, R.J.; Gao, J.; Zhao, Z.; Zhu, C.; et al. Optical properties and possible sources of brown carbon in PM2.5 over Xi’an, China. Atmos. Environ. 2017, 150, 322–330. [Google Scholar] [CrossRef]
  7. Shrivastava, M.; Cappa, C.D.; Fan, J.; Goldstein, A.H.; Guenther, A.B.; Jimenez, J.L.; Kuang, C.; Laskin, A.; Martin, S.T.; Ng, N.L.; et al. Recent advances in understanding secondary organic aerosol: Implications for global climate forcing. Rev. Geophys. 2017, 55, 509–559. [Google Scholar] [CrossRef] [Green Version]
  8. Atkinson, R.W.; Analitis, A.; Samoli, E.; Fuller, G.W.; Green, D.C.; Mudway, I.S.; Anderson, H.R.; Kelly, F.J. Short-term exposure to traffic-related air pollution and daily mortality in London, UK. J. Exposure Sci. Environ. Epidemiol. 2016, 26, 125–132. [Google Scholar] [CrossRef] [Green Version]
  9. Mauderly, J.L.; Chow, J.C. Health effects of organic aerosols. Inhalation Toxicol. 2008, 20, 257–288. [Google Scholar] [CrossRef]
  10. Ji, D.; Gao, M.; Maenhaut, W.; He, J.; Wu, C.; Cheng, L.; Gao, W.; Sun, Y.; Sun, J.; Xin, J.; et al. The carbonaceous aerosol levels still remain a challenge in the Beijing-Tianjin-Hebei region of China: Insights from continuous high temporal resolution measurements in multiple cities. Environ. Int. 2019, 126, 171–183. [Google Scholar] [CrossRef]
  11. Li, L.W.; Xiao, Z.M.; Kui, C.; Xu, H.; Peng, L.; Deng, X.W.; Yang, W.; Sun, R. Characteristics of carbonaceous species of PM2.5 in the region of Beijing, Tianjin and Hebei, China. Acta Sci. Circumstantiae 2018, 38, 1306–1316. [Google Scholar]
  12. Wang, G.; Cheng, S.; Li, J.; Lang, J.; Wen, W.; Yang, X.; Tian, L. Source apportionment and seasonal variation of PM2.5 carbonaceous aerosol in the Beijing-Tianjin-Hebei region of China. Environ. Monit. Assess. 2015, 187, 143. [Google Scholar] [CrossRef] [PubMed]
  13. Li, B.; Zhang, J.; Zhao, Y.; Yuan, S.; Zhao, Q.; Shen, G.; Wu, H. Seasonal variation of urban carbonaceous aerosols in a typical city Nanjing in Yangtze River Delta, China. Atmos. Environ. 2015, 106, 223–231. [Google Scholar] [CrossRef]
  14. Chen, D.; Cui, H.; Zhao, Y.; Yin, L.; Lu, Y.; Wang, Q. A two-year study of carbonaceous aerosols in ambient PM2.5 at a regional background site for western Yangtze River Delta, China. Atmos. Res. 2017, 183, 351–361. [Google Scholar] [CrossRef]
  15. Wang, W.; Yu, J.; Cui, Y.; He, J.; Xue, P.; Cao, W.; Ying, H.; Gao, W.; Yan, Y.; Hu, B.; et al. Characteristics of fine particulate matter and its sources in an industrialized coastal city, Ningbo, Yangtze River Delta, China. Atmos. Res. 2018, 203, 105–117. [Google Scholar] [CrossRef]
  16. Duan, J.; Tan, J.; Cheng, D.; Bi, X.; Deng, W.; Sheng, G.; Fu, J.; Wong, M.H. Sources and characteristics of carbonaceous aerosol in two largest cities in Pearl River Delta Region, China. Atmos. Environ. 2007, 41, 2895–2903. [Google Scholar] [CrossRef]
  17. Cao, J.J.; Lee, S.C.; Ho, K.F.; Zou, S.C.; Fung, K.; Li, Y.; Watson, J.G.; Chow, J.C. Spatial and seasonal variations of atmospheric organic carbon and elemental carbon in Pearl River Delta Region, China. Atmos. Environ. 2004, 38, 4447–4456. [Google Scholar] [CrossRef]
  18. Wang, J.; Li, X.; Zhang, W.; Jiang, N.; Zhang, R.; Tang, X. Secondary PM2.5 in Zhengzhou, China: Chemical species based on three years of observations. Aerosol Air Qual. Res. 2017, 16, 91–104. [Google Scholar] [CrossRef] [Green Version]
  19. Ding, X.X.; Kong, L.D.; Du, C.T.; Zhanzakova, A.; Fu, H.B.; Tang, X.F.; Wang, L.; Yang, X.; Chen, J.M.; Cheng, T.T. Characteristics of size-resolved atmospheric inorganic and carbonaceous aerosols in urban Shanghai. Atmos. Environ. 2017, 167, 625–641. [Google Scholar] [CrossRef]
  20. Zhu, C.S.; Cao, J.J.; Tsai, C.-J.; Shen, Z.-X.; Ho, K.-F.; Liu, S.-X. The indoor and outdoor carbonaceous pollution during winter and summer in rural areas of Shaanxi, China. Aerosol Air Qual. Res. 2010, 10, 550–558. [Google Scholar] [CrossRef] [Green Version]
  21. Chen, Y.; Xie, S.; Luo, B.; Zhai, C. Characteristics and origins of carbonaceous aerosol in the Sichuan Basin, China. Atmos. Environ. 2014, 94, 215–223. [Google Scholar] [CrossRef]
  22. Yang, W.; Xie, S.; Zhang, Z.; Hu, J.; Lei, X.; Zhong, L.; Hao, Y.; Shi, F. Characteristics and sources of carbonaceous aerosol across urban and rural sites in a rapidly urbanized but low-level industrialized city in the Sichuan Basin, China. Environ. Sci. Pollut. Res. 2019, 26, 1–18. [Google Scholar] [CrossRef] [PubMed]
  23. Ning, G.; Wang, S.; Ma, M.; Ni, C.; Shang, Z.; Wang, J.; Li, J. Characteristics of air pollution in different zones of Sichuan Basin, China. Sci. Total Environ. 2018, 612, 975–984. [Google Scholar] [CrossRef] [PubMed]
  24. Wang, H.; Shi, G.; Tian, M.; Zhang, L.; Chen, Y.; Yang, F.; Cao, X. Aerosol optical properties and chemical composition apportionment in Sichuan Basin, China. Sci. Total Environ. 2017, 577, 245–257. [Google Scholar] [CrossRef] [PubMed]
  25. Wang, H.; Tian, M.; Chen, Y.; Shi, G.; Liu, Y.; Yang, F.; Zhang, L.; Deng, L.; Yu, J.; Peng, C.; et al. Seasonal characteristics, formation mechanisms and source origins of PM2.5 in two megacities in Sichuan Basin, China. Atmos. Chem. Phys. 2018, 18, 865–881. [Google Scholar] [CrossRef] [Green Version]
  26. Querol, X.; Alastuey, A.; Viana, M.; Moreno, T.; Reche, C.; Minguillón, M.C.; Ripoll, A.; Pandolfi, M.; Amato, F.; Karanasiou, A.; et al. Variability of carbonaceous aerosols in remote, rural, urban and industrial environments in Spain: Implications for air quality policy. Atmos. Chem. Phys. 2013, 13, 6185–6206. [Google Scholar] [CrossRef] [Green Version]
  27. Zhang, L.; Huang, Y.; Liu, Y.; Yang, F.; Lan, G.; Fu, C.; Wang, J. Characteristics of carbonaceous species in PM2.5 in Wanzhou in the hinterland of the Three Gorges Reservior of northeast Chongqing, China. Atmosphere 2015, 6, 534–546. [Google Scholar] [CrossRef] [Green Version]
  28. Peng, C.; Zhai, Q.Z.; Wang, H.B.; Tian, M.; Li, H.L.; Liu, Y.; Fu, C.; Zhang, L.Y.; Yang, F.M. Characterization of organic carbon and elemental carbon in PM2.5 in the urban Wanzhou area in summer and winter. Acta Sci. Circumatantiae 2015, 35, 1638–1644. [Google Scholar]
  29. Huang, Y.; Liu, Y.; Zhang, L.; Peng, C.; Yang, F. Characteristics of carbonaceous aerosol in PM2.5 at Wanzhou in the southwest of China. Atmosphere 2018, 9, 37. [Google Scholar] [CrossRef] [Green Version]
  30. Chongqing Municipal Environmental Protection Bureau. Chongqing Environmental Statement. Available online: http://sthjj.cq.gov.cn/hjzl_249/hjzkgb/201912/P020191228644009739543.pdf (accessed on 28 March 2020).
  31. Ji, D.; Gao, W.; Maenhaut, W.; He, J.; Wang, Z.; Li, J.; Du, W.; Wang, L.; Sun, Y.; Xin, J.; et al. Impact of air pollution control measures and regional transport on carbonaceous aerosols in fine particulate matter in urban Beijing, China: Insights gained from long-term measurement. Atmos. Chem. Phys. 2019, 19, 8569–8590. [Google Scholar] [CrossRef] [Green Version]
  32. Chow, J.C.; Watson, J.G.; Pritchett, L.C.; Pierson, W.R.; Frazier, C.A.; Purcell, R.G. The dri thermal/optical reflectance carbon analysis system: Description, evaluation and applications in U.S. air quality studies. Atmos. Environ. 1993, 27, 1185–1201. [Google Scholar] [CrossRef]
  33. Cao, J.J.; Lee, S.C.; Ho, K.F.; Zhang, X.Y.; Zou, S.C.; Fung, K.; Chow, J.C.; Watson, J.G. Characteristics of carbonaceous aerosol in Pearl River Delta Region, China during 2001 winter period. Atmos. Environ. 2003, 37, 1451–1460. [Google Scholar] [CrossRef]
  34. Ara Begum, B.; Kim, E.; Jeong, C.-H.; Lee, D.-W.; Hopke, P.K. Evaluation of the potential source contribution function using the 2002 Quebec forest fire episode. Atmos. Environ. 2005, 39, 3719–3724. [Google Scholar] [CrossRef]
  35. Ji, D.; Yan, Y.; Wang, Z.; He, J.; Liu, B.; Sun, Y.; Gao, M.; Li, Y.; Cao, W.; Cui, Y. Two-year continuous measurements of carbonaceous aerosols in urban Beijing, China: Temporal variations, characteristics and source analyses. Chemosphere 2018, 200, 191–200. [Google Scholar] [CrossRef]
  36. Chang, Y.; Deng, C.; Cao, F.; Cao, C.; Zou, Z.; Liu, S.; Lee, X.; Li, J.; Zhang, G.; Zhang, Y. Assessment of carbonaceous aerosols in Shanghai, China—Part 1: Long-term evolution, seasonal variations, and meteorological effects. Atmos. Chem. Phys. 2017, 17, 9945–9964. [Google Scholar] [CrossRef] [Green Version]
  37. Chen, W.; Tian, H.; Qin, K. Black carbon aerosol in the industrial city of Xuzhou, China: Temporal characteristics and source appointment. Aerosol Air Qual. Res. 2019, 19, 794–811. [Google Scholar] [CrossRef] [Green Version]
  38. Polissar, A.V.; Hopke, P.K.; Paatero, P.; Kaufmann, Y.J.; Hall, D.K.; Bodhaine, B.A.; Dutton, E.G.; Harris, J.M. The aerosol at Barrow, Alaska: Long-term trends and source locations. Atmos. Environ. 1999, 33, 2441–2458. [Google Scholar] [CrossRef]
  39. Zhao, S.; Yu, Y.; Yin, D.; Qin, D.; He, J.; Dong, L. Spatial patterns and temporal variations of six criteria air pollutants during 2015 to 2017 in the city clusters of Sichuan Basin, China. Sci. Total Environ. 2018, 624, 540–557. [Google Scholar] [CrossRef]
  40. Chen, Y.; Wenger, J.C.; Yang, F.; Cao, J.; Huang, R.; Shi, G.; Zhang, S.; Tian, M.; Wang, H. Source characterization of urban particles from meat smoking activities in Chongqing, China using single particle aerosol mass spectrometry. Environ. Pollut. 2017, 228, 92–101. [Google Scholar] [CrossRef]
  41. Chen, Y.; Xie, S.D. Long-term trends and characteristics of visibility in two megacities in southwest China: Chengdu and Chongqing. J. Air Waste Manag Assoc. 2013, 63, 1058–1069. [Google Scholar] [CrossRef]
  42. Li, L.; Tan, Q.; Zhang, Y.; Feng, M.; Qu, Y.; An, J.; Liu, X. Characteristics and source apportionment of PM2.5 during persistent extreme haze events in Chengdu, southwest China. Environ. Pollut. 2017, 230, 718–729. [Google Scholar] [CrossRef] [PubMed]
  43. Seinfeld, J.H.; Pandis, S.N.; Noone, K. Atmospheric Chemistry and Physics: From Air Pollution to Climate Change; Wiley: Hoboken, NJ, USA, 2006; p. 114. [Google Scholar]
  44. Zhao, L.; Lu, Q.M.; Li, L.; Luo, Y.Z.; Yang, Q.L.; Chen, G.C. Chemical characteristics of atmospheric precipitation at Wanzhou district of Chongqing. Environ. Ecol. Three Gorges 2013, 35, 9–15. [Google Scholar]
  45. Duan, F.; He, K.; Ma, Y.; Jia, Y.; Yang, F.; Lei, Y.; Tanaka, S.; Okuta, T. Characteristics of carbonaceous aerosols in Beijing, China. Chemosphere 2005, 60, 355–364. [Google Scholar] [CrossRef] [PubMed]
  46. Wu, C.; Ng, W.M.; Huang, J.; Wu, D.; Yu, J.Z. Determination of elemental and organic carbon in PM2.5 in the Pearl River Delta Region: Inter-Instrument (Sunset vs. DRI Model 2001 Thermal/Optical Carbon Analyzer) and inter-protocol comparisons (IMPROVE vs. ACE-Asia Protocol). Aerosol Sci. Technol. 2012, 46, 610–621. [Google Scholar] [CrossRef] [Green Version]
  47. National Bureau of Statistics Chongqing Investigation Team. Chongqing Statistical Yearbook. 2017. Available online: http://tjj.cq.gov.cn//tjnj/2017/indexch.htm (accessed on 6 May 2018).
  48. Zhao, P.; Dong, F.; Yang, Y.; He, D.; Zhao, X.; Zhang, W.; Yao, Q.; Liu, H. Characteristics of carbonaceous aerosol in the region of Beijing, Tianjin, and Hebei, China. Atmos. Environ. 2013, 71, 389–398. [Google Scholar] [CrossRef]
  49. Wu, C.; Wu, D.; Yu, J.Z. Estimation and uncertainty analysis of secondary organic carbon using one-year of hourly organic and elemental carbon data. J. Geophys. Res. Atmos. 2019, 124. [Google Scholar] [CrossRef]
  50. Zhang, Y.H.; Wang, D.F.; Zhang, Q.B.; Cui, H.X.; Li, J.; Duan, Y.S.; Fu, Q.Y. Characteristics and sources of organic carbon and elemental carbon in PM2.5 in Shanghai urban area. Environ. Sci. 2014, 35, 3263–3270. [Google Scholar]
  51. Niu, Z.; Zhang, F.; Chen, J.; Yin, L.; Wang, S.; Xu, L. Carbonaceous species in PM2.5 in the coastal urban agglomeration in the Western Taiwan Strait Region, China. Atmos. Res. 2013, 122, 102–110. [Google Scholar] [CrossRef]
  52. Lim, H.J.; Turpin, B.J. Origins of primary and secondary organic aerosol in Atlanta: Results of timeresolved measurements during the Atlanta supersite experiment. Environ. Sci. Technol. 2002, 36, 4489–4496. [Google Scholar] [CrossRef]
  53. Na, K.; Sawant, A.A.; Song, C.; Cocker, D.R. Primary and secondary carbonaceous species in the atmosphere of Western Riverside County, California. Atmos. Environ. 2004, 38, 1345–1355. [Google Scholar] [CrossRef]
  54. Cao, J.J.; Lee, S.C.; Chow, J.C.; Watson, J.G.; Ho, K.F.; Zhang, R.J.; Jin, Z.D.; Shen, Z.X.; Chen, G.C.; Kang, Y.M.; et al. Spatial and seasonal distributions of carbonaceous aerosols over China. J. Geophys. Res. 2007, 112. [Google Scholar] [CrossRef] [Green Version]
  55. Watson, J.G.; Chow, J.C.; Houck, J.E. PM2.5 chemical source profiles for vehicle exhaust, vegetative burning, geological material, and coal burning in Northwestern Colorado during 1995. Chemosphere 2001, 43, 1141–1151. [Google Scholar] [CrossRef]
  56. Tao, J.; Zhang, L.; Engling, G.; Zhang, R.; Yang, Y.; Cao, J.; Zhu, C.; Wang, Q.; Luo, L. Chemical composition of PM2.5 in an urban environment in Chengdu, China: Importance of springtime dust storms and biomass burning. Atmos. Res. 2013, 122, 270–283. [Google Scholar] [CrossRef]
  57. Sahu, L.K.; Kondo, Y.; Miyazaki, Y.; Pongkiatkul, P.; Kim Oanh, N.T. Seasonal and diurnal variations of black carbon and organic carbon aerosols in Bangkok. J. Geophys. Res. 2011, 116, 1–14. [Google Scholar] [CrossRef]
  58. Chow, J.C.; Watson, J.G. Guideline on Speciated Particulate on Monitoring; US EPA: Washington, DC, USA, 1998; pp. 4–37.
  59. Andreae, M.O.; Merlet, P. Emission of trace gases and aerosols from biomass burning. Global Biogeochem. Cycles 2001, 15, 955–966. [Google Scholar] [CrossRef] [Green Version]
  60. Turpin, B.J.; Cary, R.A.; Huntzicker, J.J. An In Situ, Time-Resolved Analyzer for Aerosol Organic and Elemental Carbon. Aerosol Sci. Technol. 1990, 12, 161–171. [Google Scholar] [CrossRef]
  61. Turpin, B.J.; Huntzicker, J.J. Secondary formation of organic aerosol in the Los Angeles basin: A descriptive analysis of organic and elemental carbon concentrations. Atmos. Environ. 1991, 25, 207–215. [Google Scholar] [CrossRef]
  62. Pandis, S.N.; Harley, R.A.; Cass, G.R.; Seinfeld, J.H. Secondary organic aerosol formation and transport. Atmos. Environ. 1992, 26, 2269–2282. [Google Scholar] [CrossRef]
  63. Castro, L.M.; Pio, C.A.; Harrison, R.M.; Smith, D.J.T. Carbonaceous aerosol in urban and rural European atmospheres: Estimation of secondary organic carbon concentrations. Atmos. Environ. 1999, 33, 2771–2781. [Google Scholar] [CrossRef]
  64. Begum, B.A.; Hossain, A.; Nahar, N.; Markwitz, A.; Hopke, P.K. Organic and black carbon in PM2.5 at an urban site at Dhaka, Bangladesh. Aerosol Air Qual. Res. 2012, 12, 1062–1072. [Google Scholar] [CrossRef] [Green Version]
  65. Day, M.C.; Zhang, M.; Pandis, S.N. Evaluation of the ability of the EC tracer method to estimate secondary organic carbon. Atmos. Environ. 2015, 112, 317–325. [Google Scholar] [CrossRef]
  66. Kaskaoutis, D.G.; Grivas, G.; Theodosi, C.; Tsagkaraki, M.; Paraskevopoulou, D.; Stavroulas, I.; Liakakou, E.; Gkikas, A.; Hatzianastassiou, N.; Wu, C.; et al. Carbonaceous aerosols in contrasting atmospheric environments in Greek Cities: Evaluation of the EC-tracer methods for secondary organic carbon estimation. Atmosphere 2020, 11, 161. [Google Scholar] [CrossRef] [Green Version]
  67. Hennigan, C.J.; Miracolo, M.A.; Engelhart, G.J.; May, A.A.; Robinson, A.L. Chemical and physical transformations of organic aerosol from the photo-oxidation of open biomass burning emissions in an environmental chamber. Atmos. Chem. Phys. 2011, 11, 7669–7686. [Google Scholar] [CrossRef] [Green Version]
  68. Wang, B.L.; Liu, Y.; Shao, M.; Lu, S.H.; Wang, M.; Yuan, B.; Gong, Z.H.; He, L.Y.; Zeng, L.M.; Hu, M. The contributions of biomass burning to primary and secondary organics: A case study in Pearl River Delta (PRD), China. Sci. Total Environ. 2016, 569–570, 548–556. [Google Scholar] [CrossRef]
  69. Zhang, W.; Ji, Y.Q.; Zhang, J.; Zhang, L.; Wang, W.; Wang, S.B. Characteristics and source apportionment of water-soluble inorganic ions in road dust PM2.5 in selected cities in Liaoning province. Environ.Sci. 2017, 38, 4951–4957. [Google Scholar]
Figure 1. Location of the sampling site in Wanzhou.
Atmosphere 11 01286 g001
Figure 2. Time series of day-averaged organic carbon (OC), elemental carbon (EC) and OC/EC ratio in Wanzhou from 8 April 2016 to 16 February 2017.
Atmosphere 11 01286 g002
Figure 3. The relationship between OC and EC.
Atmosphere 11 01286 g003
Figure 4. Linear regression between OC, EC and K+ in Wanzhou.
Atmosphere 11 01286 g004
Figure 5. Seasonal secondary OC (SOC) concentrations and SOC/OC ratios in Wanzhou.
Atmosphere 11 01286 g005
Figure 6. The contribution of the five sources identified by the PMF model.
Atmosphere 11 01286 g006
Figure 7. Potential source areas for OC and EC in the four seasons in Wanzhou.
Atmosphere 11 01286 g007
Table 1. Comparison of OC and EC concentrations (μg∙m−3), OC/EC ratio at Wanzhou with results from other cities in China.
Sampling Site.PeriodOCECOC/ECTCReference
WanzhouSpring, 201613.6 ± 4.64.5 ± 1.73.2 ± 1.018.1 ± 6.0This study
Summer, 20168.7 ± 2.52.8 ± 0.83.2 ± 0.811.5 ± 3.0
Fall, 201611.0 ± 7.14.1 ± 2.42.9 ± 1.015.1 ± 9.5
Winter, 201628.8 ± 20.39.5 ± 7.53.4 ± 1.038.2 ± 26.9
Annual15.5 ± 13.55.2 ± 4.73.2 ± 0.920.7 ± 17.8
Wanzhou18 June 2013–31 May 201413.163.124.2216.28[29]
ChongqingMay 2012–April 201315.2 ± 8.44.0 ± 1.63.8 ± 1.219.2[21]
Chengdu19.0 ± 13.34.6 ± 2.6 4.3 ± 1.523.6
Neijiang18.3 ± 8.44.1 ± 1.84.6 ± 1.122.4
Nanchong,
Sichuan
May 2015–April 201610.1 ± 7.83.1 ± 3.35.0 ± 4.013.2[22]
ShijiazhuangJuly 2015–April 201618.1 ± 17.46.9 ± 4.52.625.0[11]
Tianjin13.1 ± 9.15.3 ± 2.92.518.4
Baoding28.5 ± 37.37.9 ± 5.53.636.4
BeijingApril 2009–February 201018.26.32.924.5[48]
GuangzhouFebruary 2012–January 20137.30 ± 5.682.67 ± 2.282.96±1.019.97±7.81[49]
ShanghaiJune 2010–May 20118.6 ± 6.22.4 ± 1.33.611.0[50]
WTSRNovember 2010, January, April, August 201112.7 ± 4.32.3 ± 0.95.515.0[51]
Table 2. One-way ANOVA for OC and EC on seasonal variables.
OCEC
Sum of Squaresdf 1Mean SquareF-Ratio 2p-Value 3Sum of SquaresdfMean SquareF-Ratiop-Value
Between Groups7384.4632461.4920.120.00764.393254.7915.720.00
Within Groups14,195.17116122.37 1880.5411616.21
Total21,579.63119 2644.93119
1 df = degree of freedom. 2 F-ratio = F test. 3 p-value = significance value for F test.
Publisher’s Note: MDPI stays neutral with regard to jurisdictional claims in published maps and institutional affiliations.

