Article

New Record of Dust Input and Provenance During Glacial Periods in Western Australia Shelf (IODP Expedition 356, Site U1461) from the Middle to Late Pleistocene

by
Margot Courtillat
1,2,*,
Maximilian Hallenberger
3,
Maria-Angela Bassetti
1,2,
Dominique Aubert
1,2,
Catherine Jeandel
4,
Lars Reuning
5,
Chelsea Korpanty
6,
Pierre Moissette
7,8,
Stéphanie Mounic
9 and
Mariem Saavedra-Pellitero
10,11
1
Centre de Formation et de Recherche sur les Environnements Méditerranéens, Université de Perpignan Via Domitia, UMR 5110, 52 Avenue Paul Alduy, CEDEX, F-66860 Perpignan, France
2
CNRS, Centre de Formation et de Recherche sur les Environnements Méditerranéens, UMR 5110, 52 Avenue Paul Alduy, CEDEX, F-66860 Perpignan, France
3
Energy & Mineral Resources Group, Geological Institute Wüllnerstr. 2, RWTH Aachen University, 52052 Aachen, Germany
4
Observatoire Midi-Pyrénées, LEGOS (Université de Toulouse, CNRS/CNES/IRD/UPS), 14 avenue Edouard Belin, 31400 Toulouse, France
5
Institute of Geosciences, CAU Kiel, Ludewig-Meyn-Straße 10, 24118 Kiel, Germany
6
MARUM Center for Marine Environmental Sciences, University of Bremen, Leobener Str. 8, 28359 Bremen, Germany
7
Department of Historical Geology & Palaeontology, Faculty of Geology and Geoenvironment, National and Kapodistrian University of Athens, 15784 Athens, Greece
8
Département Origines et Evolution, Muséum National d’Histoire Naturelle, UMR7207 CR2P, 8 rue Buffon, 75005 Paris, France
9
Géosciences-Environnement Toulouse, Université de Toulouse, UPS (SVT-OMP), CNRS, IRD, 31400 Toulouse, France
10
Department of Geosciences, University of Bremen, Klagenfurter Strasse Bremen, 28359 Bremen, Germany
11
School of Geography, Earth and Environmental Sciences, University of Birmingham, Birmingham B15 2TT, UK
*
Author to whom correspondence should be addressed.
Atmosphere 2020, 11(11), 1251; https://doi.org/10.3390/atmos11111251
Submission received: 29 September 2020 / Revised: 12 November 2020 / Accepted: 17 November 2020 / Published: 20 November 2020
(This article belongs to the Special Issue Paleoclimate and Its Connection with Future Climate Change)

Abstract

:
International Ocean Discovery Program (IODP) Expedition 356 Site U1461 represents one of the few records from the North West Australian shelf that provides information about aridity fluctuations in Australia during the Quaternary. A combination of chronostratigraphic indicators revealed the (partial) preservation of two major glaciations (Marine Isotope Stage (MIS) 2 and MIS 12) in the sedimentary record. The faunal content (mainly benthic foraminifera, corals and bryozoans) was analyzed to estimate paleo-environments and paleo-depths in order to determine if these sediments have been remobilized by reworking processes. Despite the occurrence of a depositional hiatus (including MIS 5d to MIS 9-time interval), the excellent preservation of faunal content suggests that the preserved sediment is in situ. The geochemical composition of the sediments (Nd and major elements) indicates that during MIS 12 riverine input was likely reduced because of enhanced aridity, and the sediment provenance (mainly atmospheric dust) is likely in the central (Lake Eyre) or eastern (Murray Darling Basin) parts of the Australian continent. MIS 2 is confirmed to be one of the driest periods recorded in Australia but with mixed dust sources from the eastern and western parts of the continent. More humid conditions followed the glacial maximum, which might correspond to the peak of the Indian-Australian Summer Monsoon.

1. Introduction

Australia is currently the driest inhabited continent with approximately half of its landmass classified as arid or semiarid [1]. It is then normal that Australia is considered as a huge source of airborne dust and that there has been a lot of interest in its climatic change [2].
During the Quaternary, the Australian climate fluctuated in accordance with the global glacial cycles. However, the amplitude and intensity of these fluctuations and their influence on regional climate are poorly defined, especially prior to the Last Glacial Maximum (LGM-20 ky ca) [3,4,5]. Recently, several studies have focused on characterizing the climate variability of northwestern Australia with emphasis on the Australian Summer Monsoon (ASM). The ASM is one of the largest monsoon systems comparable in intensity to the Indian Monsoon [6], and the Asian Monsoon [7,8]. However, depending on the geographical position, the Australian continent can also experience the influence of the westerlies that control the amount of winter rainfall in the south and the monsoon in the north [9].
Paleoclimate proxies from both continental and marine records [10,11] indicate that wet and dry phases alternated during the Quaternary in Australia. The western side of the continent was interpreted to be relatively arid during the glacial stages and humid during the interglacial stages [12,13], contrasting to what is classically observed for the southern hemisphere climate variability at other locations of the same latitude (≈20° S) [14,15,16].
Presently, increased dust transport during glacial periods is well-documented in the Southern Pacific Ocean [17], the Southern Atlantic Ocean [18], and in Antarctica [19] over the last 800 ky, but records for the Indian Ocean and especially in the eastern part are poorly known despite the interest for reconstructing the variability of atmospheric dynamics over the Australia continent. As an example, Stuut et al., (2014) [12], near North West Cape, demonstrated an increase of the trade-wind intensities based on the size of the aeolian particles and the Zr/Fe ratio during the glacial stages.
The knowledge of Quaternary dust processes in Australia concluded that there are two general dust transport pathways over the southeast and northwest coasts of the continent still active today [20,21,22,23,24]. The southeast dust path has been studied extensively [21,22,23,25,26,27,28]. Contrastingly, few studies have investigated the northwest dust path to the Indian Ocean [10,12,29,30,31,32]. Even if the records are scarce, some studies have attempted to elucidate the source of the transported dust from the northwestern path. Karlson et al., (2014) [32] show through chemical characterization and particle size analysis, that the northwestern dust pathway may have a central Australian source, and that during summer it could expand as far north as Indonesia and the southern Philippines.
In order to better understand the Australian climate patterns spanning Quaternary glacial periods and the provenance of the dust for the western part of Australia, we focused on a new sedimentary record that is (1) sufficiently expanded to identify the main global climate cycles; (2) sufficiently shallow to effectively register the input of terrestrial fluxes but without the influence of marine currents; (3) sufficiently long (temporally) to provide data prior to MIS 2. IODP Expedition 356 Site U1461 fulfills these requirements as it yields the signature of terrestrial fluxes (by rivers or by winds), despite occasional erosional phenomena. In this study, multiple glacial (MIS 2, MIS 12) and interglacial (MIS 1, MIS 11) stages were identified at Site U1461, and a multiproxy approach was used to characterize the provenance of land-derived sediments and their possible pathways to the sea. This approach yields a better understanding of the wind effect on westerly dust transport in relation to continental aridity variability. In order to assess terrestrial sediment fluxes, provenances, and pathways, the impact of sea level change on shelf sedimentation was assessed using benthic foraminifera assemblages combined with the occurrences of azooxanthellate solitary corals and bryozoans. Together, the preservation (taphonomy) and ecological data from this fauna provide information about the paleo-environment, bathymetry, and (sediment particle) reworking rates during sea level lowstands. Additionally, the timing, extent, and intensity of the Southern Hemisphere atmospheric circulation was evaluated using geochemical proxies (εNd, REE, and relative content of major chemical elements such as Zr, Ti, Ca, Al, and K) to trace possible sources for terrigenous input from the Australian continent.

2. Experiments

(All the depths are in CSF-A: core depth below sea floor.)

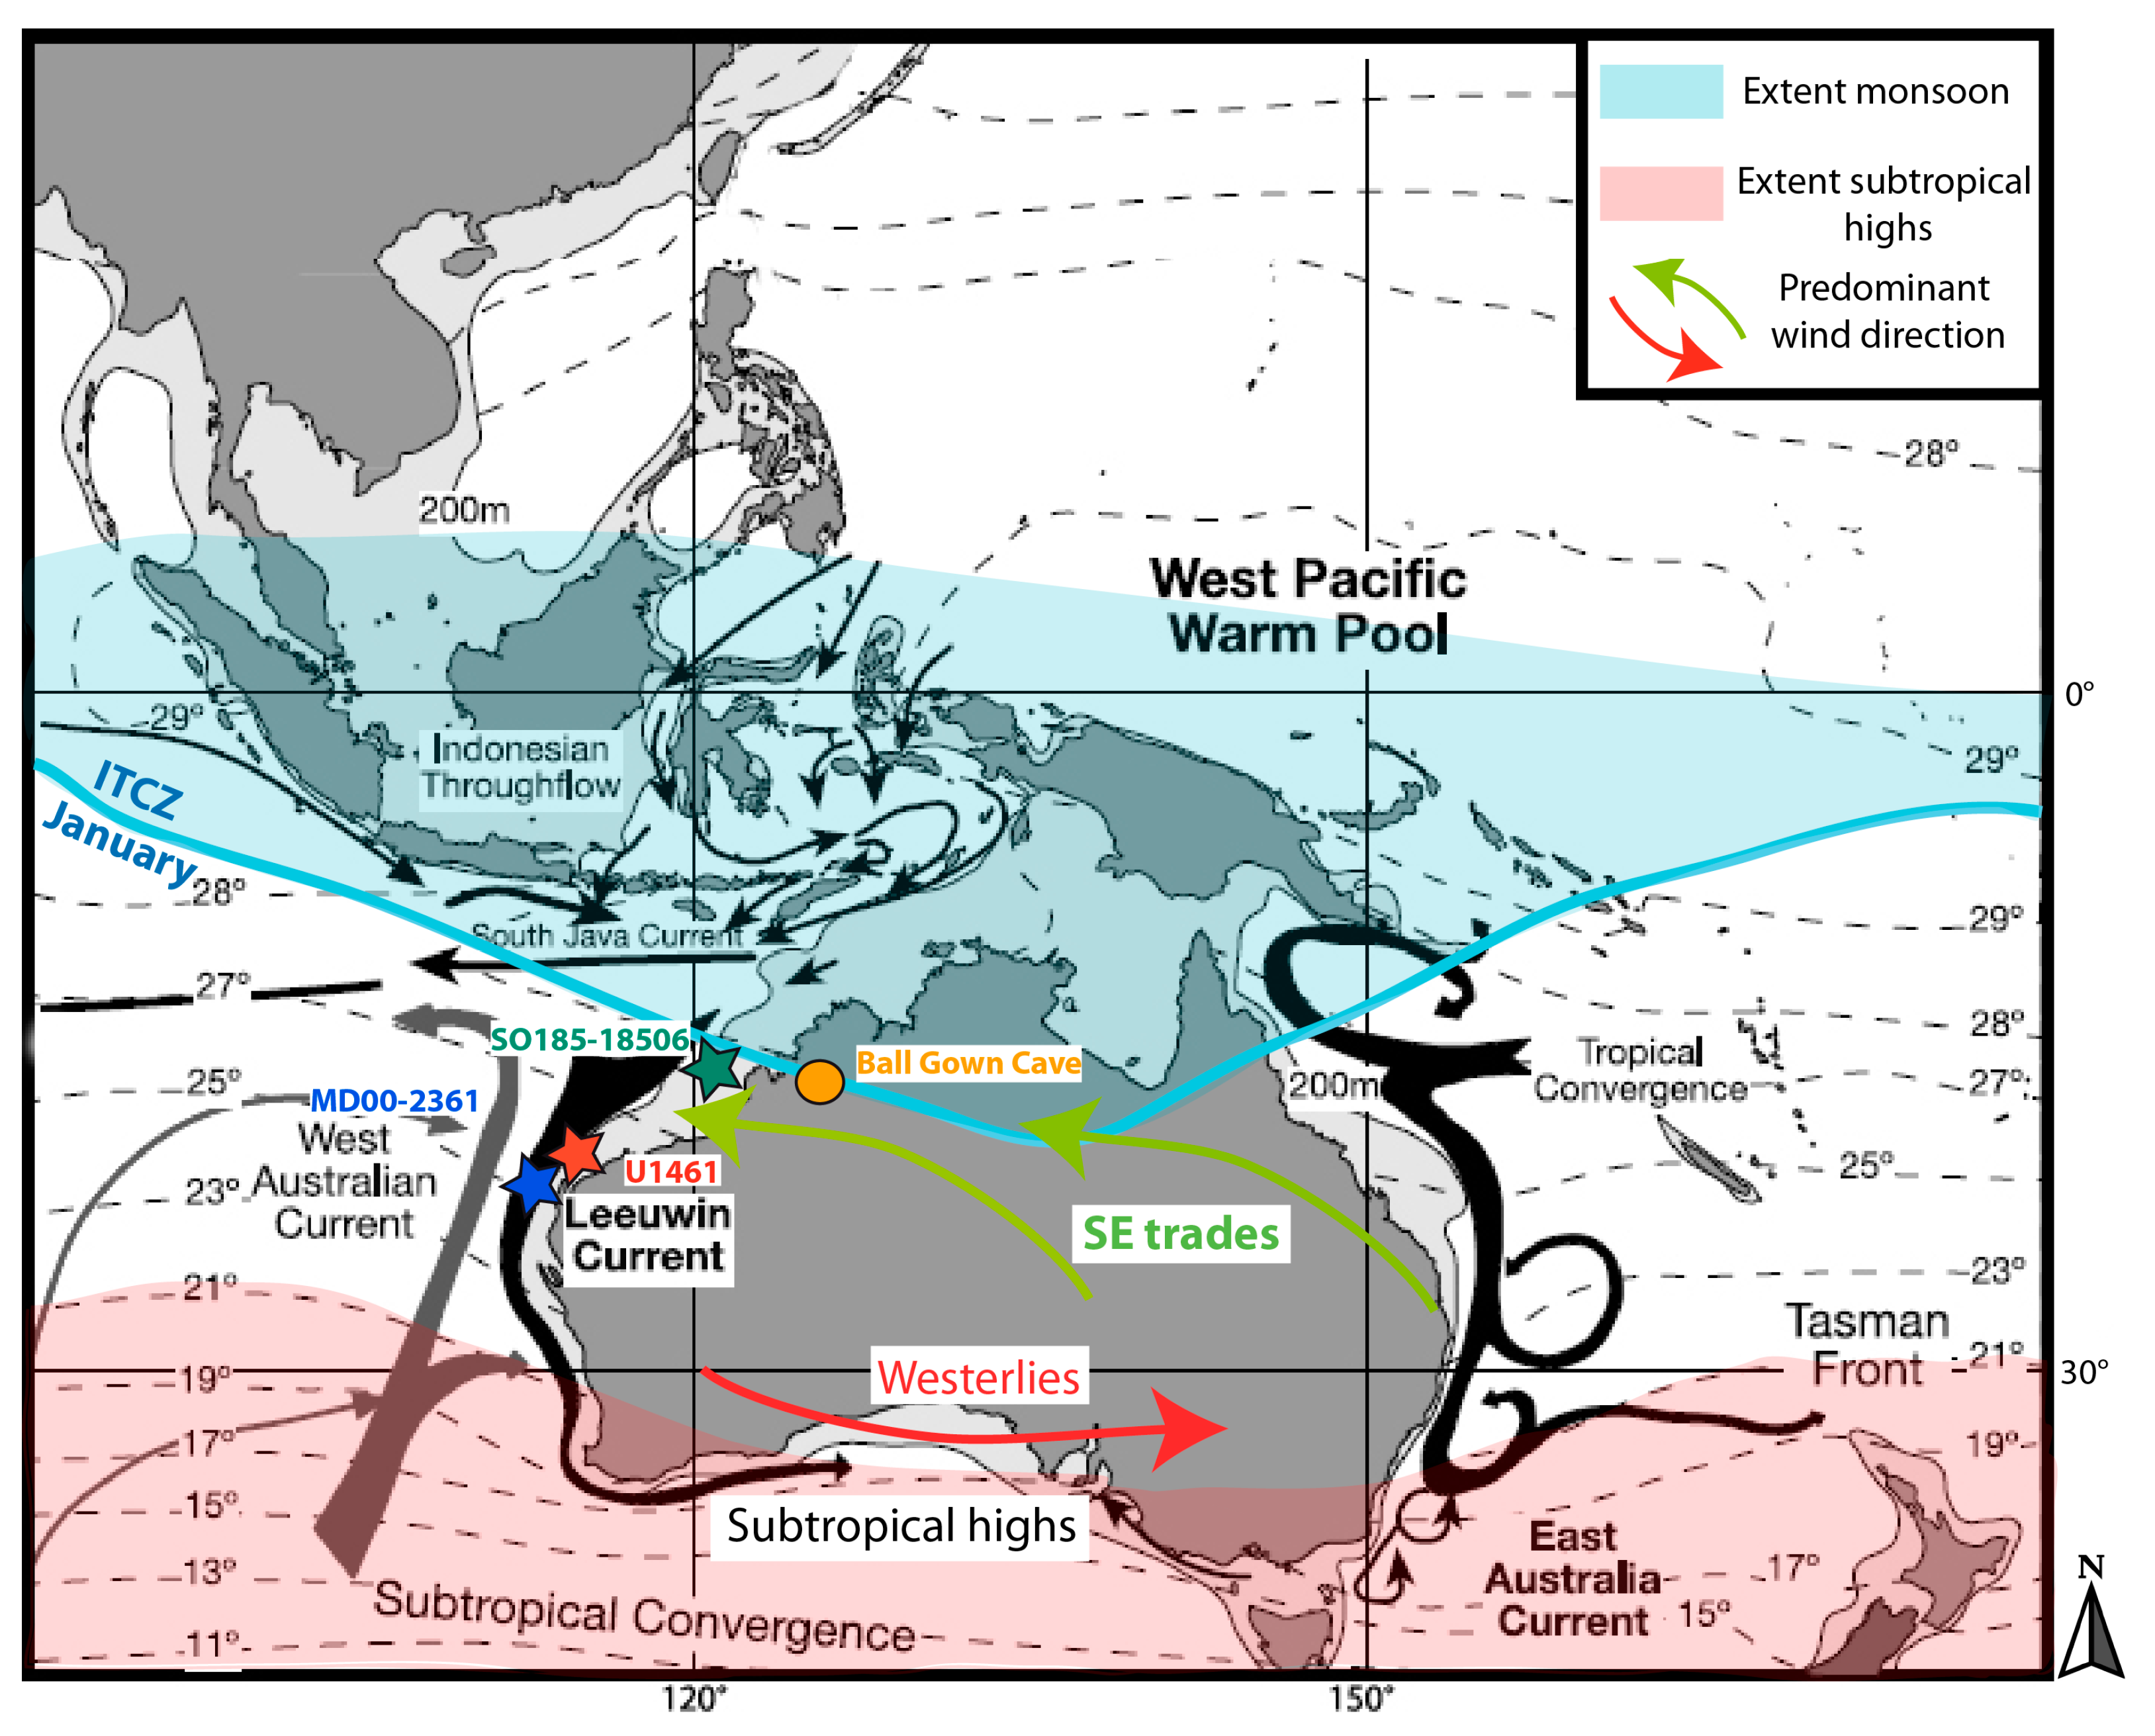
2.1. Regional Settings

The studied borehole (Site U1461) is situated in the northwestern sector of the Australian continental shelf (Figure 1), which is dominated by the Indonesian Throughflow (ITF) that connects the Indo-Pacific Warm Pool (IPWP) with the Indian Ocean and the Western Australian shelf [33]. A part of the ITF is incorporated into the Leeuwin Current (LC), which is a warm, oxygen-rich, low-salinity current that flows southerly along the western Australian coast for more than 5500 km at a speed of 0.45 m/s. The LC is suspected to play an important role in the local climate [34,35]. In addition to its intensity varying with the seasonality of surface winds, the LC experiences strong surface heat loss (evaporative cooling) as it travels southward, which induces strong vertical mixing and thereby affects the vertical stratification of surface productivity on the Australian continental shelf [36].
The climate of Australia is mainly arid. However, depending on the geographical position, the Australian continent can also experience the influence of the westerlies that control the amount of winter rainfall in the south and the monsoon in the north [9]. The ASM or more precisely the quasi-monsoon [37] primarily influences the northern coast of Queensland, whereas the westerlies have a strong impact in the south. Between 25° S and 27° S the climate is not dominated by a single climatic system. In fact, the westerlies decrease to the North while the influence of the monsoon decreases to the South such as the center of the continent has low precipitation but is weakly influenced by both systems according to the seasonal movement of the zonal circulation. There the weather appears to be driven by the complex interaction between local atmospheric circulation and land–sea temperature contrasts [38]. As a result, the climate in northwestern Australia is influenced by the ASM with strong rainfall seasonality, whereas the southern part of the Australian continent experiences dry and hot summers [39]. Rainfall is more important in the cool winter months when the subtropical highs (or subtropical ridges) move to the north and the cold fronts embedded in the westerly circulation bring moisture over the continent [39,40].

2.2. Study Site

This study is based on a multiproxy analysis of the uppermost 65 m of Site U1461, Hole A (20°12.8634′ S, 115°03.9495′ E; 127.18 m water depth) retrieved on the northwest shelf of Australia (Northern Carnarvon Basin) in August 2015 during IODP Expedition 356 (on board JOIDES Resolution). The sediment spans from lithologic Unit I to the top of Subunit IIc because the bottom of Subunit IIb is 63.7 m CSF-A. Unit I (0–11 m) is characterized by unlithified greenish-gray to brown packstone, with glauconitic grains present in the uppermost part of the unit. Unit II (11–284.7 m) is defined by the alternation of unlithified beds of packstone, wackestone, and mudstone. Unit II is divided into six subunits, all of which (except Subunit IIa, 11–39.50 m), consist of two intervals that alternate between an upper, darker-colored wackestone to packstone interval and a lower, light-colored mudstone to wackestone interval. Unit II is also characterized by the presence of non-skeletal grains in the lower part of the subunit (white cream wackestone) [44]. Despite a lack of evidence for erosion or sediment reworking, a sedimentary hiatus has been identified at 15 m based on established ages (see age model discussion) [13,45]. There is also a lack of sediment recovery between 54.5 and 57.2 m.

2.3. Age Model

The age assessment for the uppermost 14 m was established using 18 radiometric 14C dates [13,45]. These radiometric dates were measured on samples retrieved from U1461 Hole C, a depth projection between Hole A and Hole C was then necessary. The depth difference between these two holes is 0.22 m, so this 0.22 m was subtracted from CSF-A in Hole C to obtain the corresponding CSF-A in Hole A.
The age model for the deeper samples was estimated through the relative abundance of the tropical planktonic foraminifera Globorotalia menardii and their δ18O values. The abundance of G. menardii was calculated in the >150 µm sediment fraction and normalized per gram. Due to its subtropical affinity, an elevated abundance of G. menardii is considered to indicate interglacial climate conditions [46]. This proxy is correlated to the oxygen isotope ratios to validate its ecological information. The oxygen isotope ratios were used for comparison to the LR04 reference data [47] to establish the chronology of glacial/interglacial alternation. The δ18O measurements (n = 70) were performed using a Finnigan MAT 253 mass spectrometer connected to a Kiel IV carbonate preparation device at the Leibniz Laboratory, University of Kiel (Germany). Isotope data is reported in standard δ-notation versus Vienna Pee Dee Belemnite (VPDB). The standard deviation was determined to be between 0.01 and 0.07‰. Analytical precision of analyses on stable isotopes is <±0.08‰ for δ18O and <±0.05‰ for δ13C.
To further constrain shipboard calcareous nannofossils biostratigraphy [44], 20 smear-slides were prepared following IODP standard procedures. Calcareous nannofossils were examined with a Leica DMRM polarized light microscope at 1000× magnification. Calcareous nannofossils were classified following Raffi et al., (2006) [48]. Bio-event ages were assigned based on the presence or absence of calcareous nannofossils markers. In addition, scanning electron microscope observations were performed on selected samples.

2.4. Fossil Assemblages

A total of 73 samples (20 cm3 for each sample) were analyzed for benthic foraminifera, planktonic foraminifera, solitary azooxanthellate coral, and bryozoan content. Samples were wet-sieved to separate the <63 µm fraction for the geochemistry. Residues were dried and then the >63 µm was dry-sieved using a 150 µm mesh screen. Benthic foraminifera, corals and bryozoans were hand-picked and identified using a binocular microscope in the >150 µm fraction. Planktonic foraminifera were counted but not identified, except for the G. menardii species.
All specimens of benthic foraminifera were identified [41,49,50,51] and clustered into seven groups using the Ward’s clustering method in the software Past [52]. This method groups species based on the similarity of their abundances. The Ward’s method results were corroborated using principal component analysis (PCA). The percentage of each cluster was calculated by adding the percentage of all the species within a cluster.
Benthic foraminifera assemblages were used as paleo-environmental markers, especially for estimating the amplitude of sea-level changes, based on the biofacies (preferred water depth habitats). No quantitative method was applied. The estimation was qualitative: the abundance of one or several species gives clues to depth on the basis of modern foraminifera distribution [53,54]. Those benthic foraminifera assemblages are related to the bryozoan and coral occurrences as well as the abundance of G. menardii to identify the interglacial stages with greater confidence.

3. Dust Proxies

Based on age, a subset of 18 fine-grained samples (<63 µm fraction) was selected for Nd isotope analysis by thermal ionization mass spectrometry (TIMS) and trace elements analysis by inductively coupled plasma mass spectrometry (ICP-MS).
About 40 mg of sediment (<63 µm) was mineralized in a mixture of concentrated HNO3 + HF (1/1 v/v). Following this digestion and further dissolution in 0.5 mL HNO3, organic matter degradation was performed by adding 0.6 mL of H2O2. After complete digestion and evaporation, the samples were dissolved again in concentrated HNO3. An aliquot of 0.5 mL of each sample solution was further diluted for ICP-MS trace elements analysis [55]. The remaining solution was used for Nd separation chemistry.
For the isotopic analyses, Nd was separated by conventional ion exchange techniques (Tru Spec, Ln column), and then analyzed for isotopic composition using a Finnigan MAT 261 TIMS at the Laboratory Géosciences Environnement Toulouse (France). Six runs of La Jolla standard yielded 143Nd/144Nd of 0.511846 ± 11 × 10−6. The ε Nd is calculated following this equation:
ε Nd = ( ( 143 Nd 144 Nd ) sample ( 143 Nd 144 Nd ) CHUR 1 ) × 10 4   with   ( 143 Nd / 144 Nd ) CHUR   =   0.512638 ,   CHUR   =   Chondritic
Unfractionated Reservoir defined by [56].
The study of rare earth elements and yttrium (REY) in marine sediments reflect as a whole the original characteristics of the seawater. The yttrium/holmium ratio is generally high in seawater (44–74), whereas volcanic ash and terrigenous material have a nearly constant ratio close to 28 [57]. The Y/Ho ratio is therefore used to fingerprint terrigenous material inputs.
X-ray fluorescence scanning was performed at the JRSO XRF Core Scanning Facility with an Avaatech XRF core scanner located at the Gulf Coast Repository in the Texas A&M University Research Park. These scans were performed with a resolution of 5 cm. There is a gap in the record between 54.5 and 57.2 m due to the lack of sediment recovery during the drilling.
The XRF data were used to determine the continental humidity (K) and to distinguish between aeolian and fluvial input of terrestrial material using selected trace elements as follows.
The ratio of Ti/Ca is commonly used to fingerprint terrestrial input relative to marine biogenic sediment [58] because titanium is inert against diagenesis alteration and related to siliciclastic sedimentary components. Thus, the Ti/Ca log ratio is used as an indicator for variations of the relative proportions of terrestrial and carbonate sedimentation.
The log (Zr + Fe + Ti)/(Al + K) is used to distinguish between terrigenous material transported by aeolian and fluvial means since potassium (K) and aluminum (Al) occur preferentially in river-transported fine-grained clay, whereas zirconium (Zr), titanium (Ti), and iron (Fe) are present in larger and/or heavier wind-blown grains from the Australian desert. Ti and Zr are well known to be the main components of heavy minerals such as zircon, and Fe is a major constituent of dust [22,57,58]. The iron oxides usually form a red coating on quartz grains from the Australian deserts and occur in aeolian deposits from soils of the Australian arid zones [12,59,60,61].
The log(Zr/Fe) at Site U1461 was also used as a proxy for the proportion of the river mud versus aeolian dust input [11,12].
The natural gamma radiation (NGR) was measured on board during the expedition at a 20 cm resolution in Hole U1461A [44]. The openly available MATLAB algorithm by [62] was used to decompose the NGR energy spectra and quantify the K (wt%), U (ppm), and Th (ppm) contents. The amount of potassium present on the North Western Shelf (NWS) is known to indicate the presence of fluvial-derived clays and K-feldspar and thus represents a proxy for continental moisture and precipitations variability [63,64]. The U concentration (ppm) was used as a proxy for aridity in this region at Site U1463 by Christensen et al. (2017) since the U-bearing igneous rocks on the Australian continent [65] are particularly exposed to erosion during dry periods.

4. Results

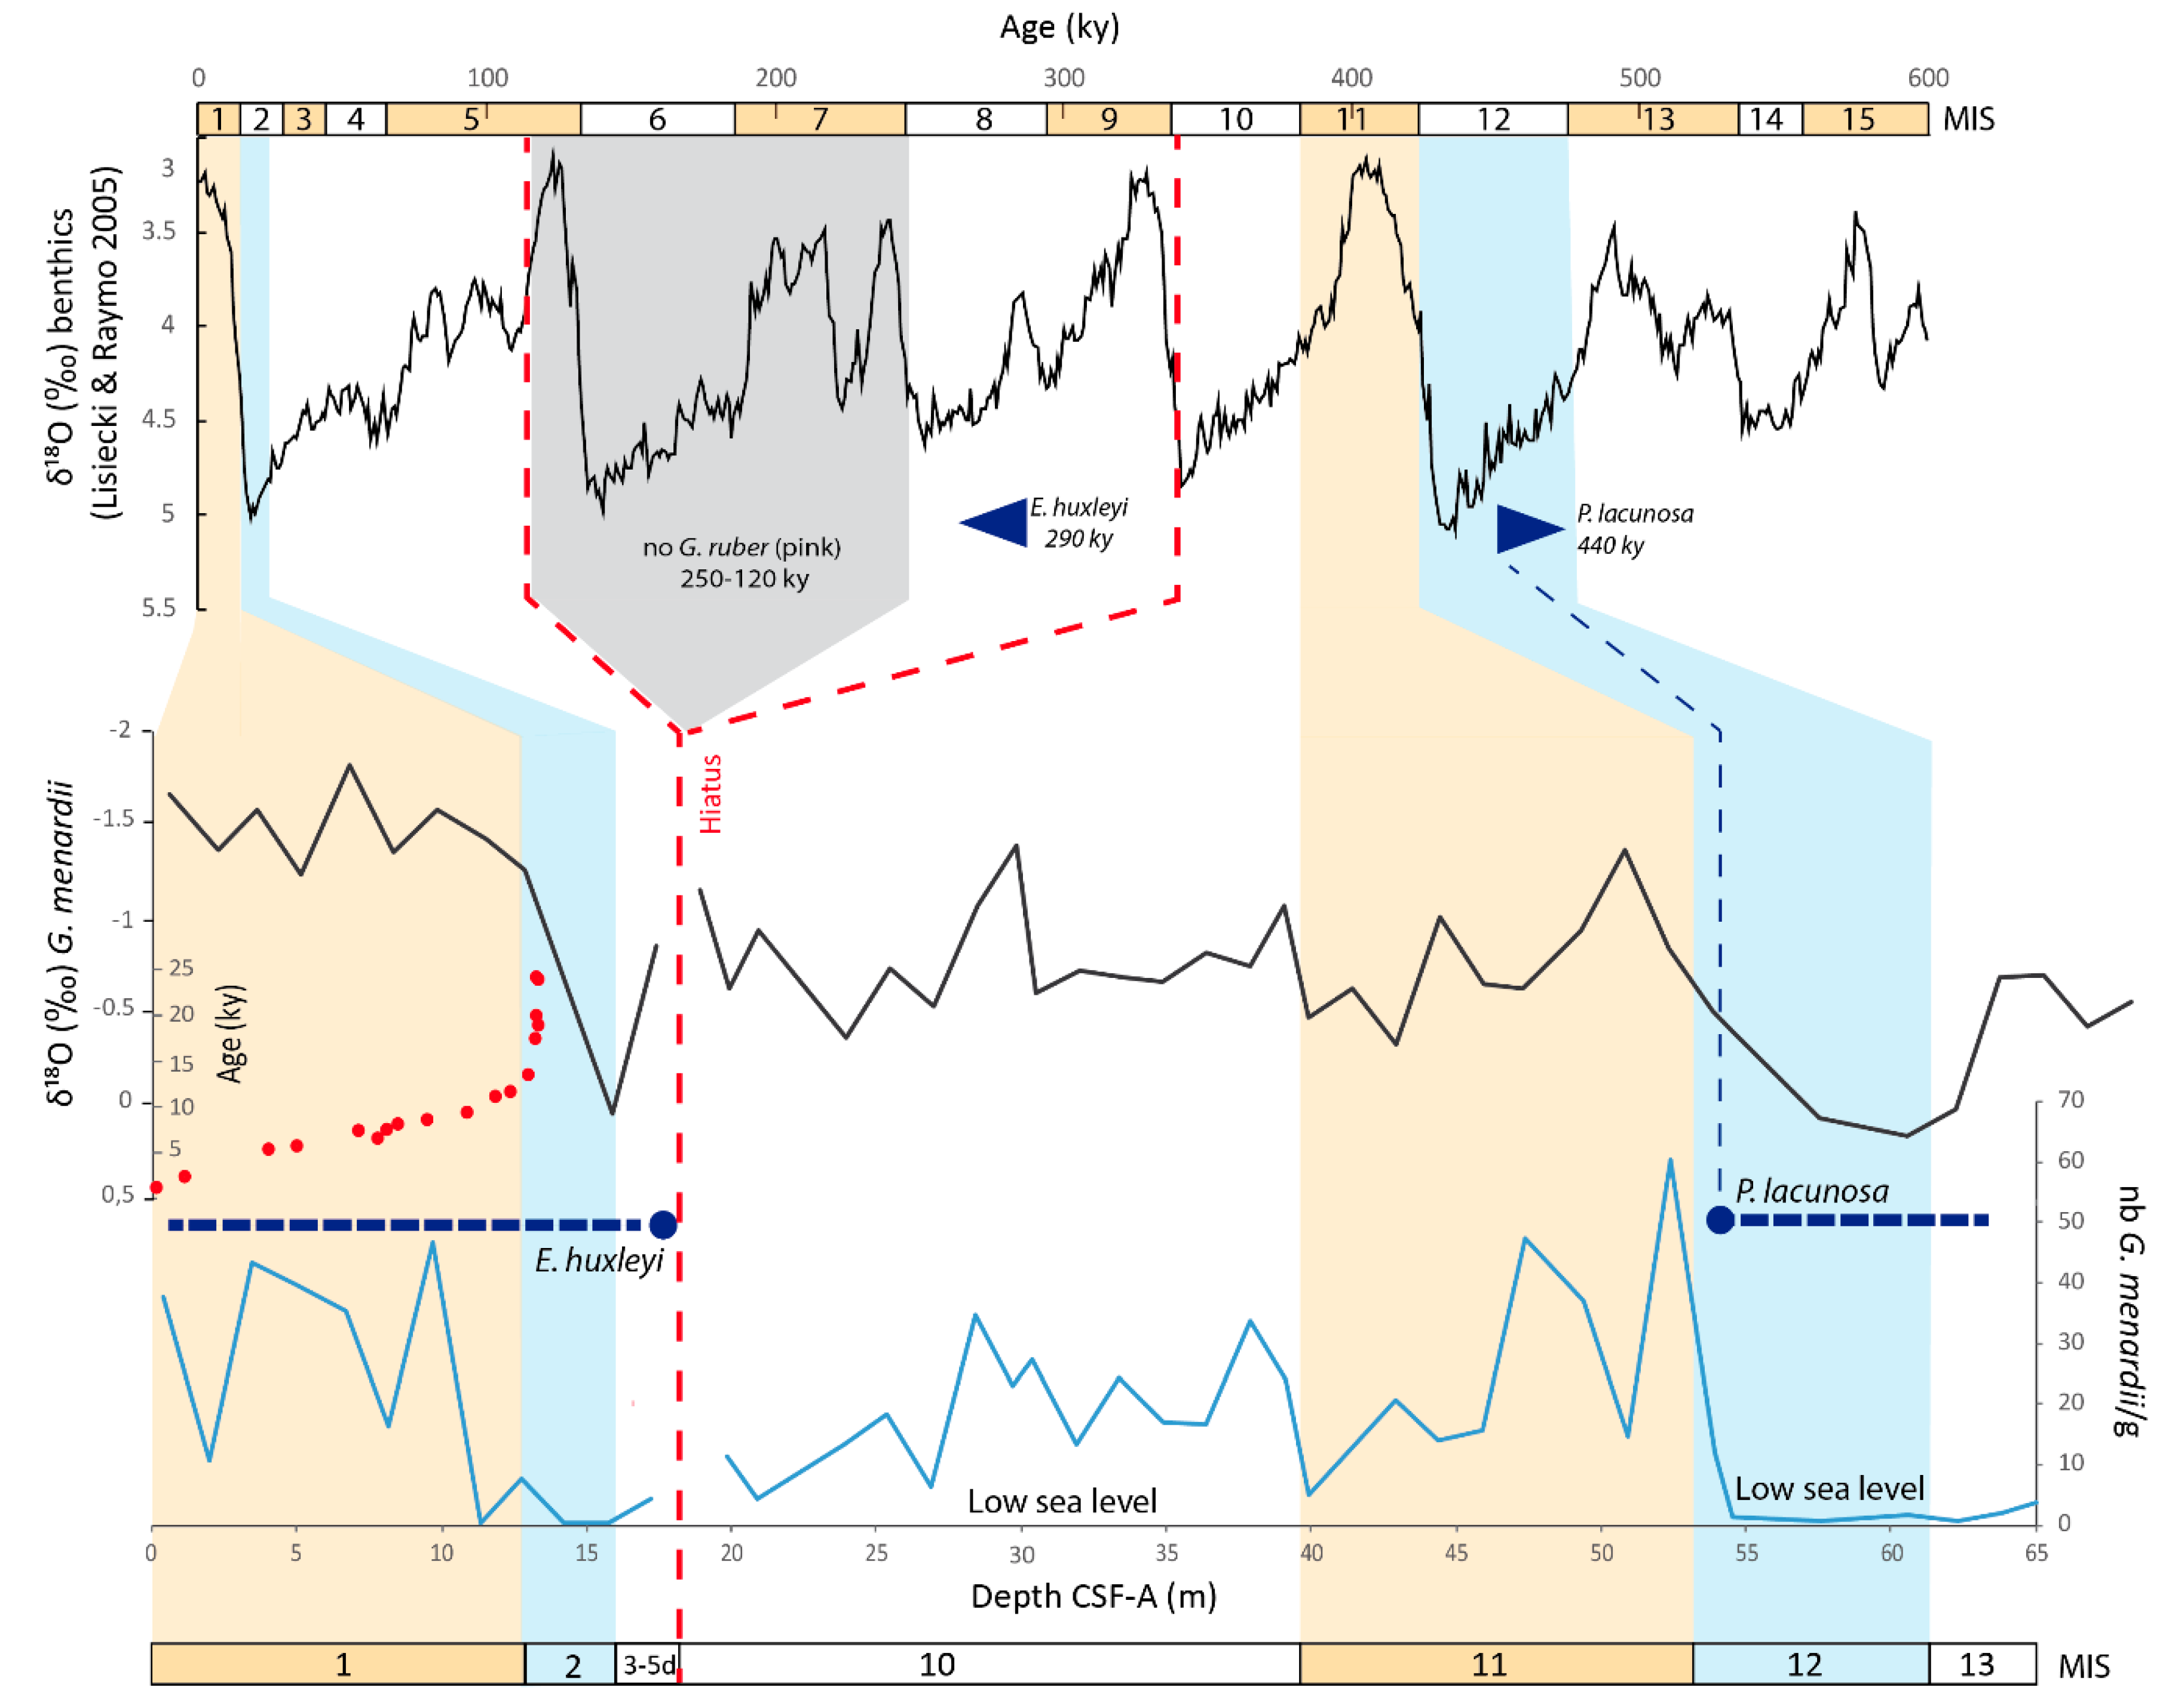
4.1. Age Model Constraints

To construct an age model at Site U1461A, a multiproxy approach was used to identify age tie points (see Table S1). The model includes:
-
14C radiometric dates by Ishiwa et al. 2019 [45] and Hallenberger et al. 2019 [13] for the first 14 m;
-
the absence of Globigerinoides ruber pink below 15.8 m (Groeneveld pers. comm.);
-
the first occurrence of Emiliania huxleyi at 17.85 m;
-
the last occurrence of Pseudoemiliana lacunosa at ≈55 m;
-
the main changes on δ18O measured in G. menardii and their correlation with the δ18O stack from Lisiecki and Raymo (2005) [47]. The stable isotope stratigraphy is very relative since the record is not continuous. The isotope ratios mainly served to identify the glacial stages vs. interglacial, the internal oscillation within a single stage was not considered.
The uppermost 13.22 m of the sequence yield an age of 14 ky BP corresponding to the MIS 1, established using 14C radiometric dates [13,45]. Following this, the next 40 cm of sediment were directly dated to be MIS 2. The interval between 13.22 and 15.8 m is then correlated to MIS 2. The bottom of MIS 2 was set based on the δ18O data and especially the heavy value of 0.05‰ at 15.8 m.
Below 15.8 m, the absence of Globigerinoides ruber pink (with a range 250–120 ky in the Indian and Pacific Oceans; [66]) and the presence of E. huxleyi (first occurrence at 290 ky; [48]) at 18 m suggest an horizon younger than 120 ky. Therefore, it is possible to attribute the interval between 15.8 and ≈18 m to MIS 3 to MIS 5d.
At ≈ 18 m a hiatus was identified by the absence of G. ruber pink (Figure 2) but the interval between 18 and 40 m cannot be clearly defined due to the absence of calcareous nannofossils bio-events [48] necessary for age refinement. However, in this horizon δ18O values range from −1.39 to −0.39‰, and the abundance of G. menardii varies from 0 to 34 individuals per gram. Those changes, especially the abundance of G. menardii, lead to the conclusion that this horizon may correspond to the beginning of the MIS 10 as the abundance of G. menardii is not zero, and therefore no low stands during glacial maxima. Moreover, the abundance of cluster 1 does not show high values suggesting low stands during a glacial maximum (Figure 3), the log (Zr/Fe) does not show the maximum that was observed at ≈330 ka in MD00-2361 (see Figure S1) and to finish, the log Ti/Ca also does not show a minimum that was observed at ≈330 ka in MD00-2361 (See Figure S1). These observations suggest that ≈18 m horizon was older than ≈330 ka, and the latest part of MIS 10 is not recorded in the sediment record.
Based on these observations, we argue that the hiatus covers the period from MIS 5d to late MIS 10, possibly due to erosion.
At ≈40–53 m, the minima of δ18O (−1.37 ‰) together with the maxima of abundance of G. menardii (60 ind/g) and the high abundance of Gephyrocapsa (including small-sized (<4 µm) G. caribbeanica and G. oceanica), suggest a reasonable correlation with MIS 11. From 53 to 61 m the sequence is devoid of tropical planktonic foraminifera, and the δ18O values are high with a maximum of 0.18‰. This period might correspond to MIS 12 (478–424 ky). This interpretation is supported by the highly sporadic presence of Pseudoemiliana lacunosa (last occurrence at 440 ky; [66,67]) recorded between 55.5 and 62.5 m CSF-A (in samples between U1461A-8H-CC and 12F-2, 40–42 cm). From 65 to 61 m, the abundance of G. menardii and the δ18O values are quite high, suggesting higher temperature and a higher sea-level corresponding to the end of MIS 13.

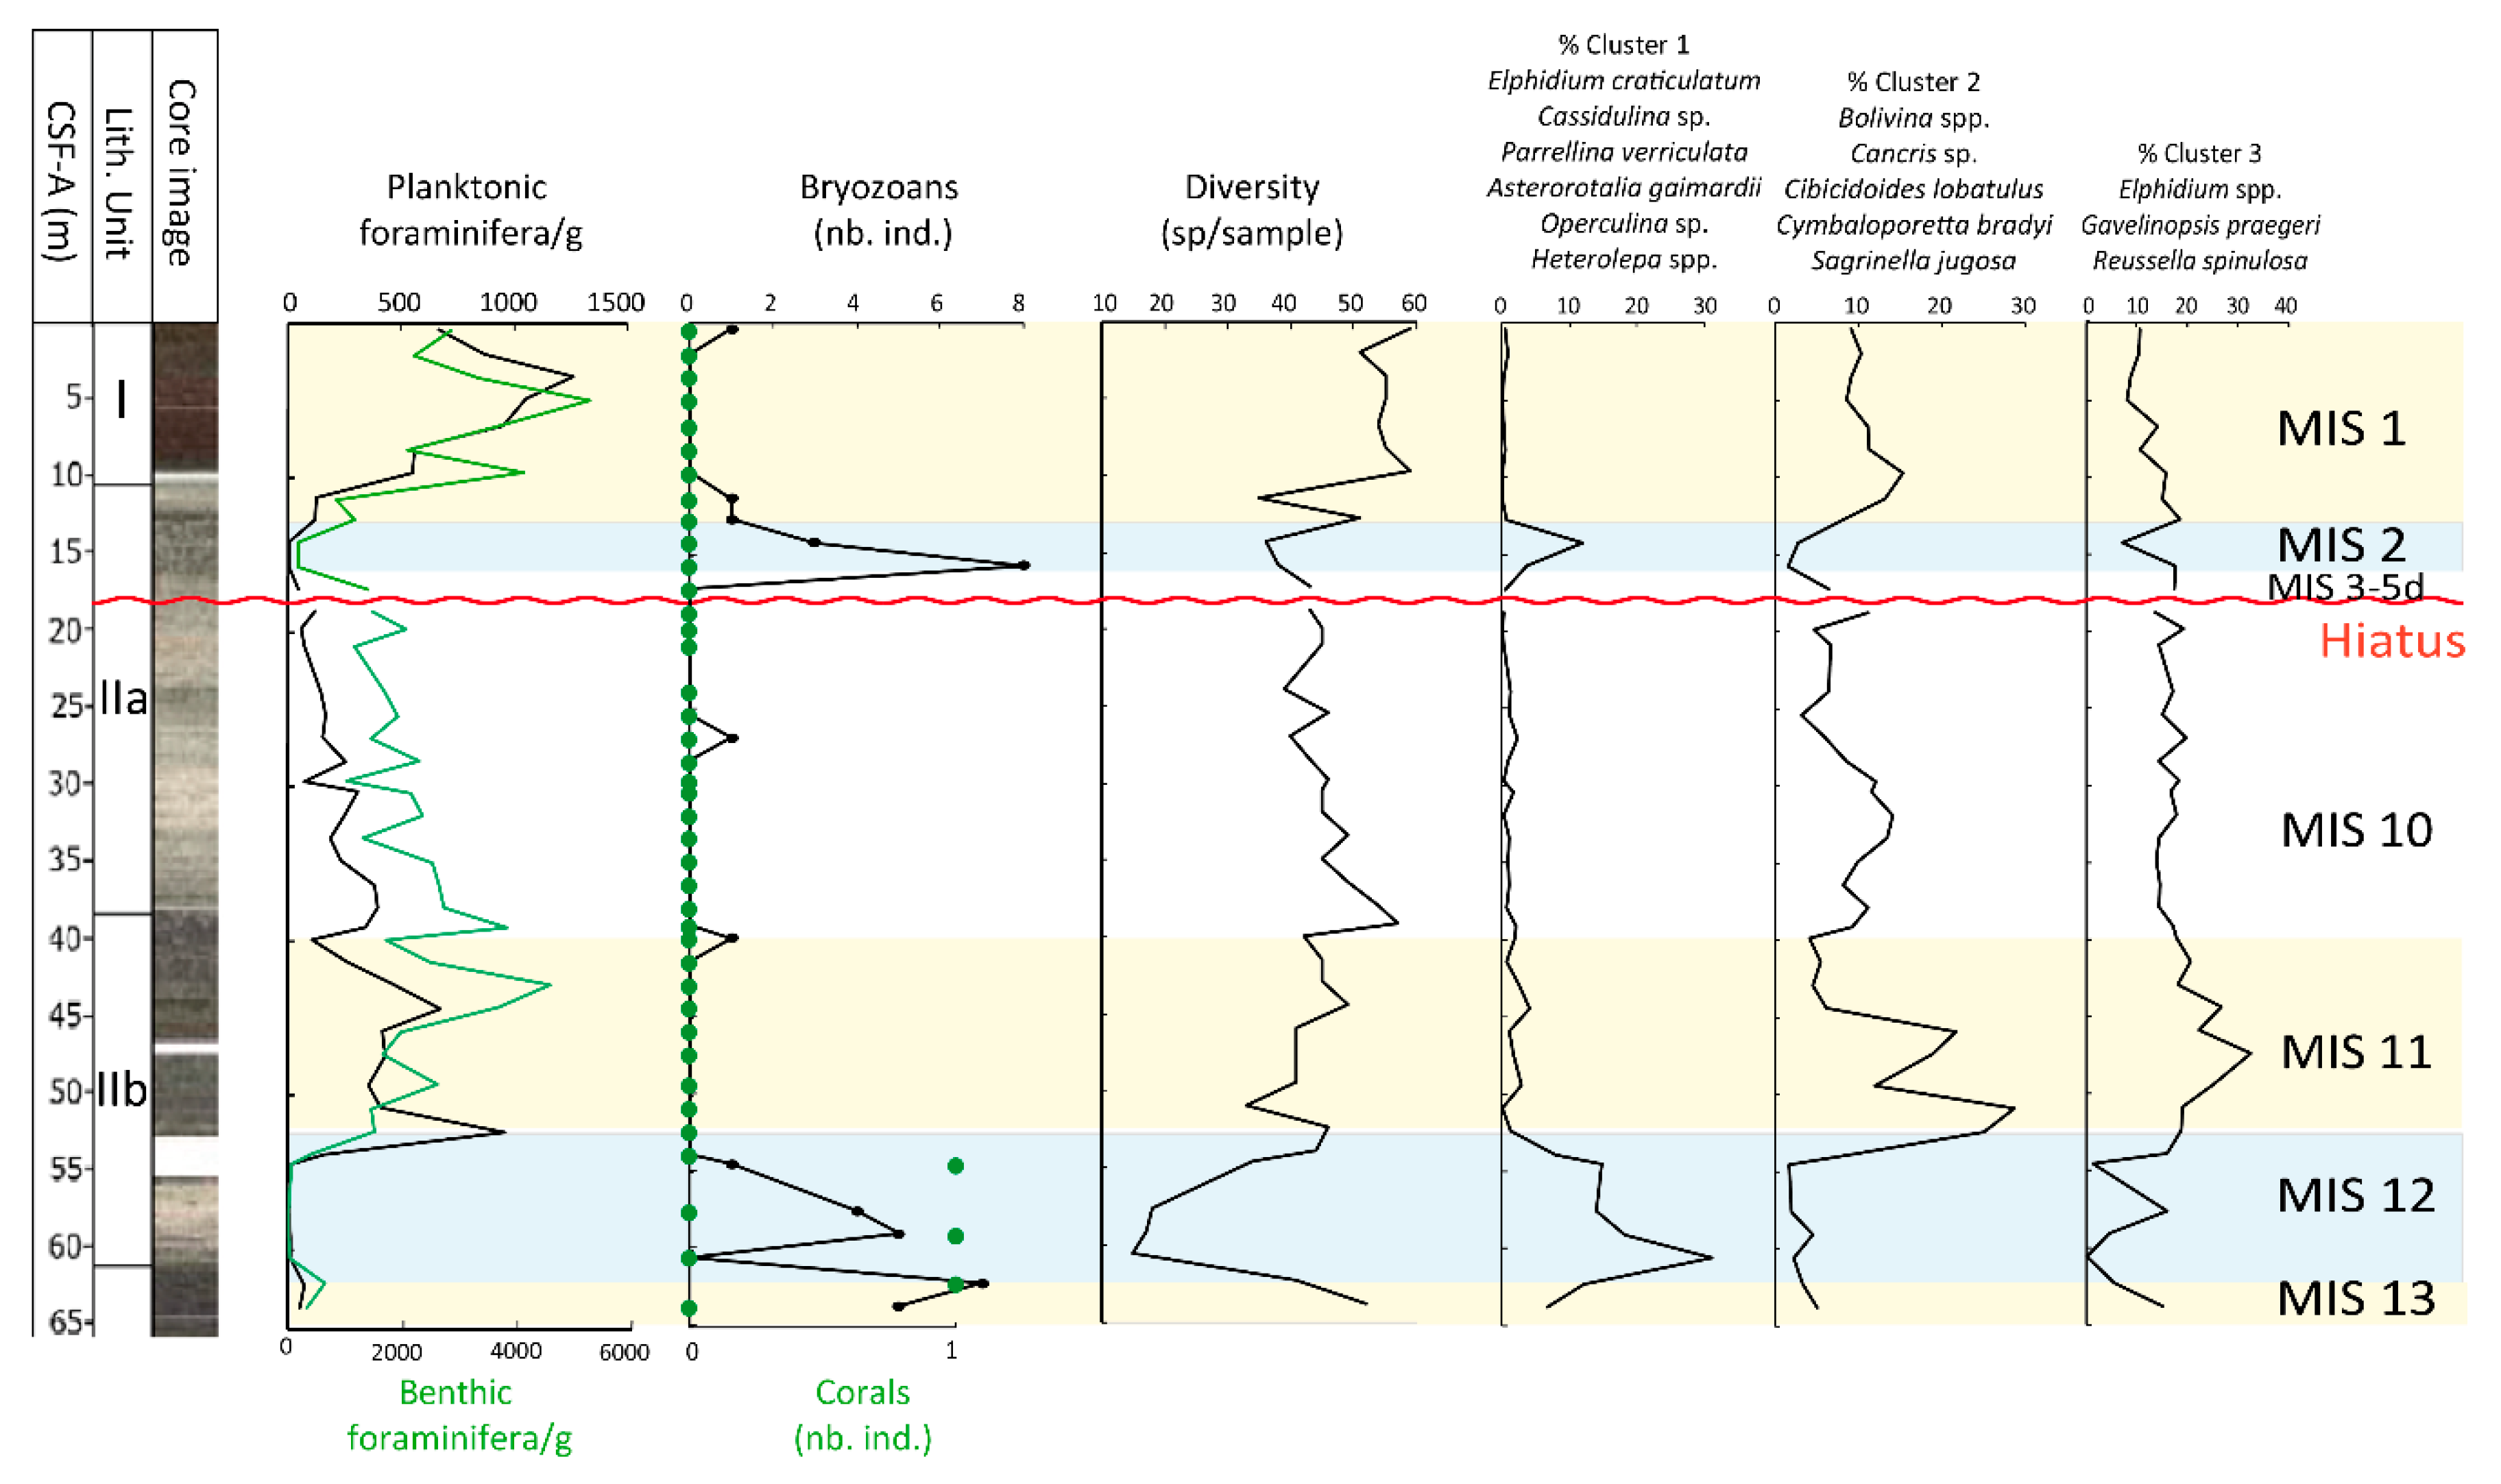
4.2. Benthic Foraminifera Assemblages

A total of 113 different benthic species were identified within the studied core section. The number of individuals per gram varies greatly from 10 (59.1 m) to 5275 ind/g (Figure 3), with the highest foraminiferal abundance recorded at 5 m. The abundance curve yields distinct phases: low values (0–600 individuals) from 65 to 55 m, to an increase with a maximum at 43 m with 4560 ind/g. A brief decrease in abundance occurs between 16 and 14 m (minimum of 160 individuals), followed by the last major increase between 14 m to the top of the core with the maxima of the foraminiferal abundance at 5 m (5275 individuals). These phases are also present in the abundance curve of planktonic foraminifera with a minimum of three individuals at 57.6 m and a maximum of 1257 individuals at 3.5 m.
The number of benthic foraminifera species present in the studied samples varies from 15 to 59: the lowest number of species occurs at 60.6 m (attributed to MIS 12), the highest at 9.7 m (corresponding to MIS 1).
A total of seven clusters were identified based on the 33 species whose abundance is >2% (Figure S2). The clusters were used mainly to estimate the approximate water depth during glacial and interglacial stages (Figure 3). Only three of the seven clusters are discussed here because of their relevance in providing environmental information (see the percentage of abundance for the other clusters in Table S2).
Cluster 1 includes Elphidium craticulatum, Cassidulina sp., Parrellina verriculata, Asterorotalia gaimardii, Operculina sp., and Heterolepa sp. and is particularly abundant during MIS 2 and MIS 12 with abundances of 12% and 31%, respectively.
Cluster 2 is composed of Bolivina spp., Cancris sp., Cibicidoides lobatulus, Cymbaloporetta bradyi, and Sagrinella jugosa. During MIS 12, the abundance of this cluster is very low with an average abundance of 2%. At the beginning of MIS 11, there is a significant increase in the abundance of this cluster, reaching a maximum value of 29%. During MIS 10, the abundance of Cluster 2 fell to an average of 10%. MIS 2 displays trends similar to MIS 12, averaging around 2%. At the transition from MIS 2 to MIS 1 (Termination I), the contribution of Cluster 2 increases again to 15%.
Cluster 3 is composed of Elphidium spp., Gavelinopsis sp., and Reussella spinulosa. The abundance of Cluster 3 is similar to that of Cluster 2, with high abundance during MIS 11 (32.5%), absence during MIS 12 (0%), and low abundance during MIS 2 (7%).

4.3. Corals and Bryozoans

In this study, four solitary azooxanthellate (without symbiont) corals and 39 bryozoans were found in a total of 43 samples (each sample was 20 cm3).
All four corals were found between 61 and 55 m, during the MIS 12 (Figure 3). The corals were identified as two Conocyathus formusus, one Heterocyathus aequicostatus (Korpanty; unpublished data), and one unidentified (due to accidental destruction during sonication cleaning). Common globally, Heterocyathus aequicostatus is a free-living coral with a low columnar form that is known to live in the Indo-Pacific between 0 and 20 m water depth [67,68]. Conocyathus formusus, a free-living coral with a conical form, is only known from northern and northeastern Australia (five specimens total) in depths between 320 and 367 m [67].
Two colonial forms of bryozoans were found, mainly between 55 and 61 m (MIS 12) but also between 10 and 15 m (MIS 2) (Figure 3). The conescharelliniform morphotype (three species, five specimens) is represented by small conical colonies attached to the muddy substratum by chitinous rootlets. The lunulitiform morphotype (four species, 34 specimens) corresponds to discoidal colonies living freely on sandy-muddy bottoms.

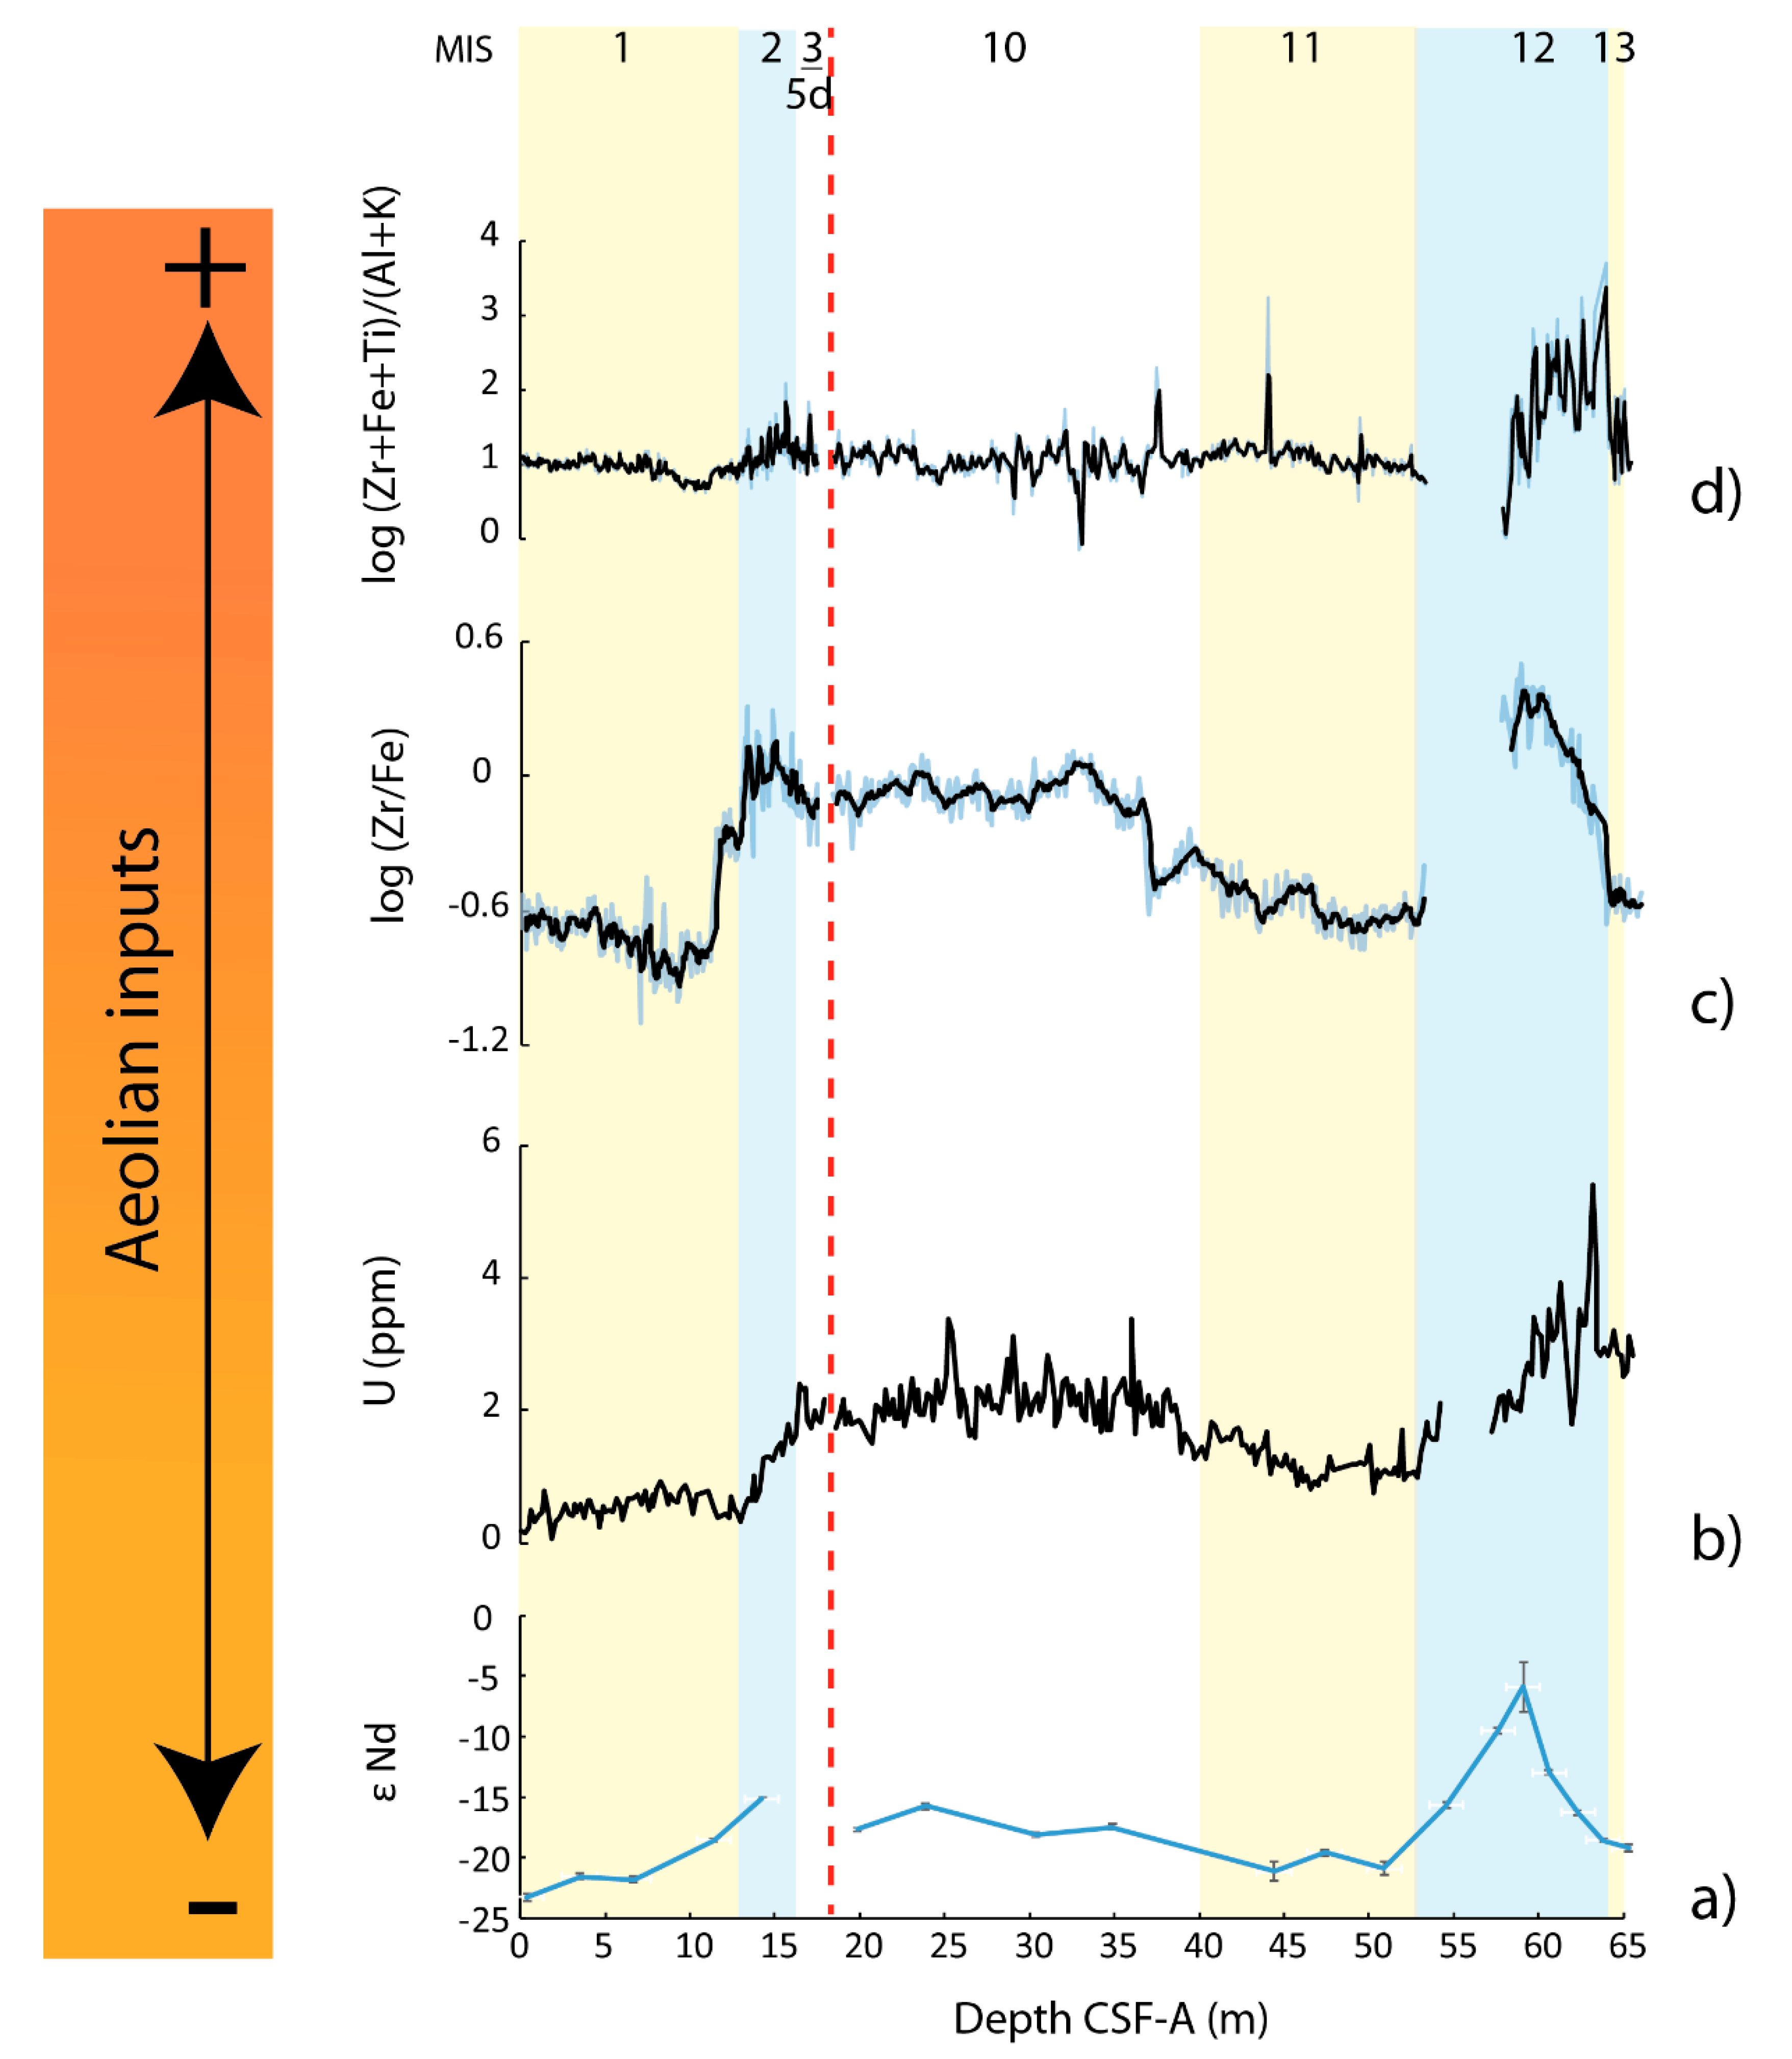
4.4. Radiogenic Isotopes (Nd), Major Elements (X-ray Fluorescence) and REE (Y/Ho)

143Nd/144Nd values in the studied cores vary between 0.511444 (±0.000017) and 0.512336 (±0.000102), corresponding to εNd ranging from −23.3 (±0.3) to −5.9 (±2) (Table 1). Between 65 and 55 m, radiogenic values occurred with a peak at 59.1 m, reaching an εNd of −5.9 (±2). This interval corresponds to a major glaciation during MIS 12. From 50 to 14.25 m the values are less radiogenic, reaching −20.9 at 50.9 m. At 35 m these values increase continuously until −15.2 during MIS 2 (at 14.25 m). After the LGM the εNd shifts again to −23.3 with the lowest radiogenic value at 0.4 m (Figure 4a).
The U concentration is high during MIS 12 with its maximum value of 5.4 ppm at 63.11 m. During MIS 11 (52.5 to 40 m), the U concentration is relatively lower with an average of 1 ppm. Then from 40 to 15 m the values are slightly higher with an average of 2 ppm, and above 15 m, the U concentration is going down to reach an average of 0.5 ppm (Figure 4b).
The log (Zr/Fe) follows the U concentration plot (Figure 5c). It shows low values during the MIS 13, with an average of −0.6, but very high values during the MIS 12, with a peak at 59 m (0.5). At the beginning of the MIS 11 low values are observed again (minimum = −0.6). A slow increase up to 39.5 m reaches the value of −0.2. Through MIS 10, the values remain steady with an average of 0. During MIS 2, the log(Zr/Fe) ratio shows a small increase until 0.3 at 13.27 m. The transition between MIS 2 and MIS 1 is marked by a quick decrease and the lowest value is observed at 7 m (−1.1).
The log (Zr + Fe + Ti)/(Al + K) ratio illustrates high values during the MIS 12 with a peak at 63.95 m (3.7). The rest of the record presents values around 1 (Figure 4d).
The log ratio of Ti/Ca is relatively low from 61 to 55 m with values fluctuating around −4 (Figure 5a). From 55 to 40 m, values increase towards −3. Above 40 m this ratio decreases and a steady value of −4 occurs at 12 m. Around 12 m the log value increases rapidly leading to the highest values (up to −2) at ≈9 m. The terminal part of MIS 1 is also characterized by values around −2.
The Y/Ho ratios (Figure 5b) yield lower values (≈28) during interglacial periods than during glacial ones (≈40), which have a maximum of 41.5 at 57.6 m (MIS 12).
The percentage of K is high during interglacial periods with a maximum during MIS 13 at 63 m with 0.9% and a maximum during MIS 1 at 9.2 m with 0.6% (Figure 5c). From the MIS 12 to the MIS 8 K content remains steady at around 0.4%. During the MIS 2, K concentration shows the minimum value at 13.8 m with 0.12.

5. Discussion

5.1. Faunal Assemblages and Bathymetric Estimates

Cluster 1 contains typical shallow-water, off-reef shelf foraminifera that live in coarse sediment, and includes A. gaimardii [69,70] and P. verriculata [71]. Additionally, present in Cluster 1, Elphidium craticulatum is characteristic of a poorly-sorted substrate composed of medium to coarse-grained carbonate sands [72]. This cluster is prominent during glacial periods when sea level was low, e.g., during glacial periods MIS 2 and MIS 12 when global sea level is estimated at –120 m [73,74] and −124 m [75] below present, respectively. Considering that the current depth at Site U1461 is 127 m, Cluster 1 likely signifies that the site would have been within very shallow water depths during the MIS 2 and 12.
Cluster 2 is composed mainly of Cibicidoides lobatulus and is present mostly during the interglacial periods. Cibicides lobatulus lives predominantly in neritic to bathyal environments with a bathymetric distribution lower than 1000 m depth [49]. Cluster 3 is also mainly present during interglacials with Gavelinopsis praegeri (mean ≈ 5%) and Reussella spinulosa (mean ≈ 5%). These species are known to live mostly between 50 and 100 m depth in the inner-middle shelf [76,77]. Thus, with Clusters 2 and 3, indicative of periods of comparatively higher sea-level than Cluster 1, Site U1461 was likely covered by more than 100 m of water during interglacial periods, similar to today.
Co-occurring with foraminifera Cluster 1, the occurrence of the solitary coral Heterocyathus aequicostatus also supports the interpretation of a comparatively shallow-water environment during a glacial period (MIS 12) as this species is known from modern depths of 0–20 m [67,68]. Found several meters below H. aequicostatus, the presence of Conocyathus formusus specimens (known from modern depths of 320–367 m) may represent deeper conditions at Site U1461 during the regression leading up to MIS 12. However, it should be noted that the modern depth range of this species is derived from only five specimens [67], meaning that this species may in fact live at shallower (and/or deeper) depths but has not yet been found beyond the aforementioned range.
The two bryozoan forms, conescharelliniform and lunulitiform, yield the same ecological conditions of modern bryozoans living in shallow water with moderate currents and a low to medium sedimentation rate [78,79]. The high quality of their preservation suggests a sub-autochthonous provenance and indicates a water depth around 100 m, fully consistent with the depth inferred using the benthic foraminifera assemblages.
Based on the above described faunal assemblages, a semiquantitative estimation of paleobathymetries is possible. Generally speaking, the fauna indicates complete and clear assemblages during interglacial high-stands. During low-stands of MIS 2 and MIS 12, a very specific assemblage, typical of shallow water can be identified and is considered in situ.
It is well known that during times of low sea level most of the continental shelves around the world were exposed or under a few meters of water, and were thus submitted to high energy hydro-dynamic that might have prevented sedimentation. However, few exceptions exist, and those are found in the Australian continental shelf—for example, sediments deposited in depressions, such as in the Bonaparte Gulf [75] and sediments of the NW Australia shelf not-rimmed reefs [80]. In particular, the latter describes the nearshore (<10 m) facies along the southern part of the Northwest Australia shelf. Fine calcareous sand sheets and bodies usually accumulate around fringing reefs, where the “obstacles” can generate low-velocity currents zones. Site U1461 is located 20 km offshore a drowned reef [44]. It likely records, at least partially, those sediments. Particularly indicative is the foraminiferal Cluster 1 that contains typical elements of the lithofacies commonly found in this kind of environment.

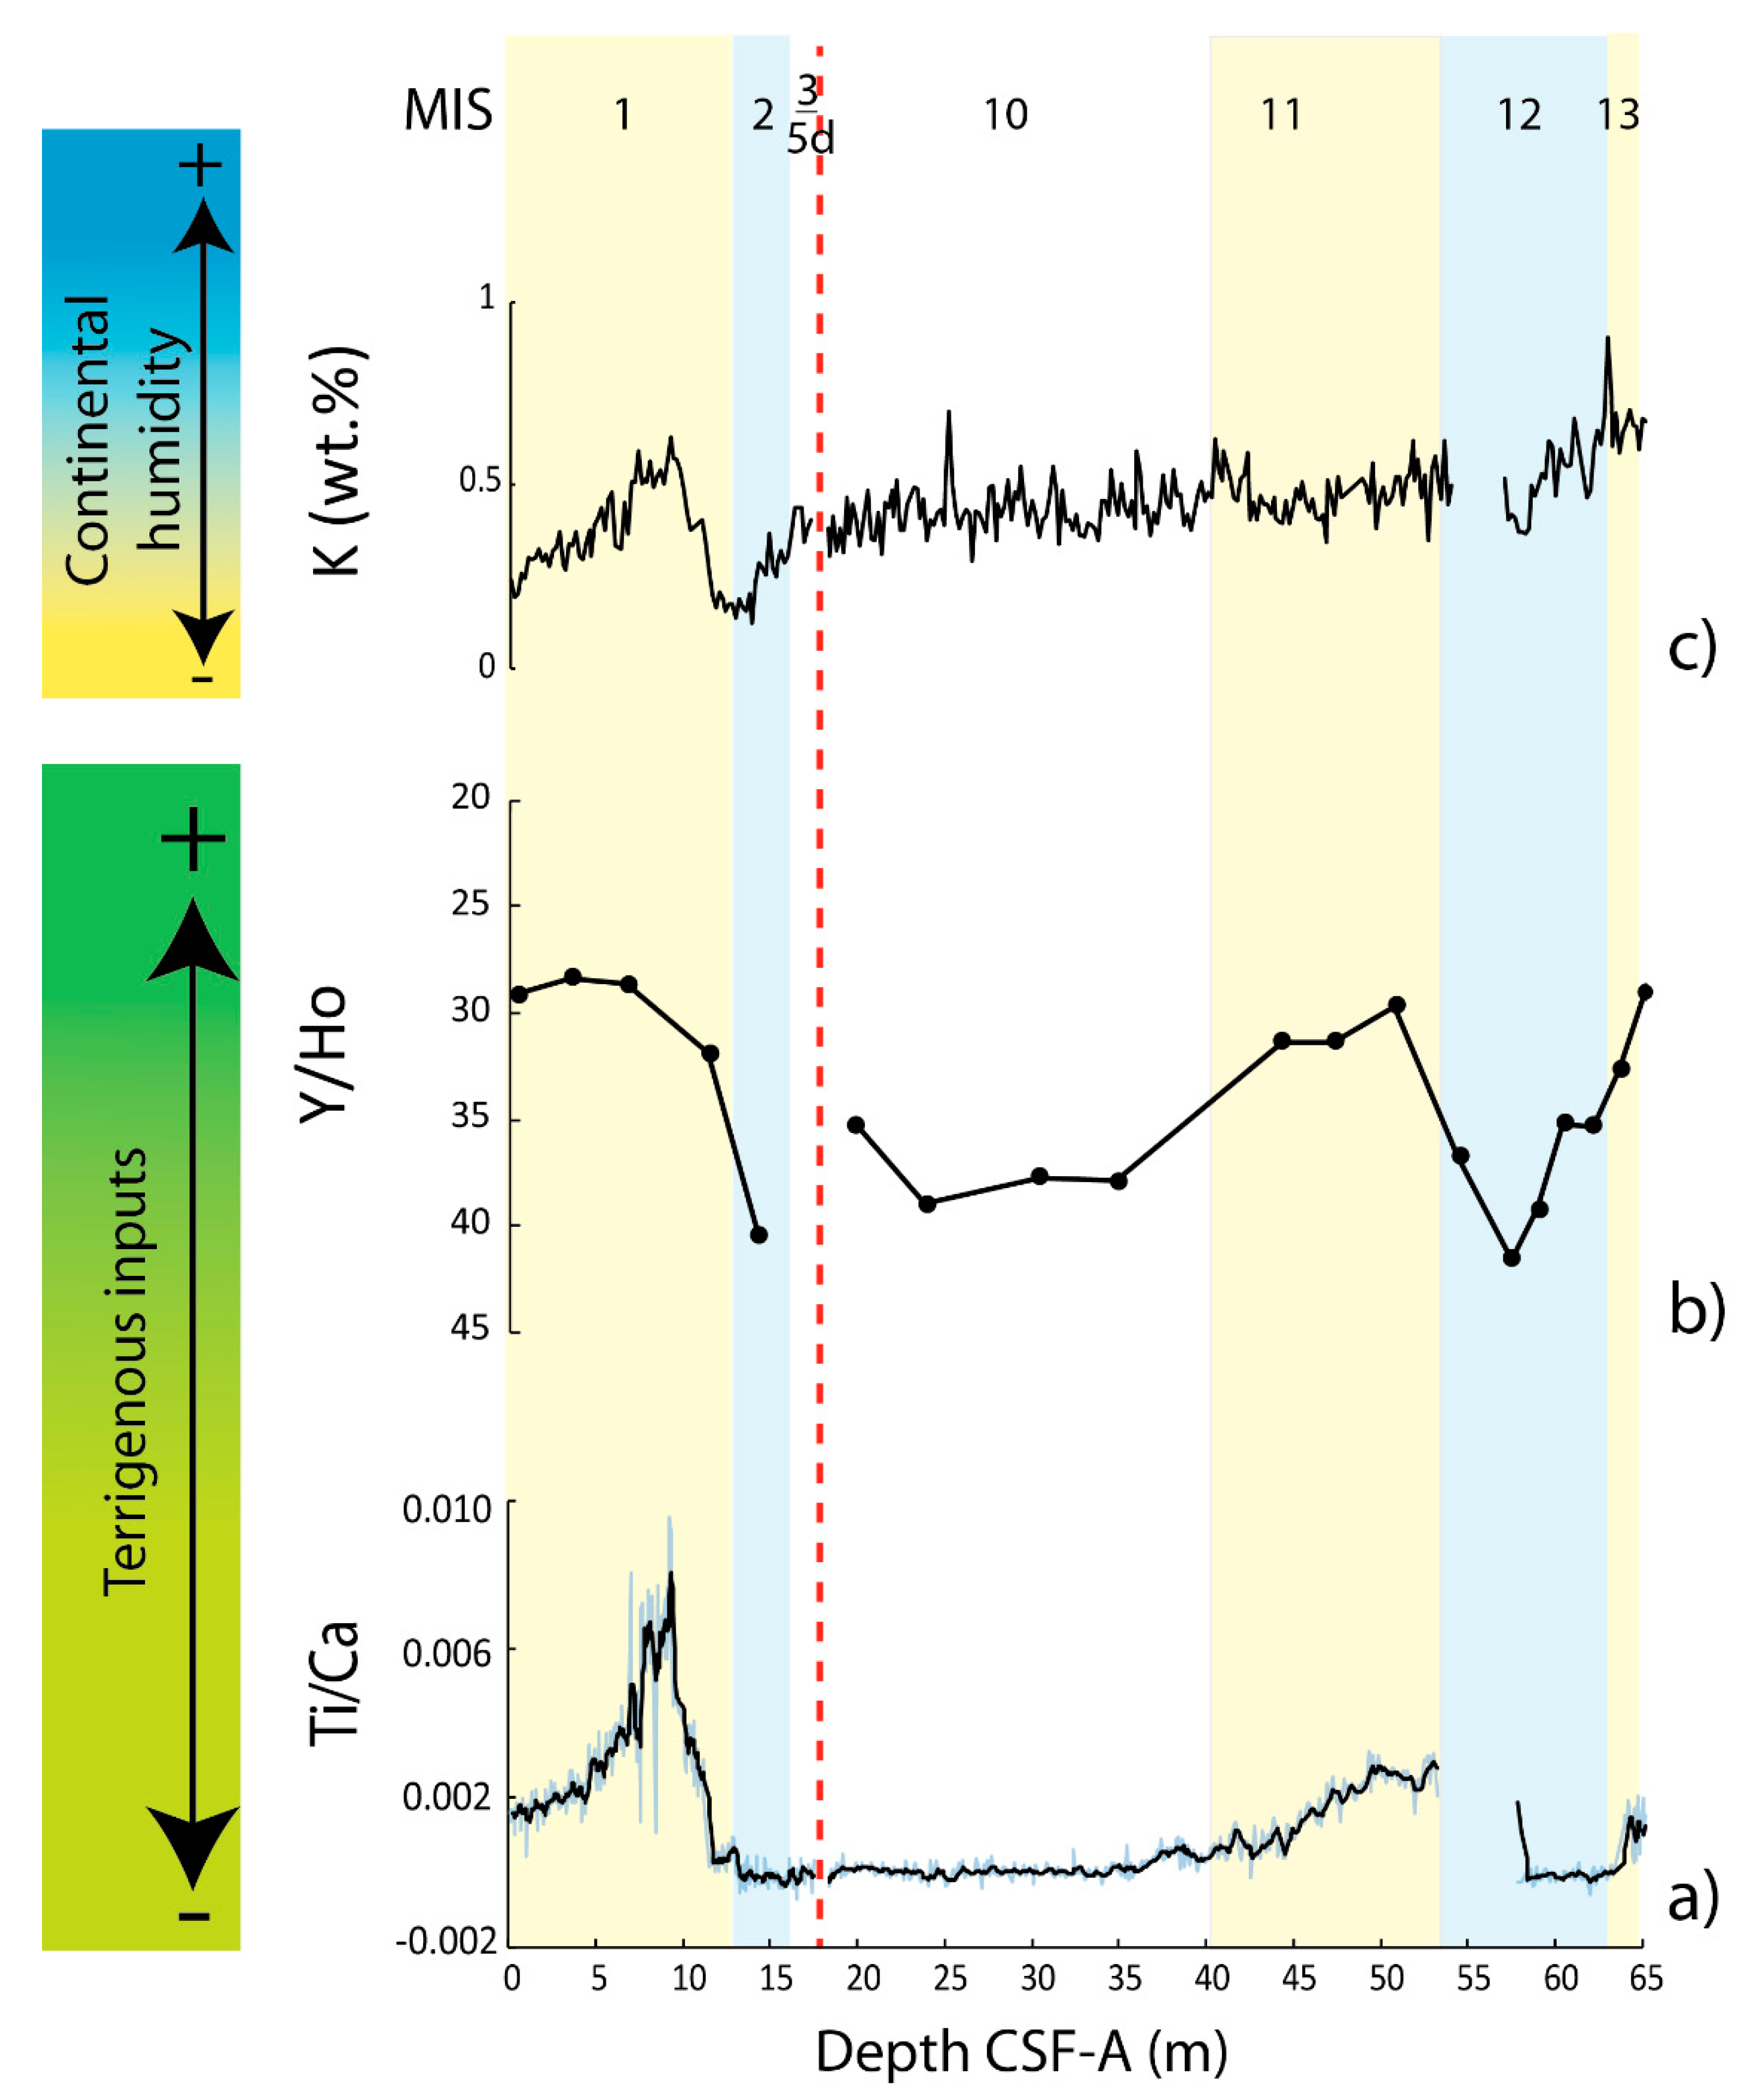
5.2. Aeolian Versus Fluvial Inputs

A nearshore marine sedimentary core, which preserves continental sediment input, provides a unique archive for the general regional climate, including the amount of precipitations and dust transport by atmospheric and fluvial routes, as well as information about cold (arid) and warmer (humid) periods [12,20,81].
The Y/Ho ratios allow differentiation of marine carbonate production (marine influence) from terrigenous/volcanic input. These results indicate that Site U1461 received more terrigenous input during interglacial periods (mean = 28) than during glacial periods (mean = 40) (Figure 5b). The increase in the Y/Ho ratio during glacial periods is possibly related to the increase in carbonate production or by lower accumulation of siliciclastics and constant flux of carbonate, leading to a lower concentration of siliciclastics in the sediment.
The Ti/Ca ratios measured at Site U1461 are perfectly coherent with previous studies carried out on deep marine sediment cores [12,42], which show that during interglacial periods the terrigenous contributions, probably of fluvial origin, are more pronounced (Figure 6).
In addition, we discuss the significance of K concentration (%) (Figure 5c) as an indicator of “continental humidity” in the Western part of Australia [63] since it can be related to quantify the concentration of K-rich aluminosilicates (mainly clays and feldspars) generated by continental erosion. The values of K% at Site U1461 oscillate between 0.12 and 0.90%. This range is the same as the one presented by [63] at Site U1463 (145 m water depth).
The Y/Ho and Ti/Ca ratios and %K illustrate a significant terrestrial input during interglacial periods that are climatically characterized by continental humidity.
To better identify the aeolian input from the Australian continent, the U concentration (%) (Figure 4b) in the sediment can be used [63]. Indeed, when U rich igneous rocks are subjected to subaerial erosion [65] this element might be considered as a wind dust tracer over Australia. At Site U1461, the concentration of U clearly shows peaks of abundance during the glacials, suggesting a major contribution of dust during cold and arid periods but also a potential influence of TOC concentrations that tend to be higher in glacial sediments [44].
The values of log(Zr + Fe + Ti)/(Al + K) in deep core SO185-18506 (2410 m) in Kuhnt et al. (2015) [42] are between 1.0 and 1.6 whereas at Site U1461 they show values between 1 and 3.7. This difference might be explained following the hypothesis that a higher aeolian input is registered during the MIS 12 mainly because the site U1461 is proximal, thus the continental dust signature is more pronounced.
The log(Zr/Fe) was used in Stuut et al., (2014) [12] to distinguish between aeolian and fluvial muds in the core MD00-2361 (1805 m water depth) on the continental slope offshore North West Cape of Western Australia. This study shows values between −0.2 and −1.3 and especially higher values during glacial periods. Similar values and trends are found at Site U1461 (Figure 6), consistent with the occurrence of consecutive dry and cold glacial, and humid interglacial periods [12,42] and following the northern hemisphere climatic pattern, which is opposite to the results obtained for the same latitude areas in South America and South Africa [16,81]. Additionally, Stuut et al. (2014) [12] consider that the physiography of the Australian continent might have played a role in developing a very peculiar climate system around Australia: a large landmass, covering almost 40° of latitude may have affected the displacement of the climate front from the Southern Ocean and strongly impacted the mechanisms of the monsoonal system.
In particular, during the glacial periods, the size of landmasses is increased by the subaerial exposure of the continental shelf. This would accentuate the influence of warm continental air masses, leading to an intensification of continental winds [12]. Therefore, reconstructing the position of dust pathways and the intensity of dust transport in the Australian continent as well as the source areas constitutes an important step for understanding the role of dust in atmospheric dynamics. Our knowledge about Australian dust transport over long timescales is scarce because of the rare continental records and of the few marine records containing such information [11,12,27,30].
Here, we used the previously established geochemical proxies to distinguish between aeolian or fluvial sediment transport to Site U1461 (Figure 4 and Figure 5):
-
The signature of the REE and, more precisely, the ratio of Y/Ho suggests significant terrestrial input during interglacial periods;
-
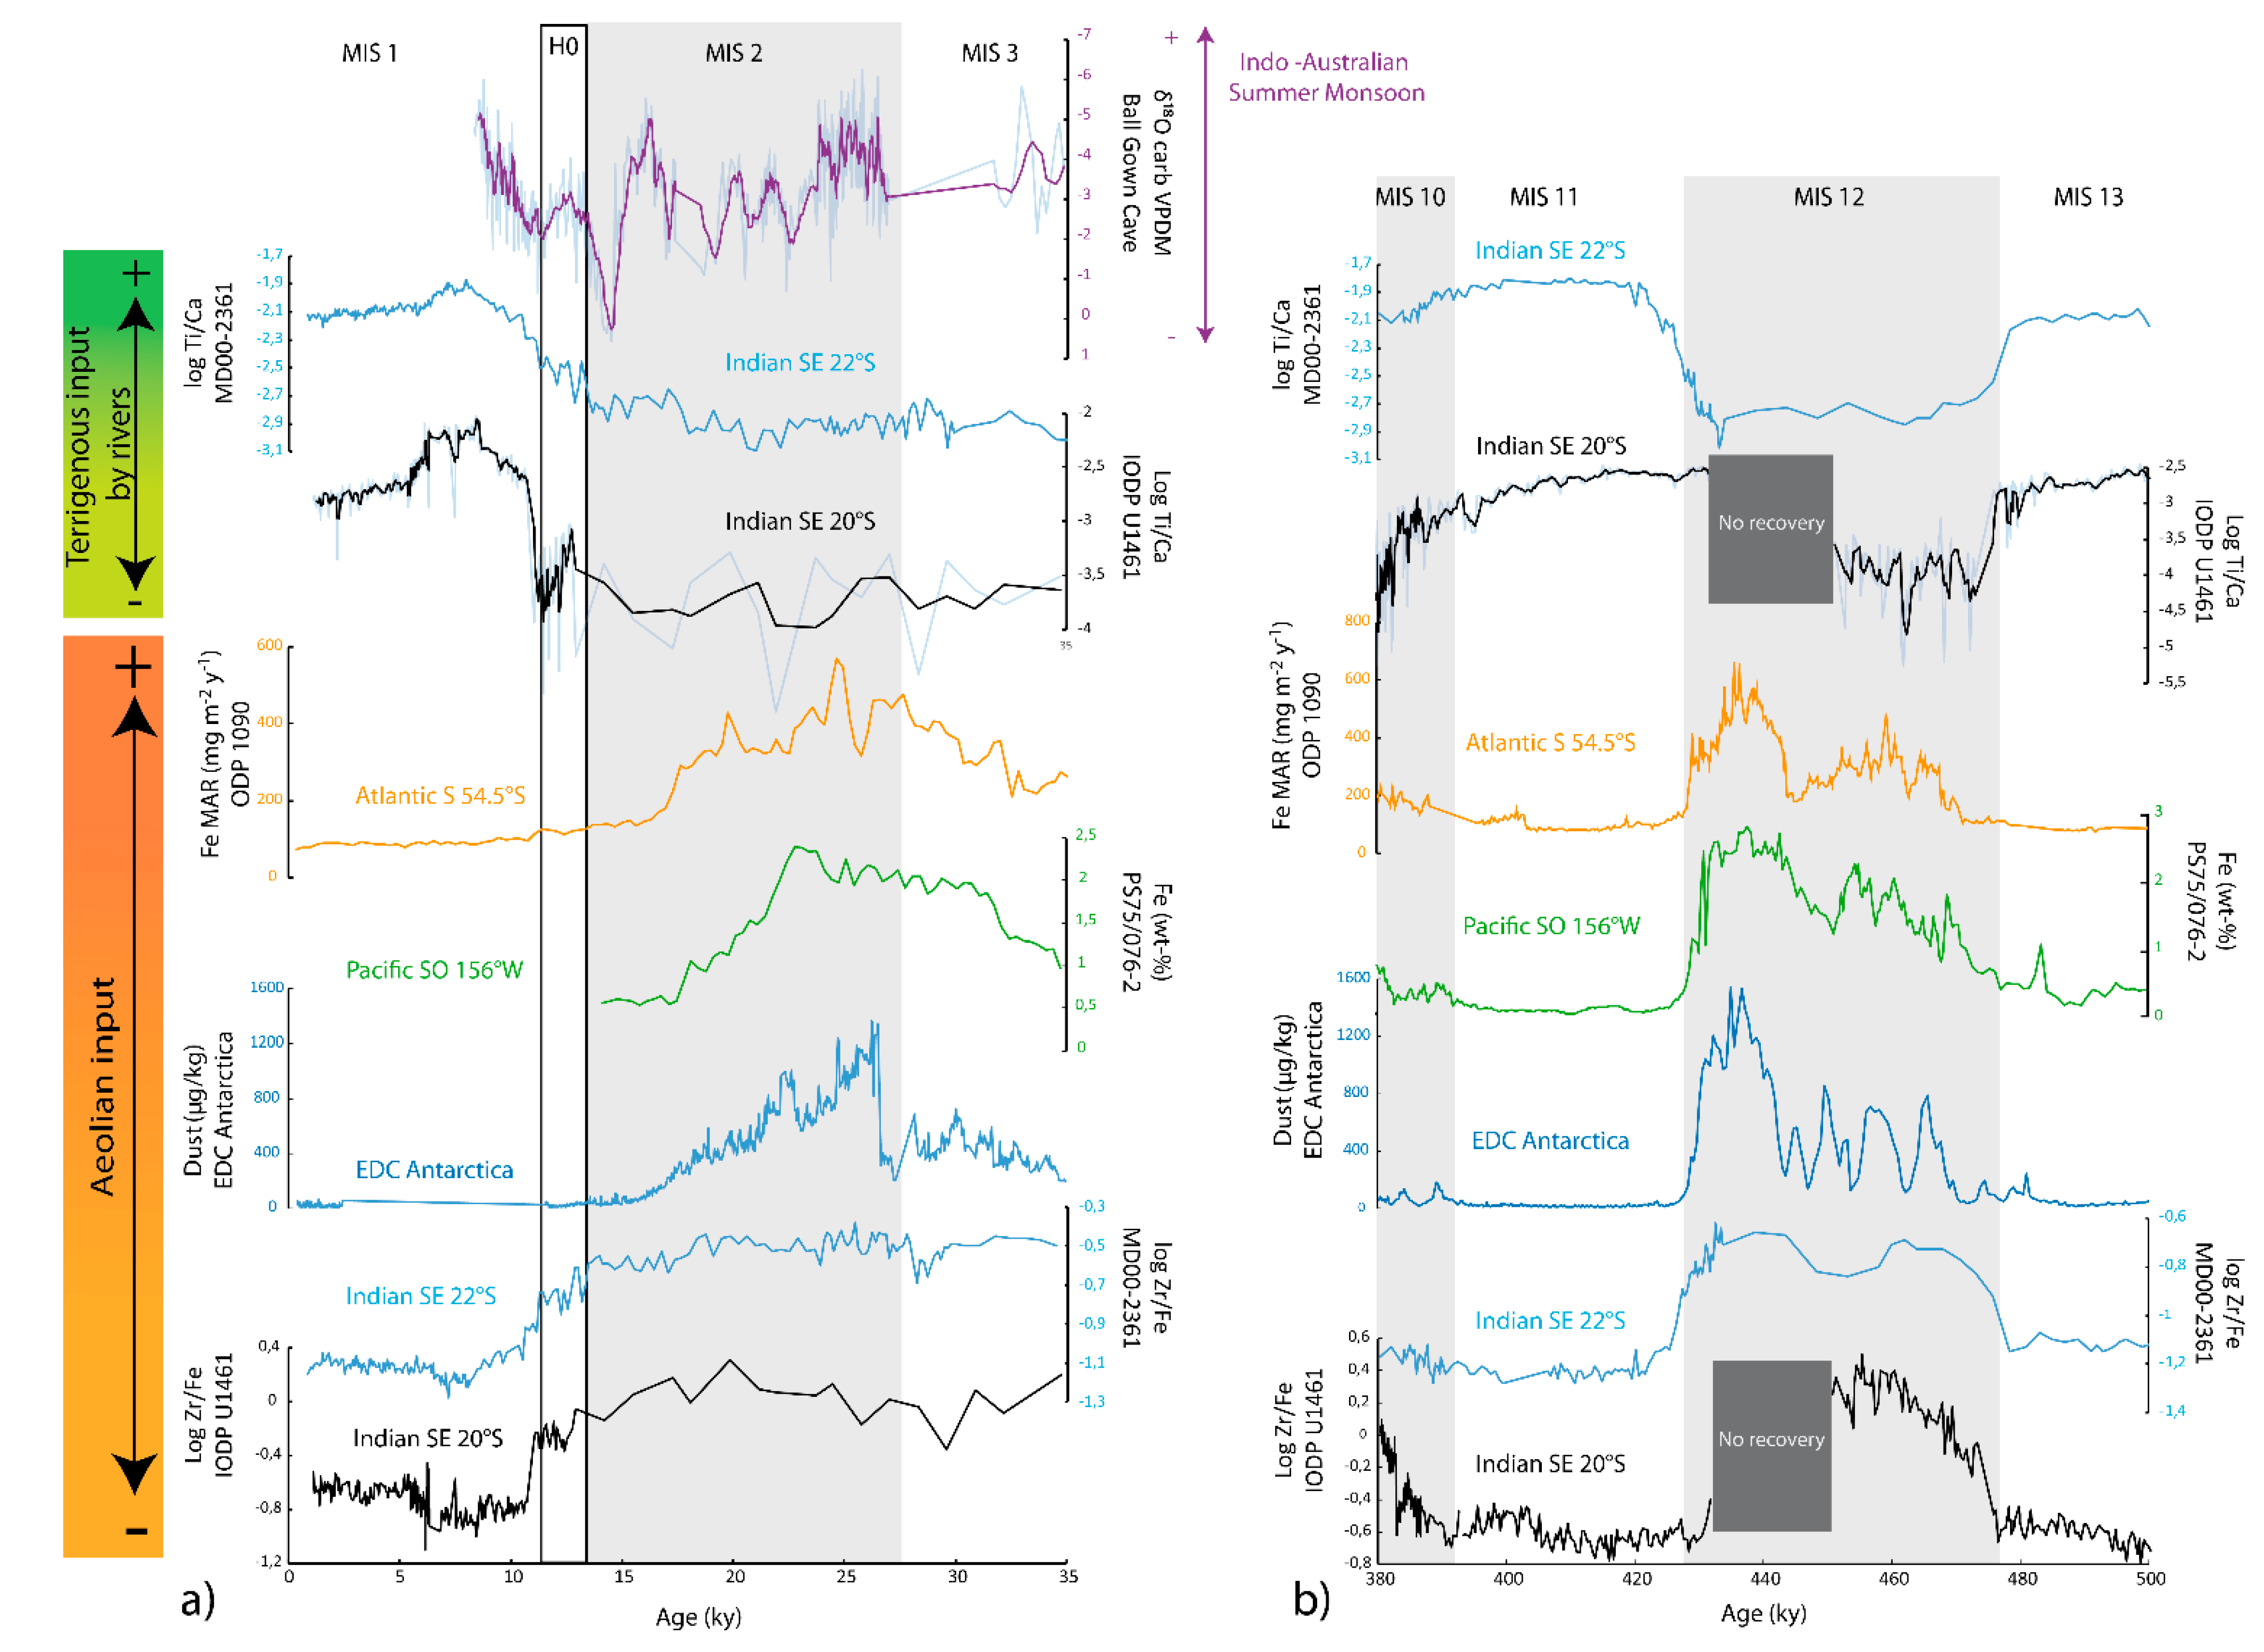
The XRF and NGR data, especially the Ti/Ca ratio and the K%, show a strong influence of the Australian Summer Monsoon (ASM), with strong precipitation and riverine input during the interglacial periods. Whereas, the log(Zr/Fe) ratio, the log(Zr + Fe + Ti)/(Al + K) ratio, and the U% are showing arid periods dominated by aeolian inputs during glacial phases;
-
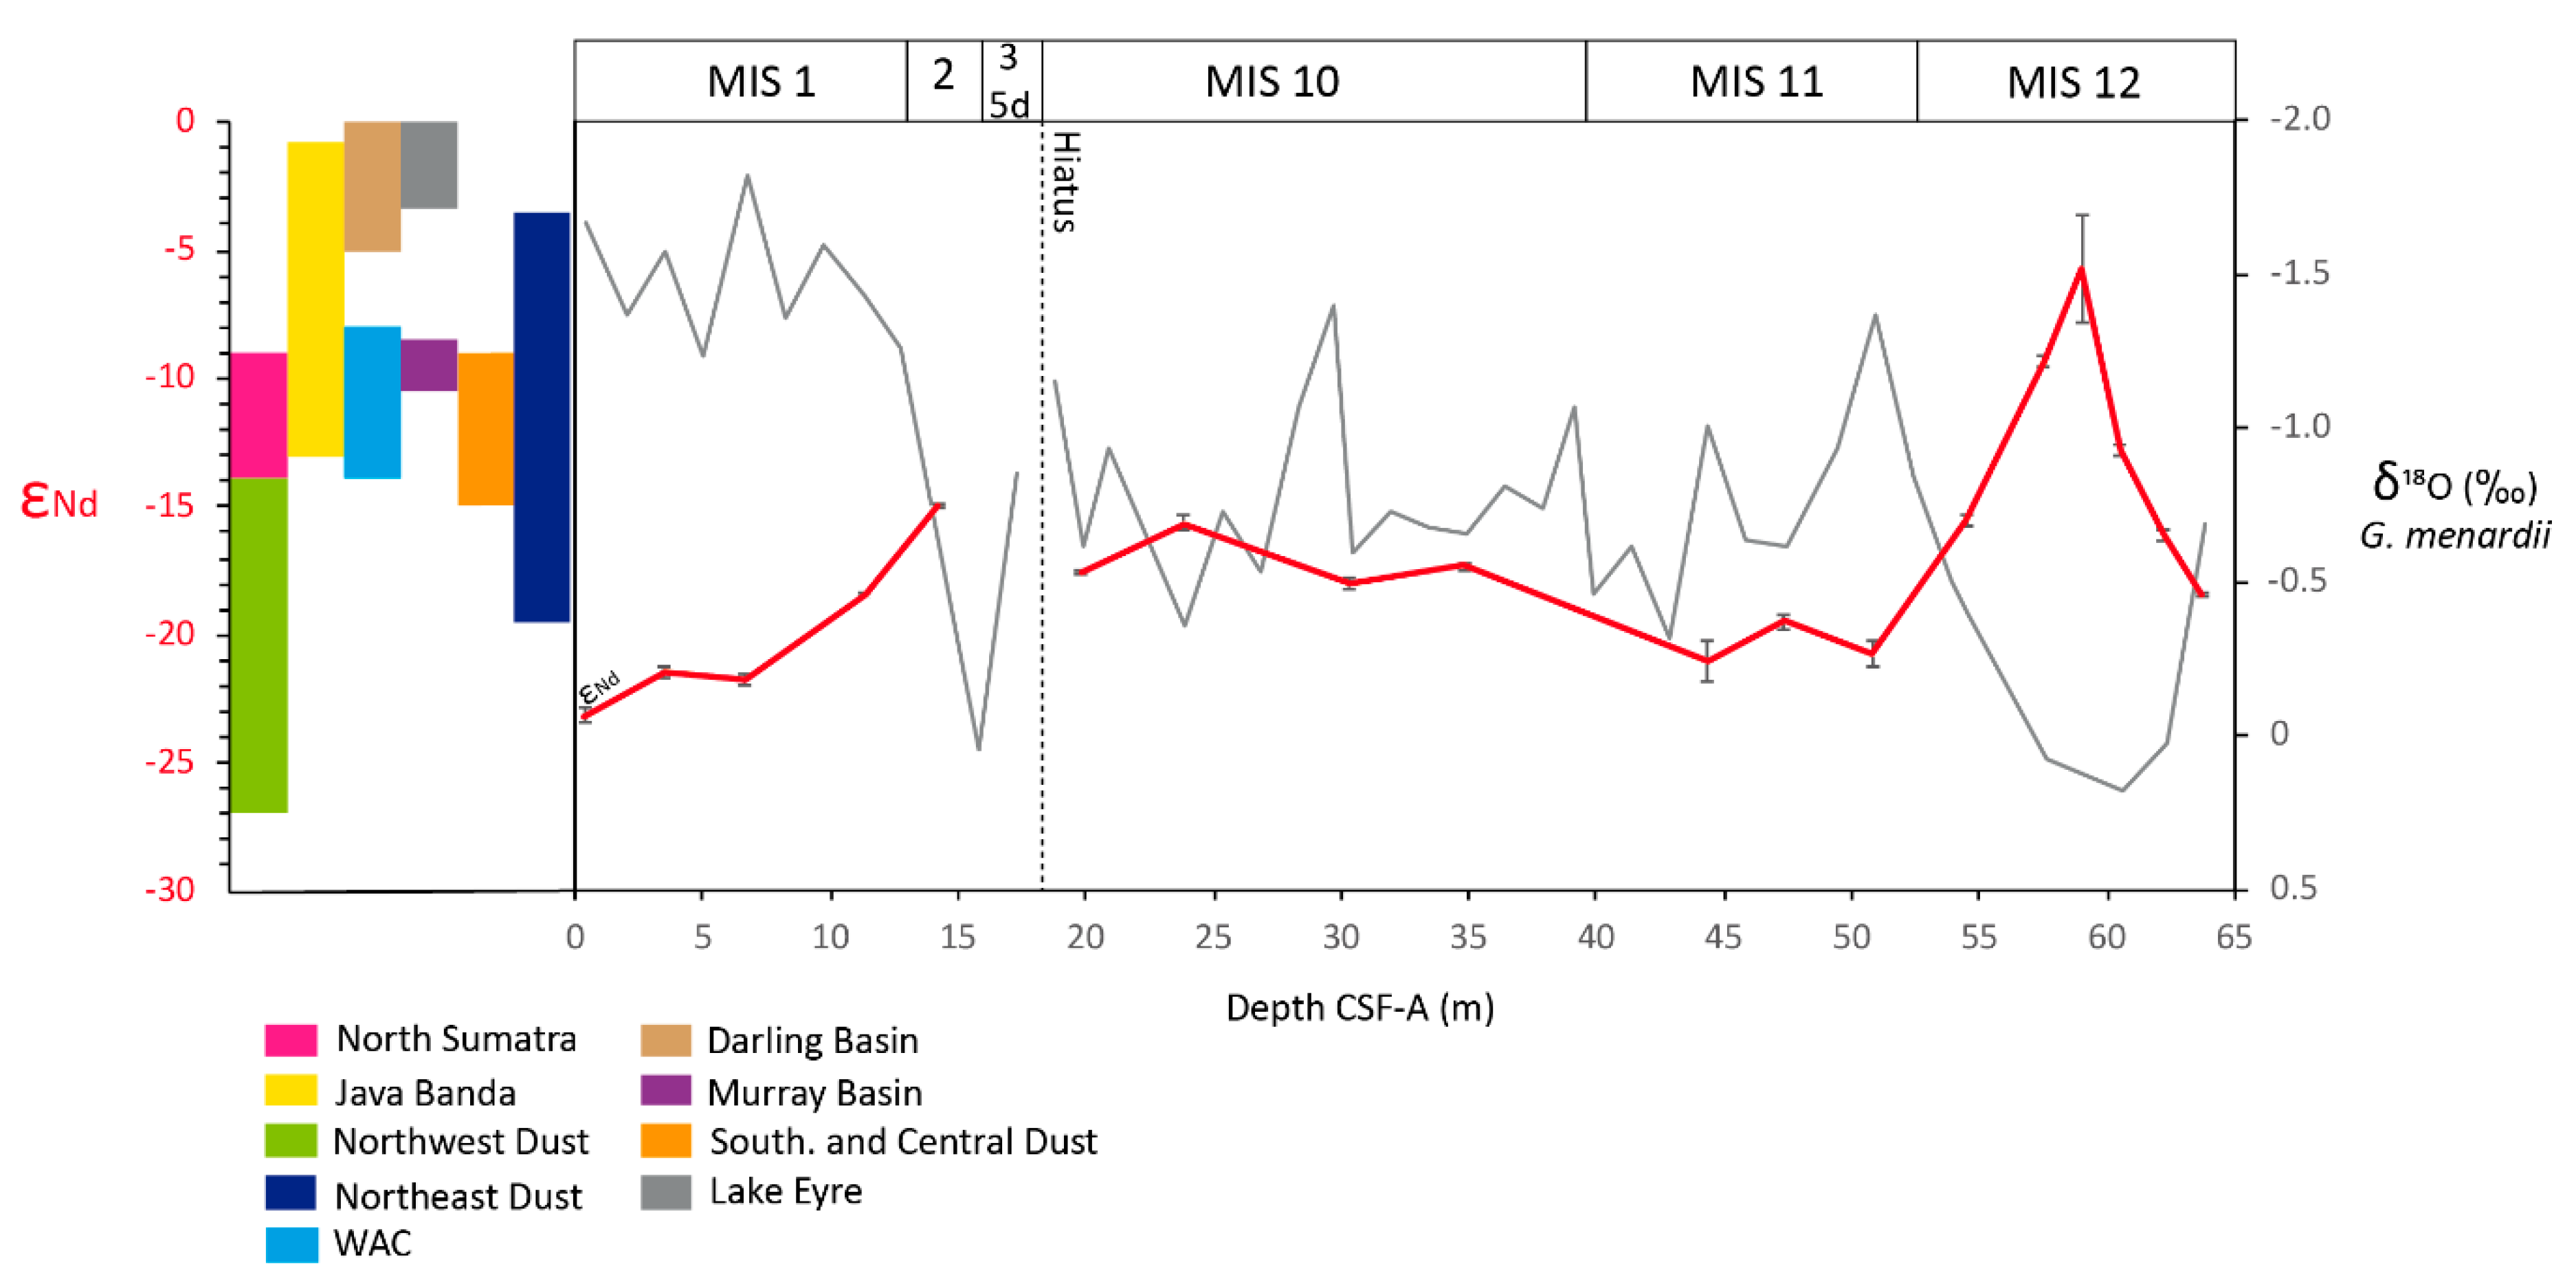
The εNd values are significantly more radiogenic during the glacial periods than during the interglacials.
Combined, these data suggest that large amounts of weathering products were deposited at Site U1461 by local rivers during interglacials and especially during MIS 1. This rise could be interpreted as a pulse in the riverine input possibly due to an enhanced ASM; this occurs when cyclonic depressions (i.e., heavy precipitation) pass over northern Australia and generate huge fluvial discharges into the sea [11]. Such a cyclonic (and fluvial discharge) event can be tentatively correlated to the maximum water level at Lake Gregory around 6 ky that marks the reinvigoration of the ASM in the northwestern sector after the last glaciation [82]. Nonetheless, this event is significant but ephemeral because drier conditions are observed subsequently. By contrast, glacial periods were characterized by aeolian sediments at Site U1461A, for which potential sources are discussed in more detail in the following subsection.

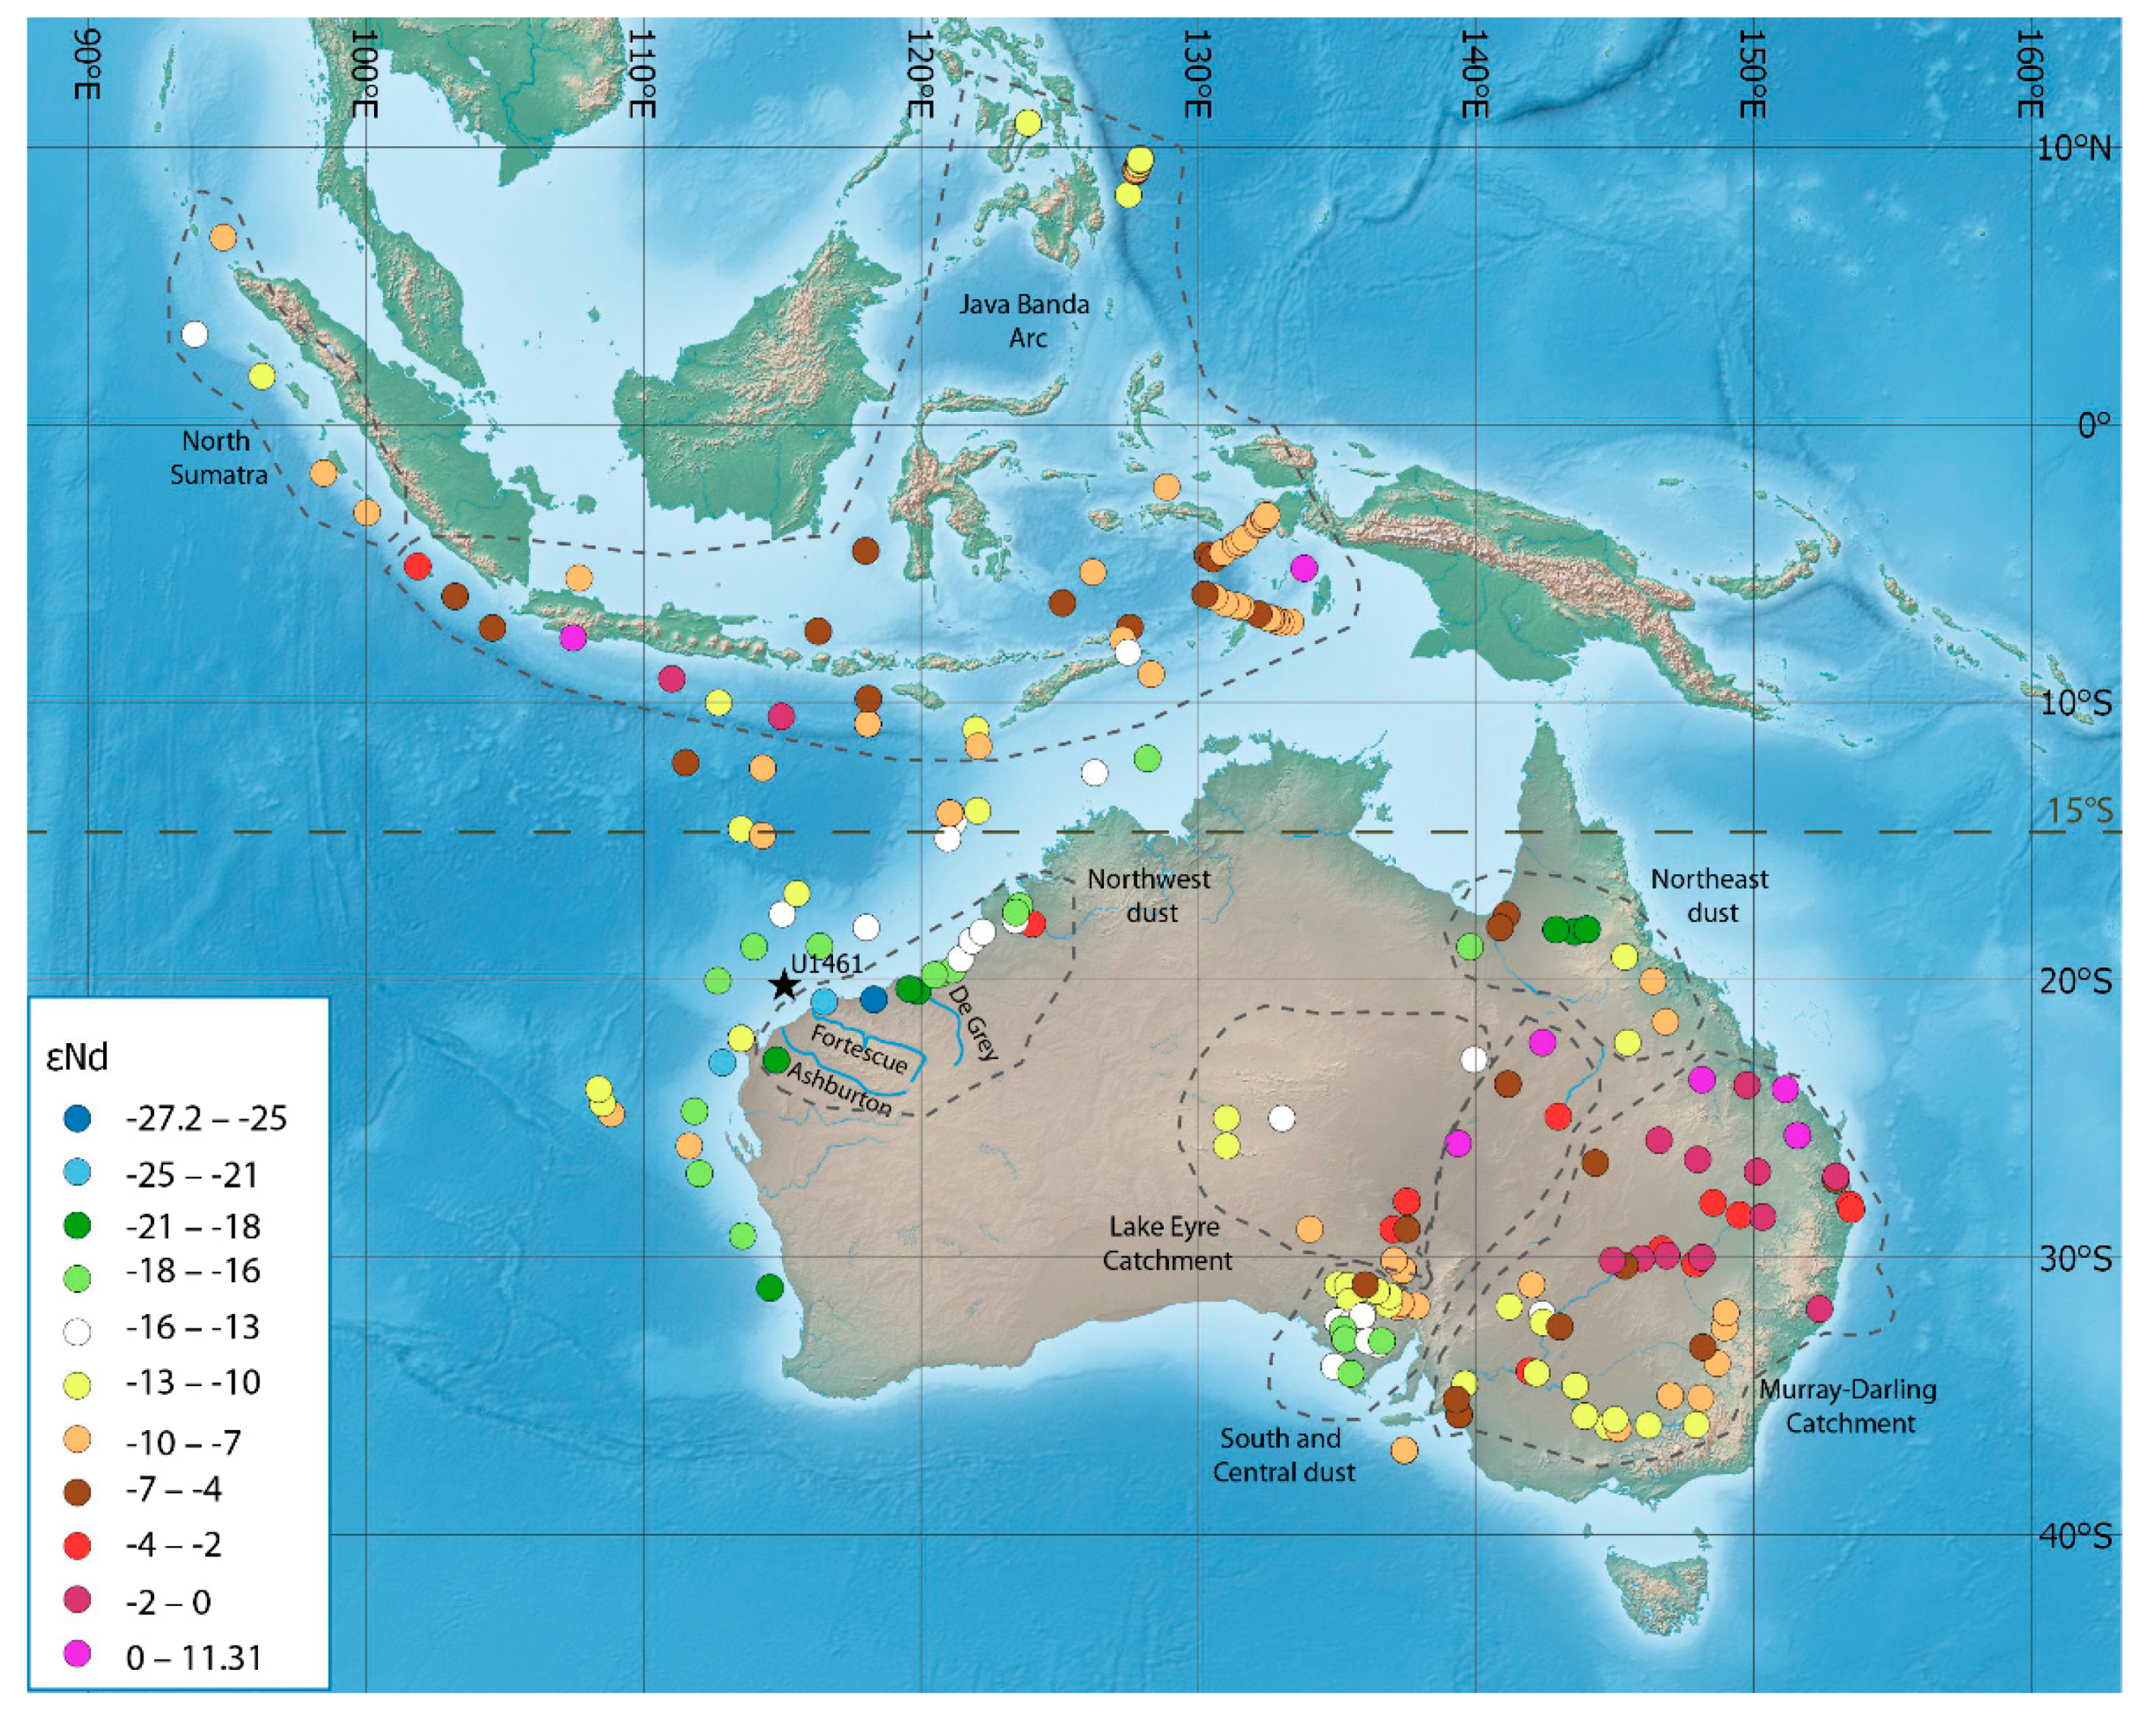
5.3. Composition of Surface Sediments in the Australian Continent: Insights from Radiogenic Isotopes Distribution

To trace the origin of the terrigenous material at Site U1461, the isotopic composition of potential sediment source areas was investigated, using Nd isotopes from Australian continental surface sediments as well as sediments from the Eastern Indian Ocean (Figure 7).
Radiogenic isotope signatures were used for providing information about the sediment source area on the NW Australia shelf. This proxy can be particularly useful and provides insights on parameters such as the degree of continental aridity (paleo-hydrology and vegetation cover), the atmospheric circulation, and the associated wind strength.
The Nd isotope composition generally displays a large range of values depending on the age and composition of the rocks but not on the size fraction of the sediment. Bayon et al. (2015) [84] demonstrated that between the <2 and 2–63 µm size fraction, only small differences (from +1 to −1) can be observed on the εNd.
A marked isotopic boundary is present around 15°S, separating the Australian shelf from the Indonesian region. Samples around Indonesia (North Sumatra and Java Banda Arc) show very high radiogenic Nd signatures due to the volcanism (εNd max = 0.7, [89]). In contrast, the northwestern and western coast of Australia are characterized by low εNd (min = −27.2 [2,10]). In eastern Australia, there is a zonation of isotopic values. In the northeast, εNd values range between −19.6 and 3.57 [87]. In the central and southern regions, εNd values span between −9 and −15 [26,83], but are higher at Lake Eyre (between 0 and −3.57). In the south, there is also a significant difference between the Darling Basin (−5 < εNd < 0) and the Murray Basin (−11 < εNd < −9) [26,83].
At Site U1461A, the relative variations of log(Zr + Fe + Ti)/(Al + K) ratio, the concentration in U, and the log(Zr/Fe) indicate (as discussed in Section 5.2 above) that part of the sediment deposited on the shelf likely has an aeolian origin (Figure 4), especially during glacial periods. This hypothesis seems to be corroborated by the sediment radiogenic isotopic signature (Figure 4a). The most remarkable result is the high εNd radiogenic value during MIS 12 that suggests possible predominant sediment source areas from Lake Eyre, the Northeast sectors, and the Darling Basin. Definitively, the isotopic signature of dust coming from the NW sector of the Australian continent (−26 < εNd < −14) does not match the sediment composition corresponding to MIS 12 in the U1461A borehole (Figure 8). This result implies that a significant part of the sediment must have been transported to Site U1461 by wind. Moreover, the supply in dust must have been significant, and the pathway would have followed the SE trade winds. The latter hypothesis was raised by McGowan and Clark (2008) based on the results of an analysis using the HYSPLIT model. The authors claim that Lake Eyre sediments could be transported over long distances, even reaching the northwestern coast of Australia or the Philippines [90]. In addition, this idea is somewhat congruent with results obtained using clay mineral tracers in marine cores [91,92] that exclude the contribution of terrigenous sediment coming from the northwestern Australian sector during the last glacial period. In the Site U1461, the εNd value in the MIS 2, is less radiogenic (Figure 4 and Figure 8). This means that the signal is less clear and either a more proximal source (Northwest Dust) was predominant during this period or that the source was located in northeast Australia or in the south and central part of Australia (Figure 7 and Figure 8). This scenario implies that the Australian monsoon belt was positioned farther north with the establishment of generally dry conditions over the continent with possible reinforcement of the SE trades winds. However, the possibility that a phase in the MIS 2 with climate conditions similar to MIS 12 (but not preserved) cannot be excluded. Overall, the long-distance, East to West transport of dust over the Australian continent during the major glacial stages is the leading interpretation for the following reasons.
The increased dust transport during glacial periods is well-documented in the Southern Pacific Ocean and Antarctica over the last 800 ky [17]. The terrigenous dust supply from Eastern Australia is found to be one of the major contributors in the Southern hemisphere [17,26,27];
The sediment contribution from the Java Banda Arc is excluded because (1) neither wind transport nor marine current are feasible and (2) there is no source of atmospheric soil dust identified in these regions [93]. It is known that the LC and the ITF intensities were reduced during the low sea level of MIS 2, and possibly during other glacial periods [91,94]. This assumption implies that during low sea level stages the sediment supply from the Indonesian Arc, transported southward along the Australian coast by the LC, might have been more complicated and strongly reduced. Concerning the possible contribution from the southern current in sediment supply, the isotopic signature of the West Australian Current (WAC) is approximately −12 for εNd [10]. These values are generally different from those measured at Site U1461 but, mixed with other sources it could be a potential source.

5.4. Reconstruction of Middle to Late Pleistocene Changes of the Main Source Sediment

Radiogenic isotope records reveal distinct changes in <63 µm fraction isotopic composition through time at Site U1461A. These changes are thought to reflect a significant shift in source sediment provenance and/or oceanographic circulation over the Quaternary. The most noteworthy result in clay-size sediments at this site is a large shift in Nd between MIS 12 and 11 and between MIS 2 and MIS 1. In both cases, the shift takes place at the transition between a long and strong glacial period to a warm interglacial [95]. Sediments deposited during the glacial periods are more radiogenic in their Nd isotope composition than those deposited during interglacial periods. We propose that more radiogenic signatures indicate a change in sediment provenance, possibly correlated with the pathways of dust in the atmosphere.
•  MIS 12-11
The Nd signature variations during MIS 12 likely reflect the isotopic signature of Nd coming from the central (Lake Eyre) or eastern (Murray Darling Basin) parts of the continent (Figure 6) by atmospheric transport. Riverine input was possibly reduced because of a dry climate related to the glacial period [22]; the sediment transported by oceanic current from the Java-Banda Arc was certainly limited or shut down due to the weakening of the LC as a consequence of sea-level fall [91,94].
•  MIS 2-1
Characteristics of the MIS 2/1 transition yield similarities and differences with the MIS 12/11 transition. Pollen assemblages off-shore NW Australia [96] suggest that the MIS 2 glacial maximum is the driest phase recorded on the continent over the last 65 ka, corresponding to the period of the weakest Australian Monsoon [97]. Moreover, Wengler et al. (2019) demonstrated that during the Holocene, dust from the eastern part of Australia was also transported to the South Pacific, proving again that there are two different dust pathways [28]. Accordingly, the log(Zr + Fe + Ti)/(Al + K) and Ti/Ca ratios suggest arid climate conditions (Figure 4) as the riverine input is at its minimum and the aeolian contribution appears to be significant, even though the εNd is less radiogenic than during MIS 12. This difference between MIS 2 and 12 records can be due to a mixed dust source coming from the eastern and western parts of the continent (Figure 7). Within MIS 2, a sudden decrease in log Zr/Fe ratio (Figure 6) suggests the establishment of more humid conditions after the glacial maximum. The comparison to δ18O in Australian speleothems of the Ball Gown Cave [43] suggests that it might correspond to the peak of the Indian-ASM. The precipitation anomaly interpreted from an increase in speleothem growth rates coincides with the Heinrich Event 0 (H0 in Figure 6) during which tropical moisture was conveyed over the Australian continent because of a southward shift in the Intertropical Convergence Zone (ITCZ) generated by high northern latitude cooling events [43].
Sedimentary records of dry phases on land are very rare because of their fragmented nature and the difficulty to date. Nonetheless, the activity of sand dune fields in the inner part of Australia might provide information of the atmospheric activity, particularly regarding dust transport [98,99]. Generally speaking, glacial dune activity highlights that the cold intervals were arid in all parts of Australia and were characterized by sparse vegetation, reduced rainfall, and consequently greater dust flux and possibly stronger winds.
Different radiogenic isotope signatures between MIS 2 and MIS 12 are herein taken for evidence of a change in dust source. This observation raises the question whether the difference in the source area is linked to the wind intensity or to a general reorganization of the atmospheric circulation during two very strong Pleistocene glaciations.
Regarding MIS 2, the correlation with dust records from South Atlantic (ODP 1090) [18], South Pacific (PS75/076-2) [17], Antarctica (EDC) [19], and South East Indian Ocean (MD00-2361) [12] (Figure 6a) shows an increased dust input in the entire Southern Hemisphere. Nonetheless, records from the Indian Ocean (Site U1461 and core MD00-2361) show a different pattern, with no prominent peaks during the MIS2, contrarily to the other records from the Southern Hemisphere where a maximum of dust transport is registered 17 ka, during the glacial maximum.
During MIS2, it is assumed that the wind strength was not greater than today [30,100], but a well-established model of the circulation pattern is not yet available for this specific period over the Australian continent. The Southern Hemisphere Westerlies are thought to be associated to the extension of the ice around the Antarctica but their position is influenced by the sea surface temperatures and changed over time in relation to climate conditions and paleogeographic configuration [64]. Despite the complexity in determining the role of ice extent in the Westerlies position in the past using numerical modeling, a general cooling (without the effect of sea ice) in the Southern Hemisphere during the MIS2 would favor a northward shift of the westerly position [101]. If the sea ice extension is taken into account in the models, this reverses the equatorward trend in cooler climates with the Westerlies possibly shifted slightly poleward [101]. However, evidence of increased dust fallout over the Tasman Sea suggests that westerlies were drier and possibly displaced toward the North during MIS 2 [100,102]. This observation matches also at Site U1461 with the hypothesis that the primary dust contribution came from a proximal source (Northwest dust in Figure 7). In this scenario, SE trades winds belt would have pushed northward, whereas easterlies would have deflated the dry central-southeast part of Australia and mainly blow the dust westward. This pattern corroborates the atmospheric circulation model reconstructed for Antarctica and low latitudes at the glacial–interglacial periods: the dust arriving in Antarctica originates mainly from South American sources [19]. This is explained by the stronger aeolian deflation of southern South America and dust particle lifetime along their pathway in the high-altitude troposphere over the Southern Ocean during the glacial maxima. On the other hand, the dust blown into the Eastern Indian Ocean is mainly emitted from the Australian continent and is related to the local easterlies dynamics.
The comparison of Site U1461 to other records from the Southern Hemisphere (Figure 6b) for the MIS 12 shows a gradual increase of dust abundance from 475 to 430 ka. Unfortunately, the glacial maximum at Site U1461 cannot be compared because of missing core recovery at this interval (430–450 ka) but all the plots encompass nicely indicating an enhanced dust circulation in the entire Southern Hemisphere from the beginning of MIS 12.
The signature of the dust provenance at the site U1461 during MIS12 indicates a central (Lake Eyre) or eastern (Murray Darling Basin) continental source (Figure 7 and Figure 8). However, the configuration of atmospheric processes at the origin of the dust transport over Australia MIS 12 is difficult to reconstruct since no long paleo-record exists for comparison on the continent. The best-known and oldest-dated sand dune fields in Australia are located in the Lake Eyre Basin but, unfortunately, those dunes are not directly comparable to the U1461 record from MIS 12 because the oldest dunes date around 300 ky ago (MIS 11) [30,103].
A hypothesis for explaining the long-range dust transport (from central Australia, Lake Eyre Basin) could rely on the evidence that during the severe glacial periods (MIS 10 and 12), the Subtropical Front moved northward almost shutting down the Agulhas Current and consequently affected the strengths of local Australian winds [104]. According to a theoretical global model, enhanced cooling could have weakened the surface westerlies and shifted the peak westerly stress toward the equator—suggesting that such a process may have occurred during MIS 2 [105]. In addition, and in contrast to MIS 2, an increase in the polar sea ice (during MIS 10 and 12) might have induced the shift of the peak westerly stress toward the pole and also increased the strength of the SE trades winds, which in the case of Australia could generate a long-distance east to west dust transport. The dust pathway is, thus, a clear indication of a very particular atmospheric circulation during the severe glaciation of MIS 12. The U1461A borehole provides the first evidence of the position of this paleo-corridor on a long time scale.

6. Conclusions

IODP coring of the Northwest Shelf of Australia during Expedition 356 revealed a sedimentary record sufficiently extensive to identify and study major global climate cycles, especially the transition between MIS 2/1 and MIS 12/11. The major challenge has been the reconstruction of a reliable chronostratigraphic framework using micropaleontological and geochemical tools, because of the discontinuous features of the sedimentary record at Site U1461. The benthic foraminifera assemblages, together with corals and bryozoans allowed estimating the relative paleo-depth, especially during low sea levels. Typical shallow-water, off-reef shelf foraminifera that include A. gaimardii and P. verriculata occur during the major glacials (MIS 2 and MIS 12), suggesting that the water depth was fairly shallow (<20 m) at site U1461, and therefore possibly affected by erosional processes. Nonetheless, the good preservation of corals and bryozoans indicate that they are likely in situ and thus provide reliable information for climate reconstruction. In particular, the Nd isotope signature trend suggests that during interglacial periods the ASM was active, leading to increased riverine discharge, whereas during strong glacial periods aeolian transport was enhanced.
For the first time and on such long Quaternary time scale, the variability of the isotope data in the sedimentary sequence from Site U1461 shows that during MIS 12, dust probably came from the Lake Eyre or the Northeastern part of the continent, where Nd isotopic signature is very radiogenic. In contrast, the less radiogenic Nd isotope values during MIS 2 suggest a different dust source, from a more proximal area, than that during MIS 12.

Supplementary Materials

The following are available online at https://www.mdpi.com/2073-4433/11/11/1251/s1, Figure S1: Comparison between Log(Ti/Ca) and Log(Zr/Fe) from the Site U1461 and the ones from the core MD00-2361, Figure S2: Hierarchical analysis of the species with more than 2% of abundance following the Ward’s method. The black line is the chosen distance to form the clusters. The numbers correspond to the name of the cluster, Table S1: Tie points for the age model. The transitions between the MIS have been dated following Liesecki and Raymo (2005) age, Table S2: Pourcentage of cluster abundances. Cluster 7a is composed of Triloculina sp. Spiroloculina sp. Hyalinea balthica. Sahulia patteliformis and Sigmohauerina sp. Cluster 7b is composed of Planispirinella exigua and Peneroplis pertusus.

Author Contributions

Conceptualization, M.C., M.-A.B. and D.A.; methodology, M.C.; software, M.C.; validation, M.C., M.-A.B. and D.A.; formal analysis, M.C.; investigation, M.C.; resources, M.C.; data curation, M.C.; writing—original draft preparation, M.C.; writing—review and editing, M.C., M.-A.B., D.A., C.J., M.H., L.R., P.M., S.M., C.K., M.S.-P.; visualization, M.C.; supervision, M.C.; project administration, M.C.; funding acquisition, M.-A.B., M.C. and M.S.-P. All authors have read and agreed to the published version of the manuscript.

Funding

This research was funded by IODP-France and by the PhD fellowship funded by the French Ministry of Research. The DFG (German Science Foundation, Project 320220579) provided funding to LR. This research also benefited from the European Union’s Horizon 2020 Research and Innovation Programme under the Marie Sklodowska-Curie Grant Agreement No 799531 to MSP.

Acknowledgments

The authors would like to acknowledge Jeroen Groenveld and Jorijntje Henderiks for the numerous tips and feedback about the age model. The authors acknowledge the International Ocean Discovery Program Expedition 356 “Indonesian Throughflow” co-chiefs and cruise https://iodp.tamu.edu/scienceops/expeditions/indonesian_throughflow.html) for giving access to the samples studied in this work. The French National IODP bureau is thanked for providing financial support and the GET laboratory (Toulouse) for giving access to the laboratory facilities. The datasets used and/or analyzed during the current study are available on PANGEA data web site following this link: https://www.pangaea.de/tok/6bd6527345473ff2388b5f3542edcc46f75a86d5. All data generated during IODP Expedition 356 are publicly accessible via the IODP-JOIDES Resolution Science Operator website (www.iodp.tamu.edu). The authors greatly acknowledge the three anonymous reviewers for their comments and corrections as they improved greatly the manuscript.

Conflicts of Interest

The authors declare no conflict of interest. The funders had no role in the design of the study; in the collection, analyses, or interpretation of data; in the writing of the manuscript, or in the decision to publish the results.

References

  1. Kottek, M.; Grieser, J.; Beck, C.; Rudolf, B.; Rubel, F. World map of the Köppen-Geiger climate classification updated. Meteorol. Z. 2006, 15, 259–263. [Google Scholar] [CrossRef]
  2. De Deckker, P. An evaluation of Australia as a major source of dust. Earth Sci. Rev. 2019, 194, 536–567. [Google Scholar] [CrossRef]
  3. Shulmeister, J. Australasian evidence for mid-Holocene climate change implies precessional control of Walker Circulation in the Pacific. Quat. Int. 1999, 57, 81–91. [Google Scholar] [CrossRef]
  4. Ellerton, D.; Shulmeister, J.; Woodward, C.; Moss, P. Last Glacial Maximum and Last Glacial–Interglacial Transition pollen record from northern NSW, Australia: Evidence for a humid late Last Glacial Maximum and dry deglaciation in parts of eastern Australia. J. Quat. Sci. 2017, 32, 717–728. [Google Scholar] [CrossRef]
  5. Petherick, L.; Shulmeister, J.; Knight, J.; Rojas, M. SHeMax: The Last Glacial Maximum in the southern hemisphere. Quat. Australas. 2016, 33, 32. [Google Scholar]
  6. Betzler, C.; Eberli, G.; Lüdmann, T.; Reolid, J.; Kroon, D.; Reijmer, J.; Swart, P.; Wright, J.; Young, J.; Alvarez-Zarikian, C. Refinement of Miocene sea level and monsoon events from the sedimentary archive of the Maldives (Indian Ocean). Prog. Earth Planet. Sci. 2018, 5, 5. [Google Scholar] [CrossRef]
  7. Tada, R.; Zheng, H.; Clift, P.D. Evolution and variability of the Asian monsoon and its potential linkage with uplift of the Himalaya and Tibetan Plateau. Prog. Earth Planet. Sci. 2016, 3, 4. [Google Scholar] [CrossRef] [Green Version]
  8. Wang, Y.-J.; Cheng, H.; Edwards, R.L.; An, Z.; Wu, J.; Shen, C.-C.; Dorale, J.A. A high-resolution absolute-dated late Pleistocene monsoon record from Hulu Cave, China. Science 2001, 294, 2345–2348. [Google Scholar] [CrossRef] [Green Version]
  9. Meneghini, B.; Simmonds, I.; Smith, I.N. Association between Australian rainfall and the southern annular mode. Int. J. Climatol. A J. R. Meteorol. Soc. 2007, 27, 109–121. [Google Scholar] [CrossRef]
  10. Ehlert, C.; Frank, M.; Haley, B.; Boeniger, U.; De Deckker, P.; Gingele, F. Current transport versus continental inputs in the eastern Indian Ocean: Radiogenic isotope signatures of clay size sediments. Geochem. Geophys. Geosystems 2011, 12. [Google Scholar] [CrossRef] [Green Version]
  11. Stuut, J.B.W.; De Deckker, P.; Saavedra-Pellitero, M.; Bassinot, F.; Drury, A.J.; Walczak, M.H.; Nagashima, K.; Murayama, M. A 5.3-million-year history of monsoonal precipitation in northwestern Australia. Geophys. Res. Lett. 2019, 46, 6946–6954. [Google Scholar] [CrossRef] [Green Version]
  12. Stuut, J.-B.W.; Temmesfeld, F.; De Deckker, P. A 550 ka record of aeolian activity near North West Cape, Australia: Inferences from grain-size distributions and bulk chemistry of SE Indian Ocean deep-sea sediments. Quat. Sci. Rev. 2014, 83, 83–94. [Google Scholar] [CrossRef]
  13. Hallenberger, M.; Reuning, L.; Gallagher, S.J.; Back, S.; Ishiwa, T.; Christensen, B.A.; Bogus, K. Increased fluvial runoff terminated inorganic aragonite precipitation on the Northwest Shelf of Australia during the early Holocene. Sci. Rep. 2019, 9, 18356. [Google Scholar] [CrossRef]
  14. Chase, B.M.; Meadows, M.E. Late Quaternary dynamics of southern Africa’s winter rainfall zone. Earth Sci. Rev. 2007, 84, 103–138. [Google Scholar] [CrossRef]
  15. Stuut, J.-B.W.; Prins, M.A.; Schneider, R.R.; Weltje, G.J.; Jansen, J.F.; Postma, G. A 300-kyr record of aridity and wind strength in southwestern Africa: Inferences from grain-size distributions of sediments on Walvis Ridge, SE Atlantic. Mar. Geol. 2002, 180, 221–233. [Google Scholar] [CrossRef]
  16. Stuut, J.-B.W.; Lamy, F. Climate variability at the southern boundaries of the Namib (southwestern Africa) and Atacama (northern Chile) coastal deserts during the last 120,000 yr. Quat. Res. 2004, 62, 301–309. [Google Scholar] [CrossRef]
  17. Lamy, F.; Gersonde, R.; Winckler, G.; Esper, O.; Jaeschke, A.; Kuhn, G.; Ullermann, J.; Martínez-Garcia, A.; Lambert, F.; Kilian, R. Increased dust deposition in the Pacific Southern Ocean during glacial periods. Science 2014, 343, 403–407. [Google Scholar] [CrossRef] [Green Version]
  18. Martínez-García, A.; Sigman, D.M.; Ren, H.; Anderson, R.F.; Straub, M.; Hodell, D.A.; Jaccard, S.L.; Eglinton, T.I.; Haug, G.H. Iron fertilization of the Subantarctic Ocean during the last ice age. Science 2014, 343, 1347–1350. [Google Scholar] [CrossRef]
  19. Lambert, F.; Delmonte, B.; Petit, J.-R.; Bigler, M.; Kaufmann, P.R.; Hutterli, M.A.; Stocker, T.F.; Ruth, U.; Steffensen, J.P.; Maggi, V. Dust-climate couplings over the past 800,000 years from the EPICA Dome C ice core. Nature 2008, 452, 616–619. [Google Scholar] [CrossRef] [Green Version]
  20. Bowler, J. Aridity in Australia: Age, Origins and Expression in Aeolian Landforms and Sediments; Elsevier: Amsterdam, The Netherlands, 1976; Volume 12, pp. 279–310. [Google Scholar]
  21. De Deckker, P.; Norman, M.; Goodwin, I.D.; Wain, A.; Gingele, F.X. Lead isotopic evidence for an Australian source of aeolian dust to Antarctica at times over the last 170,000 years. Palaeogeogr. Palaeoclimatol. Palaeoecol. 2010, 285, 205–223. [Google Scholar] [CrossRef]
  22. Hesse, P.P.; McTainsh, G.H. Australian dust deposits: Modern processes and the Quaternary record. Quat. Sci. Rev. 2003, 22, 2007–2035. [Google Scholar] [CrossRef]
  23. McTainsh, G. Quaternary aeolian dust processes and sediments in the Australian region. Quat. Sci. Rev. 1989, 8, 235–253. [Google Scholar] [CrossRef]
  24. De Deckker, P. Airborne dust traffic from Australia in modern and Late Quaternary times. Glob. Planet. Chang. 2020, 184, 103056. [Google Scholar] [CrossRef]
  25. Marx, S.K.; McGowan, H.A.; Kamber, B.S. Long-range dust transport from eastern Australia: A proxy for Holocene aridity and ENSO-type climate variability. Earth Planet. Sci. Lett. 2009, 282, 167–177. [Google Scholar] [CrossRef]
  26. Revel-Rolland, M.; De Deckker, P.; Delmonte, B.; Hesse, P.; Magee, J.; Basile-Doelsch, I.; Grousset, F.; Bosch, D. Eastern Australia: A possible source of dust in East Antarctica interglacial ice. Earth Planet. Sci. Lett. 2006, 249, 1–13. [Google Scholar] [CrossRef]
  27. Hesse, P.P. The record of continental dust from Australia in Tasman Sea sediments. Quat. Sci. Rev. 1994, 13, 257–272. [Google Scholar] [CrossRef]
  28. Wengler, M.; Lamy, F.; Struve, T.; Borunda, A.; Boening, P.; Geibert, W.; Kuhn, G.; Pahnke, K.; Roberts, J.; Tiedemann, R. A geochemical approach to reconstruct modern dust fluxes and sources to the South Pacific. Geochim. Et Cosmochim. Acta 2019, 264, 205–223. [Google Scholar] [CrossRef]
  29. Kohfeld, K.E.; Harrison, S.P. DIRTMAP: The geological record of dust. Earth Sci. Rev. 2001, 54, 81–114. [Google Scholar] [CrossRef]
  30. Hesse, P.P.; Magee, J.W.; van der Kaars, S. Late Quaternary climates of the Australian arid zone: A review. Quat. Int. 2004, 118, 87–102. [Google Scholar] [CrossRef]
  31. Fitzsimmons, K.E.; Cohen, T.J.; Hesse, P.P.; Jansen, J.; Nanson, G.C.; May, J.-H.; Barrows, T.T.; Haberlah, D.; Hilgers, A.; Kelly, T. Late Quaternary palaeoenvironmental change in the Australian drylands. Quat. Sci. Rev. 2013, 74, 78–96. [Google Scholar] [CrossRef]
  32. Karlson, L.; Greene, R.; Scott, K.; Stelcer, E.; O’Loingsigh, T. Characteristics of aeolian dust across northwest Australia. Aeolian Res. 2014, 12, 41–46. [Google Scholar] [CrossRef]
  33. Potemra, J.T. Indonesian Throughflow transport variability estimated from satellite altimetry. Oceanography 2005, 18, 98–107. [Google Scholar] [CrossRef]
  34. Feng, M.; Meyers, G. Interannual variability in the tropical Indian Ocean: A two-year time-scale of Indian Ocean Dipole. Deep Sea Res. Part Ii Top. Stud. Oceanogr. 2003, 50, 2263–2284. [Google Scholar] [CrossRef] [Green Version]
  35. Tomczak, M.; Godfrey, J.S. Regional Oceanography: An Introduction; Elsevier: Amsterdam, The Netherlands, 2013; p. 437. [Google Scholar]
  36. Feng, M.; Waite, A.; Thompson, P. Climate variability and ocean production in the Leeuwin Current system off the west coast of Western Australia. J. R. Soc. West. Aust. 2009, 92, 67. [Google Scholar]
  37. Gentilli, J. Climates of Australia and New Zealand; Elsevier Pub. Co.: Washington, DC, USA, 1971. [Google Scholar]
  38. Gimeno, L.; Drumond, A.; Nieto, R.; Trigo, R.M.; Stohl, A. On the origin of continental precipitation. Geophys. Res. Lett. 2010, 37. [Google Scholar] [CrossRef]
  39. Suppiah, R. The Australian summer monsoon: A review. Prog. Phys. Geogr. 1992, 16, 283–318. [Google Scholar] [CrossRef]
  40. McBride, J.L. The Australian summer monsoon. Monsoon Meteorol. 1987, 203, 13. [Google Scholar]
  41. Gallagher, S.J.; Wallace, M.W.; Li, C.L.; Kinna, B.; Bye, J.T.; Akimoto, K.; Torii, M. Neogene history of the West Pacific warm pool, Kuroshio and Leeuwin currents. Paleoceanography 2009, 24. [Google Scholar] [CrossRef] [Green Version]
  42. Kuhnt, W.; Holbourn, A.; Xu, J.; Opdyke, B.; De Deckker, P.; Röhl, U.; Mudelsee, M. Southern Hemisphere control on Australian monsoon variability during the late deglaciation and Holocene. Nat. Commun. 2015, 6, 5916. [Google Scholar] [CrossRef] [Green Version]
  43. Denniston, R.F.; Asmerom, Y.; Lachniet, M.; Polyak, V.J.; Hope, P.; An, N.; Rodzinyak, K.; Humphreys, W.F. A Last Glacial Maximum through middle Holocene stalagmite record of coastal Western Australia climate. Quat. Sci. Rev. 2013, 77, 101–112. [Google Scholar] [CrossRef]
  44. Gallagher, S.; Fulthorpe, C.; Bogus, K.; Auer, G.; Baranxal, S.; Castañeda, I.S.; Christensen, B.A.; de Vleeschouwer, D.; Franco, D.R.; Groeneveld, J.; et al. Expedition 356 summary. Proc. Int. Ocean Discov. Program 2017, 356. [Google Scholar] [CrossRef]
  45. Ishiwa, T.; Yokoyama, Y.; Reuning, L.; McHugh, C.M.; De Vleeschouwer, D.; Gallagher, S.J. Australian Summer Monsoon variability in the past 14,000 years revealed by IODP Expedition 356 sediments. Prog. Earth Planet. Sci. 2019, 6, 17. [Google Scholar] [CrossRef] [Green Version]
  46. Kucera, M. Chapter six planktonic foraminifera as tracers of past oceanic environments. Dev. Mar. Geol. 2007, 1, 213–262. [Google Scholar]
  47. Lisiecki, L.E.; Raymo, M.E. A Pliocene-Pleistocene stack of 57 globally distributed benthic δ18O records. Paleoceanography 2005, 20. [Google Scholar] [CrossRef] [Green Version]
  48. Raffi, I.; Backman, J.; Fornaciari, E.; Pälike, H.; Rio, D.; Lourens, L.; Hilgen, F. A review of calcareous nannofossil astrobiochronology encompassing the past 25 million years. Quat. Sci. Rev. 2006, 25, 3113–3137. [Google Scholar] [CrossRef]
  49. Holbourn, A.; Henderson, A.S.; MacLeod, N. Atlas of Benthic Foraminifera; John Wiley & Sons: Hoboken, NJ, USA, 2013. [Google Scholar]
  50. Hanagata, S.; Nobuhara, T. Illustrated guide to Pliocene foraminifera from Miyakojima, Ryukyu Island Arc, with comments on biostratigraphy. Palaeontol. Electron. 2015, 1, 1–140. [Google Scholar]
  51. Panchang, R.; Nigam, R. Benthic ecological mapping of the Ayeyarwady delta shelf off Myanmar, using foraminiferal assemblages. J. Palaeontol. Soc. India 2014, 59, 121–168. [Google Scholar]
  52. Hammer, Ř.; Harper, D.; Ryan, P. PAST: Paleontological Statistics Software Package for Education and Data Analysis. Palaeontol. Electron. 2001, 4, 9. [Google Scholar]
  53. Phleger, F.B. Ecology and Distribution of Recent Foraminifera; Johns Hopkins Press: Baltimore, MD, USA, 1960. [Google Scholar]
  54. Boltovskoy, E.; Wright, R. Recent Foraminifera.–The Hague; Dr. W. Junk bv Publishers: The Hague, The Netherlands, 1976. [Google Scholar]
  55. Dumas, C.; Aubert, D.; De Madron, X.D.; Ludwig, W.; Heussner, S.; Delsaut, N.; Menniti, C.; Sotin, C.; Buscail, R. Storm-induced transfer of particulate trace metals to the deep-sea in the Gulf of Lion (NW Mediterranean Sea). Environ. Geochem. Health 2014, 36, 995–1014. [Google Scholar] [CrossRef]
  56. Hamilton, P.; O’nions, R.; Bridgwater, D.; Nutman, A. Sm-Nd studies of Archaean metasediments and metavolcanics from West Greenland and their implications for the Earth’s early history. Earth Planet. Sci. Lett. 1983, 62, 263–272. [Google Scholar] [CrossRef]
  57. Taylor, S.R.; McLennan, S.M. The Continental Crust: Its Composition and Evolution; OSTI: Oak Ridge, TN, USA, 1985.
  58. Jaeschke, A.; Rühlemann, C.; Arz, H.; Heil, G.; Lohmann, G. Coupling of millennial-scale changes in sea surface temperature and precipitation off northeastern Brazil with high-latitude climate shifts during the last glacial period. Paleoceanography 2007, 22. [Google Scholar] [CrossRef]
  59. Folk, R.L. Reddening of desert sands; Simpson Desert, NT, Australia. J. Sediment. Res. 1976, 46, 604–615. [Google Scholar]
  60. Bullard, J.E.; White, K. Quantifying iron oxide coatings on dune sands using spectrometric measurements: An example from the Simpson-Strzelecki Desert, Australia. J. Geophys. Res. Solid Earth 2002, 107, ECV 5-1–ECV 5-11. [Google Scholar] [CrossRef]
  61. Mackie, D.S.; Peat, J.M.; McTainsh, G.H.; Boyd, P.W.; Hunter, K.A. Soil abrasion and eolian dust production: Implications for iron partitioning and solubility. Geochem. Geophys. Geosystems 2006, 7. [Google Scholar] [CrossRef]
  62. De Vleeschouwer, D.; Dunlea, A.G.; Auer, G.; Anderson, C.H.; Brumsack, H.; de Loach, A.; Gurnis, M.; Huh, Y.; Ishiwa, T.; Jang, K.; et al. Quantifying K, U, and Th contents of marine sediments using shipboard natural gamma radiation spectra measured on DV JOIDES Resolution. Geochem. Geophys. Geosyst. 2017, 18, 1053–1064. [Google Scholar] [CrossRef]
  63. Christensen, B.A.; Renema, W.; Henderiks, J.; De Vleeschouwer, D.; Groeneveld, J.; Castañeda, I.S.; Reuning, L.; Bogus, K.; Auer, G.; Ishiwa, T. Indonesian Throughflow drove Australian climate from humid Pliocene to arid Pleistocene. Geophys. Res. Lett. 2017, 44, 6914–6925. [Google Scholar] [CrossRef] [Green Version]
  64. Groeneveld, J.; Henderiks, J.; Renema, W.; McHugh, C.M.; De Vleeschouwer, D.; Christensen, B.A.; Fulthorpe, C.S.; Reuning, L.; Gallagher, S.J.; Bogus, K. Australian shelf sediments reveal shifts in Miocene Southern Hemisphere westerlies. Sci. Adv. 2017, 3, e1602567. [Google Scholar] [CrossRef] [Green Version]
  65. Schofield, A. Uranium Content of Igneous Rocks of Australia: 1: 5 000 000 Maps-Explanatory Notes and Discussion; Geoscience Australia: Canberra, ACT, Australia, 2009.
  66. Thompson, P.R.; Bé, A.W.; Duplessy, J.-C.; Shackleton, N.J. Disappearance of pink-pigmented Globigerinoides ruber at 120,000 yr BP in the Indian and Pacific Oceans. Nature 1979, 280, 554. [Google Scholar] [CrossRef]
  67. Integrated Ocean Drilling Program Expedition 346 Preliminary Report. Available online: http://publications.iodp.org/preliminary_report/346/index.html (accessed on 18 November 2020).
  68. Cairns, S.D. The azooxanthellate Scleractinia (Coelenterata: Anthozoa) of Australia. Rec. Aust. Mus. 2004, 56, 329. [Google Scholar] [CrossRef] [Green Version]
  69. Hoeksema, B.; Best, M. New observations on scleractinian corals from Indonesia: 2. Sipunculan-associated species belonging to the genera Heterocyathus and Heteropsammia. Zool. Meded. 1991, 65, 221–245. [Google Scholar]
  70. Baccaert, J. Distribution Patterns and Taxonomy of Benthic Foraminifera in the Lizard Island Reef Complex, Northern Great Barrier Reef, Australia. Ph.D. Thesis, University of Liege, Liège, Belgium, 1987; p. 661. [Google Scholar]
  71. Collins, A.C. Foraminifera. Great Barrier Reef Expedition 1928-29. Sci. Rep. 1958, 6, 335–437. [Google Scholar]
  72. Switzer, A.; Mamo, B.; Dominey-Howes, D.; Strotz, L.; Courtney, C.; Jones, B.; Haslett, S.; Everett, D. On the possible origins of an unusual (mid to late Holocene) coastal deposit, Old Punt Bay, south-east Australia. Geogr. Res. 2011, 49, 408–430. [Google Scholar] [CrossRef]
  73. Narayan, Y.R.; Pandolfi, J.M. Benthic foraminiferal assemblages from Moreton Bay, South-East Queensland, Australia: Applications in monitoring water and substrate quality in subtropical estuarine environments. Mar. Pollut. Bull. 2010, 60, 2062–2078. [Google Scholar] [CrossRef] [PubMed]
  74. Shackleton, N. Oxygen isotopes, ice volume and sea level. Quat. Sci. Rev. 1987, 6, 183–190. [Google Scholar] [CrossRef]
  75. Spratt, R.M.; Lisiecki, L.E. A Late Pleistocene sea level stack. Clim. Past 2016, 12, 1079–1092. [Google Scholar] [CrossRef] [Green Version]
  76. Yokoyama, Y.; De Deckker, P.; Lambeck, K.; Johnston, P.; Fifield, L.K. Sea-level at the Last Glacial Maximum: Evidence from northwestern Australia to constrain ice volumes for oxygen isotope stage 2. Palaeogeogr. Palaeoclimatol. Palaeoecol. 2001, 165, 281–297. [Google Scholar] [CrossRef]
  77. Morigi, C.; Jorissen, F.J.; Fraticelli, S.; Horton, B.P.; Principi, M.; Sabbatini, A.; Capotondi, L.; Curzi, P.V.; Negri, A. Benthic foraminiferal evidence for the formation of the Holocene mud-belt and bathymetrical evolution in the central Adriatic Sea. Mar. Micropaleontol. 2005, 57, 25–49. [Google Scholar] [CrossRef]
  78. Wright, R. 41. Neogene paleobathymetry of the Mediterranean based on benthic foraminifers from DSDP Leg 42a. Initial. Rep. Dsdp 1978, 42, 837–847. [Google Scholar]
  79. Moissette, P. Changes in bryozoan assemblages and bathymetric variations. Examples from the Messinian of northwest Algeria. Palaeogeogr. Palaeoclimatol. Palaeoecol. 2000, 155, 305–326. [Google Scholar] [CrossRef]
  80. Amini, Z.Z.; Adabi, M.H.; Burrett, C.F.; Quilty, P.G. Bryozoan distribution and growth form associations as a tool in environmental interpretation, Tasmania, Australia. Sediment. Geol. 2004, 167, 1–15. [Google Scholar] [CrossRef]
  81. Dix, G.R. High-energy, inner shelf carbonate facies along a tide-dominated non-rimmed margin, northwestern Australia. Mar. Geol. 1989, 89, 347–362. [Google Scholar] [CrossRef]
  82. Stuut, J.-B.W.; Crosta, X.; Van Der Borg, K.; Schneider, R. Relationship between Antarctic sea ice and southwest African climate during the late Quaternary. Geology 2004, 32, 909–912. [Google Scholar] [CrossRef]
  83. Wyrwoll, K.-H.; Miller, G.H. Initiation of the Australian summer monsoon 14,000 years ago. Quat. Int. 2001, 83, 119–128. [Google Scholar] [CrossRef]
  84. Bayon, G.; De Deckker, P.; Magee, J.W.; Germain, Y.; Bermell, S.; Tachikawa, K.; Norman, M.D. Extensive wet episodes in Late Glacial Australia resulting from high-latitude forcings. Sci. Rep. 2017, 7, 44054. [Google Scholar] [CrossRef] [PubMed] [Green Version]
  85. Bayon, G.; Toucanne, S.; Skonieczny, C.; André, L.; Bermell, S.; Cheron, S.; Dennielou, B.; Etoubleau, J.; Freslon, N.; Gauchery, T. Rare earth elements and neodymium isotopes in world river sediments revisited. Geochim. Cosmochim. Acta 2015, 170, 17–38. [Google Scholar] [CrossRef] [Green Version]
  86. Goldstein, S.J.; Jacobsen, S.B. The Nd and Sr isotopic systematics of river-water dissolved material: Implications for the sources of Nd and Sr in seawater. Chem. Geol. Isot. Geosci. Sect. 1987, 66, 245–272. [Google Scholar] [CrossRef]
  87. Grousset, F.E.; Biscaye, P.E.; Revel, M.; Petit, J.-R.; Pye, K.; Joussaume, S.; Jouzel, J. Antarctic (Dome C) ice-core dust at 18 ky BP: Isotopic constraints on origins. Earth Planet. Sci. Lett. 1992, 111, 175–182. [Google Scholar] [CrossRef]
  88. Kamber, B.S.; Greig, A.; Collerson, K.D. A new estimate for the composition of weathered young upper continental crust from alluvial sediments, Queensland, Australia. Geochim. Et Cosmochim. Acta 2005, 69, 1041–1058. [Google Scholar] [CrossRef]
  89. Liu, E.; Wang, X.-C.; Zhao, J.-x.; Wang, X. Geochemical and Sr–Nd isotopic variations in a deep-sea sediment core from Eastern Indian Ocean: Constraints on dust provenances, paleoclimate and volcanic eruption history in the last 300,000 years. Mar. Geol. 2015, 367, 38–49. [Google Scholar] [CrossRef] [Green Version]
  90. Vroon, P.; Van Bergen, M.; Klaver, G.; White, W. Strontium, neodymium, and lead isotopic and trace-element signatures of the East Indonesian sediments: Provenance and implications for Banda Arc magma genesis. Geochim. Cosmochim. Acta 1995, 59, 2573–2598. [Google Scholar] [CrossRef]
  91. McGowan, H.; Clark, A. Identification of dust transport pathways from Lake Eyre, Australia using Hysplit. Atmos. Environ. 2008, 42, 6915–6925. [Google Scholar] [CrossRef]
  92. Gingele, F.; De Deckker, P.; Hillenbrand, C.-D. Late Quaternary fluctuations of the Leeuwin Current and palaeoclimates on the adjacent land masses: Clay mineral evidence. Aust. J. Earth Sci. 2001, 48, 867–874. [Google Scholar] [CrossRef]
  93. Gingele, F.X.; De Deckker, P.; Hillenbrand, C.-D. Clay mineral distribution in surface sediments between Indonesia and NW Australia—Source and transport by ocean currents. Mar. Geol. 2001, 179, 135–146. [Google Scholar] [CrossRef] [Green Version]
  94. Prospero, J.M.; Ginoux, P.; Torres, O.; Nicholson, S.E.; Gill, T.E. Environmental characterization of global sources of atmospheric soil dust identified with the Nimbus 7 Total Ozone Mapping Spectrometer (TOMS) absorbing aerosol product. Rev. Geophys. 2002, 40, 2-1–2-31. [Google Scholar] [CrossRef]
  95. Spooner, M.I.; De Deckker, P.; Barrows, T.T.; Fifield, L.K. The behaviour of the Leeuwin Current offshore NW Australia during the last five glacial–interglacial cycles. Glob. Planet. Chang. 2011, 75, 119–132. [Google Scholar] [CrossRef]
  96. Howard, W.R. Palaeoclimatology: A warm future in the past. Nature 1997, 388, 418. [Google Scholar] [CrossRef]
  97. Van der Kaars, S.; De Deckker, P. A Late Quaternary pollen record from deep-sea core Fr10/95, GC17 offshore Cape Range Peninsula, northwestern Western Australia. Rev. Palaeobot. Palynol. 2002, 120, 17–39. [Google Scholar] [CrossRef]
  98. Johnson, B.; Miller, G.H.; Fogel, M.L.; Magee, J.; Gagan, M.; Chivas, A. 65,000 years of vegetation change in central Australia and the Australian summer monsoon. Science 1999, 284, 1150–1152. [Google Scholar] [CrossRef]
  99. Fitzsimmons, K.E.; Rhodes, E.J.; Magee, J.W.; Barrows, T.T. The timing of linear dune activity in the Strzelecki and Tirari Deserts, Australia. Quat. Sci. Rev. 2007, 26, 2598–2616. [Google Scholar] [CrossRef]
  100. Fujioka, T.; Chappell, J.; Fifield, L.K.; Rhodes, E.J. Australian desert dune fields initiated with Pliocene–Pleistocene global climatic shift. Geology 2009, 37, 51–54. [Google Scholar] [CrossRef]
  101. Hesse, P.P.; McTainsh, G.H. Last glacial maximum to early Holocene wind strength in the mid-latitudes of the Southern Hemisphere from aeolian dust in the Tasman Sea. Quat. Res. 1999, 52, 343–349. [Google Scholar] [CrossRef]
  102. Sime, L.S.; Hodgson, D.; Bracegirdle, T.J.; Allen, C.; Perren, B.; Roberts, S.; de Boer, A.M. Sea ice led to poleward-shifted winds at the Last Glacial Maximum: The influence of state dependency on CMIP5 and PMIP3 models. Clim. Past 2016, 12, 2241–2253. [Google Scholar] [CrossRef] [Green Version]
  103. De Deckker, P.; Moros, M.; Perner, K.; Jansen, E. Influence of the tropics and southern westerlies on glacial interhemispheric asymmetry. Nat. Geosci. 2012, 5, 266. [Google Scholar] [CrossRef]
  104. Hesse, P.P. How do longitudinal dunes respond to climate forcing? Insights from 25 years of luminescence dating of the Australian desert dunefields. Quat. Int. 2016, 410, 11–29. [Google Scholar] [CrossRef]
  105. Bard, E.; Rickaby, R.E. Migration of the subtropical front as a modulator of glacial climate. Nature 2009, 460, 380. [Google Scholar] [CrossRef]
Figure 1. Oceanographic and atmospheric circulation of the Indo-Pacific. The red star indicates the location of Site U1461 (Modified from Gallagher et al., 2009 [41]). The blue star indicates the location of MD00-2361 [12]. The green star indicates the location of SO185-18506 [42]. The orange circle indicates the position of Ball Gown Cave [43].
Atmosphere 11 01251 g001
Figure 2. Age model for Site U1461. This age model is based on 14C radiocarbon dates (represented by red dots) [45] and δ18O measurements on Globorotalia menardii as well as the abundance of G. menardii (expressed as individuals per gram of sediment). The reference curve for δ18O is measured on benthic foraminifera [47].
Atmosphere 11 01251 g002
Figure 3. Lithostratigraphic units at Hole U1461A and micro-faunal abundance. The abundance of planktonic and benthic foraminifera (per gram), the number of bryozoans and corals, and the diversity for the benthonic foraminifera (number of species per sample) are presented in this figure. Only the clusters used for the bathymetric level identification are displayed here.
Atmosphere 11 01251 g003
Figure 4. Proxies to trace the aeolian inputs. (a) εNd, (b) uranium concentration (ppm), (c) log(Zr/Fe), and (d) log(Zr + Ti + Fe)/(Al + K). Black lines are the moving average with a period of 5 for (c,d).
Atmosphere 11 01251 g004
Figure 5. Proxies to trace the terrestrial versus fluvial inputs. (a) Ti/Ca ratio, (b) Y/Ho ratio, and (c) K% (wt.%). Black line is the moving average with a period of 5 for (a).
Atmosphere 11 01251 g005
Figure 6. Synthesis and comparison of the data with the literature for the two targeted time periods. (a) MIS 1–MIS 3. (b) MIS 10-MIS 13. Comparison between Log(Ti/Ca) and Log(Zr/Fe) from the Site U1461 and the ones from the core MD00-2361 [12]. This figure also show proxy of dust abundance in other records from the Southern Hemisphere: Antarctica with the dust concentration in µg/kg from Epica Dome C [19], SO Pacific Ocean with the abundance of Fe (wt-%) in PS75/076-2 [17], and from South Atlantic with the Fe Mass Accumulation rate in mg−1 m2 y−1 from the Site ODP 1090 [18]. For the period between MIS 1 and MIS 3 the δ18O values of the speleothem in the Ball Gown Cave [43] are shown. The correlation with Southern Hemisphere records is discussed in Section 5.2 and Section 5.4.
Atmosphere 11 01251 g006
Figure 7. Nd isotopic composition of the surface sediments in Indo-Pacific [10,26,83,84,85,86,87,88,89]. Black star indicates the location of Site U1461. Dotted lines indicate the geographical zonation of North Sumatra, Java Banda Arc, northwest dust, northeast dust, Lake Eyre catchment, Murray-Darling catchment, and South and Central dust.
Atmosphere 11 01251 g007
Figure 8. The last 500 ky evolution of neodymium isotopic ratios in clay-size sediment at Site U1461A. Neodymium isotope data (εNd) are reported for the Hole U1461A (red line) with the inferred uncertainty on measurements. Additionally, shown for comparison are the average εNd compositions of the main potential source areas of fine-grained sediments to the studied site. The δ18O curve measured on the G. menardii is also reported. WAC = West Australian Current.
Atmosphere 11 01251 g008
Table 1. Neodymium radiogenic isotope data at Hole U1461A.
SamplesDepth143Nd/144NdStandard ErrorεNd
CSF-A (m)
1F-1W0.40.51144417 × 10−6−23.3
2H-2W3.50.51153112 × 10−6−21.6
3F-1W6.70.51151812 × 10−6−21.8
4H-1W11.40.5116856 × 10−6−18.6
4H-3W14.250.5118614 × 10−6−15.2
4F-7W19.850.5117316 × 10−6−17.7
5H-3W23.90.5118312 × 10−6−15.8
6H-1W30.40.5117079 × 10−6−18.2
6H-4W34.90.51174210 × 10−6−17.5
7H-4W44.40.51155440 × 10−6−21.1
7H-6W47.40.51163214 × 10−6−19.6
8H-2W50.90.51156628 × 10−6−20.9
9F-1W54.550.51183413 × 10−6−15.7
11F-1W57.60.51215212 × 10−6−9.5
11F-2W59.10.512336110 × 10−6−5.9
11F-3W60.60.51197411 × 10−6−13
12F-1W62.30.5118039 × 10−6−16.3
12F-2W63.80.5116856 × 10−6−18.6
12F-3W65.30.51165318 × 10−6−19.2
Publisher’s Note: MDPI stays neutral with regard to jurisdictional claims in published maps and institutional affiliations.

