Analysis of Spatial Data from Moss Biomonitoring in Czech–Polish Border

 , ,
, ,  ,
,
Abstract
:1. Introduction
2. Materials and Methods
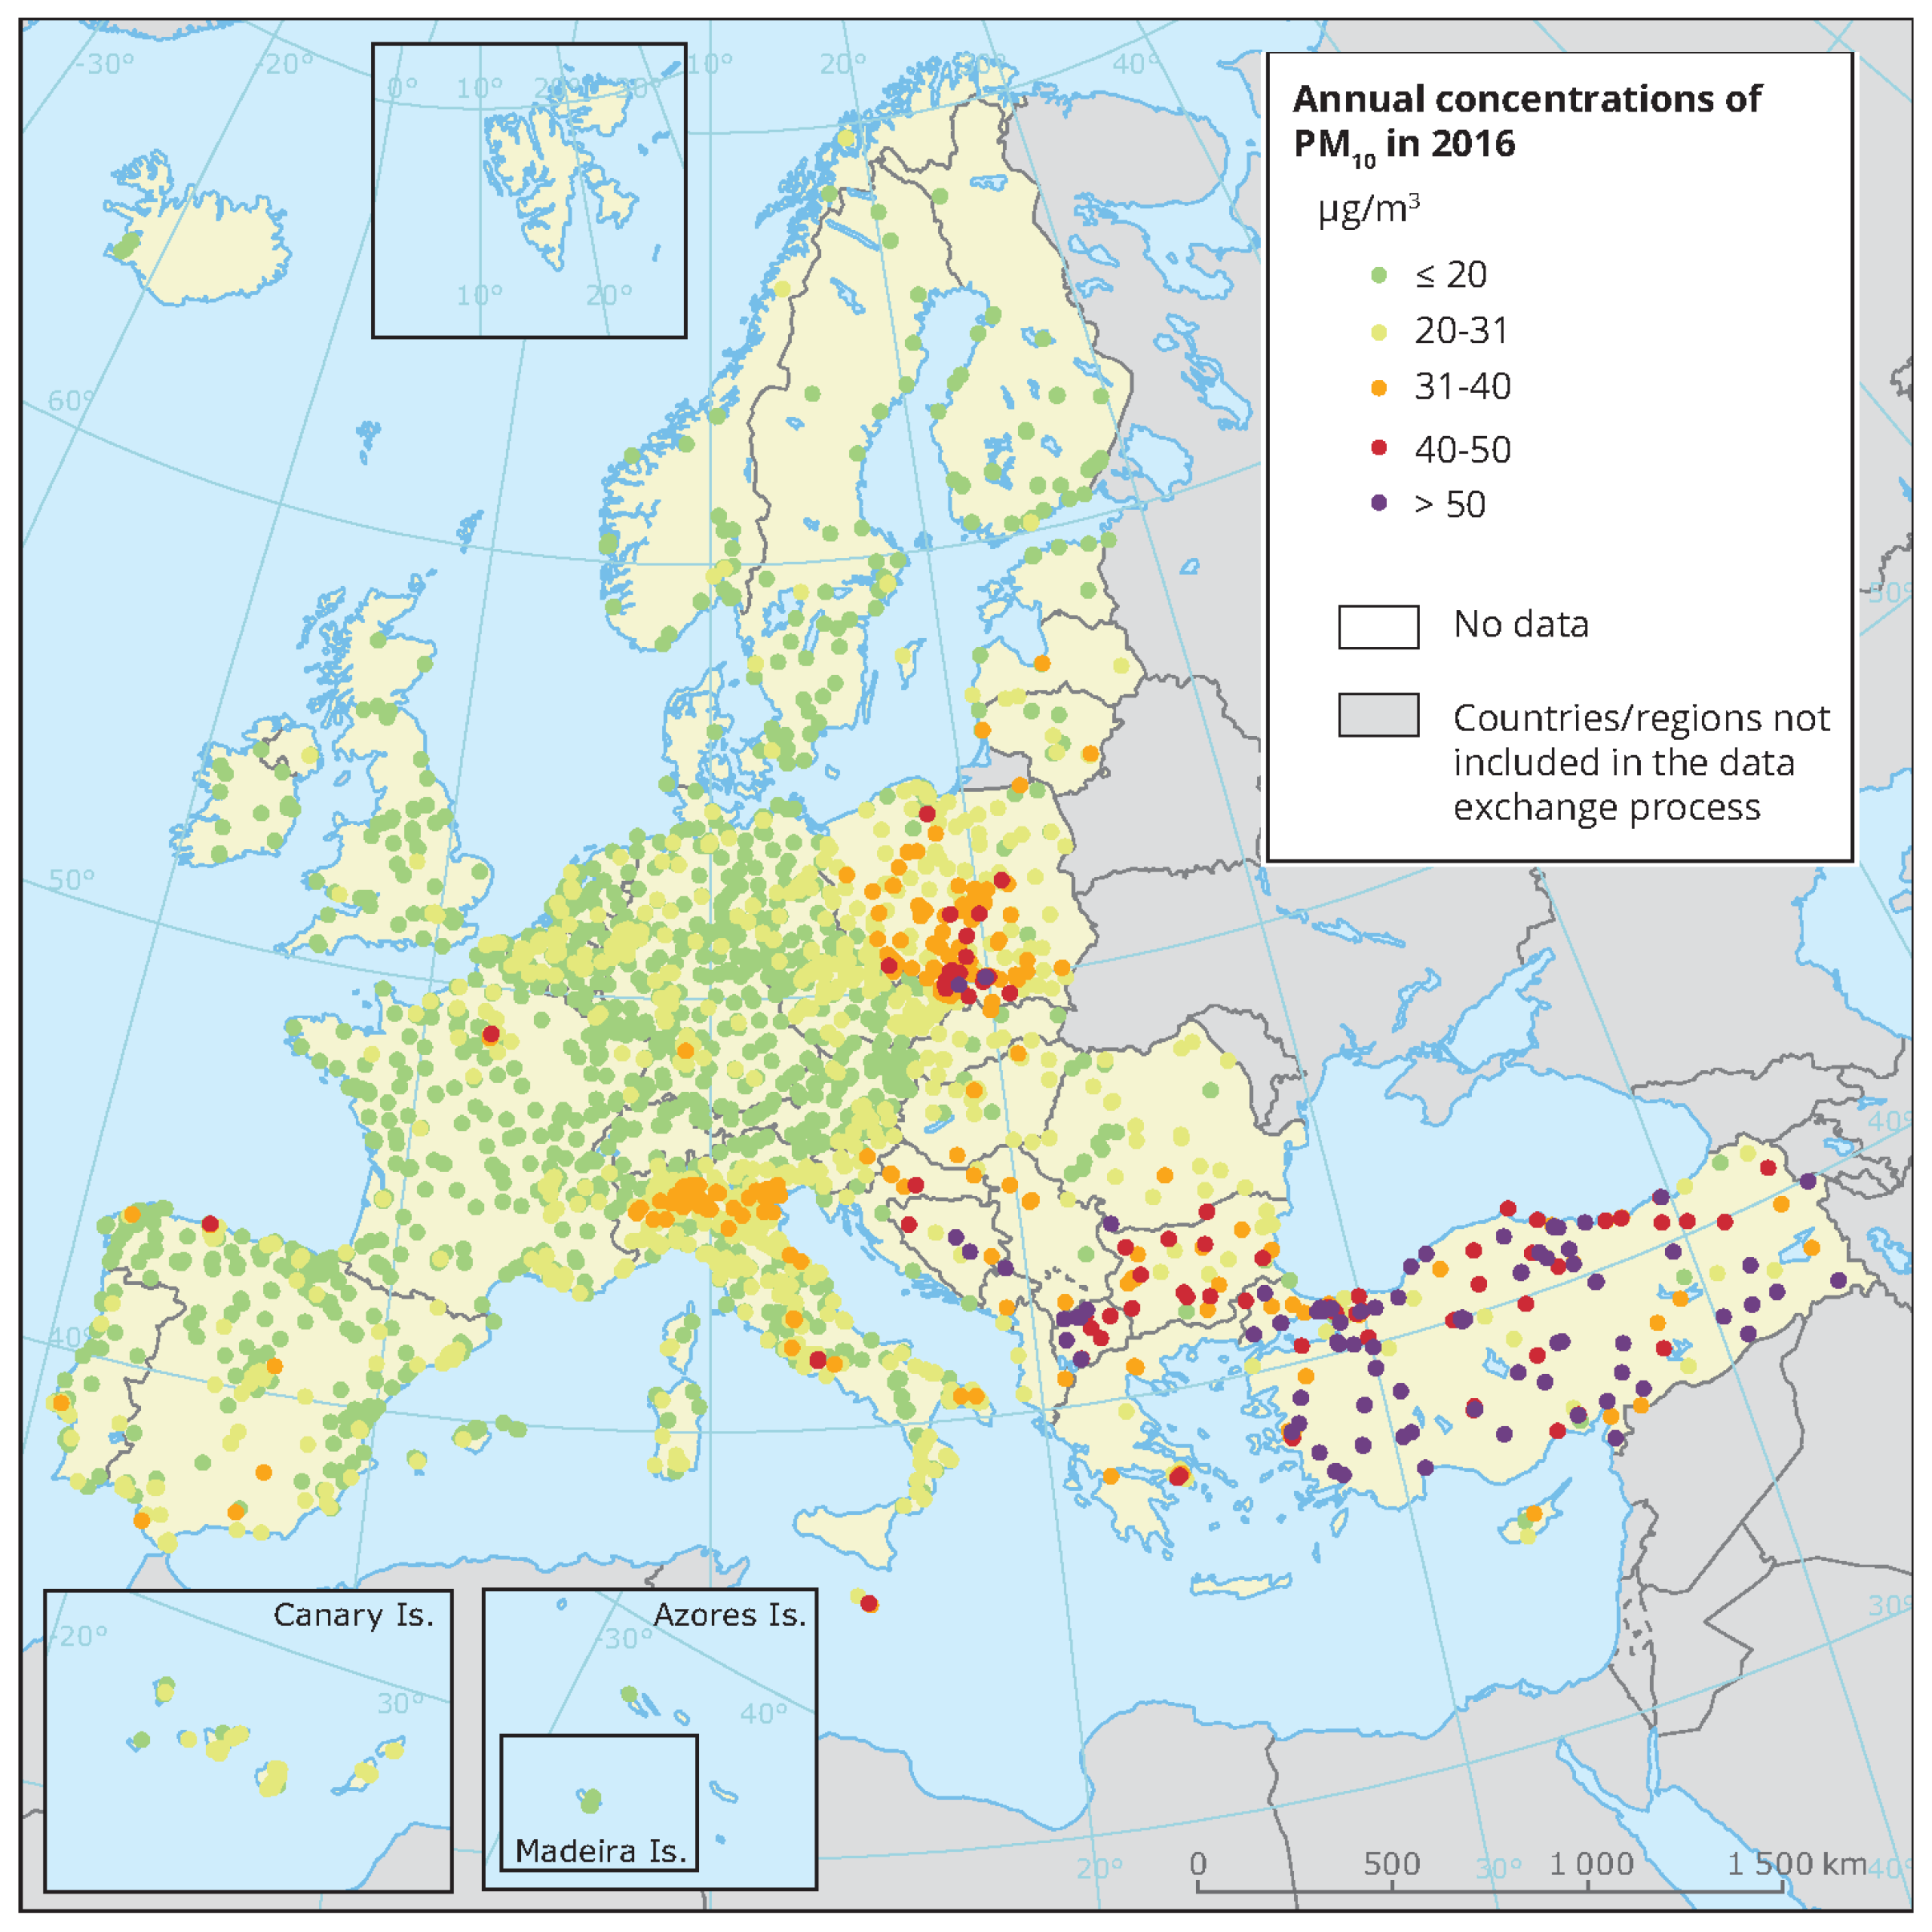
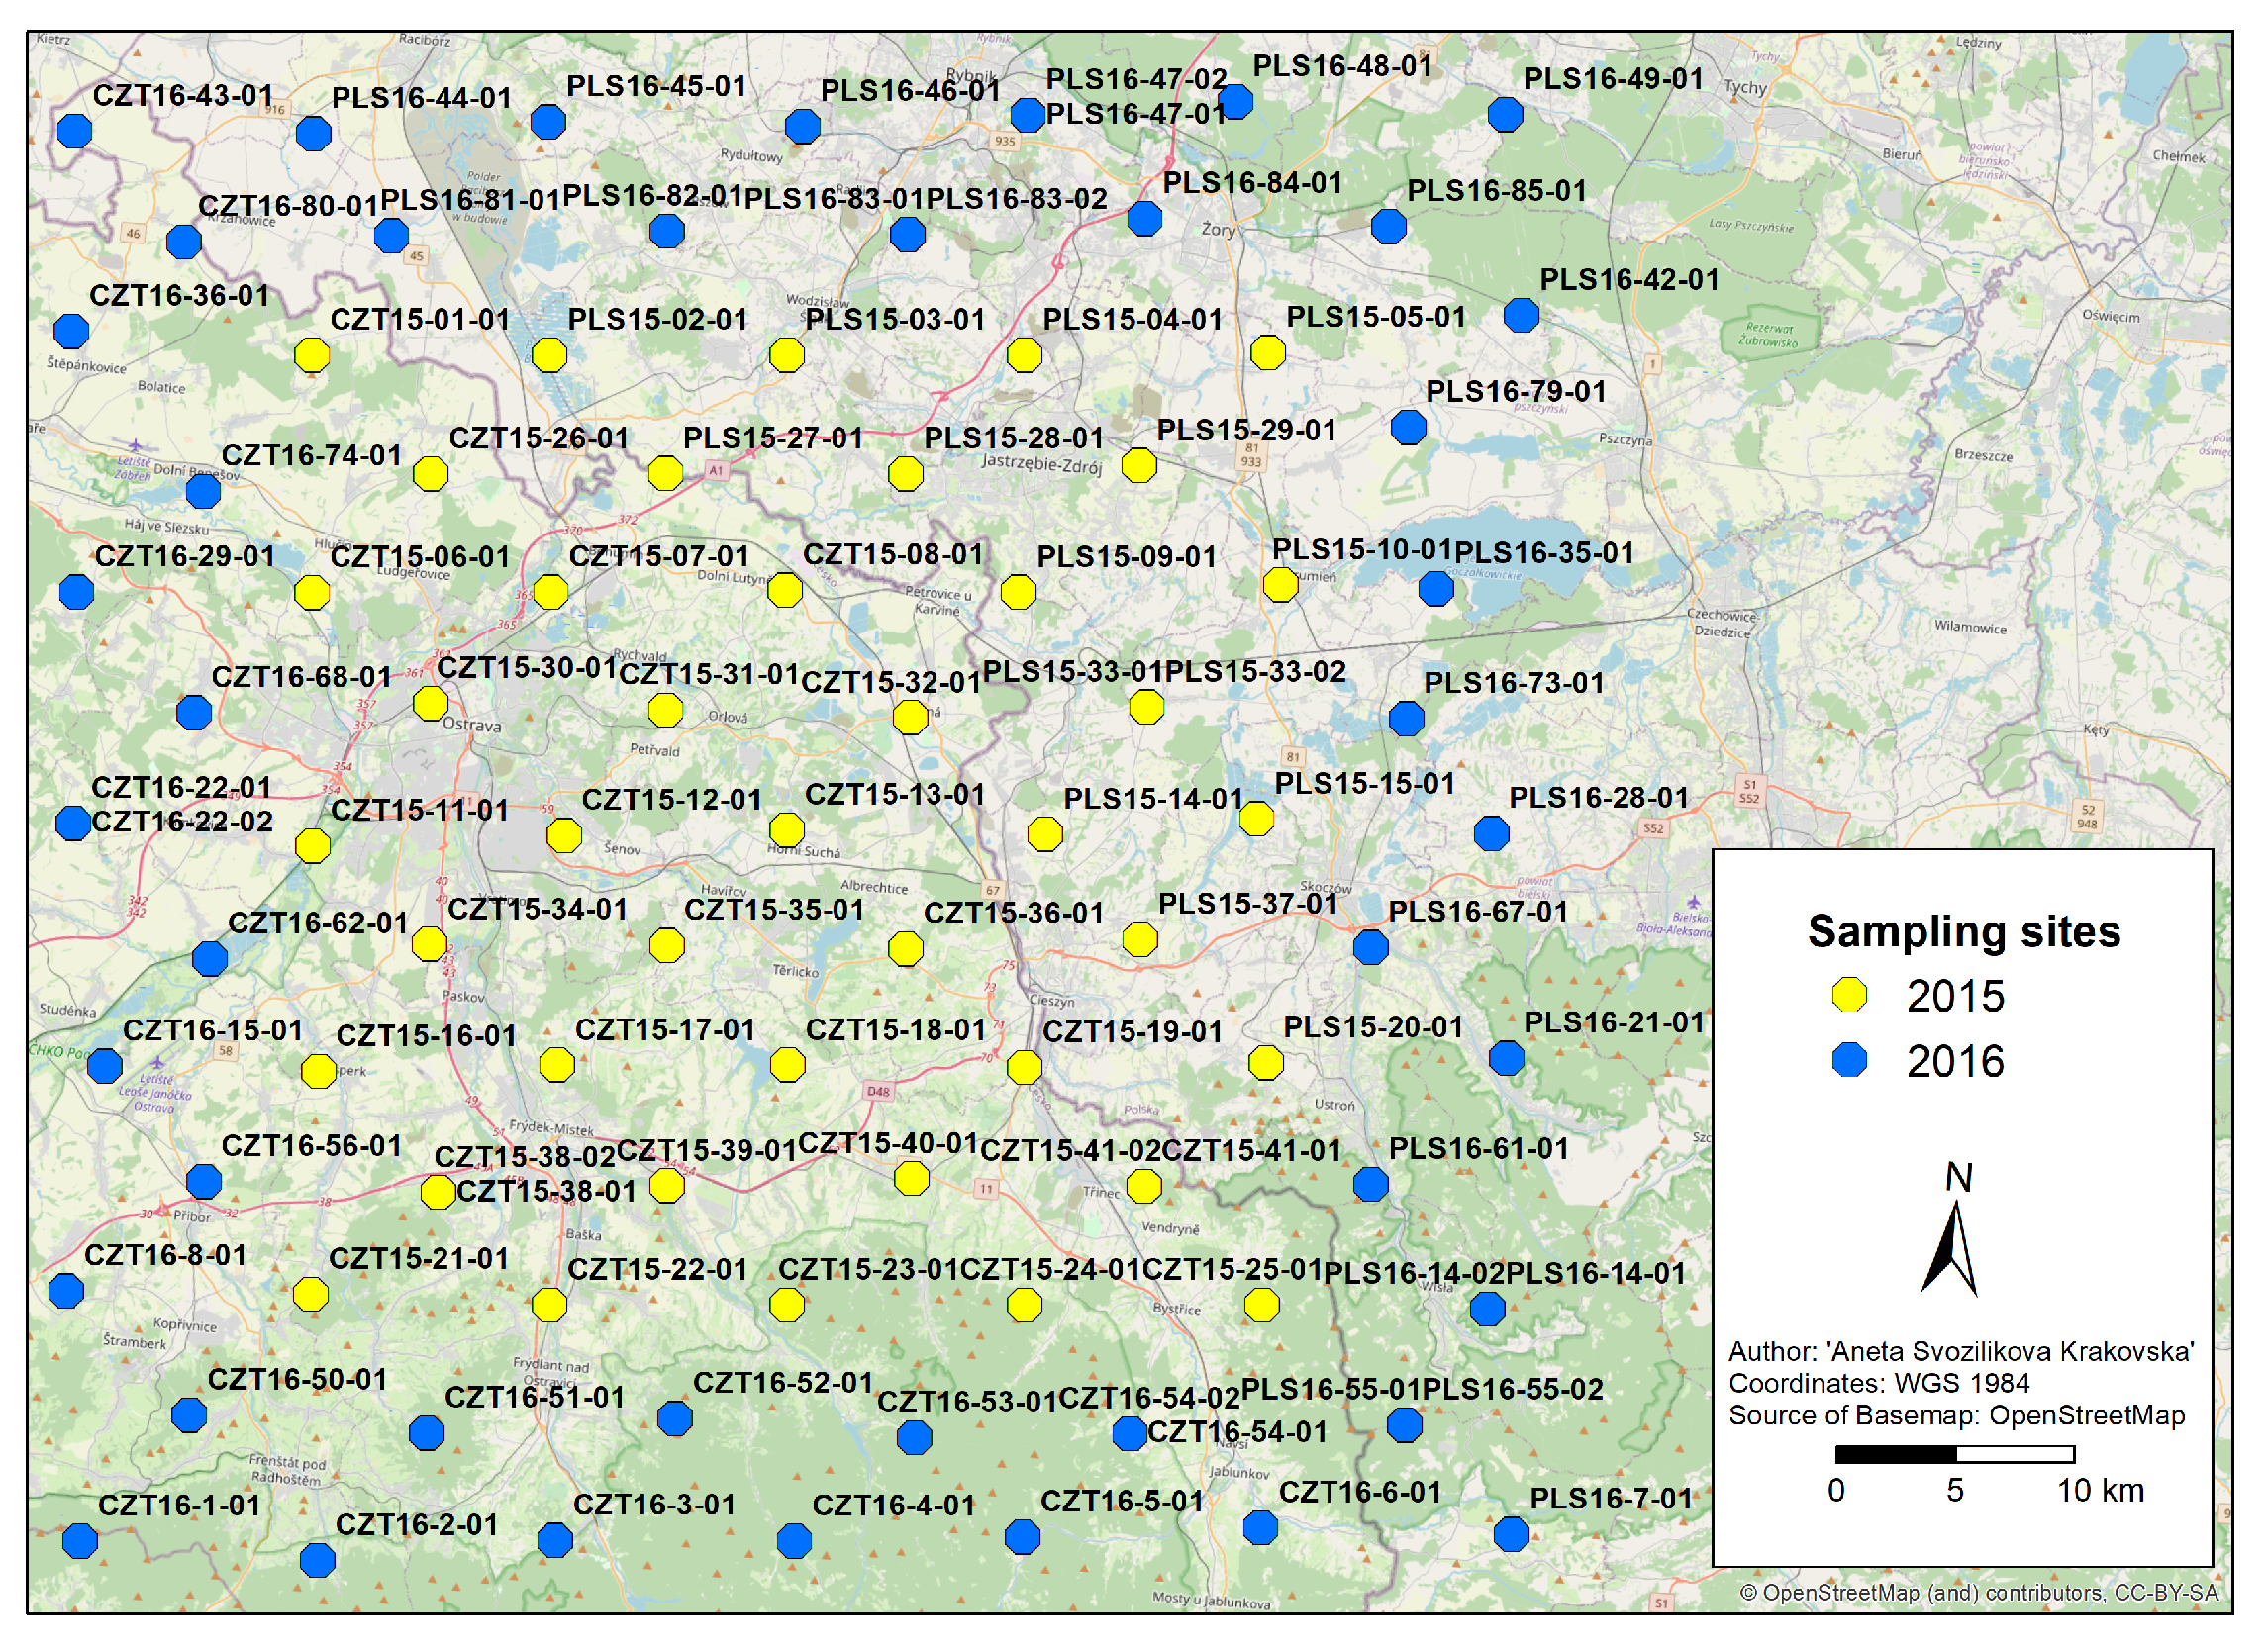
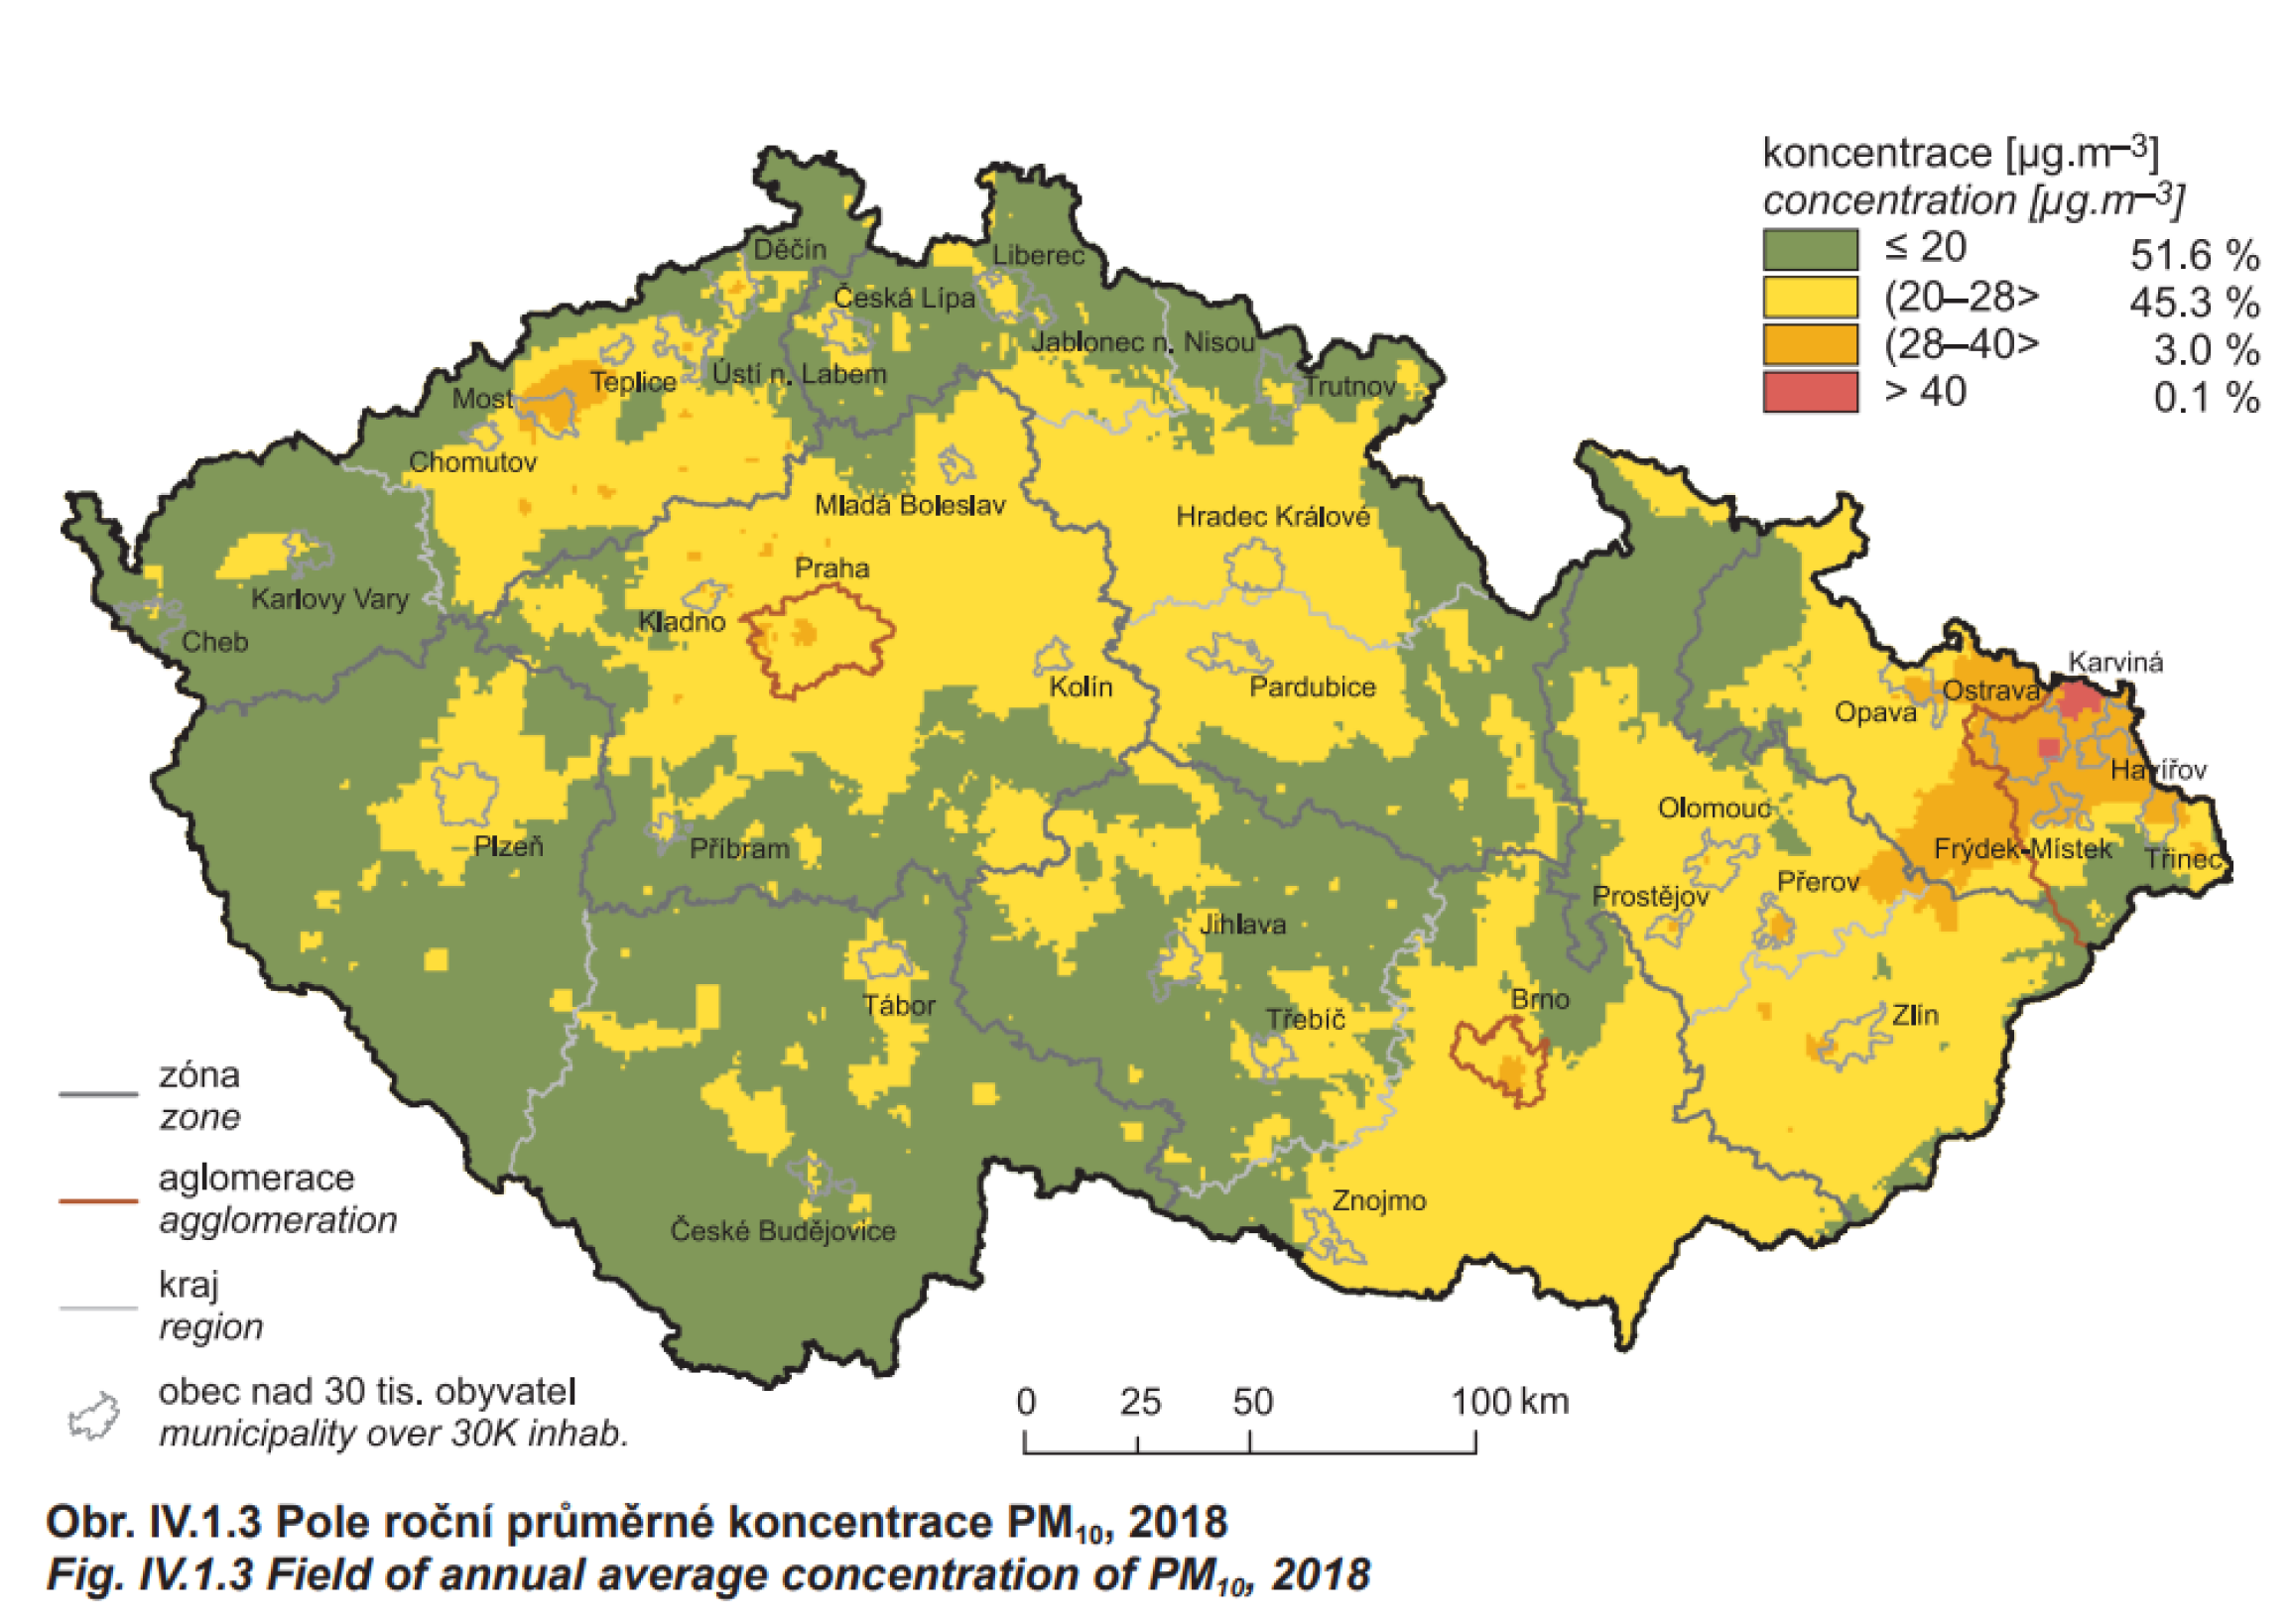
2.1. Study Area
2.2. Sampling and Sample Preparation
2.3. Neutron Activation Analysis
2.4. Statistical Data Processing
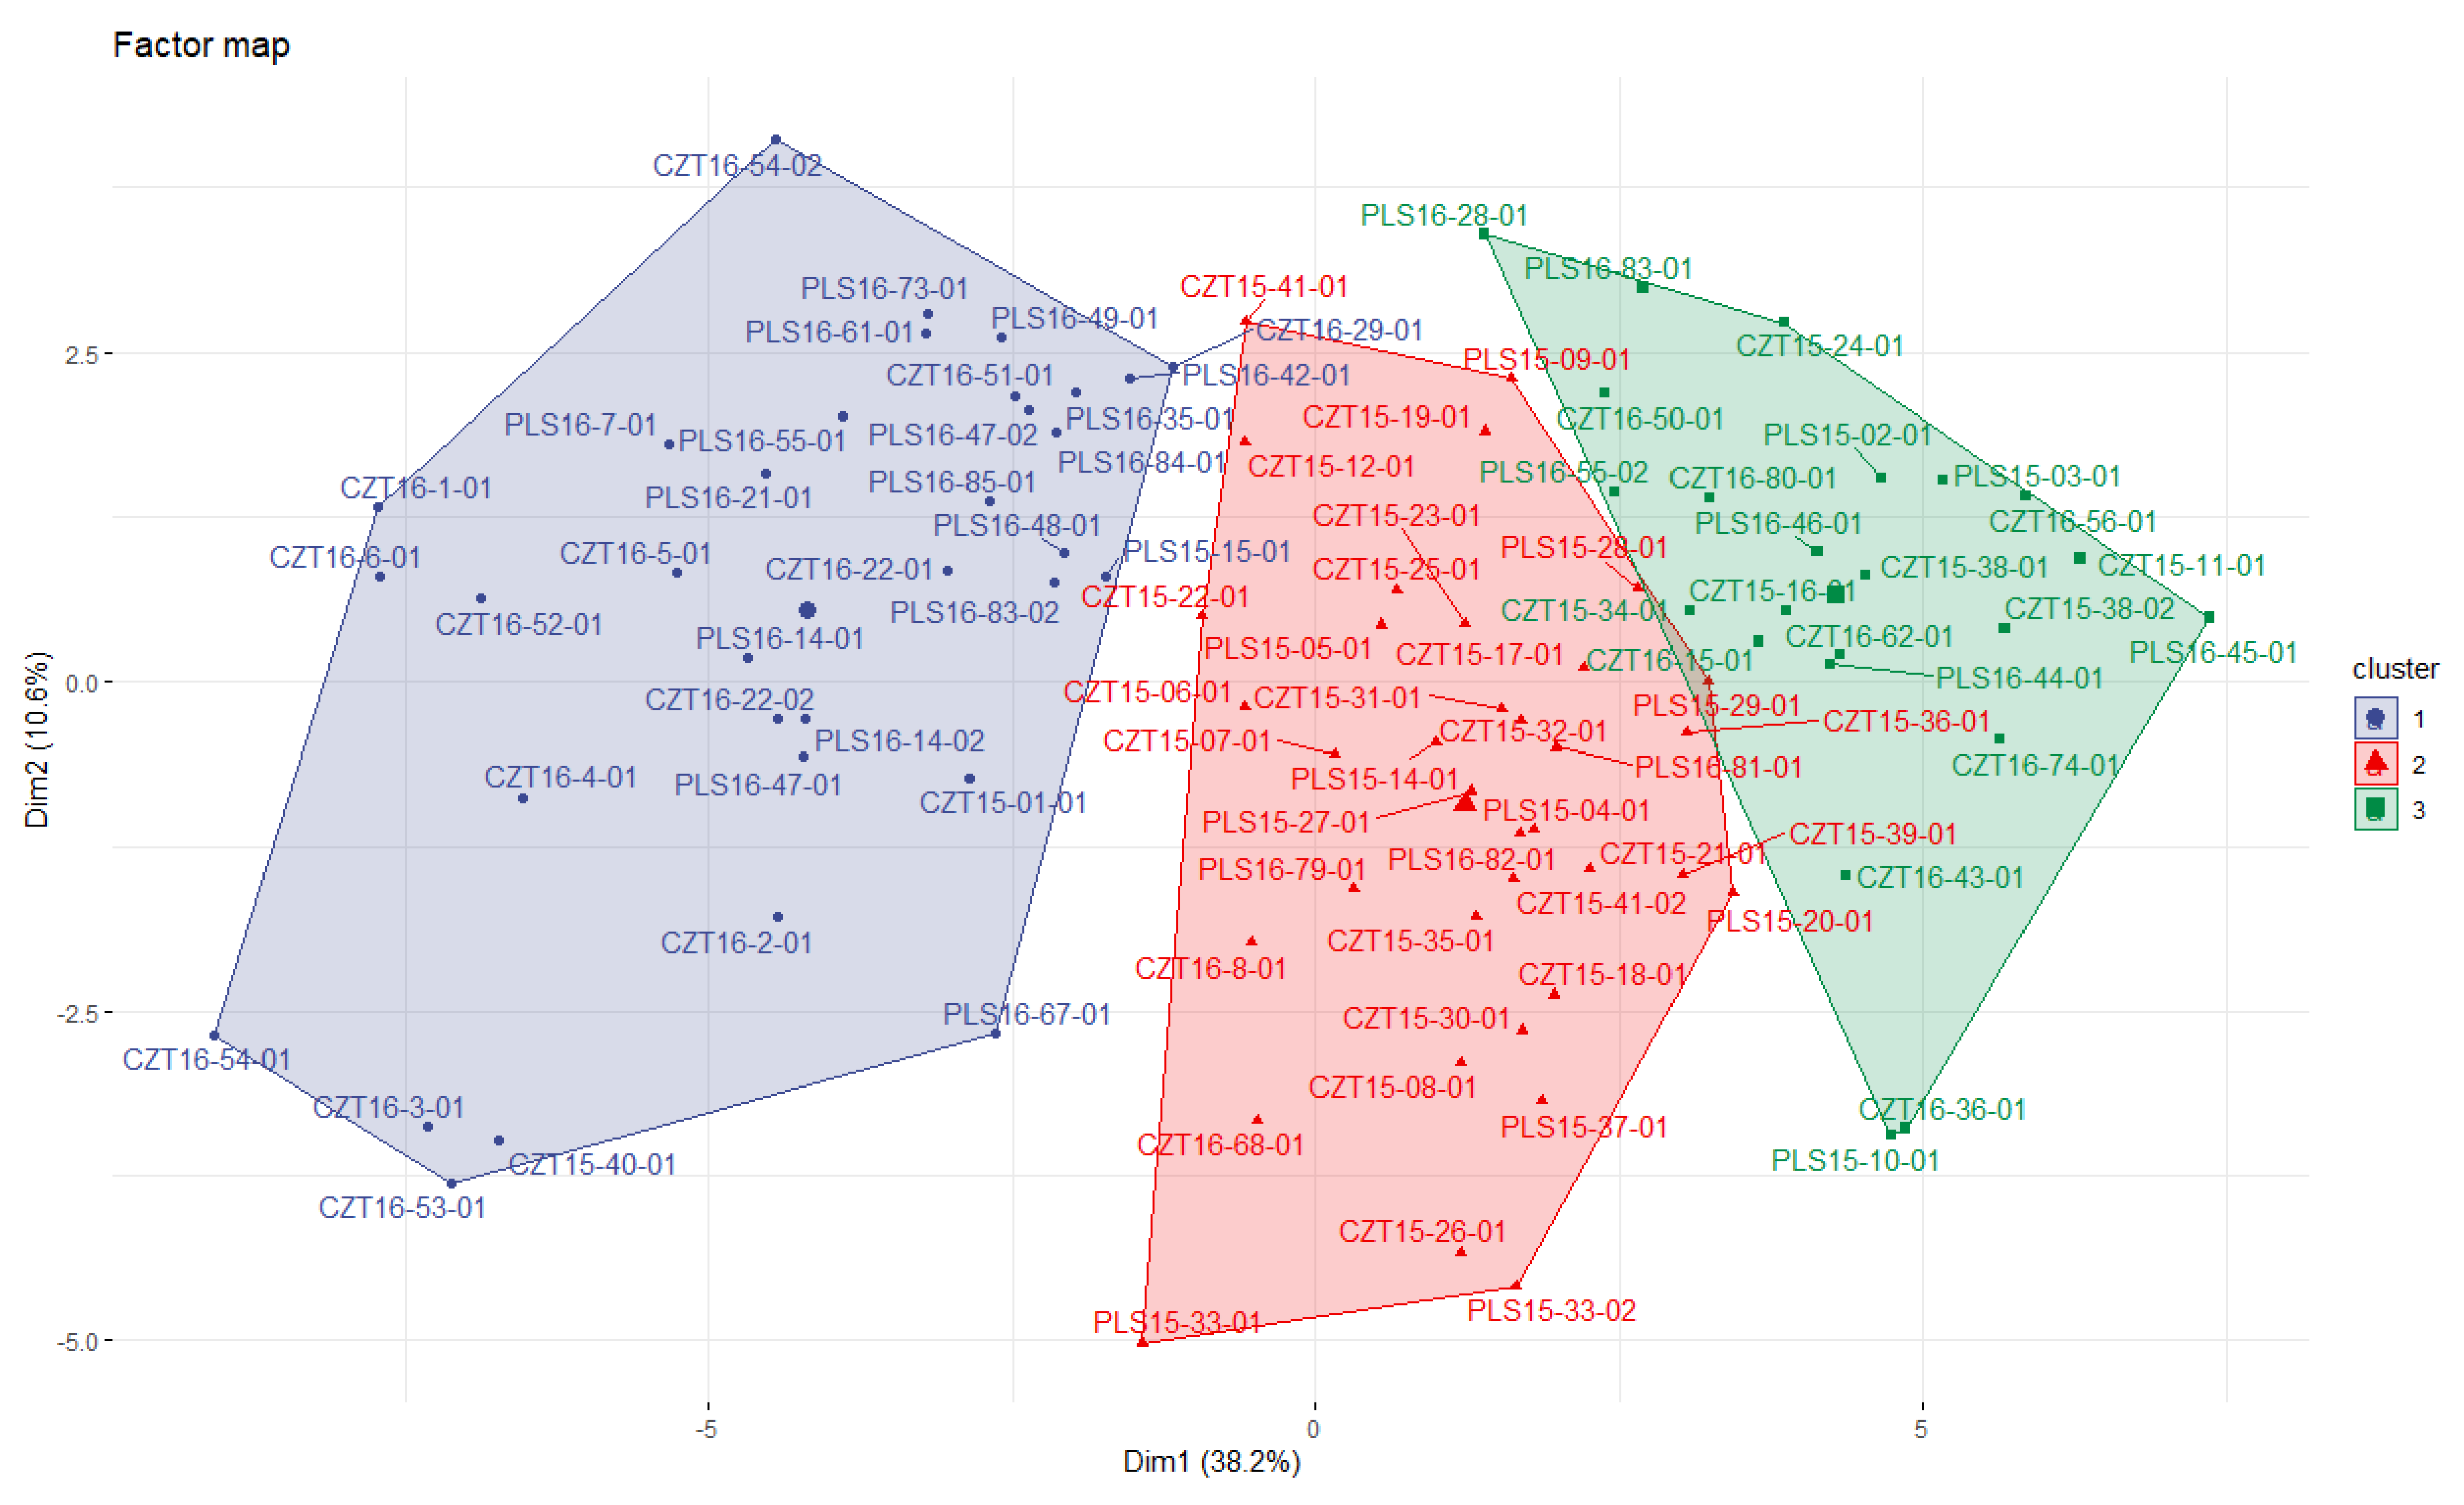
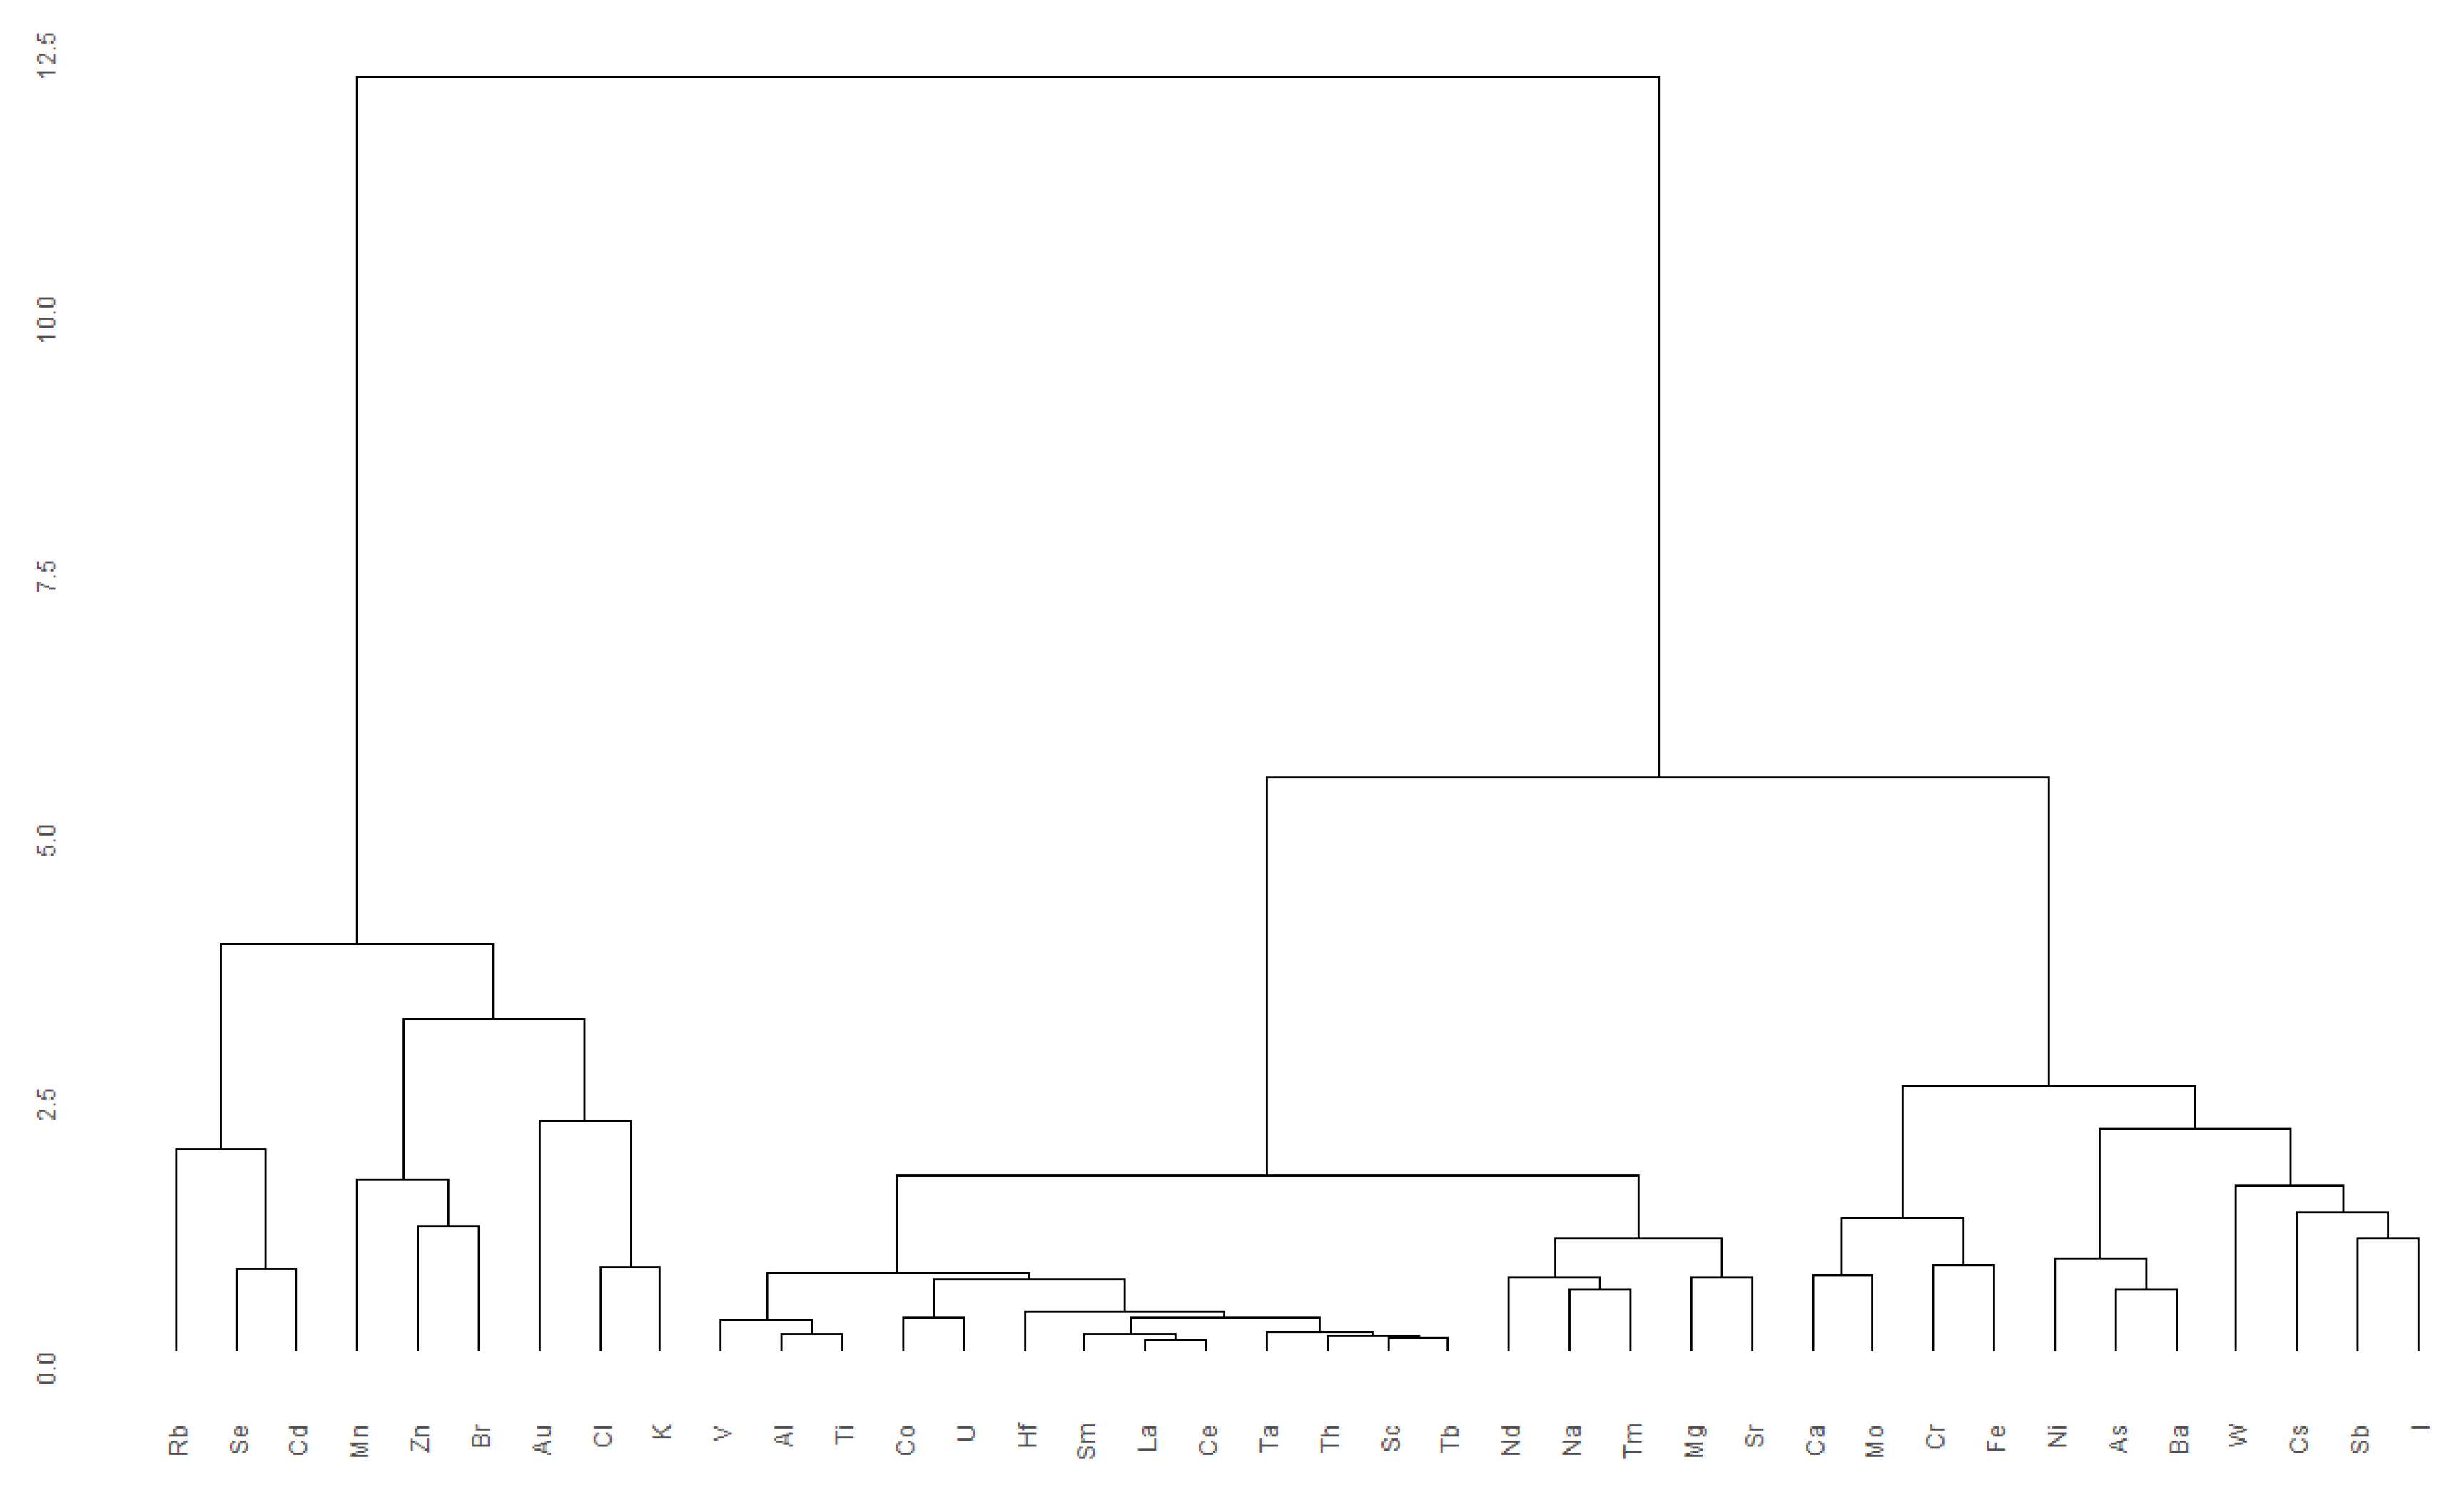
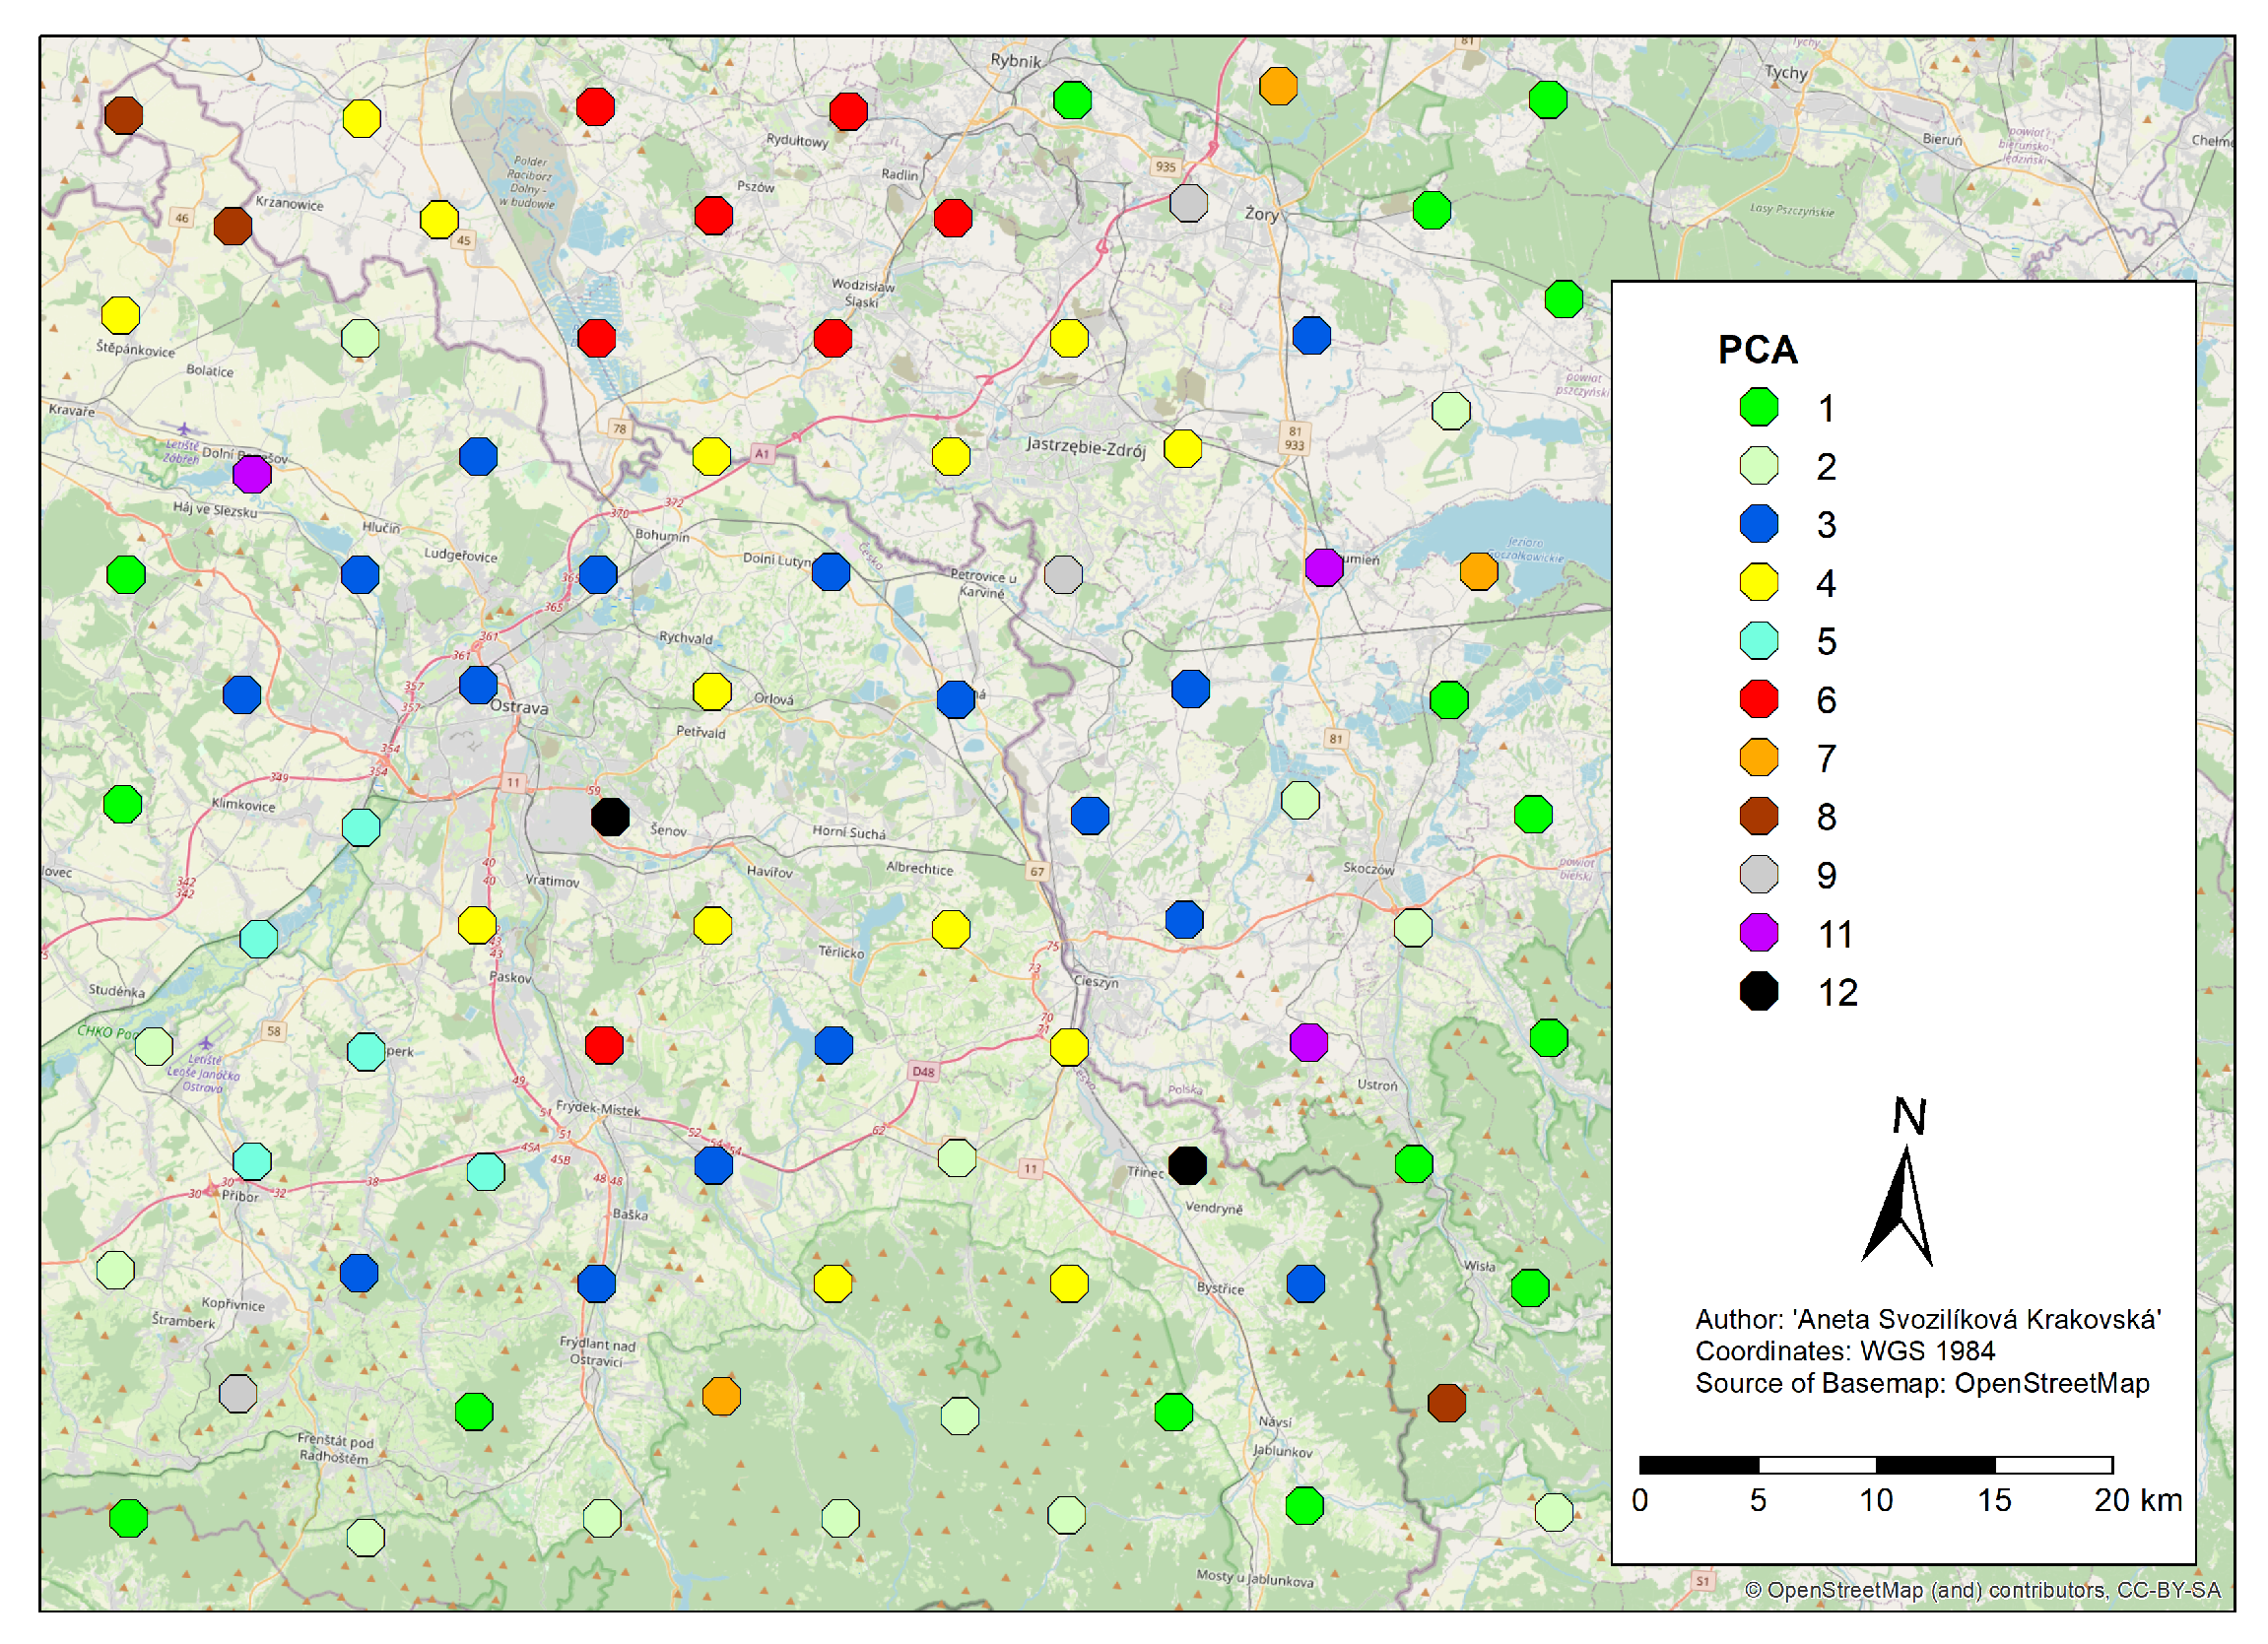
2.4.1. Principal Component Analysis
2.4.2. Factor Analysis
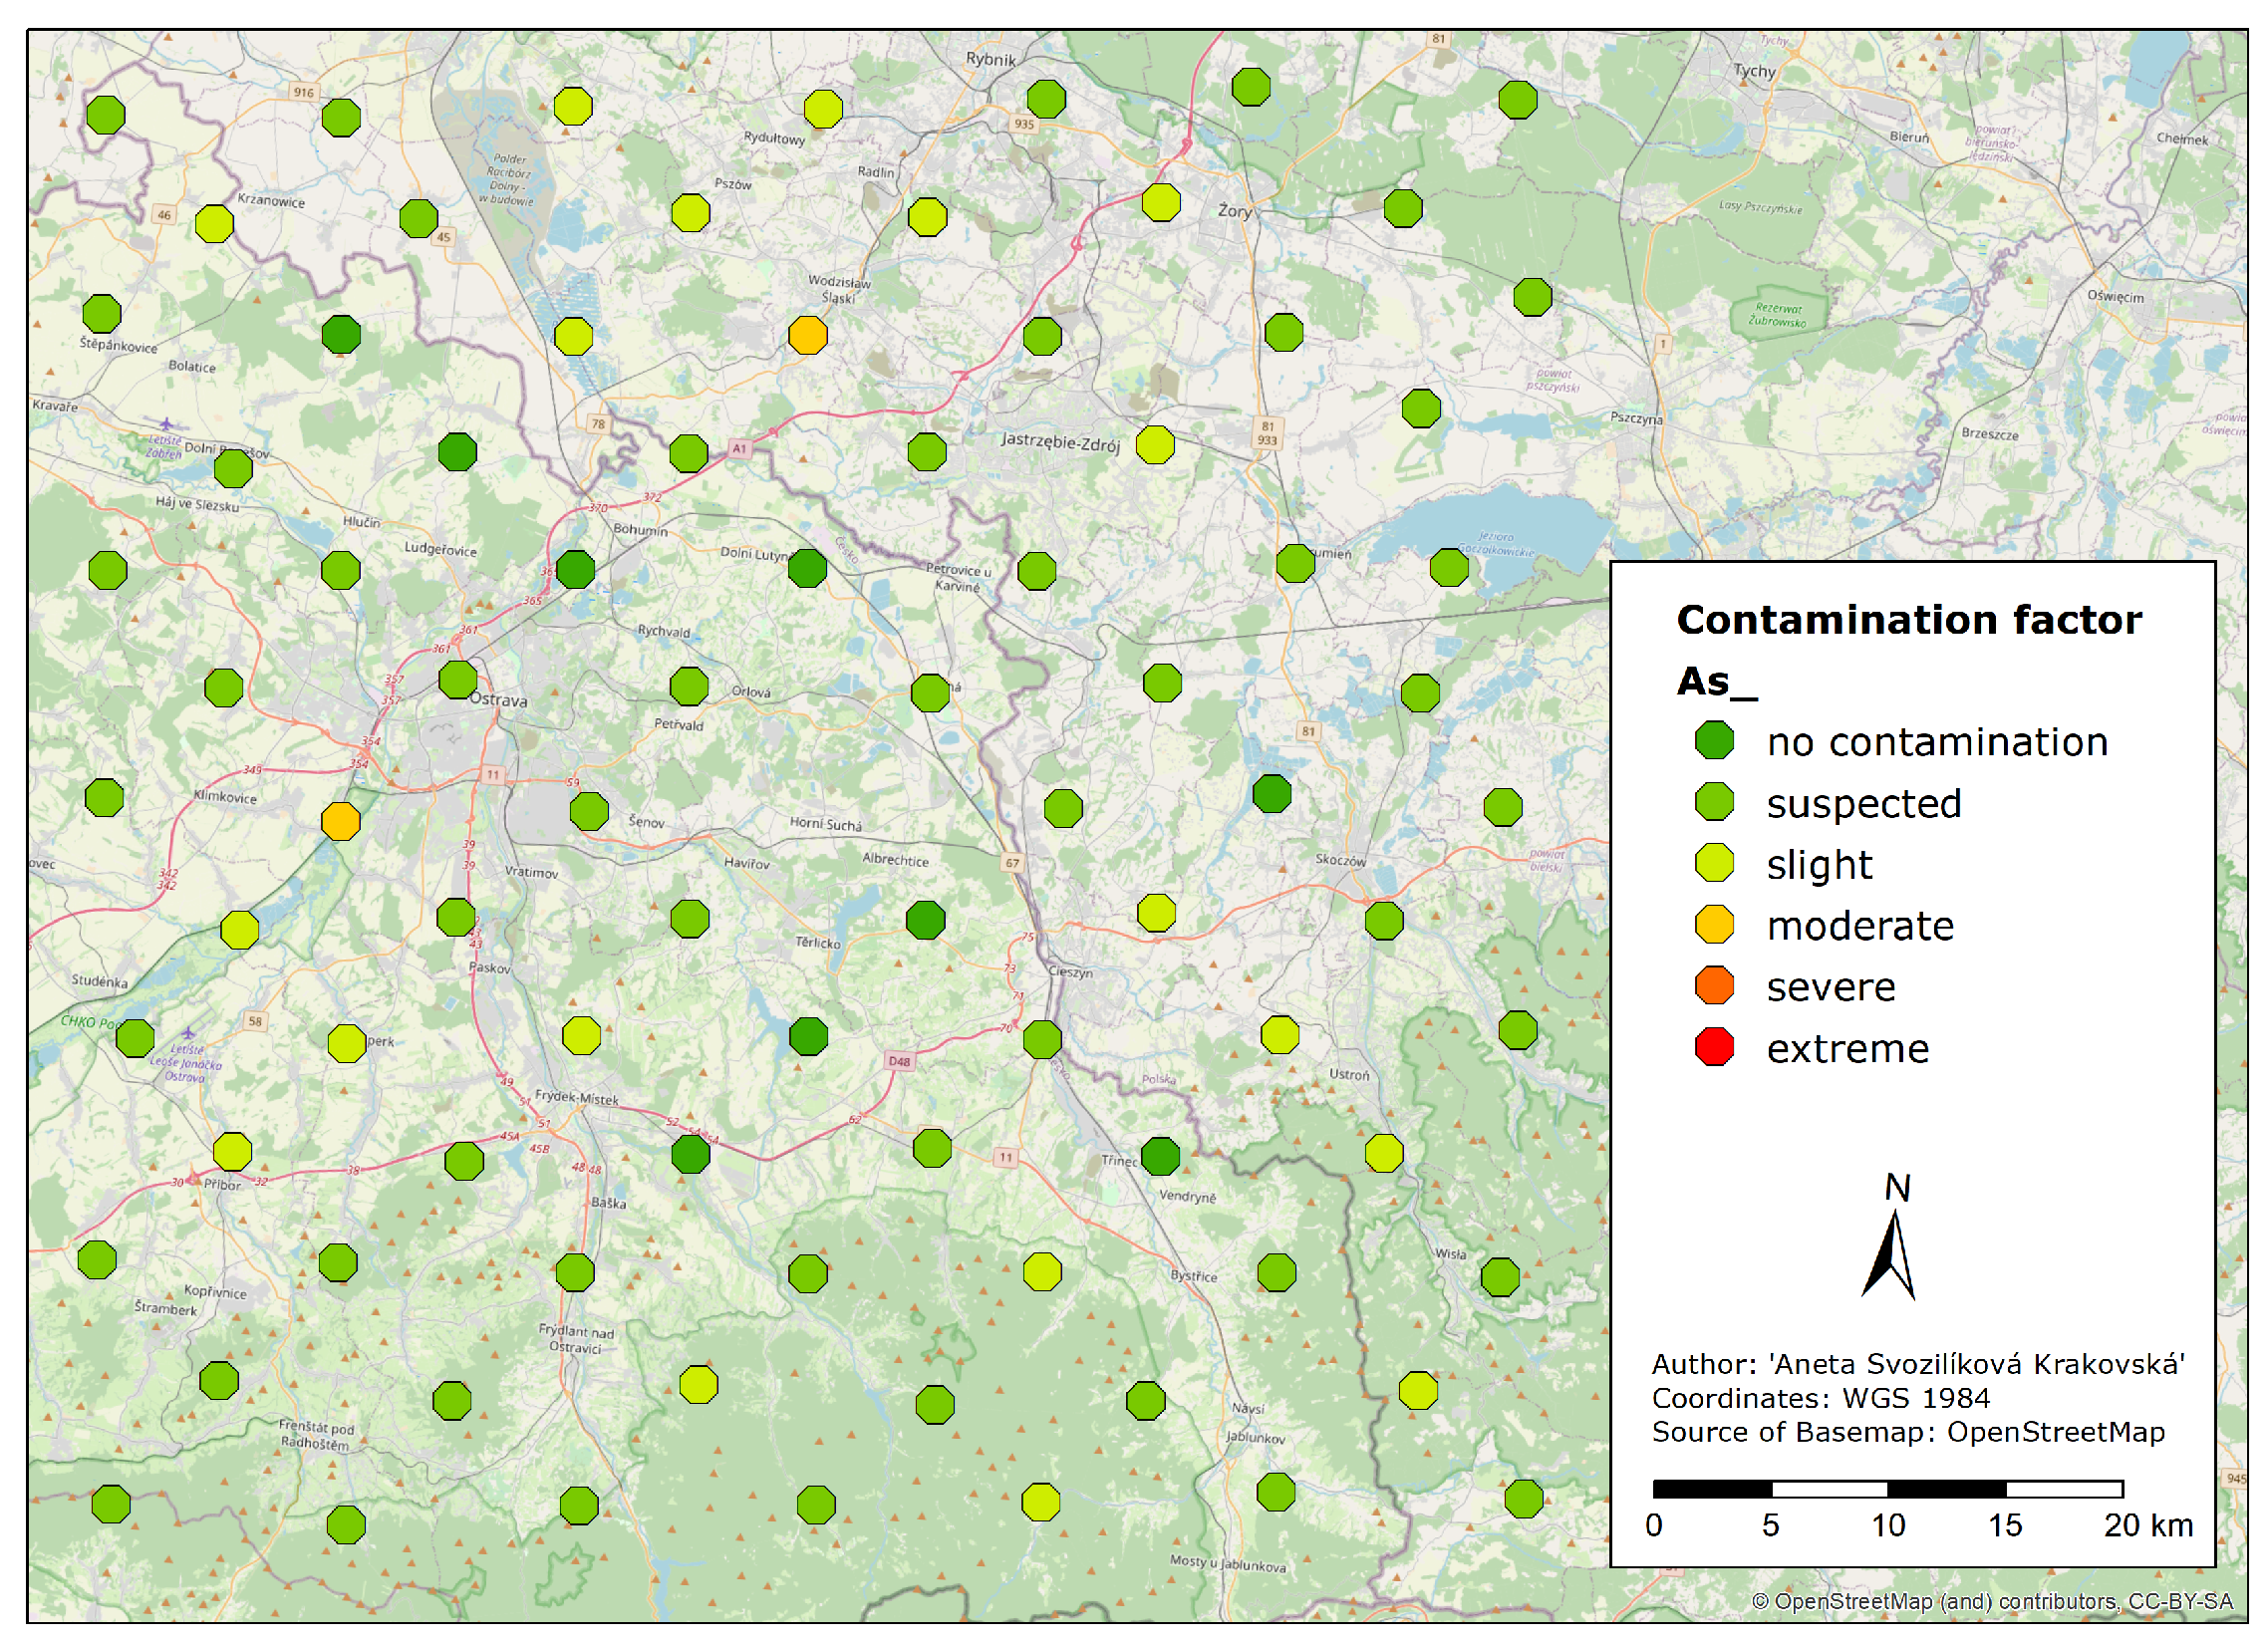
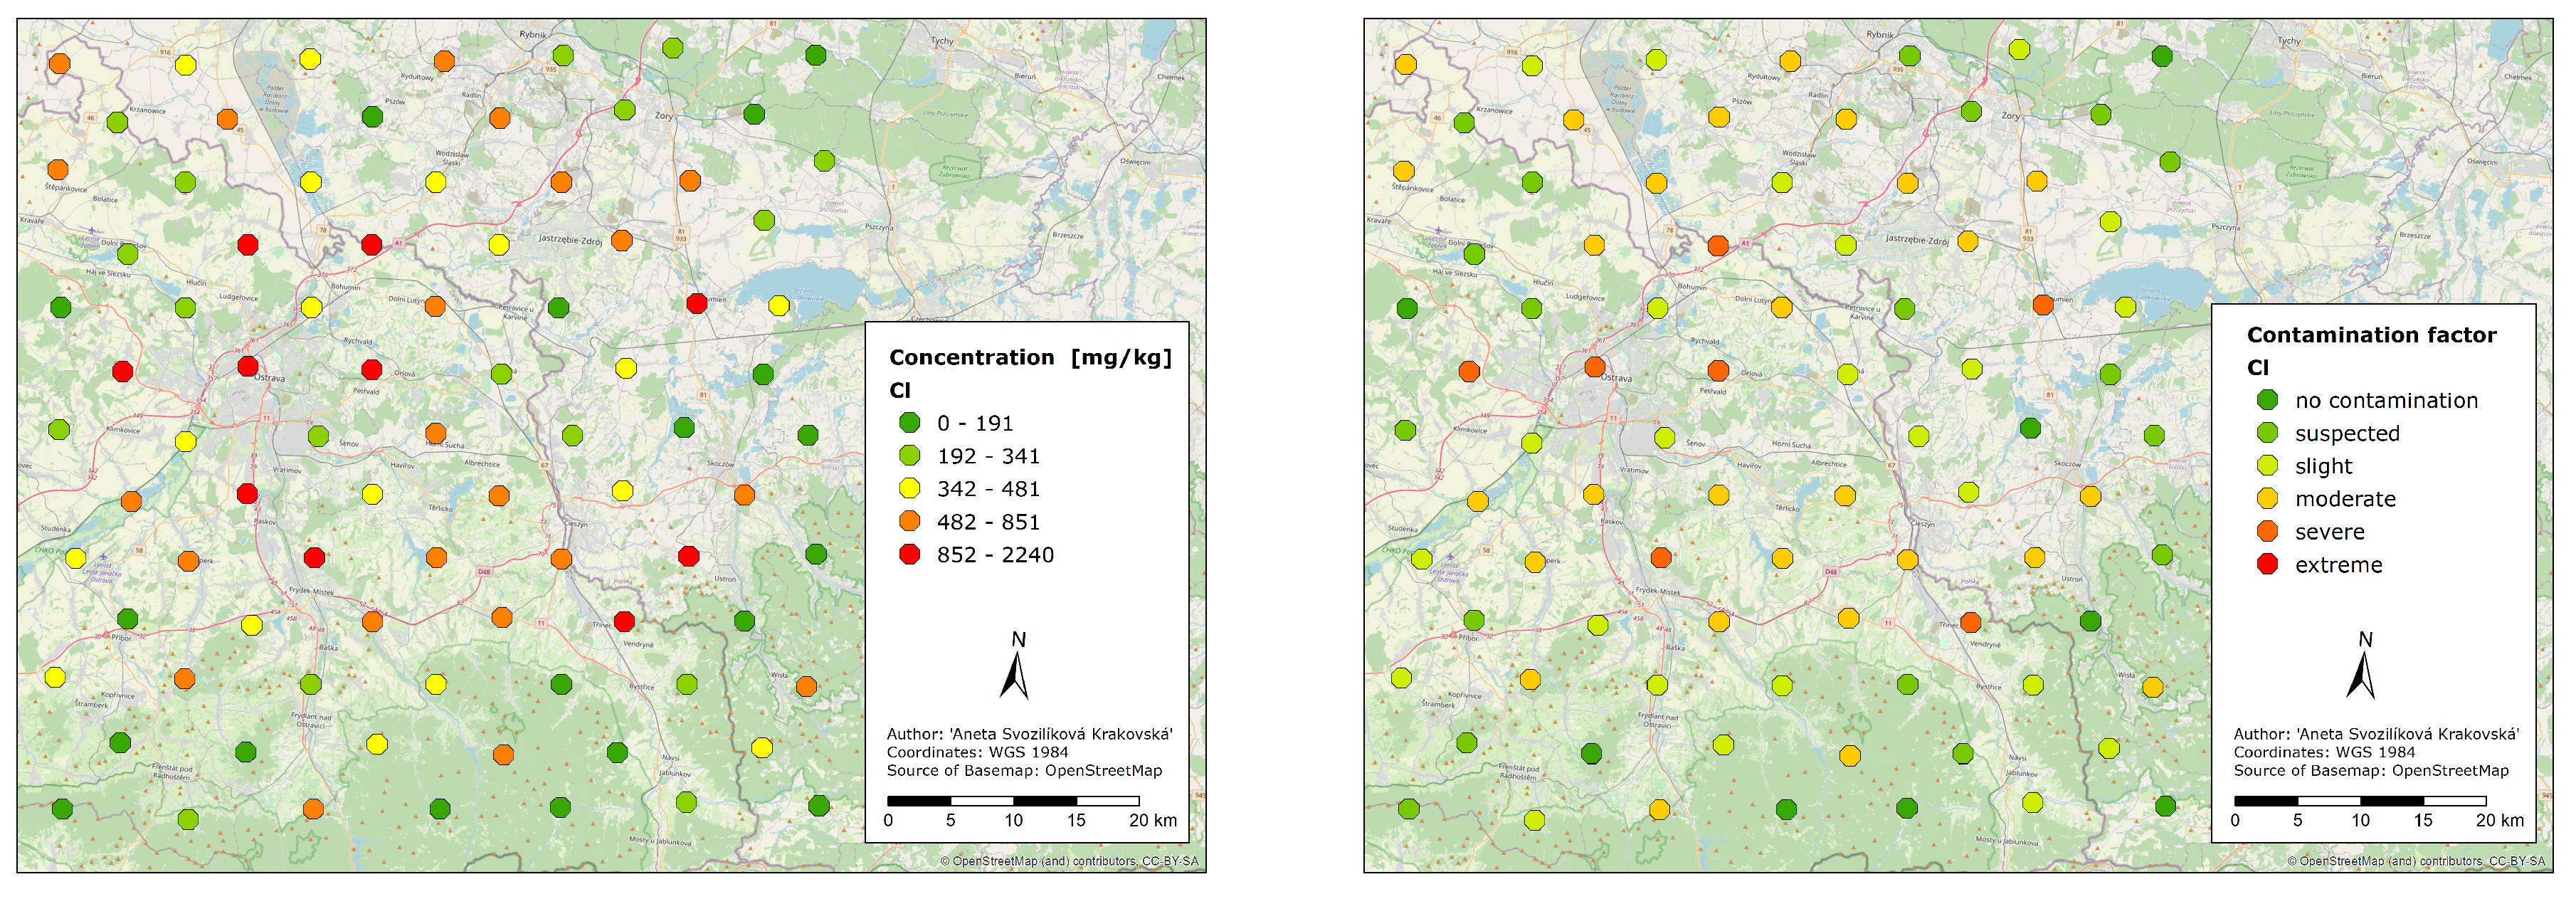
2.4.3. Contamination Factor
2.4.4. Geoaccumulation Index
- cn concentration in moss sample n,
- Bn background value for moss sample n,
- a factor of 1.5 is used due to possible variability in background values.
2.4.5. Enrichment Factor
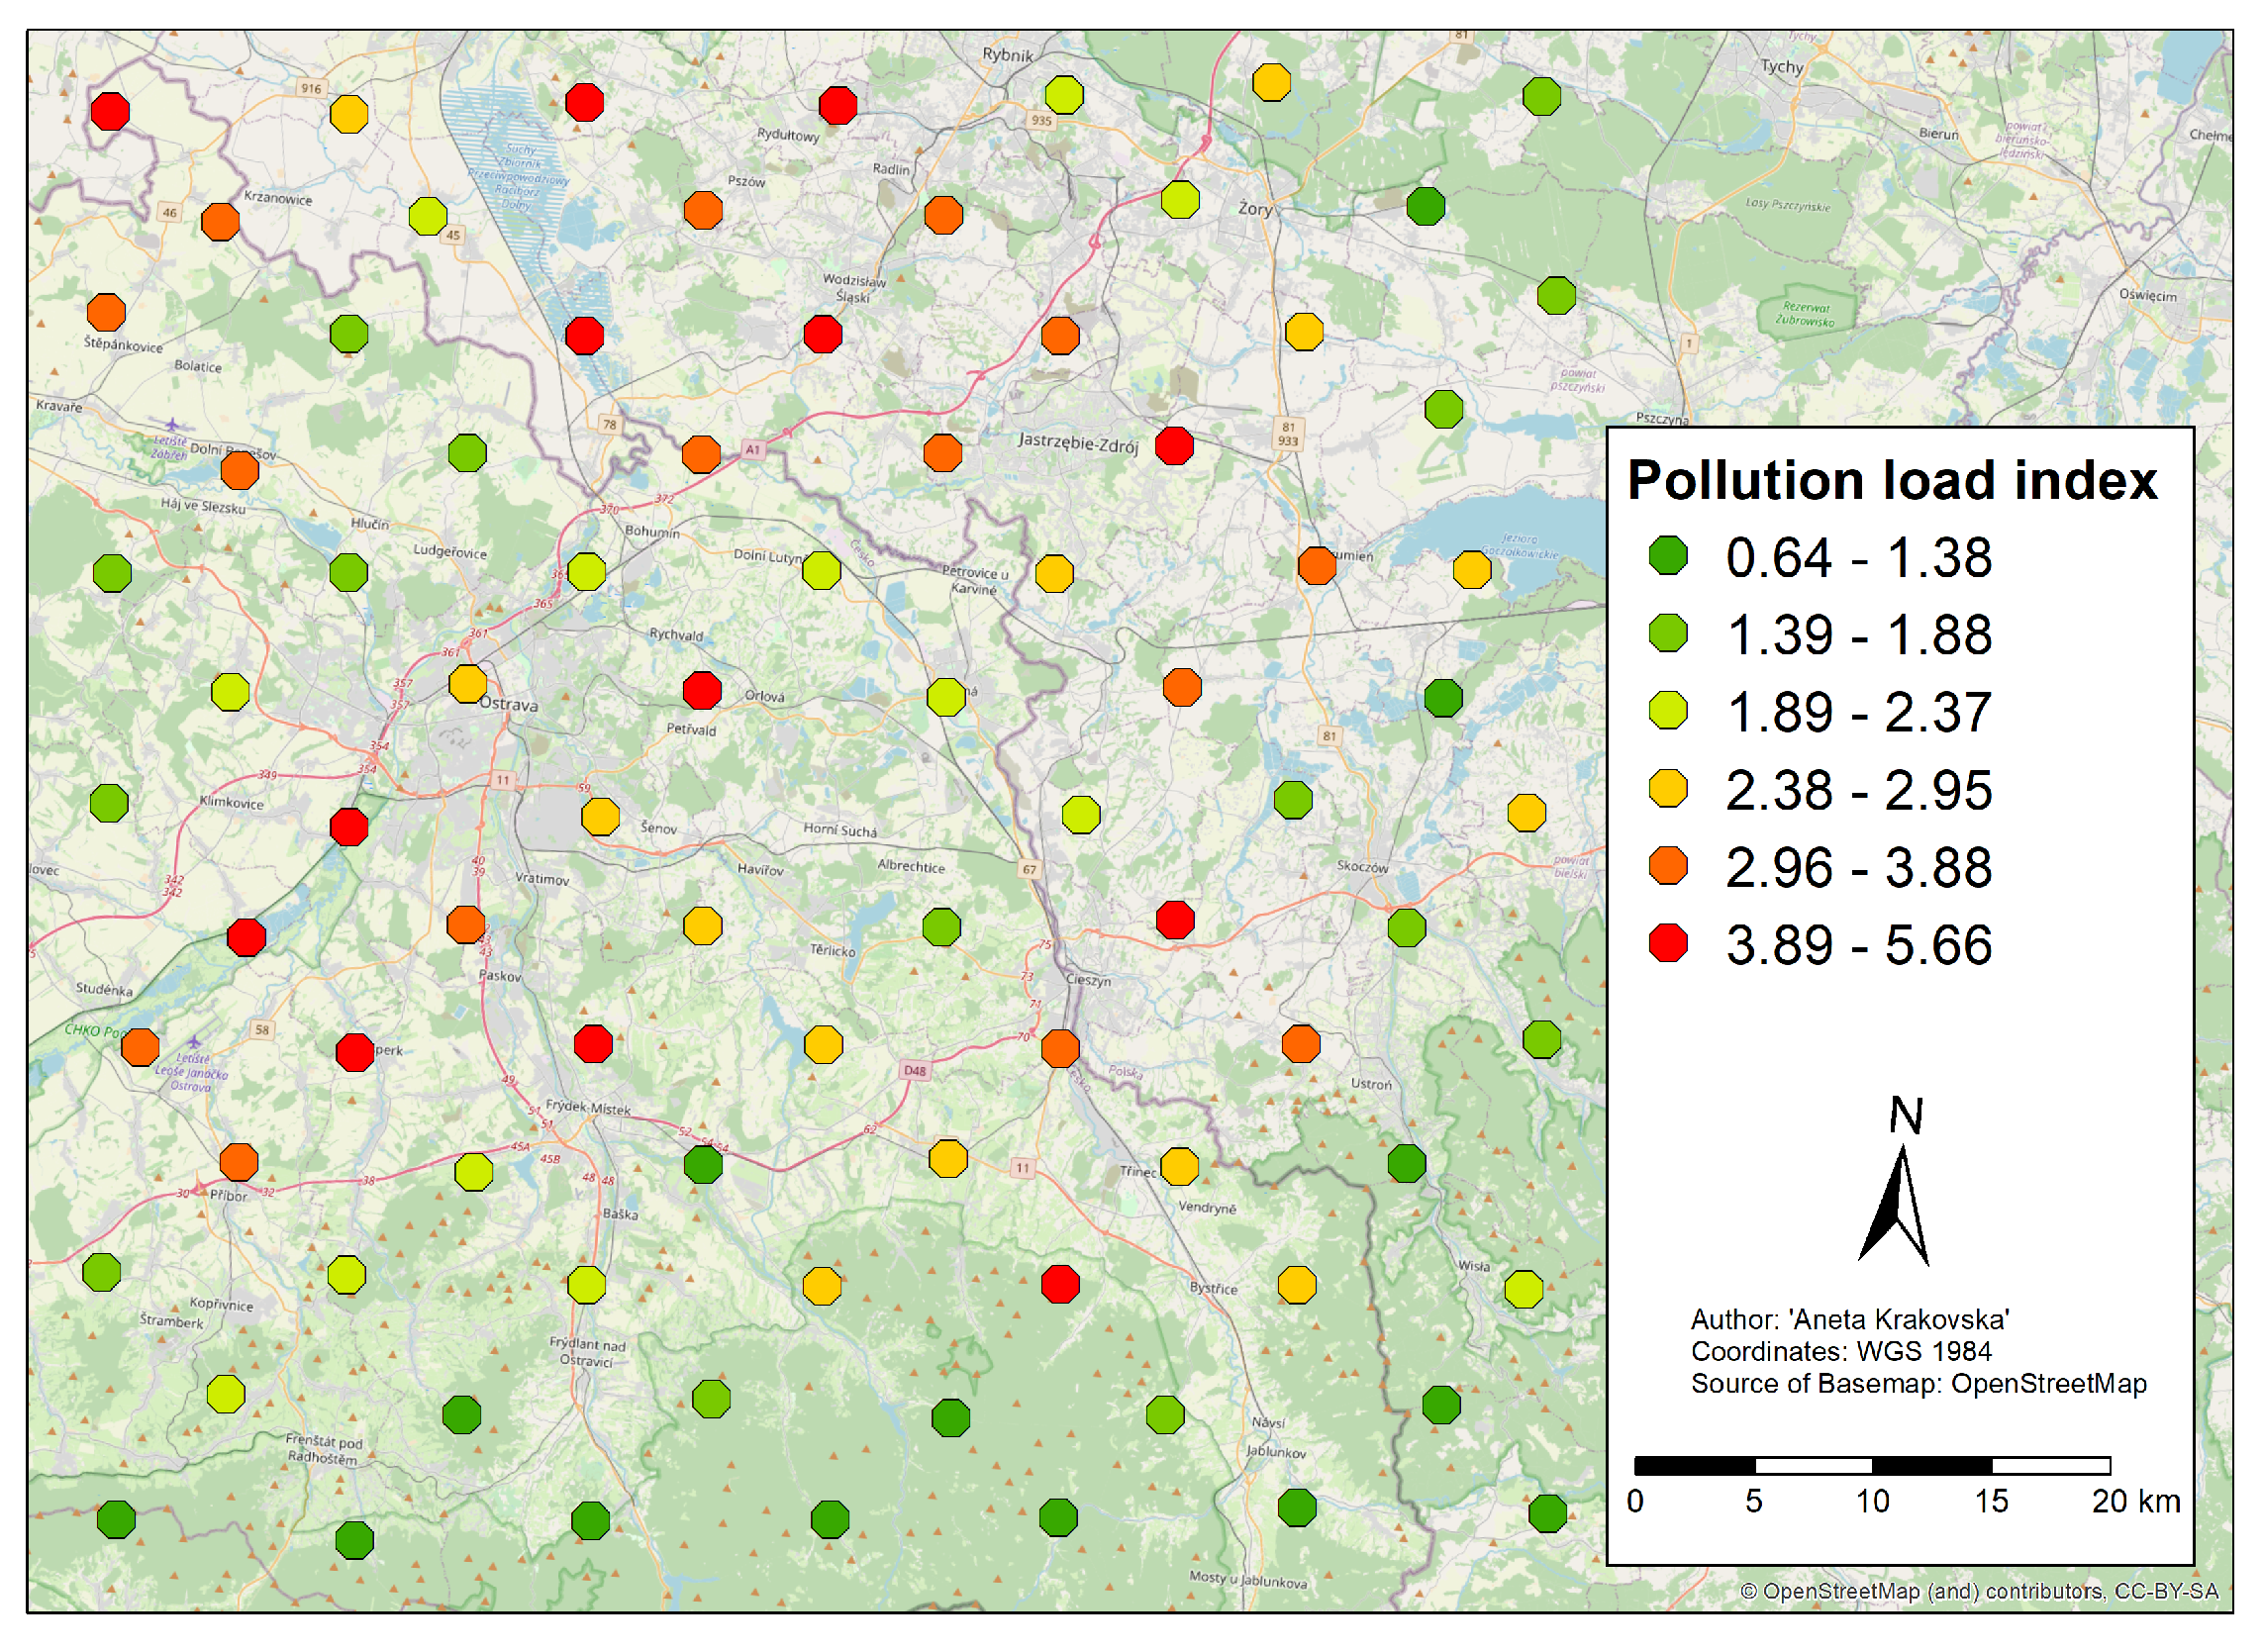
2.4.6. Pollution Load Index
3. Results
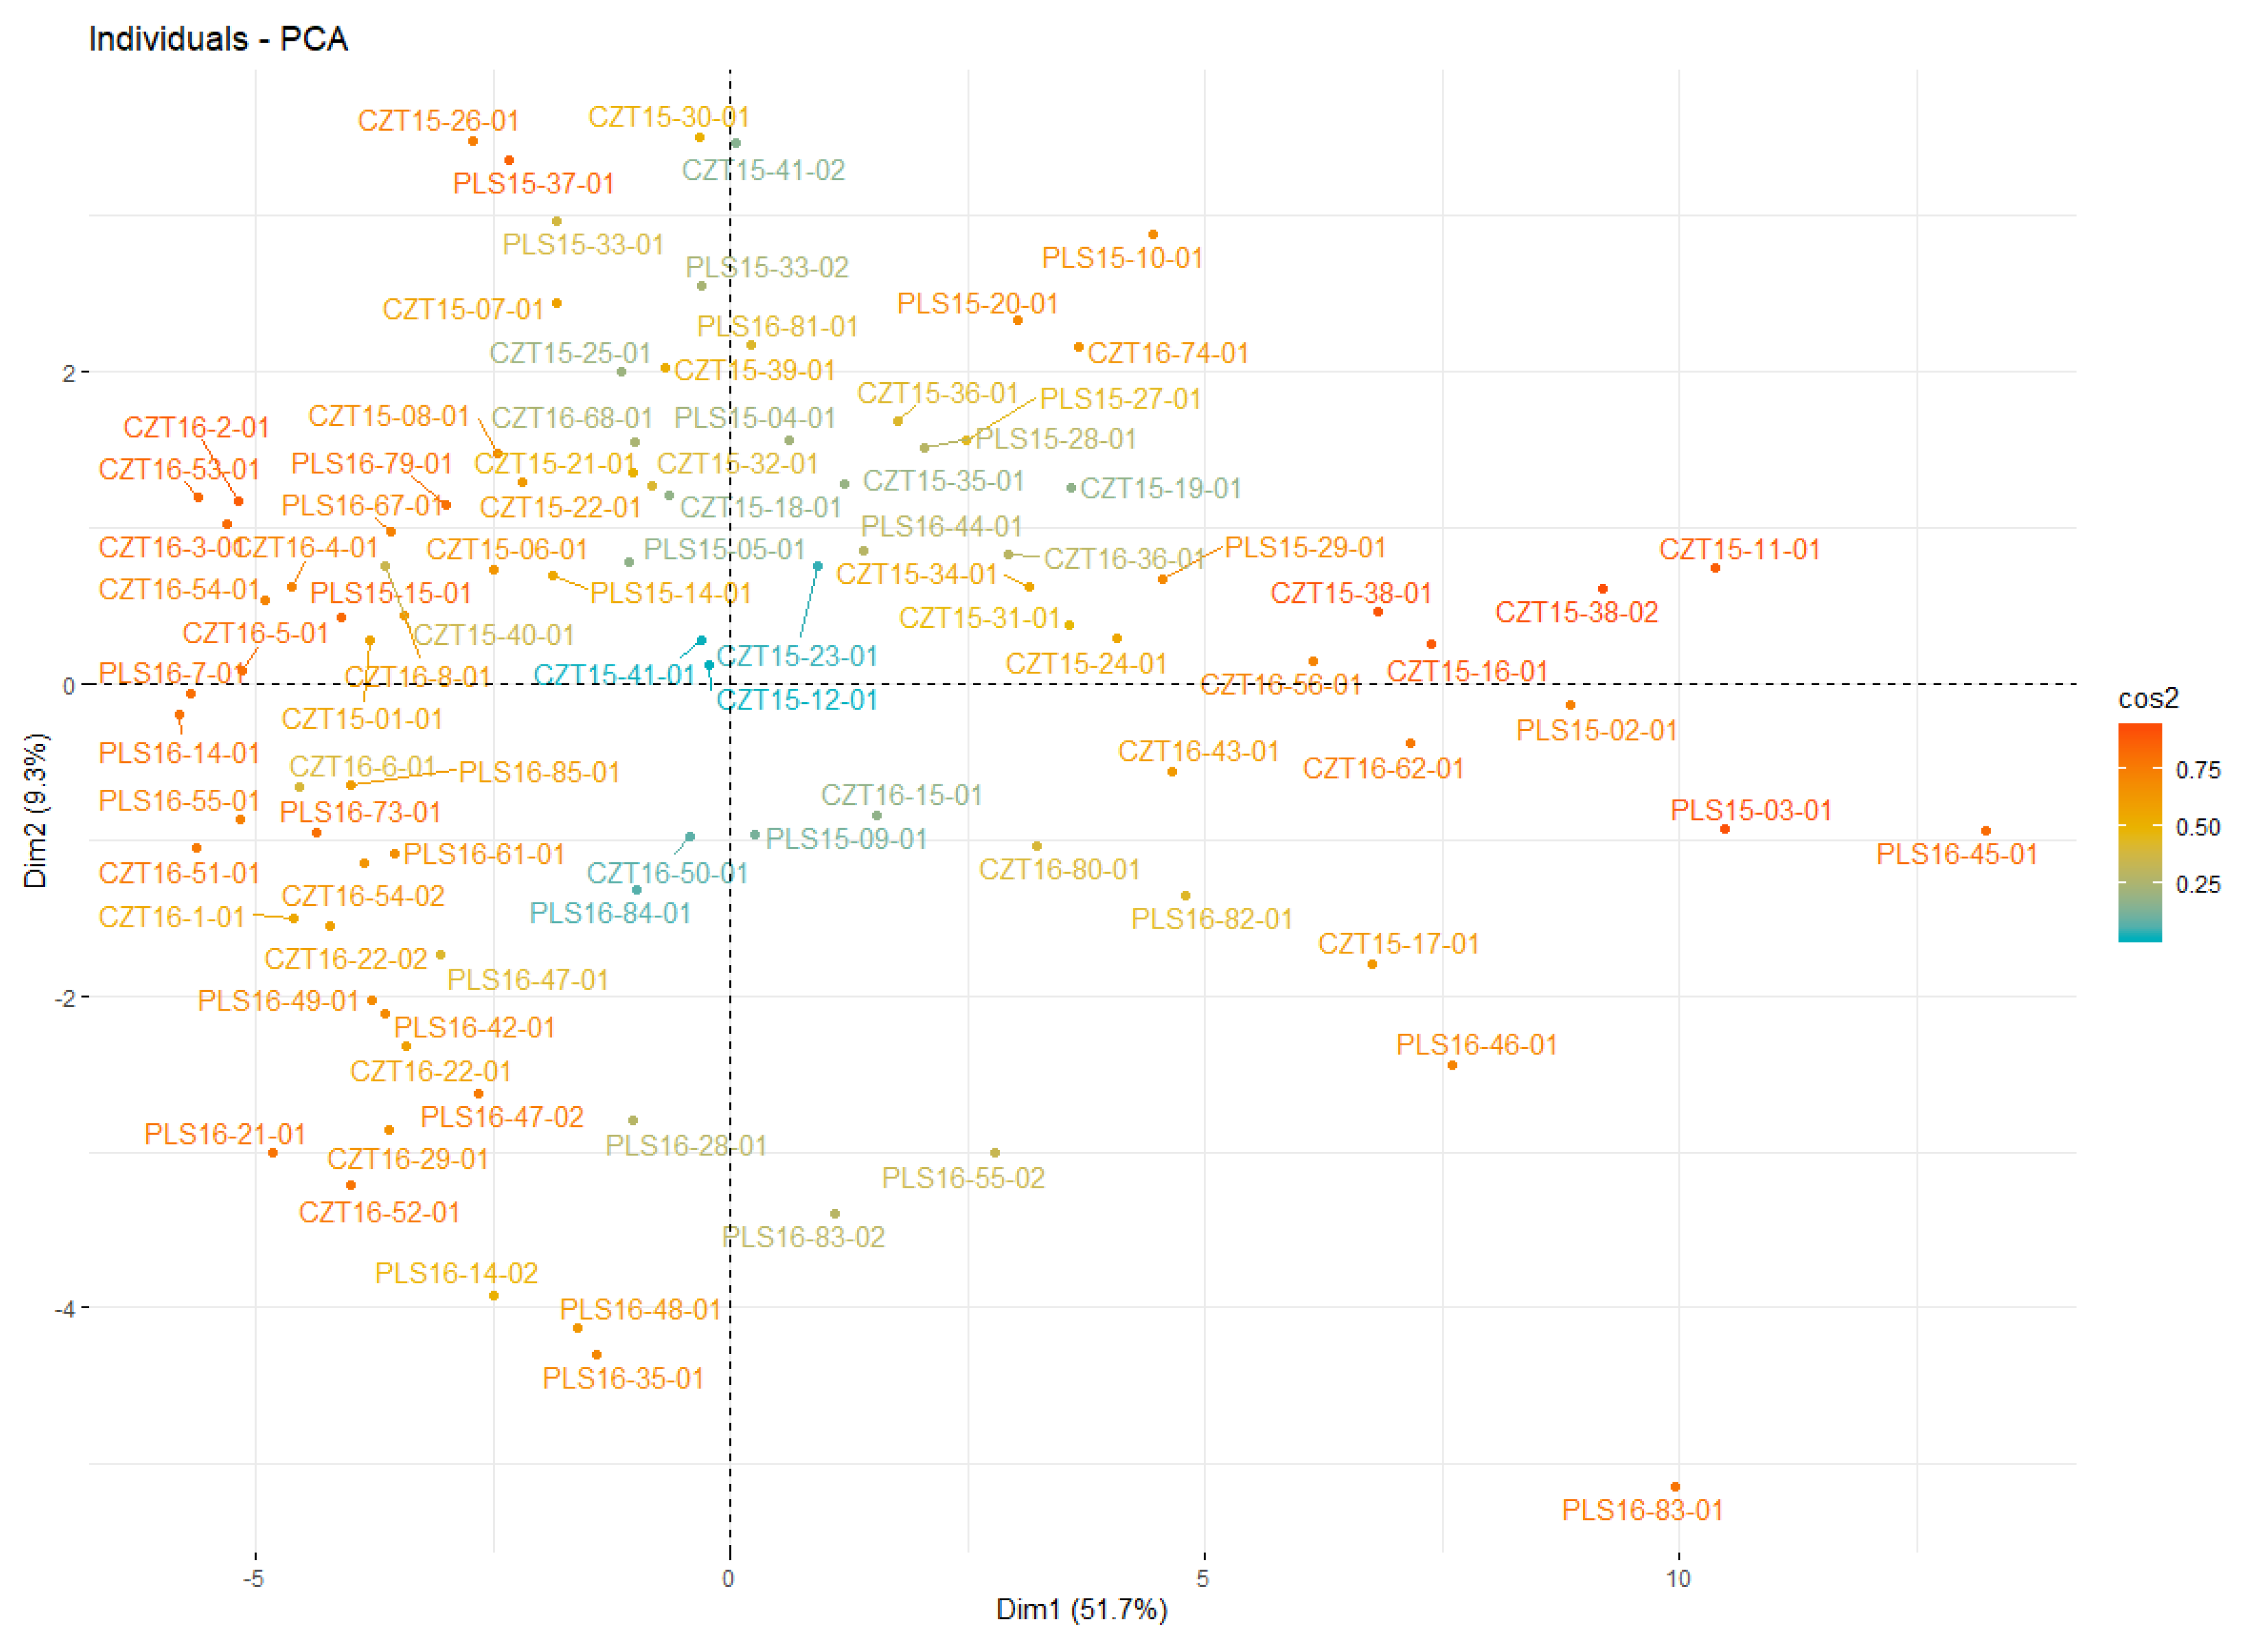
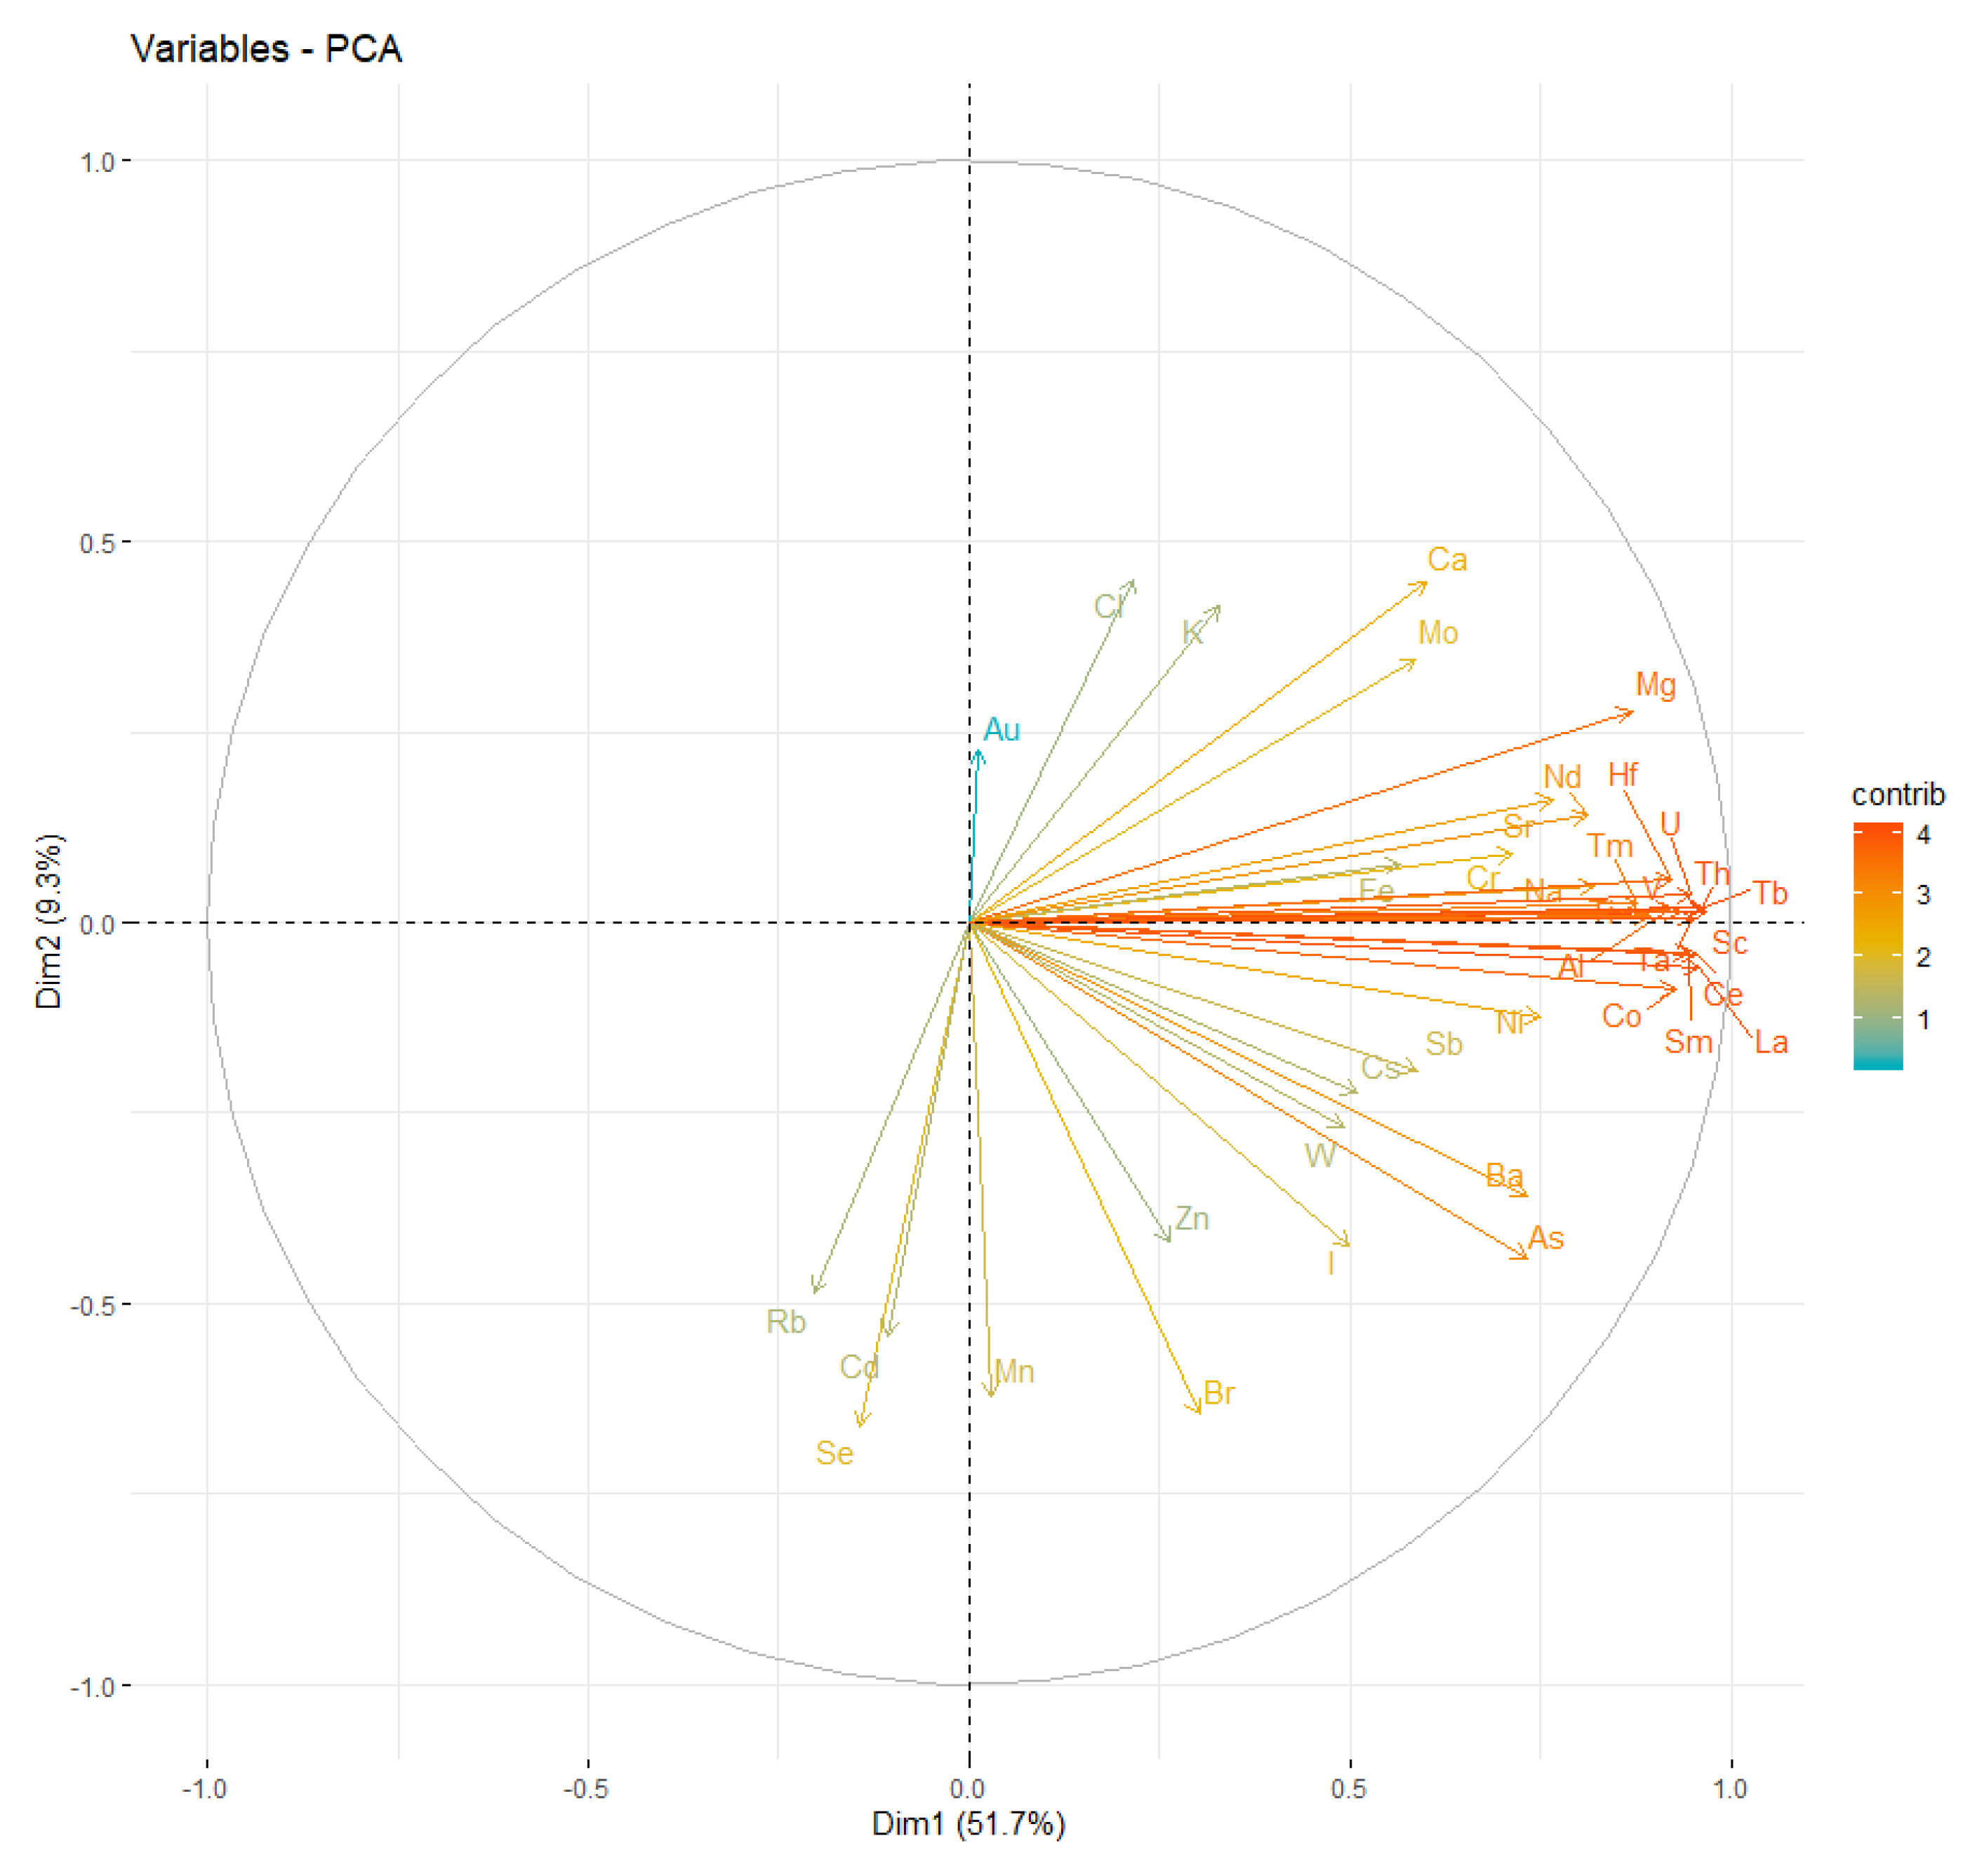
3.1. Principal Component Analysis
3.2. Factor Analysis
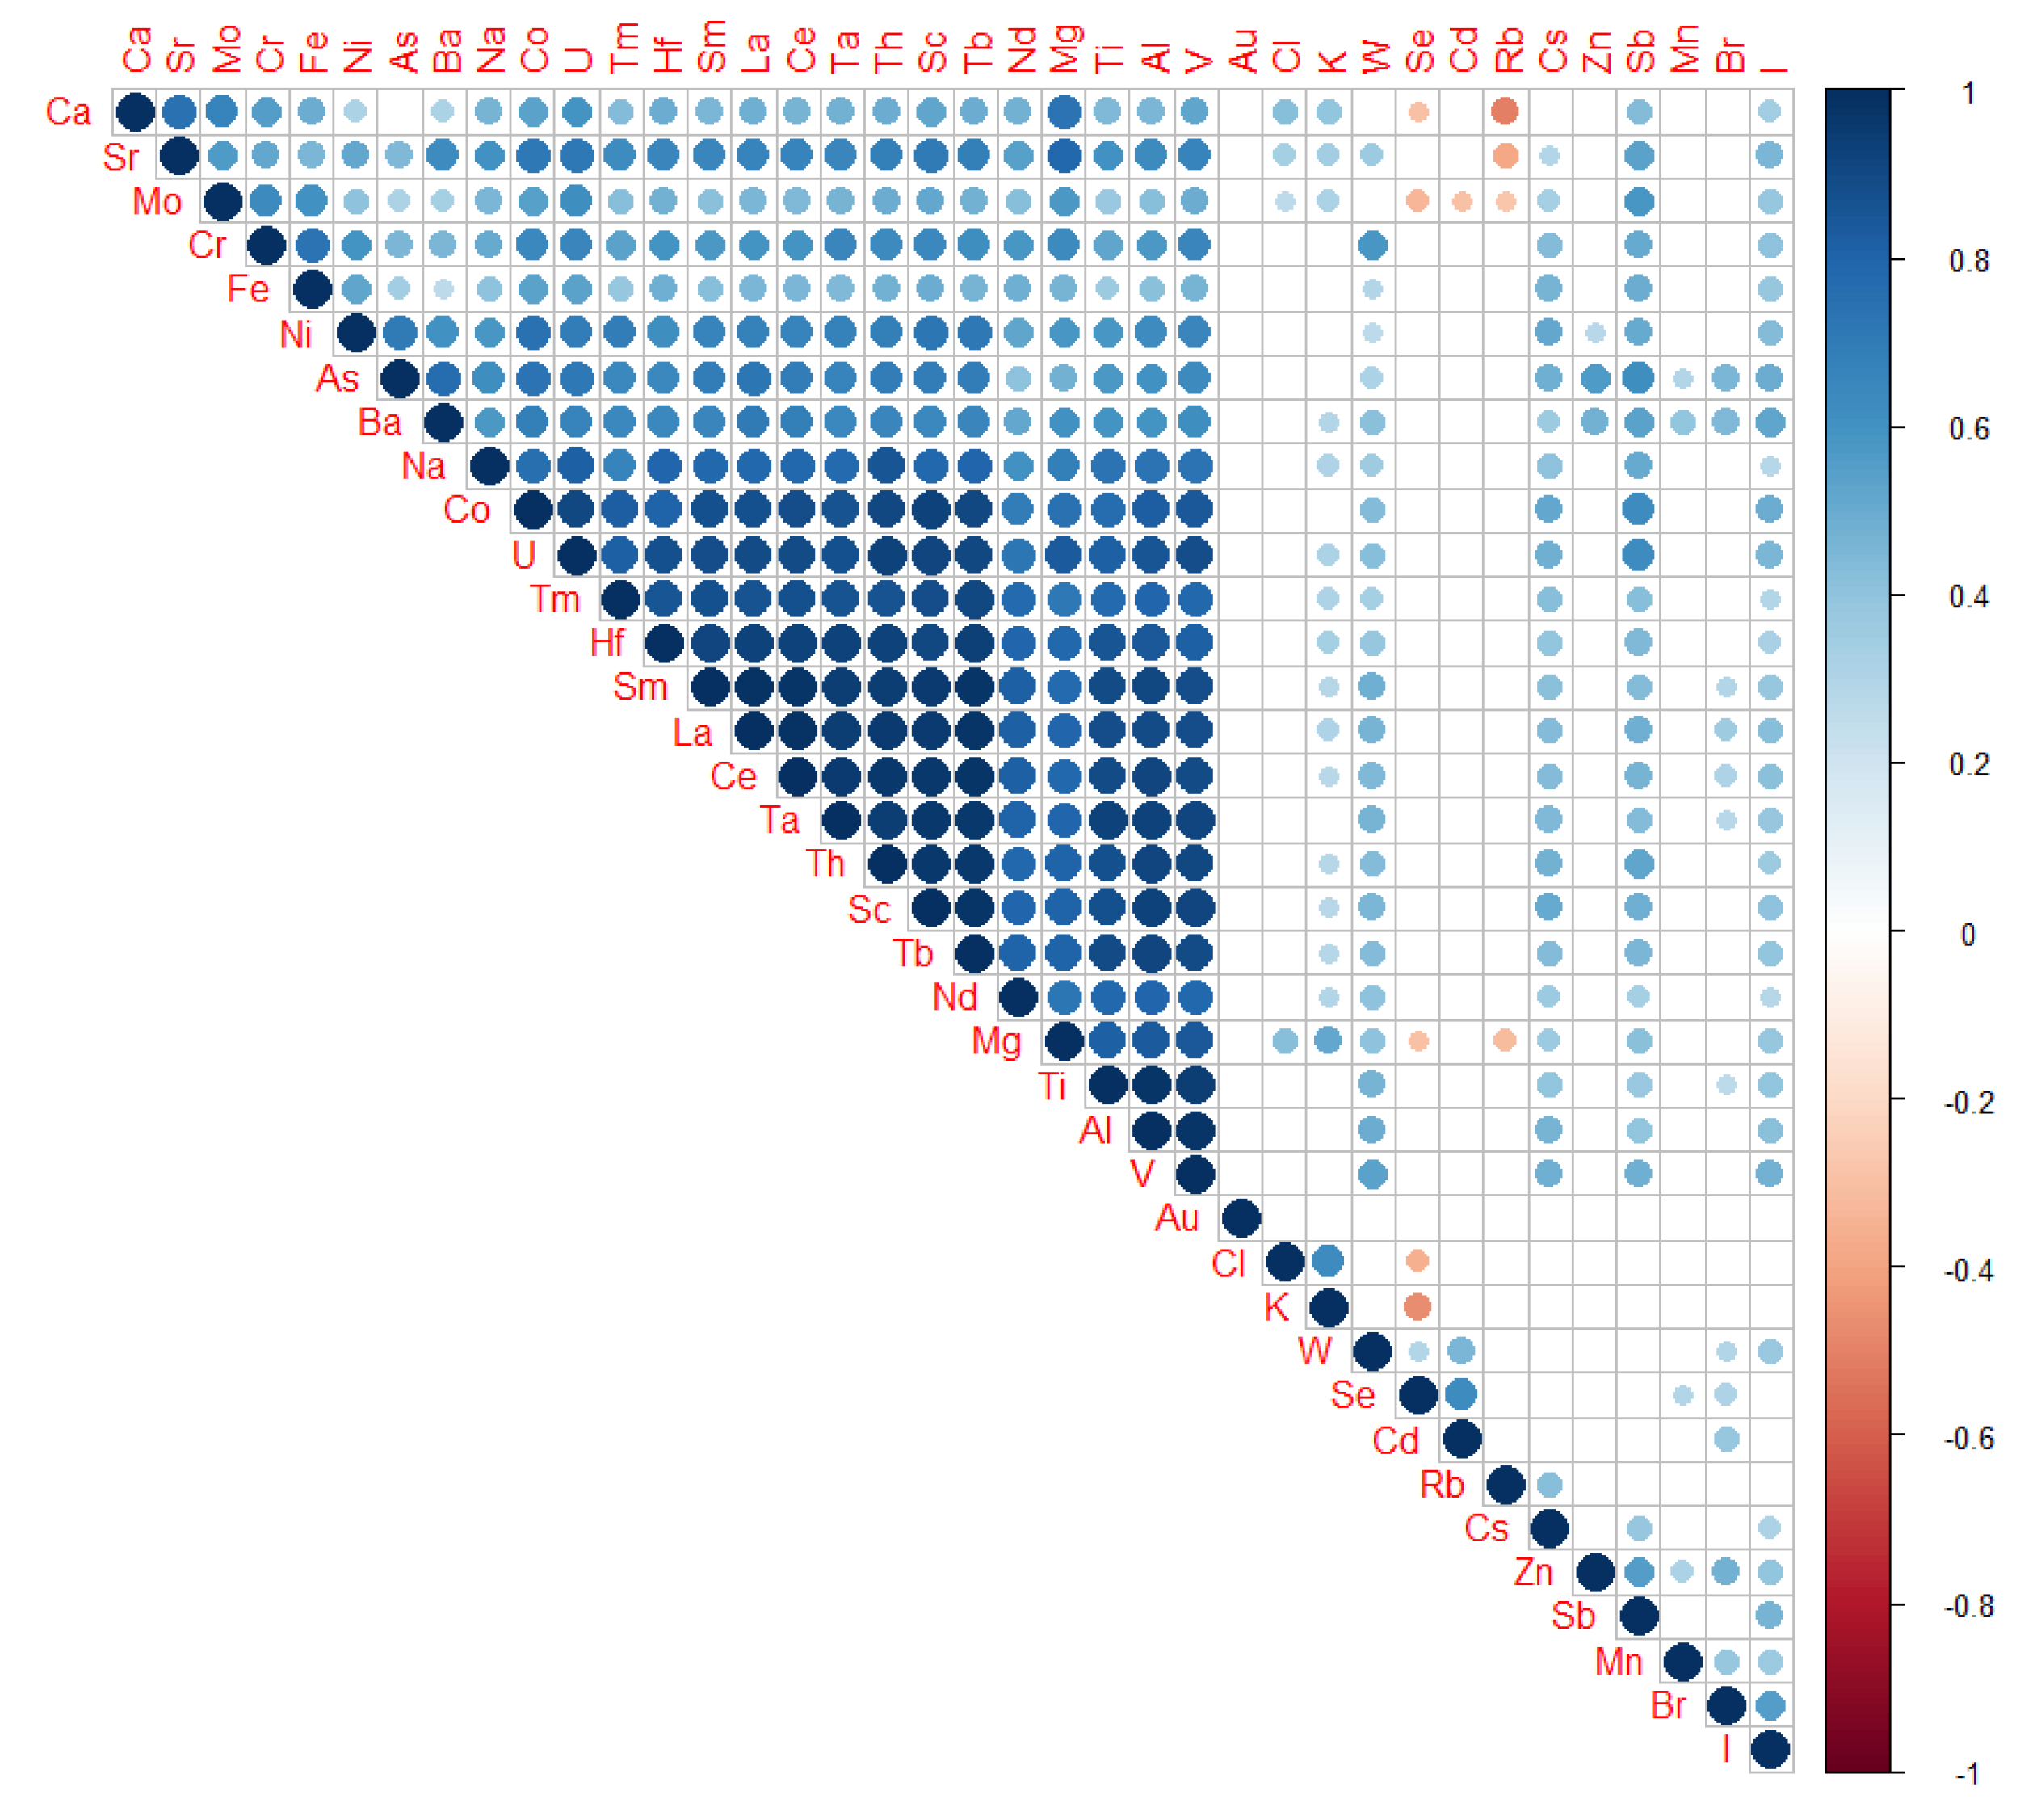
3.3. Correlations Analysis
3.4. Contamination Factor
3.5. Geoaccumulation Index
3.6. Enrichment Factor
3.7. Pollution Load Index
4. Discussion
5. Conclusions
Author Contributions
Funding
Conflicts of Interest
Abbreviations
| MDPI | Multidisciplinary Digital Publishing Institute |
| DOAJ | Directory of open access journals |
| TLA | Three letter acronym |
| LD | linear dichroism |
| i.e., | id est |
| EEA | The European Environment Agency |
| PM | Particulate matter |
| REZZO | Register of Emissions and Air Polution Sources |
| GIS | Geographic information system |
| ICP | International Cooperative Programme |
| JINR | Joint Institute for Nuclear Research |
| SLI | short lived isotope |
| LLI | long lived isotope |
| HPGe | high pure germanium |
| NAA | Neutron activation analysis |
| CRM | Certified reference material |
| NIST | National Institute of Standards and Technology |
| SRM | Standard Reference Materials |
| CF | Contamination factor |
| Igeo | Geoaccumulation index |
| PLI | Pollution load index |
| EF | Enrichment factor |
| PCA | Principal Component Analysis |
| HCPC | Hierarchical Clustering on Principal Components |
| e.g., | exempli gratia |
| FA | Factor analysis |
References
- Mulgrew, A.; Williams, P. Biomonitoring of Air Quality Using Plants; Air Hygiene Report; WHO Collab. Centre for Air Quality Management and Air Pollution Control: Berlin, Germany, 2000. [Google Scholar]
- Satsangi, G.; Yadav, S.; Pipal, A.; Kumbhar, N. Characteristics of trace metals in fine (PM2.5) and inhalable (PM10) particles and its health risk assessment along with in-silico approach in indoor environment of India. Atmos. Environ. 2014, 92, 384–393. [Google Scholar] [CrossRef]
- Sarti, E.; Pasti, L.; Rossi, M.; Ascanelli, M.; Pagnoni, A.; Trombini, M.; Remelli, M. The composition of PM1 and PM2.5 samples, metals and their water soluble fractions in the Bologna area (Italy). Atmos. Pollut. Res. 2015, 6. [Google Scholar] [CrossRef] [Green Version]
- European Environment Information and Observation Network (Eionet). European Environment Agency. Available online: https://www.eea.europa.eu/ (accessed on 26 May 2020).
- Cherry Hill Mortgage Investment Corp. ISKO: Informace o úrovni Znečištění Ovzduší ve Smyslu Zákona o Ochraně Ovzduší. Available online: http://portal.chmi.cz/ (accessed on 11 March 2019).
- Cherry Hill Mortgage Investment Corp. Register of Emissions and Air Polution Sources (REZZO). Available online: http://portal.chmi.cz/files/portal/docs/uoco/oez/embil/11embil/rezzo1_4/rezzo1_4_CZ.html (accessed on 26 May 2020).
- Krakovská, A.S. Analýza Prostorových Dat z Biomonitoringu v Průmyslových Oblastech. Ph.D. Thesis, VSB–Technical University of Ostrava, Ostrava, Czech Republic, 2020. [Google Scholar]
- UC Centre for Ecology and Hydrology. ICP Vegetation. Available online: https://icpvegetation.ceh.ac.uk/ (accessed on 26 May 2020).
- Rodrigues, L.A.; Daunis-i Estadella, P.; Figueras, G.; Henestrosa, S. Compositional Data Analysis: Theory and Applications; John Wiley & Sons: Hoboken, NJ, USA, 2011; pp. 235–254. [Google Scholar] [CrossRef]
- Eaton, M. Multivariate Statistics: A Vector Space Approach; Lecture Notes-Monograph Series; Institute of Mathematical Statistics: Hoboken, NJ, USA, 2007. [Google Scholar]
- Aitchison, J. The Statistical Analysis of Compositional Data; Chapman & Hall, Ltd.: GBR, Australia, 1986. [Google Scholar]
- Hron, K. Elementy Statistické Analýzy Kompozičních Dat in Informační Bulletin České Statistické Společnosti; Praha, Czech Republic, 2010; Volume 3, Available online: https://www.statspol.cz/oldstat/bulletiny/ib-2010-3.pdf (accessed on 25 October 2020).
- Shirani, M.; Afzali, K.; Jahan, S.; Strezov, V.; Soleimani-Sardo, M. Pollution and contamination assessment of heavy metals in the sediments of Jazmurian playa in southeast Iran. Sci. Rep. 2020, 10. [Google Scholar] [CrossRef]
- Jiang, H.H.; Cai, L.; Wen, H.H.; Luo, J. Characterizing pollution and source identification of heavy metals in soils using geochemical baseline and PMF approach. Sci. Rep. 2020, 10. [Google Scholar] [CrossRef] [PubMed] [Green Version]
- Betsou, C.; Tsakiri, E.; Kazakis, N.; Vasilev, A.; Frontasyeva, M.; Ioannidou, A. Atmospheric deposition of trace elements in Greece using moss Hypnum cupressiforme Hedw. as biomonitors. J. Radioanal. Nucl. Chem. 2019, 320, 597–608. [Google Scholar] [CrossRef]
- Koroleva, Y.; Napreenko, M.; Baymuratov, R.; Schefer, R. Bryophytes as a bioindicator for atmospheric deposition in different coastal habitats (a case study in the Russian sector of the Curonian Spit, South-Eastern Baltic). Int. J. Environ. Stud. 2020, 77, 152–162. [Google Scholar] [CrossRef]
- Demková, L.; Árvay, J.; Bobulska, L.; Hauptvogl, M.; Hrstková, M. Open mining pits and heaps of waste material as the source of undesirable substances: Biomonitoring of air and soil pollution in former mining area (Dubnik, Slovakia). Environ. Sci. Pollut. Res. 2019, 26. [Google Scholar] [CrossRef] [PubMed]
- Aničić Urošević, M.; Frontasyeva, M.; Tomasevic, M.; Popovic, A. Assessment of Atmospheric Deposition of Heavy Metals and Other Elements in Belgrade Using the Moss Biomonitoring Technique and Neutron Activation Analysis. Environ. Monit. Assess. 2007, 129, 207–219. [Google Scholar] [CrossRef] [PubMed]
- Vergel, K.; Zinicovscaia, I.; Yushin, N.; Frontasyeva, M. Heavy Metal Atmospheric Deposition Study in Moscow Region, Russia. Bull. Environ. Contam. Toxicol. 2019, 103. [Google Scholar] [CrossRef]
- Thieme, N. R generation. Significance 2018, 15, 14–19. [Google Scholar] [CrossRef]
- Templ, M.; Hron, K.; Filzmoser, P. robCompositions: An R-Package for Robust Statistical Analysis of Compositional Data. In Compositional Data Analysis: Theory and Applications; John Wiley and Sons, Ltd.: Chichester, UK, 2011; pp. 341–345. [Google Scholar]
- Lê, S.; Josse, J.; Husson, F. FactoMineR: An R Package for Multivariate Analysis. J. Stat. Softw. Artic. 2008, 25, 1–18. [Google Scholar] [CrossRef] [Green Version]
- Wei, T.; Simko, V. R Package “Corrplot”: Visualization of a Correlation Matrix; Version 0.84; 2017; Available online: https://github.com/taiyun/corrplot/ (accessed on 26 May 2020).
- StatSoft CR s.r.o. TIBCO Statistica. Available online: http://www.statsoft.cz/ (accessed on 26 May 2020).
- Barandovski, L.; Frontasyeva, M.; Stafilov, T.; Sajn, R.; Ostrovnaya, T. Multi-element atmospheric deposition in Macedonia studied by the moss biomonitoring technique. Environ. Sci. Pollut. Res. 2015. [Google Scholar] [CrossRef] [PubMed]
- Bajraktari, N.; Morina, I.; Demaku, S. Assessing the Presence of Heavy Metals in the Area of Glloogoc (Kosovo) by Using Mosses as a Bioindicator for Heavy Metals. J. Ecol. Eng. 2019, 20, 135–140. [Google Scholar] [CrossRef]
- Zinicovscaia, I.; Aničić Urošević, M.; Vergel, K.; Vieru, E.; Frontasyeva, M.; Povar, I.; Duca, G. Active Moss Biomonitoring of Trace Elements Air Pollution in Chisinau, Republic of Moldova. Ecol. Chem. Eng. 2018, 25, 361–372. [Google Scholar] [CrossRef] [Green Version]
- Shetekauri, S.; Chaligava, O.; Shetekauri, T.; Kvlividze, A.; Kalabegishvili, T.; Kirkesali, E.; Frontasyeva, M.; Chepurchenko, O.; Tselmovich, V. Biomonitoring Air Pollution Using Moss in Georgia. Pol. J. Environ. Stud. 2018, 27. [Google Scholar] [CrossRef]
- Korzekwa, S.; Frontasyeva, M. Air Pollution Studies in Opole Region, Poland, Using the Moss Biomonitoring and INAA. Am. Inst. Phys. 2007, 958, 230–231. [Google Scholar] [CrossRef]
- Ermakova, E.; Frontasyeva, M.; Pavlov, S.; Povtoreiko, E.; Steinnes, E.; Cheremisina, Y. Air Pollution Studies in Central Russia (Tver and Yaroslavl Regions) Using the Moss Biomonitoring Technique and Neutron Activation Analysis. J. Atmos. Chem. 2004, 49, 549–561. [Google Scholar] [CrossRef] [Green Version]
- Haruštiaková, D.; Jarkovský, J.; Littnerová, S.; Dušek, L. Vícerozměrné Statistické Metody v Biologii; Akademické nakladatelství CERM, s.r.o.: Brno, Czech Republic, 2012. [Google Scholar]
- Hebák, P. Vícerozměrné Statistické Metody; Informatorium: Praha, Czech Republic, 2007. [Google Scholar]
- Legendre, P.; Legendre, L. Numerical Ecology, 3rd ed.; Elsevier: Amsterdam, The Netherlands, 2012. [Google Scholar]
- Håkanson, L. An Ecological Risk Index for Aquatic Pollution Control—A Sedimentological Approach. Water Res. 1980, 14, 975–1001. [Google Scholar] [CrossRef]
- Fernández, J.; Rey, A.; Carballeira, A. An extended study of heavy metal deposition in Galicia (NW Spain) based on moss analysis. Sci. Total Environ. 2000, 254, 31–44. [Google Scholar] [CrossRef]
- Muller, G. Index of Geoaccumulation in Sediments of the Rhine River. Geojournal 1969, 2, 109–118. [Google Scholar]
- Turekian, K.; Wedepohl, K. Distribution of the Elements in Some Major Units of the Earth’s Crust. Geol. Soc. Am. Bull. 1961, 72. [Google Scholar] [CrossRef]
- Covelli, S.; Fontolan, G. Application of a normalization procedure in determining regional geochemical baselines. Environ. Geol. 1997, 30, 34–45. [Google Scholar] [CrossRef]
- Sinex, S.; Helz, G. Regional geochemistry of trace elements in Chesapeake Bay sediments. Environ. Geol. 1981, 3, 315–323. [Google Scholar] [CrossRef]
- Rubio, B.; Nombela, M.; Vilas, F. Geochemistry of Major and Trace Elements in Sediments of the Ria de Vigo (NW Spain): An Assessment of Metal Pollution. Mar. Pollut. Bull. 2000, 40, 968–980. [Google Scholar] [CrossRef]
- Ackermann, F. A procedure for correcting the grain size effect in heavy metal analyses of estuarine and coastal sediments. Environ. Technol. Lett. 2008, 1. [Google Scholar] [CrossRef]
- Olise, F.; Lasun Tunde, O.; Olajire, M.; Owoade, O.; Oloyede, F.; Fawole, O.G.; Ezeh, G. Biomonitoring of environmental pollution in the vicinity of iron and steel smelters in southwestern Nigeria using transplanted lichens and mosses. Environ. Monit. Assess. 2019, 191. [Google Scholar] [CrossRef]
- Rotter, P.; Šrámek, V.; Vácha, R.; Borůvka, L.; Fadrhonsová, V.; Sáňka, M.; Drábek, O.; Vortelová, L. Rizikové prvky v lesních půdách: review. ZpráVy Lesn. VýZkumu 2013, 58, 17–27. [Google Scholar]
- Kłos, A.; Rajfur, M.; Wacławek, M.; Wacławek, M. Application of enrichment factor (EF) to the interpretation of results from the biomonitoring studies. Ecol. Chem. Eng. 2011, 18, 171–183. [Google Scholar]
- Tomlinson, D.; Wilson, J.; Harris, C.; Jeffrey, D. Problems in Assessment of Heavy Metals in Estuaries and the Formation of Pollution Index. HelgoläNder Meeresunters. 1980, 33, 566–575. [Google Scholar] [CrossRef] [Green Version]
- Salo, H.; Bućko, M.; Vaahtovuo, E.; Limo, J.; Mäkinen, J.; Pesonen, L. Biomonitoring of air pollution in SW Finland by magnetic and chemical measurements of moss bags and lichens. J. Geochem. Explor. 2012, 115, 69–81. [Google Scholar] [CrossRef]
- Angulo, E. The Tomlinson Pollution Load Index applied to heavy metal, ’Mussel-Watch’ data: A useful index to assess coastal pollution. Sci. Total Environ. 1996, 187, 19–56. [Google Scholar] [CrossRef]
- Aitchison, J.; Greenacre, M. Biplots of Compositional Data. J. R. Stat. Soc. Ser. 2002, 51, 375–392. [Google Scholar] [CrossRef] [Green Version]
- Cartell, R. The Scree Test for the Number of Factors. Multivar. Behav. Res. 1966, 1, 245–276. [Google Scholar] [CrossRef] [PubMed]
- Meloun, M. Vícerozměrná Analýza Dat Metodou Hlavních Komponent a Shluků; Analýza Dat 2015; Celostátní Seminář a Workshop: Pardubice, Czech Republic, 2015; pp. 25–42. [Google Scholar]
- Barbieri, M. The Importance of Enrichment Factor (EF) and Geoaccumulation Index (Igeo) to Evaluate the Soil Contamination. J. Geol. Geophys. 2016, 5. [Google Scholar] [CrossRef]
- Nowrouzi, M.; Pourkhabbaz, A. Application of geoaccumulation index and enrichment factor for assessing metal contamination in the sediments of Hara Biosphere Reserve, Iran. Chem. Speciat. Bioavailab. 2014, 26. [Google Scholar] [CrossRef] [Green Version]
- Pant, P.; Harrison, R. Critical Review of Receptor Modelling for Particulate Matter: A Case Study of India. Atmos. Environ. 2012, 49, 1–12. [Google Scholar] [CrossRef]
- Fawole, O.; Owoade, O.; Hopke, P.; Olise, F.; Lasun Tunde, O.; Olaniyi, B.; Jegede, O.; Ayoola, M.; Bashiru, M. Chemical compositions and source identification of particulate matter (PM2.5 and PM2.5–10) from a scrap iron and steel smelting industry along the Ife–Ibadan highway, Nigeria. Atmos. Pollut. Res. 2015, 6, 107–119. [Google Scholar] [CrossRef]
- Kara, M.; Hopke, P.; Dumanoglu, Y.; Altiok, H.; Elbir, T.; Odabasi, M.; Bayram, A. Characterization of PM Using Multiple Site Data in a Heavily Industrialized Region of Turkey. Aerosol Air Qual. Res. 2015, 15, 11–27. [Google Scholar] [CrossRef]
- Bates, J.; Farmer, A. Bryophytes and Lichens in a Changing Environment; Oxford University Press: New York, NY, USA, 1992. [Google Scholar]
- Wells, J.; Boddy, L. Phosphorous translocation by saprotrophic basidiomycete cord systems on the floor of a mixed deciduous woodland. Mycol. Res. 1995, 99, 977–980. [Google Scholar] [CrossRef]
- Brown, D.; Brumelis, G. A biomonitoring method using the cellular distribution of metals in moss. Sci. Total Environ. 1996, 187, 153–161. [Google Scholar] [CrossRef]
- Brumelis, G.; Brown, D. Movement of Metals to New Growing Tissue in the Moss Hylocomium splendens (Hedw.) BSG. Ann. Bot. 1997, 79. [Google Scholar] [CrossRef] [Green Version]
- Pandey, V.; Upreti, D.; Pathak, R.; Pal, A. Heavy Metal Accumulation in Lichens from the Hetauda Industrial Area Narayani Zone Makwanpur District, Nepal. Environ. Monit. Assess. 2002, 73, 221–228. [Google Scholar] [CrossRef] [PubMed]
- Praha: Ministerstvo životního Prostředí, CENIA. Integrovaný Registr Znečišťování životního Prostředí. Available online: https://www.irz.cz/ (accessed on 26 May 2020).
- Greenwood, N.N.; Earnshaw, A. Chemie Prvků; Informatorium: Praha, Czech Republic, 1993. [Google Scholar]
- Český Statistický úřad (ČSÚ). Český Statistický úřad. Available online: https://www.czso.cz/ (accessed on 26 May 2020).


| Min [mg/kg] | Max [mg/kg] | Mean [mg/kg] | Median [mg/kg] | std.dev [mg/kg] | var [mg/kg]2 | var. koef. / | Skew / | kurt. / | |
|---|---|---|---|---|---|---|---|---|---|
| Na | 84.9 | 1150 | 276 | 224 | 173 | 29,869 | 0.6 | 2 | 9.1 |
| Mg | 789 | 4790 | 2525 | 2340 | 1009 | 1,017,205 | 0.4 | 0.3 | 2.1 |
| Al | 305 | 11,000 | 2530 | 1830 | 2119 | 4,488,235 | 0.8 | 1.4 | 4.9 |
| Cl | 69.3 | 2240 | 502 | 389 | 394 | 154,875 | 0.8 | 1.9 | 7.7 |
| K | 4660 | 20,200 | 11,024 | 11,100 | 3104 | 9,634,437 | 0.3 | 0.1 | 3 |
| Ca | 1540 | 10,600 | 5941 | 5940 | 2411 | 5,811,460 | 0.4 | 0 | 2 |
| Sc | 0.053 | 1.86 | 0.51 | 0.41 | 0.384 | 0.147 | 0.8 | 1.1 | 3.8 |
| Ti | 22.3 | 923 | 202 | 133 | 177 | 31,182 | 0.9 | 1.5 | 5.2 |
| V | 0.551 | 14.9 | 4 | 2.88 | 3.13 | 9.78 | 0.8 | 1.2 | 4.1 |
| Cr | 1.1 | 34.1 | 6.84 | 5.41 | 5.56 | 30.96 | 0.8 | 2.1 | 8.9 |
| Mn | 45.7 | 767 | 230 | 195 | 153 | 23,449 | 0.7 | 1.5 | 5 |
| Fe | 338 | 18,700 | 2203 | 1680 | 2258 | 5,099,947 | 1 | 4.5 | 31.9 |
| Co | 0.119 | 2.13 | 0.76 | 0.63 | 0.483 | 0.233 | 0.6 | 1.1 | 3.6 |
| Ni | 0.711 | 8.26 | 2.98 | 2.69 | 1.465 | 2.15 | 0.5 | 1.2 | 4.8 |
| Zn | 30.6 | 587 | 111 | 85.4 | 106 | 11,295 | 1 | 3.3 | 13.6 |
| As | 0.286 | 3.75 | 1.07 | 0.97 | 0.518 | 0.269 | 0.5 | 2.1 | 10 |
| Se | 0.06 | 2.39 | 0.64 | 0.39 | 0.537 | 0.289 | 0.8 | 1.4 | 3.8 |
| Br | 1.65 | 7.73 | 3.54 | 3.27 | 1.31 | 1.72 | 0.4 | 1 | 3.9 |
| Rb | 5.94 | 63.8 | 17.2 | 13.3 | 11.5 | 132 | 0.7 | 1.9 | 6.8 |
| Sr | 5.65 | 69.2 | 27.4 | 26.6 | 13.3 | 177 | 0.5 | 0.5 | 3 |
| Mo | 0.016 | 1 | 0.39 | 0.34 | 0.245 | 0.06 | 0.6 | 0.6 | 2.3 |
| Cd | 0.02 | 7.09 | 1.18 | 0.57 | 1.719 | 2.95 | 1.5 | 2.2 | 6.8 |
| Sb | 0.049 | 1.31 | 0.34 | 0.28 | 0.226 | 0.051 | 0.7 | 2 | 7.8 |
| I | 0.349 | 4.08 | 1.41 | 1.31 | 0.724 | 0.525 | 0.5 | 1 | 4.2 |
| Cs | 0.078 | 1.74 | 0.41 | 0.33 | 0.282 | 0.079 | 0.7 | 1.7 | 7.4 |
| Ba | 13.1 | 209 | 63.1 | 55.8 | 33.8 | 1145 | 0.5 | 1.3 | 5.8 |
| La | 0.194 | 6.13 | 1.6 | 1.24 | 1.211 | 1.47 | 0.8 | 1.2 | 4.1 |
| Ce | 0.011 | 15.6 | 3.23 | 2.43 | 2.682 | 7.19 | 0.8 | 1.6 | 6.6 |
| Nd | 0.249 | 6.82 | 1.91 | 1.74 | 1.333 | 1.78 | 0.7 | 1 | 4.1 |
| Sm | 0.026 | 1.03 | 0.26 | 0.2 | 0.201 | 0.04 | 0.8 | 1.3 | 4.5 |
| Tb | 0.003 | 0.16 | 0.04 | 0.03 | 0.03 | 0.001 | 0.8 | 1.3 | 4.5 |
| Tm | 0.002 | 0.08 | 0.02 | 0.02 | 0.017 | 0 | 0.7 | 1.2 | 4.2 |
| Hf | 0.025 | 1.56 | 0.39 | 0.27 | 0.34 | 0.115 | 0.9 | 1.2 | 3.9 |
| Ta | 0.004 | 0.21 | 0.05 | 0.04 | 0.041 | 0.002 | 0.8 | 1.3 | 4.4 |
| W | 0.03 | 1.38 | 0.27 | 0.23 | 0.233 | 0.054 | 0.9 | 2.2 | 9.9 |
| Au | 0 | 0.07 | 0 | 0 | 0.008 | 0 | 4.4 | 7.4 | 59.4 |
| Th | 0.049 | 1.92 | 0.49 | 0.38 | 0.4 | 0.16 | 0.8 | 1.3 | 4.5 |
| U | 0.021 | 0.56 | 0.18 | 0.14 | 0.14 | 0.02 | 0.8 | 1 | 3.3 |
| Factor 1 | Factor 2 | Factor 3 | Factor 4 | Factor 5 | |
|---|---|---|---|---|---|
| Na | 0.79 | 0.16 | 0.16 | 0.07 | 0.13 |
| Mg | 0.76 | 0.07 | 0.37 | 0.05 | 0.39 |
| Al | 0.94 | 0.04 | 0.13 | −0.06 | 0.07 |
| Cl | 0.11 | −0.02 | 0.12 | 0.08 | 0.82 |
| K | 0.25 | 0.07 | 0.00 | 0.22 | 0.79 |
| Ca | 0.37 | 0.01 | 0.72 | 0.03 | 0.42 |
| Sc | 0.96 | 0.11 | 0.19 | 0.01 | 0.03 |
| Ti | 0.92 | 0.03 | 0.08 | −0.09 | 0.11 |
| V | 0.91 | 0.08 | 0.25 | −0.07 | 0.03 |
| Cr | 0.56 | 0.13 | 0.62 | 0.03 | −0.13 |
| Mn | −0.08 | 0.61 | −0.12 | −0.33 | −0.03 |
| Fe | 0.38 | 0.19 | 0.65 | 0.09 | −0.17 |
| Co | 0.85 | 0.26 | 0.30 | −0.01 | −0.04 |
| Ni | 0.67 | 0.39 | 0.18 | 0.19 | −0.08 |
| Zn | 0.07 | 0.81 | 0.00 | 0.13 | 0.10 |
| As | 0.65 | 0.62 | 0.00 | 0.03 | −0.13 |
| Se | −0.08 | 0.09 | −0.17 | −0.74 | −0.37 |
| Br | 0.20 | 0.63 | −0.14 | −0.45 | 0.11 |
| Rb | −0.12 | 0.41 | −0.55 | 0.17 | −0.26 |
| Sr | 0.58 | 0.22 | 0.48 | −0.03 | 0.35 |
| Mo | 0.36 | 0.17 | 0.70 | 0.29 | 0.13 |
| Cd | −0.09 | 0.09 | −0.16 | −0.82 | −0.01 |
| Sb | 0.36 | 0.55 | 0.48 | 0.10 | −0.13 |
| I | 0.28 | 0.58 | 0.39 | −0.33 | −0.05 |
| Cs | 0.47 | 0.36 | 0.09 | 0.24 | −0.33 |
| Ba | 0.61 | 0.59 | 0.05 | −0.13 | 0.17 |
| La | 0.95 | 0.18 | 0.12 | −0.06 | 0.10 |
| Ce | 0.96 | 0.13 | 0.11 | −0.04 | 0.06 |
| Nd | 0.83 | −0.08 | 0.19 | −0.05 | 0.12 |
| Sm | 0.96 | 0.09 | 0.10 | −0.10 | 0.07 |
| Tb | 0.97 | 0.10 | 0.15 | 0.00 | 0.07 |
| Tm | 0.89 | 0.14 | 0.05 | 0.12 | 0.08 |
| Hf | 0.91 | 0.12 | 0.13 | 0.03 | 0.15 |
| Ta | 0.96 | 0.09 | 0.14 | −0.01 | 0.05 |
| W | 0.45 | 0.02 | 0.27 | −0.62 | −0.08 |
| Au | −0.05 | −0.14 | 0.30 | 0.04 | 0.02 |
| Th | 0.96 | 0.11 | 0.17 | 0.03 | 0.05 |
| U | 0.87 | 0.21 | 0.32 | 0.05 | 0.07 |
| Expl.Var | 17.06 | 3.71 | 3.70 | 2.42 | 2.34 |
| Prp.Totl | 0.45 | 0.10 | 0.10 | 0.06 | 0.06 |
| No Contamination | Suspected | Slight | Moderate |
|---|---|---|---|
| Mn | As | Al | Sm |
| Cd | Cr | W | |
| Ni | Fe | U | |
| Sb | V | Tb | |
| Ba | Zn | Th | |
| Sr | Co | Sc | |
| Se | Mo | ||
| Ca | Ce | ||
| K | Na | ||
| Mg | Cs | ||
| Rb | Nd | ||
| Ba | Ti | ||
| Au | Cl |
| Igeo Class | Igeo Value | Classification |
|---|---|---|
| 0 | <0 | uncontaminated |
| 1 | 0–1 | uncontaminated to moderately contaminated |
| 2 | 1–2 | moderately contaminated |
| 3 | 2–3 | moderately to strongly contaminated |
| 4 | 3–4 | strongly contaminated |
| 5 | 4–5 | strongly to extremely contaminated |
| 6 | >5 | extremely contaminated |
| Uncontaminated | Uncontaminated to Moderately Contaminated | Moderately Contaminated |
|---|---|---|
| Ni | As | Al |
| Mn | Cd | Fe |
| Se | Cr | Ce |
| Ca | Sb | Sm |
| Rb | V | W |
| Au | Zn | U |
| Br | Ba | Nd |
| I | Sr | Tb |
| Co | Th | |
| Mo | Sc | |
| K | ||
| Mg | ||
| Na | ||
| Cs | ||
| Ba | ||
| Cl | ||
| Ti |
| EF < 1 | EF > 1 | |
|---|---|---|
| Mn | Sr | La |
| Rb | Zn | Hf |
| Se | Na | Fe |
| Au | Cs | Th |
| Ca | Co | Ta |
| Ni | Mo | Tb |
| Br | Tm | Sm |
| K | Ti | U |
| I | Cr | W |
| As | Cl | |
| Mg | V | |
| Ba | Nd | |
| Cd | Ce | |
| Sb | Al | |
Publisher’s Note: MDPI stays neutral with regard to jurisdictional claims in published maps and institutional affiliations. |
© 2020 by the authors. Licensee MDPI, Basel, Switzerland. This article is an open access article distributed under the terms and conditions of the Creative Commons Attribution (CC BY) license (http://creativecommons.org/licenses/by/4.0/).
Share and Cite
Svozilíková Krakovská, A.; Svozilík, V.; Zinicovscaia, I.; Vergel, K.; Jančík, P. Analysis of Spatial Data from Moss Biomonitoring in Czech–Polish Border. Atmosphere 2020, 11, 1237. https://doi.org/10.3390/atmos11111237
Svozilíková Krakovská A, Svozilík V, Zinicovscaia I, Vergel K, Jančík P. Analysis of Spatial Data from Moss Biomonitoring in Czech–Polish Border. Atmosphere. 2020; 11(11):1237. https://doi.org/10.3390/atmos11111237
Chicago/Turabian StyleSvozilíková Krakovská, Aneta, Vladislav Svozilík, Inga Zinicovscaia, Konstantin Vergel, and Petr Jančík. 2020. "Analysis of Spatial Data from Moss Biomonitoring in Czech–Polish Border" Atmosphere 11, no. 11: 1237. https://doi.org/10.3390/atmos11111237