Article

Evaluation of Six Satellite and Reanalysis Precipitation Products Using Gauge Observations over the Yellow River Basin, China

1
Zhuhai Branch of State Key Laboratory of Earth Surface Processes and Resource Ecology, Advanced Institute of Natural Sciences, Beijing Normal University at Zhuhai, Zhuhai 519087, China
2
State Key Laboratory of Earth Surface Processes and Resource Ecology, Faculty of Geographical Science, Beijing Normal University, Beijing 100875, China
3
Institute of Land Surface System and Sustainable Development, Faculty of Geographical Science, Beijing Normal University, Beijing 100875, China
*
Author to whom correspondence should be addressed.
Atmosphere 2020, 11(11), 1223; https://doi.org/10.3390/atmos11111223
Submission received: 18 September 2020 / Revised: 6 November 2020 / Accepted: 11 November 2020 / Published: 13 November 2020
(This article belongs to the Special Issue Satellite Precipitation Uncertainty)

Abstract

:
Satellite-based and reanalysis products are precipitation data sources with high potential, which may exhibit high uncertainties over areas with a complex climate and terrain. This study aimed to evaluate the accuracy of the latest versions of six precipitation products (i.e., Climate Hazards Group Infrared Precipitation with Stations (CHIRPS) V2.0, gauge-satellite blended (BLD) Climate Prediction Center Morphing technique (CMORPH) V1.0, European Centre for Medium-Range Weather Forecasts (ECMWF) Reanalysis (ERA) 5-Land, Integrated Multisatellite Retrievals for Global Precipitation Measurement (IMERG) V6 Final, Global Satellite Mapping of Precipitation (GSMaP) near-real-time product (NRT) V6, and Precipitation Estimation from Remotely Sensed Information using Artificial Neural Networks (PERSIANN)-CDR) over the Yellow River Basin, China. The daily precipitation amounts determined by these products were evaluated against gauge observations using continuous and categorical indices to reflect their quantitative accuracy and capability to detect rainfall events, respectively. The evaluation was first performed at different time scales (i.e., daily, monthly, and seasonal scales), and indices were then calculated at different precipitation grades and elevation levels. The results show that CMORPH outperforms the other products in terms of the quantitative accuracy and rainfall detection capability, while CHIRPS performs the worst. The mean absolute error (MAE), root mean square error (RMSE), probability of detection (POD), and equitable threat score (ETS) increase from northwest to southeast, which is similar to the spatial pattern of precipitation amount. The correlation coefficient (CC) exhibits a decreasing trend with increasing precipitation, and the mean error (ME), MAE, RMSE, POD and BIAS reveal an increasing trend. CHIRPS demonstrates the highest capability to detect no-rain events and the lowest capability to detect rain events, while ERA5 has the opposite performance. This study suggests that CMORPH is the most reliable among the six precipitation products over the Yellow River Basin considering both the quantitative accuracy and rainfall detection capability. ME, MAE, RMSE, POD (except for ERA5) and BIAS (except for ERA5) increase with the daily precipitation grade, and CC, RMSE, POD, false alarm ratio (FAR), BIAS, and ETS exhibit a negative correlation with elevation. The results of this study could be beneficial for both developers and users of satellite and reanalysis precipitation products in regions with a complex climate and terrain.

1. Introduction

Precipitation is an important variable related to climate change [1], hydrological cycle [2,3,4], soil-water-related processes (e.g., soil erosion and sedimentation) [5,6,7], protection against natural hazards (e.g., flooding and drought) [8,9], and human activities (e.g., agricultural activities, population distribution, urban heat island intensity, and human health) [4,10,11,12]. Precipitation information with a high accuracy and high spatial-temporal resolution is a prerequisite for a good understanding of these processes and phenomena. Hence, precipitation products based on satellite images and reanalysis have become the most promising data over meteorological gauged data and weather radar data [13,14,15,16].
In recent decades, a series of satellite-based and reanalysis precipitation products have been developed, such as the Tropical Rainfall Measuring Mission (TRMM) Multisatellite Precipitation Analysis (TMPA) [17] and its successor (Integrated Multisatellite Retrievals for Global Precipitation Measurement (IMERG)) [18], Climate Hazards Group Infrared Precipitation with Stations (CHIRPS) [19], Climate Prediction Center Morphing (CMORPH) [20], Global Satellite Mapping of Precipitation (GSMaP) [21], Precipitation Estimation from Remotely Sensed Information using Artificial Neural Networks (PERSIANN) [22], Global Precipitation Climatology Centre (GPCC) [23], European Centre for Medium-Range Weather Forecasts (ECMWF) Reanalysis (ERA) [24], and Climate Forecast System Reanalysis (CFSR) [25]. Due to differences in the gauge data, the raw satellite data from different types of sensors (e.g., passive microwave (PMW) or near-infrared ray (NIR) sensors) and the variations in algorithms used to generate the datasets, these products, with various spatial and temporal resolutions, exhibit discrepant performances according to previous evaluation studies worldwide [26,27,28,29]. A comparison of CHIRPS V2.0, PERSIANN-CDR, and TRMM 3B42 V7, for example, reveals that CHIRPS performs best in South America and tropical Africa, CHIRPS and TRMM have comparable performance in southeast Asia, and that PERSIANN-CDR is not recommended in tropical forest areas [30]. TRMM, CMORPH, PERSIANN and ECMWF all underestimate rainfall over northwest Europe, and ECMWF performs well in winter and performs poorly in summer, while the other products have the opposite performance [31]. IMERG V05 Early run outperforms ERA5-HRES (high resolution) in regions dominated by convective storms, while the opposite was observed in regions with complex terrain [32].
However, regions with complex terrain have exhibited poor performance because of the high spatial and temporal variability in precipitation and the lack of rain gauge observations [33,34]. The bias of the real-time version of TMPA (TMPA-RT) and PERSIANN over the Tibetan Plateau depends on topography, and can be explained mostly by the variability of elevation and surface roughness [35]. The IMERG and GSMaP products attain a good detection ability in southern China, except for the Sichuan Basin, where the topography and climate types are extremely complex [36]. Therefore, it is important to evaluate precipitation products before specific applications, especially in regions with a complex topography [37,38].
As the origin of Chinese civilization and an important area of economic development and ecological protection, the Yellow River originates in the Tibetan Plateau and flows across plateaus, mountains, and plains, with the Yellow River Basin covering arid, semi-arid, semi-humid and humid climate zones. The complex terrain and climate over the basin result in unevenly (spatially and temporally) distributed precipitation. In recent decades, the Yellow River Basin has experienced a decreasing annual precipitation and an increasing frequency and amount of short-duration consecutive precipitation events, which could aggravate water resource shortages and lead to higher risks of flooding in summer and drought in spring and autumn, especially in the middle reaches [39]. Thus, choosing an accurate precipitation dataset is vital for related studies in this basin.
To date, evaluation studies of precipitation products over the Yellow River Basin have been performed over mainland China [40,41,42,43], the whole basin [44,45], or subregions of the basin [37,46,47], and have mainly focused on earlier versions of precipitation products [43,48]. However, various precipitation products have been updated (e.g., IMERG V6 morphs microwave estimates to decrease the gaps at high latitudes and incorporates SAPHIR estimates, CMORPH V1.0 extends the data period, updates the estimation algorithm, and combines gauge data with satellite data). Hence, a comparative evaluation of the latest precipitation products is necessary before specific applications.
The aims of this study are: (1) to evaluate the accuracy of the latest versions of six widely applied daily precipitation products (i.e., IMERG, CHIRPS, CMORPH, ERA5, GSMaP, and PERSIANN) at multiple temporal scales, and (2) to analyze the accuracy at different precipitation grades and elevation levels.

2. Materials and Methods

2.1. Study Area

The Yellow River, with a length of 5464 km and a drainage area of 75.2 × 10⁴ km2, is the second longest river in China and the sixth longest river globally [49]. The landforms over the basin vary, including plateaus, mountains, and plains. The climate in this basin is mainly arid and semi-arid continental monsoon, and the basin thus covers arid, semi-arid, semi-humid and humid climate zones. The average annual precipitation is between 123 and 1021 mm [50] and is distributed unevenly in both the spatial and temporal domains. The amount of rainfall increases from the northwest to the southeast, with most rainfall occurring between May and October [51]. The average annual temperature ranges from −4 to 14 °C across the basin [50]. The runoff from the upper reaches accounts for half of the total runoff discharge of the entire Yellow River, and the middle reaches are the main source of sediment [52,53]. The farmland in this basin accounts for approximately 15% of the cropland and 14% of the GDP of China [54].

2.2. Dataset

2.2.1. Gauged Precipitation Data

Daily gauged precipitation data were extracted from the Dataset of Daily Climate Data from the Chinese Surface Stations for Global Exchange (V3.0) of the China Meteorological Data Service Center (CMDC) (http://data.cma.cn). This dataset includes daily precipitation data from 840 Chinese surface stations since 1951. There are 95 stations within the Yellow River Basin, which are not evenly distributed, especially in the lower reaches and the source region (Figure 1).

2.2.2. Satellite-Based and Reanalysis Precipitation Products

Six satellite-based and reanalysis precipitation products were selected to be evaluated in this study, with the basic information of these datasets listed in Table 1. Because of the data accessibility, the daily precipitation from 2001 to 2018 was chosen to be assessed. To mask a comparison, the spatial and temporal resolutions of products were unified as 0.05° and daily scale, respectively. A nearest neighbor interpolation method was adopted and the spatial resolution of 0.05° is the same as CHIRPS, to prevent missing information and resulting in no changing values of the other products.
CMORPH was created based on PMW and half-hour interval infrared (IR) data. Version 1.0 includes raw (satellite-only precipitation estimates), bias-corrected (CRT) and gauge-satellite blended (BLD) precipitation products. A bias correction was first performed on the raw satellite-based precipitation estimates by matching their probability density function (PDF) with that of the gauge observations, resulting in the CRT dataset, and then the CRT was modified by combining it with gauge data through an optimal interpolation (OI) technique to generate the BLD version [55,59]. The BLD version (hereafter referred to as CMORPH) was evaluated in this study because previous evaluation studies demonstrated that BLD outperforms the raw version in the Lake Titicaca region, South America [60], and performs better than CRT in the Huaihe and Fujiang River Basins, China [61,62,63].
PERSIANN-CDR is a daily precipitation product with a spatial resolution of 0.25° and is generated by the Center for Hydrometeorology and Remote Sensing at the University of California. The 3 h GridSat-B1 infrared window (IRWIN) brightness–temperature data from Geostationary Earth orbiting (GEO) satellites are the input data of the PERSIANN model to yield a primary dataset, and the monthly Global Precipitation Climatology Project (GPCP) version 2.2 was adopted to correct the bias of this dataset [56].
GPM IMERG is an extension of TRMM, with an improved capability to measure light rainfall and snowfall at middle and high latitudes. Version 6 is the current version of the dataset, and it provides three types of products: early, late and final runs [57]. The IMERG final run (hereafter referred to as IMERG) is selected to be evaluated in this study because the latest final version performs the best over complex terrain regions such as the Sichuan Basin of China [64], similar to earlier final versions across China [29,65].
ERA5 is the atmospheric reanalysis dataset for the global climate by the ECMWF. ERA5-Land is the land component of the ERA5 climate reanalysis dataset and contains a series of improvements (e.g., higher spatial resolution), making it more suitable for all types of land applications, e.g., evaporation, precipitation, and runoff [58]. Total precipitation data (hereafter referred to as ERA5) at an hourly resolution are resampled to a daily scale to be evaluated in this study.
GSMaP is a collection of hourly global rainfall maps provided by the Japan Aerospace Exploration Agency (JAXA, Tokyo, Japan). Precipitation data are obtained using PMW sensors in low-Earth orbit and IR radiometers in geostationary Earth orbit [21]. GSMaP is mainly composed of four products, i.e., standard product (GSMaP-MVK), near-real-time product (GSMaP-NRT), real-time product (GSMaP_NOW), and reanalysis product (GSMaP_RNL), and each product has an additional gauge-adjusted version. The gauge-adjusted GSMaP-NRT product version 6 (hereafter referred to as GSMaP) is selected to be evaluated in this study.
CHIRPS was primarily developed for agricultural drought monitoring by scientists at the Climate Hazards Group, University of California, Santa Barbara, and the USGS Famine Early Warning Systems Network (FEWS NET). The dataset is quasi-global, with a high spatial resolution of 0.05° and a long data period (1981 to the near present). The dataset is available at multiple temporal resolutions, i.e., 6 h, daily, pentadal, and monthly resolutions. In the data generation process, the TMPA 3B42 V7 satellite precipitation product and IR cold cloud duration (CCD) observations are used for calibration, and GPCC monthly product and independent stations are employed to perform the validation. The dataset of version 2.0 [19] (hereafter referred to as CHIRPS) is evaluated in this study.

2.2.3. Digital Elevation Model Data

The ASTER GDEM V2 dataset with a resolution of 1 arc-second (~30 m) was downloaded from the Geospatial Data Cloud site, Computer Network Information Center, Chinese Academy of Sciences (http://www.gscloud.cn).

2.3. Evaluation Indices

Daily precipitation values of the above precipitation products at the pixels where gauge stations are located were extracted for comparison against gauge data in this study, and four continuous and four categorical indices were selected to quantify the performances of the products (Table 2). The four continuous indices (i.e., correlation coefficient (CC), mean error (ME), mean absolute error (MAE), and root mean square error (RMSE)) measure the quantitative accuracy of the precipitation products, and the four categorical indices (i.e., probability of detection (POD), false alarm ratio (FAR), BIAS, and equitable threat score (ETS)) reflect the capability of the products to detect rainfall events. CC represents the correlation between the observed and estimated precipitation. ME measures the average difference between the observed and estimated rainfall, where a negative ME indicates rainfall underestimation by the product, and a positive ME indicates rainfall overestimation. Both MAE and RMSE denote the magnitude of the difference between the observed and estimated rainfall, and RMSE assigns higher weights to large errors. POD measures the ratio of the satellite-detected rain events to the observed rain events. FAR determines the ratio of detected rain events but no observed rain to all detected rain events. A high POD indicates that the product exhibits a good capability to correctly detect rain events, and a low FAR indicates that the product attains a low possibility of incorrectly detecting no-rain events as rain events. The BIAS is the ratio of the estimated rain frequency to the observed rain frequency. If the BIAS is lower than 1, the number of satellite-detected rain events is smaller than the observed number of rain events. ETS is a more comprehensive index to assess the capability of satellites to detect rainfall events. An ETS value of 1 implies that the satellite detects all observed rain events without any misses or false detection results, and an ETS value of −1/3 implies that the satellite incorrectly detects all rain events as no-rain and detects all no-rain events as rain events. Both types of indices should be considered to determine the performance of a given precipitation product. A reliable product should attain both a high quantitative accuracy and rainfall detection capability. The rainfall threshold is set to 0 with regard to the daily precipitation, and 0.1 mm/day with respect to light rainfall.

2.4. Evaluation Experimental Design

The evaluation of the above precipitation products was conducted in terms of the daily rainfall at the daily, monthly, and seasonal scales. First, the indices were calculated across all stations to obtain the overall accuracy of each precipitation product over the Yellow River Basin, after which the indices at each station were calculated to better understand their spatial patterns.
In addition, to obtain a better understanding of the performance of the products at various precipitation intensities and elevations, the evaluation indices were calculated in this study at different daily precipitation grades (i.e., 0 mm, 0–0.1 mm, 0.1–1 mm, 1–2 mm, 2–5 mm, 5–10 mm, 10–20 mm, 20–40 mm, and more than 40 mm) and elevation levels (i.e., 0–500 m, 500–1000 m, …, 4500–5000 m). The classification of precipitation grades referred to the evaluation of precipitation products across the globe and mainland China by Chen et al. (2020) [66]. The elevation levels were divided into equal intervals of 500 m according to previous studies in China [36], the Awash River basin of Ethiopia [67], and the distribution of gauge stations with elevation in the study area.

3. Results and Discussion

3.1. Basic Statistics and Distribution of the Daily Precipitation

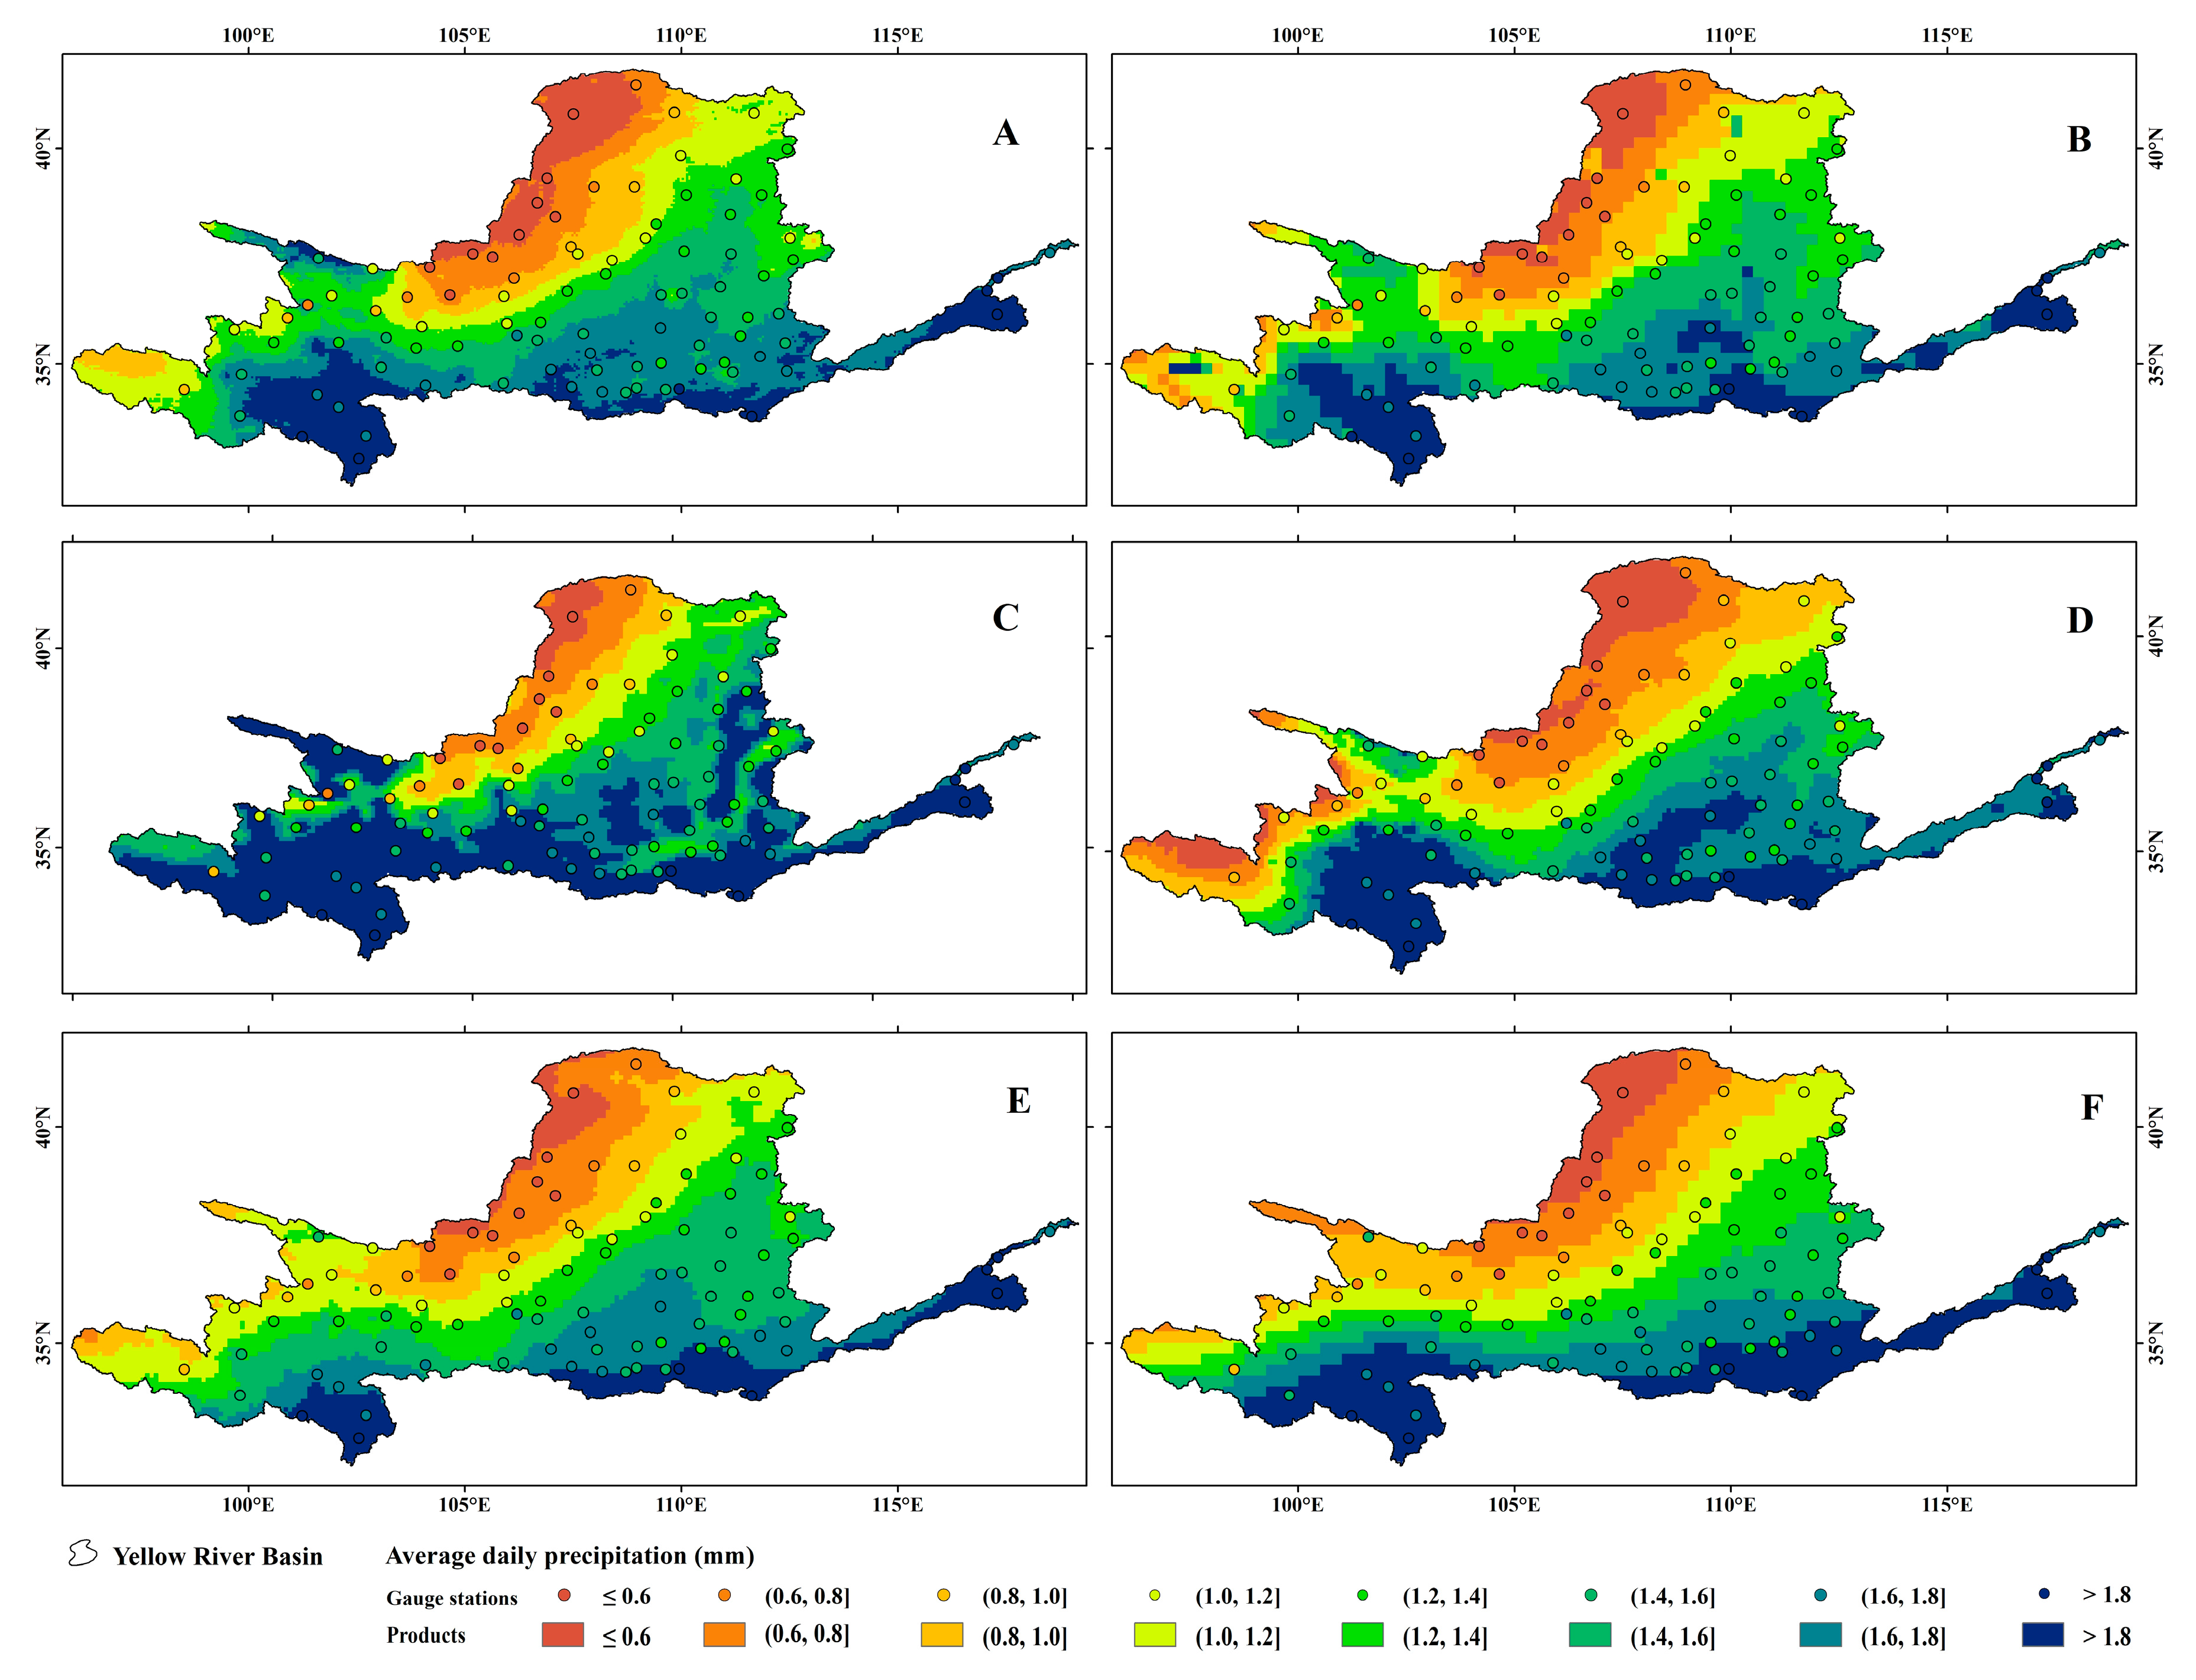
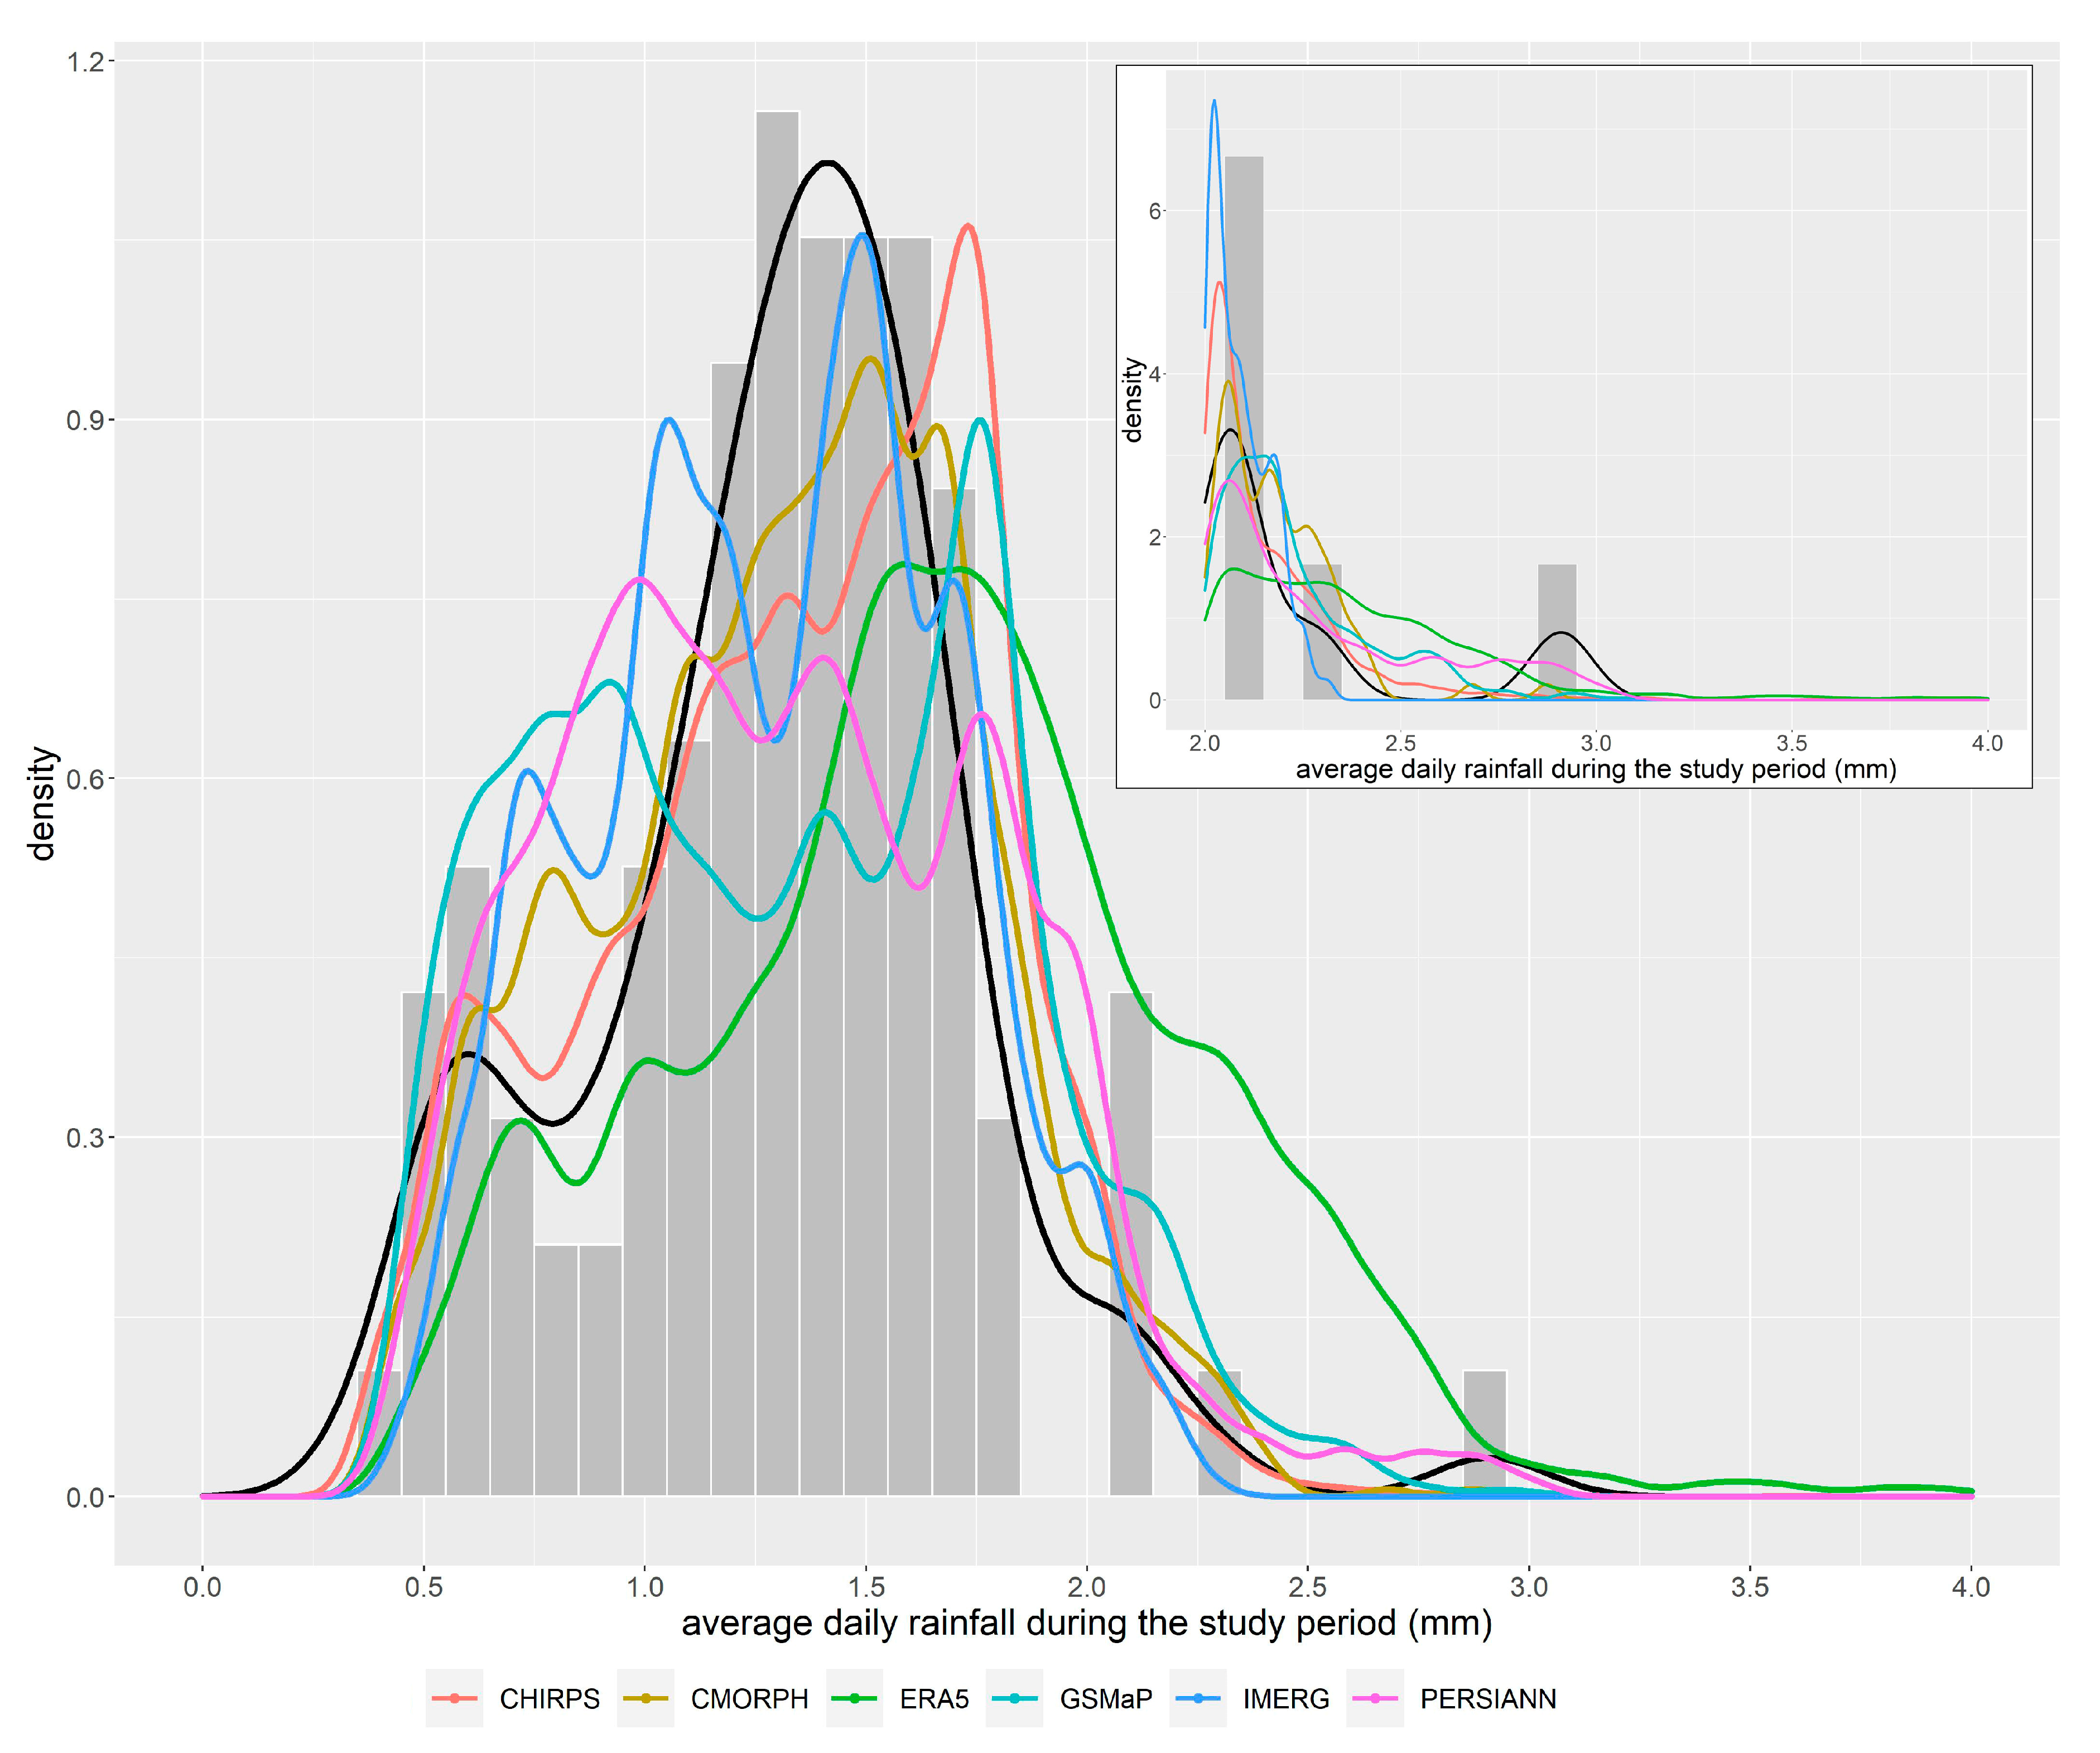
The average daily precipitation during the study period was calculated for each gauge station and each pixel of the six products. Table 4 lists their statistics, Figure 2 shows their spatial distributions, while Figure 3 depicts the histogram and density curve of the average daily precipitation recorded by the gauge stations during the study period and the density curves of the average daily precipitation over the whole basin for the products. The statistics in Table 4 indicate that ERA5 yields the highest average daily precipitation over the Yellow River Basin (with a mean of 1.66 mm), followed by CHIRPS (with a mean of 1.35 mm), CMORPH (with a mean of 1.33 mm), GSMaP and PERSIANN (with a mean of 1.33 mm), and IMERG (with a mean of 1.30 mm). With regard to the range and deviation of the average daily precipitation, IMERG attains the narrowest range (0.41–2.33 mm), while ERA5 exhibits the widest range (0.41–4.16 mm), and the range of PERSIANN (0.38–3.02 mm) is close to that of the gauge stations (0.38–2.91 mm). IMERG exhibits the smallest standard deviation (0.40 mm), and ERA5 attains the largest standard deviation (0.58 mm), while the standard deviation of CMORPH (0.43 mm) is close to that of the gauge stations (0.43 mm). The shapes of the density curve of the average daily precipitation in Figure 3 reveal that the CHIRPS’s and CMORPH’s density curves are more similar to that of the gauge stations than those of the other products, and the average daily precipitation of ERA5 is obviously more concentrated at precipitation intervals larger than 1.5 mm, which might lead to precipitation overestimation.
The spatial patterns of the average daily precipitation based on the precipitation products are similar throughout the study period, and they are consistent with those based on the gauge stations (Figure 2). The average daily precipitation gradually increases from the northwest to the southeast. High daily precipitation mainly occurs in the lower reaches and the southern source region, and low precipitation occurs in the upper reaches in the northwestern areas. The average daily precipitation values of ERA5 are higher than those of the other products in the west of the source region and middle reaches.

3.2. Evaluation of the Precipitation Products at the Different Time Scales

3.2.1. Evaluation at the Daily Scale

With regard to the continuous indices, CMORPH performs the best, with the lowest MAE and RMSE, a high CC and low ME, followed by ERA5 and IMERG, while CHIRPS performs the worst, with the lowest CC and the highest MAE and RMSE (Table 5). Compared to the observed data, all products yield an overestimation, and ERA5 has the greatest overestimation (Table 5). In terms of the categorical indices, ERA5 yields the highest POD and FAR, a BIAS much higher than 1, and the lowest ETS, because it correctly detects the most rain events (30.15% of the total daily records), falsely detects the most no-rain events as rain (63.52% of the total daily records), with the number of falsely detected rain events much larger than that of the events where rain is missed (0.32% of the total daily records) (i.e., f is much larger than m, as indicated in Table 2) (Figure S3), resulting in a low ETS. CHIRPS yields the lowest POD and a BIAS much lower than 1, because it correctly detects the least rain (8.34% of the total daily records), and the number of falsely detected rain events (9.78% of the total daily records) is much smaller than that of the events whereby rain is missed (22.13% of the total daily records) (i.e., f is much smaller than m, as indicated in Table 2). Additionally, it correctly detects the most no-rain events (59.75% of the total daily records). CMORPH and GSMaP exhibit the lowest FAR, high PODs (0.72 and 0.58, respectively), and BIASs close or equal to 1 (1.24 and 1, respectively), thus resulting in the highest ETSs. IMERG and PERSIANN perform a moderate rainfall detection capability. IMERG and PERSIANN falsely detect more no-rain events as rain events than they miss rain events, resulting in a BIAS higher than 1 (Figure S3). Therefore, POD, FAR and ETS of ERA5 reveal conflicts with regard to the reliability of the products, while CMORPH yields a POD lower than ERA5, the highest FAR, a BIAS close to 1, and the highest ETS, revealing that it performs the best. Among the six products, CMORPH attains the best quantitative accuracy and rainfall detection capability, and it is the most reliable product to select in the Yellow River Basin.
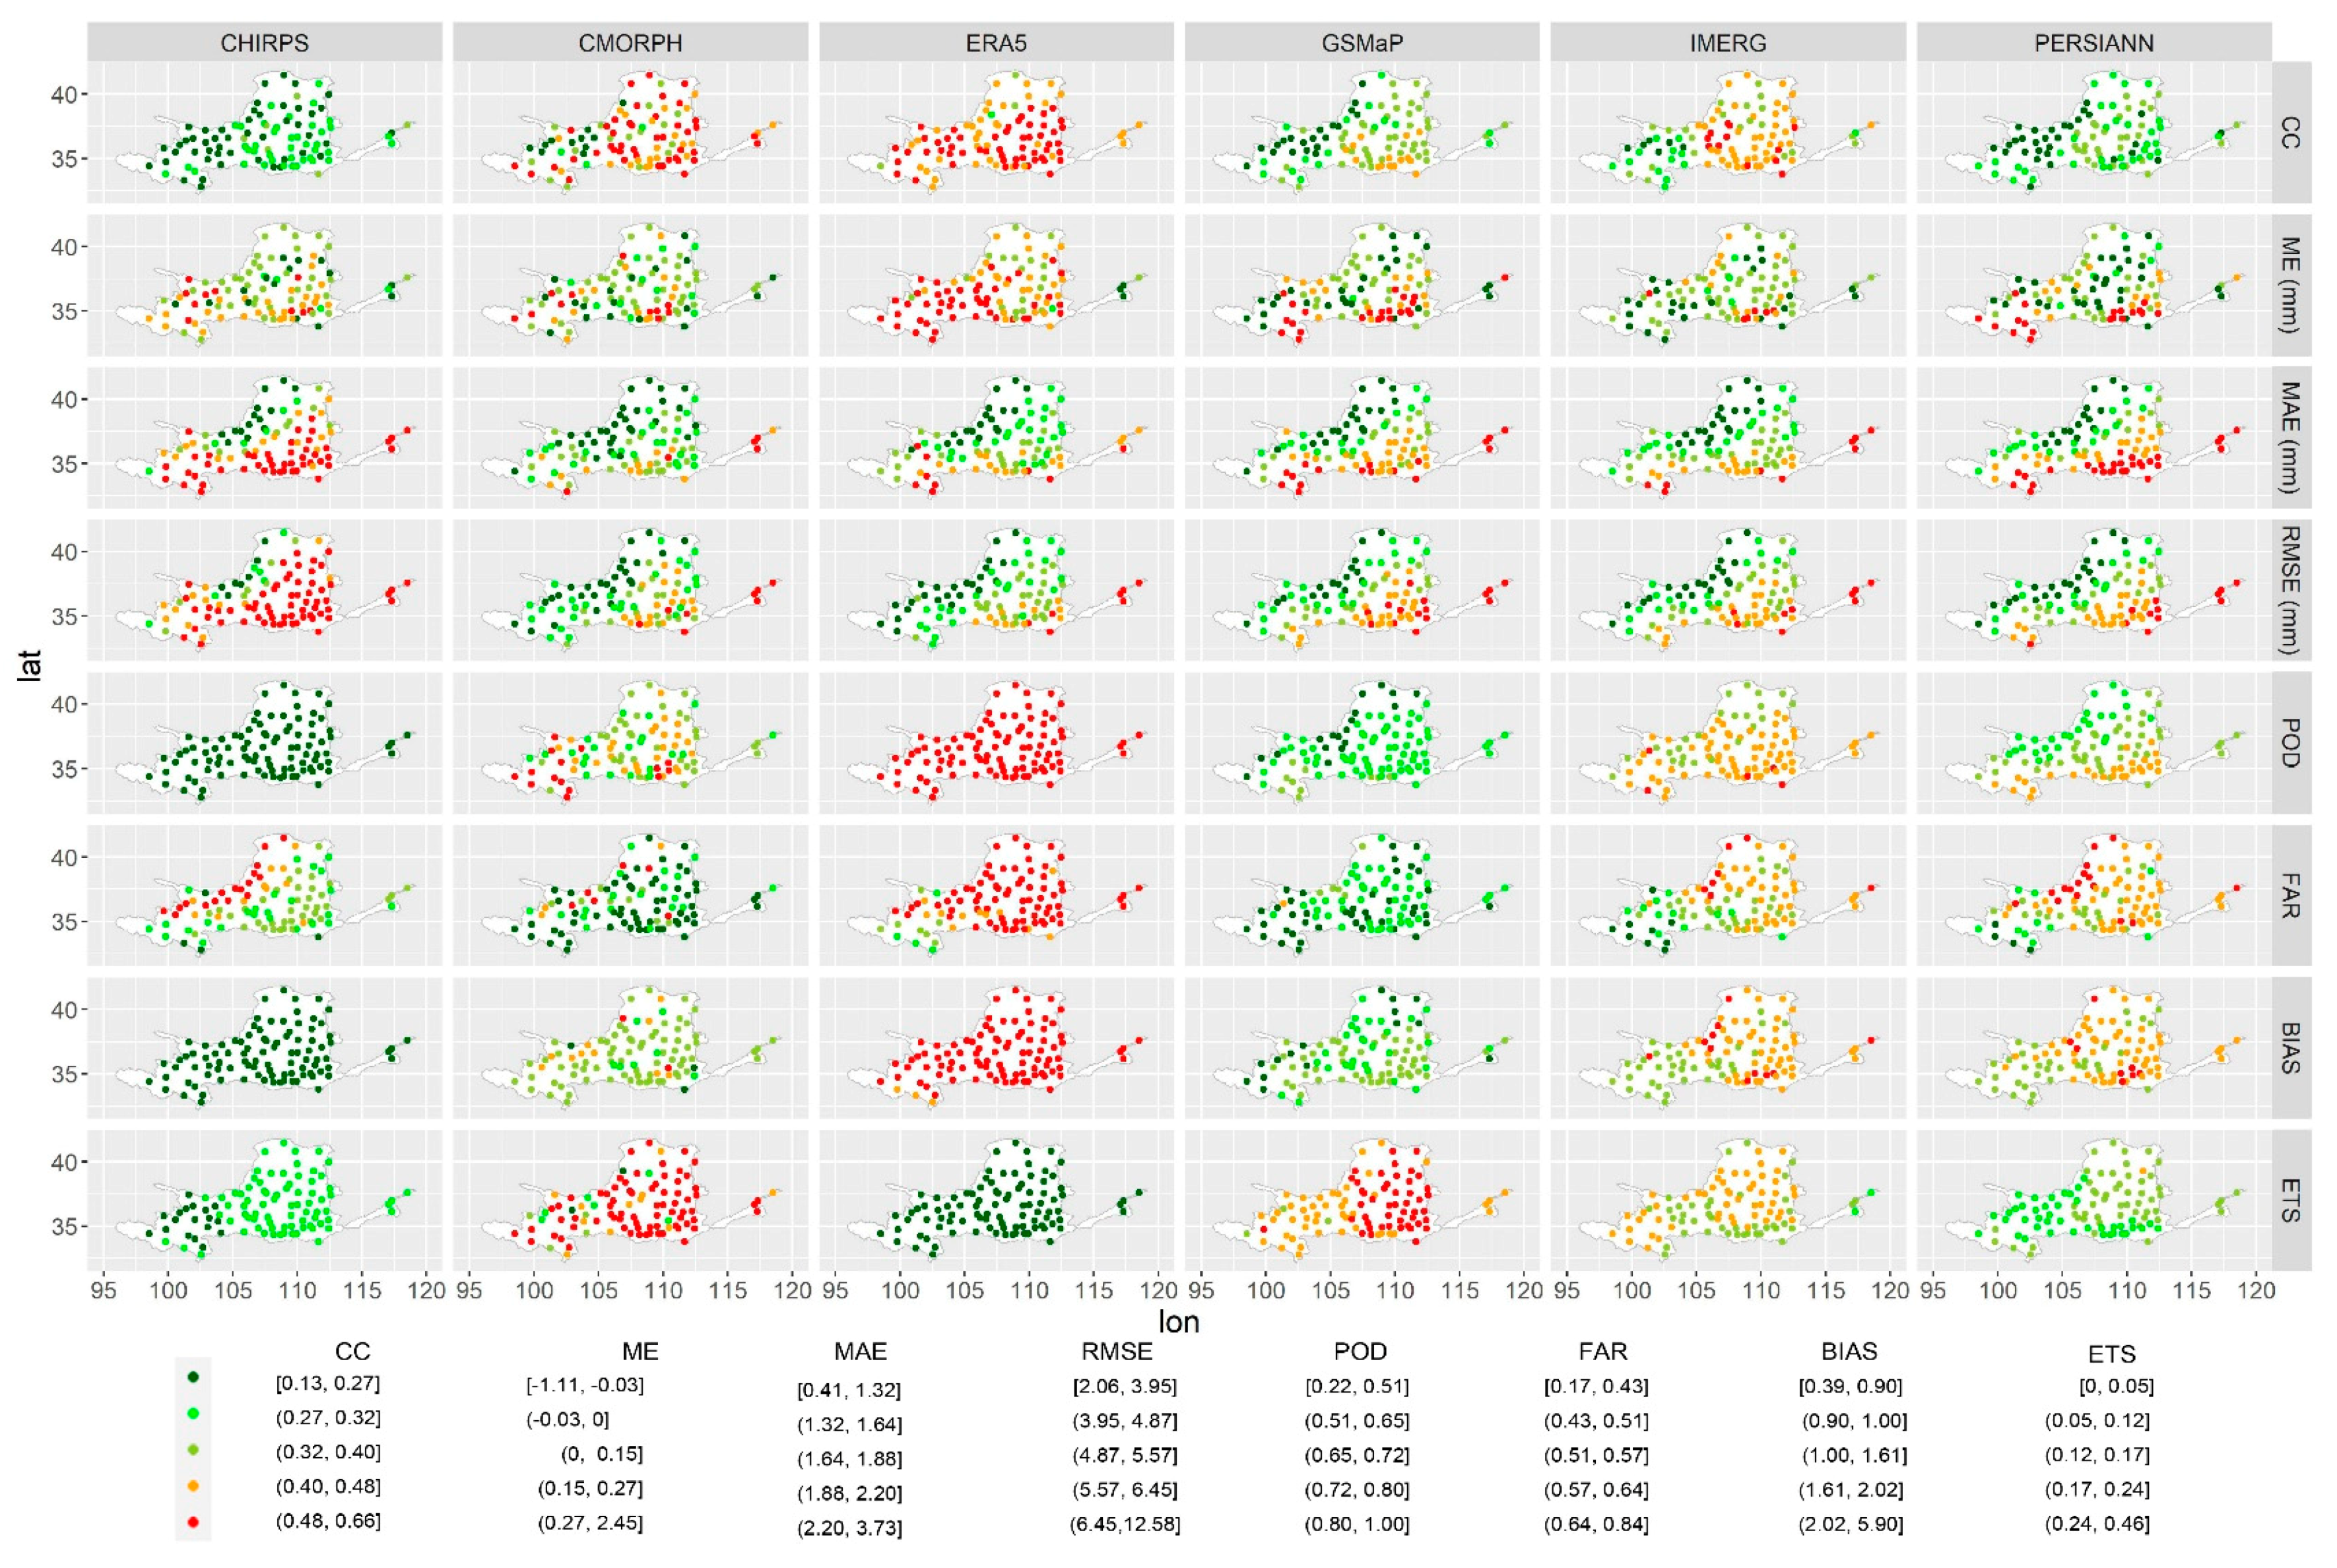
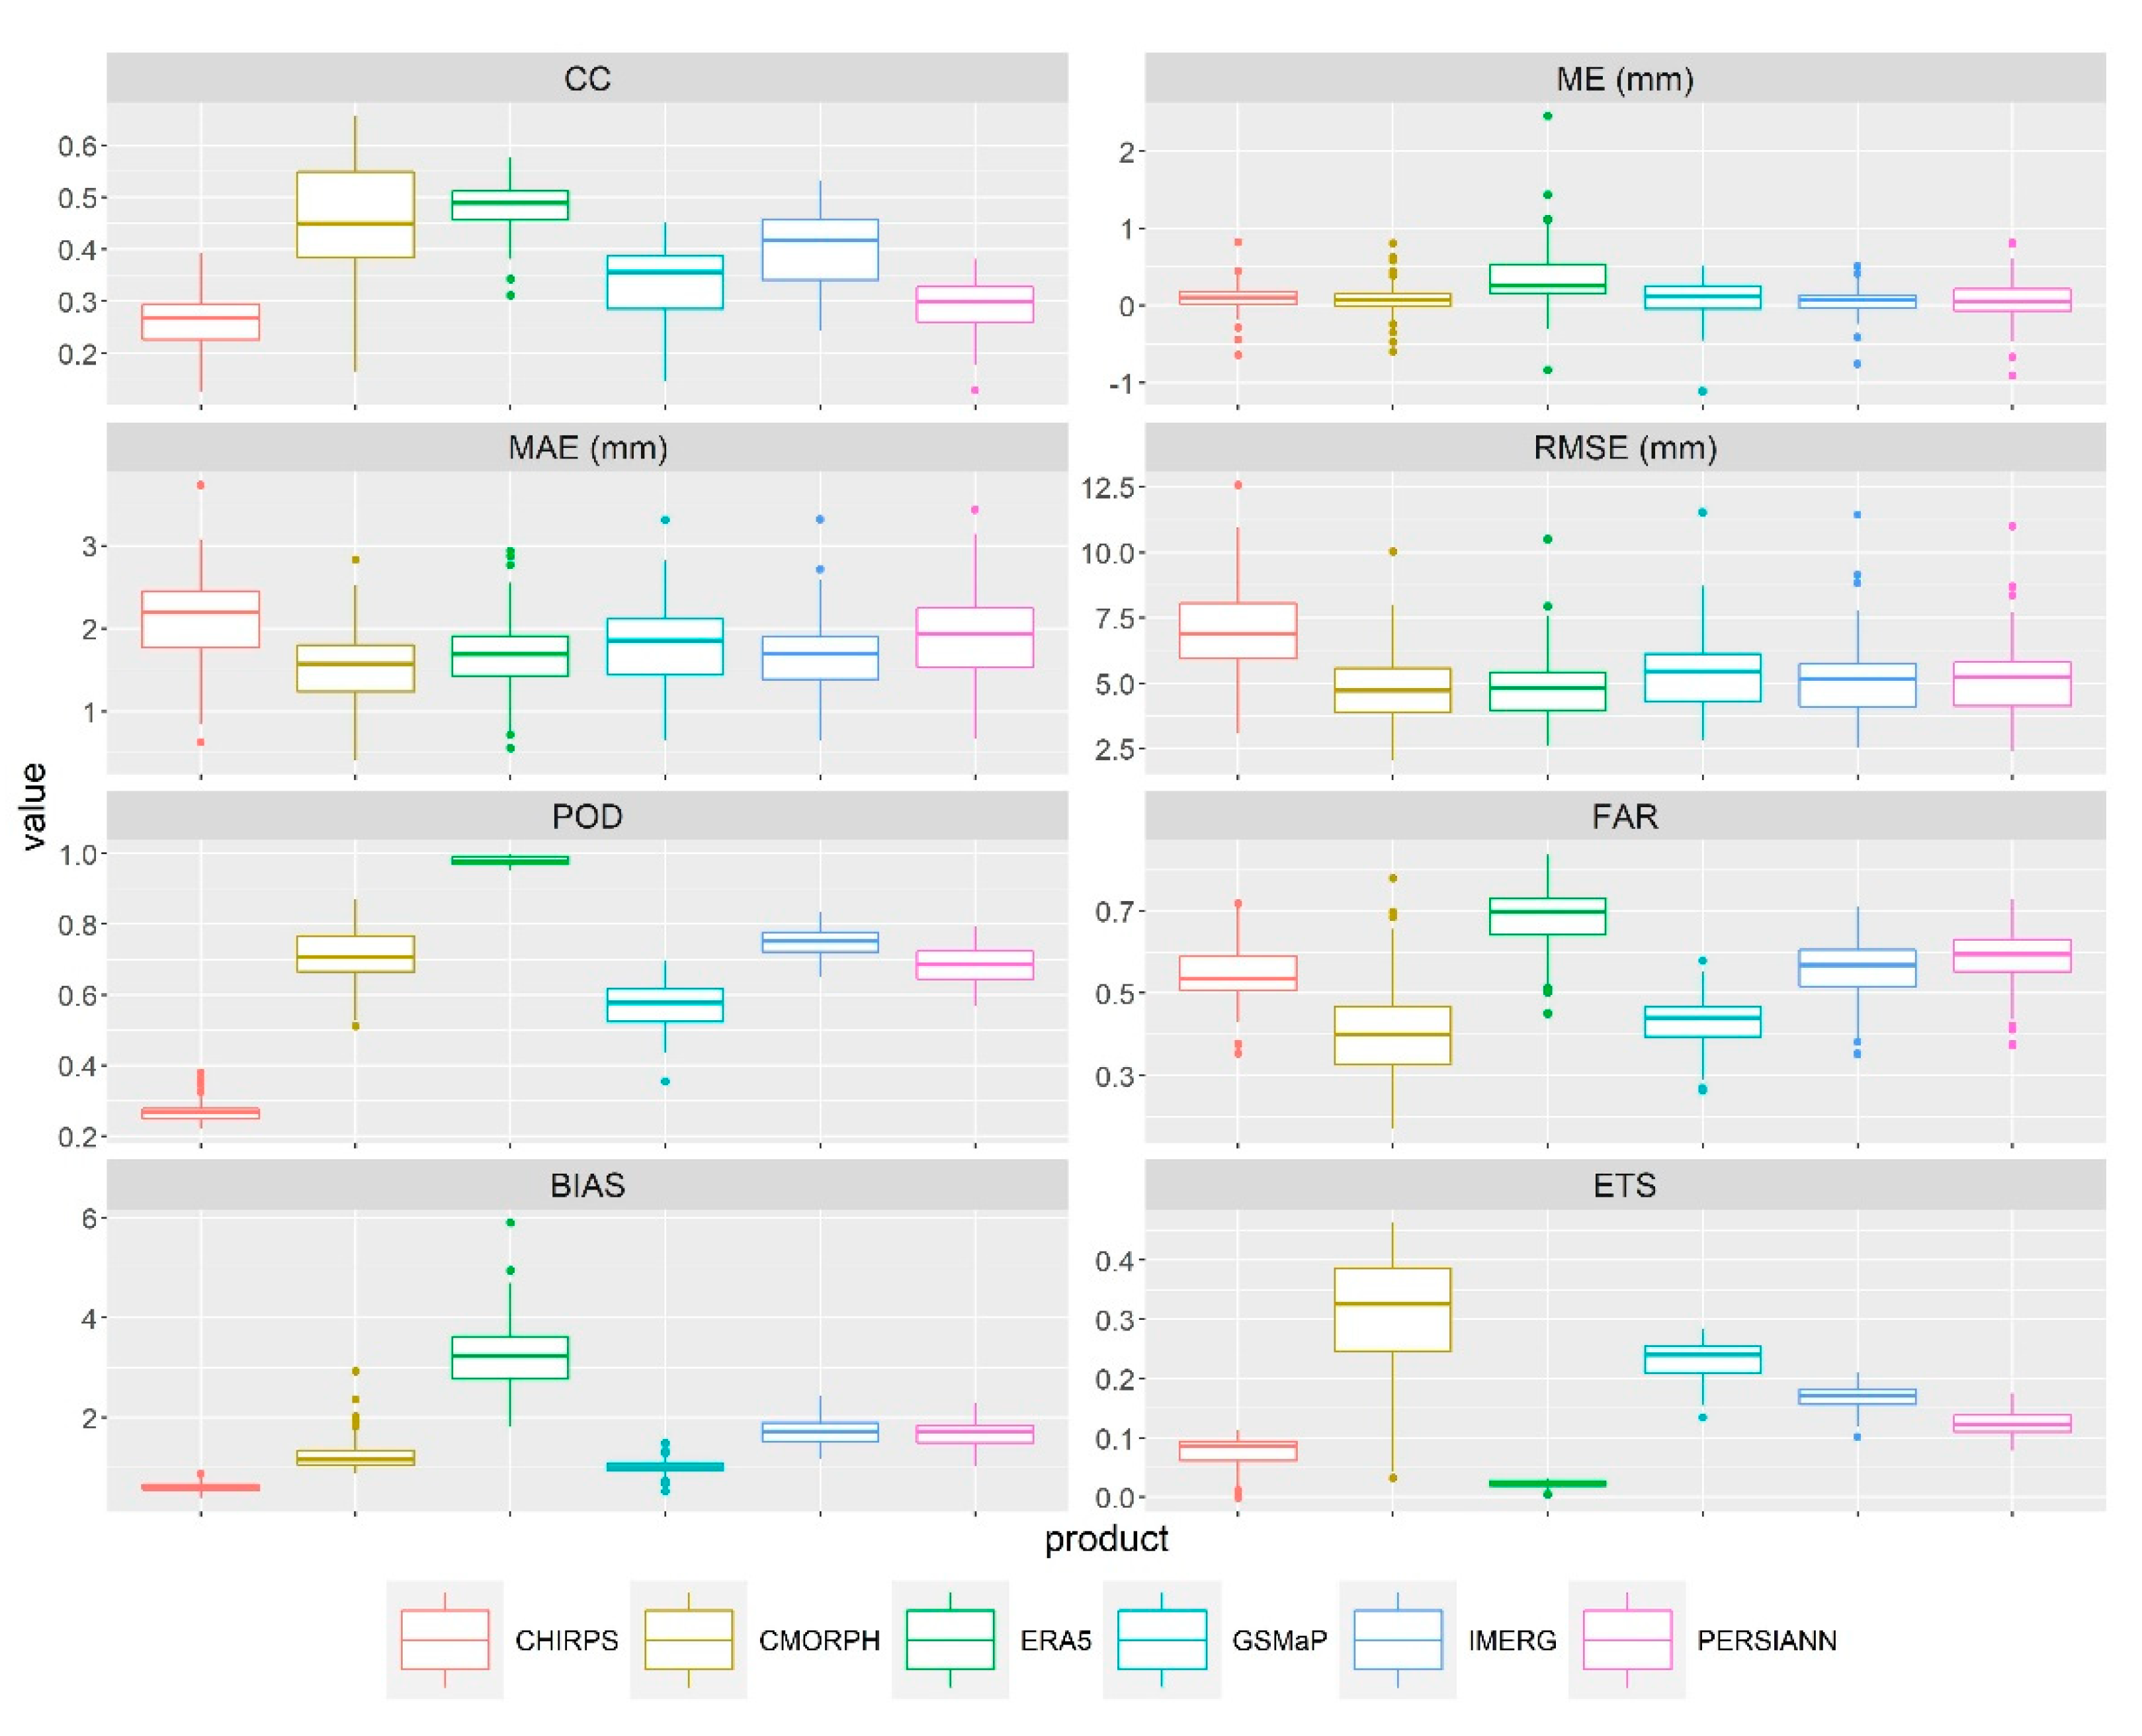
Figure 4 shows the spatial distribution of the evaluation indices at the gauge stations over the Yellow River Basin, and Figure 5 shows boxplots of these indices. High CCs are mainly located in the middle reaches, and low CCs occur in the upper reaches. MAE, RMSE, POD, and ETS increase from northwest to southeast, which is consistent with the pattern of the daily precipitation. High FARs mainly occur in the upper reaches, and low FARs are observed in the source region and southern middle reaches, which indicates that incorrect rainfall detection occurs more severely in arid areas than in humid areas. Across the basin, CMORPH attains the highest quantitative accuracy (with the lowest MAEs and RMSEs, high CCs and low MEs) and highest rainfall detection capability (with the highest ETSs, high PODs, low FARs and BIASs close to 1). Hence, CMORPH is considered to be the most reliable product in this basin (Figure 5).
Compared to previous studies, the RMSEs, FARs, PODs and BIASs of CHIRPS and IMERG in this study are close to those reported by Yu (2020) [40] in the Yellow River Basin, but the CCs are lower in this study, probably because different study periods (2015–2018 in Yu and 2001–2018 in this study) were selected, which may cause a difference between the gauge observations when evaluating the products. GSMaP slightly overestimates the daily precipitation in the lower reaches of the Yellow River Basin, which is similar to the results of Ning et al. (2017) [28]. PERSIANN underestimated the rainfall amount across the Wei River Basin (a subregion in the southern middle reaches of the Yellow River Basin) in a previous study, which is consistent with the spatial pattern of ME in this study [47]. CMORPH has the best capability for detecting rainfall, with high PODs and low FARs in this basin, similar to the results in the Huaihe River Basin, which is due to the application of PDF–OI algorithms in the dataset generation process [61,68]. The POD and FAR of CMORPH and GSMaP increase from the northwest to the southeast, which is similar to the result reported by Yang et al. (2020) [44].

3.2.2. Evaluation at Monthly and Seasonal Scales

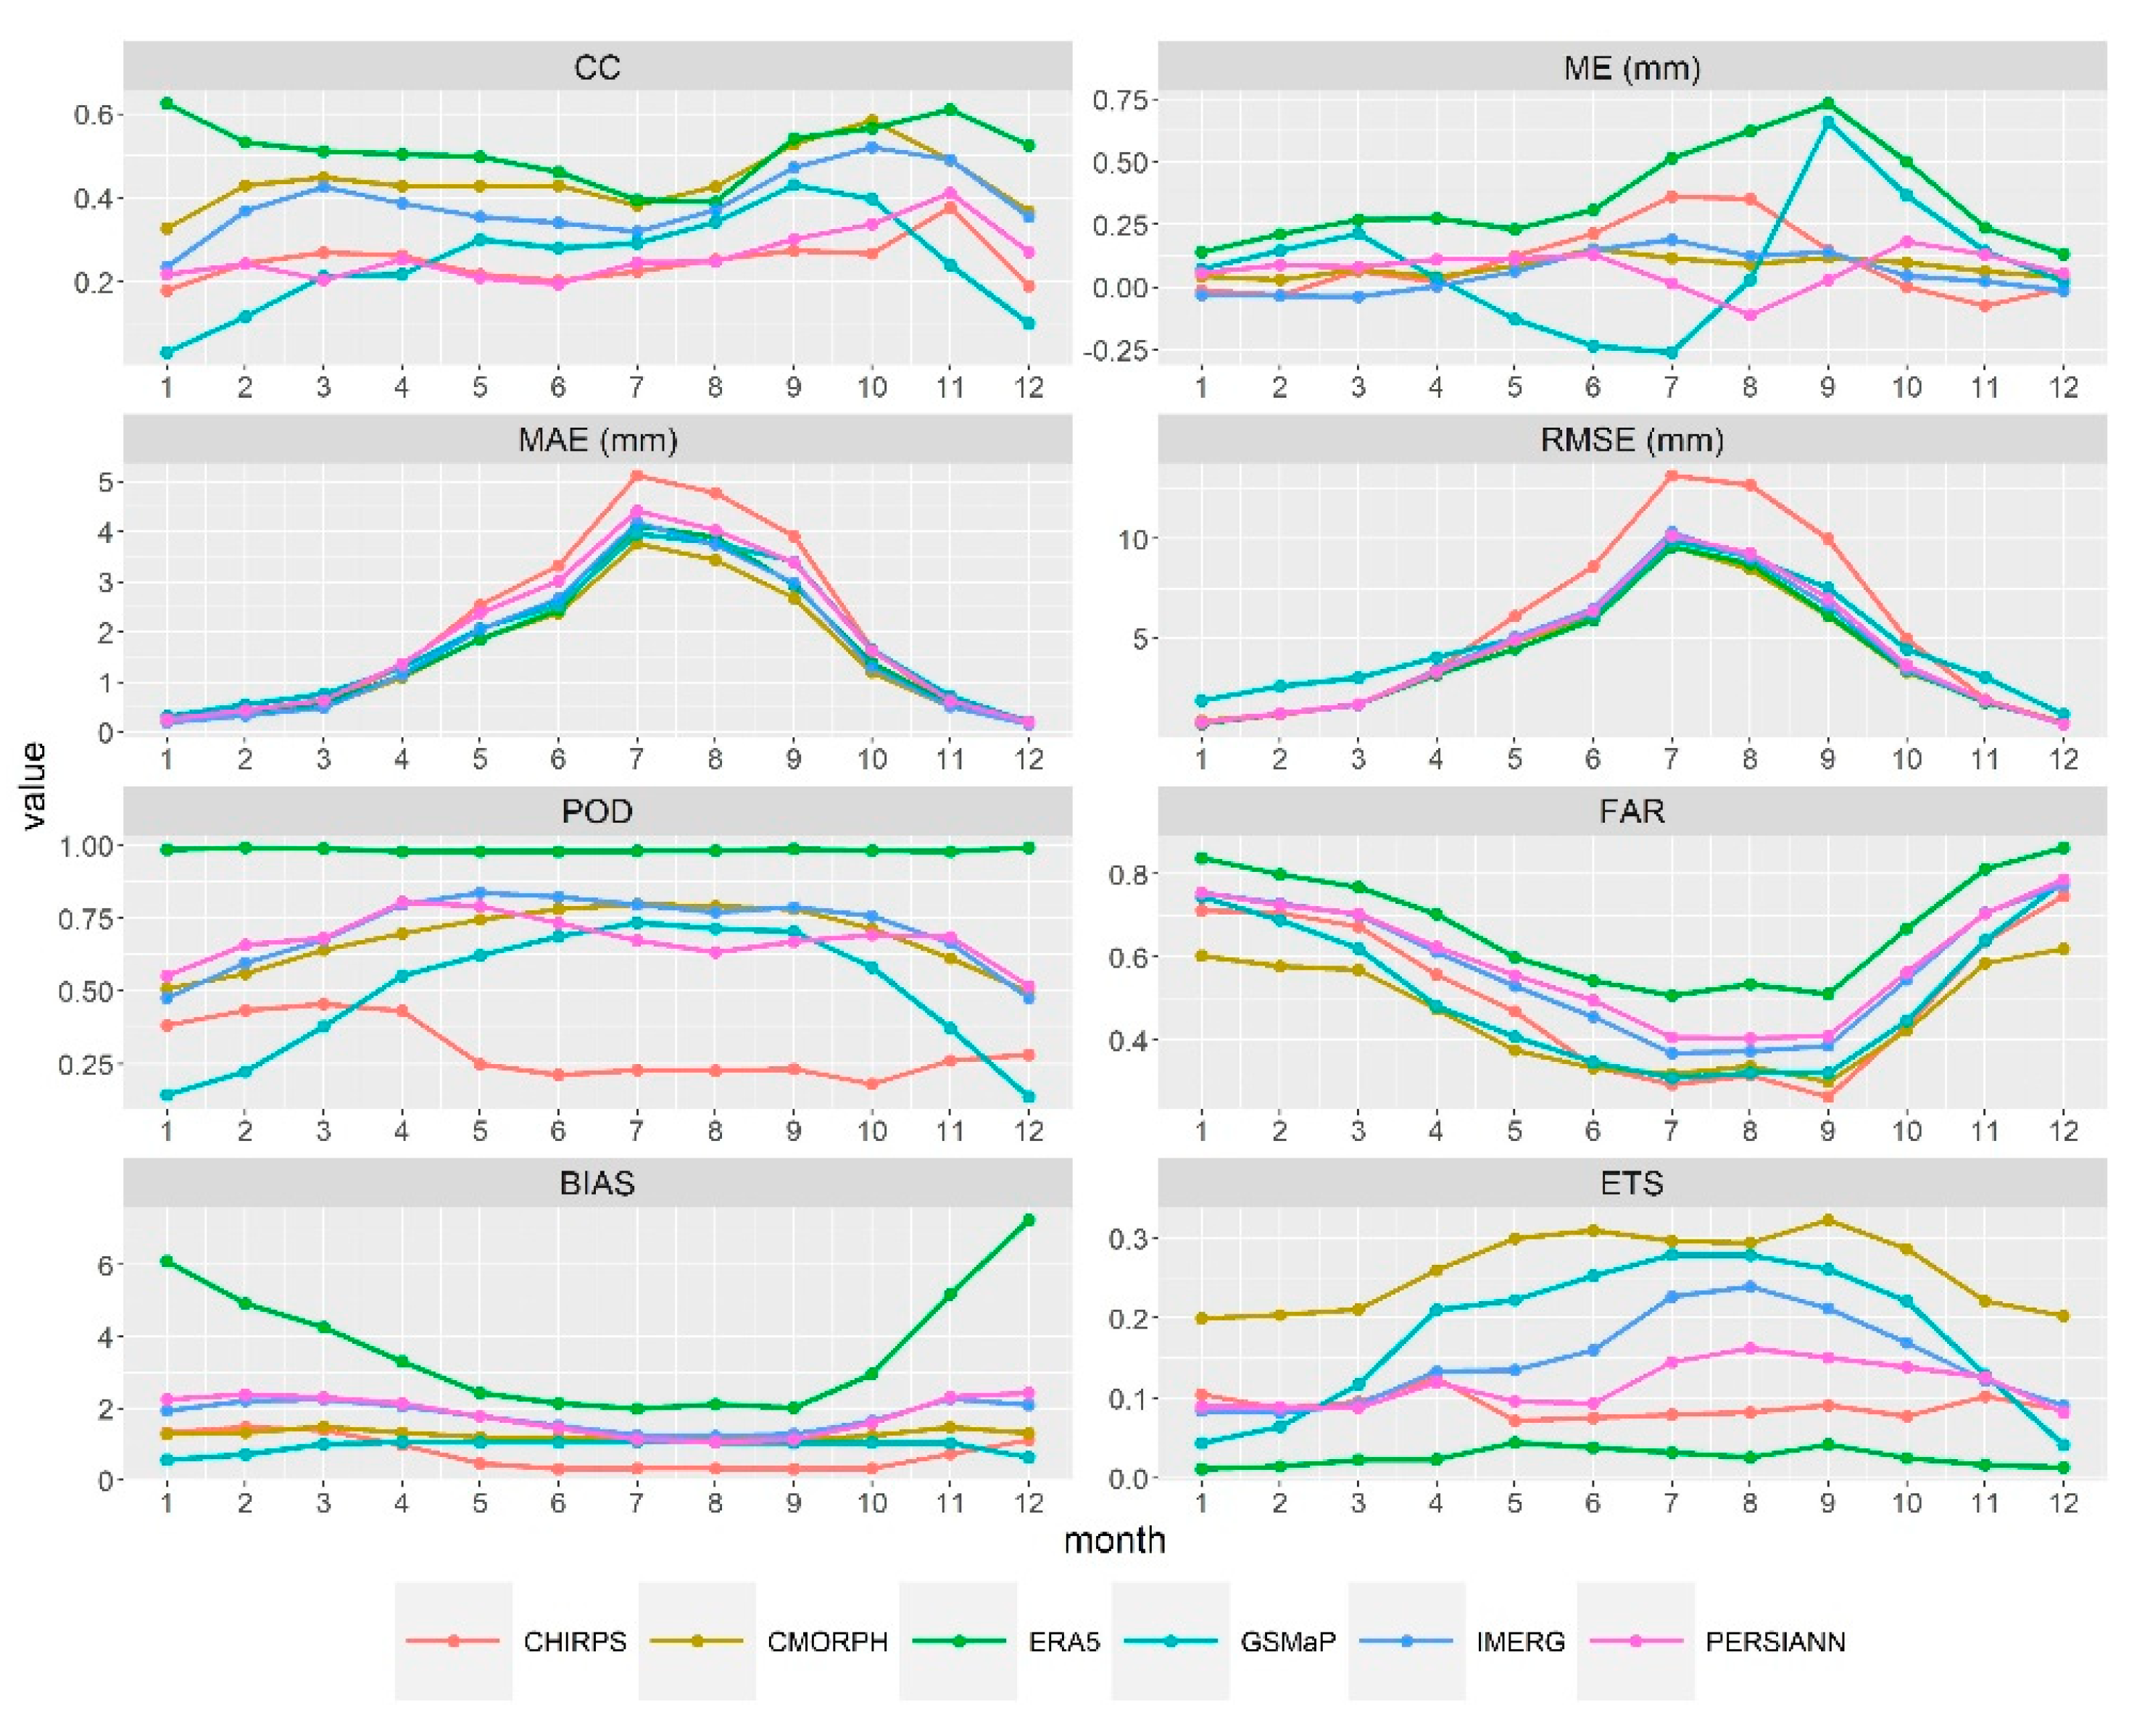
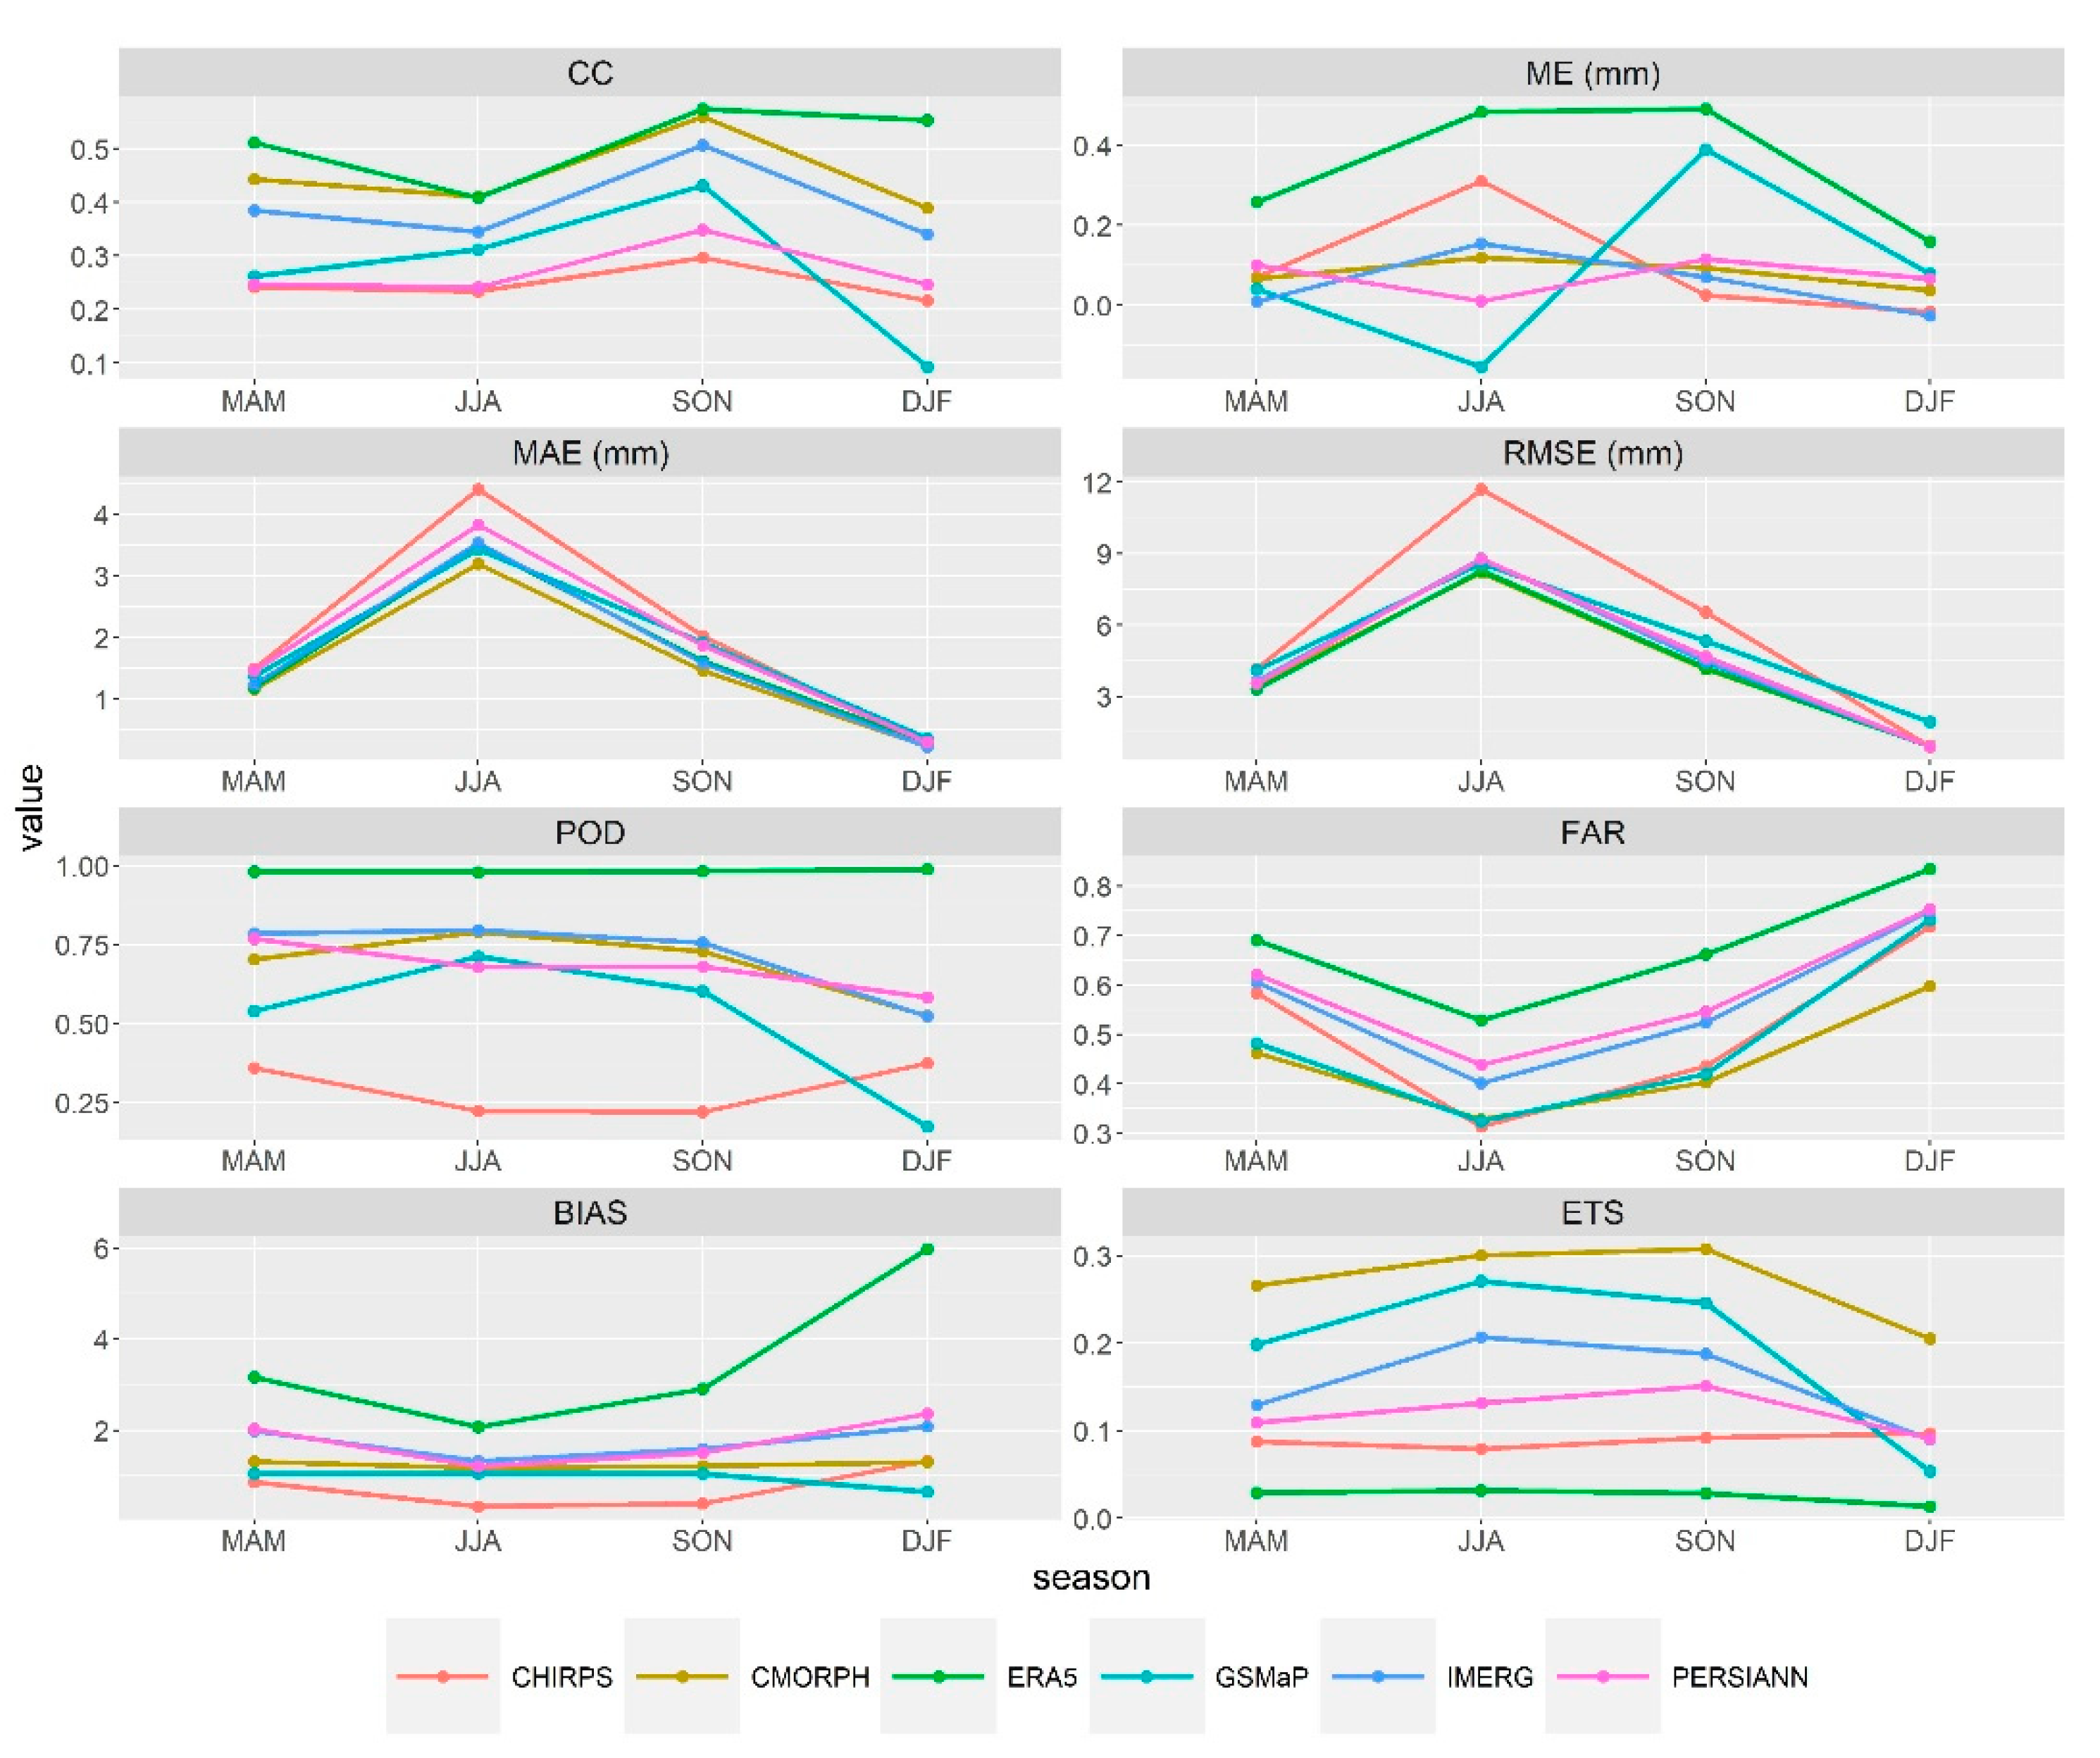
Values of the evaluation indices of the products’ daily precipitation were calculated month by month and season by season across all stations and at each station (Figure 6 and Figure 7) as well as at the daily scale. Throughout the year, ERA5 attains the highest CCs for most months, except August and October, followed by CMORPH and IMERG. Among all products, CCs from September to November are much higher than those in the other months, resulting in the highest CCs in autumn. With regard to CMORPH, ERA5 and PERSIANN, precipitation is overestimated for all months and seasons (except that PERSIANN underestimates precipitation in August). CHIRPS and IMERG underestimate precipitation in winter and overestimate precipitation in the other seasons, while GSMaP underestimates precipitation in summer and overestimates precipitation in the other seasons. MAE and RMSE first increase and then decrease throughout the year, with peak values occurring in July, which is consistent with the monthly precipitation. CHIRPS exhibits the highest MAEs and RMSEs from May to September, while these two indices of CMORPH reveal the lowest values throughout the year.
Figure 6 shows that the PODs of ERA5 are approximately 1, which means that almost all the observed rain events are detected in all months. The PODs of CHIRPS increase from January to March, then decrease from April to October and finally increase, resulting in high PODs from January to April and low PODs from March to December. The PODs of the other products first increase from January to April, then change slightly from May to September and finally decrease, resulting in high PODs from May to September and low PODs in December, January and February. The FARs of the products first decrease from January to July, then remain quite stable from July to September and finally increase from October to December. The months with low FARs are from June to September, which are all months with large rainfall amounts, while December to January exhibit a low rainfall resulting in high FARs. For all products, the FARs in summer are the lowest, followed by those in autumn and spring, and winter has the highest FAR (Figure 7). ERA5 attains the highest FARs from March to November. The BIASs of the products first decrease and then increase. ERA5 exhibits the highest BIASs for all months, which are much lower from May to September. Regarding the other products, the BIASs are low from May to October. The ETSs of the products first increase and then decrease, and the highest ETSs occur in July or August except for ERA5 and CMORPH. GSMaP reaches the highest ETSs from March to November, and ERA5 has the lowest ETSs from March to November. Generally, MAE, RMSE, POD, and ETS are consistent with the monthly and seasonal rainfall, and FAR and BIAS reveal the opposite trend to the rainfall trend. The summer months (e.g., June and July) with much rainfall result in a low quantitative accuracy and high rainfall detection capability, which provide reliable precipitation estimates.
The spatial patterns of the evaluation indices in terms of the products’ daily precipitation at the monthly and seasonal scales are shown in Figures S1 and S2, respectively. Similar to the patterns at the daily scale, MAE, RMSE, POD, and ETS increase from the northwest to the southeast, which is consistent with the precipitation distribution, but FAR reveals the opposite spatial pattern to that of precipitation. Seasonal characteristics can also be summarized from the spatial pattern of the indices. The CCs in autumn are obviously higher than those in the other seasons across the basin, the MAE and RMSE are visibly high in summer and low in winter, and the FAR is remarkably lower in summer than in the other seasons. With regard to the products, the CCs, PODs and BIAs of ERA5, and the BIAS and PODs of CHIRPS throughout the year are prominently different from the indices of the other products.
Compared to previous studies, the monthly variations in ME and RMSE for PERSIANN and CHIRPS are similar to the results obtained by Wei et al. (2019) [45], but CCs are highest in spring and slightly lower in autumn in Wei’s study, while CCs are the highest in autumn and slightly lower in spring in this study. This difference probably occurs because of the use of various validation datasets: a grid dataset from 405 meteorological stations was used for product evaluation by Wei et al. (2019) [45], and gauge observations at 95 stations are considered in this study, which may lead to minor differences between the spring and autumn results. The seasonal performance order of CC, RMSE POD and FAR for CHIRPS and IMERG match the results reported by Yu et al. (2020) [40]. The monthly variations in ME and RMSE for CMORPH and GSMaP are similar to the results obtained by Yang et al. (2020) [44]. Few studies have been performed to evaluate ERA5-Land precipitation estimations over the Yellow River Basin. ERA5 overestimates precipitation under all wetness and slope classes in Amjad’s research [69] conducted in Turkey, which is similar to the results obtained in this study.

3.3. Evaluation of the Products at the Different Precipitation Grades and Elevation Levels

3.3.1. Evaluation at the Different Precipitation Grades

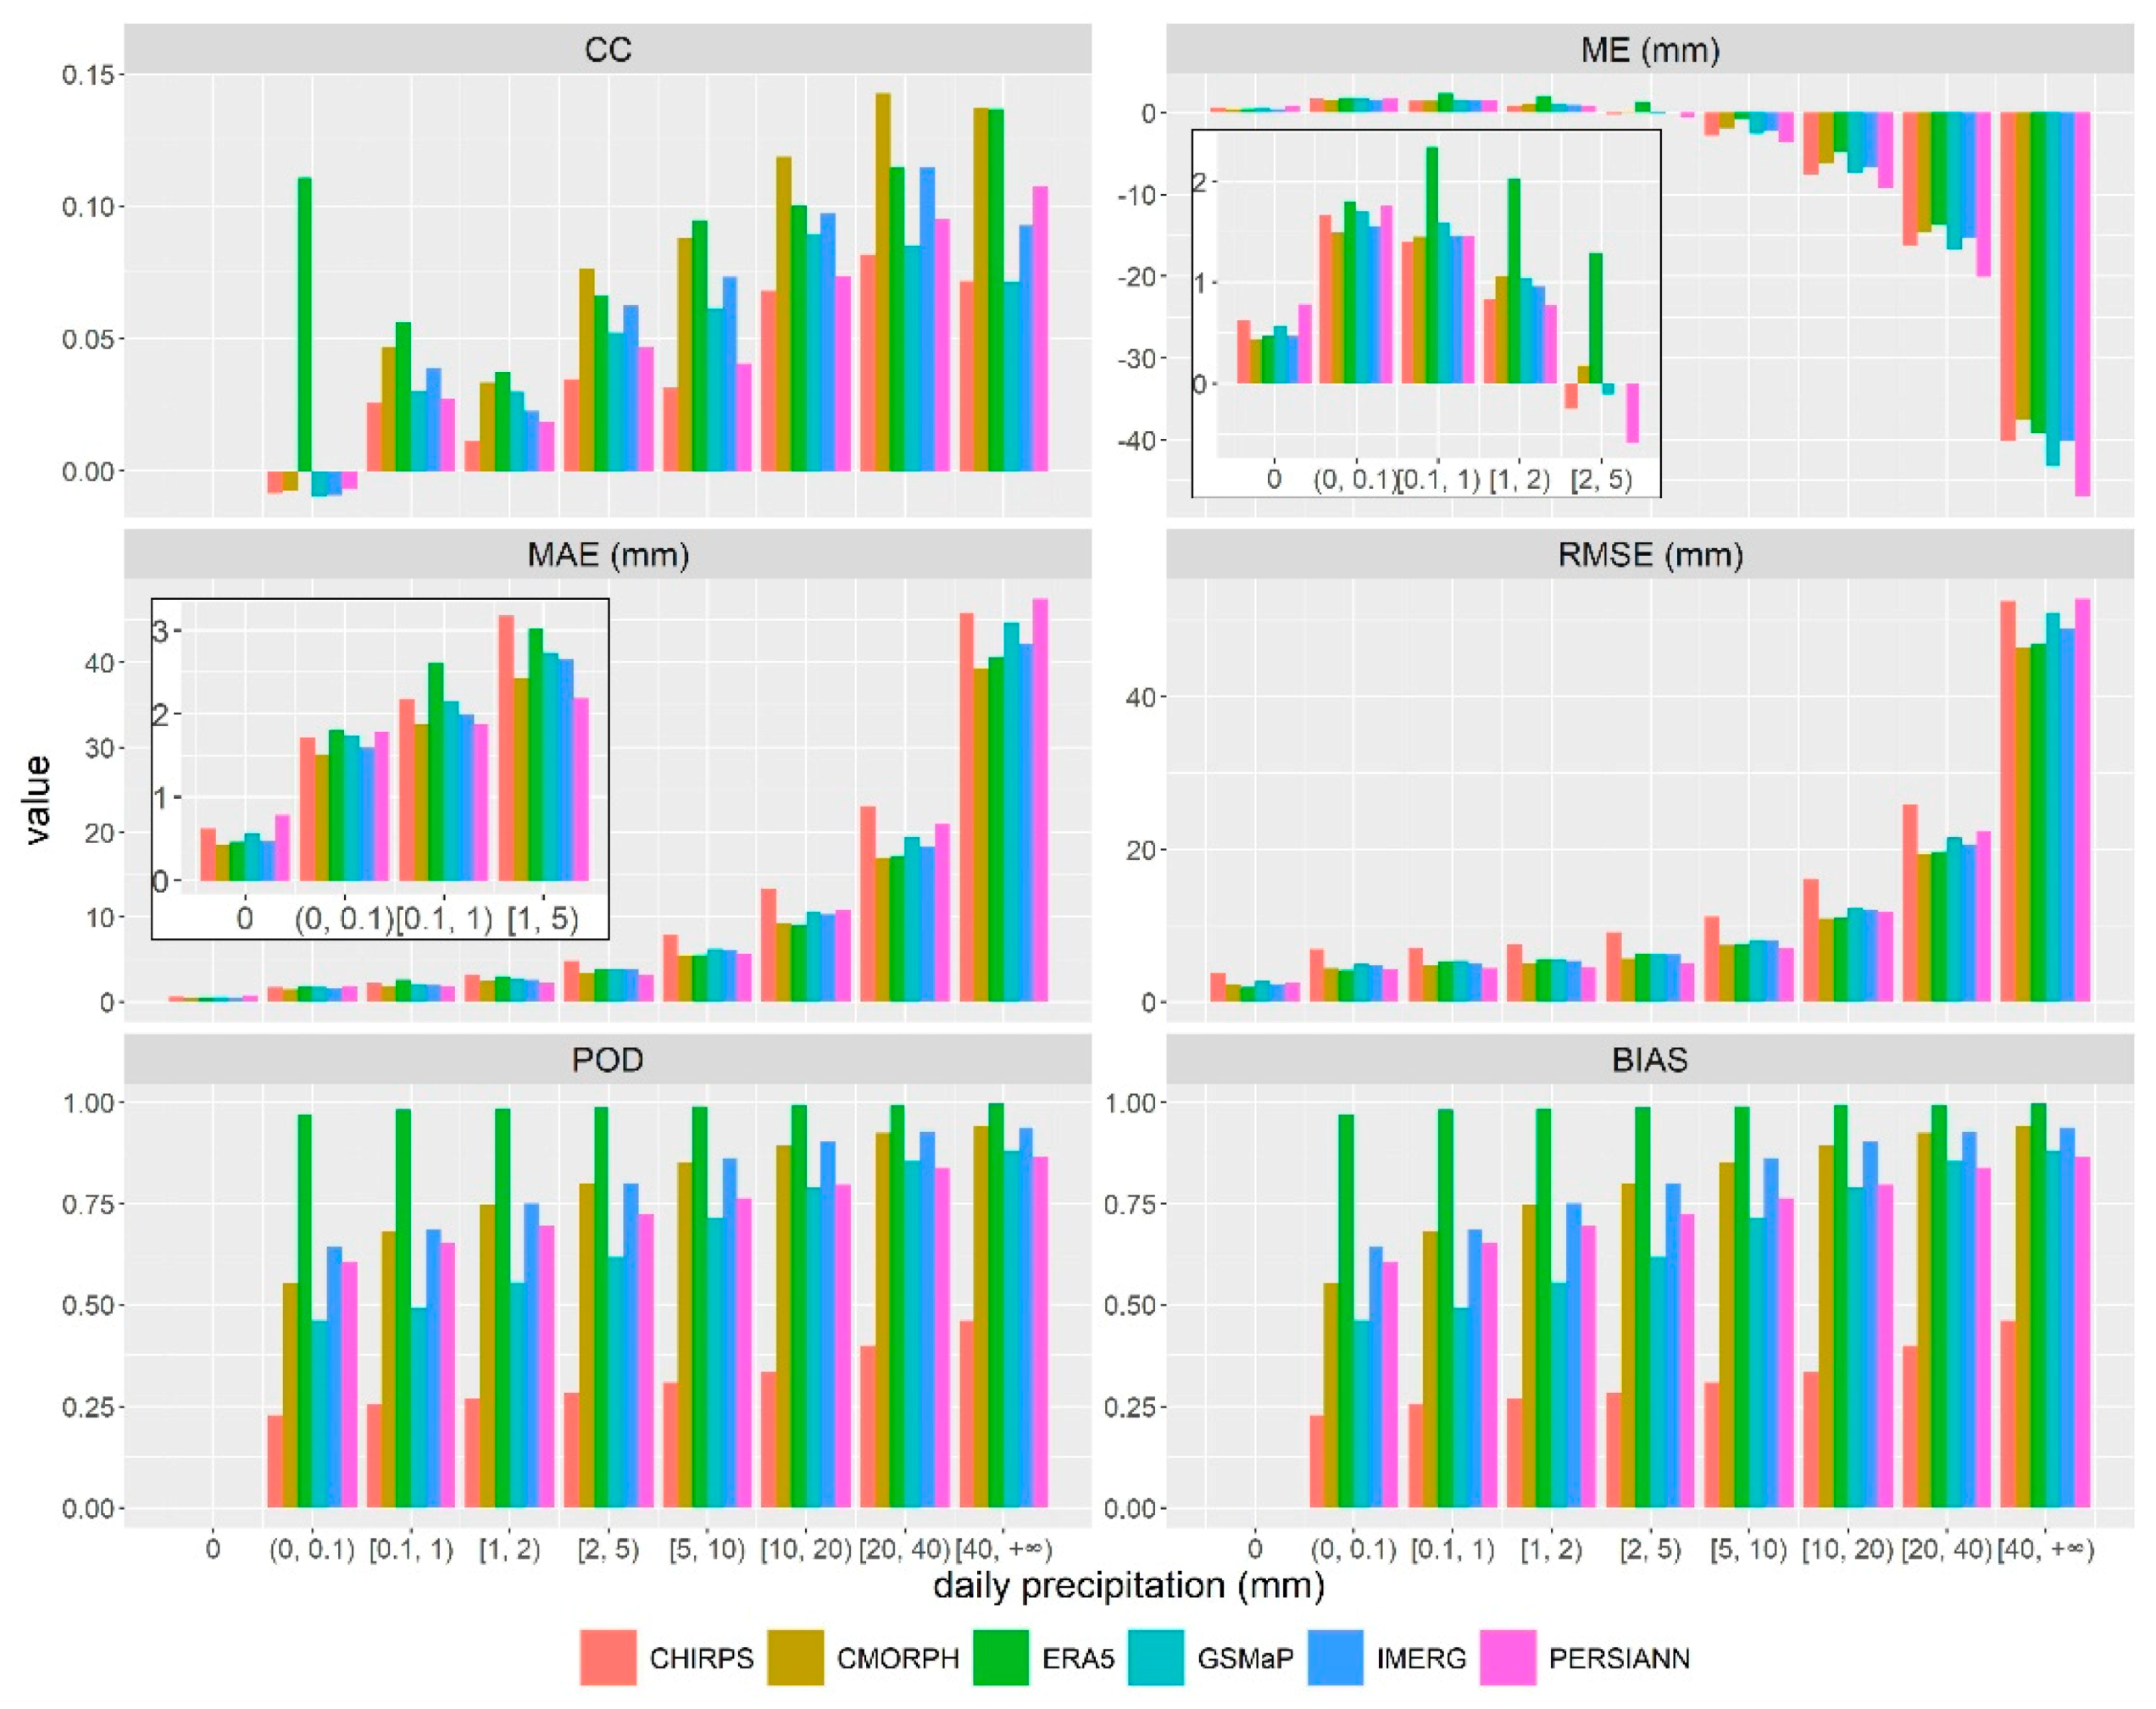
Figure 8 shows the evaluation indices for the nine daily precipitation grades. CC generally increases with increasing precipitation for all products when it is larger than 1 mm per day, and ERA5 reveals the highest CCs when the daily precipitation is less than 10 mm. CMORPH yields the highest CCs when daily precipitation is larger than 10 mm precipitation, while CHIRPS attains the lowest CCs at all grades. At the light rain grade (0–0.1 mm/day), ERA5 shows the highest CCs, the lowest RMSE and a low ME and MAE, which implies that it exhibits a better capability to detect light rain than the others. All products slightly overestimate precipitation at low precipitation grades (daily rainfall lower than 2 mm) and underestimate it at high precipitation grades (daily rainfall higher than 5 mm), which is similar to the performance of IMERG-F and GSMaP-N over mainland China [36]. The magnitudes of ME, MAE, RMSE, POD (except for ERA5) and BIAS (except for ERA5) increase with the daily precipitation grade, which is similar to previous studies [36]. When the daily rainfall exceeds 0, the POD and BIAS calculation equations are the same. The associated values are lower than 1 because the observed rain events are missed to a certain extent. The PODs and BIASs of ERA5 are approximately 1 because it misses few rain events (Figure S3).
The number of H, M, F and C events were counted at each daily precipitation grade (Figure S3). No-rain days accounted for 69.53% of the total daily records at 95 stations across the Yellow River Basin throughout the study period. Hence, it is important to clarify the precipitation products’ performance on no-rain days. The products’ C event proportions indicate that all products underestimate the proportions of no-rain days in the total daily records (Figure S3), which is similar to previous studies. With regard to no-rain events, CHIRPS correctly detects the most no-rain events and falsely detects the fewest rain events, indicating the highest capability to detect rainfall events. ERA5 correctly detects the least no-rain events and falsely detects the most rain events, thus performing the worst. GSMaP and CMORPH reveal a slightly lower capability than that of CHIRPS but perform much better than IMERG and PERSIANN. In terms of rainy days, ERA5 correctly detects the most rain events and misses the fewest rain events at all daily precipitation grades, while CHIRPS correctly detects the fewest rain events and misses the most rain events. The order of the H event proportions remains consistent when the daily rainfall is between 0.1 and 20 cm, i.e., ERA5 > IMERG > CMORPH > PERSIANN > GSMaP > CHIRPS.
Figure 8 shows that in the Yellow River Basin, products yield an overestimation on no-rain days and days with low precipitation grades (less than 2 mm), and an underestimation for high precipitation grades (more than 5 mm), defining the overall performance of the products. The characteristics of the precipitation across the basin vary according to gauge observations. The source region has the largest number of rainy days, and daily precipitation varies in a relatively narrow range, resulting in the most days with high precipitation grades (more than 5 mm) and the lowest average daily precipitation. In the upper reaches, no-rain days represent the largest proportion, days with high precipitation grades represent the fewest, and the average daily precipitation for these days is higher than that in the source region. In the middle reaches, the average daily precipitation with high grades is greater than that in the middle region, and the average daily precipitation with high grades are also larger. With regard to the lower reaches, there is a larger number of days with high precipitation grades, and they account for the largest proportion of the annual rainfall. As a consequence, the middle reaches, with the largest portion of days with no-rain and low precipitation grades and the smallest number of days with high precipitation grades, are likely to be underestimated by products, as the results of CHIRPS, CMORPH, GSMaP and IMERG show, and the lower reaches with the largest proportion of days with high precipitation grades are underestimated. However, GSMAP, IMERG and PERSIANN exhibit overestimations in the southeastern middle reaches, where daily precipitation is generally high, because the overestimation for no-rain days and days with low precipitation are stronger than the underestimation of days with high precipitation grades.

3.3.2. Evaluation at the Different Elevation Levels

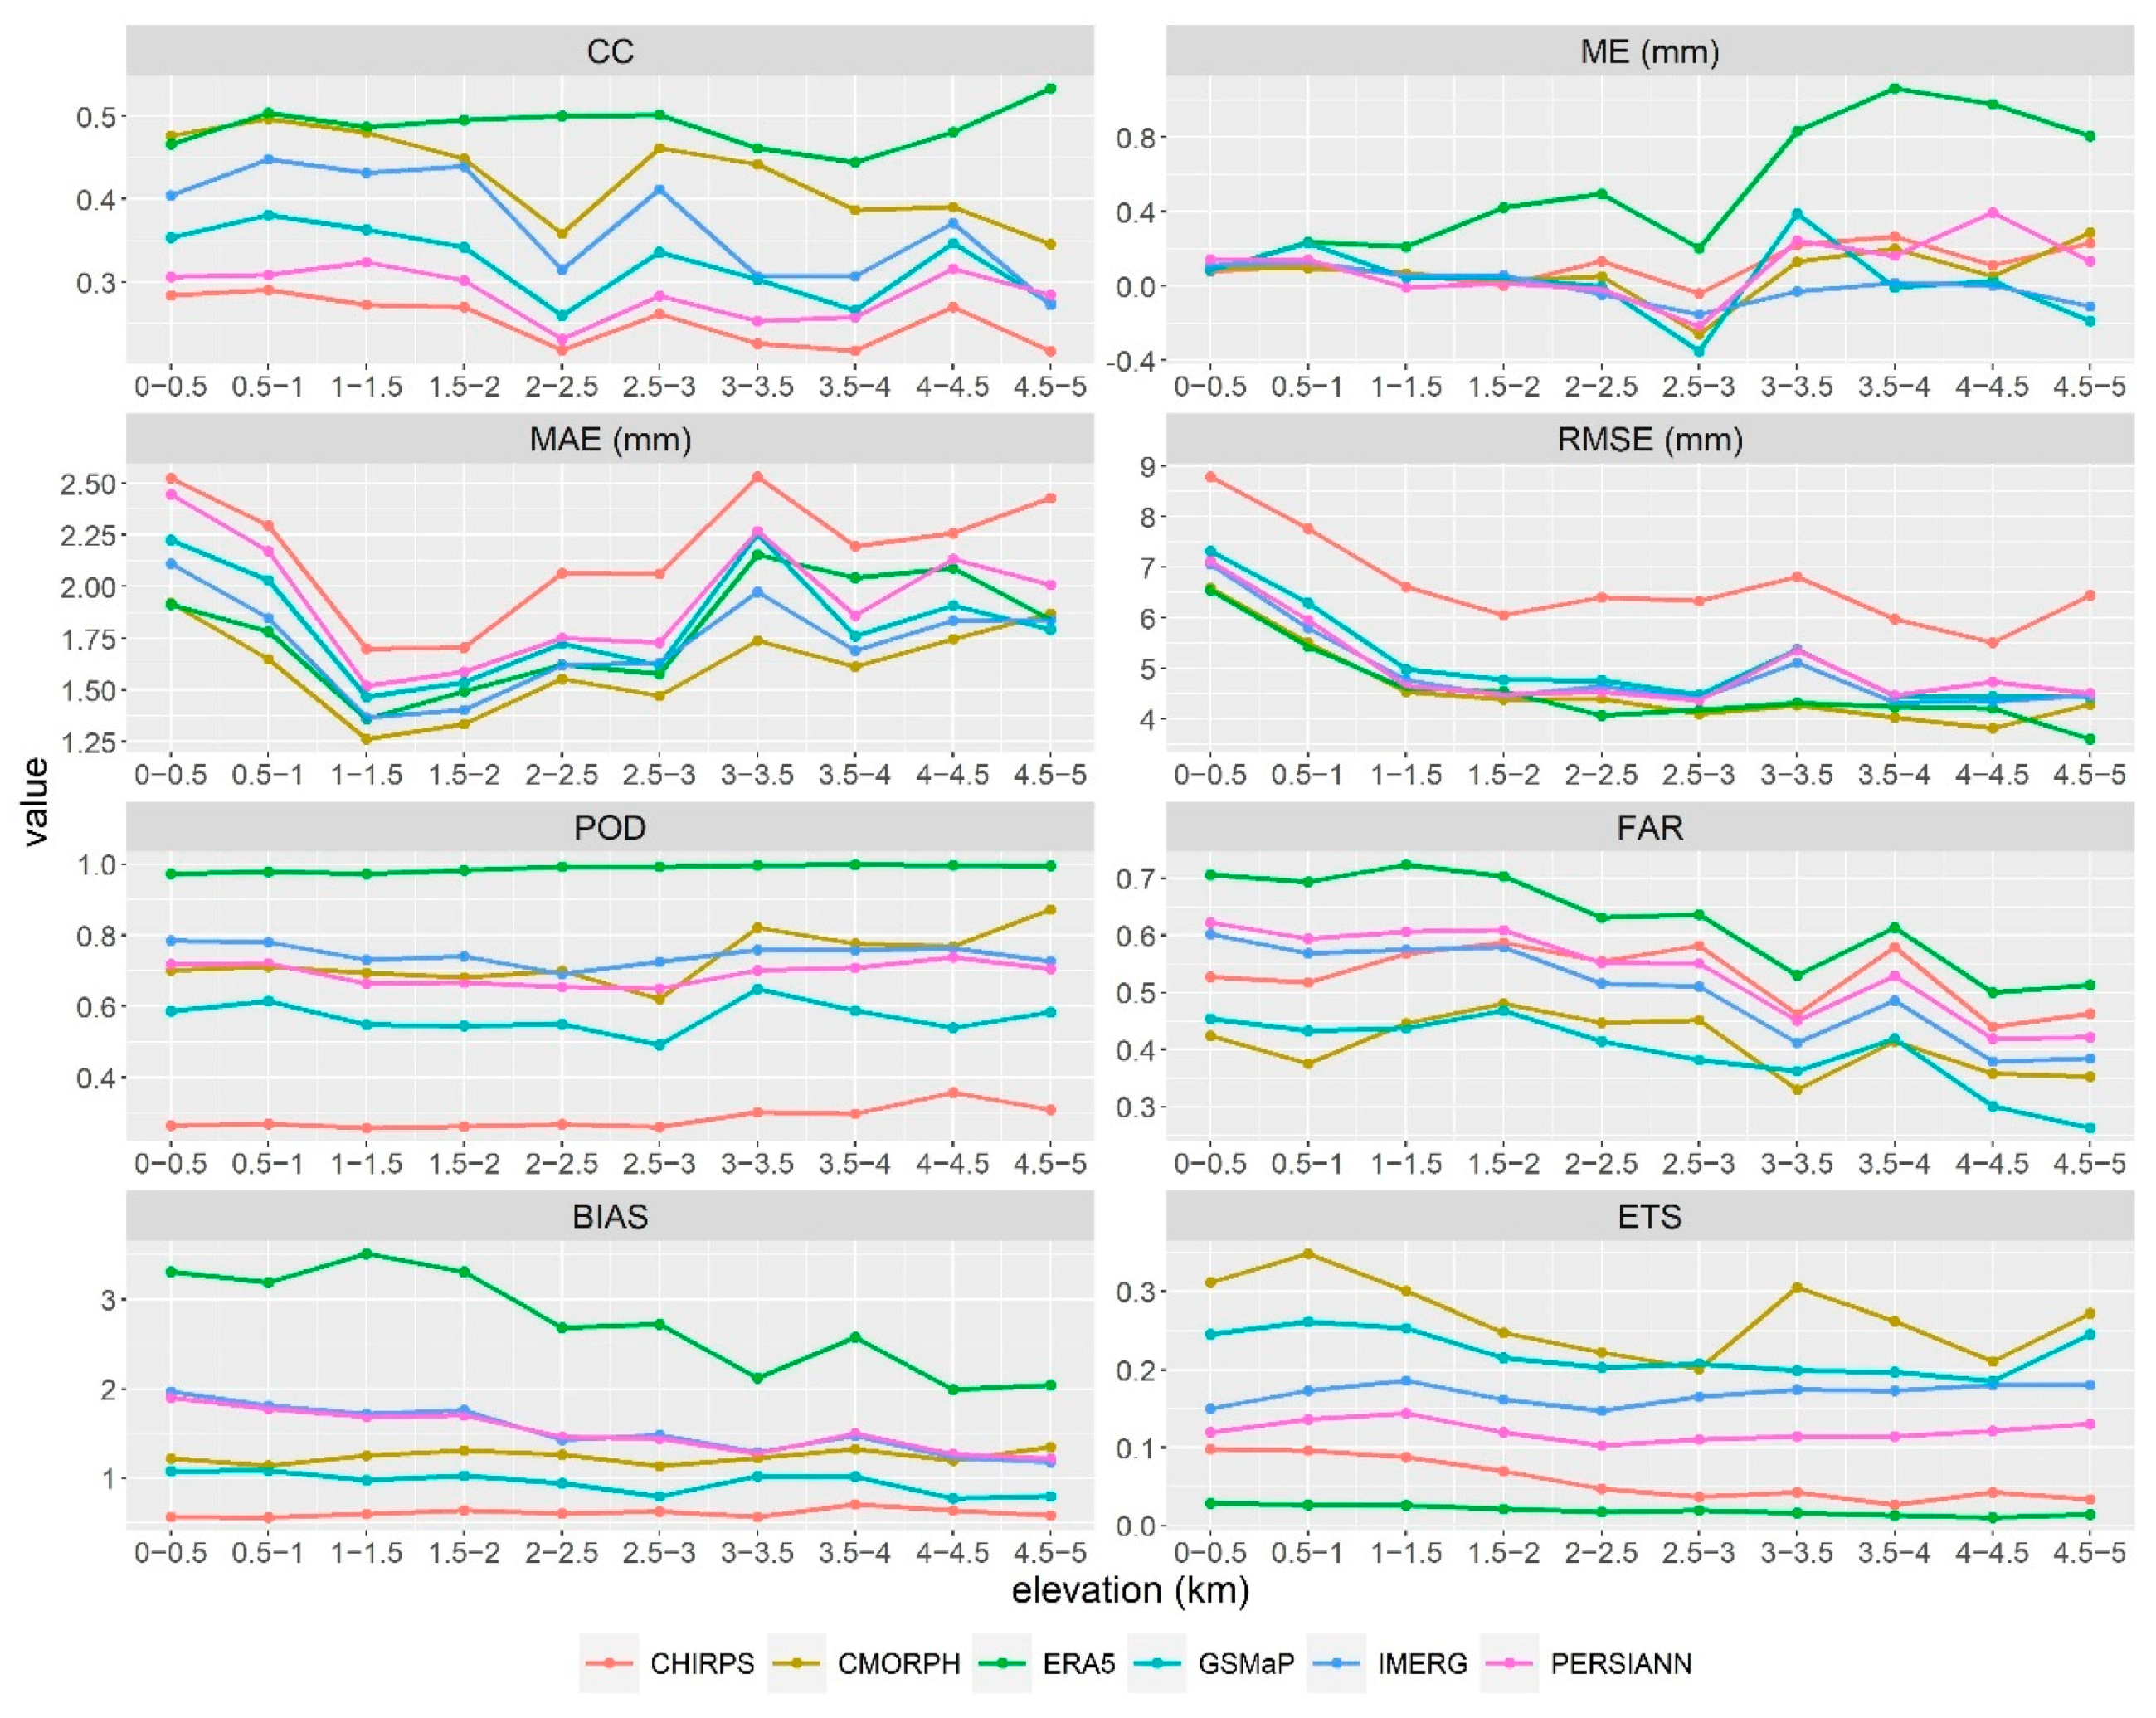
Figure 9 shows the evaluation indices of the daily precipitation for the products at the different elevation levels. CCs of all products except ERA5 exhibit two valleys at elevations of 2000–2500 m and 3500–4000 m and one peak at elevations 2500–3000 m. The highest CC of ERA5 occurs at the peak (2500–3000 m), and the lowest CC occurs at one of the valleys (3500–4000 m). ERA5 overestimates rainfall at all elevation levels, while the other products underestimate precipitation from 2500 to 3000. MAEs first decrease with increasing elevation and reach a valley at an elevation level of 1000–1500 m, then increase and reach peaks at an elevation level of 3000–3500 m. RMSE generally tends to decrease with increasing elevation. ERA5 reaches a POD of approximately 1 at all elevation levels. PODs of the other products vary within quite narrow ranges. FARs of the products generally decrease with increasing elevation, and valley values occur at an elevation level of 3000–3500 m. ERA5 yields the highest FARs at all elevation intervals, and CMORPH and GSMaP attain the lowest values. BIASs of the products generally also show a decreasing trend. CHIRPS attains a BIAS lower than 1 at all elevation levels, and GSMaP reaches a BIAS very close to 1, while the other products yield a BIAS higher than 1 at all elevation levels. With regard to ETS, CMORPH reaches the highest ETSs at all elevation levels except for 2500–3000 m, followed by GSMaP, while ERA5 exhibits the lowest ETSs. Among the six products, ERA5 attains the highest CCs and MEs when the elevation is higher than 500 m, the highest FARs and BIASs, and the lowest ETSs for all elevation levels. CHIRPS exhibits the lowest CCs and PODs, and the highest MAEs and RMSEs for all elevation levels, while CMORPH has the lowest MAEs when the elevation is between 500 and 4500 m, the highest ETSs, high CCs and low RMSEs and BIAs. Generally, CMORPH performs the best with high quantitative accuracy and rain detection capabilities, while CHIRPS performs the worst.
To better understand the relationships between the various evaluation indices and elevation, the CCs between the indices and elevation at the stations were calculated (Table S1). The results showed that most evaluation indices (i.e., CC, RMSE, POD, FAR, BIAS, and ETS) exhibited a negative correlation with elevation, which is consistent with the result for mainland China obtained by Yu [40]. This is reasonable because these indices are consistent with the daily precipitation, which reveals a negative relationship with elevation (Figure S4) and is similar to the observed relationship in the Hengduan Mountain region in China [70]. Thus, elevation could be used to correct or downscale the precipitation estimates of the satellite and reanalysis precipitation products [71,72].
The accuracy of the precipitation products is affected by terrain. All products in this study, except for CHIRPS, perform the best in the middle reaches with elevations of 500–1500 m (Figure 9). PERSIANN performs the worst in the source region and southwestern middle reaches. There are several possible reasons: the terrain in these areas is complex, resulting in various precipitation patterns, where the satellite-based sensors are not especially sensitive [73], and the number of gauge stations is limited to product calibration and evaluation.

4. Conclusions

Six state-of-the-art precipitation products were evaluated over the Yellow River Basin of China from 2001 to 2018. The main findings are as follows:
(1)
At the daily scale, CMORPH outperforms the other products in terms of both quantitative accuracy and rainfall detection capability, while CHIRPS performs the worst.
(2)
At the monthly and seasonal scales, ERA5 produces the highest CCs in all months. Among all products, CCs are the highest in autumn, MAE and RMSE increase first and then decrease throughout the year, and peak values occur in July. The PODs of all products except for CHIRPS increase first from January to April, then remain stable for some months and finally decrease. The FARs and BIASs of the products first decrease and then increase, and the FARs in summer are the lowest, followed by those in autumn, spring, and winter. MAE, RMSE, POD, and ETS exhibit consistent monthly and seasonal rainfall amounts, and FAR and BIAS show the opposite trends to that of the rainfall amount. The summer months (e.g., June and July) with large rainfall amounts result in a low continuous accuracy and high rainfall detection capability.
(3)
Spatially, at the daily, monthly, and seasonal scales, the MAE, RMSE, POD, and ETS increase from northwest to southeast, which is consistent with the precipitation pattern. The precipitation amount in the humid areas of the source region and middle reaches is likely to be overestimated, and that in the arid areas is likely to be underestimated.
(4)
The CC, ME, MAE, RMSE, POD and BIAS generally exhibit an increasing trend with increasing daily precipitation. All products slightly overestimate precipitation at low precipitation grades and underestimate it at high precipitation grades. Regarding rainfall detection capability, CHIRPS exhibits the best capability to detect no-rain events, and ERA5 performs the worst. Regarding the rainy days, ERA5 misses the fewest rain events, while CHIRPS misses the most.
(5)
Most evaluation indices show a negative correlation with elevation. The RMSE, FAR, BIAS, and ETS decrease with increasing elevation. CMORPH performs the best for all elevation levels, while CHIRPS performs the worst.
Overall, the precipitation evaluation indices vary with the terrain condition, temporal scale, and product. An evaluation is therefore necessary before an application. The distribution of the gauge stations is uneven across the Yellow River Basin, especially in the source region and lower reaches, where the stations are sparse. This may increase the evaluation uncertainty. More gauge data should be collected to conduct better evaluation studies. The time scales adopted to conduct the evaluation in this study are the daily, monthly, and seasonal scales. However, rain events usually occur within a very short time, such as a few hours. Hence, in further studies, evaluations conducted at the hourly scale are necessary to obtain a more accurate understanding of the validity of these products.

Supplementary Materials

The following are available online at https://www.mdpi.com/2073-4433/11/11/1223/s1, Figure S1: Monthly evaluation indices of the products’ daily precipitation at each station. (A) CC, (B) ME, (C) MAE, (D) RMSE, (E) POD, (F) FAR, (G) BIAS, (H) ETS, Figure S2: Seasonal evaluation indices of the products’ daily precipitation at each station. (A) CC, (B) ME, (C) MAE, (D) RMSE, (E) POD, (F) FAR, (G) BIAS, (H) ETS, Figure S3: Proportions of the H, M, F, and C events in the total daily records at the different daily precipitation grades (CH: CHIRPS; CM: CMORPH; E: REA5; G: GSMaP; I: IMERG; P: PERSIANN), Figure S4: Change in the daily precipitation with the elevation across the Yellow River Basin from 2001 to 2018, Table S1: Correlation coefficients of the evaluation indices of the six precipitation products and elevation.

Author Contributions

Conceptualization, Y.A. and W.Z.; methodology, Y.A.; validation, Y.A., C.L. and Y.L.; writing—Original Draft Preparation, Y.A.; writing—review and editing, C.L. and Y.L.; supervision, W.Z.; project administration, W.Z.; funding Acquisition, W.Z. All authors have read and agreed to the published version of the manuscript.

Funding

This research was funded by the National Key Research and Development Program of China (No. 2017YFA0604704), China Postdoctoral Science Foundation (No. 2019M650522), and the Fundamental Research Funds for the Central Universities.

Acknowledgments

The authors would like to thank the high-performance computing support from the Center for Geodata and Analysis, Faculty of Geographical Science, Beijing Normal University (https://gda.bnu.edu.cn/).

Conflicts of Interest

The authors declare no conflict of interest.

References

  1. Warnatzsch, E.A.; Reay, D.S. Temperature and precipitation change in Malawi: Evaluation of CORDEX-Africa climate simulations for climate change impact assessments and adaptation planning. Sci. Total Environ. 2019, 654, 378–392. [Google Scholar] [CrossRef] [PubMed]
  2. Isabelle, P.; Nadeau, D.F.; Anctil, F.; Rousseau, A.N.; Jutras, S.; Music, B. Impacts of high precipitation on the energy and water budgets of a humid boreal forest. Agr. Forest Meteorol. 2020, 280, 107813. [Google Scholar] [CrossRef]
  3. Song, S.; Xu, Y.P.; Wu, Z.F.; Deng, X.J.; Wang, Q. The relative impact of urbanization and precipitation on long-term water level variations in the Yangtze River Delta. Sci. Total Environ. 2019, 648, 460–471. [Google Scholar] [CrossRef]
  4. Yang, P.; Ren, G.; Hou, W. Impact of daytime precipitation duration on urban heat island intensity over Beijing city. Urban Climate 2019, 28, 100463. [Google Scholar] [CrossRef]
  5. Himanshu, S.K.; Pandey, A.; Yadav, B. Assessing the applicability of TMPA-3B42V7 precipitation dataset in wavelet-support vector machine approach for suspended sediment load prediction. J. Hydrol. 2017, 550, 103–117. [Google Scholar] [CrossRef]
  6. Liu, J.; Bi, X.; Ma, M.; Jiang, L.; Du, L.; Li, S.; Sun, Q.; Zou, G.; Liu, H. Precipitation and irrigation dominate soil water leaching in cropland in Northern China. Agr. Water Manag. 2019, 211, 165–171. [Google Scholar] [CrossRef]
  7. Zhou, J.; Fu, B.; Gao, G.; Lü, Y.; Liu, Y.; Lü, N.; Wang, S. Effects of precipitation and restoration vegetation on soil erosion in a semi-arid environment in the Loess Plateau, China. Catena 2016, 137, 1–11. [Google Scholar] [CrossRef]
  8. Li, Y.; Zhang, Z.; Gong, S.; Liu, M.; Zhao, Y. Risk assessment of rainstorm disasters under different return periods: A case study of Bohai Rim, China. Ocean Coast. Manag. 2020, 187, 105107. [Google Scholar] [CrossRef]
  9. Shi, J.; Cui, L.; Tian, Z. Spatial and temporal distribution and trend in flood and drought disasters in East China. Environ. Res. 2020, 185, 109406. [Google Scholar] [CrossRef]
  10. Jiao, K.; Hu, W.; Ren, C.; Xu, Z.; Ma, W. Impacts of tropical cyclones and accompanying precipitation and wind velocity on childhood hand, foot and mouth disease in Guangdong Province, China. Environ. Res. 2019, 173, 262–269. [Google Scholar] [CrossRef]
  11. Zhang, W.; Zhou, T. Increasing impacts from extreme precipitation on population over China with global warming. Sci. Bull. 2020, 65, 243–252. [Google Scholar] [CrossRef] [Green Version]
  12. Zhang, Y.; Qu, H.; Yang, X.; Wang, M.; Qin, N.; Zou, Y. Cropping system optimization for drought prevention and disaster reduction with a risk assessment model in Sichuan Province. Glob. Ecol. Conserv. 2020, 23, e01095. [Google Scholar] [CrossRef]
  13. Bai, P.; Liu, X. Evaluation of Five Satellite-Based Precipitation Products in Two Gauge-Scarce Basins on the Tibetan Plateau. Remote Sens. 2018, 10, 1316. [Google Scholar] [CrossRef] [Green Version]
  14. Tang, G. Evaluation of GPM Day-1 IMERG and TMPA Version-7 legacy products over Mainland China at multiple spatiotemporal scales. J. Hydrol. 2016, 533, 152–167. [Google Scholar] [CrossRef]
  15. Yong, B.; Liu, D.; Gourley, J.J.; Tian, Y.; Huffman, G.J.; Ren, L.; Hong, Y. Global View of Real-Time Trmm Multisatellite Precipitation Analysis: Implications for Its Successor Global Precipitation Measurement Mission. Bull. Am. Meteorol. Soc. 2015, 96, 283–296. [Google Scholar] [CrossRef]
  16. Germann, U.; Joss, J. Mesobeta Profiles to Extrapolate Radar Precipitation Measurements above the Alps to the Ground Level. J. Appl. Meteorol. 2002, 41, 542–557. [Google Scholar] [CrossRef]
  17. Huffman, G.J.; Bolvin, D.T.; Nelkin, E.J.; Wolff, D.B.; Adler, R.F.; Gu, G.; Hong, Y.; Bowman, K.P.; Stocker, E.F. The TRMM Multisatellite Precipitation Analysis (TMPA): Quasi-Global, Multiyear, Combined-Sensor Precipitation Estimates at Fine Scales. J. Hydrometeorol. 2007, 8, 38–55. [Google Scholar] [CrossRef]
  18. Huffman, G.; Bolvin, D.; Braithwaite, D.; Hsu, K.; Joyce, R.; Xie, P. Integrated Multi-Satellite Retrievals for GPM (IMERG), Version 4.4. NASA’s Precipitation Processing Center. 2014. Available online: https://gpm.nasa.gov/data/directory (accessed on 31 March 2015).
  19. Funk, C.; Peterson, P.; Landsfeld, M.; Pedreros, D.; Verdin, J.; Shukla, S.; Husak, G.; Rowland, J.; Harrison, L.; Hoell, A.; et al. The climate hazards infrared precipitation with stations—A new environmental record for monitoring extremes. Sci. Data 2015, 2, 150066. [Google Scholar] [CrossRef] [Green Version]
  20. Joyce, R.J.; Janowiak, J.E.; Arkin, P.A.; Xie, P. CMORPH: A Method that Produces Global Precipitation Estimates from Passive Microwave and Infrared Data at High Spatial and Temporal Resolution. J. Hydrometeorol. 2004, 5, 487–503. [Google Scholar] [CrossRef]
  21. Kubota, T.; Shige, S.; Hashizume, H.; Aonashi, K.; Takahashi, N.; Seto, S.; Hirose, M.; Takayabu, Y.N.; Ushio, T.; Nakagawa, K.; et al. Global Precipitation Map Using Satellite-Borne Microwave Radiometers by the GSMaP Project: Production and Validation. IEEE T. Geosci. Remote 2007, 45, 2259–2275. [Google Scholar] [CrossRef]
  22. Sorooshian, S.; Hsu, K.L.; Gao, X.; Gupta, H.V.; Imam, B.; Braithwaite, D. Evaluation of PERSIANN System Satellite-Based Estimates of Tropical Rainfall. Bull. Am. Meteorol. Soc. 2000, 81, 2035–2046. [Google Scholar] [CrossRef] [Green Version]
  23. Schneider, U.; Finger, P.; Meyer-Christoffer, A.; Ziese, M.; Becker, A. GPCC Full Data Monthly Product Version 2018 at 0.25°: Monthly Land-Surface Precipitation from Rain-Gauges built on GTS-based and Historical Data. 2018. Available online: https://opendata.dwd.de/climate_environment/GPCC/html/fulldata-monthly_v2018_doi_download.html (accessed on 12 November 2020).
  24. Dee, D.P.; Uppala, S.M.; Simmons, A.J.; Berrisford, P.; Poli, P.; Kobayashi, S.; Andrae, U.; Balmaseda, M.A.; Balsamo, G.; Bauer, P.; et al. The ERA-Interim reanalysis: Configuration and performance of the data assimilation system. Q. J. R. Meteorol. Soc. 2011, 137, 553–597. [Google Scholar] [CrossRef]
  25. Saha, S.; Moorthi, S.; Pan, H.L.; Wu, X.; Wang, J.; Nadiga, S.; Tripp, P.; Kistler, R.; Woollen, J.; Behringer, D.; et al. The NCEP climate forecast system reanalysis. Bull. Am. Meteorol. Soc. 2010, 91. [Google Scholar] [CrossRef]
  26. Sun, Q.; Miao, C.; Duan, Q.; Ashouri, H.; Sorooshian, S.; Hsu, K.L. A Review of Global Precipitation Data Sets: Data Sources, Estimation, and Intercomparisons. Rev. Geophys. 2018, 56, 79–107. [Google Scholar] [CrossRef] [Green Version]
  27. Maggioni, V.; Meyers, P.C.; Robinson, M.D. A Review of Merged High-Resolution Satellite Precipitation Product Accuracy during the Tropical Rainfall Measuring Mission (TRMM) Era. J. Hydrometeorol. 2016, 17, 1101–1117. [Google Scholar] [CrossRef]
  28. Ning, S.; Song, F.; Udmale, P.; Jin, J.; Thapa, B.R.; Ishidaira, H. Error Analysis and Evaluation of the Latest GSMap and IMERG Precipitation Products over Eastern China. Adv. Meteorol. 2017, 2017, 1–16. [Google Scholar] [CrossRef] [Green Version]
  29. Wang, Z.; Zhong, R.; Lai, C.; Chen, J. Evaluation of the GPM IMERG satellite-based precipitation products and the hydrological utility. Atmos. Res. 2017, 196, 151–163. [Google Scholar] [CrossRef]
  30. Burton, C.; Rifai, S.; Malhi, Y. Inter-comparison and assessment of gridded climate products over tropical forests during the 2015/2016 El Niño. Philos. Trans. R. Soc. B 2018, 20170406. [Google Scholar] [CrossRef] [Green Version]
  31. Kidd, C.; Bauer, P.; Turk, J.; Huffman, G.J.; Joyce, R.; Hsu, K.L.; Braithwaite, D. Intercomparison of High-Resolution Precipitation Products over Northwest Europe. J. Hydrometeorol. 2012, 13, 67–83. [Google Scholar] [CrossRef] [Green Version]
  32. Beck, H.; Pan, M.; Roy, T.; Weedon, G.P.; Pappenberger, F.; Van Dijk, A.I.J.M.; Huffman, G.J.; Adler, R.F.; Wood, E.F. Daily evaluation of 26 precipitation datasets using Stage-IV gauge-radar data for the CONUS. Hydrol. Earth Syst. Sci. 2019, 23, 207–224. [Google Scholar] [CrossRef] [Green Version]
  33. Yang, M.; Liu, G.; Chen, T.; Chen, Y.; Xia, C. Evaluation of GPM IMERG precipitation products with the point rain gauge records over Sichuan, China. Atmos. Res. 2020, 246, 105101. [Google Scholar] [CrossRef]
  34. Yuan, F.; Zhang, L.; Win, K.; Ren, L.; Zhao, C.; Zhu, Y.; Jiang, S.; Liu, Y. Assessment of GPM and TRMM Multi-Satellite Precipitation Products in Streamflow Simulations in a Data-Sparse Mountainous Watershed in Myanmar. Remote Sens. 2017, 9, 302. [Google Scholar] [CrossRef] [Green Version]
  35. Gao, Y.C.; Liu, M.F. Evaluation of high-resolution satellite precipitation products using rain gauge observations over the Tibetan Plateau. Hydrol. Earth Syst. Sc. 2013, 17, 837–849. [Google Scholar] [CrossRef] [Green Version]
  36. Zhou, Z.; Guo, B.; Xing, W.; Zhou, J.; Xu, F.; Xu, Y. Comprehensive evaluation of latest GPM era IMERG and GSMaP precipitation products over mainland China. Atmos. Res. 2020, 246, 105132. [Google Scholar] [CrossRef]
  37. Wang, F.; Yang, H.; Wang, Z.; Zhang, Z.; Li, Z. Drought Evaluation with CMORPH Satellite Precipitation Data in the Yellow River Basin by Using Gridded Standardized Precipitation Evapotranspiration Index. Remote Sens. 2019, 11, 485. [Google Scholar] [CrossRef] [Green Version]
  38. Yao, J.; Chen, Y.; Yu, X.; Zhao, Y.; Guan, X.; Yang, L. Evaluation of multiple gridded precipitation datasets for the arid region of northwestern China. Atmos. Res. 2020, 236, 104818. [Google Scholar] [CrossRef]
  39. Zhang, Q.; Peng, J.; Singh, V.P.; Li, J.; Chen, Y.D. Spatio-temporal variations of precipitation in arid and semiarid regions of China: The Yellow River basin as a case study. Glob. Planet Chang. 2014, 114, 38–49. [Google Scholar] [CrossRef]
  40. Yu, C.; Hu, D.; Liu, M.; Wang, S.; Di, Y. Spatio-temporal accuracy evaluation of three high-resolution satellite precipitation products in China area. Atmos. Res. 2020, 241, 104952. [Google Scholar] [CrossRef]
  41. Tang, G.; Clark, M.P.; Papalexiou, S.M.; Ma, Z.; Hong, Y. Have satellite precipitation products improved over last two decades? A comprehensive comparison of GPM IMERG with nine satellite and reanalysis datasets. Remote Sens. Environ. 2020, 240, 111697. [Google Scholar] [CrossRef]
  42. Chen, F.; Gao, Y. Evaluation of precipitation trends from high-resolution satellite precipitation products over Mainland China. Clim. Dyn. 2018, 51, 3311–3331. [Google Scholar] [CrossRef]
  43. Bai, L.; Shi, C.; Li, L.; Yang, Y.; Wu, J. Accuracy of CHIRPS Satellite-Rainfall Products over Mainland China. Remote Sens. 2018, 10, 362. [Google Scholar] [CrossRef] [Green Version]
  44. Yang, Y.; Wu, J.; Bai, L.; Wang, B. Reliability of Gridded Precipitation Products in the Yellow River Basin, China. Remote Sens. 2020, 12, 374. [Google Scholar] [CrossRef] [Green Version]
  45. Wei, L.; Jiang, S.; Ren, L.; Yuan, F.; Zhang, L. Performance of Two Long-Term Satellite-Based and GPCC 8.0 Precipitation Products for Drought Monitoring over the Yellow River Basin in China. Sustainability 2019, 11, 4969. [Google Scholar] [CrossRef] [Green Version]
  46. Yuan, F.; Wang, B.; Shi, C.; Cui, W.; Zhao, C.; Liu, Y.; Ren, L.; Zhang, L.; Zhu, Y.; Chen, T.; et al. Evaluation of hydrological utility of IMERG Final run V05 and TMPA 3B42V7 satellite precipitation products in the Yellow River source region, China. J. Hydrol. 2018, 567, 696–711. [Google Scholar] [CrossRef]
  47. Liu, J.; Xia, J.; She, D.; Li, L.; Wang, Q.; Zou, L. Evaluation of Six Satellite-Based Precipitation Products and Their Ability for Capturing Characteristics of Extreme Precipitation Events over a Climate Transition Area in China. Remote Sens. 2019, 11, 1477. [Google Scholar] [CrossRef] [Green Version]
  48. Yang, X.; Lu, Y.; Tan, M.L.; Li, X.; Wang, G.; He, R. Nine-Year Systematic Evaluation of the GPM and TRMM Precipitation Products in the Shuaishui River Basin in East-Central China. Remote Sens. 2020, 12, 1042. [Google Scholar] [CrossRef] [Green Version]
  49. Zhang, Q.; Liu, J.; Singh, V.P.; Shi, P.; Sun, P. Hydrological responses to climatic changes in the Yellow River basin, China: Climatic elasticity and streamflow prediction. J. Hydrol. 2017, 554, 635–645. [Google Scholar] [CrossRef]
  50. Omer, A.; Zhuguo, M.; Zheng, Z.; Saleem, F. Natural and anthropogenic influences on the recent droughts in Yellow River Basin, China. Sci. Total Environ. 2020, 704, 135428. [Google Scholar] [CrossRef]
  51. Yan, Z.; Zhou, Z.; Liu, J.; Wang, H.; Li, D. Water use characteristics and impact factors in the Yellow River basin, China. Water Int. 2020, 45, 148–168. [Google Scholar] [CrossRef]
  52. Fan, X.; Shi, C.; Shao, W.; Zhou, Y. The suspended sediment dynamics in the Inner-Mongolia reaches of the upper Yellow River. Catena 2013, 109, 72–82. [Google Scholar] [CrossRef]
  53. Zhao, G.; Tian, P.; Mu, X.; Jiao, J.; Wang, F.; Gao, P. Quantifying the impact of climate variability and human activities on streamflow in the middle reaches of the Yellow River basin, China. J. Hydrol. 2014, 519, 387–398. [Google Scholar] [CrossRef]
  54. Xie, J.; Xu, Y.; Wang, Y.; Gu, H.; Wang, F.; Pan, S. Influences of climatic variability and human activities on terrestrial water storage variations across the Yellow River basin in the recent decade. J. Hydrol. 2019, 579, 124218. [Google Scholar] [CrossRef]
  55. Xie, P.; Xiong, A.-Y. A conceptual model for constructing high-resolution gauge-satellite merged precipitation analyses. J. Geophys. Res. Space Phys. 2011, 116, 116. [Google Scholar] [CrossRef]
  56. Ashouri, H.; Hsu, K.; Sorooshian, S.; Braithwaite, D.K.; Knapp, K.R.; Cecil, L.D.; Nelson, B.R.; Prat, O.P. PERSIANN-CDR: Daily Precipitation Climate Data Record from Multisatellite Observations for Hydrological and Climate Studies. Bull. Am. Meteorol. Soc. 2015, 96, 69–83. [Google Scholar] [CrossRef] [Green Version]
  57. Huffman, G.J.; Stocker, E.F.; Bolvin, D.T.; Nelkin, E.J.; Tan, J. GPM IMERG Final Precipitation L3 1 Day 0.1 Degree × 0.1 Degree V06. 2019. Available online: https://disc.gsfc.nasa.gov/datasets/GPM_3IMERGDF_06/summary?keywords=IMERG (accessed on 12 November 2020).
  58. Muñoz Sabater, J. ERA5-Land Hourly Data from 1981 to Present. 2019. Available online: https://cds.climate.copernicus.eu/cdsapp#!/dataset/reanalysis-era5-land?tab=form (accessed on 12 November 2020).
  59. Xie, P.; Joyce, R.; Wu, S.; Yoo, S.; Yarosh, Y.; Sun, F.; Lin, R. Reprocessed, Bias-Corrected CMORPH Global High-Resolution Precipitation Estimates from 1998. J. Hydrometeorol. 2017, 18, 1617–1641. [Google Scholar] [CrossRef]
  60. Satgé, F.; Ruelland, D.; Bonnet, M.; Molina, J.; Pillco, R. Consistency of satellite-based precipitation products in space and over time compared with gauge observations and snow- hydrological modelling in the Lake Titicaca region. Hydrol. Earth Syst. Sci. 2019, 23, 595–619. [Google Scholar] [CrossRef] [Green Version]
  61. Sun, R.; Yuan, H.; Liu, X.; Jiang, X. Evaluation of the latest satellite–gauge precipitation products and their hydrologic applications over the Huaihe River basin. J. Hydrol. 2016, 536, 302–319. [Google Scholar] [CrossRef]
  62. Sun, W.; Ma, J.; Yang, G.; Li, W. Statistical and Hydrological Evaluations of Multi-Satellite Precipitation Products over Fujiang River Basin in Humid Southeast China. Remote Sens. 2018, 10, 1898. [Google Scholar] [CrossRef] [Green Version]
  63. Wu, Z.; Xu, Z.; Wang, F.; He, H.; Zhou, J.; Wu, X.; Liu, Z. Hydrologic Evaluation of Multi-Source Satellite Precipitation Products for the Upper Huaihe River Basin, China. Remote Sens. 2018, 10, 840. [Google Scholar] [CrossRef] [Green Version]
  64. Tang, S.; Li, R.; He, J.; Wang, H.; Fan, X.; Yao, S. Comparative Evaluation of the GPM IMERG Early, Late, and Final Hourly Precipitation Products Using the CMPA Data over Sichuan Basin of China. Water 2020, 12, 554. [Google Scholar] [CrossRef] [Green Version]
  65. Jiang, S.; Ren, L.; Xu, C.; Yong, B.; Yuan, F.; Liu, Y.; Yang, X.; Zeng, X. Statistical and hydrological evaluation of the latest Integrated Multi-satellitE Retrievals for GPM (IMERG) over a midlatitude humid basin in South China. Atmos. Res. 2018, 214, 418–429. [Google Scholar] [CrossRef]
  66. Chen, H.; Yong, B.; Shen, Y.; Liu, J.; Hong, Y.; Zhang, J. Comparison analysis of six purely satellite-derived global precipitation estimates. J. Hydrol. 2020, 581, 124376. [Google Scholar] [CrossRef]
  67. Hirpa, F.A.; Gebremichael, M.; Hopson, T. Evaluation of High-Resolution Satellite Precipitation Products over Very Complex Terrain in Ethiopia. J. Appl. Meteorol. Clim. 2010, 49, 1044–1051. [Google Scholar] [CrossRef]
  68. CMORPH-BLD, CHIRPS, and PERSIANN-CDR in the upper Huaihe River basin, China. J. Meteorol. Res. 2020, 5, 1–18.
  69. Amjad, M.; Yilmaz, M.T.; Yucel, I.; Yilmaz, K.K. Performance evaluation of satellite- and model-based precipitation products over varying climate and complex topography. J. Hydrol. 2020, 584, 124707. [Google Scholar] [CrossRef]
  70. Yu, H.; Wang, L.; Yang, R.; Yang, M.; Gao, R. Temporal and spatial variation of precipitation in the Hengduan Mountains region in China and its relationship with elevation and latitude. Atmos. Res. 2018, 213, 1–16. [Google Scholar] [CrossRef]
  71. Hashemi, H.; Fayne, J.V.; Lakshmi, V.; Huffman, G.J. Very high resolution, altitude-corrected, TMPA-based monthly satellite precipitation product over the CONUS. Sci. Data 2020, 7, 1–10. [Google Scholar] [CrossRef]
  72. Zhang, T.; Li, B.; Yuan, Y.; Gao, X.; Sun, Q.; Xu, L.; Jiang, Y. Spatial downscaling of TRMM precipitation data considering the impacts of macro-geographical factors and local elevation in the Three-River Headwaters Region. Remote Sens. Environ. 2018, 215, 109–127. [Google Scholar] [CrossRef]
  73. Hu, Q.; Yang, D.; Wang, Y.; Yang, H. Accuracy and spatio-temporal variation of high resolution satellite rainfall estimate over the Ganjiang River Basin. Sci. China Technol. Sci. 2013, 56, 853–865. [Google Scholar] [CrossRef]
Figure 1. Location of the Yellow River Basin and spatial distribution of the gauge stations in the basin.
Atmosphere 11 01223 g001
Figure 2. Spatial distribution of the average daily precipitation of the gauge stations and precipitation products over the Yellow River Basin from 2001 to 2018: (A) CHIRPS, (B) CMORPH, (C) ERA5, (D) GSMaP, (E) IMERG, and (F) PERSIANN.
Atmosphere 11 01223 g002
Figure 3. Histogram and density curve (the black line) of the average daily precipitation of the gauge stations and the density curves of the products’ average daily precipitation over the Yellow River Basin from 2001 to 2018.
Atmosphere 11 01223 g003
Figure 4. Daily evaluation indices of the products at the gauge stations across the Yellow River Basin from 2001 to 2018.
Atmosphere 11 01223 g004
Figure 5. Boxplots of the evaluation indices of the products’ daily precipitation against the gauge observations across the Yellow River Basin from 2010 to 2018.
Atmosphere 11 01223 g005
Figure 6. Monthly evaluation indices of the products’ daily precipitation across all gauge stations.
Atmosphere 11 01223 g006
Figure 7. Seasonal evaluation indices of the products’ daily precipitation for all gauge stations: MAM (spring, March–May), JJA (summer, June–August), SON (autumn, September–November), and DJF (winter, December–February).
Atmosphere 11 01223 g007
Figure 8. Evaluation indices of the products at the different daily precipitation grades.
Atmosphere 11 01223 g008
Figure 9. Evaluation indices of the products at the different elevation levels.
Atmosphere 11 01223 g009
Table 1. Summary of the satellite-based and reanalysis precipitation products adopted in this study.
ProductsSpatial Coverage and ResolutionTemporal Coverage and ResolutionUnitDate SourceReferences
CMORPH V 1.0 BLD0.125E–359.875E, 9.875N–59.875S,
0.25° × 0.25°
1 January 1998–31 December 2019,
1 day
mm/hPMW, IR, gauge dataXie et al. [55]
PERSIANN-CDR180W–180E, 60S–60N,
0.25° × 0.25°
1 January 1983–30 September 2019,
1 day
mm/dayPMW, IR, GPCP monthly 2.5° V2.2Ashouri et al. [56]
IMERG V6 Final180W–180E, 90S–90N,
0.1° × 0.1°
1 June 2000–1 August 2020,
1 day
mm/hPMW, IR, gauge dataHuffman et al. [57]
ERA5-Land180W–180E, 90S–90N,
0.1° × 0.1°
1 January 1981–present,
1 h
mGauge dataMuñoz Sabater [58]
Gauge-adjusted GSMaP-NRT V6180W–180E, 60S–60N,
0.1° × 0.1°
1 April 2000–present,
1 h
mm/dayPMW, IRKubota et al. [21]
CHIRPS V 2.0180W–180E, 50S–50N,
0.05° × 0.05°
1 January 1981–present,
1 day
mm/dayCCD, TMPA 3B42, CFS precipitation, gauge dataFunk et al. [19]
Websites for downloading the datasets: Climate Prediction Center Morphing technique (CMORPH) V1.0 gauge-satellite blended (BLD): https://ftp.cpc.ncep.noaa.gov/precip/CMORPH_V1.0/BLD/0.25deg-DLY_EOD/GLB/, Precipitation Estimation from Remotely Sensed Information using Artificial Neural Networks (PERSIANN)-CDR): https://www.ncdc.noaa.gov/cdr/atmospheric/precipitation-persiann-cdr, Integrated Multisatellite Retrievals for Global Precipitation Measurement (IMERG) V6 Final: https://disc.gsfc.nasa.gov/, European Centre for Medium-Range Weather Forecasts (ECMWF) Reanalysis (ERA)5-Land: https://cds.climate.copernicus.eu/#!/home, Gauge-adjusted Global Satellite Mapping of Precipitation (GSMaP)-near-real-time product (NRT) V6: ftp://hokusai.eorc.jaxa.jp/, Climate Hazards Group Infrared Precipitation with Stations (CHIRPS) V2.0: https://data.chc.ucsb.edu/products/CHIRPS-2.0/global_daily/tifs/p05/.
Table 2. Continuous and categorical indices to quantify the performance of the precipitation products.
Evaluation IndicesEquationRange of ValuesPerfect Value
Correlation coefficient
(CC)
C C = i = 1 N ( S i S ¯ ) ( G i G ¯ ) i = 1 N ( S i S ¯ ) 2 i = 1 N ( G i G ¯ ) 2 [ 1 , 1 ] 1
Mean error
(ME)
M E = 1 N i = 1 N ( S i G i ) ( , + ) 0
Mean absolute error
(MAE)
M A E = 1 N i = 1 N | S i G i | [ 0 , + ) 0
Root mean square error
(RMSE)
R M S E = 1 N i = 1 N ( S i G i ) 2 [ 0 , + ) 0
Probability of detection
(POD)
P O D = h h + m [ 0 , 1 ] 1
False alarm ratio
(FAR)
F A R = f h + f [ 0 , 1 ] 0
BIAS B I A S = h + f h + m [ 0 , + ) 1
Equitable threat score (ETS) E T S = h + r h + m + f r
r = ( h + m ) ( h + f ) h + m + f + c
[ 1 / 3 , 1 ] 1
Notation: N is the total number of daily records, Si and Gi are the estimated and gauged precipitation, respectively, S ¯ and G ¯ are their mean values, respectively, and H, M, F, and C are the four events indicating whether the satellite has correctly detected an observed rainfall event (as summarized in Table 3), where H indicates that the observed rain event has been correctly detected by the satellite, M indicates that the satellite has missed the occurring rain event, F indicates that the satellite has incorrectly detected the occurring rain event as no-rain, and C indicates that there is no-rain and the satellite has detected none. Moreover, h, m, f, and c are the numbers of H, M, F, and C, respectively.
Table 3. Contingency table for the comparison of the observed and satellite-based rainfall events.
Satellite Products
RainNo-Rain
ObservationRainhit (H)miss (M)
No-Rainfalse (F)correct negative (C)
Table 4. Statistics of the average daily precipitation of the gauge stations and precipitation products across the Yellow River Basin from 2001 to 2018 (unit: mm).
SourcesMinimumMedianMeanMaximumStandard Deviation
Gauge stations0.381.351.312.910.43
CHIRPS0.331.401.353.650.44
CMORPH0.391.361.332.870.43
ERA50.411.661.664.160.58
GSMaP0.381.321.323.140.51
IMERG0.411.311.302.330.40
PERSIANN0.381.291.323.020.49
Table 5. Evaluation indices of the products’ daily precipitation at all gauge stations.
ProductCCMEMAERMSEPODFARBIASETS
CHIRPS0.270.102.067.060.270.540.590.08
CMORPH0.470.081.524.960.720.421.240.30
ERA50.480.351.664.960.980.683.040.03
GSMaP0.350.091.785.550.580.421.000.24
IMERG0.410.051.665.290.750.551.650.18
PERSIANN0.300.071.885.310.690.581.620.13
Publisher’s Note: MDPI stays neutral with regard to jurisdictional claims in published maps and institutional affiliations.