Review

Applications of GNSS-RO to Numerical Weather Prediction and Tropical Cyclone Forecast

1
National Space Science Center, Chinese Academy of Sciences (NSSC/CAS), Beijing 100190, China
2
Beijing Key Laboratory of Space Environment Exploration, Beijing 100190, China
3
School of Astronomy and Space Science, University of Chinese Academy of Sciences, Beijing 100049, China
4
Joint Laboratory on Occultations for Atmosphere and Climate (JLOAC), NSSC/CAS and University of Graz, Beijing 100190, China
5
Key Laboratory of Science and Technology on Space Environment Situational Awareness, CAS, Beijing 100190, China
*
Author to whom correspondence should be addressed.
Atmosphere 2020, 11(11), 1204; https://doi.org/10.3390/atmos11111204
Submission received: 10 October 2020 / Revised: 2 November 2020 / Accepted: 3 November 2020 / Published: 6 November 2020
(This article belongs to the Special Issue GNSS Meteorology and Climatology)

Abstract

:
The global navigation satellite system (GNSS) radio occultation (RO) technique is an atmospheric sounding technique that originated in the 1990s. The data provided by this approach are playing a consistently significant role in atmospheric research and related applications. This paper mainly summarizes the applications of RO to numerical weather prediction (NWP) generally and specifically for tropical cyclone (TC) forecast and outlines the prospects of the RO technique. With advantages such as high precision and accuracy, high vertical resolution, full-time and all-weather, and global coverage, RO data have made a remarkable contribution to NWP and TC forecasts. While accounting for only 7% of the total observations in European Centre for Medium-Range Weather Forecasts’ (ECMWF’s) assimilation system, RO has the fourth-largest impact on NWP. The greater the amount of RO data, the better the forecast of NWP. In cases of TC forecasts, assimilating RO data from heights below 6 km and from the upper troposphere and lower stratosphere (UTLS) region contributes to the forecasting accuracy of the track and intensity of TCs in different stages. A statistical analysis showed that assimilating RO data can help restore the critical characteristics of TCs, such as the location and intensity of the eye, eyewall, and rain bands. Moreover, a non-local excess phase assimilation operator can be employed to optimize the assimilation results. With denser RO profiles expected in the future, the accuracy of TC forecast can be further improved. Finally, future trends in RO are discussed, including advanced features, such as polarimetric RO, and RO strategies to increase the number of soundings, such as the use of a cube satellite constellation.

1. Brief Introduction to GNSS-RO Technique

The radio occultation (RO) measurement technique can be traced back to the mid-20th century, when Mars atmosphere detection missions, namely Mariner 3 and 4, were launched by scientists from Stanford and Jet Propulsion Laboratory [1]. With the deployment of a GPS constellation, it has been found that the RO technique could also be applied to Earth [2].

1.1. Principle of RO

The RO technique is based on the atmospheric refraction phenomenon, which occurs when a GPS/GNSS signal penetrates the Earth’s atmosphere and is then received by low-earth orbit (LEO) satellites behind the earth, as shown in Figure 1. During this refraction, the bending angle of the signal is considered a primary parameter in assimilation systems used for operational atmospheric research. The local and temporal atmospheric characteristics determine the bending angle α, which is principally subjected to the vertical gradient of the refractive index (n) along the penetrating path. The vertical gradient is associated with atmospheric parameters such as the temperature (T), total pressure (p), water vapor partial pressure (e), and electron number density [3]. This relationship can be expressed in the form of an empirical equation:
N = n × 10 6 = 77.6 p T + 3.73 × 10 5 e T 2
where N is the refractivity and n is the refractive index. Based on the assumption of local spherical symmetry, the bending angle can be transformed to refractive index n via Equation (2), i.e., the Abel transformation.
n ( r ) = exp [ 1 π a α ( x ) d x x 2 a 2 ]
where n (r) is the refractive index profiles, r is position vector, α is the bending angle, and a is the impact parameter [3].

1.2. RO Missions

The successful GPS/Meteorology (GPS/MET) experiments conducted in 1995 ushered in the era of RO application for atmospheric measurements, given that these experiments helped derive 0–60 km atmospheric parameter profiles [5]. Subsequently, scientists performed several studies on GPS/MET RO meteorological data and compared the results with those obtained using radiosonde [6] and Lidar [7]. These studies have confirmed the accuracy of RO data, although GPS/MET provided only a small amount of RO data. Therefore, a series of RO missions have been scheduled for the following years. These missions include Challenging Mini-satellite Payload (CHAMP) [8,9]; Gravity Recovery and Climate Experiment (GRACE) and Gravity Recovery and Climate Experiment Follow-on (GRACE-FO) [10]; Scientific Application Satellite-C/D (SAC-C/D) [11]; TerraSAR-X; TanDEM-X; Constellation Observing System for Meteorology, Ionosphere, and Climate (COSMIC/COSMIC-2, also known as FORMOSAT-3/ FO RMOSAT-7); the Meteorological Operational satellite Programme-A/B/C (MetOp-A/B/C); FengYun-3C/D (FY-3C/D) (Sun, 2018); Communications/Navigation Outage Forecasting System(C/NOFS); Korea Multi-Purpose Satellite-5 (KOMPSAT-5); the Indian Space Research Organization spacecraft Ocean Satellite-2 (OceanSat-2); and Spanish PAZ (peace in Spanish). A few missions have been retired, such as COSMIC-1, GRACE, CHAMP, and SAC-C/D, and some missions will be completed by the end of 2020, such as FY-3C, TanDEM-X/TerraSAR-X, KOMPSAT-5, OceanSat-2, and C/NOFS. More missions have been planned for the future such as MetOp Second Generation (MetOp-SG), FengYun-3E/F/G/H (FY-3E/F/G/H), TerraSAR-X Next Generation (TSX-NG), Jason Continuity of Service-A/B (JASON-CS-A/B, also known as Sentinel 6A/6B), and Meteor-MP N1/N2. By 2025, the planned operational missions will provide approximately 14,700 RO soundings per day [12].
Herein, we introduce three primary missions accounting for most of the RO data: COSMIC, MetOp, and FY-3 series.
(1)
COSMIC. On 15 April 2006, the first satellite constellation COSMIC designed for RO measurements was launched. It marked the beginning of the wide use of RO data in atmospheric and ionospheric sounding research from an operational standpoint [13]. Since then, COSMIC has provided 1500–2000 soundings per day globally, significantly contributing to numerical weather prediction (NWP) and meteorological studies [14]. Later, its follow-up mission was COSMIC-2, launched in June 2019; COSMIC-2 has provided approximately 5000 soundings per day over 35° N–35° S, mainly for tropical cyclone (TC) forecasting [15]. Such data are useful for short- and medium-range forecasts in the tropics, given the more accurate measurements of the temperature, humidity, and wind field [16]. The European Centre for Medium-Range Weather Forecasts (ECMWF) started to assimilate COSMIC-2 data at a rate of approximately 5000 soundings per day since March 2020.
(2)
MetOp. MetOp-A/B/C are three polar-orbiting meteorological satellites that form the space segment component of the overall EUMETSAT Polar System (EPS). MetOp-A was launched in 2006, and its RO data were found to contribute to weather forecasts up to 10 days ahead. This mission was followed by MetOp-B and C. Since March 2019, the ECMWF started to assimilate the bending angle from MetOp-C, with a quality similar to both MetOp-A and B measurements. Currently, the MetOp constellation can provide approximately 2000 soundings per day. As a next step, the EUMETSAT group has planned to launch six MetOp-second-generation (MetOp-SG) satellites. MetOp SG-A is scheduled for launch at the end of 2022.
(3)
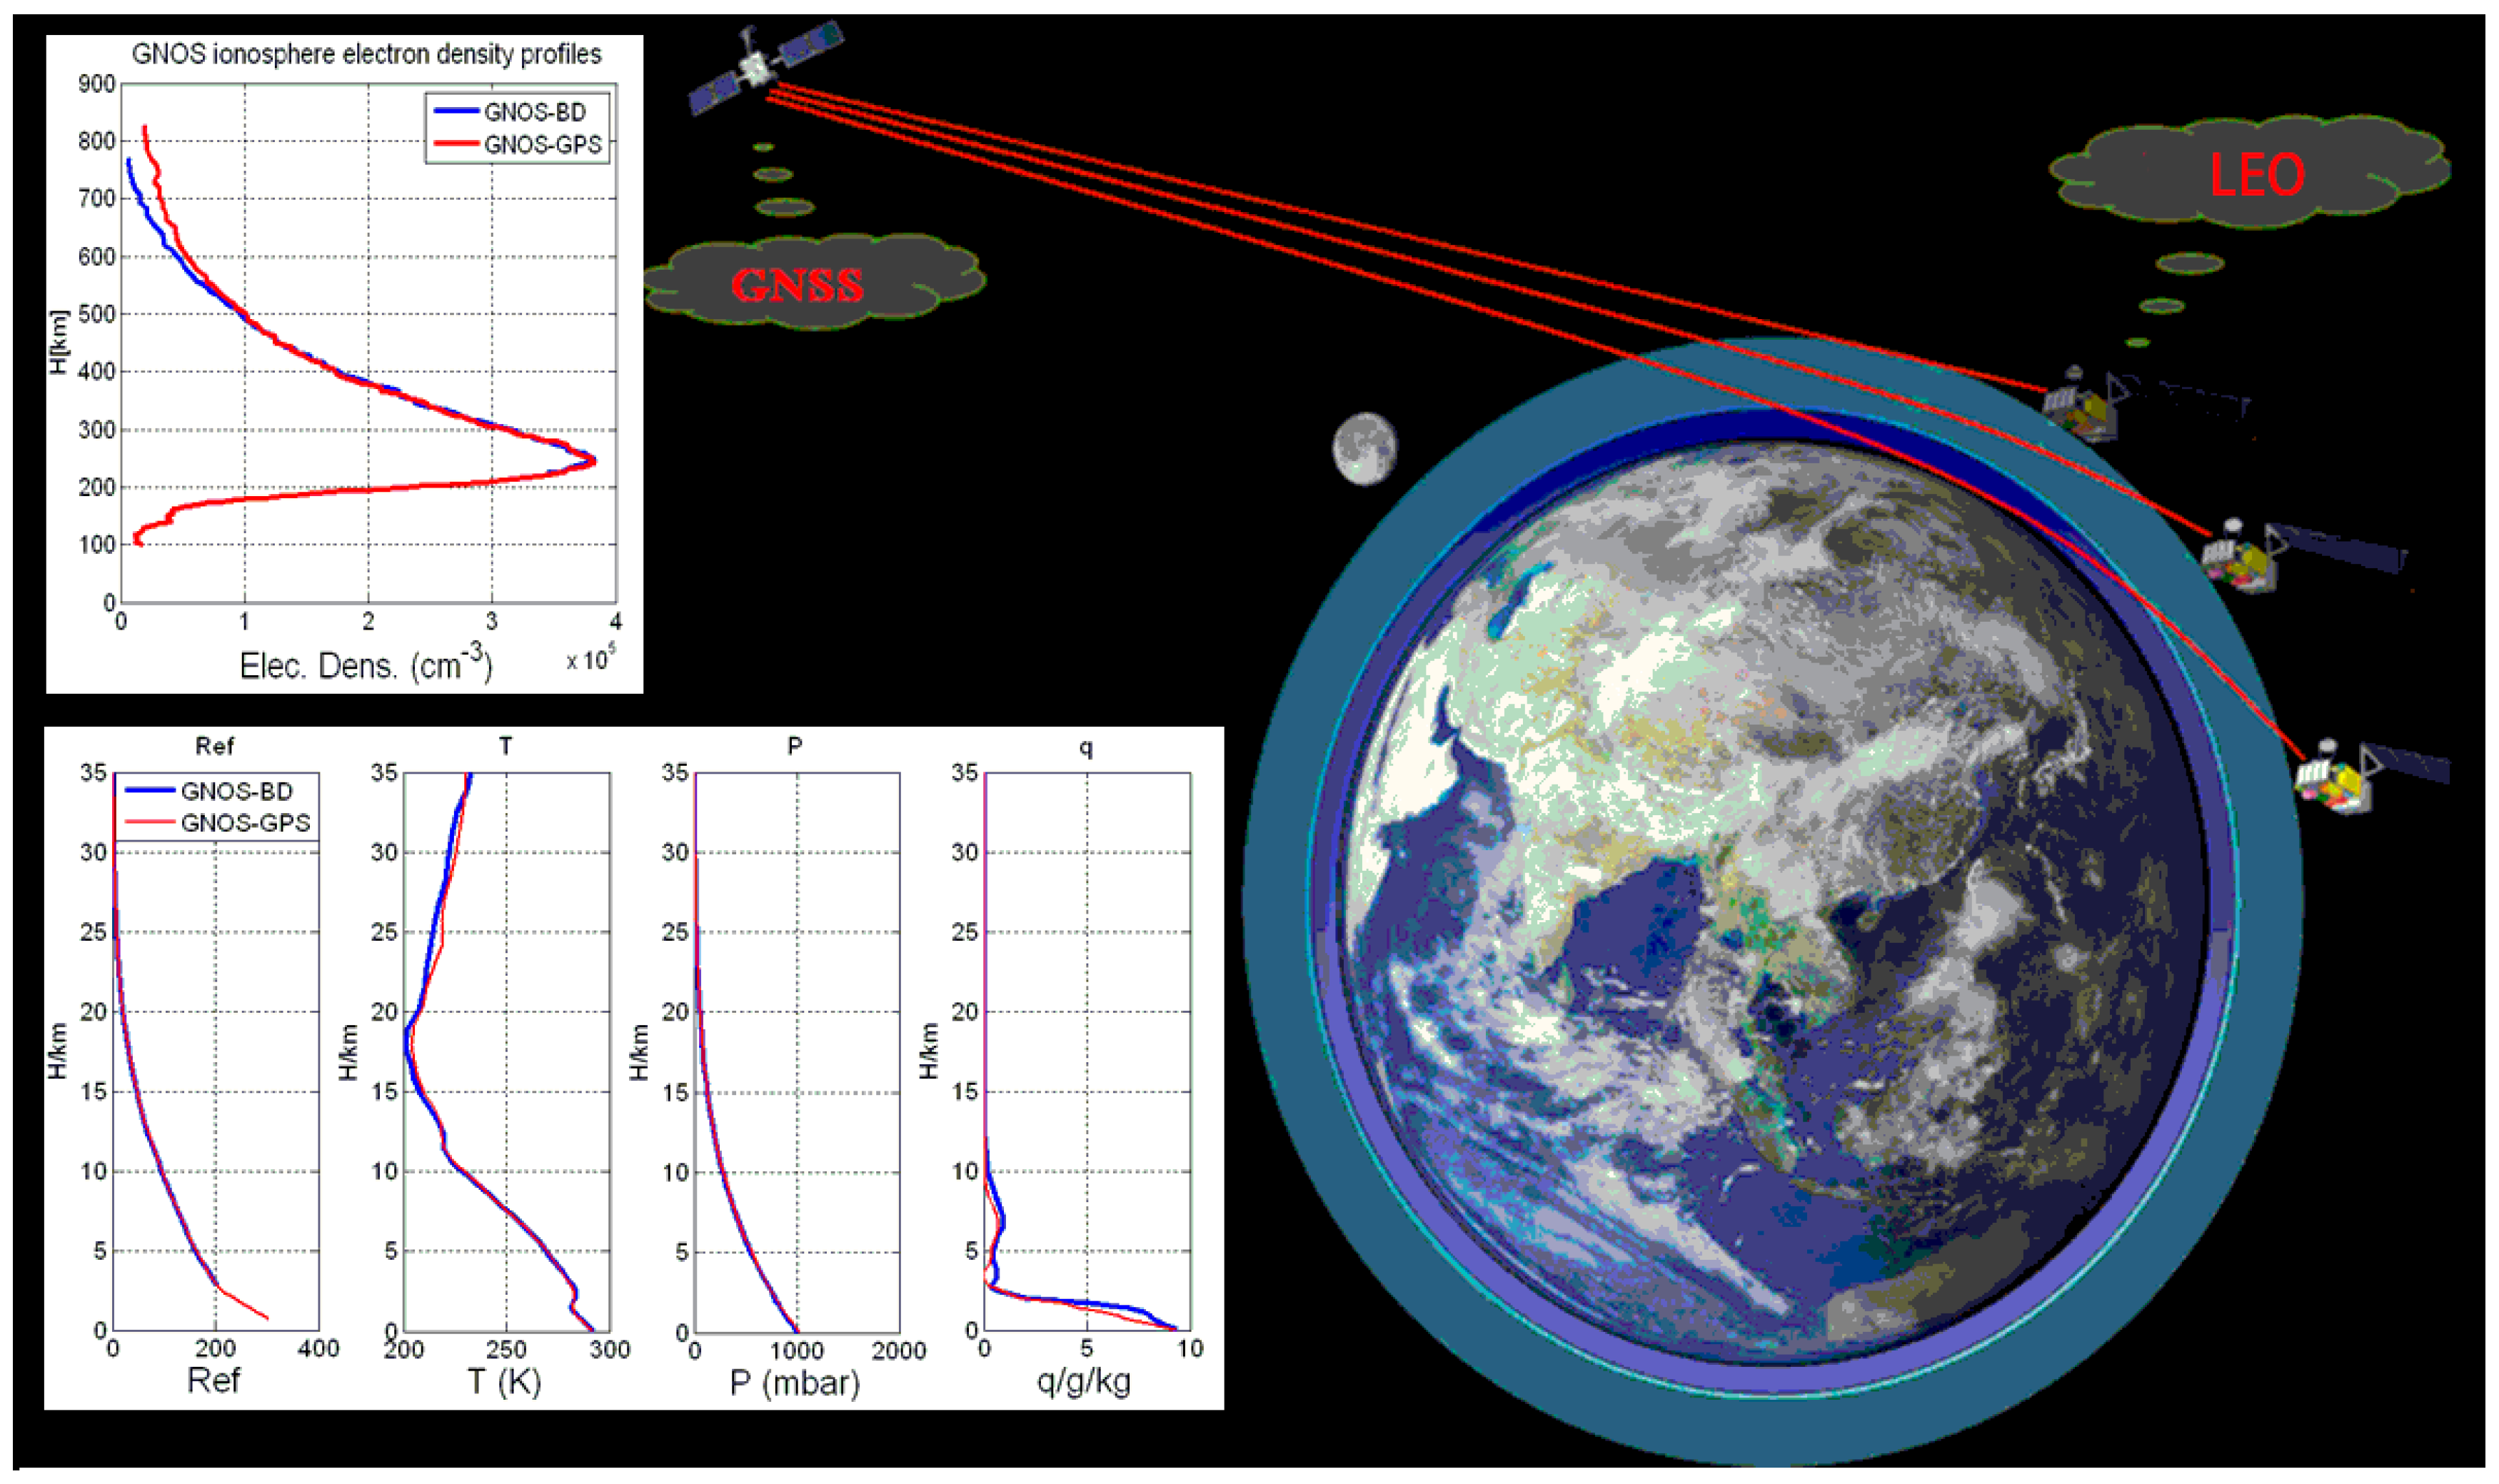
FY-3C/D. FY-3C and D were launched in 2013 and 2017, respectively. The GNSS occultation sounder (GNOS) receiver onboard the FY-3C/D satellites is the first GPS and BeiDou-compatible sounder [17,18,19,20]. FY-3C can provide approximately 450–500 RO soundings per day for NWP. The FY-3D launched in 2020 can provide even more RO soundings, approximately 1000 per day. The GNOS-RO data have been used to study climate and TCs [21,22]. GNOS data have been assimilated into the operational NWP system of the ECMWF, Deutscher Wetterdienst (DWD), and Met Office [23]. Moreover, the FY-3-series satellites contain FY-3E/F/G/H and FY-3R, which are intended for rainfall observation. These missions are expected to be launched by 2025 and will provide ten years of continuous RO data. An advanced GNOS receiver (GNOS II) has been designed for the FY-3E satellite, making FY-3E applicable for monitoring sea waves as well [24].
With the rapid development of GNSS, such as the Chinese BeiDou Satellite (BDS), Russian GLONASS [25,26], European Galileo [27], GPS, and more LEO satellites deployed with GNSS signal receivers, the frequency and number of RO soundings are expected to improve remarkably [17,18,28,29,30].

1.3. Advantages of RO

RO measurements have many advantages, including global coverage, high accuracy and precision, superior vertical resolution, and a full-time and all-weather observation. Near the top of the tropopause, the departure of the RO soundings with respect to the temperature/pressure/ geopotential temperature is approximately 0.7 K/0.15%/1.4 K. The departure further decreases toward the lower troposphere because of the increased information in the background [31]; its vertical resolutions in the stratosphere and troposphere are approximately 1.5 km and 0.2 km, respectively, even reaching 0.1 km near the surface [32]. RO measurements have a global coverage, particularly including sights over the polar region and oceans, which are blind spots of other detection approaches such as radar and radiosonde [33]. Additionally, RO signals loaded on the L1 (1575.42 MHz) and L2 (1227.60MHz) bands, whose wavelengths are sufficiently long to avoid appreciable attenuation by rain [34]. Therefore, RO measurements are minimally contaminated by aerosol, clouds, and precipitation, thus ensuring a full-time and all-weather observation. RO is a self-calibrated remote sensing technique. Once deployed on an orbiting satellite, the RO sensor requires no further calibration. Hence, RO can provide long-term steady data. Furthermore, an RO measurement is considered a calibration standard [35] and can complement other observations. Given that RO data are independent of the missions and satellites, the data obtained from the different missions always have a high degree of consistency. Owing to this unified benchmark, RO data complement each other well [15,36].
This paper focuses on the impacts of RO measurements on the NWP and TC forecasts. The rest of this paper is organized as follows. In Section 2, we introduce the status quo of the application of RO to NWP, including a sensitivity analysis and discussions on the amount of RO data. Section 3 presents the positive effects of RO data on TC forecasting through some typical studies. The advances in RO and its prospects are discussed in Section 4. Finally, Section 5 presents the conclusions drawn from our review.

2. Research and Applications of RO in NWP

This section reviews studies that applied RO to NWP. Section 2.1 details the progress made using RO in NWP, including the first assimilation of RO data in the assimilation systems of different institutes, and the sensitivities of the RO quality to height and region. Section 2.2 introduces a simulation study that focuses on the impact of the amount of RO data. Moreover, the total amount of RO data expected in the future is estimated.

2.1. Progress in the Application of RO to NWP

Given the advantages described in Section 1.3, RO measurements can be applied to operational NWP and climate monitoring. Initially, RO data were operationally assimilated into the NWP systems of the ECMWF, NCEP, and Met Office. The results showed that the RO measurements have a significant impact on the NWP. On 12 December 2006, the ECMWF started to assimilate RO data obtained from COSMIC operationally. As shown in Figure 2, there is a significant reduction in the mean biases for short-range forecast and analysis in the southern hemisphere [37]. According to [38], after the NCEP incorporated the COSMIC RO data into their assimilation system, the anomaly correlation scores at 500 hPa for the southern hemisphere improved by 4.5 h in a seven-day prediction period. A similar result was obtained in [39] when Met Office assimilated the refractivity of GHAMP and GRACE into their operational forecast system. The forecast was improved significantly for the upper troposphere and lower stratosphere (UTLS) region in the southern hemisphere.
Subsequently, the quality of the RO data was tested gradually. To test the sensitivity of RO data quality to the geopotential height and hemisphere, the authors of [40] studied the effect of COSMIC RO data at different geopotential heights on the ECMWF forecast via comparison experiments with and without RO data. The group without the RO data was called CTRL, whereas the group with the COSMIC RO data was called COS1. The fractional reduction in the root mean square (RMS) means the impact of the RO measurement on the NWP, which is defined as (RMSCTL − RMSCOS1)/RMSCTL, where RMSCTL and RMSCOS1 denote the RMS error for the CTL and COS1, respectively. As shown in Figure 3 and Figure 4, the RO measurement improves the forecast accuracy at heights of 100 hPa and 200 hPa in both the northern and southern hemispheres, which can be attributed to the high vertical resolution of RO in the UTLS region. However, the results for heights of 1000 hPa and 500 hPa are neutral. This is because, in the troposphere, there are already many conventional observations, such as radiosonde and radar, and the signal-to-noise ratio (SNR) of RO data toward the troposphere is relatively low. A comparison of Figure 3 and Figure 4 shows that the RO measurement performs better in the southern hemisphere than in the northern hemisphere. This is because the emergence of RO data increased the total number of observations in the southern hemisphere, where oceans dominate and where conventional observations, such as radiosonde and ground-based observations, are unavailable. Moreover, the RO signal is minimally contaminated by clouds and precipitation, making it suitable for detecting atmospheric profiles above oceans. Thus, RO measurements provide more accurate atmospheric parameters than other observations in the southern hemisphere, such as meteorological satellites based on the detection in the visible and infrared ranges, where the clouds and precipitation could contaminate signals in this band. Many studies also support the superior performance of the RO measurement for NWP [36,41,42,43,44]. The degradation over day 6 in Figure 3a or Figure 4a may be a general phenomenon for many observations associated with synoptic systems in the troposphere, as these synoptic systems disappear within six days.
In addition to the height and region, the amount of RO data is considered in a further sensitivity analysis. The authors of [45] studied the impact of the amount of RO data available at that time at different heights using the NWP assimilation system. As shown in Figure 5, the forecast error reduces more in the stratosphere above 200 hPa than in the troposphere below 500 hPa when assimilating RO data. As shown in Figure 5a–d, at heights of 50, 100, 150, and 200 hPa, increasing the amount of assimilated RO data decreases the relative forecast error. This is also consistent with the results, shown in Figure 3 and Figure 4, in that the improvement for the southern hemisphere is more significant than for the northern hemisphere and the tropics. RO measurements reduced the forecast error by approximately 10% with assimilating RO data of only 5%. However, at 1000 hPa and 500 hPa, as shown in Figure 5e,f, RO measurements have a modest impact on the forecast, due to the relatively low SNR in the troposphere. Nevertheless, in actual operation, every observation’s weight metric varies with the height. Therefore, the impact of RO measurements on the NWP is positive.
The authors of [44] analyzed the height at which the RO measurements have the most significant impact and found that the quality of the RO data in the lower troposphere is not ideal, particularly below a height of 2 km. In contrast, RO has a pronounced positive impact in the UTLS region, which is approximately in the height range of 10–20 km. Thus, in an operational NWP assimilation system, the range between 10 and 20 km is the main region where RO data yield optimal results.
To assess the impact of RO measurement on NWP, the authors of [44] evaluated the forecast error reduction of various observations assimilated by the ECMWF. Figure 6 shows that, while accounting for only approximately 7% of all observations, RO data rank 4th in terms of the contribution, reducing the error by approximately 10%. Notably, the assimilated RO data in the 2014 ECMWF assimilation system are estimated to be less than 3000 soundings per day. With such a modest amount and yet a tremendous impact on the NWP, the RO data are deemed promising.

2.2. Impact of the Amount of RO Data on NWP and Future Trends

As a small amount of RO observation data has an impressive impact on the NWP, the authors of [46] analyzed the upper limit of the amount of RO data that benefits NWP. The authors of [46] simulated the impact of the number of assimilated RO observations varying from 2000 to 128,000 on NWP using the ensemble of data assimilation (EDA) approach, namely the OSSE (Observing System Simulation Experiment). The operational ECMWF NWP analysis is used as the proxy of the truth to simulate the bending angle.
Figure 7 shows that increasing the amount of assimilated RO data leads to a continuous reduction in the EDA spread, a parameter that estimates the forecast error. Specifically, Figure 7a–c indicate that, at heights of 500 and 100 hPa, the simulated temperature and geopotential height show better results in the southern hemisphere than in the tropics and the northern hemisphere. Furthermore, the higher the geopotential height, the greater the error reduction. For example, the statistical errors, shown in Figure 7a,b, at 500 hPa decrease by approximately 20%, whereas they decrease by approximately 50% at 100 hPa. Notably, the maximum error reduction is 80% when using 128,000 observations, and impact saturation has not been reached, i.e., if the amount of RO data keeps increasing, the forecast error will keep decreasing. However, 128,000 is far from achievable, as the total amount of RO observations in 2020 is only approximately 10,000. Therefore, the greater the amount of RO data, the better the accuracy of the NWP.
Another notable result in Figure 7 is that half of the maximum impact can be attained using only 16,000 RO observations, a more reachable number. However, the current RO data in the assimilation system are far from reaching 128,000 and 16,000. So far, the ECMWF could assimilate approximately 5000 soundings per day from the seven missions. As listed in Table 1, these missions include COSMIC-2, MetOp-A/B/C, FY-3C/D, TanDEM-X, TerraSAR-X, KOMPSAT-5, and PAZ. The total amount of RO data received by these missions is approximately 9000; however, the actual received number is only approximately 6000. After the quality control, there are only 5000 soundings left in the assimilation system. As for the NCEP Global Data Assimilation System (GDAS), there were 2000–3000 RO soundings per day until 2019, according to [47], as shown in Figure 8.
The amount of RO observations will thrive in the future. According to the OSCAR website, there were approximately 10,000 soundings per day in 2020. Commercial RO data from Spire and other companies are not included. As shown in Figure 9, the possible amount of RO observations may reach 14,700 soundings per day in 2025. Moreover, it may reach a maximum of approximately 18,400 soundings per day in 2027. According to [46], if the assimilated number reaches 16,000 soundings per day, the error in the NWP can be reduced by 25% compared with the error in 2013. This can probably be achieved by 2027.

3. Research and Applications of RO to TC Forecast

This section details how the RO measurement benefits TC forecast. Section 3.1 states the current status of TC forecast. Section 3.2 presents case studies that demonstrate how the RO measurement impacts TC forecast. In Section 3.3, we discuss how the assimilation operator, mainly the non-local excess phase operator, optimizes the TC forecast.

3.1. Status of TC Forecast

NWP is one of the primary methods for predicting the TC; however, it is hard to improve the accuracy. The authors of [49] investigated the predictions of TC using global NWP models, including Climate Change Canada’s Global Environmental Multiscale Model (CMC), European Center’s Medium-Range Weather Forecast Global Model (ECMWF), American National Center’s Environmental Prediction Global Forecast System (GFS), and Met Office Global Model (UKMET), based on three verification metrics defined in [50], namely, the hit, false alarm, and miss. Here, the metric hit means a successful prediction whose location is within 5° against the target TC and whose time is within 24 h against the target TC; the metric miss means a failed prediction; the false alarm indicates a successful TC forecast modeling, but with incorrect time and track. As shown in Figure 10, all the institutes performed suboptimally, as most of the predictions fell in the low critical success index portion with a low detection probability, which is far from the perfect forecast.

3.2. Effect of RO Data on TC Forecasts

Theoretically, TCs form in the environment of reduced wind shear, a deep layer of warm sea surface (temperatures above 27 °C), enhanced vorticity, humidity, and deep convection. These conditions are based on the TC forecast model [51]. If these initial conditions in the TC forecast model, such as wind, temperature, and water vapor, are more accurate, the TC forecast will be improved.
The RO data are conducive to improving the accuracy and precision of TC prediction via enhancing the accuracy of the intensity and track of the TCs. Most TCs are generated above oceans, and the inner structures of a TC are moist. The conventional measurements, such as radiosonde and some of the satellites, are either incapable of detecting the atmospheric systems above oceans or inaccurate in detecting the water vapor. As mentioned in Section 1.3, the RO signals can propagate through clouds and obtain water vapor condition above the oceans. Thus, this feature makes the RO measurements feasible for TC forecasts.
Many studies show that RO measurements have a positive impact on the TC forecast [52,53,54,55,56,57,58,59]. The most famous one is the NCAR (National Center for Atmospheric Research) 4-Day forecast of Ernesto in 2007. As shown in Figure 11, in the second and third column, the generation of hurricane Ernesto is successfully predicted in the group with the RO data, whereas the group without the RO data failed.
This case was further studied in [61]. Because of the strong correlation between T, e, and p as in Equation (1), while solving equations, it is difficult to know which parameter induces the error. Thus, it is difficult to accurately estimate the error RO data brings to the TC forecast. The authors of [61] solved this problem using an ensemble mean assimilation system. In the paper, one observation set (ObS) using the NCEP reanalysis was set, and three experiments were set: CTRL, RO, and RO6km. The CTRL assimilated the conventional measurements, such as those obtained from radiosonde, aircraft, and satellite cloud drift wind; the RO assimilated all the RO refractivity profiles; and the RO6km assimilated only the RO refractivity profiles above a height of 6 km. In Figure 12a, the central sea level pressure in the RO is approximately 15 hPa lower than those in CTRL and RO6km, which makes the TC in RO stronger. This is because the assimilated RO data provided a more accurate pressure field and helped adjust the initial wind field through forecast multivariate correlations between the provided parameters RO and wind, which affects the cyclone’s intensification. In Figure 12b, the track error of the RO is approximately in the range of 30–50 km, which is lower than that in other groups. From the image of the total column cloud liquid water shown in Figure 12c, the RO prediction is similar to the satellite infrared cloud image, which verified fact that RO data provide better measurements of the water vapor field. Therefore, the RO data have a positive impact on the TC prediction. Notably, the results of RO6km are neutral, emphasizing the importance of RO data below 6 km. As mentioned in Section 2, the main benefits of RO for the NWP are in the height range of 10–20 km. However, for the TC prediction, RO data below 6 km are crucial as they provide more accurate initial conditions of the water vapor and help adjust wind analysis above oceans.
Similarly, the authors of [62] investigated the impact of COSMIC RO data on the track of the super cyclone Gonu. Considering the error of the lower troposphere, they assimilated only the RO data in the UTLS region. The results show that the 72–96 h forecast of Gonu’s track was improved because the RO data provided more accurate temperature information in the UTLS region. The energy for the development of a mature TC comes from the cold air above the TC. Therefore, assimilating RO data in UTLS region can improve the TC forecast in the later stage. The above two studies emphasized that RO data both in the UTLS region and below 6 km are essential to TC prediction.
To further study how RO measurements help improve the accuracy of TC forecast, the authors of [63] used RO data to simulate the vertical structure of forty-two cases of TCs formed over the North Atlantic basin during 2002–2010. The TC parameters were statistically analyzed as a function of the distance from the eye of the cyclones. In comparison with the ECMWF reanalysis, the result confirmed that the RO observation could resolve the major characteristics of the TC structure—the eye and eyewall; the inflow, which is the mark of a mature TC; the outflow layers; and even the rain bands at a confidence level of 95%. The relative humidity of the simulated rain bands 200 km from the center, shown in Figure 13, is approximately 25% higher than ECMWF reanalysis. However, the location of the rain bands may not be that distinct because of the low horizontal coverage of the RO water vapor data. Therefore, the improvement in the TC forecast can be attributed to assimilating RO data.

3.3. Effect of RO Assimilation Operator on TC Forecasts

To further improve the accuracy of TC forecast using RO measurements, the forecast model should consider the assimilation approaches and associated operators in the assimilation system. The popular assimilation approaches include 3D-Var, 4D-Var, and ensemble Kalman filter [64]. In terms of the assimilation operator, as listed in Table 2, the RO provides two measurements: the refractivity and the bending angle. These two can be used to derive several assimilation operators. The refractivity includes the local refractivity, non-local refractivity [65], and non-local excess phase; the bending angle includes the 2D/3D ray tracer [66] and local bending angle [67]. On the one hand, the first operator of the bending angle, i.e., the ray tracer, is computationally expensive. The local bending operator of the bending angle is theoretically equivalent to the local refractivity operator because the bending angle can be transformed to a refractive index via Abel transformation. However, the local bending angle is more accurate and has a wider range [67]. On the other hand, the local refractivity used to be the most popular operator for avoiding complex computations [68]. In the assimilation system for TCs, a better choice is the non-local excess phase operator (EPH), as the high moisture environment in the inner regions of a TC results in strong local-refractivity horizontal gradients, which break the spherically symmetric atmosphere assumption, resulting in multipath effects [69]. In such circumstances, the local refractivity would induce significant representativeness errors. Nevertheless, the EPH can avoid this issue, as proven in many papers [68,70,71,72,73]. Here, the non-local value represents a more accurate value estimated under the mathematical assumption. The EPH is a virtual value obtained by integrating the refractivity along an arbitrary trajectory, which passes the tangent point closer to the actual ray path [74].
Based on ten tropical cyclones that occurred during 2008–2010, the authors of [75] investigated the impact of RO measurements on the tropical cyclogenesis using the WRF data assimilation system. The study demonstrated that the EPH can help improve the probability of successful TC predictions from 30% to 70%, whereas the local refractivity operator (LOC) improved this value by only 10%. A case study on the typhoon Nuri revealed that the experiment using the EPH shows a higher moisture content near the ocean surface and vertical motion, as indicated by the red circle in Figure 14a. Additionally, the dashes in Figure 14b indicate a stronger mid-level vorticity development in the EPH experiment against the LOC experiment. Therefore, the non-local excess phase operator is a better assimilation operator.
All the above studies prove that assimilating the RO data can promote the accuracy of TC forecast. RO data below 6 km are essential as they play an important role in the initial stages of TC genesis. The RO data in the UTLS region have a positive influence on the forecast over three days owing to their high vertical resolution. Through the vertical studies of TC, RO data provide a more accurate initial field above the sea surface, including sufficient water vapor, which restores the dynamic structures of TCs such as the eyewall and rain bands. Therefore, the TC forecast is improved significantly owing to the RO measurement. However, the current number of RO measurements is insufficient. The planned missions, such as COSMIC-2, MetOp, and FY-3, are expected to increase the daily number of RO soundings in the future. This will bring remarkable improvements for TC prediction [76].

4. Outlook

This section introduces some new perspectives in the application of the RO technique in NWP and TC forecast. It is worthwhile to exploit other potential features of the GNSS signal, particularly to increase the frequency and amount of RO soundings. There are trends toward increasing the amount of RO soundings and expanding the new features of the RO. Section 4.1 illustrates three emerging strategies to overcome the insufficiency in the amount of RO data, including multi-system-compatible RO receivers, commercial cube satellite constellation, and the airborne RO technique. Section 4.2 introduces two advanced RO features, including the polarimetric RO technique and multi-feature receiver.

4.1. Trends Toward Increasing the Amount of RO Soundings

4.1.1. Multi-System-Compatible RO Receivers

The authors of [47] demonstrated that there is no saturation in NWP, even with 128,000 RO observations assimilated. However, there may be only 18,400 soundings per day in 2027, as estimated in Section 2.2. Therefore, the frequency of RO soundings should be enhanced. Other than more missions, a multi-system-compatible RO sounder is an economical and efficient strategy to improve the frequency of RO soundings.
Table 3 lists some of the primary GNSS sounders in operation or in the planning stage. The popular TriG (Tri-GNSS) receiver on COSMIC-2 and GRACE collects signals from GPS and GALILEO with approximately 500 soundings per day per satellite. The next-generation, TriG (JASON-CS), can receive additional data from GLONASS, with the amount of data reaching 1000 soundings per day. According to [77], the next-generation TriG will be compatible not only with GPS, Galileo, and GLONASS, but also with BeiDou, DORIS (The Doppler Orbitography by Radio positioning Integrated on Satellite), Japan’s QZSS (Quasi-Zenith Satellite System), and IRNSS (India’s Regional Navigation Satellite Systems). Moreover, China’s GNOS (GNSS Occultation Sounder) onboard FY-3C/D is the first BeiDou and GPS-compatible RO sounder [17,18,19,20]. With the complete deployment of BeiDou satellites, the soundings have reached 1000 soundings per day. Furthermore, the next sounder for MetOp, namely the RO Sounder, may increase the tracked GNSS constellation to three constellations. More multi-system-compatible RO receivers are required. With the development of multi-system RO receivers, a further increment in the amount of RO soundings is foreseen. As a result, this will further improve the NWP and TC forecast.

4.1.2. Commercial Cube Satellite Constellation

As discussed in Section 2.2, 16,000 soundings can be a closer target. For such a substantial number, at least one hundred satellites with RO receivers are required. Fortunately, RO receivers are inexpensive, light, small, and less power consuming. RO receivers have been additional payloads on many satellites such as CHAMP, SAC-C/D, and GRACE. This approach has been commercially applied to cube satellites (10 cm × 10 cm × 30 cm and 4.7 ± 0.1 kg) by companies, such as Spire, GeoOptics, and PlanetIQ, to establish a constellation network for providing critical weather data to NWP, ship, and aircraft tracking. Here, only the part regarding NWP of our interest is introduced.
Spire is one of the largest commercial producers of RO measurement systems. Up to 2019, Spire launched more than 80 nanosatellites in LEOs for full global sampling [78], and the sounder Lemur-2 on these cube satellites can receive signals from GPS, GLONASS, QZSS, and Galileo, providing approximately 6000 RO profiles per day. According to the initial assessment and test run in the Met office NWP system, as reported in [79], Spire’s data are as good as the operational GNSS-RO data below 30 km. The research also showed that assimilating Spire data as a replacement of MetOp-C data into the NWP system can further improve the forecast.
The Climate Community Initiative for Continuing Earth Radio Occultation (CICERO) is another cube satellite constellation project designed as a follow-up and augmentation for COSMIC by GeoOptics Cooperation. Up to 2017, 48 cube satellites have been deployed in orbit [80]. If the data from these projects can be incorporated into the operational NWP assimilation systems, a considerable improvement will be seen in the accuracy of the NWP and TC forecast.

4.1.3. Airborne RO Technique

To some extent, most of studies we reviewed were the Spaceborne RO (SRO) technique, because the receivers are onboard LEO satellites. The GNSS also has a ground-based observation, which provides its signal delays as a source of the water vapor contents for NWP, such as zenith total delay (ZTD) and integrated water vapor (IWV) [81]. However, in the case of receivers onboard aircrafts, the Airborne RO [82] technique is employed. The ARO is a solution to the shortcomings of the SRO, i.e., the insufficient observations and random temporal and spatial distributions. For instance, in the face of a target location where a TC is generated, the obtained profiles from the SRO are sparse. The ARO addresses this issue by maneuvering the aircraft to the target location and by collecting the samples several times. The drawbacks of the ARO are the less stable receiver platform and the low SNR of the current antennas.
The authors of [83] used the ARO to study Hurricane Karl in 2010 and the heavy rainfall over Colorado in September 2013. The results showed improvement in the initial moisture and pressure field measurements, resulting in a better 36 h rainfall forecast. That dissertation reported that if all U.S. continental flights were to set up this receiver, the estimated RO soundings could reach 3000 every 12 h. If the drawbacks of the ARO can be solved, it will be a step forward in the application of RO in NWP and TC monitoring.

4.2. Trends Toward Expanding New Features of RO

4.2.1. Polarimetric RO Technique

A new feature of the RO is the detection of heavy precipitation via polarimetric RO (PRO). Although the RO profiles have a high vertical resolution and are minimally affected by clouds and precipitation, they have a low horizontal resolution of approximately 100 km. If the horizontal resolution can be improved, it will benefit short-/medium-range weather forecasts such as rainfall and TC forecasts. The PRO technique aims to address the low horizontal resolution of RO. The approach involves deploying a closely spaced RO satellite train for a denser sampling. This strategy provides near-simultaneous observations of the water vapor profiles surrounding the target heavy-precipitation region.
The PRO receivers launched in February 2018 are onboard the Spanish PAZ (peace in Spanish) spacecraft, and a concept-of-proof experiment has been carried out [84]. The authors of [84,85,86] studied the probability of the train constellation in encountering heavy-precipitation regions, and possible orbital strategies for implementing such a constellation. If the concept can be proven, the precipitation forecast can be improved. This will be conducive to the precipitation forecasts in NWP and TC monitoring.

4.2.2. Multi-Feature GNSS Receiver

In addition to navigation and RO, another function of the GNSS signal is GNSS reflectometry (GNSS-R), which can be used for observing oceans, ice, soil, and other geophysical parameters. This feature is also important for TC and NWP as it provides a sufficient wind field measurement, particularly over oceans. So far, this spaceborne GNSS-R technique has been implemented in The Cyclone Global Navigation Satellite System (CYGNSS) mission [87,88], Jason-2/OSTM satellite, OceanSat-2 [89], and Disaster Monitoring Constellation (DMC) [82].
The GNOS sounder onboard FY-3E integrated the RO function and GNSS-R function in one receiver to save space and power for the satellites. Thus, the sounder measures the ionosphere, neutral atmosphere, sea wave, and wind field [24] simultaneously. In the future, multi-feature GNSS receivers will also be a trend. If more integrated receivers are developed, more RO missions will help increase the use of GNSS-R data. This will provide more atmospheric parameters for TC forecasts and NWP.

5. Conclusions

As an advanced atmospheric sounding technique, RO effectively complements other conventional observations owing to its unique advantages. RO measurements have contributed significantly to NWP and TC forecasts. In this paper, we mainly reviewed the applications of RO observations in NWP and TC forecasts.
RO has many advantages such as global coverage, high accuracy and precision, superior vertical resolution, and full-time and all-weather observation. In terms of the contribution to NWP, RO promotes the accuracy of NWP, particularly in the southern hemisphere and poles, where most of the conventional measurements are unavailable. Through studies on the sensitivity of RO data to the height, the core region where RO data make most contribute to the NWP assimilation system was found to be in the range of 10–20 km. While accounting for only 7% of the total observations made in 2014 in the assimilation system, RO has the fourth-largest impact on NWP. Moreover, the amount of current RO data is approximately 10,000 soundings per day, far from the upper limit, i.e., 128,000 soundings per day, which means that more RO data can benefit NWP. In the future, with the amount of assimilated RO data expected to reach up to 16,000 soundings per day, the error in NWP can be reduced by 25% compared with the error in 2013, which is a considerable improvement.
In the tropical cyclone monitoring field, RO represents a solution that overcomes the long-lasting problem of false or missed predictions. With the assimilation of RO data, the intensity and track predictions of the TC can be improved significantly. RO data, from both below 6 km and the UTLS region, contribute to this improvement. RO data below 6 km are critical in the initial stage of TC genesis, and the data in the UTLS positively influence the forecast over three days owing to the high vertical resolution of RO. Moreover, through an analysis of the simulated vertical structure of TCs, the essential structures could be restored, particularly the eye, eyewall, and rain bands, because the RO technique provides more accurate measurements of the initial water vapor fields and helps adjust the wind fields. Because of the high horizontal gradient of the water vapor and temperature of TC, the assimilation of RO data in such regions remains challenging. New approaches, such as the non-local excess phase operator, can partly solve this problem and further improve the TC forecast. With denser RO data expected in the future, a more accurate TC forecast can be anticipated.
Finally, to better serve NWP and TC forecasts, the potentials of RO should be exploited. New RO techniques and strategies have emerged to increase the frequency of RO soundings, such as the Airborne RO technique, multi-system compatible receiver, and Cube Satellite Constellation. Moreover, the superior behaviors of RO can yield original features, such as the polarimetric RO technique to measure heavy precipitation, and the multi-feature receiver, which helps integrated RO and GNSS-R. With more RO missions and satellite launches, a consistent improvement in NWP and TC forecast can be expected.
Some problems in the application of RO in NWP and TC forecast remain unresolved. First, the horizontal resolution of RO data remains low [63], approximately 100 km. Additionally, the water vapor and temperature below a height of 10 km cannot be solved independently [61], resulting in further bias in the assimilation system. There are noises in the lower troposphere (0–5 km) due to the comprehensive effect of multipath effects, super-refractivity, and receiver errors [75]. To solve these issues and increase the total number of RO missions, more advanced algorithms are required.
Further development in the application of RO in NWP and TC forecast can be realized using original methods such as deep learning, machine learning, and big data [90]. These methods may improve the quality of RO data below a height of 10 km, based on the reanalysis of RO data accumulated over the past several decades. Furthermore, as RO measurements contain important parameters of the atmosphere and ionosphere, we could explore the possible relationships between space weather or stratospheric dynamics and weather forecast in the troposphere to improve NWP and TC forecast [91]. We believe that the development of RO will bring more promising results for NWP and TC forecasts.

Author Contributions

Writing—original draft/editing, W.B., N.D.; Data curation G.T., Z.L., X.L., N.D.; Resources, W.B., N.D., Y.S., C.L.; Funding acquisition, Y.S., Q.D., J.X., X.W., X.M., D.Z., C.L. All authors have read and agreed to the published version of the manuscript.

Funding

This research was supported by the National Natural Science Foundation of China, grant numbers 42074042, 41505030, 41606206, and 41775034; Strategic Priority Research Program of Chinese Academy of Sciences, grant number XDA15007501.

Conflicts of Interest

The authors declare no conflict of interest.

References

  1. Ho, S.-P.; Goldberg, M.; Kuo, Y.-H.; Zou, C.-Z.; Shiau, W. Calibration of Temperature in the Lower Stratosphere from Microwave Measurements Using COSMIC Radio Occultation Data: Preliminary Results. Terr. Atmos. Ocean. Sci. 2009, 20, 87. [Google Scholar] [CrossRef] [Green Version]
  2. Steinerl, A.K.; Kirchengastl, G.; Foelsche, U.; Kornblueh, L.; Manzinil, E.; Bengtsson, L. GNSS occultation sounding for climate monitoring. Phys. Chem. Earth Part A Solid Earth Geod. 2001, 26, 113–124. [Google Scholar] [CrossRef]
  3. Jin, S.; Cardellach, E.; Xie, F. GNSS Remote Sensing: Theory, Methods and Applications. In Remote Sensing and Digital Image Processing; Springer: Berlin, Germany, 2014. [Google Scholar]
  4. Bai, W.; Wang, G.; Sun, Y.; Shi, J.; Yang, G.; Meng, X.; Wang, D.; Du, Q.; Wang, X.; Xia, J.; et al. Application of the Fengyun 3 C GNSS occultation sounder for assessing the global ionospheric response to a magnetic storm event. Atmos. Meas. Tech. 2019, 12, 1483–1493. [Google Scholar] [CrossRef] [Green Version]
  5. Kursinski, E.R.; Hajj, G.A.; Schofield, J.T.; Linfield, R.P.; Hardy, K.R. Observing Earth’s atmosphere with radio occultation measurements using the Global Positioning System. J. Geophys. Res. Space Phys. 1997, 102, 23429–23465. [Google Scholar] [CrossRef]
  6. Palmer, P.I.; Barnett, J.J. Application of an optimal estimation inverse method to GPS/MET bending angle observations. J. Geophys. Res. Space Phys. 2001, 106, 17147–17160. [Google Scholar] [CrossRef] [Green Version]
  7. Zhen, Z.; Xiong, H.; Zhang, X.J. Comparison of Density and Temperature Profile Measurement with Lidar and Occultation Technique. In Proceedings of the 2000 5th International Symposium on Antennas, Propagation, and EM Theory, Beijing, China, 15–18 August 2000; pp. 560–564. [Google Scholar]
  8. Wickert, J.; Reigber, C.; Beyerle, G.; König, R.; Marquardt, C.; Schmidt, T.; Grunwaldt, L.; Galas, R.; Meehan, T.K.; Melbourne, W.G.; et al. Atmosphere sounding by GPS radio occultation: First results from CHAMP. Geophys. Res. Lett. 2001, 28, 3263–3266. [Google Scholar] [CrossRef] [Green Version]
  9. Wickert, J.; Schmidt, T.; Beyerle, G.; König, R.; Reigber, C.; Jakowski, N. The Radio Occultation Experiment aboard CHAMP: Operational Data Analysis and Validation of Vertical Atmospheric Profiles. J. Meteorol. Soc. Jpn. 2004, 82, 381–395. [Google Scholar] [CrossRef] [Green Version]
  10. Wickert, J.; Michalak, G.; Schmidt, T.; Beyerle, G.; Cheng, C.Z.; Healy, S.B.; Heise, S.; Huang, C.Y.; Jakowski, N.; Köhler, W.; et al. GPS Radio Occultation: Results from CHAMP, GRACE and FORMOSAT-3/COSMIC. Terr. Atmos. Ocean. Sci. 2009, 20, 35–50. [Google Scholar] [CrossRef] [Green Version]
  11. Hajj, G.A.; Ao, C.O.; Iijima, B.A.; Kuang, D.; Kursinski, E.R.; Mannucci, A.J.; Meehan, T.; Romans, L.J.; De La Torre-Juárez, M.; Yunck, T.P. CHAMP and SAC-C atmospheric occultation results and intercomparisons. J. Geophys. Res. Space Phys. 2004, 109, D6. [Google Scholar] [CrossRef]
  12. Oscar. Available online: https://www.wmo-sat.info/oscar/gapanalyses?mission=9 (accessed on 15 August 2020).
  13. Anthes, R.A. Exploring Earth’s Atmosphere with Radio Occultation: Contributions to Weather, Climate and Space Weather. Atmos. Meas. Tech. 2011, 4, 1077–1103. [Google Scholar] [CrossRef] [Green Version]
  14. Anthes, A.R.; Bernhardt, A.P.; Chen, Y.; Cucurull, L.; Dymond, K.F.; Ector, D.; Healy, S.B.; Ho, S.-P.; Hunt, D.C.; Kuo, Y.-H.; et al. The COSMIC/FORMOSAT-3 Mission: Early Results. Bull. Am. Meteorol. Soc. 2008, 89, 313–334. [Google Scholar] [CrossRef]
  15. Ho, S.-P.; Anthes, R.A.; Ao, C.O.; Healy, S.; Horanyi, A.; Hunt, D.; Mannucci, A.J.; Pedatella, N.; Randel, W.J.; Simmons, A.; et al. The COSMIC/FORMOSAT-3 Radio Occultation Mission after 12 Years: Accomplishments, Remaining Challenges, and Potential Impacts of COSMIC-2. Bull. Am. Meteorol. Soc. 2020, 101, E1107–E1136. [Google Scholar] [CrossRef] [Green Version]
  16. Healy, S. ECMWF Starts Assimilating Cosmic-2 Data. Available online: https://www.ECMWF.int/en/newsletter/163/.news/ECMWF-starts-assimilating-cosmic-2-data (accessed on 20 July 2020).
  17. Bai, W.; Liu, C.; Meng, X.; Sun, Y.; Kirchengast, G.; Du, Q.; Wang, X.; Yang, G.; Liao, M.; Yang, Z.; et al. Evaluation of atmospheric profiles derived from single- and zero-difference excess phase processing of BeiDou radio occultation data from the FY-3C GNOS mission. Atmos. Meas. Tech. 2018, 11, 819–833. [Google Scholar] [CrossRef] [Green Version]
  18. Wang, S.Z.; Zhu, G.W.; Bai, W.H.; Liu, C.L.; Sun, Y.Q.; Wang, X.Y.; Meng, X.G.; Yang, G.L.; Yang, Z.D.; Zhang, X.X.; et al. For the First Time Fengyun3 C Satellite-Global Navigation Satellite System Occultation Sounder Achieved Spaceborne Bei Dou System Radio Occultation. Acta Phys. Sin. 2015, 64, 089301-1–089301-9. [Google Scholar]
  19. Du, Q.; Sun, Y.; Bai, W.; Wang, X.; Wang, D.; Meng, X.; Cai, Y.; Liu, C.; Wu, D.; Wu, C.; et al. The next generation GNOS instrument for FY-3 meteorological satellites. In Proceedings of the 2016 IEEE International Geoscience and Remote Sensing Symposium (IGARSS), Beijing, China, 10–15 July 2016; pp. 381–383. [Google Scholar]
  20. Bai, W.; Sun, Y.; Du, Q.; Yang, G.; Yang, Z.; Zhang, P.; Bi, Y.; Wang, X.; Wang, D.; Meng, X. An Introduction to FY3 GNOS in-Orbit Performance and Preliminary Validation Results. In Proceedings of the EGU General Assembly Conference, Vienna, Austria, 27 April–2 May 2014. [Google Scholar]
  21. Ma, G.; Wang, Y.; Yuan, B.; Xi, S.; Liao, M.; Zhang, P. Assimilation Application of Satellite Cloud Drive Wind and Radio Occultation and Its Impact to Rainfall and Cloudy Region. In Proceedings of the 33rd Chinese meteorology union Annual Meeting, Xi’an, China, 2–4 November 2016. [Google Scholar]
  22. Liu, Z.; Sun, Y.; Bai, W.; Xia, J.; Tan, G.; Cheng, C.; Du, Q.; Wang, X.; Zhao, D.; Tian, Y.; et al. Validation of Preliminary Results of Thermal Tropopause Derived from FY-3C GNOS Data. Remote Sens. 2019, 11, 1139. [Google Scholar] [CrossRef] [Green Version]
  23. Liao, M.; Healy, S.; Zhang, P. Processing and quality control of FY-3C GNOS data used in numerical weather prediction applications. Atmos. Meas. Tech. 2019, 12, 2679–2692. [Google Scholar] [CrossRef] [Green Version]
  24. Sun, Y.; Tian, Y.; Liu, C.; Li, W.; Zhao, D.; Li, F.; Qiao, H.; Wang, X.; Du, Q.; Bai, W.; et al. The Status and Progress of Fengyun-3e GNOS II Mission for GNSS Remote Sensing. In Proceedings of the IGARSS 2019—2019 IEEE International Geoscience and Remote Sensing Symposium; Institute of Electrical and Electronics Engineers (IEEE), Yokohama, Japan, 28 July–2 August 2019; pp. 5181–5184. [Google Scholar]
  25. Romanov, A.; Selivanov, A.; Vishnyakov, V.; Vinogradov, A.; Selin, V.; Pavelyev, A.; Yakovlev, O.; Matyugov, S. Space System “Radiomet” for GLONASS/GPS Navigation Signal Radio Occultation Monitoring of Lower Atmosphere and Ionosphere Based on Super-Small Satellites. In Small Satellite Missions for Earth Observation; Springer: Berlin/Heidelberg, Germany, 2009; pp. 85–94. [Google Scholar]
  26. Ladreiter, H.P.; Kirchengast, G. GPS/GLONASS sensing of the neutral atmosphere: Model-independent correction of ionospheric influences. Radio Sci. 1996, 31, 877–891. [Google Scholar] [CrossRef]
  27. Kirchengast, G.; Høeg, P. The ACE+ Mission: An Atmosphere and Climate Explorer based on GPS, GALILEO, and LEO-LEO Radio Occultation. In Occultations for Probing Atmosphere and Climate; Springer: Berlin/Heidelberg, Germany, 2004; pp. 201–220. [Google Scholar]
  28. Borowitz, M. Is It Time for Commercial Weather Satellites? Analyzing the Case of Global Navigation Satellite System Radio Occultation. N. Space 2016, 4, 115–122. [Google Scholar] [CrossRef]
  29. Cai, Y.; Bai, W.; Wang, X.; Sun, Y.; Du, Q.; Zhao, D.; Meng, X.-G.; Liu, C.; Xia, J.; Wang, D.; et al. In-orbit performance of GNOS on-board FY3-C and the enhancements for FY3-D satellite. Adv. Space Res. 2017, 60, 2812–2821. [Google Scholar] [CrossRef]
  30. Jin, S.; Feng, G.; Gleason, S. Remote sensing using GNSS signals: Current status and future directions. Adv. Space Res. 2011, 47, 1645–1653. [Google Scholar] [CrossRef]
  31. Scherllin-Pirscher, B.; Steiner, A.K.; Kirchengast, G.; Schwärz, M.; Leroy, S.S. The power of vertical geolocation of atmospheric profiles from GNSS radio occultation. J. Geophys. Res. Atmos. 2017, 122, 1595–1616. [Google Scholar] [CrossRef] [PubMed]
  32. Gorbunov, M.E.; Benzon, H.-H.; Jensen, A.S.; Lohmann, M.S.; Nielsen, A.S. Comparative analysis of radio occultation processing approaches based on Fourier integral operators. Radio Sci. 2004, 39, 1–11. [Google Scholar] [CrossRef] [Green Version]
  33. Yu, X.; Xie, F.; Ao, C.O. Evaluating the lower-tropospheric COSMIC GPS radio occultation sounding quality over the Arctic. Atmos. Meas. Tech. 2018, 11, 2051–2066. [Google Scholar] [CrossRef] [Green Version]
  34. Emanuel, K. 100 Years of Progress in Tropical Cyclone Research. Meteorol. Monogr. 2018, 59, 15.1–15.68. [Google Scholar] [CrossRef]
  35. Wilgan, K.; Rohm, W.; Bosy, J. Multi-observation meteorological and GNSS data comparison with Numerical Weather Prediction model. Atmos. Res. 2015, 156, 29–42. [Google Scholar] [CrossRef]
  36. Ho, S.-P.; Kirchengast, G.; Leroy, S.; Wickert, J.; Mannucci, A.J.; Steiner, A.K.; Hunt, D.; Schreiner, W.; Sokolovskiy, S.; Ao, C.; et al. Estimating the uncertainty of using GPS radio occultation data for climate monitoring: Intercomparison of CHAMP refractivity climate records from 2002 to 2006 from different data centers. J. Geophys. Res. Space Phys. 2009, 114, 114. [Google Scholar] [CrossRef] [Green Version]
  37. Luntama, J.-P.; Kirchengast, G.; Borsche, M.; Foelsche, U.; Steiner, A.K.; Healy, S.; Von Engeln, A.; O’Clerigh, E.; Marquardt, C. Prospects of the EPS GRAS Mission For Operational Atmospheric Applications. Bull. Am. Meteorol. Soc. 2008, 89, 1863–1876, © American Meteorological Society. Used with permission. [Google Scholar] [CrossRef] [Green Version]
  38. Cucurull, L. Improvement in the Use of an Operational Constellation of GPS Radio Occultation Receivers in Weather Forecasting. Weather Forecast. 2010, 25, 749–767. [Google Scholar] [CrossRef]
  39. Buontempo, C.; Jupp, A.; Rennie, M. Operational NWP assimilation of GPS radio occultation data. Atmos. Sci. Lett. 2008, 9, 129–133. [Google Scholar] [CrossRef]
  40. Healy, S.B. Forecast impact experiment with a constellation of GPS radio occultation receivers. Atmos. Sci. Lett. 2008, 9, 111–118. [Google Scholar] [CrossRef]
  41. Healy, S.B.; Thépaut, J.-N. Assimilation experiments with CHAMP GPS radio occultation measurements. Q. J. R. Meteorol. Soc. 2006, 132, 605–623. [Google Scholar] [CrossRef]
  42. Healy, S.B. Operational Assimilation of GPS Radio Occultation Measurements at ECMWF. ECMWF Newsl. 2007, 111, 6–11. [Google Scholar]
  43. Lagasio, M.; Pulvirenti, L.; Parodi, A.; Boni, G.; Pierdicca, N.; Venuti, G.; Realini, E.; Tagliaferro, G.; Barindelli, S.; Rommen, B. Effect of the ingestion in the WRF model of different Sentinel-derived and GNSS-derived products: Analysis of the forecasts of a high impact weather event. Eur. J. Remote Sens. 2019, 52, 1–18. [Google Scholar] [CrossRef] [Green Version]
  44. Cardinali, C.; Healy, S. Impact of GPS radio occultation measurements in the ECMWF system using adjoint-based diagnostics. Q. J. R. Meteorol. Soc. 2014, 140, 2315–2320. [Google Scholar] [CrossRef]
  45. Bauer, P.; Radnóti, G.; Healy, S.; Cardinali, C. GNSS Radio Occultation Constellation Observing System Experiments. Mon. Weather Rev. 2014, 142, 555–572, © American Meteorological Society. Used with permission. [Google Scholar] [CrossRef]
  46. Harnisch, F.; Healy, S.B.; Bauer, P.; English, S.J. Scaling of GNSS Radio Occultation Impact with Observation Number Using an Ensemble of Data Assimilations. Mon. Weather Rev. 2013, 141, 4395–4413, © American Meteorological Society. Used with permission. [Google Scholar] [CrossRef]
  47. Zhang, B.; Ho, S.P.; Shao, X.; Cao, C. Error Assessments in the GNSS Radio Occultation Excess Phase/Bending Angle Calculation. In Proceedings of the CISESS/UMD Annual Science Meeting, College Park, MD, USA, 12–14 November 2019. [Google Scholar]
  48. ECMWF. Available online: https://www.ECMWF.int/en/forecasts/charts/obstat/?facets=Parameter,Bending%20angles (accessed on 15 August 2020).
  49. Halperin, D.J.; Fuelberg, H.E.; Hart, R.E.; Cossuth, J.H. Verification of Tropical Cyclone Genesis Forecasts from Global Numerical Models: Comparisons between the North Atlantic and Eastern North Pacific Basins. Weather Forecast. 2016, 31, 947–955, © American Meteorological Society. Used with permission. [Google Scholar] [CrossRef]
  50. Halperin, D.J.; Fuelberg, H.E.; Hart, R.E.; Cossuth, J.H.; Sura, P.; Pasch, R.J. An Evaluation of Tropical Cyclone Genesis Forecasts from Global Numerical Models. Weather Forecast. 2013, 28, 1423–1445. [Google Scholar] [CrossRef]
  51. Tory, K.J.; Frank, W.M.; Chan, J.C.L.; Kepert, J. Tropical Cyclone Formation. In The Global Monsoon System; World Scientific: Singapore, 2010; pp. 55–91. [Google Scholar]
  52. Biondi, R.; Neubert, T.; Syndergaard, S.; Nielsen, J. Cosmic Radio Occultation Technique for Measurement of the Tropopause During Tropical Cyclones. In Proceedings of the Fourth FORMOSAT-3/COSMIC Data Users Workshop, Boulder, CO, USA, 27–29 October 2009. [Google Scholar]
  53. Biondi, R.; Neubert, T.; Ho, S.P.; Syndergaard, S. Tropical Cyclones Detection Using GPS Radio Occultation Data. In Proceedings of the IUGG: Earth on the Edge: Science for a Sustainable Planet, Melbourne, Australia, 28 June–7 July 2011; pp. 920–933. [Google Scholar]
  54. Huang, C.-Y.; Kuo, Y.-H.; Chen, S.-Y.; Terng, C.-T.; Chien, F.-C.; Lin, P.-L.; Kueh, M.-T.; Chen, S.-H.; Yang, M.-J.; Wang, C.-J.; et al. Impact of GPS radio occultation data assimilation on regional weather predictions. GPS Solut. 2009, 14, 35–49. [Google Scholar] [CrossRef]
  55. Hsieh, M.E.; Chen, Y.C.; Hsiao, L.F.; Chang, L.Y.; Huang, C.Y. Case Study of Impact of Assimilating Metop GPS Radio Occultation Observation on Top of Cosmic Data on Typhoon Forecast. J. Aeronaut. Astronaut. Aviat. 2018, 50, 375–390. [Google Scholar]
  56. Phunthirawuthi, P.; Wu, F.; Boonyuen, P. Performance analysis of GPS Radio Occultation assimilation for tropical cyclone monitoring. In Proceedings of the 2016 IEEE International Geoscience and Remote Sensing Symposium (IGARSS); Institute of Electrical and Electronics Engineers (IEEE), Beijing, China, 10–15 July 2016; pp. 2181–2184. [Google Scholar]
  57. Chen, S.-Y.; Wee, T.-K.; Kuo, Y.-H.; Bromwich, D.H. An Impact Assessment of GPS Radio Occultation Data on Prediction of a Rapidly Developing Cyclone over the Southern Ocean. Mon. Weather Rev. 2014, 142, 4187–4206. [Google Scholar] [CrossRef] [Green Version]
  58. Chen, Y.C.; Hsieh, M.E.; Hsiao, L.F.; Kuo, Y.H.; Yang, M.J.; Huang, C.Y.; Lee, C.S. Systematic Evaluation of the Impacts of GPSRO Data on the Prediction of Typhoons over the Northwestern Pacific in 2008–2010. Atmos. Meas. Tech. 2015, 8, 2531–2542. [Google Scholar] [CrossRef] [Green Version]
  59. Chen, S.Y.; Zhao, H.; Huang, C.Y. Impacts of GNSS Radio Occultation Data on Predictions of Two Super-Intense Typhoons with Wrf Hybrid Variational-Ensemble Data Assimilation. J. Aeronaut. Astronaut. Aviat. 2018, 50, 347–364. [Google Scholar]
  60. Kuo, Y.H.; Liu, H. The Use of GPS Radio Occultation Data for Tropical Cyclones Prediction. In Proceedings of the 2nd IROWG Workshop, Estes Park, CO, USA, 28 March–3 April 2012. [Google Scholar]
  61. Liu, H.; Anderson, J.; Kuo, Y.-H. Improved Analyses and Forecasts of Hurricane Ernesto’s Genesis Using Radio Occultation Data in an Ensemble Filter Assimilation System. Mon. Weather Rev. 2012, 140, 151–166, © American Meteorological Society. Used with permission. [Google Scholar] [CrossRef] [Green Version]
  62. Anisetty, S.P.R.; Huang, C.Y.; Chen, S.Y. Impact of Formosat-3/Cosmic Radio Occultation Data on the Prediction of Super Cyclone Gonu (2007): A Case Study. Nat. Hazards 2014, 70, 1209–1230. [Google Scholar] [CrossRef]
  63. Vergados, P.; Mannucci, A.J.; Su, H. A validation study for GPS radio occultation data with moist thermodynamic structure of tropical cyclones. J. Geophys. Res. Atmos. 2013, 118, 9401–9413. [Google Scholar] [CrossRef]
  64. Unwin, M.; Duncan, S.; Jales, P.; Blunt, P.; Tye, J. Implementing GNSS-Reflectometry in Space on the Techdemosat-1 Mission. In Proceedings of the 27th International Technical Meeting of the Satellite Division of The Institute of Navigation (ION GNSS+ 2014), Tampa Convention Center, Tampa, FL, USA, 8–12 September 2014. [Google Scholar]
  65. Sokolovskiy, S.V.; Kuo, Y.-H.; Wang, W. Assessing the Accuracy of a Linearized Observation Operator for Assimilation of Radio Occultation Data: Case Simulations with a High-Resolution Weather Model. Mon. Weather Rev. 2005, 133, 2200–2212. [Google Scholar] [CrossRef] [Green Version]
  66. Liu, H.; Zou, X. Improvements to a GPS radio occultation ray-tracing model and their impacts on assimilation of bending angle. J. Geophys. Res. Space Phys. 2003, 108. [Google Scholar] [CrossRef]
  67. Healy, S.B. Assimilation of GPS Radio Occultation Measurements at ECMWF. In Proceedings of the GRAS SAF Workshop on Applications of GPSRO measurements, ECMWF, Reading, UK, 16–18 June 2008; pp. 16–18. [Google Scholar]
  68. Ma, Z.; Kuo, Y.H.; Wang, B.; Wu, W.S.; Sokolovskiy, S. Comparison of Local and Non-local Observation Operators for the Assimilation of GPS Ro Data with the Ncep Gsi System: An Osse Study. Mon. Weather Rev. 2009, 137, 3575–3587. [Google Scholar] [CrossRef] [Green Version]
  69. Zou, X.; Hui, L. Impact Multipath Quality Control Improving GPS Ro Data Assimilation in the Tropical Lower Troposphere. Trans. Atmos. Sci. 2020, 1, 116–127. [Google Scholar]
  70. Ma, Z.; Kuo, Y.-H.; Ralph, F.M.; Neiman, P.J.; Wick, G.A.; Sukovich, E.; Wang, B. Assimilation of GPS Radio Occultation Data for an Intense Atmospheric River with the NCEP Regional GSI System. Mon. Weather Rev. 2011, 139, 2170–2183. [Google Scholar] [CrossRef] [Green Version]
  71. Liu, H.; Anderson, J.; Kuo, Y.H.; Snyder, C.; Caya, A. Evaluation of a Non-local Quasi-Phase Observation Operator in Assimilation of Champ Radio Occultation Refractivity with Wrf. Mon. Weather Rev. 2008, 136, 242–256. [Google Scholar] [CrossRef]
  72. Ha, J.-H.; Lim, G.-H.; Choi, S.-J. Assimilation of GPS Radio Occultation Refractivity Data with WRF 3DVAR and Its Impact on the Prediction of a Heavy Rainfall Event. J. Appl. Meteorol. Clim. 2014, 53, 1381–1398. [Google Scholar] [CrossRef]
  73. Chen, S.Y.; Huang, C.Y.; Kuo, Y.H.; Guo, Y.R.; Sokolovskiy, S. Assimilation of GPS Refractivity from Formosat-3/Cosmic Using a Non-local Operator with WRF 3Dvar and Its Impact on the Prediction of a Typhoon Event. Terr. Atmos. Ocean. Sci. 2009, 20, 133–154. [Google Scholar] [CrossRef] [Green Version]
  74. Cheng, W.; Wang, B.; Xu, Y. Assimilation of GPS Radio Occultation Data with the Local and Non-Local Op- Erators Using Backward-4dvar Approach. Sci. Sin. Math. 2012, 42, 377–387. (In Chinese) [Google Scholar]
  75. Chen, S.Y.; Kuo, Y.H.; Huang, C.Y. The Impact of GPS RO Data on the Prediction of Tropical Cyclogenesis Using a Non-local Observation Operator: An Initial Assessment. Mon. Weather Rev. 2020, 148, 2701–2717, © American Meteorological Society. Used with permission. [Google Scholar] [CrossRef]
  76. Biondi, R.; Steiner, A.K.; Kirchengast, G.; Rieckh, T. Characterization of thermal structure and conditions for overshooting of tropical and extratropical cyclones with GPS radio occultation. Atmos. Chem. Phys. Discuss. 2015, 15, 5181–5193. [Google Scholar] [CrossRef] [Green Version]
  77. Young, L. JPL GNSS Receivers, Past, Present, and Future; Jet Propulsion Laboratory, California Institute of Technology: La Cañada Flintridge, CA, USA, 2017. [Google Scholar]
  78. Masters, D.; Irisov, V.; Nguyen, V.; Duly, T.; Nogués-Correig, O.; Tan, L.; Yuasa, T.; Ringer, J.; Sikarin, R.; Gorbunov, M.; et al. Status and Plans for Spire’s Growing Commercial Constellation of GNSS Science CubeSats. In Proceedings of the Joint 6th ROM SAF User Workshop and 7th IROWG Workshop, Helsingør, Denmark, 19–25 September 2019. [Google Scholar]
  79. Bowler, N.E. An assessment of GNSS radio occultation data produced by Spire. Q. J. R. Meteorol. Soc. 2020. [Google Scholar] [CrossRef]
  80. Yunck, T.; Lautenbacher, C.; McGrath, M.; Withnell, P.; Axelrad, P.; Nuding, D.; Kreisher, J. CICERO—Community Initiative for Continuing Earth Radio Occultation. In Proceedings of the 6th FORMOSAT-3/COSMIC Data Users Workshop, Boulder, CO, USA, 30 October–1 November 2012. [Google Scholar]
  81. Rohm, W.; Yuan, Y.; Biadeglgne, B.; Zhang, K.; Le Marshall, J. Ground-based GNSS ZTD/IWV estimation system for numerical weather prediction in challenging weather conditions. Atmos. Res. 2014, 138, 414–426. [Google Scholar] [CrossRef]
  82. Ruf, C.S.; Atlas, R.; Chang, P.S.; Clarizia, M.P.; Garrison, J.L.; Gleason, S.; Katzberg, S.J.; Jelenak, Z.; Johnson, J.T.; Majumdar, S.J.; et al. New Ocean Winds Satellite Mission to Probe Hurricanes and Tropical Convection. Bull. Am. Meteorol. Soc. 2016, 97, 385–395. [Google Scholar] [CrossRef]
  83. Chen, X.M. Airborne Radio Occultation Measurements and Their Impact on Severe Weather Prediction Using the Regional WRF Model. Ph.D. Thesis, University of California, Davis, CA, USA, 2017. Available from ProQuest Dissertations & Theses Global; ProQuest Dissertations & Theses Global A&I: The Sciences and Engineering Collection. (2037164052). [Google Scholar]
  84. Turk, F.J.; Padullés, R.; Ao, C.O.; Juárez, M.D.L.T.; Wang, K.-N.; Franklin, G.W.; Lowe, S.T.; Hristova-Veleva, S.M.; Fetzer, E.; Cardellach, E.; et al. Benefits of a Closely-Spaced Satellite Constellation of Atmospheric Polarimetric Radio Occultation Measurements. Remote Sens. 2019, 11, 2399. [Google Scholar] [CrossRef] [Green Version]
  85. Cardellach, E.; Padullés, R.; Tomás, S.; Turk, F.J.; Ao, C.O.; De La Torre-Juárez, M. Probability of intense precipitation from polarimetric GNSS radio occultation observations. Q. J. R. Meteorol. Soc. 2017, 144, 206–220. [Google Scholar] [CrossRef] [PubMed]
  86. Cardellach, E.; Oliveras, S.; Rius, A.; Tomás, S.; Ao, C.O.; Franklin, G.W.; Iijima, B.A.; Kuang, D.; Meehan, T.K.; Padullés, R.; et al. Sensing Heavy Precipitation With GNSS Polarimetric Radio Occultations. Geophys. Res. Lett. 2019, 46, 1024–1031. [Google Scholar] [CrossRef] [Green Version]
  87. Dong, Z.; Jin, S. Evaluation of Spaceborne GNSS-R Retrieved Ocean Surface Wind Speed with Multiple Datasets. Remote Sens. 2019, 11, 2747. [Google Scholar] [CrossRef] [Green Version]
  88. Singh, S.K.; Kumar, P.; Pal, P.K. Assimilation of Oceansat-2-Scatterometer-Derived Surface Winds in the Weather Research and Forecasting Model. IEEE Trans. Geosci. Remote Sens. 2011, 50, 1015–1021. [Google Scholar] [CrossRef]
  89. Mohanty, U.C.; Gopalakrishnan, S.G. (Eds.) Advanced Numerical Modeling and Data Assimilation Techniques for Tropical Cyclone Prediction; Springer: Berlin, Germany, 2016. [Google Scholar]
  90. Benjamin, S.G.; Brown, J.M.; Brunet, G.; Lynch, P.; Saito, K.; Schlatter, T.W. 100 Years of Progress in Forecasting and NWP Applications. Meteorol. Monogr. 2019, 59, 13.1–13.67. [Google Scholar] [CrossRef]
  91. Yiğit, E.; Knížová, P.K.; Georgieva, K.; Ward, W. A review of vertical coupling in the Atmosphere–Ionosphere system: Effects of waves, sudden stratospheric warmings, space weather, and of solar activity. J. Atmos. Solar Terr. Phys. 2016, 141, 1–12. [Google Scholar] [CrossRef]
Figure 1. Schematic of radio occultation [4]. In the legend, the GNOS-BD (BeiDou) /GPS means global navigation satellite system (GNSS) occultation sounder (GNOS) received signals from Beidou/GPS satellite. The radio occultation (RO) phenomenon occurs when a GPS signal from the GNSS penetrates the Earth’s atmosphere and is then received by low-earth orbit (LEO) satellites behind the earth.
Atmosphere 11 01204 g001
Figure 2. Time series of the mean and standard deviation of short-range forecast and analysis fitted to the radiosonde temperature measurements in the southern hemisphere, for the operational numerical weather prediction (NWP) system at the European Centre for Medium-Range Weather Forecasts (ECMWF) [37]. With the assimilation of COSMIC RO data operationally by the ECMWF since December 2006, there has been an apparent improvement in the short-range forecast and analysis.
Atmosphere 11 01204 g002
Figure 3. Impact of RO data for heights of 100, 200, 500, and 1000 hPa on the ECMWF operational forecast in the northern hemisphere, where the positive values indicate improved NWP. The y-axis represents the fractional improvement in the root mean square (RMS) geopotential height errors as a function of the forecast range, which is plotted along the x-axis, in the northern hemisphere (latitude > 20°) [40]. The error bars represent the 95% confidence interval.
Atmosphere 11 01204 g003
Figure 4. Impact of RO data in 100, 200, 500, and 1000 hPa on the ECMWF operational forecast in the southern hemisphere, where the positive values indicate improved NWP. The y-axis represents the fractional improvement in the RMS geopotential height errors as a function of the forecast range, which is plotted along the x-axis, in the southern hemisphere (latitude > 20°) [40]. The error bars represent the 95% confidence interval.
Atmosphere 11 01204 g004
Figure 5. Sensitivity of height to the amount of RO data in NWP [45]. Dependence of 24-h temperature forecast. error relative to 0%-GPS-RO experiment (%) at (a) 50, (b) 100, (c) 150, (d) 200, (e) 500, and (f) 1000 hPa. The 24 h temperature relative forecast error, plotted along the y-axis, decreases with an increase in the GPS-RO data density. Above 500 hPa, more RO data induces less error, and the phenomenon in the stratosphere is more obvious than in the troposphere. The solid, dotted, and dashed lines indicate the results for the northern hemisphere, southern hemisphere, and tropics, respectively.
Atmosphere 11 01204 g005
Figure 6. Evaluation of various observations assimilated by the ECMWF. (a) Data Percentage; (b) Frequency of Error Reduction. While accounting for only 7% of the total observations in the assimilation system, RO has the fourth-largest impact on NWP. Adapted from [44].
Atmosphere 11 01204 g006
Figure 7. Normalized ensemble of data assimilation (EDA) spread (%) as a function of the assimilated number of simulated RO profiles [46]. The EDA spread is an error statistic of the ECMWF NWP theoretical forecast and analysis. (a) Temperature at 100 hPa; (b) temperature at 500 hPa; (c) geopotential height at 500 Pa; (d) relative humidity at 850 hPa. The more the RO observations, the better the NWP, and there is no saturation even with 128,000 soundings per day.
Atmosphere 11 01204 g007
Figure 8. Daily total RO profiles in the National Centers for Environmental Prediction (NCEP) Global Data Assimilation System (GDAS) from 01/2017 to 09/2019. Taken from [47].
Atmosphere 11 01204 g008
Figure 9. Planned RO data amount from 2020 to 2030 from all missions. The shadow area represents the estimates of possible RO data; the bold lines indicate three primary missions, namely, COSMIC, FY-3, and MetOp [12].
Atmosphere 11 01204 g009
Figure 10. Tropical cyclone (TC) forecast model performance of four institutes during 2007–2014. Probability of detection (POD) =   h i t h i t + m i s s is given along the y-axis; Success ratio (SR) = h i t h i t + f a l s e   a l a r m is given along the x-axis; the dashed line indicates the bias = h i t + f a l s e   a l a r m h i t + m i s s ; the solid line indicates the critical success index (CSI) = h i t h i t + f l a s e   a l a r m + m i s s . The solid circle and triangle indicate the North Atlantic (NATL) and eastern North Pacific (EPAC) basins. Higher values of POD, SR, and CSI indicate a better forecast of the TC genesis. On the top right corner is the perfect forecast [49].
Atmosphere 11 01204 g010
Figure 11. Left column shows the image of Ernesto’s genesis taken by a satellite after 54, 78, and 102 h; the middle column shows the model result with RO data; the right column shows the model results without the RO data. Ernesto’s genesis is predicted successfully after assimilating the RO observation [60].
Atmosphere 11 01204 g011
Figure 12. Forty-eight-hour prediction results of Storm Ernesto: (a) central sea level pressure; (b) track error; and (c) total column cloud liquid water obtained from three experiments and satellite infrared cloud image of the actual storm. The central sea level pressure (SLP) in the RO group is approximately 15 hPa lower than those in CTRL and RO6km, which makes the TC in RO stronger [61].
Atmosphere 11 01204 g012
Figure 13. TC relative humidity fractional difference between GPS simulation and ECMWF reanalysis. As the vertical profile of the TC, the humidity is statistically analyzed as a function of the altitude and distance from the eye of the cyclones. The relative humidity of the simulated rain bands 200 km from the center is approximately 25% higher than ECMWF reanalysis [63].
Atmosphere 11 01204 g013
Figure 14. Differences between the excess phase operator (EPH) and local refractivity operator (LOC) experiments in a time–pressure section from −72 to 0 h for Typhoon Nuri (2008) in (a) vertical velocity (colors; m s−1) and water vapor mixing ratio (contours; g kg−1), and (b) vertical velocity (colors; m s−1) and vorticity (contours, 10−5s−1) [75].
Atmosphere 11 01204 g014
Table 1. Assimilated radio occultation (RO) data in the European Center Medium-Range Weather Forecast (ECMWF) operational numerical weather prediction (NWP) system (adapted from ECMWF) [48].
MissionSoundings/Day
COSMIC-25000
MetOp-A/B/C1905
FY-3C/D1000
TanDEM-X100
TerraSAR-X200
KOMPSAT-5500
PAZ300
Total data9005
Actual received data~6000
Data used~5000
Table 2. RO operator in data assimilation.
ObservationAssimilation Operator Atmosphere 11 01204 i001
RefractivityLocal refractivity
Non-local refractivity
Non-local excess phase
Bending angleLocal bending angle
2D/3D Ray tracer
Table 3. Global navigation satellite system (GNSS) sonders (adapted from OSCAR website).
SonderGNSS TrackedSoundings/DaySatelliteStatus
TriGGPS, GALILEO~500COSMIC-2In orbit
~600GRACE-FO
TriG (JASON-CS)GPS, GALILEO, GLONASS~1000JASON-CS-A/BPlanned
GNOSGPS, BeiDou~1000FY-3DIn orbit
GNOS-2FY-3E/F/G/H/RPlaned
GRASGPS~650MetOp-A/B/CIn orbit
ROGPS, Galileo, GLONASS, Beidou (2 or 3 of them)~1100-1500MetOp-SG-A/BPlanned
IGORGPS~100TanDEM-XIn orbit
~200TerraSAR-X
TSX-NGPlanned
ARMA-MPGPS, Galileo, GLONASS~2000Meteor-MPPlanned
TriG: Triple G (GPS, Galileo, GLONASS); GRAS: GNSS Receiver for Atmospheric Sounding; IGOR: Integrated GPS Occultation Receiver; ARMA: Radio occultation instrument for Meteor-MP.
Publisher’s Note: MDPI stays neutral with regard to jurisdictional claims in published maps and institutional affiliations.

