Article

Ambient Non-Methane Hydrocarbons (NMHCs) Measurements in Baoding, China: Sources and Roles in Ozone Formation

1
Collaborative Innovation Center of Atmospheric Environment and Equipment Technology, Jiangsu Key Laboratory of Atmospheric Environment Monitoring and Pollution Control, School of Environmental Science and Engineering, Nanjing University of Information Science & Technology, Nanjing 210044, China
2
Nanjing Intelligent Environmental Science and Technology Co., Ltd., Nanjing 211800, China
*
Author to whom correspondence should be addressed.
Atmosphere 2020, 11(11), 1205; https://doi.org/10.3390/atmos11111205
Submission received: 29 September 2020 / Revised: 27 October 2020 / Accepted: 4 November 2020 / Published: 6 November 2020
(This article belongs to the Section Air Quality)

Abstract

:
Ambient non-methane hydrocarbons (NMHCs) are important precursors of ozone (O3) and secondary organic aerosol (SOA). Online and offline measurements of NMHCs were conducted during September 2015 in Baoding, Hebei province of China, in order to investigate their sources and roles in ozone formation. Average levels of total NMHCs online measured at the urban site were 44.5 ± 26.7 ppb. Aromatics was the largest contributor to NMHCs levels and OH reactivity, with fraction of 27.1% and 35.9%, respectively. Based on offline measurements at eight sites, we found that toluene, ethylbenzene, and m,p-xylene displayed the highest level at the site close to automobile manufacturing factories, followed by downwind receptor sites and other sites. Positive matrix factorization (PMF) model was then used to analyze NMHCs sources. Four factors were identified, including traffic-related emission, automobile manufacturing coating, biogenic emission, and NG/LPG usage and background. Average relative contribution of automobile manufacturing coating to NMHCs levels during the entire online measurement period was 33.4%, and this value increased to 42% during two O3 pollution days. Sensitivity of O3 formation to NMHCs and NOX during an O3 pollution episode were analyzed using a box model based on observations. Relative incremental reactivity (RIR) results suggested that O3 formation was in NOx-titration regime (i.e., highly NMHCs-limited regime). Further scenario analyses on relationship of O3 formation with reduction of NOx and anthropogenic NMHCs (AHC) indicated that AHC and NOx should be reduced by a ratio greater than two and three to achieve 5% and 10% O3 control objectives, respectively. The largest RIR value for anthropogenic NMHC species was from xylenes, which were also an important contributor to SOA formation and dominantly from sources related to automobile manufacturing coating and traffic emission. This means reducing NMHCs emission from automobile manufacturing coating and traffic emission should be given priority for synergetic control of O3 and PM2.5.
Keywords:
NMHCs; O3; PMF; OBM

1. Introduction

The Beijing-Tianjin-Hebei (BTH) region is one of the fast-developing city clusters in China. Severe air pollution problems in this region has caused continuing concerns during recent years. Meanwhile, a lot of control measures have been taken by the government to improve air quality, and thus ambient levels of primary pollutants have shown a decreasing trend. Measurement data reported by Chinese Environmental Situation Communique (http://www.mee.gov.cn/hjzl/zghjzkgb/lnzghjzkgb/) showed that average concentrations of ambient sulfur dioxide (SO2), PM10, PM2.5, nitrogen dioxide (NO2), and carbon monoxide (CO) in 13 important cities of BTH region decreased by 71%, 40%, 43%, 16%, and 45% from 2013 to 2018, respectively. However, the 90th percentiles of daily maximum 8-h moving averaged (DMA8) ozone (O3) concentration in the BTH region increased from 155 μg/m3 during 2013 to 199 μg/m3 during 2018.
Ground-level O3 in urban area is mainly from photochemical oxidation of volatile organic compounds (VOCs) and nitrogen oxides (NOX) [1]. Therefore, understanding roles of VOCs and NOX in O3 formation and sources of VOCs is necessary for establishment of effective O3 control measures [2,3]. A few of studies on sensitivity of O3 to VOCs and NOX have been conducted in Beijing. Two studies using box models based on observations (OBM) suggested that O3 formation at urban sites of Beijing was in transition regime during summer of 2006–2007 [4,5], whereas the study by Zhang et al. (2014) using a simplified O3 production calculating method [6] and the study by Tang et al. (2010) [7] using emission-based model indicated that O3 formation fell within a VOCs-limited regime during summer. Overall, O3 formation during summertime of Beijing was more sensitive to VOCs. Measurements of ambient VOCs in summer of Beijing have been reported by some studies [8,9]. Vehicular exhaust was considered as the dominant source of ambient VOCs based on receptor model results, with relative contributions of 32–68% [8,9].
O3 pollutions in megacities of China commonly displayed regional characteristics, and thus it is necessary to implement multiregional O3 control strategies [10]. Baoding is located in central of Beijing-Tianjin-Hebei region, with distances from Beijing and Tianjin of about 140 and 150 km, respectively. Automobile manufacturing is the most important industry in Baoding. In this study, ambient levels and sources of non-methane hydrocarbons (NMHCs) were analyzed based on based online and offline measurements of NMHCs during September 2015. Potential source contribution function (PSCF) analysis for NMHCs were then conducted to investigate source regions. Sensitivity of O3 formation to NMHCs and NOX was finally discussed using a box model to obtain implications for the development of O3 control strategies.

2. Methodology

2.1. Ambient NMHCs Measurements

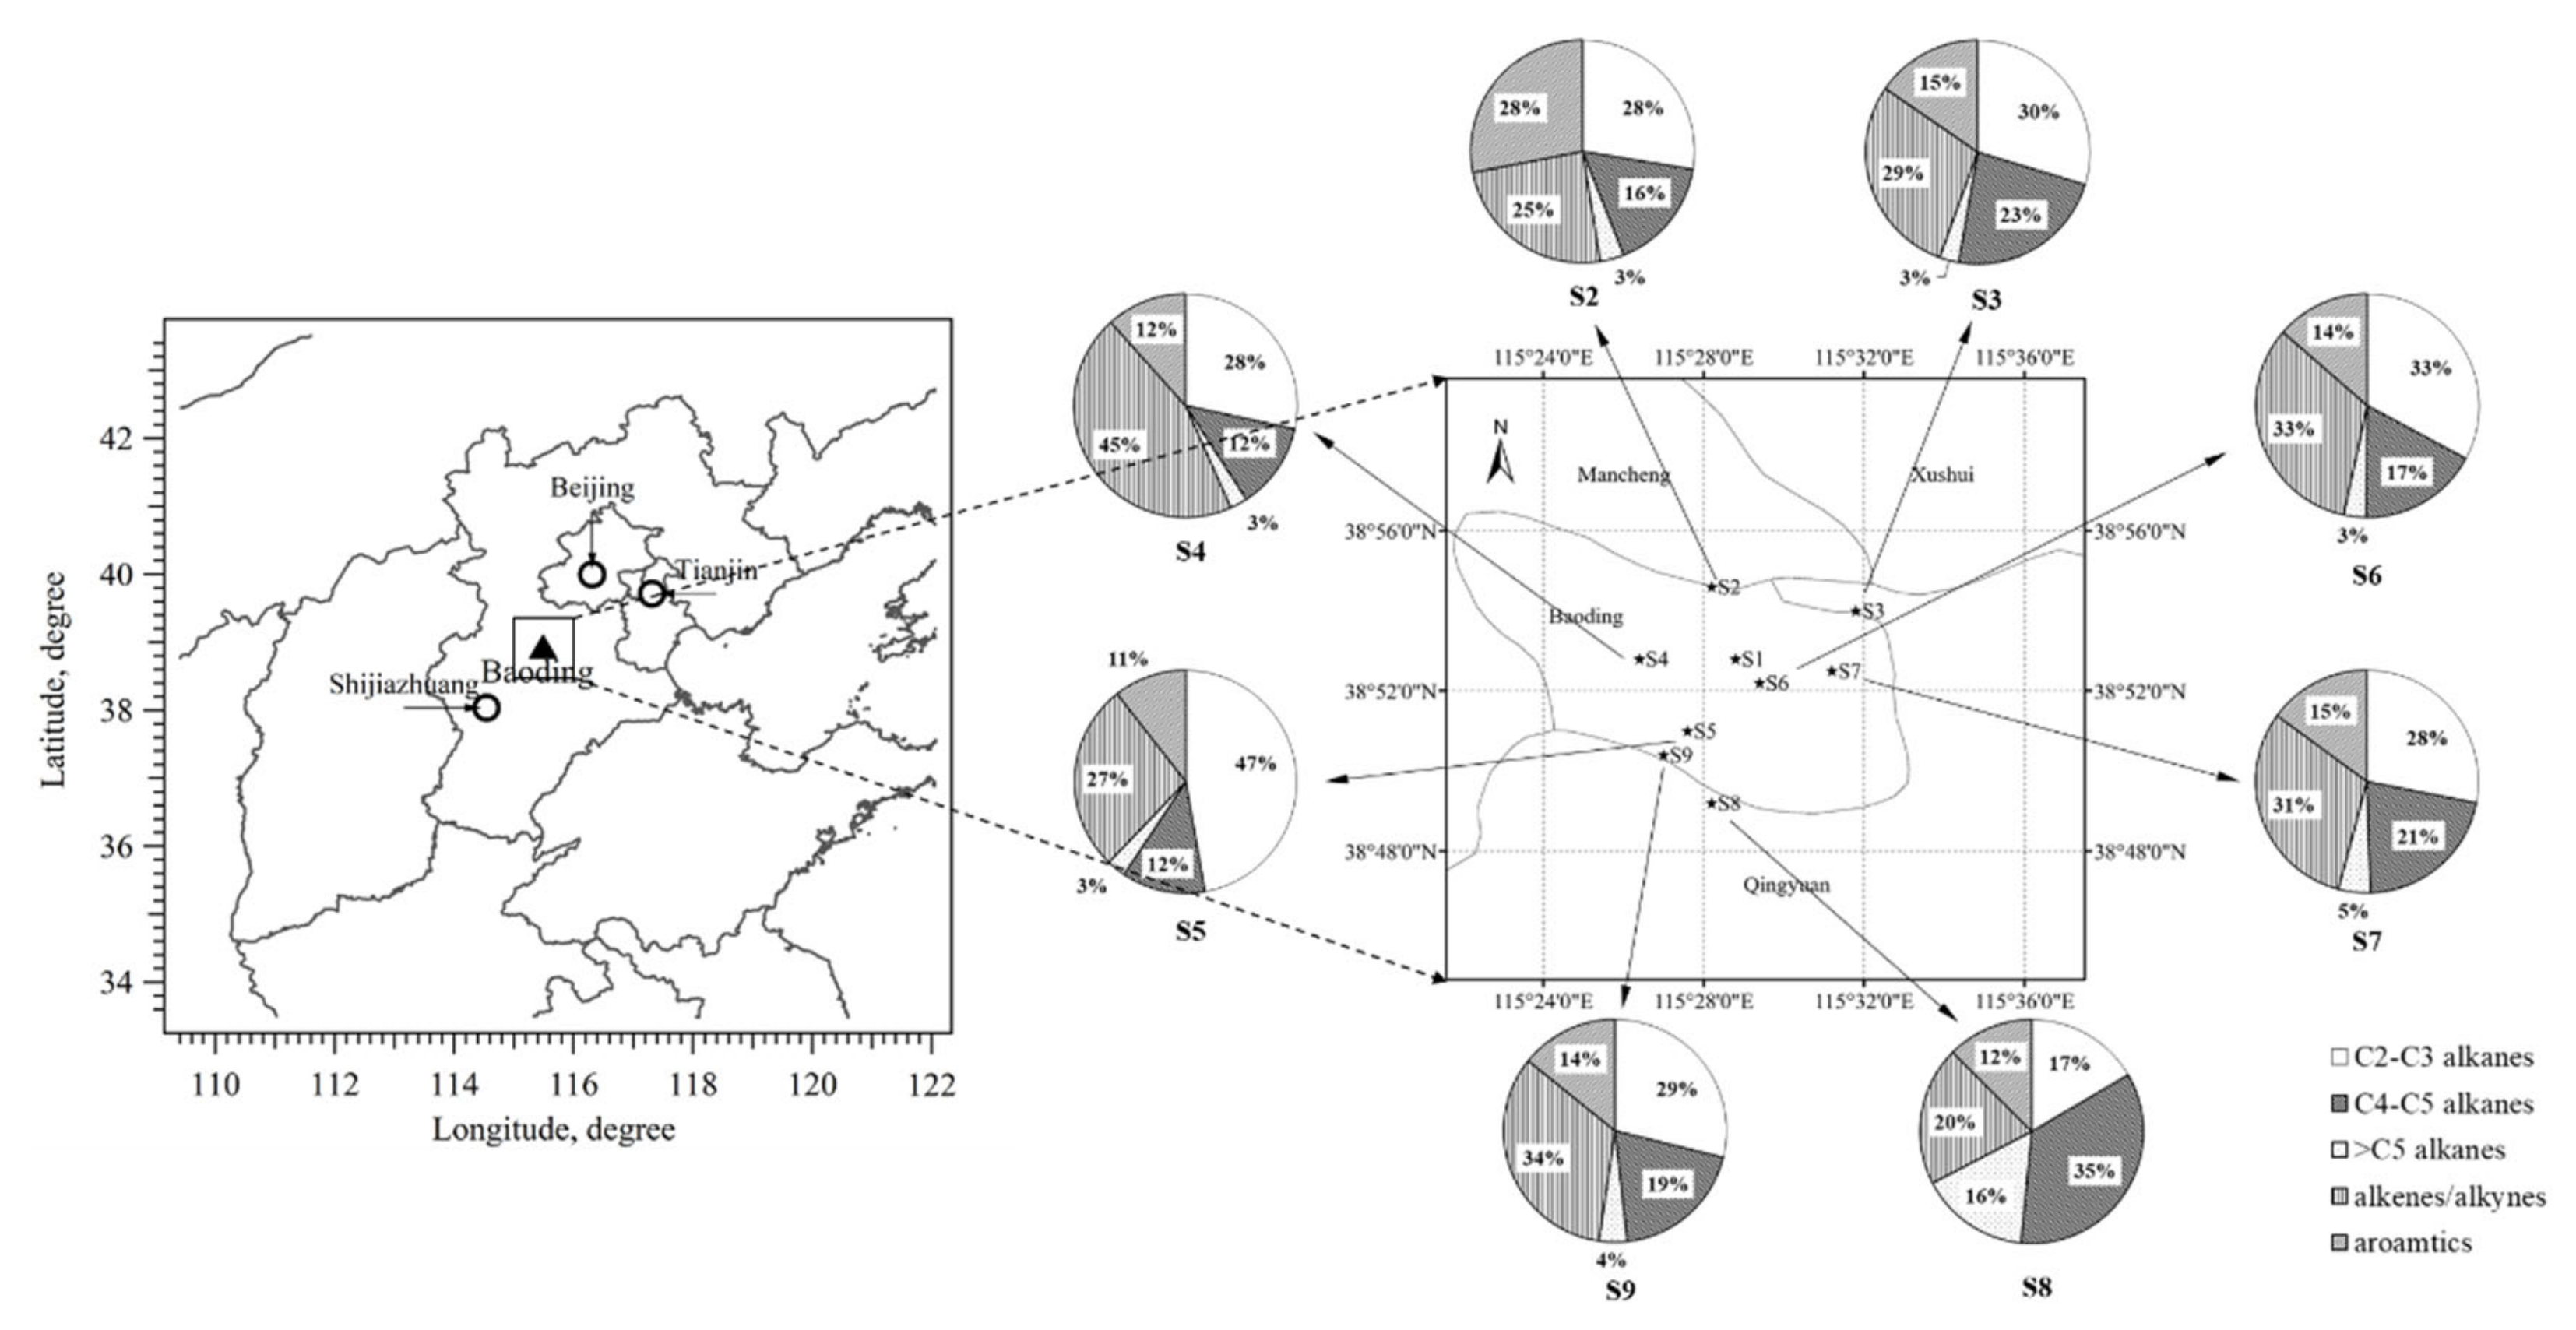
2.1.1. Sampling Sites

The online NMHCs measurements site (38.9°N, 115.5°E) was located on the roof of a fourth-story building (~20 m above ground) in Baoding Environmental Protection Bureau (the S1 site in Figure 1), which is in central urban area of Baoding city and about 900 m south of inner ring road. This site represents a typical urban environment in Baoding. Offline whole air samples were collected at six national environmental automatic air quality monitoring stations (the S2–S7 sites in Figure 1) and two industrial sites (the S8 and S9 sites in Figure 1). These air quality monitoring stations were located in well-ventilated areas to avoid the potential influences from local sources. The S8 and S9 sites were close to two automobile manufacturers in Baoding.

2.1.2. Online and Offline Measurements of NMHCs

Ambient NMHCs were online measured by a cryogen-free automatic gas chromatograph system equipped with a mass spectrometer detector (MSD) and a flame ionization detector (FID) (HP-7890A, Agilent Technologies, Santa Clara, CA, USA) from September 10th to September 30th in 2015. Detailed analytical methods and quality assurance/quality-control (QA/QC) procedures for this system have been described elsewhere [11]. The pre-concentration device of this system was developed by Peking University and contained two channels. In one channel, C2–C5 NMHCs were trapped in a PLOT column (0.53 mm ID, 15 cm) at ultralow temperature (−110 °C). In the other channel, C5–C12 NMHCs were trapped in a deactivated capillary column (0.32 mm ID, 15 cm). After sampling, these two traps were heated to 110 °C, then pre-concentrated NMHCs were vaporized and injected into GC for separation and detection. C2–C5 NMHCs were separated using a PLOT column (0.32 mm ID, 15 m) and detected by the FID, while C5–C12 NMHCs were separated by a DB-624 column (0.25 mm, 30 m) and detected by the MSD.
Whole air samples were collected simultaneously at 8 sites on 9:00 and 13:00 of September 17th and October 8th in 2015 using 3.2 L fused silica stainless steel canisters (Entech Instruments, Simi Valley, CA, USA) that had been pre-cleaned with high purity nitrogen (99.999%) and evacuated with an automated canister cleaner (Entech 3100, Entech Instruments, Simi Valley, CA, USA). After sampling, these canisters were returned to the laboratory in Peking University within one week to analyze NMHCs using a three-stage cryofocusing pre-concentration system (Entech 7100, Entech Instruments) coupled with a GC-MS/FID system. The analytical methods and QA/QC procedures for this system were described in detail by Liu et al. (2008) [12] and Wang et al. (2010) [13].
A commercial mixed standard gas with 57 NMHCs (Spectra Gases Inc., Branchburg, USA) was used to calibrate C2–C12 hydrocarbons. The 1-ppm standard gas was diluted to calibration standards with mixing ratios of 0.5 ppb, 1 ppb, 2 ppb, 4 ppb, and 8ppb. Correlation coefficients (r) of calibration curves for target species ranged from 0.992 to 1.00. The method detection limits (MDLs) of C2–C12 hydrocarbons measured by the online and offline systems were in the range of 0.009–0.057 ppb and 0.005–0.028 ppb, respectively.

2.2. Observation-Based Model (OBM)

In this study, relationship of ozone formation with its precursors was analyzed using a box model based on observations developed by Cardelino and Chameides (1995) [14]. The OBM uses online measurement data of speciated NMHCs, NOX, O3, CO, temperature, and relative humidity as inputs to simulate O3 production potential (P(O3)), i.e., integral of O3 production rate with time. Relative incremental reactivity (RIR) for each precursor (X) was calculated by the following equation:
R I R X = P O 3 N O X P O 3 N O X Δ X / P O 3 N O X Δ S X / S X            
where P O 3 N O is net production of ozone that consumed by reaction with NO is also included. S(X) means source function of X. ΔX represents change of concentration for X that caused by the change of S(X) (i.e., ΔS(X)). In this study, measurement data between 07:00 and 19:00 were used to simulate P(O3) in each day and the ΔS(X)/S(X) was set as 10% to calculate RIR.

2.3. Positive Matrix Factorization (PMF) Model

The PMF model (Version 5.0) developed by the US Environmental Protection Agency (EPA) was applied for NMHCs source apportionment. Detailed introductions on PMF5.0 can be found in its user guide written by Norris et al. (2014) [15]. Briefly, PMF is a multivariate factor analytical tool that decomposes the speciated measurement data matrix (x) into two matrices: factor profiles (f) and factor contributions (g) (Equation (2)):
x i j   =   k = 1 p g i k f k j   +   e i j
where xij is concentration of jth species measured in ith sample; gik is contribution of the kth source to ith sample; fkj is fraction of jth species in kth source; p is number of factors; eij is residual for each sample and species.

3. Results and Discussion

3.1. Characteristic of O3, NOX, and NMHCs

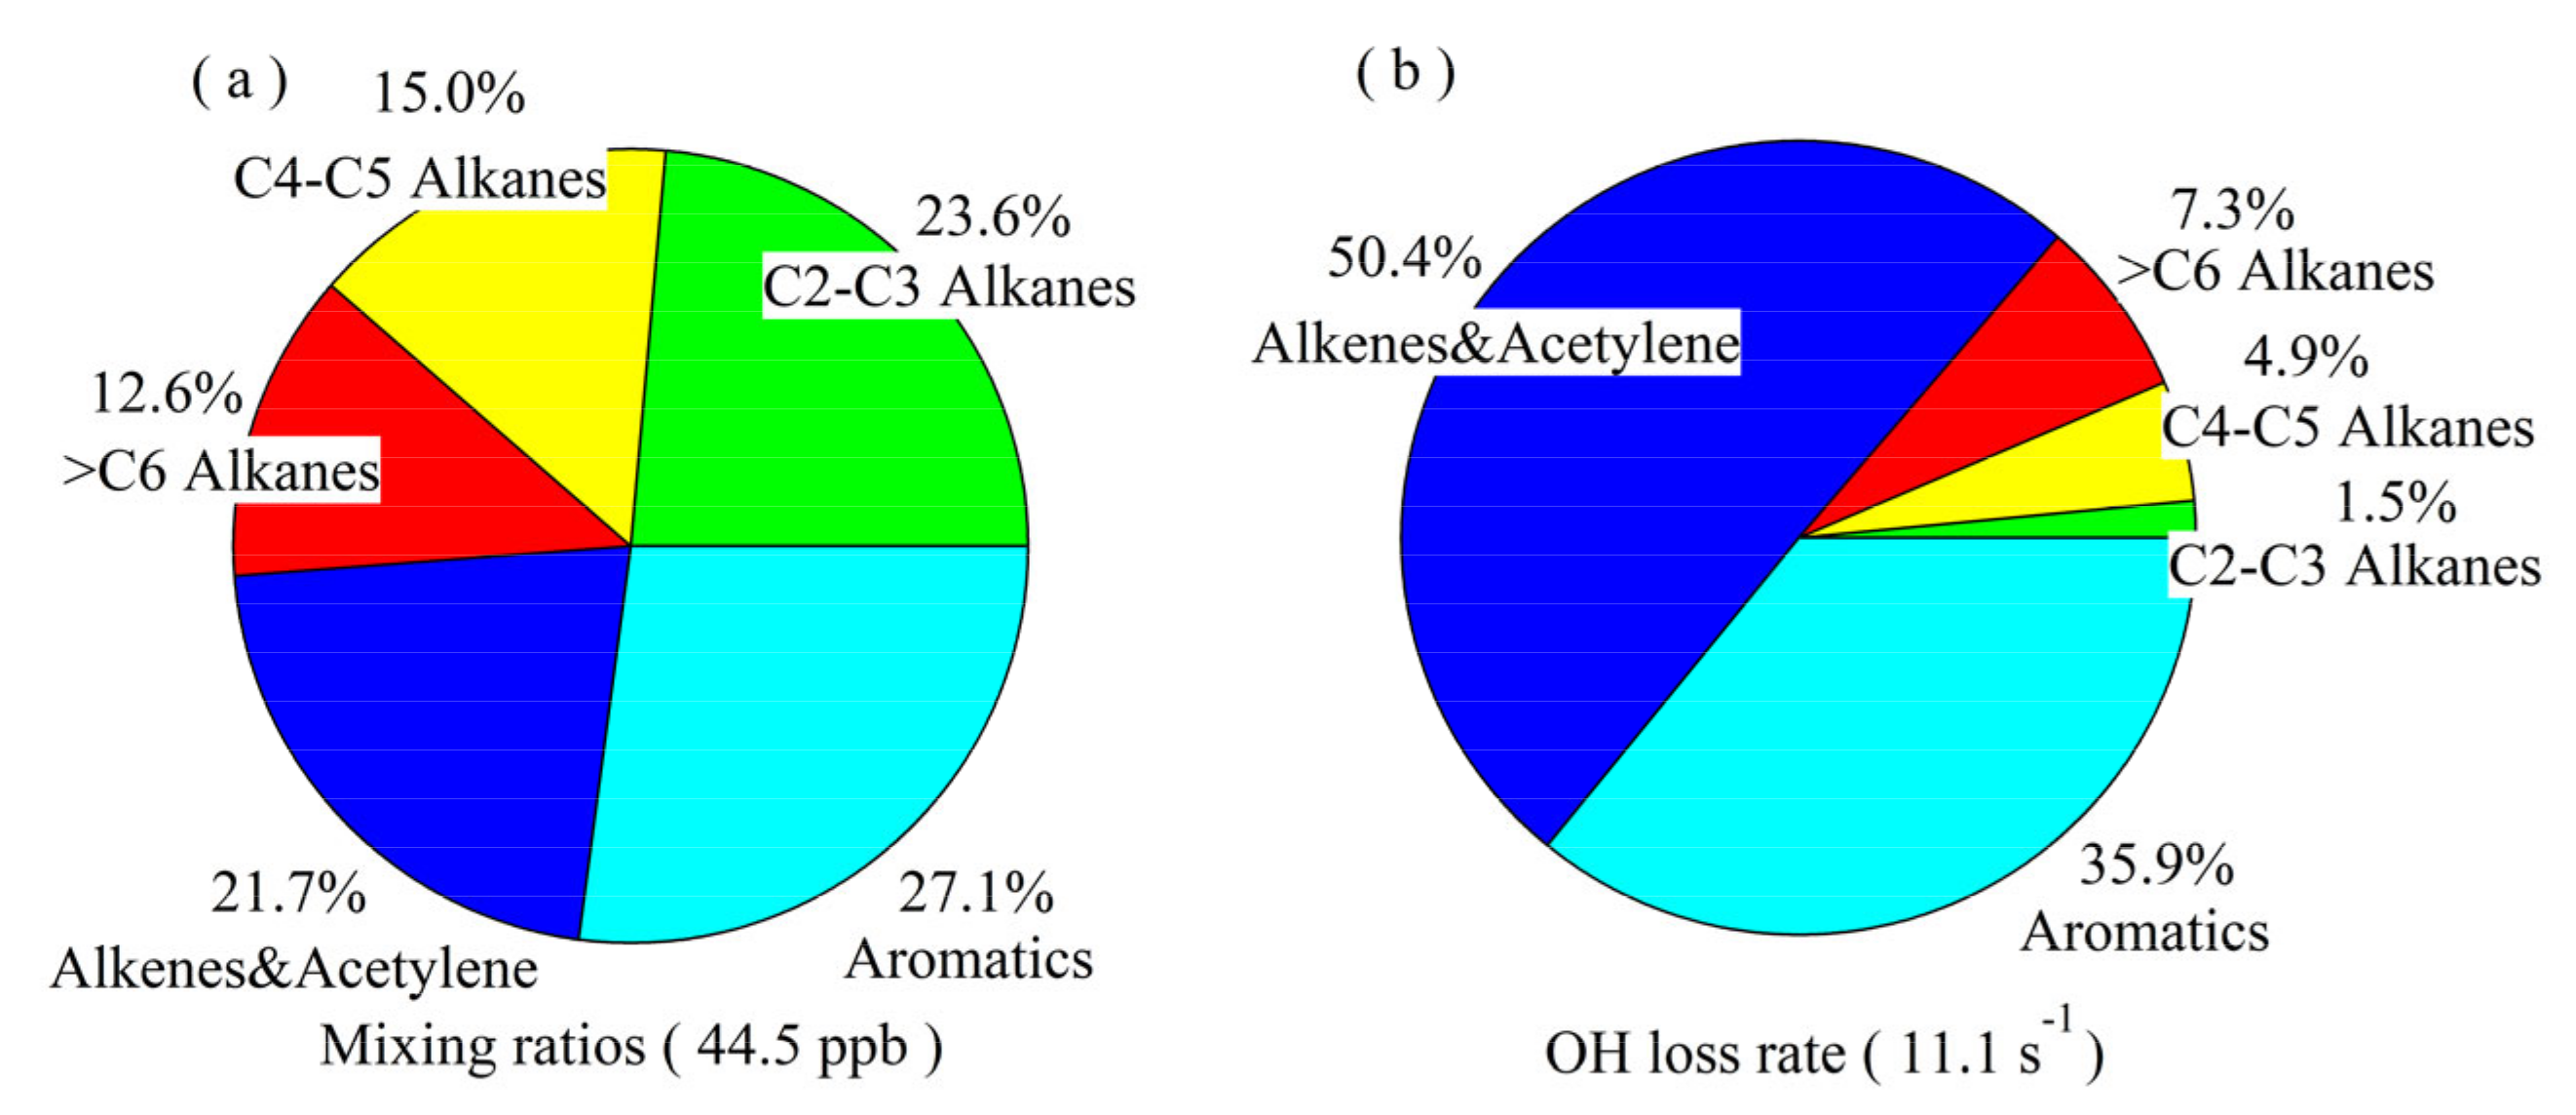
3.1.1. Mixing Ratios, Chemical Composition, and Reactivity of NMHCs

Ambient mixing ratios for total NMHCs online measured at the S1 site during September 10th to September 30th, 2015 ranged from 13.3 ppb to 165.4 ppb, with average value of 44.5 ± 26.7 ppb. The highest NMHCs level appeared at 7:00 of September 16th with low wind speed (<2 m/s), while the lowest concentration (13.3ppb) appeared at 15:00 on September 29th with high wind speed (>4 m/s). Overall, high NMHCs levels frequently appeared at night and morning with low wind speeds, while low NMHCs levels tended to occur at noon and early afternoon. This is possibly because the high boundary layer and strong photochemical reactions at noon are in favor of dilution and removal of NMHCs. As shown in Figure 2a, aromatics was the largest contributor to NMHCs mixing ratios, with fraction of 27.1%, followed by C2–C3 alkanes (23.6%), alkenes and alkynes (21.7%), C4–C5 alkanes (15.0%), and alkanes with carbon atoms more than 5 (12.6%). In the 57 measured NMHC species, ethane, toluene, and propane showed the three highest mixing ratios, with average value of 6.2 ppb, 4.2 ppb, and 4.0 ppb, respectively.
The average mixing ratio of NMHCs from offline measurements at eight sites was 27.8 ± 10.2 ppb, which was lower than the result from online observation, possibly due to the discrepancy of sampling sites and time between online and offline measurements. The highest average NMHCs level occurred at the S8 site, with value of 49.2 ppb, implying the possible influence of an automobile factory. The lowest average NMHCs level was 20.1 ppb for the S2 site, which located in the north of urban area. From the perspective of NMHCs chemical composition, there were also significant differences among these offline sites. Relative contributions from C2–C3 alkanes, alkenes and alkynes, C4–C5 alkanes, aromatics, and >C5 alkanes were in the range of 17–47%, 20–45%, 12–35%, 11–28%, and 3–16%, respectively (Figure 1). The average chemical compositions of NMHCs from online and offline measurements on September 17th were compared with each other. It was found that relative contribution of alkanes from online measurements was 49.1%, close to value from offline measurement (51.0%). However, relative contribution of alkenes and alkynes from online measurements was 23.9%, lower than that from offline measurements (34.7%), while aromatics showed larger contribution of 27.0% from online measurements, about twice of result from offline measurements. The discrepancy of NMHCs chemical composition between online and offline measurements may be caused by the difference of sites locations. The online NMHCs measurements were conducted at the S2 site, while the offline measurements were conducted at eight different sites, some of which may be affected by local emissions.
OH loss rate for total measured NMHC (LOH) was calculated using the equation LOH = ∑kOH,NMHC × [NMHC], where kOH,NMHC means reaction rate constant of a specific NMHC with OH radical and [NMHC] is the mixing ratio of this NMHC species. kOH values for NMHCs are from Atkinson et al. (2006) [16]. Average LOH from online measurements was 11.1 ± 6.4 s−1. Alkenes and aromatics were the two largest contributors to LOH, with relative contributions of 50.4% and 35.9%, respectively (Figure 2b). The top three species with largest LOH values were isoprene (2.0 s−1), m,p-xylene (1.1 s−1), and ethylene (0.9 s−1), with respective mixing ratios of 0.7ppb, 2.2ppb, and 3.7ppb.
Average mixing ratios of propane, i-pentane, and toluene in this study were compared with results for other cities from previous publications (Table 1). Average level of propane in this study was 4.0 ± 2.9 ppb, comparable to results measured in Beijing [17] and Shanghai [18], and higher than values for Nanjing [19], Wuhan [20], and Ningbo [21], but lower than those for Guangzhou [22], Houston, US [23], and Ulsan, Korea [24]. For i-pentane, its average level in this study was 1.9 ± 1.3 ppb, comparable to results for Shanghai [18] and Ningbo [21], and higher than those for Nanjing [19] and Wuhan [20], but lower than those for Beijing [17], Guangzhou [22], Houston [23], and Ulsan [24]. Average mixing ratio of toluene in this study was 4.2 ± 4.7 ppb, higher than results measured in Beijing [17], Nanjing [19], Wuhan [20], and Ningbo [21] (1.2–3.3 ppb), but lower than that for Guangzhou [22]. It should be pointed that these comparisons possibly had large uncertainty due to differences in types of measurement sites, observation periods, and meteorological conditions among these studies.

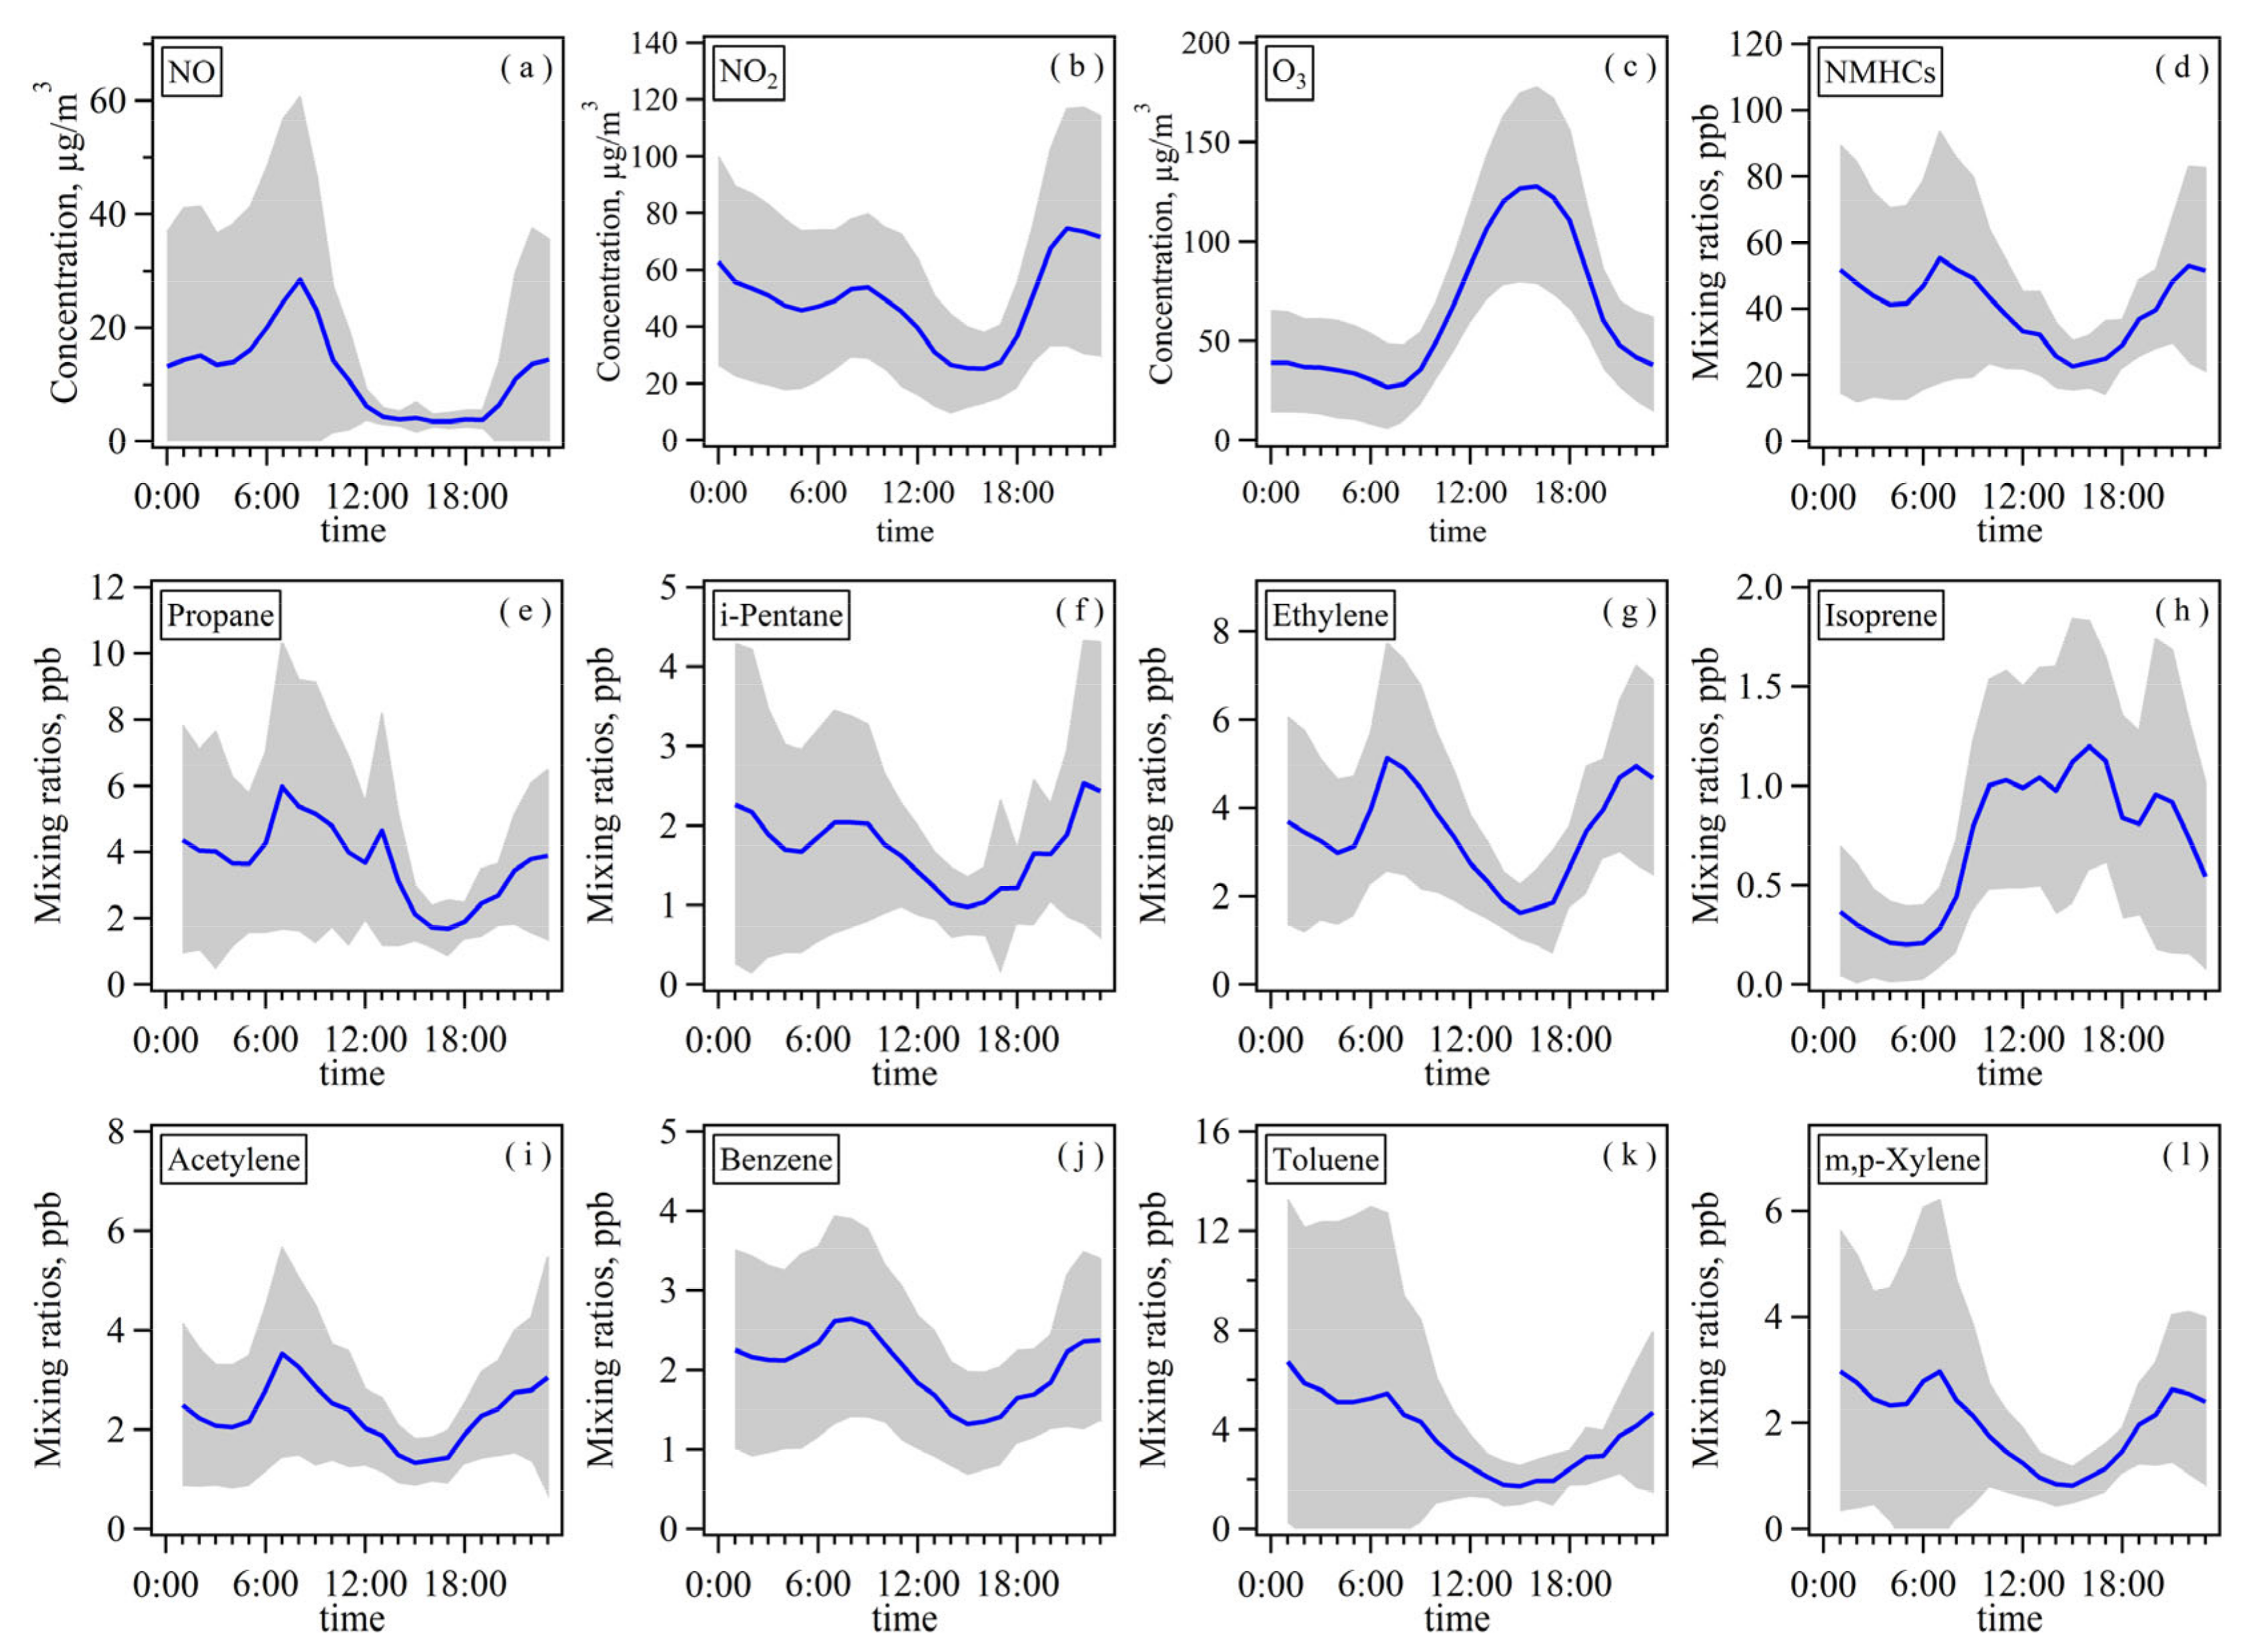
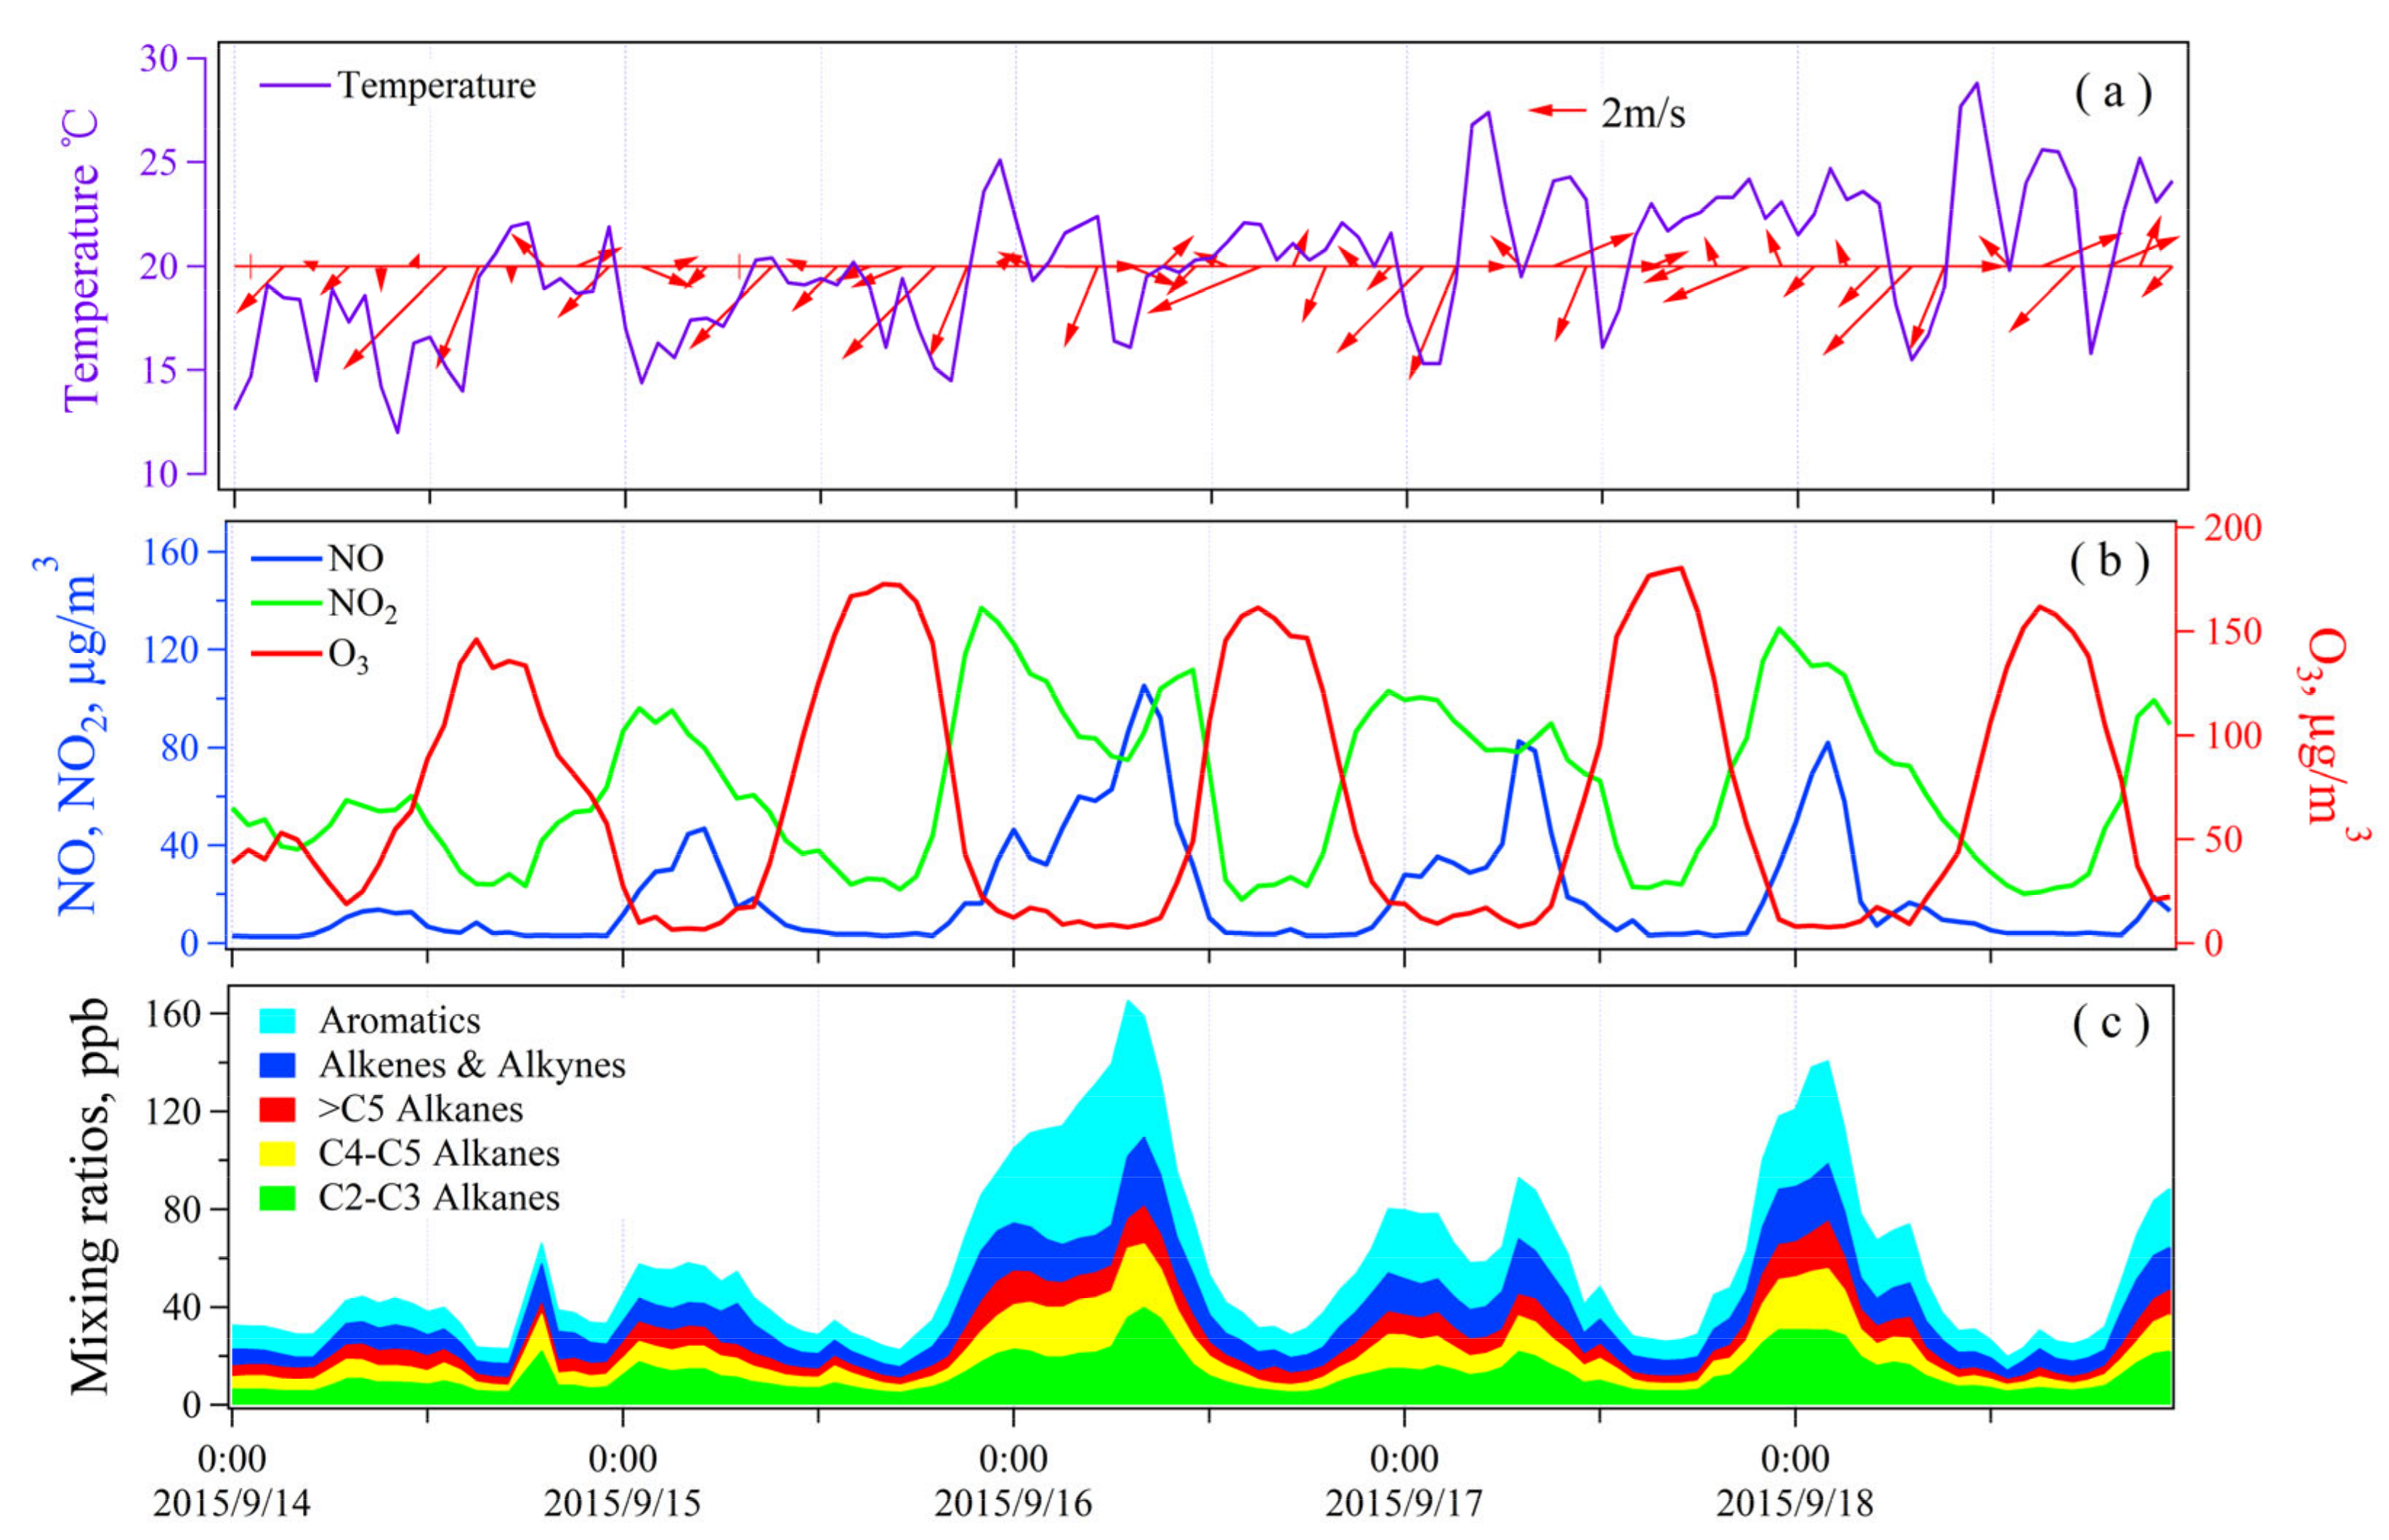
3.1.2. Diurnal Variations of NMHCs, NOX, and O3 Based on Online Measurements

Figure 3 shows average diurnal variation patterns of ambient levels for NMHCs, NOX, and O3 at the S1 site during the online observation period. Ambient levels of NMHCs and NO2 displayed a similar U-shaped diurnal variation pattern, with higher values during nighttime and morning and lower values during afternoon (Figure 3b,d). Additionally, it was found that NMHCs and NO2 levels both attained a peak at 7:00–8:00 in the morning, which was consistent with morning rush hour, implying possible influence from traffic-related sources. The lowest levels of NMHCs and NOX at noon and early-afternoon were probably due to the increase of boundary layer height and faster turbulent mixing processes, as well as strong photochemical reactions at noon. Contrary with NMHCs and NOx, O3 concentrations showed maximum values around 15:00 in the afternoon, and then decreased gradually to low values during night (Figure 3c), indicating that O3 was dominantly from photochemical formation.
Diurnal variations of propane, i-pentane, ethylene, isoprene, acetylene, benzene, toluene, and m,p-xylene were also displayed in Figure 3e–l. Mixing ratios of propane, i-pentane, ethylene, acetylene and benzene showed a peak at morning rush hour (7:00–8:00), suggesting influence from traffic-related sources. Benzene and acetylene levels also showed a strong correlation, with the correlation coefficient (r) of 0.83, which indicated that benzene and acetylene had similar sources (e.g., vehicular exhaust). Additionally, since the atmospheric lifetime of benzene is relatively long (kOH = 1.22 × 10⁻¹² molecule s−1), benzene has a background mixing ratio. Different with acetylene, toluene, and m,p-xylene showed the highest levels at midnight, indicating that they were possibly impacted by other sources besides traffic-related emissions. Isoprene showed a different diurnal variation pattern with other NMHC species, with low values during nighttime, but peak values around 15:00 in the afternoon. This was because biogenic emission is the dominant source of ambient isoprene during summer [25].

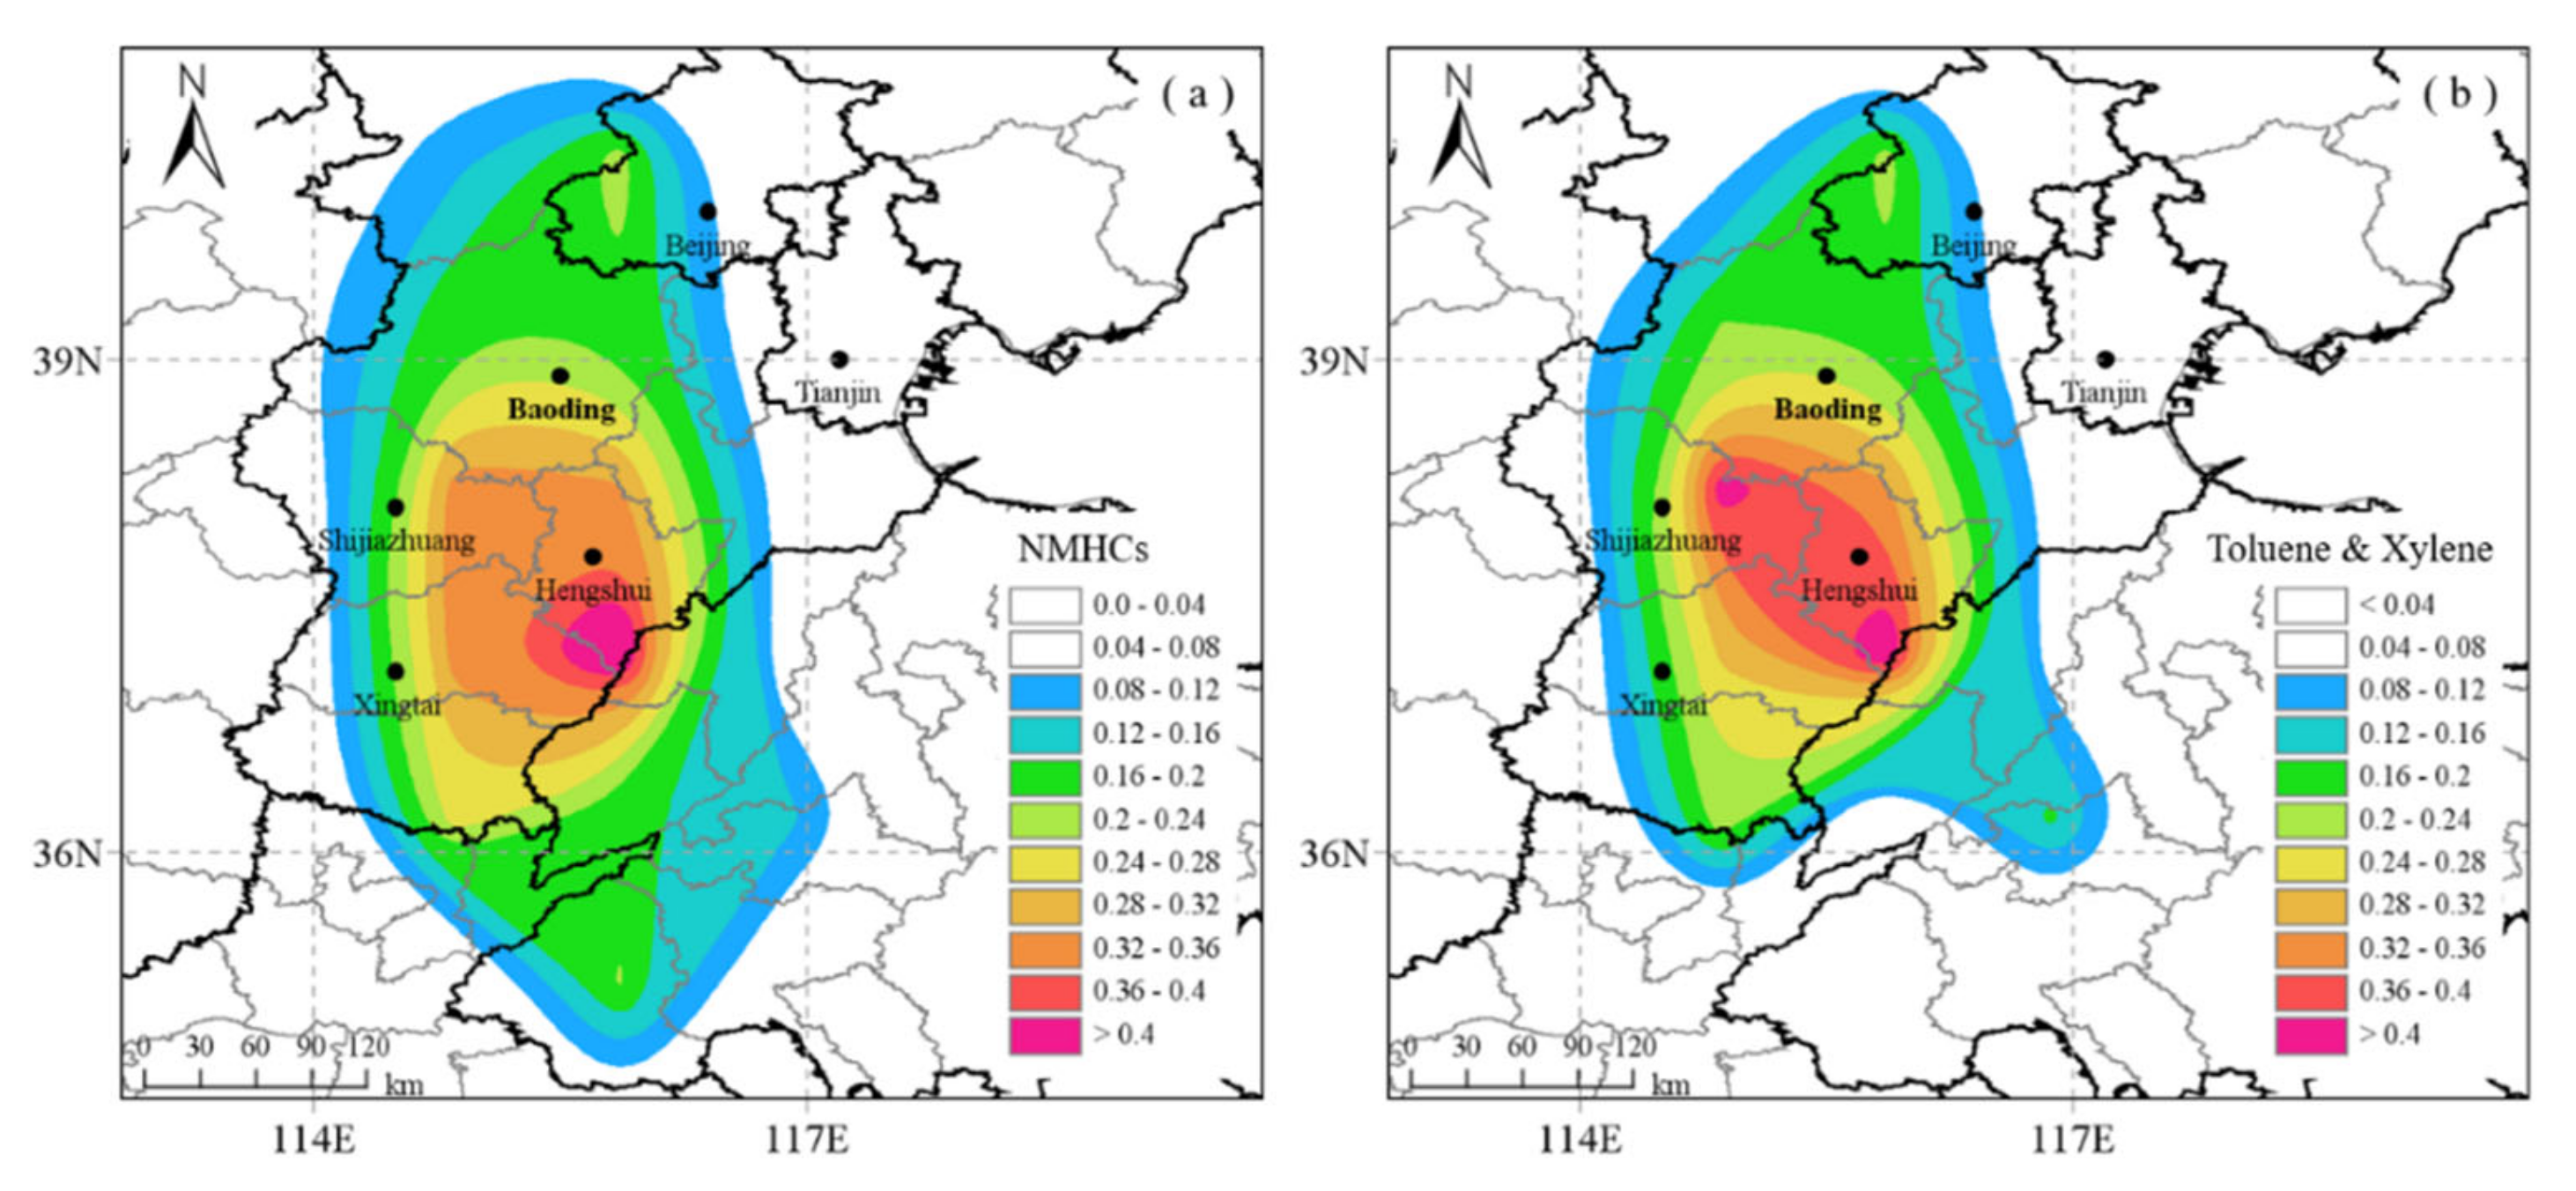
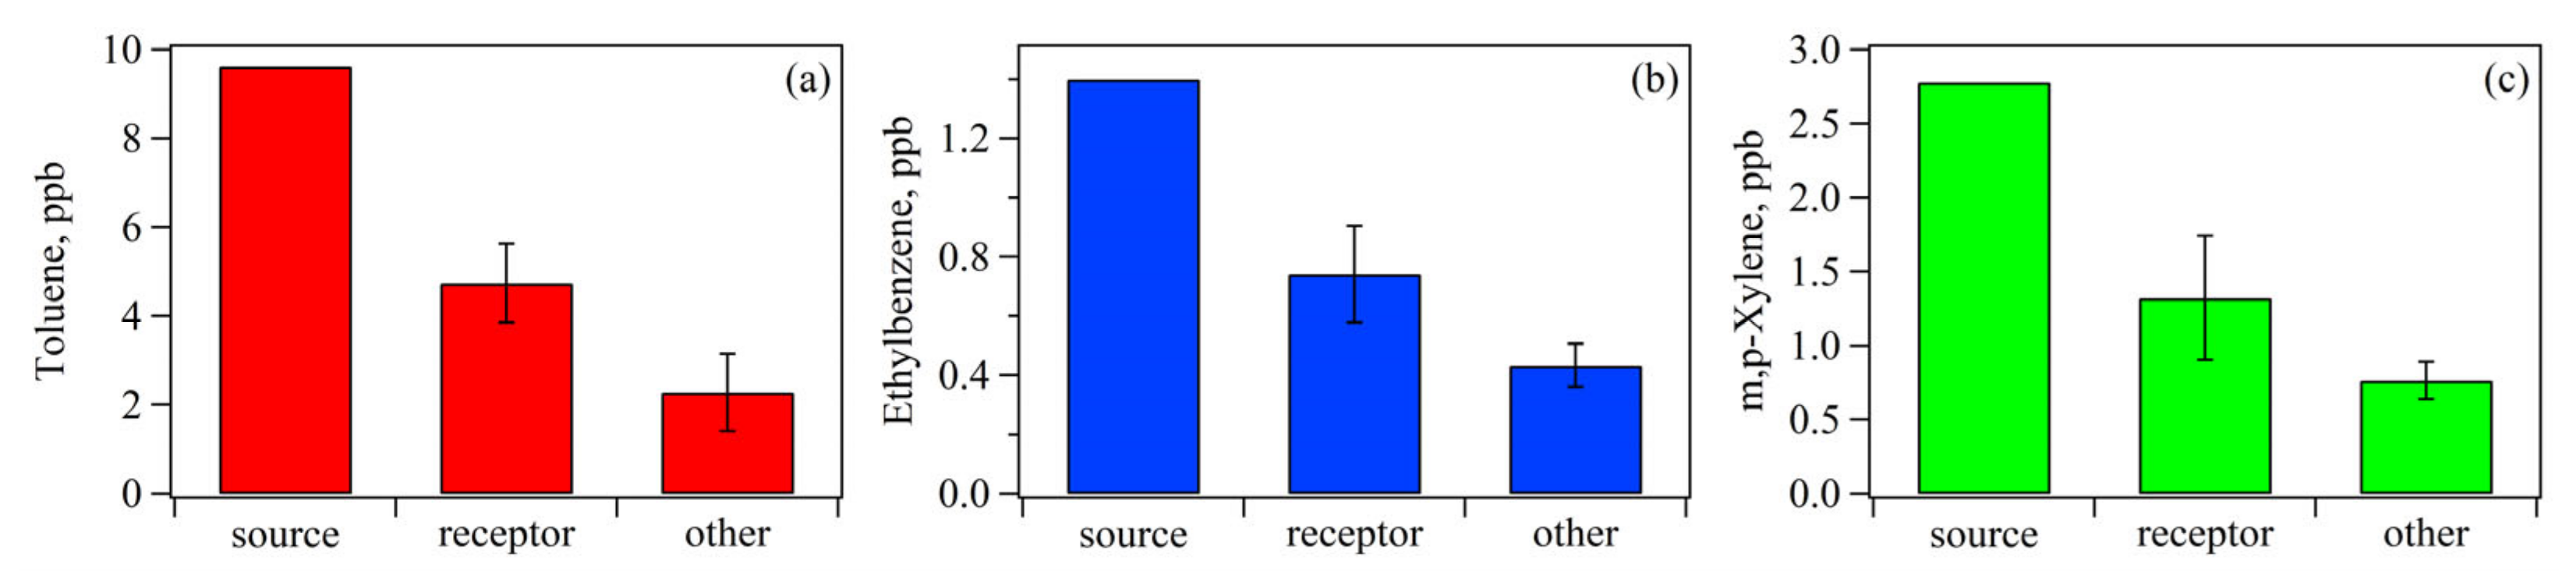
3.1.3. Influence of Transport: Potential Source Contributions and Spatial Distribution of Aromatics Levels

The potential source contribution function (PSCF) analysis using MeteoInfo back trajectories [26] was conducted to qualitatively investigate potential source regions of NMHCs and aromatics online measured at the S1 site. The MeteoInfo is a GIS software for meteorological data visualization and analysis. For back trajectories analysis, the input data include meteorological data (Global Data Assimilation System (GDAS) provided by National Centers for Environmental Prediction (NCEP), ftp://arlftp.arlhq.noaa.gov/pub/archives/gdas1), date and simulation time (72 h), and site location (longitude and latitude) and the highest altitude (500 m) of air masses. Then, time series of mixing ratios for NMHCs, and toluene and xylene were added to trajectories and conduct PSCF analysis. The PSCF thresholds for NMHCs, toluene, and xylenes were set as 59.6 ppb, 5.4 ppb, and 4.5 ppb, respectively. Potential source regions for NMHCs, toluene, and xylenes were mainly distributed in south of the S1 site, including the south area of Baoding, the east area of Shijiazhuang, the north area of Xingtai, and Hengshui (Figure 4). It should be pointed out that atmospheric lifetimes for NMHCs, especially reactive alkenes and aromatics, are only several hours with average OH radical concentration of 107 molecule/m3, and thus transport distances for reactive NMHC species are about tens of kilometers at the average wind speed of 2 m/s. This means that the potential source regions for these reactive species were possibly mainly concentrated in the south area of Baoding. However, it should be pointed out that the PSCF results possibly have large uncertainty due to the lack of meteorological data with high spatial resolution. In this study, we only preliminarily infer that ambient VOCs measured in this study possibly influenced by those cities in south of Baoding, but hardly determine detailed locations of emission sources.
The two largest automobile factories in Baoding are located in south the S1 site with distance of about 7 km. Offline measurements of NMHCs at 8 sites during September 17th, 2015 were used as a case to investigate influence of transport on aromatic levels. According to the southwest dominant wind direction during this day, the eight offline sites were divided into three categories, including source (the S8 site, close to the largest automobile factory), receptor (i.e., sites in downwind of automobile factories, including the S3, S5–S7, and S9 sites), and other sites (the S2 and S4 sites). As shown in Figure 5, toluene, ethylbenzene, and m,p-xylene all showed the largest mixing ratios at the source site, with values of 9.6 ppb, 1.4 ppb, and 2.8 ppb, respectively. Additionally, it was found that average levels for these aromatics at the receptor sites were about twice of values for the other sites. These findings imply the influence of transport from automobile factories on aromatics levels.

3.2. Source Apportionment of NMHCs

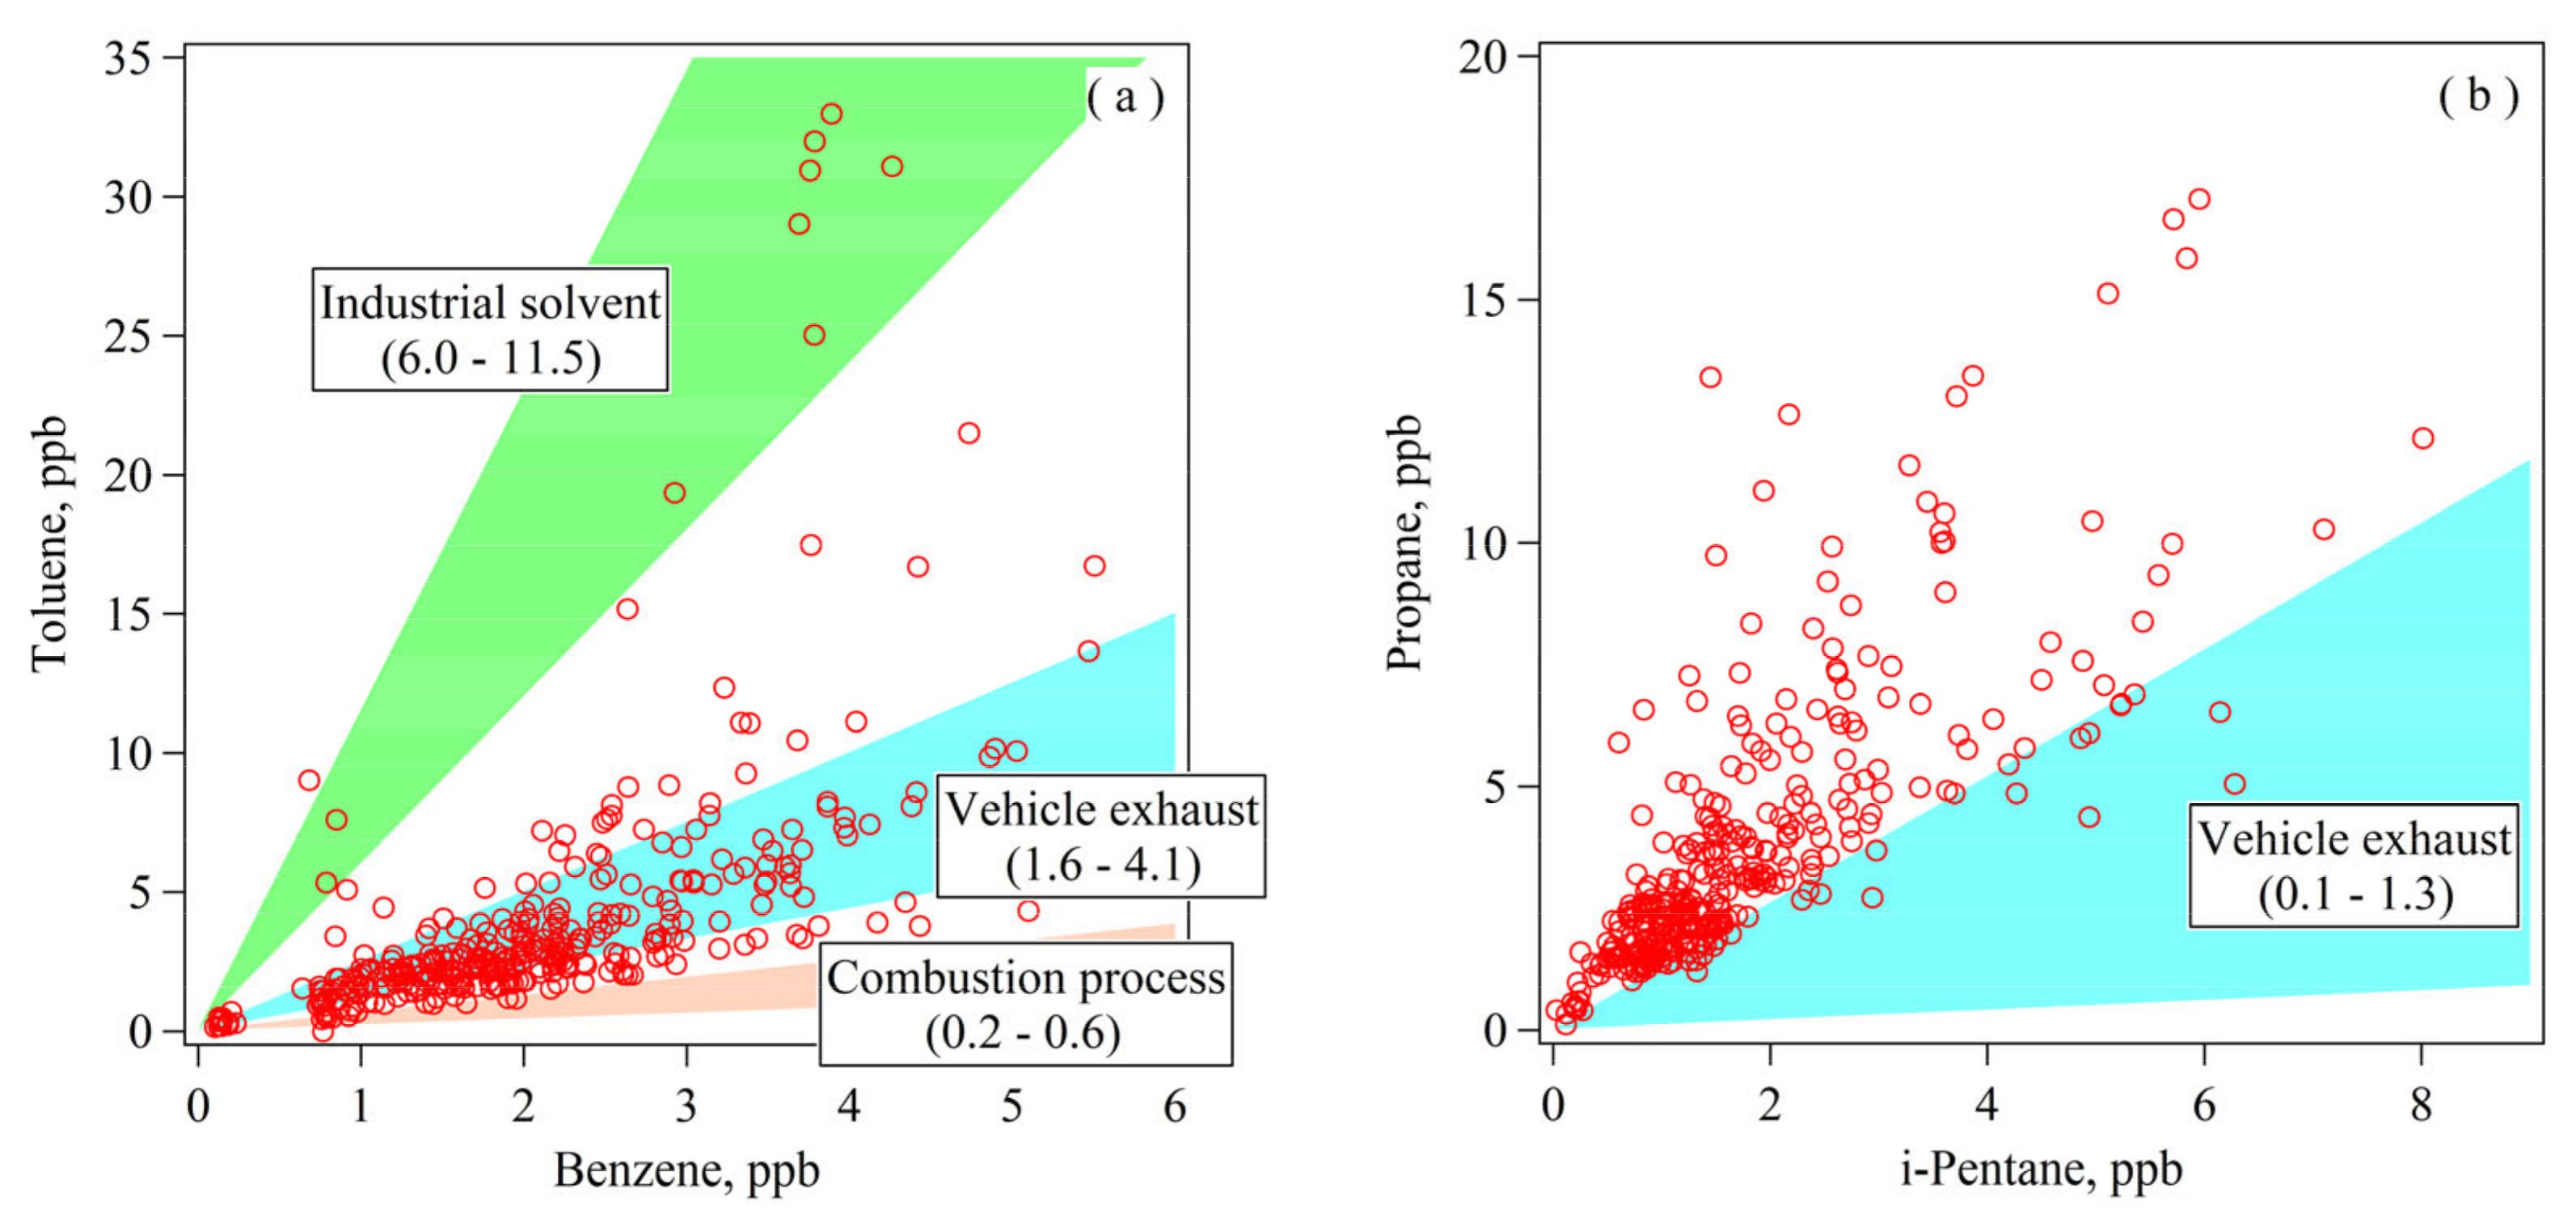
3.2.1. Preliminary Analysis of NMHC Sources Using Ratios

Ratios of two NMHC species can be used to preliminarily analyze NMHCs sources prior to source apportionment by a receptor model. In this study, ratios of toluene versus benzene (T/B) and propane versus i-pentane (P/I) were calculated based on online measurements. In urban atmosphere, benzene was considered mainly emitted from combustion processes, such as vehicle exhaust emissions and coal combustion etc. [8,25]. In addition to combustion sources, toluene can also be influenced by paint and solvents use [27]. Previous studies reported that T/B values in an industrial area of the pearl river delta (PRD) region were in the range of 6.0–6.9 ppb/ppb [28]. For paint and solvents usage, T/B value reached 11.5 ppb/ppb [29]. T/B values from vehicular exhaust determined by tunnel experiments were 1.6–4.1 ppb/ppb [27,30,31]. T/B values from other combustion processes (e.g., coal combustion, and biomass burning) were in the range of 0.2–0.6 ppb/ppb [27]. As shown in Figure 6a, most of online measured T/B ratios fell on or above the line for vehicular exhaust, suggesting the combined affect from vehicular exhaust and paint and solvent usage. Propane was associated with the leakage or use of liquefied petroleum gas (LPG), while i-pentane was mainly emitted from vehicular exhaust and gasoline evaporation [32]. The P/I ratios from tunnel experiments were in the range of 0.1–1.3 ppb/ppb [31,33,34,35]. As shown in Figure 6b, the online measured P/I ratios were mainly above the ratio from tunnel experiment, illustrating that ambient propane was not only related to vehicular exhaust but also influenced by LPG usage.

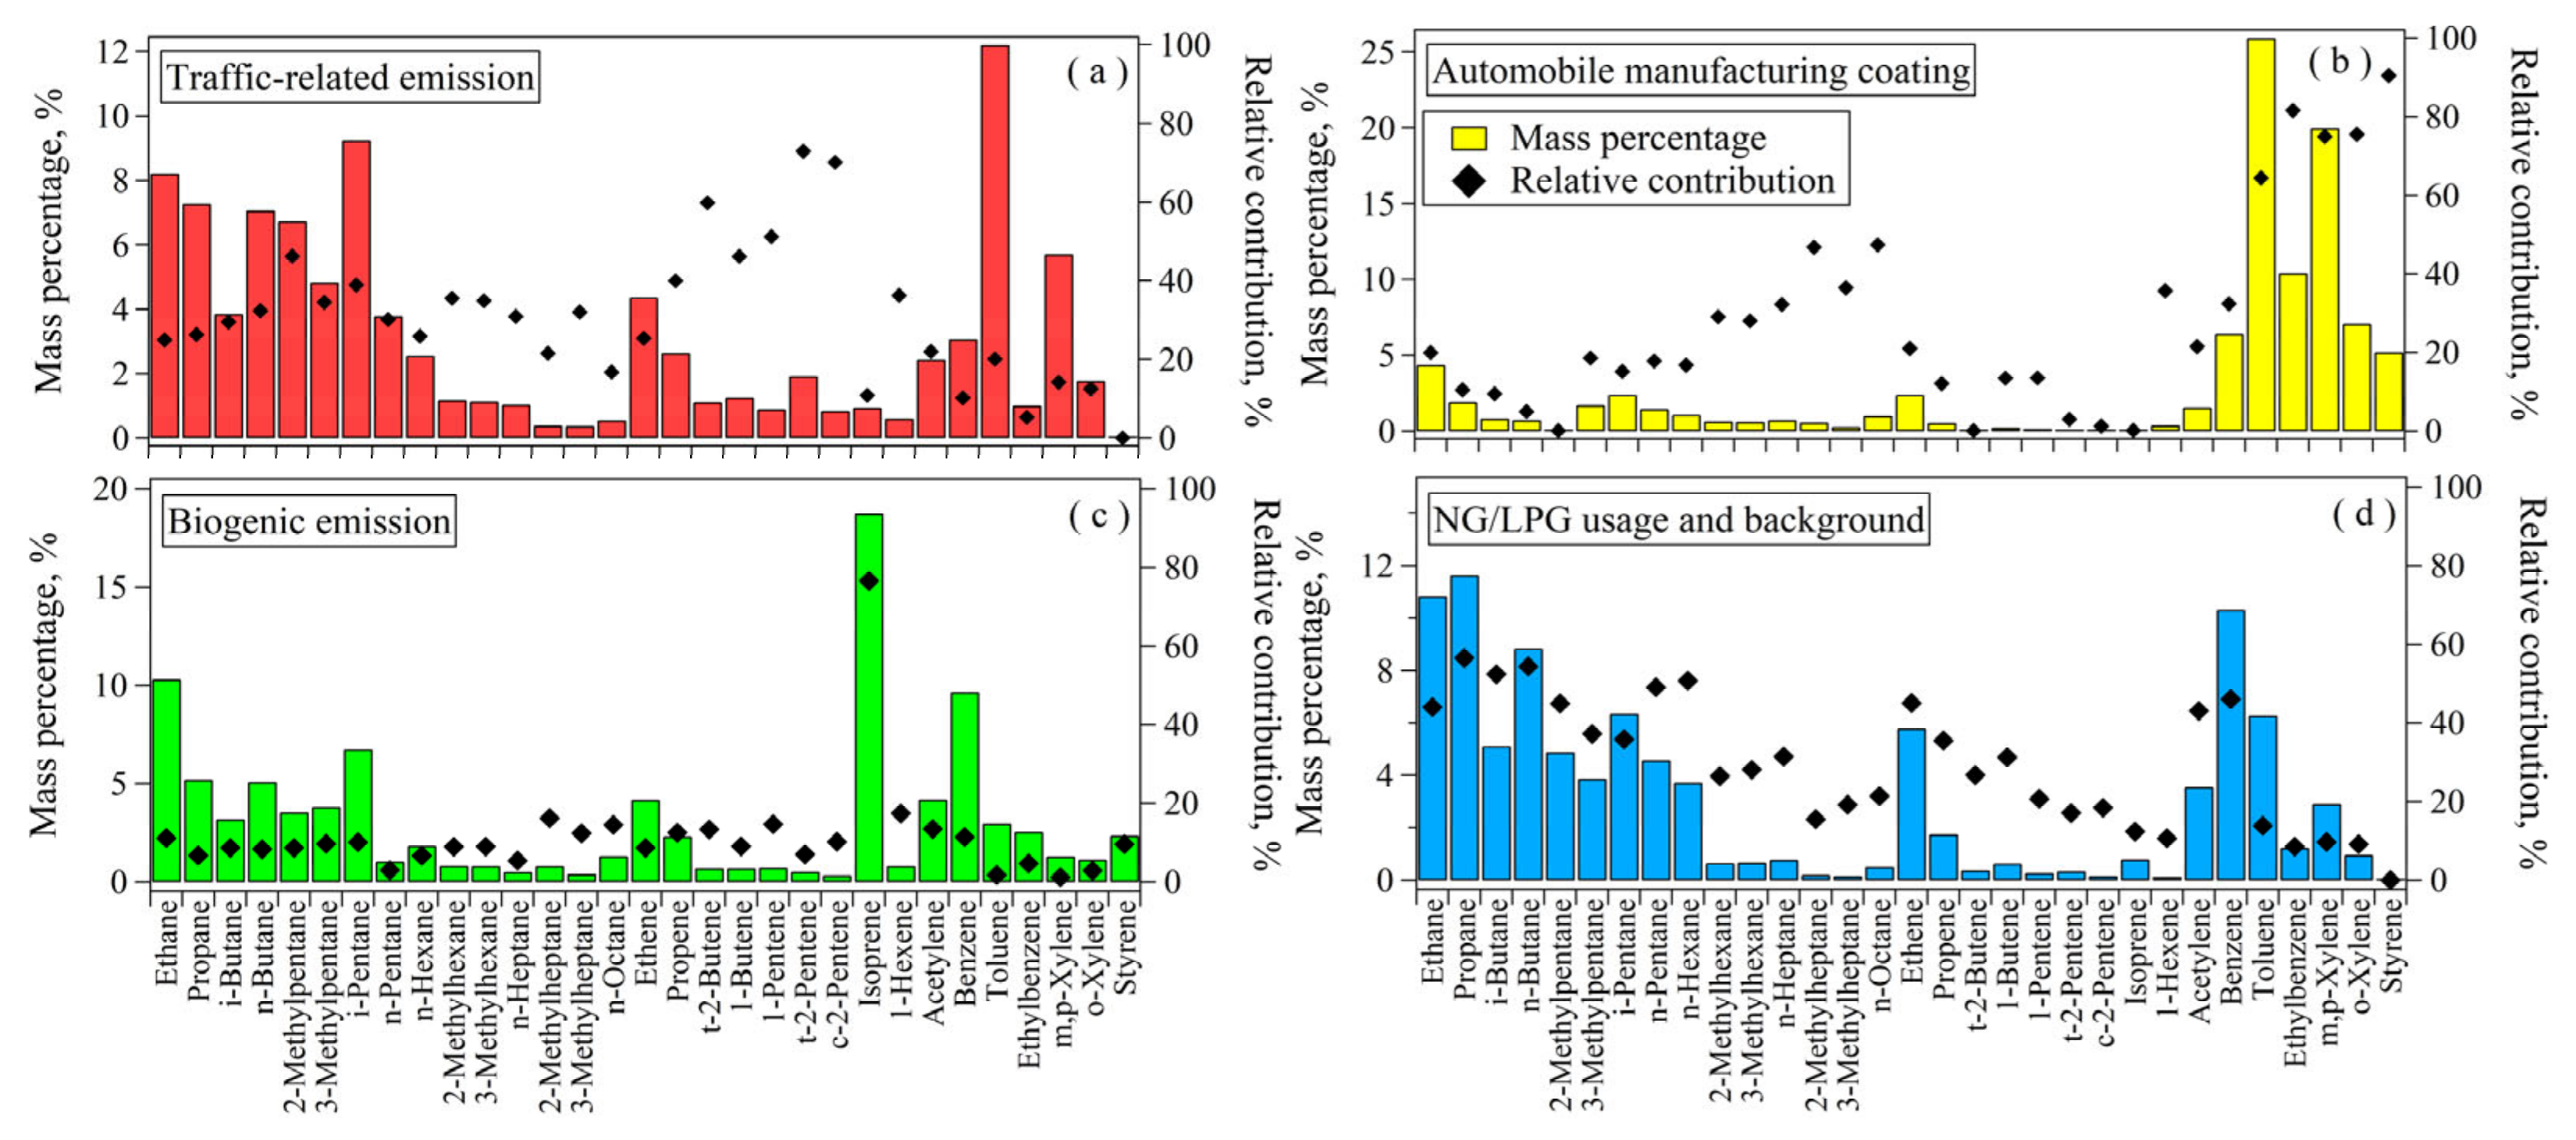
3.2.2. Identification of PMF-Resolved Factors

Online measurements for 30 NMHC species were inputted into the PMF 5.0 for source apportionment, including 14 alkanes, 9 alkenes, acetylene, and 6 aromatics (Figure 7). These species were mainly selected based on their signal versus noise (S/N) values, indications for sources, and ambient levels. Those species with S/N values greater than five, high mixing ratios, and potential tracers for individual sources were given a priority in selection. Furthermore, PMF solutions with 3–8 factors were tested. When more than four factors were solved, one of these factors will be decomposed into several factors that cannot be explained by an individual source, and therefore the number of factors was finally determined as four. Figure 7 shows chemical profiles for these four factors.
Factor 1 was characterized by its high relative contributions to C4–C5 alkenes, with values of 46.2–72.9% (Figure 7a). In urban area, C4–C5 alkenes were mainly emitted from vehicular exhaust and gasoline evaporation [17], and thus factor 1 was identified as traffic-related emission. Factor 2 was characterized by high abundance of C7–C8 aromatics, including toluene, ethylbenzene, xylenes, and styrene, with mass percentages of 5.2–25.9% and relative contributions of 32.4–90.4%, respectively (Figure 7b). Several studies have reported that C7–C8 aromatics were important components of paint and solvents [36]. Automobile manufacturing is one important industry in Baoding and a lot of paints are used in for surface coating of automobile. Therefore, factor 2 was identified as automobile manufacturing coating. Isoprene was the dominant NMHC species in factor 3 (Figure 7c). Isoprene has been reported to be mainly emitted from plants during daytime of summer [37], and thus factor 3 was considered as biogenic emission. Factor 4 was characterized by high levels of light alkanes and benzene (Figure 7d). Ethane and propane are commonly used tracers for leakage or use of natural gas (NG) and LPG, respectively [38]. In addition, relative contributions of factor 4 to acetylene and benzene reached to 43.0% and 46.0%, respectively. Ethane, propane, acetylene, and benzene all have long atmospheric lifetimes, and thus they possibly exist in background air masses. Therefore, factor 4 was identified as NG/LPG usage and background.
To further check identification of PMF-resolved factors, diurnal variation patterns for relative contributions of anthropogenic sources and biogenic source to NMHCs mass concentrations were analyzed and shown in Figure 8. Anthropogenic sources showed higher relative contributions to NMHCs during night and morning (about 70%) (Figure 8a), while biogenic source showed higher contributions at noon and afternoon (about 30%) (Figure 8b). These patterns were in accordance with emission characteristics of anthropogenic and biogenic sources. Anthropogenic NMHCs emissions were mainly related to human activities, while biogenic emission was in favor of high solar radiation and temperature at moon and afternoon [25].

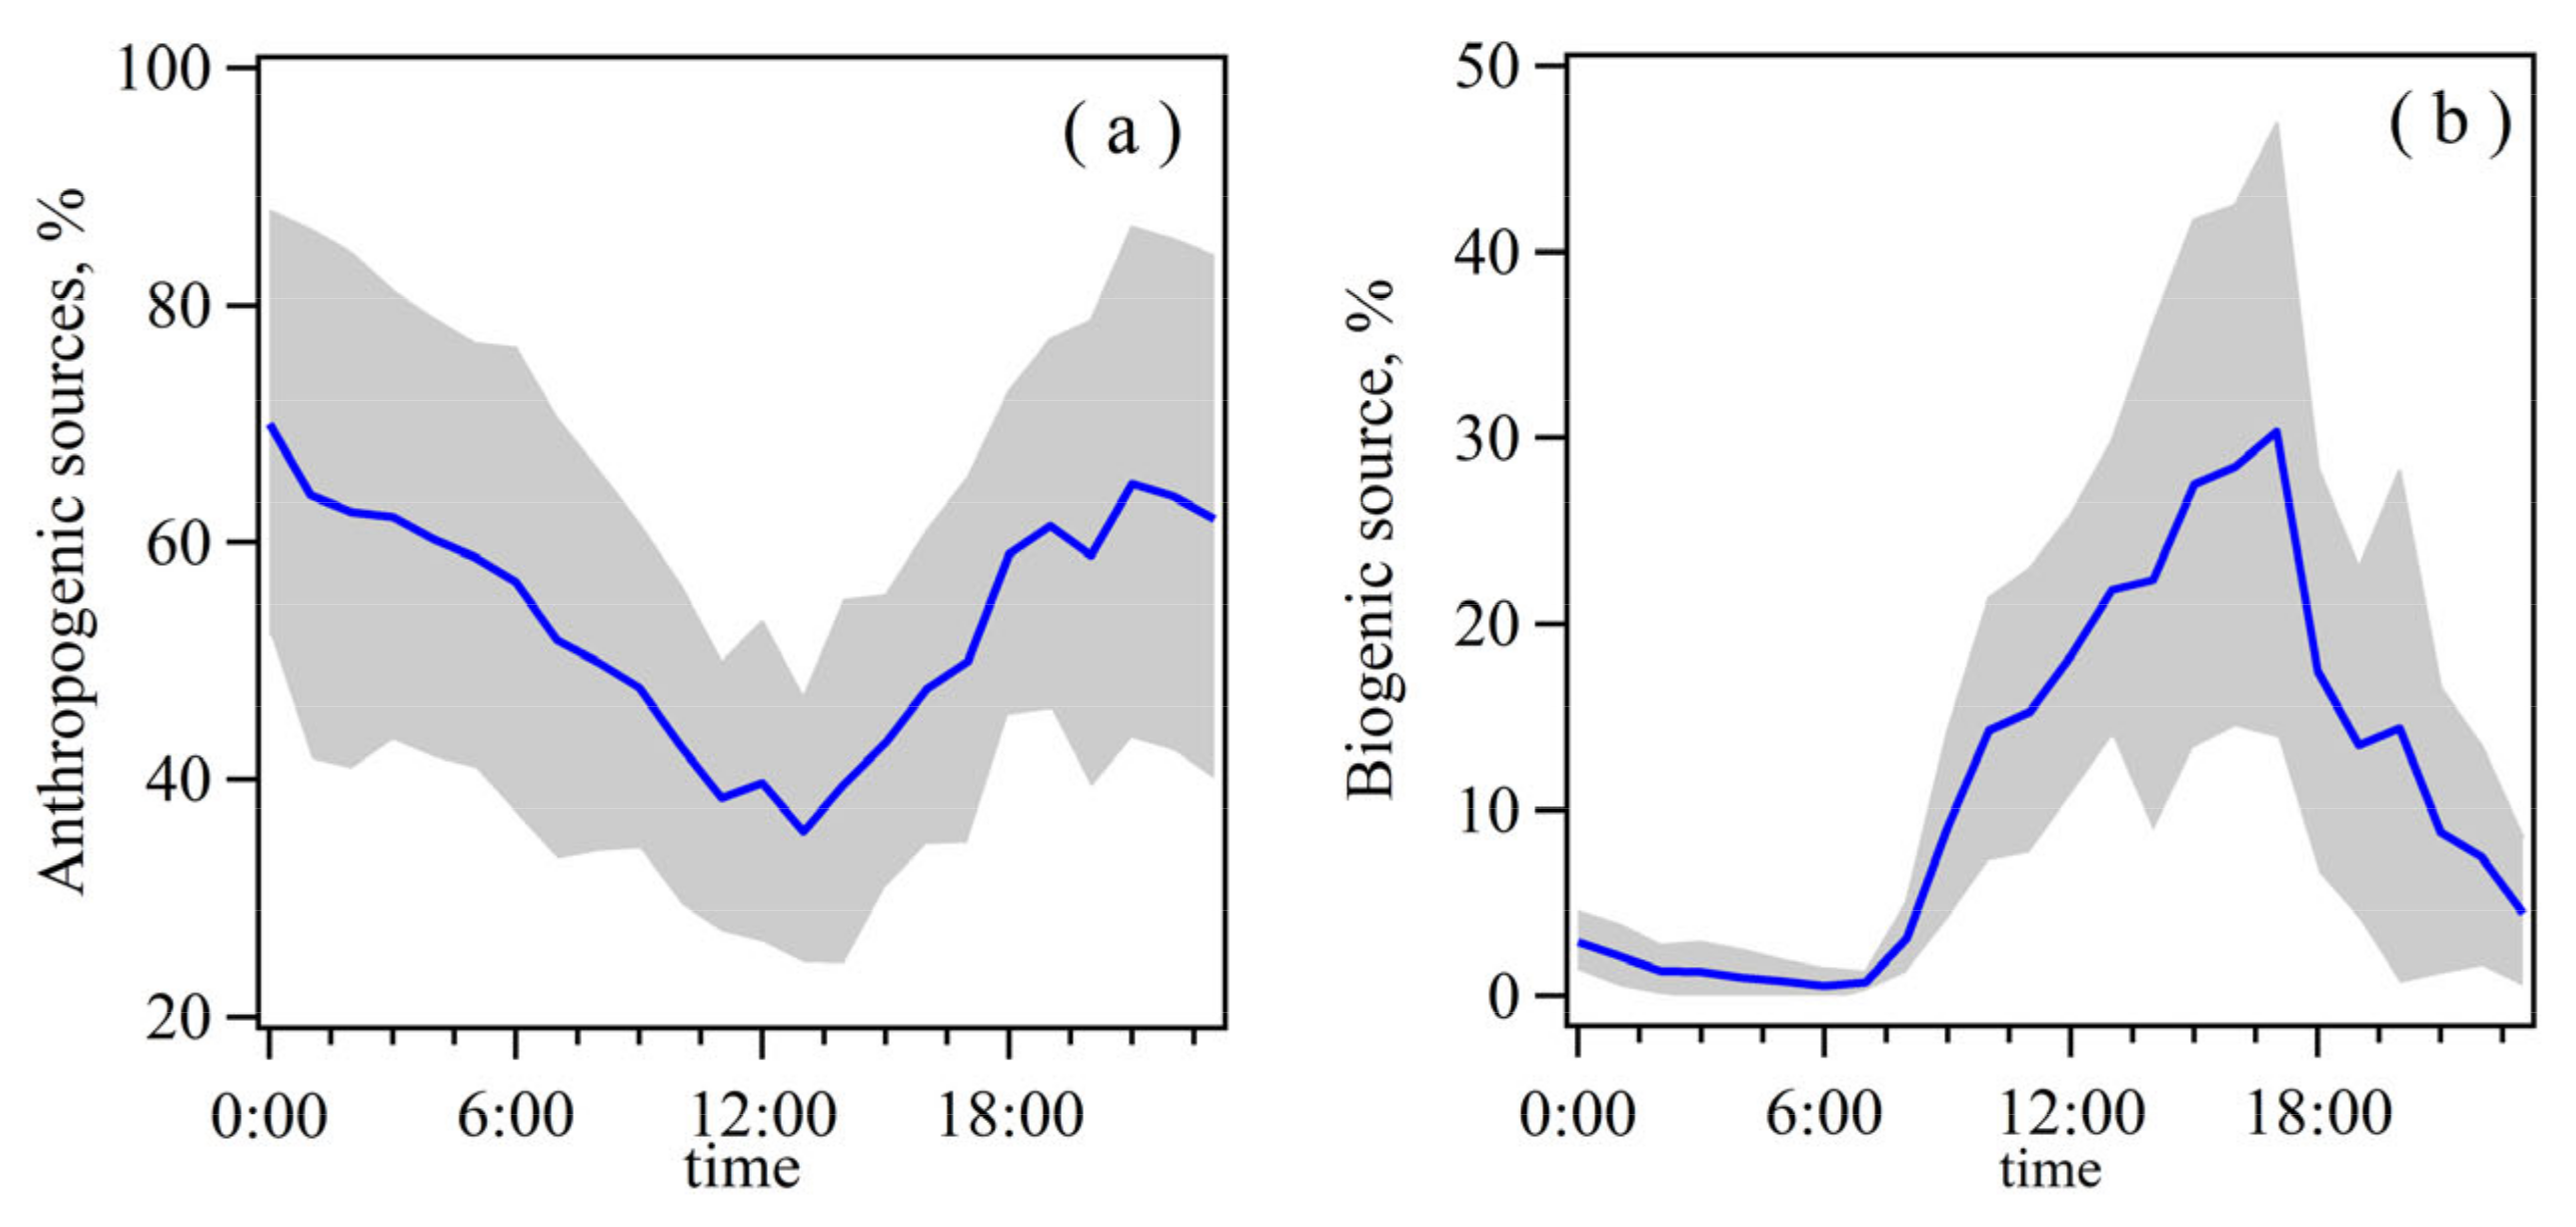
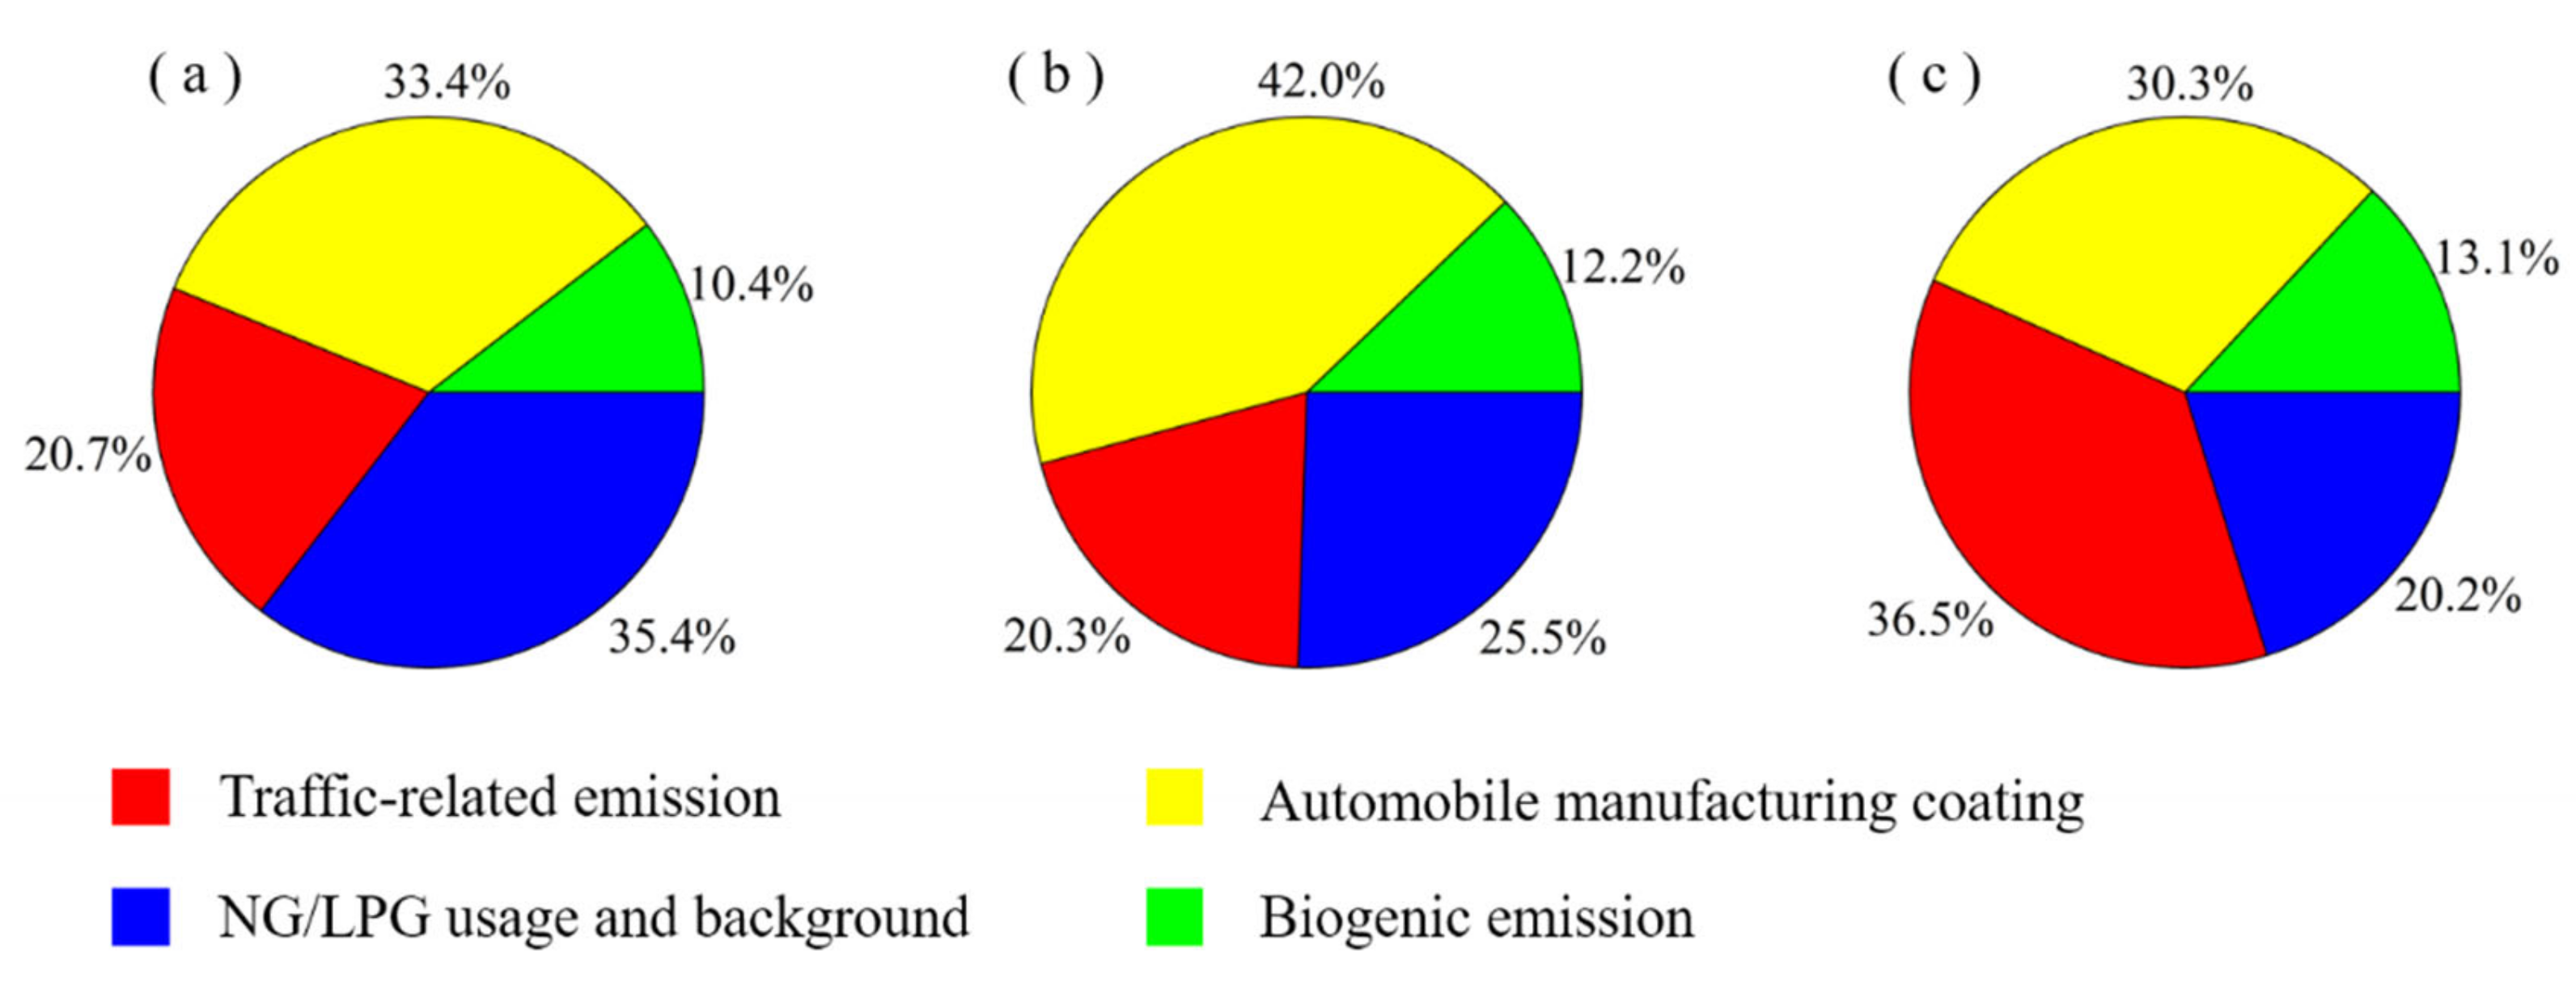
3.2.3. Relative Contributions of Individual Sources to Ambient NMHCs Concentrations

Figure 9 shows average relative contribution of individual sources to online measured NMHCs mass concentrations during the entire observation period, two O3 pollution days (September 16th–17th), and two clean days (September 25th–26th). During the entire measurement period, NG/LPG usage and background and automobile manufacturing coating contributed 35.4% and 33.4% of total mass concentrations of 30 NMHC species, respectively (Figure 9a). Average relative contributions from traffic-related emission and biogenic emission were 20.7% and 10.4%, respectively. In these two O3 pollution days, average relative contribution for automobile manufacturing coating increased to 42.0%, followed by NG/LPG usage and background (25.5%), traffic-related emission (20.3%), and biogenic emission (12.2%) (Figure 9b). During two clean days, relative contribution from automobile manufacturing coating and NG/LPG usage and background decreased to 30.3% and 20.2%, while those for traffic-related emission and biogenic emission increased to 36.5% and 13.1%, respectively (Figure 9c).
Relative contribution from paint and solvents use (i.e., automobile manufacturing coating) to NMHCs mass concentrations in Baoding was 33.4%, close to results for Shanghai (23–32%) [18,39] and Bolu, Turkey (31%) [40], little higher than result for Beijing (18–30%) [8], Nanjing (12–30%) [19,41,42], and Huston, U.S. (13.4%) [23]. Relative contribution from traffic-related emission in Baoding (20.7%) was lower than Huston (29.6%) [23], Beijing (32–68%) [8,9], Shanghai (40–48%) [18,39], and Nanjing (39–71%) [19,41,42], but little higher than Bolu, Turkey (18%) [40]. Additionally, relative contribution from NG/LPG usage and background in Baoding (35.4%) was close to Beijing (18–38%) [8,9] and much higher than Nanjing (9%) [19], little lower than Huston, U.S. (44.1%) [23].

3.3. Roles of NMHCs in O3 Formation

3.3.1. O3 Pollution Episodes

Understanding roles of NMHCs and NOX in O3 formation is the basis for developing effective O3 control measures. In this study, online measurements of O3 and its precursors during an O3 pollution episode (September 14th–18th) were used to further investigate sensitivity of O3 formation to its precursors. Figure 10 shows time series of wind vector, temperature, and ambient levels of NO, NO2, O3, CO, and NMHCs during this pollution episode. NMHCs and NO2 showed a similar diurnal variation pattern with high levels during night and morning, while O3 concentrations showed a peak at 13:00–15:00. This suggests that O3 was mainly from photochemical production during this episode. The dominant wind direction was southwest and average wind speed was 1.8 ± 1.0 m/s. Daily maximum hourly average O3 concentration during this episode ranged from 146.0 μg/m3 to 180.4 μg/m3, close to values of 155–241 μg/m3 for Beijing, Shanghai, Guangzhou, and Chongqing reported by Tan et al. (2019) [43]. Ambient levels of NOX and NMHCs were in the range of 21.8–196.2 μg/m3 and 19.6–165.4 ppb, with mean values of 82.7 ± 48.8 μg/m3 and 57.7 ± 33.9 ppb, respectively.

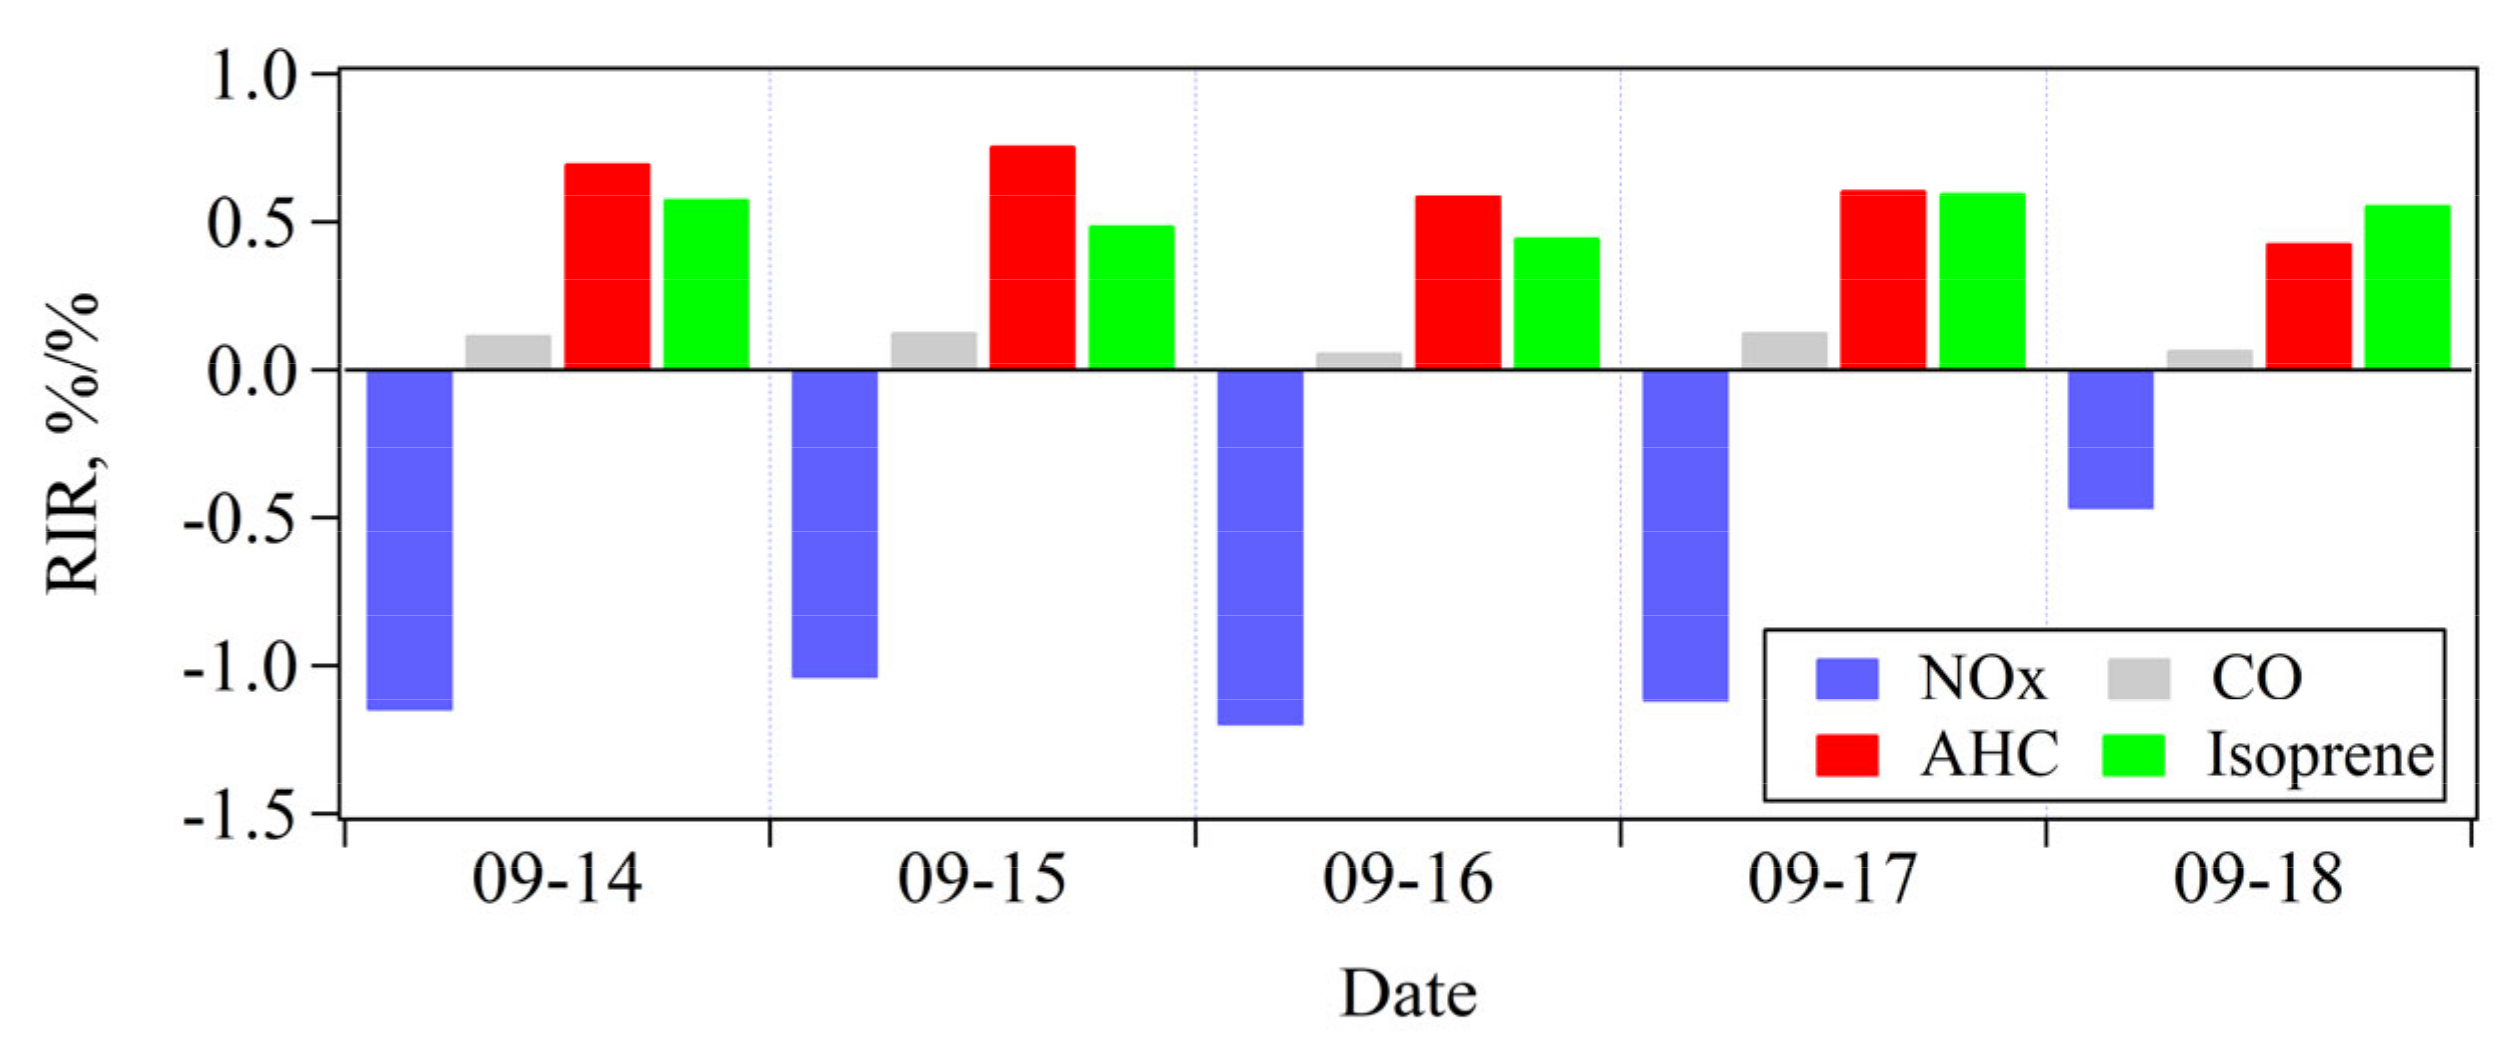
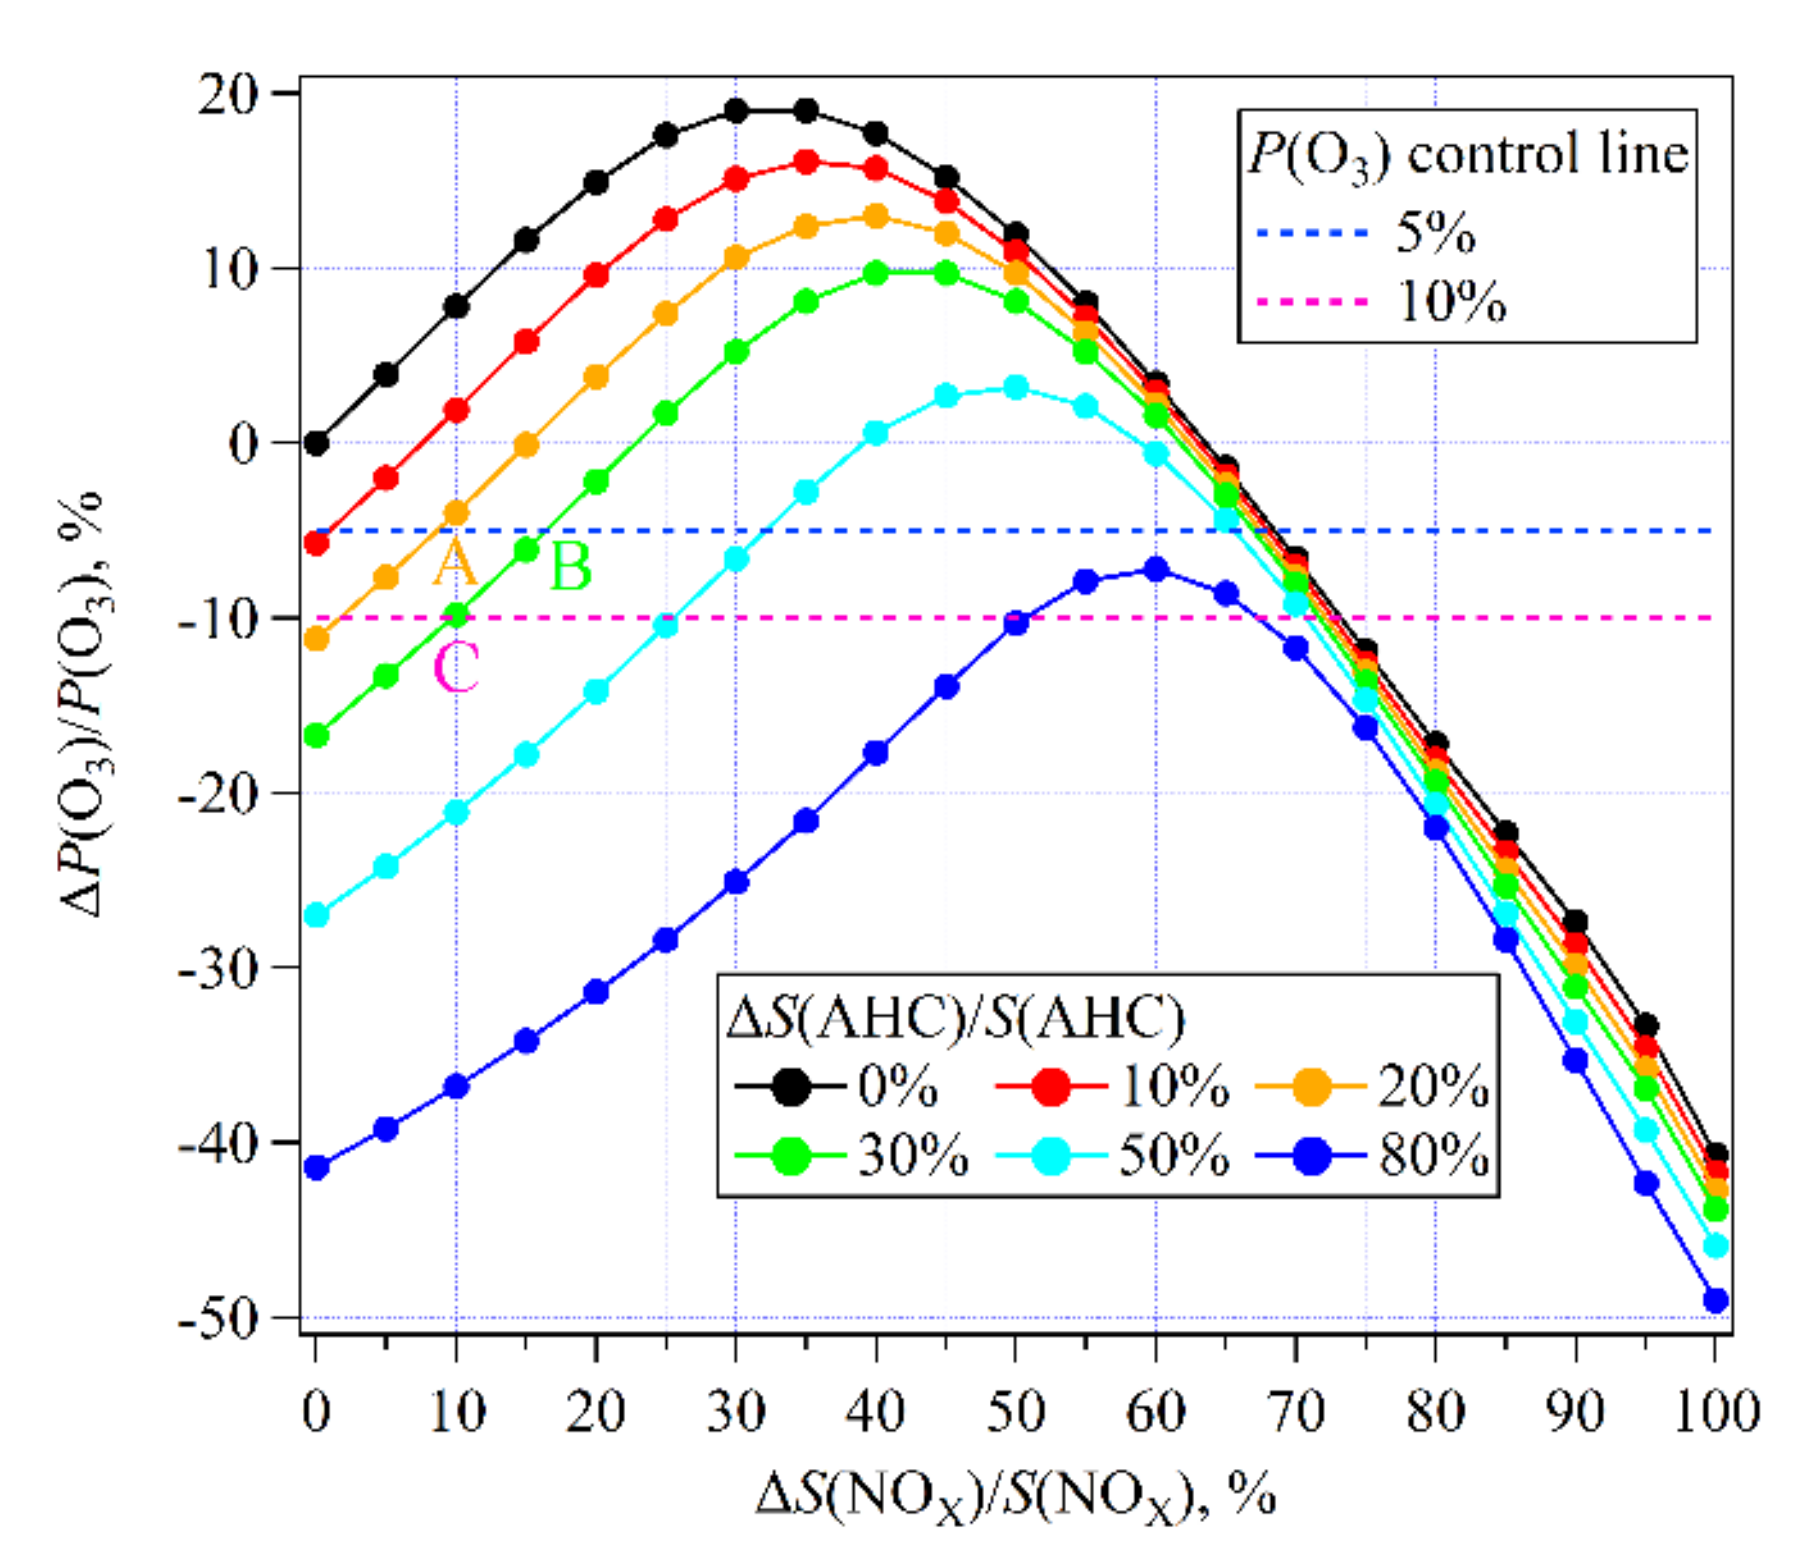
3.3.2. O3 Sensitivity to NMHCs and NOX

RIR values for NOx, CO, isoprene, and anthropogenic hydrocarbons (AHC) during each day of the O3 pollution episode were calculated by the OBM and shown in Figure 11. RIR values of AHC and isoprene were both positive, in the range of 0.43–0.76%/% and 0.45–0.60%/%, respectively. This suggests that reduction of NMHCs would decrease O3 production. Although RIR values for CO were also positive, its values were 0.06–0.13%/%, significantly lower than those for NMHCs. This implies that NMHCs played a more important role in O3 formation than CO. Contrary with NMHCs and CO, RIR values of NOX were negative, with values ranging from −1.20%/% to −0.47%/%, indicating that the reduction of NOx may lead to an increase in O3 production. The RIR results for NMHCs and NOx suggests that O3 formation during this episode was in NOx-titration regime (i.e., highly NMHCs-limited regime). This finding was similar to results obtained in the PRD region [36] and Beijing [43], where O3 formation was also mainly controlled by NMHCs, but different with result in Nanjing, where O3 formation was both controlled by NMHCs and NOx (i.e., in transition regime) [25].
Considering it is hardly to reduce biogenic emission, scenario analyses on relationship of O3 formation with its precursors reduction mainly focused on AHC and NOX. In this study, 120 scenarios combing AHC and NOX reductions were designed. Relative reductions for S(NOx) ranged from 0 to 100%, with an interval of 5%. S(AHC) were reduced by 10%, 20%, 30%, 50%, and 100%. Figure 12 shows the relationship of relative change for O3 production changes (ΔP(O3)/P(O3)) with relative reductions of S(AHC) and S(NOX). As shown in the black line, if S(AHC) did not change, P(O3) would increase with NOX reduction and reach maximum at the scenario with ΔS(NOX)/S(NOX) of 30%. After that, P(O3) began to decrease and reached the initial value with ΔS(NOX)/S(NOX) of 64%. That means that if anthropogenic NMHCs emission were not reduced, NOx emission need to be reduced by greater than 64% and then O3 began to decrease.
Two O3 control objectives, including 5% and 10%, were set for further discussions on O3 control strategies. As shown in Figure 12, the most quick and efficient way to achieve the 5% O3 control objective was reducing AHC by 15% and meanwhile remaining NOx constant. If AHC kept constant, NOx need to be reduced by more than 68% to achieve this control objective. Actually, AHC and NOX are also important precursors of PM2.5 [44], and thus AHC and NOX emissions should be both reduced for synergetic control of PM2.5 and O3. The ratios of ΔS(AHC)/S(AHC) versus ΔS(NOX)/S(NOX) for intersections of the 5% O3 control line with 20% and 30% AHC reduction lines (A and B in Figure 12) were about two. That implies that reducing AHC and NOx by a ratio greater than two seemed to be a more reasonable and feasible way to achieve the 5% O3 control objective. The ratio of ΔS(AHC)/S(AHC) versus ΔS(NOX)/S(NOX) at the intersection of 10% O3 control line with 30% AHC reduction line (C in Figure 12) was three. Therefore, if NOX was reduced by 10%, AHC should be reduced by greater than 30% to achieve the 10% O3 control objective.

3.3.3. Identification of Key Anthropogenic NMHC Species in O3 Formation

In order to determine key NMHC species in O3 formation during this pollution episode, the RIR values for individual NMHC species were also calculated using OBM. In general, the RIR values for AHC species were in range of 0.002–0.168%/%. Figure 13 shows the AHC species with top ten largest RIR values, including seven aromatics and three alkenes, indicating that aromatics and alkenes played key roles in O3 formation. m,p-Xylene and o-xylene had the two largest RIR values. The summed RIR value for xylenes was 0.225%/%, accounting for 36.4% of RIR for total AHC species. Additionally, xylenes have been reported to be important precursors of secondary organic aerosol (SOA) [45]. Based on PMF results, xylenes were dominantly from sources related to automobile manufacturing coating and traffic-related emission, which contributed 75.2% and 13.3% of their mass concentrations, respectively (Figure 13). This means reducing NMHCs emission from automobile manufacturing coating and traffic-related emission should be given priority to control both O3 and PM2.5.

4. Conclusions

Ambient NMHCs were online measured by a cryogen-free automatic GC-MS/FID system at urban site in Baoding during September 2015. Additionally, whole air samples were collected using canisters at eight sites on 9:00 and 13:00 of September 17th and October 8th. Mixing ratios for total NMHCs online measured at the urban site ranged from 13.3 ppb to 165.4 ppb, with average value of 44.5 ± 26.7 ppb. Aromatics was the largest contributor to NMHCs, with fraction of 27.1%, followed by C2–C3 alkanes (23.6%), alkenes & alkynes (21.7%), C4–C5 alkanes (15.0%), and alkanes with carbon atoms more than 5 (12.6%). Average OH loss rate for total measured NMHCs was 11.1 ± 6.4 s−1, with respective contributions from aromatics and anthropogenic alkenes of 35.9% and 32.3%. PSCF analysis for NMHCs, toluene, and xylenes were conducted and found that potential source regions were mainly located in south of the urban site.
Online measurement data for 30 NMHC species were inputted into the PMF model and four factors were resolved, including traffic-related emission, automobile manufacturing coating, biogenic emission, and NG/LPG usage and background. During the entire online measurement period, NG/LPG usage and background was the largest contributor to total mass concentrations of 30 NMHC species, with relative contribution of 35.4%, followed by automobile manufacturing coating (33.4%), traffic-related emission (20.7%), and biogenic emission (10.4%). Relative contribution of automobile manufacturing coating increased to 42.0% during the O3 pollution episode.
Sensitivity of O3 formation to its precursors during September 14th–18th (an O3 pollution episode) was then investigated using OBM. RIR values of AHC and isoprene were both positive, in the range of 0.43–0.76%/% and 0.45–0.60%/%, respectively. However, RIR values of NOX were negative, with values ranging from −1.20%/% to −0.47%/%, suggesting that O3 formation during this episode was in NOx-titration regime. Scenarios combing AHC and NOX reductions were then designed to further discuss O3 control strategies. Results suggested that if NOX was reduced by 10%, AHC should be reduced by greater than 20% and 30% to achieve the 5% and 10% O3 control objectives, respectively. In anthropogenic NMHC species, xylenes had the largest RIR value of 0.225%/%, accounting for 36.4% of RIR for total AHC species. PMF results showed that xylenes were dominantly from automobile manufacturing coating and traffic emission, which contributed 75.2% and 13.3% of their mass concentrations. Therefore, these two sources should be given priority to control both O3 and PM2.5.

Author Contributions

Conceptualization, M.W. and W.C.; methodology, M.W. and K.H.; software, K.H., X.S., and W.L.; resources, X.L.; data curation, K.H. and X.L.; writing—original draft preparation, M.W. and K.H.; writing—review and editing, M.W. and W.C.; supervision, M.W.; funding acquisition, M.W. All authors have read and agree to the published version of the manuscript.

Funding

This research was funded by the National Key R&D Program of China (grant number 2016YFC0202200) and the National Natural Science Foundation of China (grant number 41505113).

Acknowledgments

We are grateful for financial support from the National Key R&D Program of China (grant number 2016YFC0202200) and the National Natural Science Foundation of China (grant number 41505113).

Conflicts of Interest

The authors declare no conflict of interest.

References

  1. Guo, H.; Ling, Z.; Cheng, H.; Simpson, I.J.; Lyu, X.; Wang, X.; Shao, M.; Lu, H.; Ayoko, G.; Zhang, Y.; et al. Tropospheric volatile organic compounds in China. Sci. Total Environ. 2017, 574, 1021–1043. [Google Scholar] [CrossRef] [PubMed] [Green Version]
  2. Tan, Z.; Lu, K.; Dong, H.; Hu, M.; Li, X.; Liu, Y.; Lu, S.; Shao, M.; Su, R.; Wang, H.; et al. Explicit diagnosis of the local ozone production rate and the ozone-NOx-VOC sensitivities. Sci. Bull. 2018, 63, 1067–1076. [Google Scholar] [CrossRef] [Green Version]
  3. Lu, H.; Lyu, X.; Cheng, H.; Ling, Z.; Guo, H. Overview on the spatial–temporal characteristics of the ozone formation regime in China. Environ. Sci. Process. Impacts 2019, 21, 916–929. [Google Scholar] [CrossRef] [PubMed]
  4. Liu, Z.; Wang, Y.; Gu, D.; Zhao, C.; Huey, L.G.; Stickel, R.; Liao, J.; Shao, M.; Zhu, T.; Zeng, L.; et al. Summertime photochemistry during CAREBeijing-2007: ROx budgets and O3 formation. Atmos. Chem. Phys. 2012, 12, 7737–7752. [Google Scholar] [CrossRef] [Green Version]
  5. Lu, K.; Zhang, Y.; Su, H.; Brauers, T.; Chou, C.; Hofzumahaus, A.; Liu, S.; Kita, K.; Kondo, Y.; Shao, M.; et al. Oxidant (O3 + NO2) production processes and formation regimes in Beijing. J. Geophys. Res. Atmos. 2010, 115, D07303. [Google Scholar]
  6. Zhang, Q.; Yuan, B.; Shao, M.; Wang, X.; Lu, S.; Lu, K.; Wang, M.; Chen, L.; Chang, C.C.; Liu, S.C. Variations of ground-level O3 and its precursors in Beijing in summertime between 2005 and 2011. Atmos. Chem. Phys. 2014, 14, 6089–6101. [Google Scholar] [CrossRef] [Green Version]
  7. Tang, X.; Wang, Z.; Zhu, J.; Gbaguidi, A.E.; Wu, Q.; Li, J.; Zhu, T. Sensitivity of ozone to precursor emissions in urban Beijing with a Monte Carlo scheme. Atmos. Environ. 2010, 44, 3833–3842. [Google Scholar] [CrossRef]
  8. Wang, M.; Shao, M.; Chen, W.; Lu, S.; Liu, Y.; Yuan, B.; Zhang, Q.; Zhang, Q.; Chang, C.C.; Wang, B.; et al. Trends of non-methane hydrocarbons (NMHC) emissions in Beijing during 2002–2013. Atmos. Chem. Phys. 2015, 15, 1489–1502. [Google Scholar] [CrossRef] [Green Version]
  9. Gao, J.; Zhang, J.; Li, H.; Li, L.; Xu, L.; Zhang, Y.; Wang, Z.; Wang, X.; Zhang, W.; Chen, Y.; et al. Comparative study of volatile organic compounds in ambient air using observed mixing ratios and initial mixing ratios taking chemical loss into account—A case study in a typical urban area in Beijing. Sci. Total Environ. 2018, 628–629, 791–804. [Google Scholar] [CrossRef]
  10. Xue, L.; Wang, T.; Louie, P.K.K.; Luk, C.W.Y.; Blake, D.R.; Xu, Z. Increasing External Effects Negate Local Efforts to Control Ozone Air Pollution: A Case Study of Hong Kong and Implications for Other Chinese Cities. Environ. Sci. Technol. 2014, 48, 10769–10775. [Google Scholar] [CrossRef] [Green Version]
  11. Wang, M.; Zeng, L.; Lu, S.; Shao, M.; Liu, X.; Yu, X.; Chen, W.; Yuan, B.; Zhang, Q.; Hu, M.; et al. Development and validation of a cryogen-free automatic gas chromatograph system (GC-MS/FID) for online measurements of volatile organic compounds. Anal. Methods 2014, 6, 9424–9434. [Google Scholar] [CrossRef]
  12. Liu, Y.; Shao, M.; Lu, S.; Liao, C.; Wang, J.; Chen, G. Volatile organic compound (VOC) measurements in the pearl river delta (PRD) region, China. Atmos. Chem. Phys. 2008, 8, 1531–1545. [Google Scholar] [CrossRef] [Green Version]
  13. Wang, B.; Shao, M.; Lu, S.; Yuan, B.; Zhao, Y.; Wang, M.; Zhang, S.; Wu, D. Variation of ambient non-methane hydrocarbons in Beijing city in summer 2008. Atmos. Chem. Phys. 2010, 10, 5911–5923. [Google Scholar] [CrossRef] [Green Version]
  14. Cardelino, C.A.; Chameides, W.L. An Observation-Based Model for Analyzing Ozone Precursor Relationships in the Urban Atmosphere. J. Air Waste Manage. Assoc. 1995, 45, 161–180. [Google Scholar] [CrossRef]
  15. EPA. EPA Positive Matrix Factorization (PMF) 5.0 Fundamentals and User Guide; United States Environmental Protection Agency: Washington, DC, USA, 2014.
  16. Atkinson, R.; Baulch, D.L.; Cox, R.A.; Crowley, J.N.; Hampson, R.F.; Hynes, R.G.; Jenkin, M.E.; Rossi, M.J.; Troe, J.; Subcommittee, I. Evaluated kinetic and photochemical data for atmospheric chemistry: Volume II—Gas phase reactions of organic species. Atmos. Chem. Phys. 2006, 6, 3625–4055. [Google Scholar] [CrossRef] [Green Version]
  17. Song, Y.; Shao, M.; Liu, Y.; Lu, S.; Kuster, W.; Goldan, P.; Xie, S. Source Apportionment of Ambient Volatile Organic Compounds in Beijing. Environ. Sci. Technol. 2007, 41, 4348–4353. [Google Scholar] [CrossRef]
  18. Cai, C.; Geng, F.; Tie, X.; Yu, Q.; An, J. Characteristics and source apportionment of VOCs measured in Shanghai, China. Atmos. Environ. 2010, 44, 5005–5014. [Google Scholar] [CrossRef]
  19. Shao, P.; An, J.; Xin, J.; Wu, F.; Wang, J.; Ji, D.; Wang, Y. Source apportionment of VOCs and the contribution to photochemical ozone formation during summer in the typical industrial area in the Yangtze River Delta, China. Atmos. Res. 2016, 176-177, 64–74. [Google Scholar] [CrossRef]
  20. Lyu, X.; Chen, N.; Guo, H.; Zhang, W.; Wang, N.; Wang, Y.; Liu, M. Ambient volatile organic compounds and their effect on ozone production in Wuhan, central China. Sci. Total Environ. 2016, 541, 200–209. [Google Scholar] [CrossRef] [PubMed]
  21. Mo, Z.; Shao, M.; Lu, S.; Niu, H.; Zhou, M.; Sun, J. Characterization of non-methane hydrocarbons and their sources in an industrialized coastal city, Yangtze River Delta, China. Sci. Total Environ. 2017, 593-594, 641–653. [Google Scholar] [CrossRef]
  22. Tang, J.; Chan, L.; Chan, C.; Li, Y.; Chang, C.; Liu, S.; Wu, D.; Li, Y. Characteristics and diurnal variations of NMHCs at urban, suburban, and rural sites in the Pearl River Delta and a remote site in South China. Atmos. Environ. 2007, 41, 8620–8632. [Google Scholar] [CrossRef]
  23. Leuchner, M.; Rappenglück, B. VOC source–receptor relationships in Houston during TexAQS-II. Atmos. Environ. 2010, 44, 4056–4067. [Google Scholar] [CrossRef]
  24. Na, K.; Kim, Y.P.; Moon, K.-C.; Moon, I.; Fung, K. Concentrations of volatile organic compounds in an industrial area of Korea. Atmos. Environ. 2001, 35, 2747–2756. [Google Scholar] [CrossRef]
  25. Wang, M.; Chen, W.; Zhang, L.; Qin, W.; Zhang, Y.; Zhang, X.; Xie, X. Ozone pollution characteristics and sensitivity analysis using an observation-based model in Nanjing, Yangtze River Delta Region of China. J. Environ. Sci. 2020, 93, 13–22. [Google Scholar] [CrossRef]
  26. Wang, Y. An Open Source Software Suite for Multi-Dimensional Meteorological Data Computation and Visualisation. J. Open Res. Softw. 2019, 7, 21. [Google Scholar] [CrossRef] [Green Version]
  27. Liu, Y.; Shao, M.; Fu, L.; Lu, S.; Zeng, L.; Tang, D. Source profiles of volatile organic compounds (VOCs) measured in China: Part I. Atmos. Environ. 2008, 42, 6247–6260. [Google Scholar] [CrossRef]
  28. Chan, L.; Chu, K.; Zou, S.; Chan, C.; Wang, X.; Barletta, B.; Blake, D.R.; Guo, H.; Tsai, W. Characteristics of non-methane hydrocarbons (NMHCs) in industrial, industrial-urban, and industrial-suburban atmospheres of the Pearl River Delta (PRD) region of south China. J. Geophys. Res. 2006, 111. [Google Scholar] [CrossRef] [Green Version]
  29. Yuan, B.; Shao, M.; Lu, S.; Wang, B. Source profiles of volatile organic compounds associated with solvent use in Beijing, China. Atmos. Environ. 2010, 44, 1919–1926. [Google Scholar] [CrossRef]
  30. Zhang, Q.; Wu, L.; Fang, X.; Liu, M.; Zhang, J.; Shao, M.; Lu, S.; Mao, H. Emission factors of volatile organic compounds (VOCs) based on the detailed vehicle classification in a tunnel study. Sci. Total Environ. 2018, 624, 878–886. [Google Scholar] [CrossRef]
  31. Song, C.; Liu, Y.; Sun, L.; Zhang, Q.; Mao, H. Emissions of volatile organic compounds (VOCs) from gasoline- and liquified natural gas (LNG)-fueled vehicles in tunnel studies. Atmos. Environ. 2020, 234, 117626. [Google Scholar] [CrossRef]
  32. Wang, M.; Li, S.; Zhu, R.; Zhang, R.; Zu, L.; Wang, Y.; Bao, X. On-road tailpipe emission characteristics and ozone formation potentials of VOCs from gasoline, diesel and liquefied petroleum gas fueled vehicles. Atmos. Environ. 2020, 223, 117294. [Google Scholar] [CrossRef]
  33. Zhang, Q.; Wu, L.; Liu, M.; Fang, X.; Zhang, J.; Mao, H.; Shao, M.; Lu, S. Pollution characteristics and health risk assessment of VOCs from vehicle exhaust in Nanjing, China. China Environ. Sci. 2016, 36, 3118–3125. (In Chinese) [Google Scholar]
  34. Fu, L.; Shao, M.; Liu, Y.; Liu, Y.; Lu, S.; Tang, D. Tunnel experiment of characteristics and emission factors of volatile organic compounds (VOCs) from vehicles. Acta Sci. Circum. 2005, 25, 79–885. (In Chinese) [Google Scholar]
  35. Li, B.; Ho, S.S.H.; Xue, Y.; Huang, Y.; Wang, L.; Cheng, Y.; Dai, W.; Zhong, H.; Cao, J.; Lee, S. Characterizations of volatile organic compounds (VOCs) from vehicular emissions at roadside environment: The first comprehensive study in Northwestern China. Atmos. Environ. 2017, 161, 1–12. [Google Scholar] [CrossRef] [Green Version]
  36. He, Z.; Wang, X.; Ling, Z.; Zhao, J.; Guo, H.; Shao, M.; Wang, Z. Contributions of different anthropogenic volatile organic compound sources to ozone formation at a receptor site in the Pearl River Delta region and its policy implications. Atmos. Chem. Phys. 2019, 19, 8801–8816. [Google Scholar] [CrossRef] [Green Version]
  37. Chen, W.T.; Shao, M.; Lu, S.H.; Wang, M.; Zeng, L.M.; Yuan, B.; Liu, Y. Understanding primary and secondary sources of ambient carbonyl compounds in Beijing using the PMF model. Atmos. Chem. Phys. 2014, 14, 3047–3062. [Google Scholar] [CrossRef] [Green Version]
  38. Blake, D.R.; Rowland, F.S. Urban Leakage of Liquefied Petroleum Gas and Its Impact on Mexico City Air Quality. Science 1995, 269, 953–956. [Google Scholar] [CrossRef] [Green Version]
  39. Liu, Y.; Wang, H.; Jing, S.; Gao, Y.; Peng, Y.; Lou, S.; Cheng, T.; Tao, S.; Li, L.; Li, Y.; et al. Characteristics and sources of volatile organic compounds (VOCs) in Shanghai during summer: Implications of regional transport. Atmos. Environ. 2019, 215, 116902. [Google Scholar] [CrossRef]
  40. Melike, D.; Odabasi, M.; Yenisoy-Karakaş, S. Source apportionment of biogenic and anthropogenic VOCs in Bolu plateau. Sci. Total Environ. 2020, 731, 139201. [Google Scholar]
  41. Fan, M.; Zhang, Y.; Lin, Y.; Li, L.; Xie, F.; Hu, J.; Mozaffar, A.; Cao, F. Source apportionments of atmospheric volatile organic compounds in Nanjing, China during high ozone pollution season. Chemosphere 2020, 263, 128025. [Google Scholar] [CrossRef]
  42. Zhao, Q.; Bi, J.; Liu, Q.; Ling, Z.; Shen, G.; Chen, F.; Qiao, Y.; Li, C.; Ma, Z. Sources of volatile organic compounds and policy implications for regional ozone pollution control in an urban location of Nanjing, East China. Atmos. Chem. Phys. 2020, 20, 3905–3919. [Google Scholar] [CrossRef] [Green Version]
  43. Tan, Z.; Lu, K.; Jiang, M.; Su, R.; Wang, H.; Lou, S.; Fu, Q.; Zhai, C.; Tan, Q.; Yue, D.; et al. Daytime atmospheric oxidation capacity in four Chinese megacities during the photochemically polluted season: A case study based on box model simulation. Atmos. Chem. Phys. 2019, 19, 3493–3513. [Google Scholar] [CrossRef] [Green Version]
  44. Huang, X.; Ding, A.; Gao, J.; Zheng, B.; Zhou, D.; Qi, X.; Tang, R.; Wang, J.; Ren, C.; Nie, W.; et al. Enhanced secondary pollution offset reduction of primary emissions during COVID-19 lockdown in China. Natl. Sci. Rev. 2020, 7, nwaa137. [Google Scholar] [CrossRef]
  45. Yang, W.; Li, J.; Wang, M.; Sun, Y.; Wang, Z. A Case Study of Investigating Secondary Organic Aerosol Formation Pathways in Beijing using an Observation-based SOA Box Model. Aerosol Air Qual. Res. 2018, 18, 1606–1616. [Google Scholar] [CrossRef] [Green Version]
Figure 1. Locations of non-methane hydrocarbons (NMHCs) measurement sites in Baoding. The S1 site is for online measurement and the S2–S8 sites are for offline sampling.
Atmosphere 11 01205 g001
Figure 2. Chemical compositions of average (a) NMHCs mixing ratio and (b) OH loss rate from online measurements.
Atmosphere 11 01205 g002
Figure 3. Average diurnal variation pattern for concentrations of (a) NO, (b) NO2, and (c) O3, and mixing ratios of (d) NMHCs, (e) propane, (f) i-pentane, (g) ethylene, (h) isoprene, (i) acetylene, (j) benzene, (k) toluene, and (l) m,p-xylene. Blue lines represent average values and grey shaded areas indicate standard deviations.
Atmosphere 11 01205 g003
Figure 4. Potential source regions of (a) NMHCs and (b) aromatics online measured at the S1 site.
Atmosphere 11 01205 g004
Figure 5. Comparison of average mixing ratios for (a) toluene, (b) ethylbenzene, and (c) m,p-xylene measured at the source, receptor, and other sites.
Atmosphere 11 01205 g005
Figure 6. Scatter plots for (a) toluene versus benzene and (b) propane versus i-pentane based on online measurements at the S1 site.
Atmosphere 11 01205 g006
Figure 7. Chemical profiles of four factors resolved by PMF: (a) traffic-related emission, (b) automobile manufacturing coating, (c) biogenic emission; and (d) NG/LPG usage and background.
Atmosphere 11 01205 g007
Figure 8. Average diurnal variation patterns of relative contributions from (a) anthropogenic sources and (b) biogenic source to NMHCs mass concentrations.
Atmosphere 11 01205 g008
Figure 9. Average relative contribution of individual sources to ambient NMHCs mass concentrations during (a) the entire observation period, (b) two O3 pollution days (September 16th–17th), and (c) two clean days (September 25th–26th).
Atmosphere 11 01205 g009
Figure 10. Time series of (a) wind and temperature, (b) concentrations of NO, NO2, and O3, and (c) mixing ratios of NMHCs during September 14th–18th, 2015.
Atmosphere 11 01205 g010
Figure 11. Daily Relative incremental reactivity (RIR) values for NOX, CO, isoprene, and anthropogenic hydrocarbons (AHC) during the O3 pollution episode.
Atmosphere 11 01205 g011
Figure 12. Relationship of P(O3) relative change with relative reduction of S(NOX) and S(AHC).
Atmosphere 11 01205 g012
Figure 13. Anthropogenic NMHC species with top ten RIR values during the pollution episode.
Atmosphere 11 01205 g013
Table 1. Comparisons of propane, i-pentane, and toluene levels (ppb) measured in different cities.
CityObservation PeriodType of SitePropanei-PentaneTolueneReferences
Baoding2015-09urban4.0 ± 2.91.9 ± 1.34.2 ± 4.7This study
Beijing2005-08urban3.6 ± 2.24.1 ± 2.53.3 ± 1.7[17]
Shanghai2007-01–2010-03urban4.8 ± 2.12.3 ± 1.44.7 ± 4.2[18]
Nanjing2013-08suburb/industrial2.0 ± 1.71.1 ± 1.01.2 ± 1.5[19]
Guangzhou2005-04urban11.3 ± 5.73.8 ± 1.910.0 ± 4.7[22]
Wuhan2014-02–10urban1.91.02.0[20]
Ningbo2012-11–2013-10urban/industrial2.6 ± 2.11.3 ± 1.71.7 ± 2.4[21]
Houston, US2006-08–09industrial13.27.25.1[23]
Ulsan, Korea1997-06industrial9.5 ± 3.52.7 ± 1.23.9 ± 0.9[24]
Publisher’s Note: MDPI stays neutral with regard to jurisdictional claims in published maps and institutional affiliations.

