1. Introduction
Agriculture plays a significant socio-economic role in the development of the Kingdom of Morocco. Nowadays, this sector contributes up to 14% of the gross domestic product (GDP) [
1].
Many scientists have raised concerns about food supply and demand in response to the pressure of a growing population and increased water consumption in the agricultural sector in several developing countries [
2,
3]. Therefore, in an effort to achieve self-sufficiency in agricultural production, designing innovative approaches to predict the climate and land suitability for different types of agriculture is necessary. The net impact of long-term progressive climate change on crop yields is a major concern for both farmers and policymakers at the local, national, and regional levels [
4].
It is axiomatic that inappropriate land use results in land degradation and decline in agricultural productivity. Reliable, accurate land suitability assessment is, therefore, required for the policy-making process to support sustainable agriculture development.
Land suitability analysis (LSA) is a key tool for rational land use planning and optimizing resource use for the present and in the future in several countries, as well as in Morocco. It can be assessed through the identification of the main limiting factors of agricultural production, whose optimum utilization enables decision-makers and farmers to achieve efficient land management. Land suitability is a multi-dimensional problem that involves the combination of numerous factors (topographic, soil, climatic, and management factors). Therefore, its evaluation requires a multi-criteria decision making (MCDM) approach to make proper management decisions, especially where the productivity of the land is limited. Several GIS-based land suitability analyses have been developed, such as fuzzy evaluation and the Boolean overlay [
5,
6]; however, climate suitability has not been sufficiently addressed.
Temperature is a main climatic driver that affects the crop growth rate. The warmer temperatures expected with climate change and the potential for more extreme temperature events, such as drought, will impact water availability and plant productivity [
7,
8].
Climate change could affect crop production through many different mechanisms [
9,
10]. Interestingly, on the one hand, it may have impact on the length of crop season (LCS). In fact, Alexandrov and Hoogenboom [
11] demonstrated that higher temperatures and a precipitation deficit shortened the winter wheat and maize growing seasons and, consequently, decreased their yield. Furthermore, Challinor et al. [
12] found that the optimal temperature should not exceed 36.8 °C, as the mean yields fall significantly due to a shortened crop duration. Moreover, through Providing REgional Climates for Impacts Studies, pronounced pray-sea (PRECIS) model simulations, Jalota et al. [
13] predicted a future reduction in rice and wheat yields associated with a shortening of the growth period due to increased temperature. On the other hand, less frequent and more intense precipitation, in addition to higher evapotranspiration, may increase water stress and diminish crop water productivity, as demonstrated by Amisigo et al. [
14].
In the early 1990s, agricultural activity was extended in areas where the factors of production were abundant (good soil, labor availability, access to inputs, underground and superficial water availability); however, no measure of optimization of these resources was taken into consideration. Today, given the scarcity of resources, it is necessary to adopt scientific methods to evaluate the exploitability of existing lands and to guide future extensions.
Furthermore, many studies have focused on the impacts of climate change on agricultural sustainability with respect to crop productivity, water availability, and demand. However, there is obviously limited literature on the impacts of potential changes in land suitability, which has a critical role in formulating future land policies. Thus, the main objectives of this work are to (1) identify the influencing parameters (climatic and physical) that have an impact on land cropping, (2) generate crop suitability maps based on the weighted combination method of the studied parameters under different climate change scenarios towards 2050, and (3) project the crop behavior with respect to water demand and growing period length under climate change.
2. Study Area
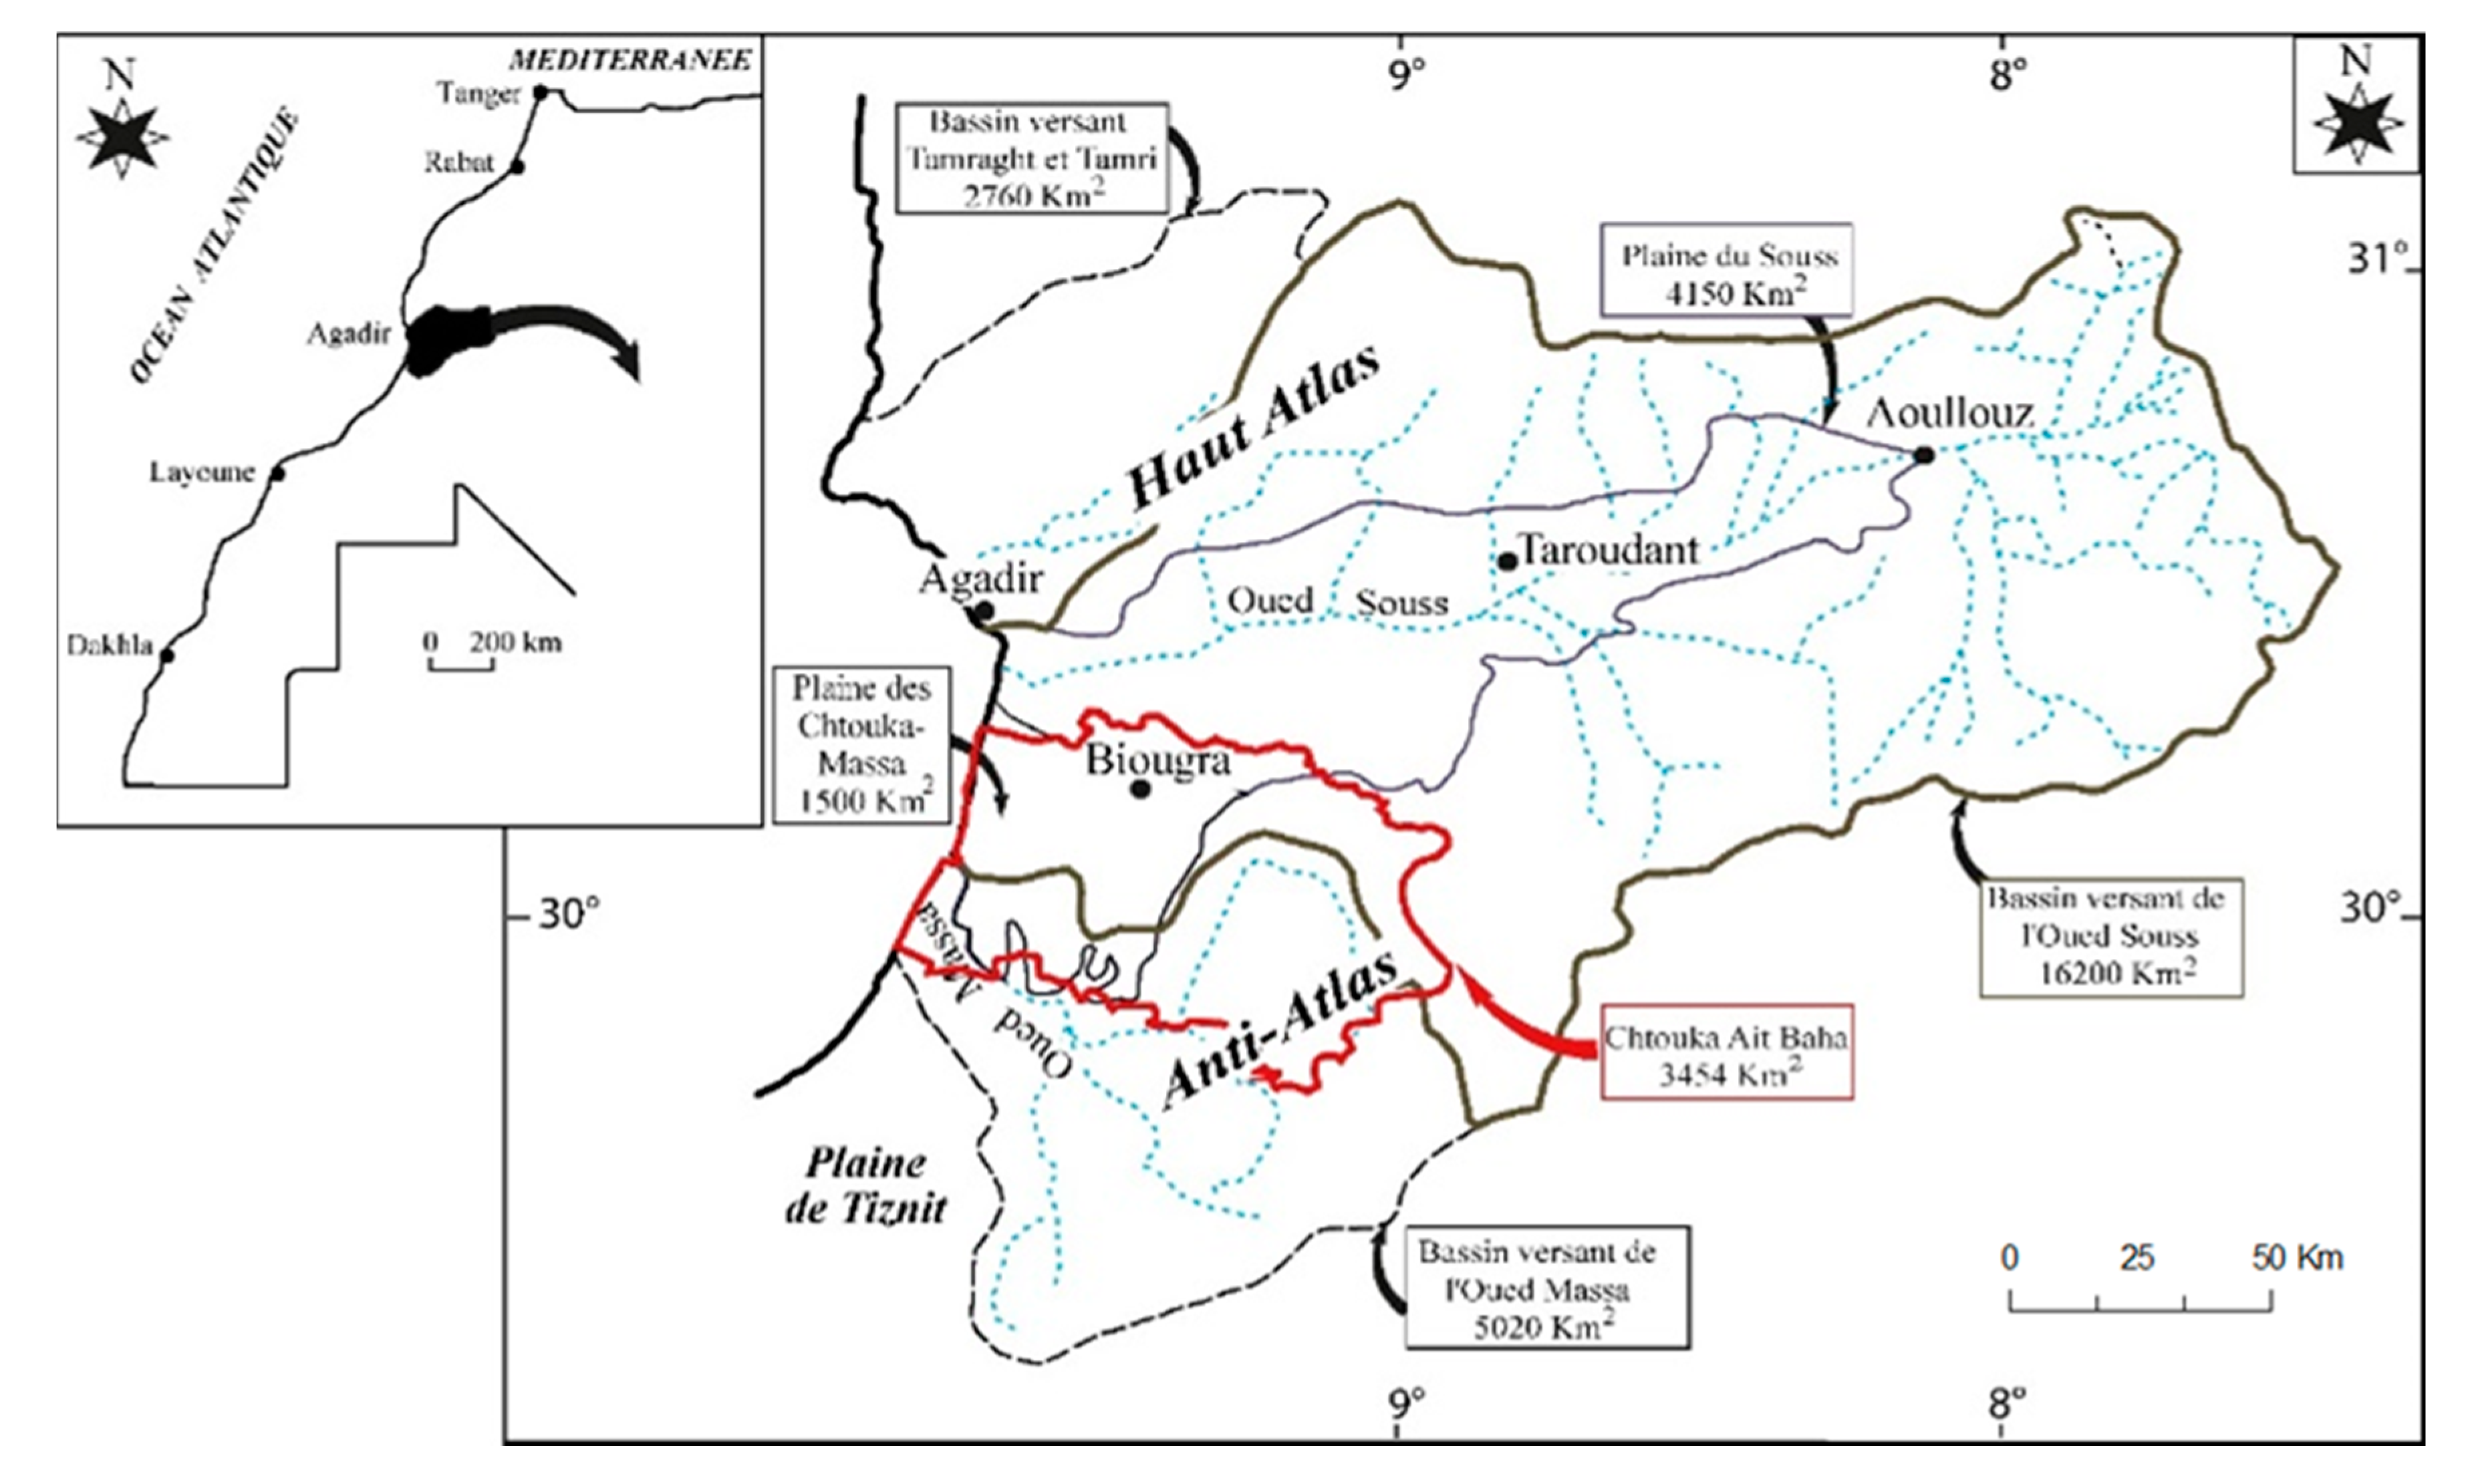
Already known to be the best agricultural area in Morocco, and with a surface of 34,354 km2, Chtouka Ait Baha is considered the agricultural center of the region of Souss–Massa. This area is characterized by a suitably sloping topography, sandy soils, and an existing irrigation network that includes canals from the Youssef Ibn Tachfin dam, with an irrigated area in the Chtouka–Massa plain of 1500 km2. The modern, irrigated agriculture focuses on early crops of high quality that are destined for export markets, which have steadily gained ground internationally in the last ten years.
The region is surrounded to the north by two mountain ranges: The Western High Atlas and the Eastern High Atlas, and in the south, by the Anti-Atlas. To the west is the Atlantic Ocean (
Figure 1).
The combined effect of the influencing parameters determines the suitability of the land for crops and helps further categorize it into different classes. Furthermore, the process of suitability assessment depends significantly upon multi-disciplinary approaches and data from different sources, such as field surveys, field realities, remote sensing imagery, and data from national authorities, which make the analysis more accurate and reliable.
3. Materials and Methods
3.1. Field Surveys and Interviews with Farmers
This section analyzes farmers’ awareness of climate change and the problem of water scarcity through their water management practices and crop choices. Hence, actual data were collected through field surveys and interviews with farmers. The Global Positioning System (GPS) was randomly sampled in the seven designated locations (Sidi Bibi, Ouad Essafa, Biougra, Inchaden, Sidi Oussay, Belfaa, and Ait Amira) that are known for horticultural production. A 200-m circular boundary was considered around each sampled location. Farms in the circle were identified from Sentinel 2A satellite images and then randomly chosen.
Figure A1 was designed to orient the farmers’ survey. Indeed, the sequence of questions was adapted to the situation of each producer to make the questionnaire more effective and to avoid asking questions that were not relevant to the farm context.
Although a detailed survey would provide more accurate information, a rapid survey using certain parameters, such as yields, climate, crops, and water use: (i) crop information: variety, planting date, harvest date, yield, water consumption per growing season for each crop; (ii) climate: data on actual rainfall over the growing season; (iii) irrigation method and frequency over the growing season; and (iv) soil: observed soil texture (from the percentage of soil moisture content, if applicable;
Table A1).
3.2. Climate Projected Data
For future climate data, we used the Coordinated Regional Climate Downscaling Experiment (CORDEX) results concerning Europe at 0.11 degrees of resolution. This dataset also covers the greater part of Morocco, including the Chtouka Aït Baha region. Two emission scenarios, representative concentration pathways (RCP) 4.5 and RCP 8.5, were used for future climate projections (
Figure 2). The choice of these two scenarios was based on their realistic probability of occurrence [
8].
3.3. Projection of the Length of Crop Season
In this study, suitability was related to both land and climate. For the climate suitability of crops, our hypothesis was based on the sum of the growing degree days (GDDs) as key elements that can determine the climatic suitability for crop growth and yield. In agreement with the literature data for the Mediterranean [
15,
16], a point was considered suitable for crop growth where the GDDs required were reached to complete crop maturity and the growing season.
The duration of the length of crop season (LCS) was simulated using the concept of growing degree days (GDD, °C day
−1), adopting the approach described by Saadi et al. [
15] and Badr et al. [
17]:
where
Tmax is the projected daily maximum temperature in °C,
Tmin is the projected daily minimum temperature in °C, and
Tbase is the threshold temperature in °C for crops, which varies (
Table 1).
The LCS corresponds to the number of days necessary for the plant to accumulate a theoretical number of GDDs. The planting dates considered in this study were obtained from the surveys. The daily maximum and minimum temperature were extracted from the CORDEX database, [
8]. Hence, the growing degree-days and cardinal temperatures used in this work were chosen by considering the examination of the field investigations and the abovementioned literature data (
Table 1).
Only annual crops grown under greenhouses were studied. Non-irrigated areas were not relevant for this study as the aim of the survey was to evaluate the water management practices which apply only for irrigated areas. Non-irrigated areas concern mainly Argan forest and forage crops, which do not have enough available data.
3.4. Projection of Evapotranspiration Change
Reference evapotranspiration is the most agronomic parameter that seems to be more affected by climate change as a result of temperature increase. Any change in evapotranspiration will likely have a pronounced effect on agriculture and water resource availability in the studied region.
The main climatic variables affecting evapotranspiration are solar radiation, air temperature, humidity, and wind speed [
4,
21]. Sensitivity analysis is key in understanding the relative importance of these weather parameters to the variation of reference evapotranspiration.
The present study provides a preliminary analysis of the correlation of reference evapotranspiration (ETo) with climatic parameters and its sensitivity to each one for eight weather stations belonging Agrotechnologies Association of Souss Massa, a local non governmental organization, to assess their effect on ETo since the rate of ETo depends on the available climatic parameters.
Historical climatic data used for calibration was obtained from the Agrotechnologies Association of Souss Massa (Agrotech SM; 2011–2015), and ETo was estimated using the FAO-56 Penman–Monteith (P-M) method [
18] and CROPWAT model based on the input data (temperature and precipitation) from CORDEX database obtained using RCP 4.5 and RCP 8.5 projections for 2031–2050.
In the present study, the FAO-56 P-M method was considered for daily ETo estimation; the equation for the estimation is presented as follows [
19]:
where ETo = reference evapotranspiration (mm day
−1),
Rn = net radiation at the crop surface (MJ m
−2 day
−1), G = soil heat flux density (MJ m
−2 day
−1), Tavg = average daily air temperature at 2 m height (°C), Ws = wind speed at 2 m height (ms
−1),
es = saturation vapor pressure (kPa),
ea = actual vapor pressure (kPa), Δ = slope of saturation vapor pressure versus air temperature curve (kPa °C
−1), and γ = psychometric constant (kPa °C
−1).
The principle of sensitivity analysis consists of varying each climate to determine its impact on evapotranspiration. Each variation of a climatic variable was made individually by keeping the others constant. Among several approaches to analyzing the sensitivity and computing sensitivity coefficients, the most common method is to explore the effects of change in each input climatic variable (i.e., T
min, T
max, Rs, RHavg, and Ws) on an output variable (ETo) on a daily basis through a ratio of change expressed as follows [
22]:
where
CS = sensitivity coefficient, Δ
ETo = change in ETo_FAO-PM entrained by the change in a climate variable and Δ
CS = the unit of change in each variable.
3.5. Water Productivity Estimation
Kijne and Barker [
23] developed the concept of water productivity (WP) as a robust measure of the ability of agricultural systems to convert water into food to evaluate the function of irrigation systems as “crop per drop”.
The water productivity of a crop is determined to evaluate the effect of water-savings on crop yield. It can be expressed by the following equation:
where
Y = Crop yield (kg),
I = Irrigation input (m
3),
P = Precipitation (considered insignificant for crops grown in greenhouses) and
WPI +
P = Water productivity based on total water.
3.6. Determination of the Areas Suitable for Cultivation
The methodology used to define land suitability for crops in the present study was based on the processing and combination of a set of data (
Table 2) that are considered the main drivers for land suitability (
Figure 3 and
Figure 4).
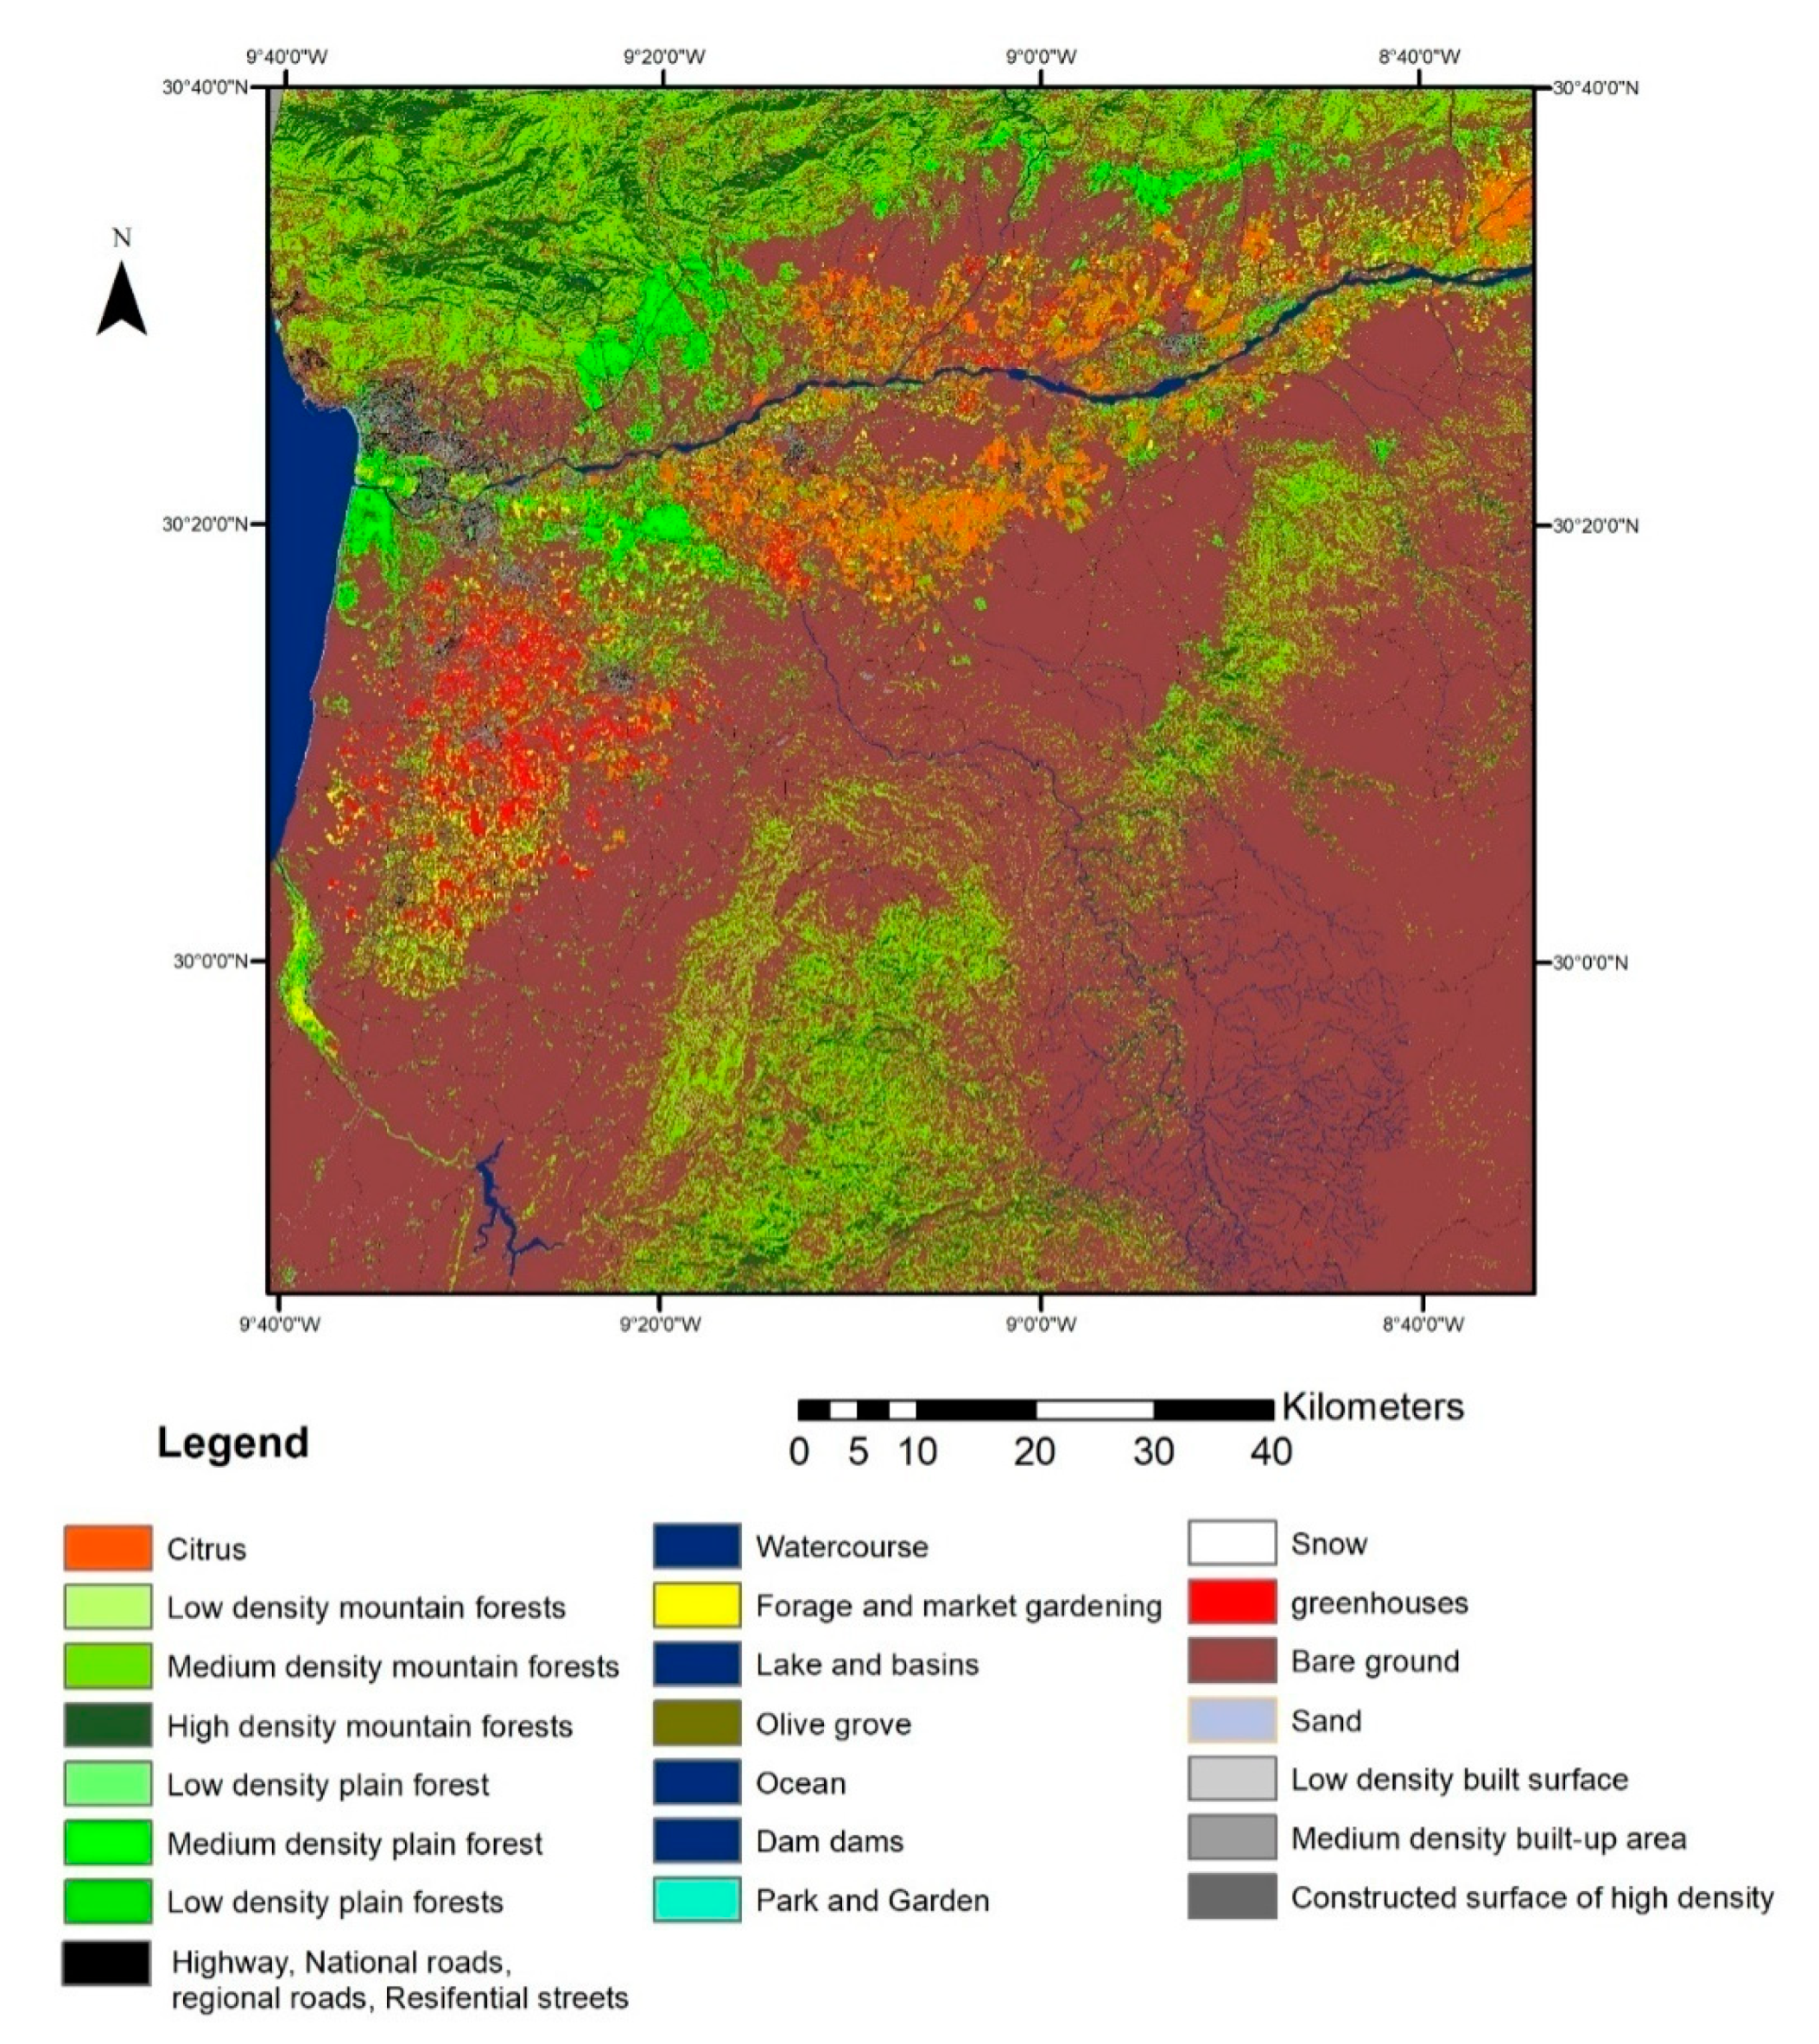
(i) Land use/land cover (
Figure A2) obtained using satellite images (Sentinel 2A; 2015; resolution 10 m and precision/kappa coefficient of 0.89). Land use classification of the region gives an idea about the present status of the land and indicates the spatial distribution and characteristics of land, such as agricultural area, forest, building, roads, bare soil. Some classes may present a limitation to agricultural activities.
(ii) Soil type (resolution 250 m): Africa Soil Information Service
https://www.isric.org. A soil texture indirectly influences nutrient retention in two ways: through its effects at the exchange sites and permeability. The rooting conditions depend on the effective depth of the soil and how easily the roots can penetrate it. Root penetration is easier in soils with a sandy texture or in heavier soils with a well-developed a fine to medium structure. It becomes more difficult in soil with a massive or coarse structure associated with a very firm consistency or containing large amounts of stones or gravel.
(iii) Slope and waterways data were derived from the digital elevation model (DEM, 30 m) using the spatial analysis tools on the ArcGis Software. On the one hand, the slope limits agricultural production by negatively affecting the properties of the soil. On the other hand, the slope affects agricultural production by limiting the ability to use machinery and management applications, such as tillage, irrigation, and drainage
(iv) The projected temperatures under RCP4.5 and RCP8.5 scenarios were derived from the CORDEX database (11.1 km). Temperature is a determining factor for crop growth. Each crop has an optimum temperature range outside which the growth is compromised or constrained at extreme temperatures. Hence, it is important to consider it as a key component for land suitability analysis.
Multiple criteria decision making (MCDM) approaches were developed in the 1960s to assist decision-makers with incorporating numerous options that reflected the opinions of concerned parties into a potential or retrospective framework [
24].
A land suitability assessment is similar to choosing an appropriate location, except that the goal is not to isolate the best alternatives, but to map a suitability index for the entire study area [
5].
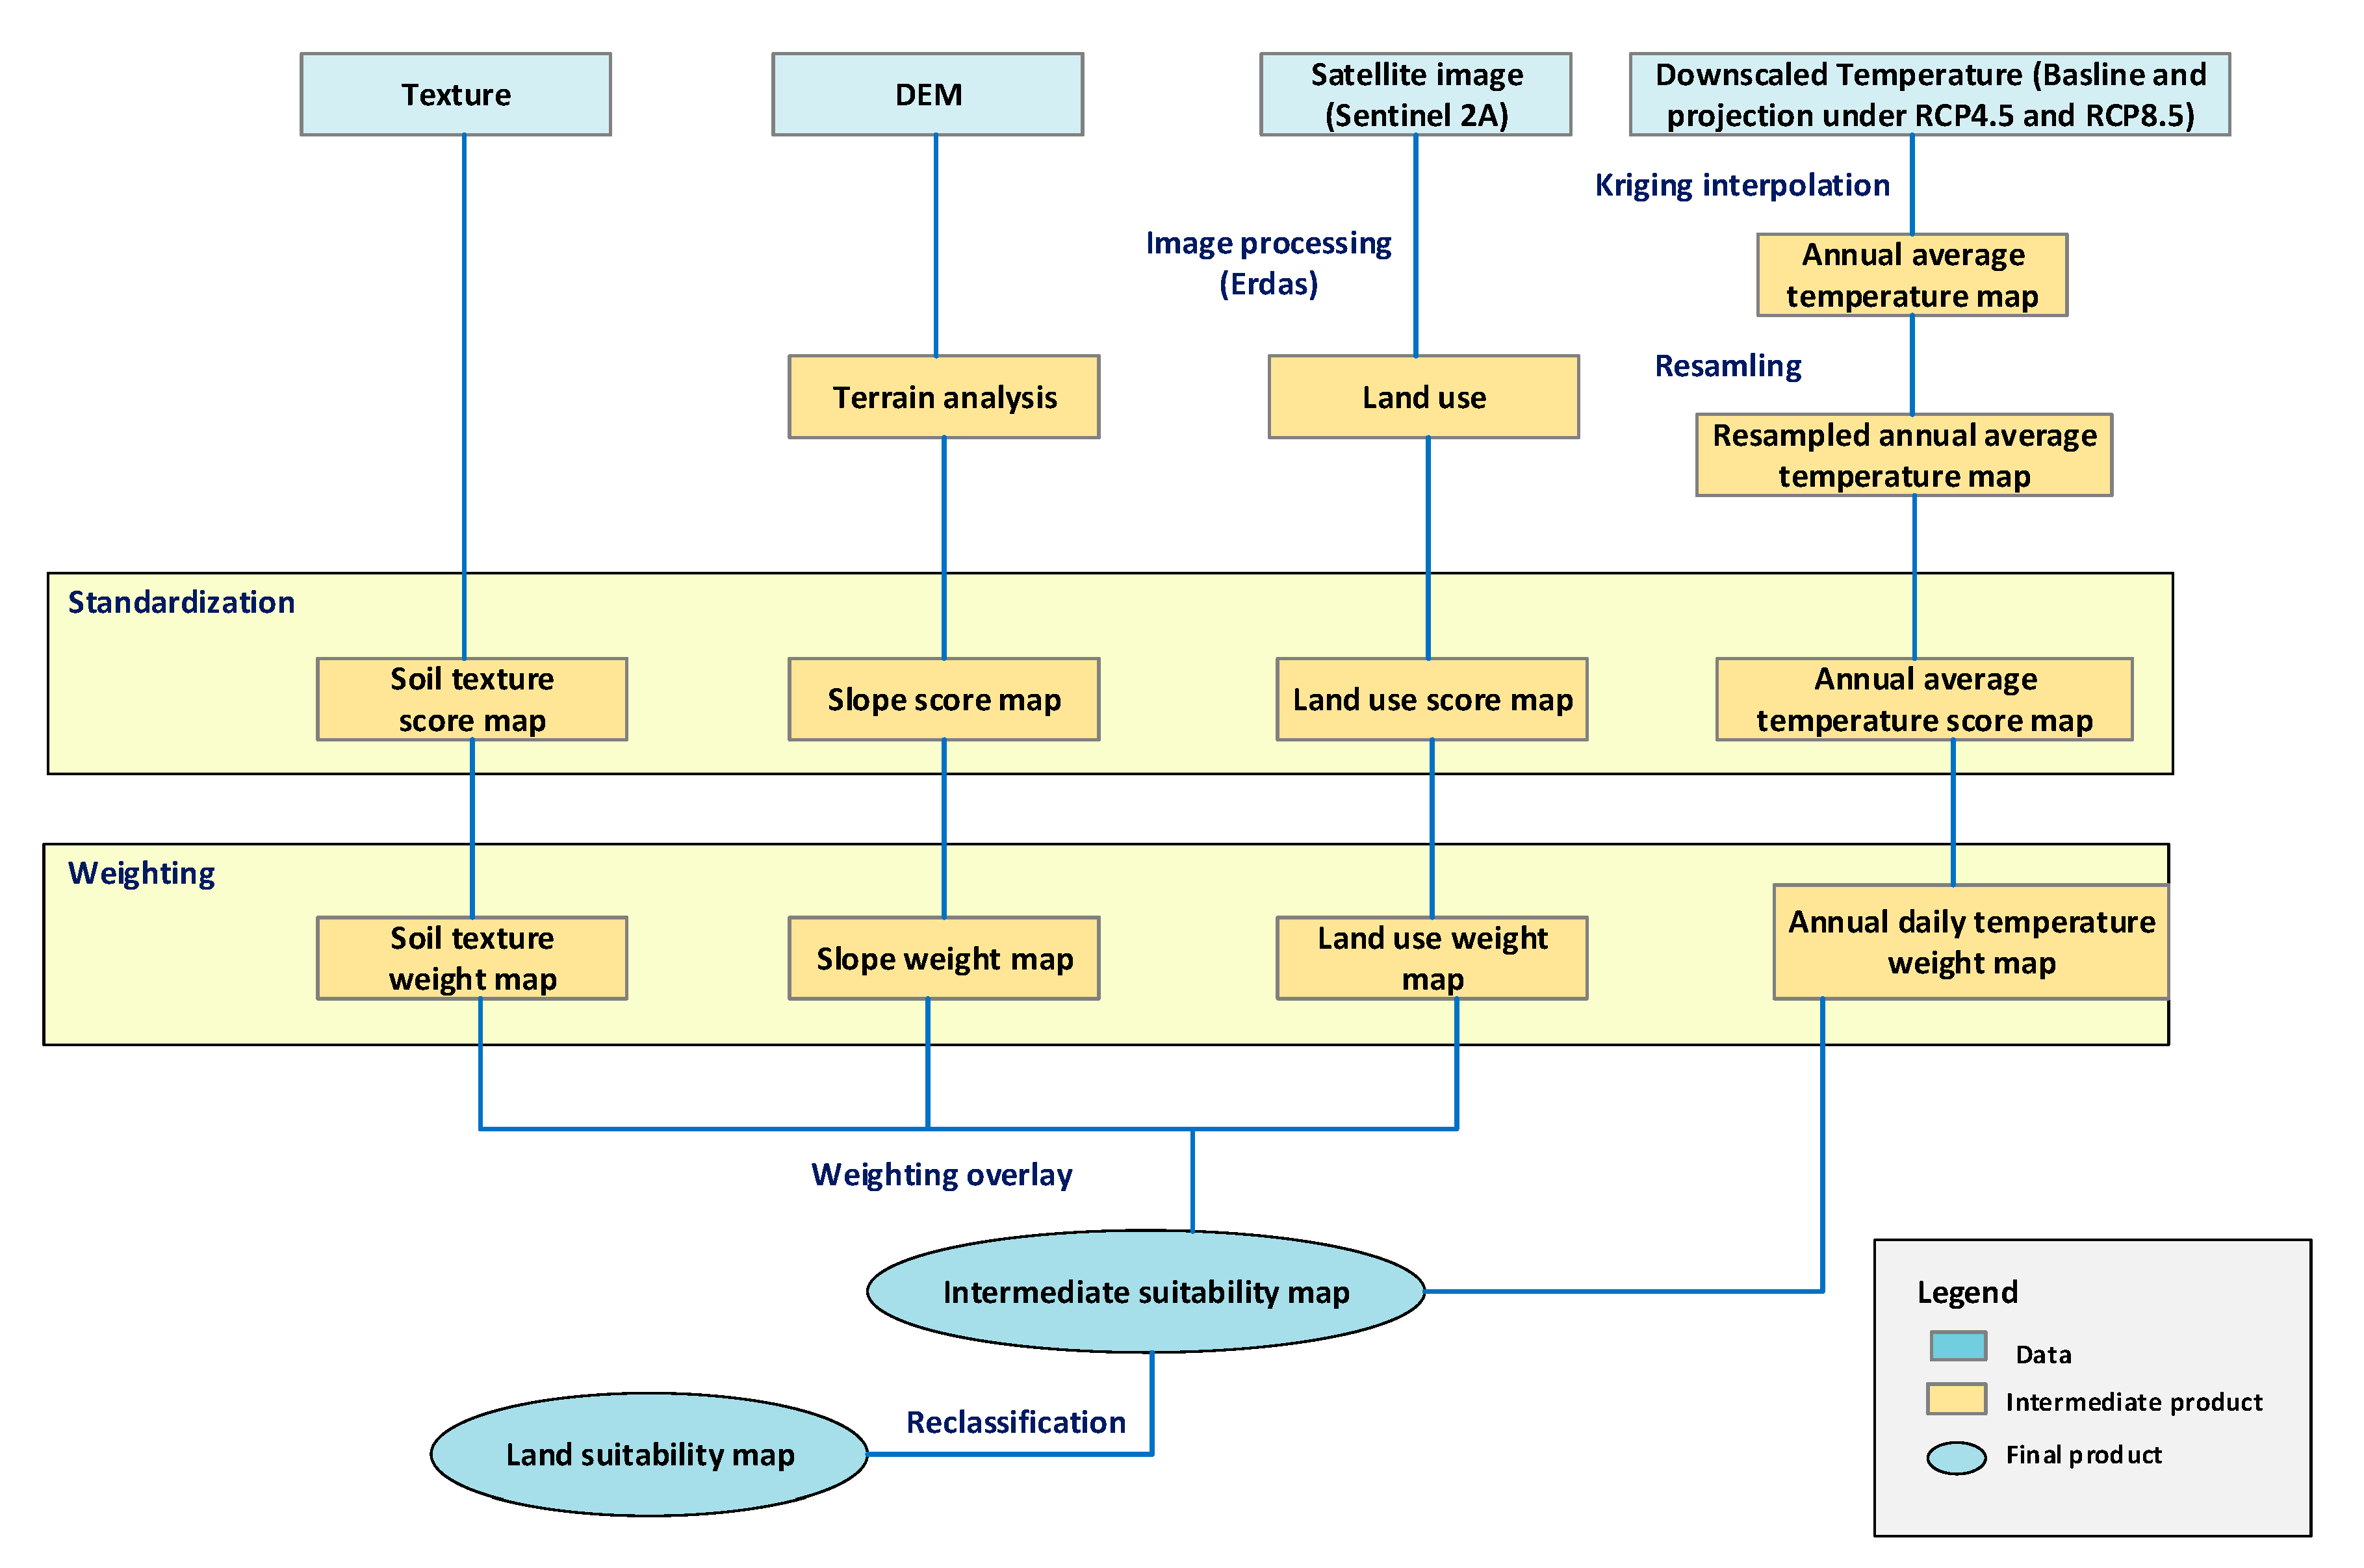
GIS-based MCDM modeling is the most common method for agriculture land suitability. These two individual areas of research, GIS and MCDM, can take advantage of each other (
Figure 4). On the one hand, GIS procedures have a critical role in analyzing decision problems. Therefore, GIS is usually acknowledged as a decision support system to integrate spatially referenced data. On the other hand, MCDM produces a wide variety of methods for constructing decision problems and weighting and ranking the information required to make decisions.
From a methodological point of view, the GIS-based MCDM model for selecting feasible locations for farming sites consists of the following steps (
Figure 4):
Identification of land suitability determining criteria and sub-criteria;
Reclassification of the temperature;
Except for temperature, normalization of parameters to obtain a continuous scale trough a scoring system (from 1 to 10) attributed to each sub-criterion according to its positive or negative effect on the land suitability for agriculture;
Prioritization (weighting) of the parameters using an analytic hierarchy process (AHP) matrix;
Creation of the intermediate land suitability maps;
Combination of the land suitability distribution map with the temperature distribution to create the final land suitability distribution map.
Depending on the objective to be achieved, the criteria or weighting factors are assigned to the elements that influence the ability to resolve a level of suitability for the concrete land (
Table 3). The choice of these criteria is based on the overall objective; in this case, they were climatic, topographic, and pedological criteria. These criteria were selected based on the knowledge of local experts.
The pairwise comparison matrix (PWCM) is a rating of the relative importance of the two factors regarding the suitability of cropland [
25].
To determine the relative importance/weight of the criteria, sub-criteria, and suitability classes, the PWCM was applied using values from the scale indicated in
Table 3.
The scoring of the criteria included in a level compared to other criteria included in the next hierarchical level was carried out using the preference scale (
Table 3) suggested by Saaty [
26], and a pairwise comparison matrix was created [
26,
27]. For example, temperature is moderately more important than texture; according to
Table 3, moderate importance was scored 3x value. While texture was scored 1/3x when it was compared to temperature.
The pairwise comparison matrix was established to calculate the criteria weights according to the AHP method (
Table 4). The importance of parameters was judged based on grower and agronomists’ opinions.
The consistency ratio of the pairwise comparison judgments was calculated as 0.054. Sub-criterions were scored within the range of 0 to10 according to the consulted opinions and taking into account the crops grown in the area. High scores were given to sub-criterions that positively affect the suitability for crops (
Table 5).
4. Results and Discussion
4.1. Land Suitability
Land suitability for crop growth under climate change was calculated using the weighted overlay method based on MCDM using a GIS approach. In fact, the GIS-based MCDM combination employs the capabilities of GIS in the management of geographic data and the flexibility of MCDM to integrate different criteria (e.g., elevation, soil texture) with value-based information.
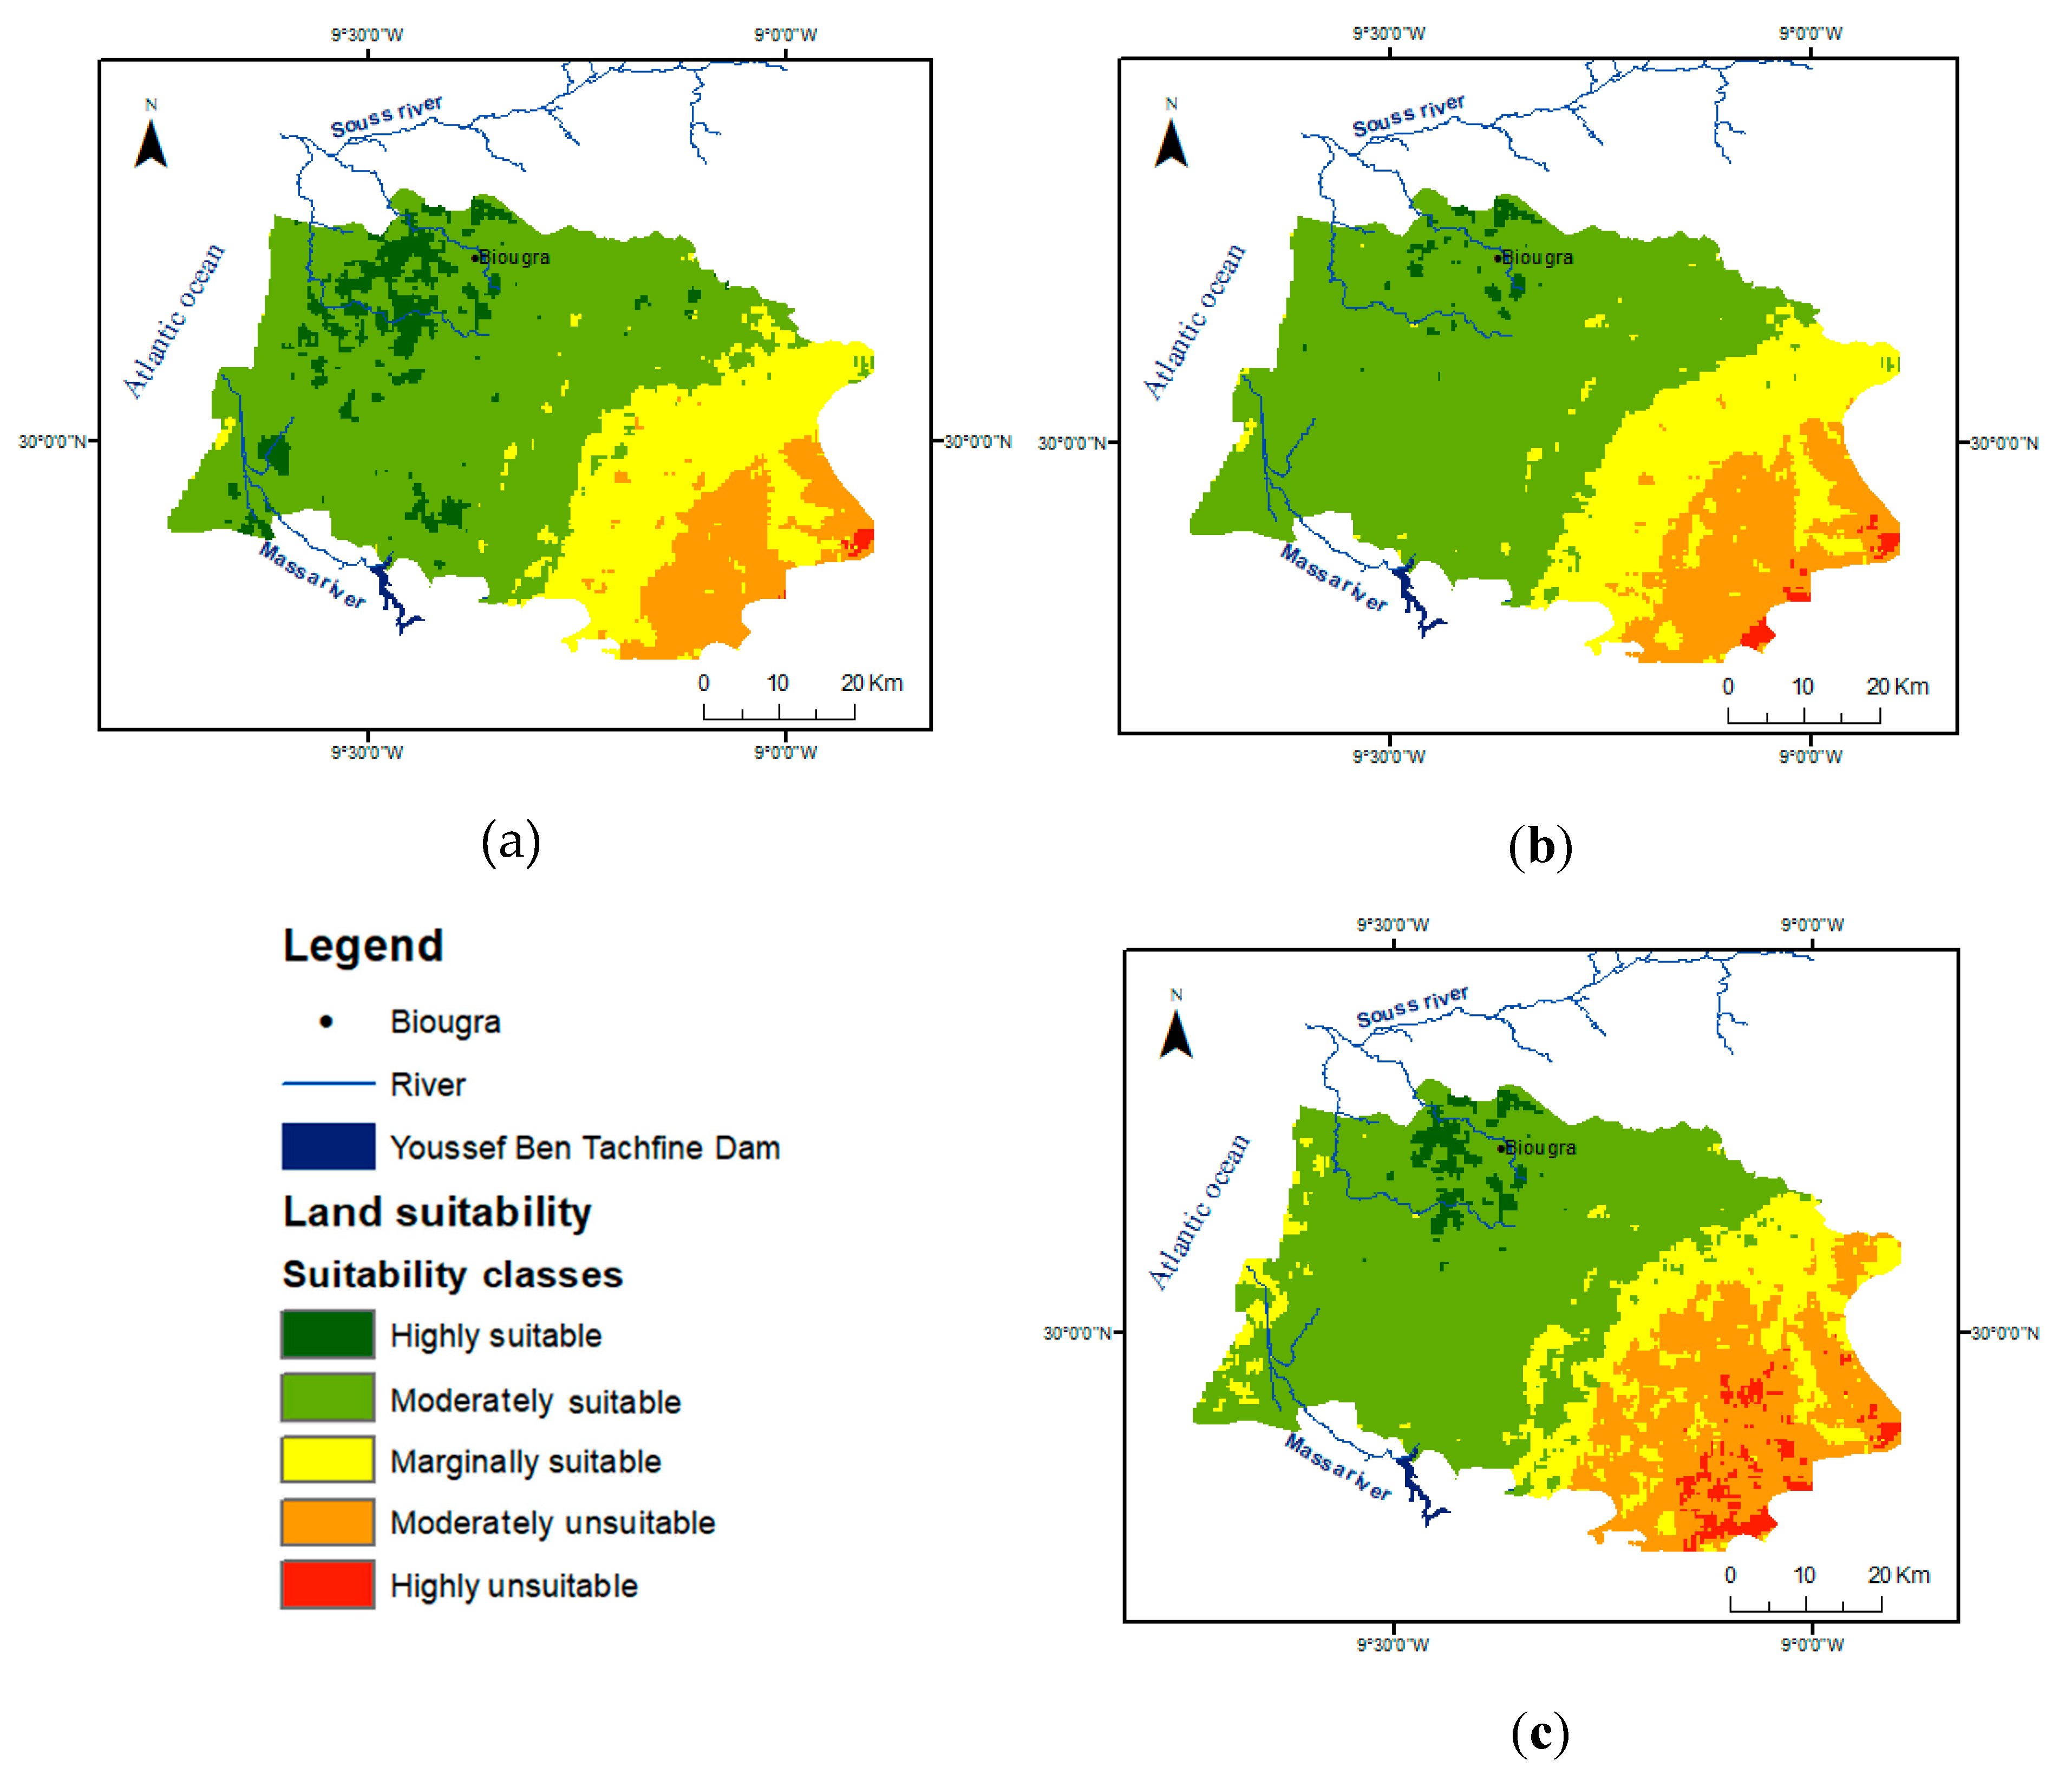
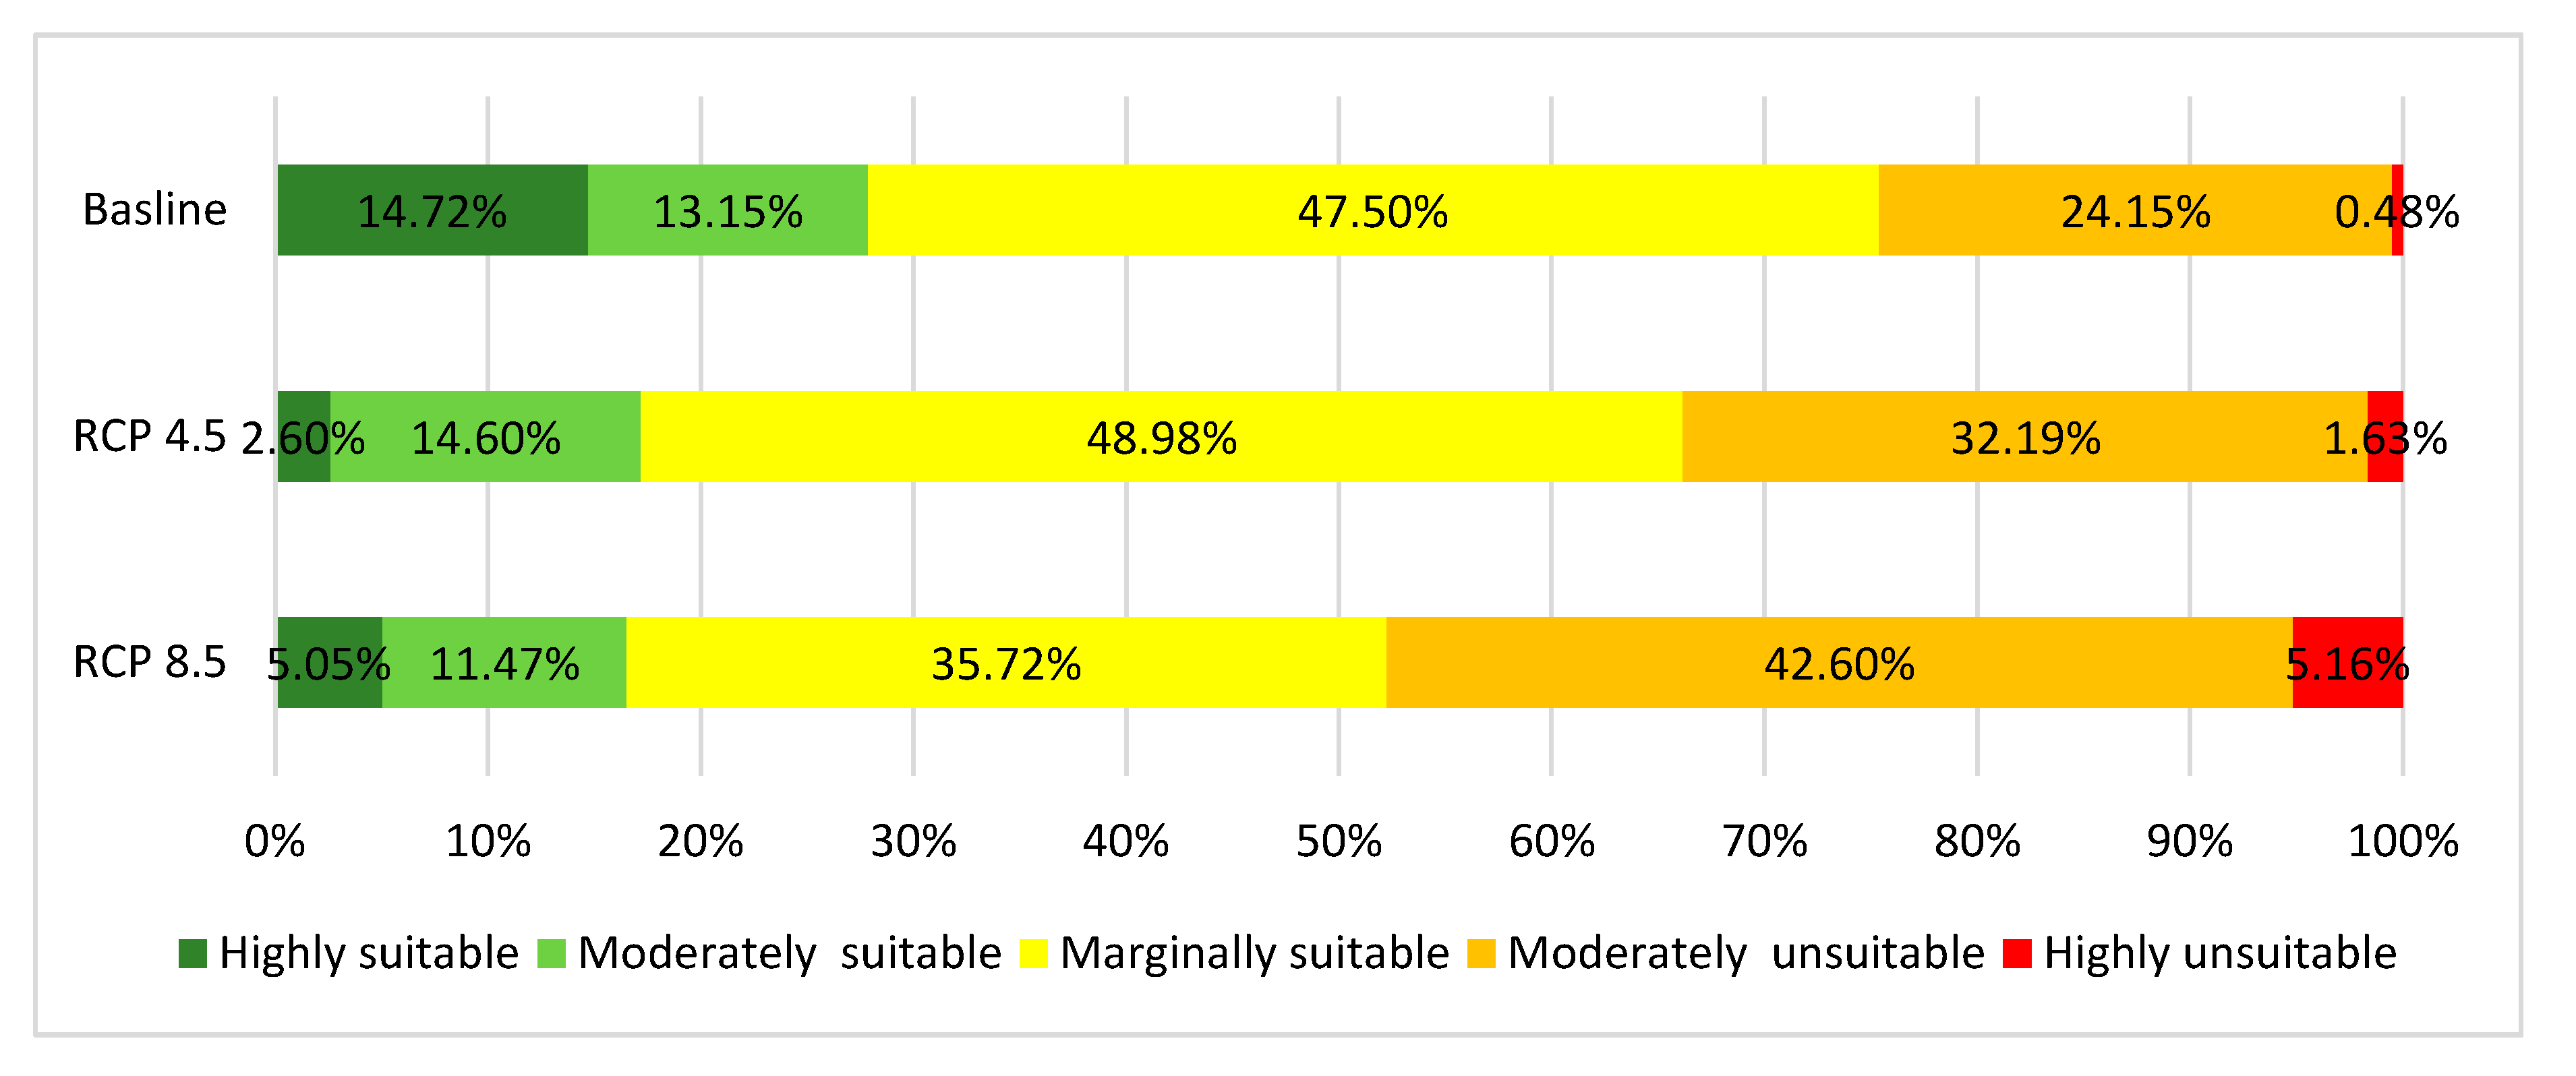
The analysis resulted in a land suitability map portrayed by five classes that clearly indicated which areas of those under study, the intensity of land use for agriculture should increase, decrease, or remain unchanged.
Figure 5 shows the projection of land suitability for 2031–2050, obtained using the MCDM method. It reveals an important decrease of 12.11% of “highly suitable” agricultural land under the scenario RCP4.5 and a significant increase of 4.68% of “highly unsuitable” according to RCP8.5 as compared to the baseline (
Figure 6). These results are in agreement with the ones found by Saadi et al. [
28] in North Africa, where rising temperatures associated with climate change are expected to decrease the areas suitable for agriculture. In contrast, climate change may lead to a positive expansion of suitable cropping areas in North of Europe, as proven by Olesen et al. [
29], despite the increase in the need for plant protection, the risk of nutrient leaching, and the turnover of soil organic matter.
A cross-comparison between the performed baseline land suitability map and the actual land map used showed that the vast majority of land classified as highly suitable for irrigated agriculture was already being used for it. Meanwhile, most marginally suitable land with severe limiting factors, such as soil texture, slope, and temperature, is located in the eastern part of the study area and is dominated by bare ground. This class of land has an appreciable value that needs to be operated on and developed into irrigated agricultural land.
Based on field sampling performed in 90 points in different classes, the accuracy of the suitability map was evaluated at 64% (
Table 6).
The concept of land suitability for crop cultivation is complex. In this study, a GIS-based method was used to match the land suitability for crop growing, based on climatic and physical factors, assuming that the physical parameters will not contribute to the change. However, extreme events due to climate change and inappropriate management could have eventual effects on land suitability through soil erosion and chemical properties (salinity organic matter, etc.). Therefore, soil types and drainage may be considered in future studies. On the other hand, the scheme adopted in this study assumes good management and good agricultural practices, while social and economic factors have not been considered and will be tackled in future work.
4.2. Evapotranspiration under Climate Change
The crop evapotranspiration depicts the main water demand in an agroecosystem [
30]. Therefore, the estimation of future evapotranspiration is the main step in predicting the impact of climate change on crop water requirements.
Among several methods, the Penman–Monteith equation (P-M) is the most soundly based on physical principles. It is the most data demanding, requiring information on daily data, such as temperature, relative air humidity, solar radiation, and wind speed [
31,
32]. Any slight change in the above meteorological variables results in changes in ETo and subsequently in crop evapotranspiration (ETc).
The results showed that all the climatic parameters considered were strongly and positively correlated with ETo, except relative humidity and vapor pressure, which were negatively correlated. Indeed, the mean temperature and solar radiation were highly and positively correlated with ETo, while wind speed is weakly correlated (
Table 7).
Meanwhile, the sensitivity coefficients indicate that the ETo was significantly not sensitive to solar radiation, which means that solar radiation has a lower impact on the FAO-56 P-M equation.
There are many methods to compute the ETo, but it is difficult to select the best ETo estimation method for the available data and climatic conditions. The uncertainty of ETo projections under climate change can (partly) be attributed to the choice of the potential evapotranspiration (ETp) appropriate equation and the probable changes in meteorological parameters due to climate change. This means that the errors introduced by the chosen method may conceal or change the climate change-induced effects [
33].
The most important parameters in estimating ETo are temperature and solar radiation; at least 80% of ETo can be explained by these factors [
34].
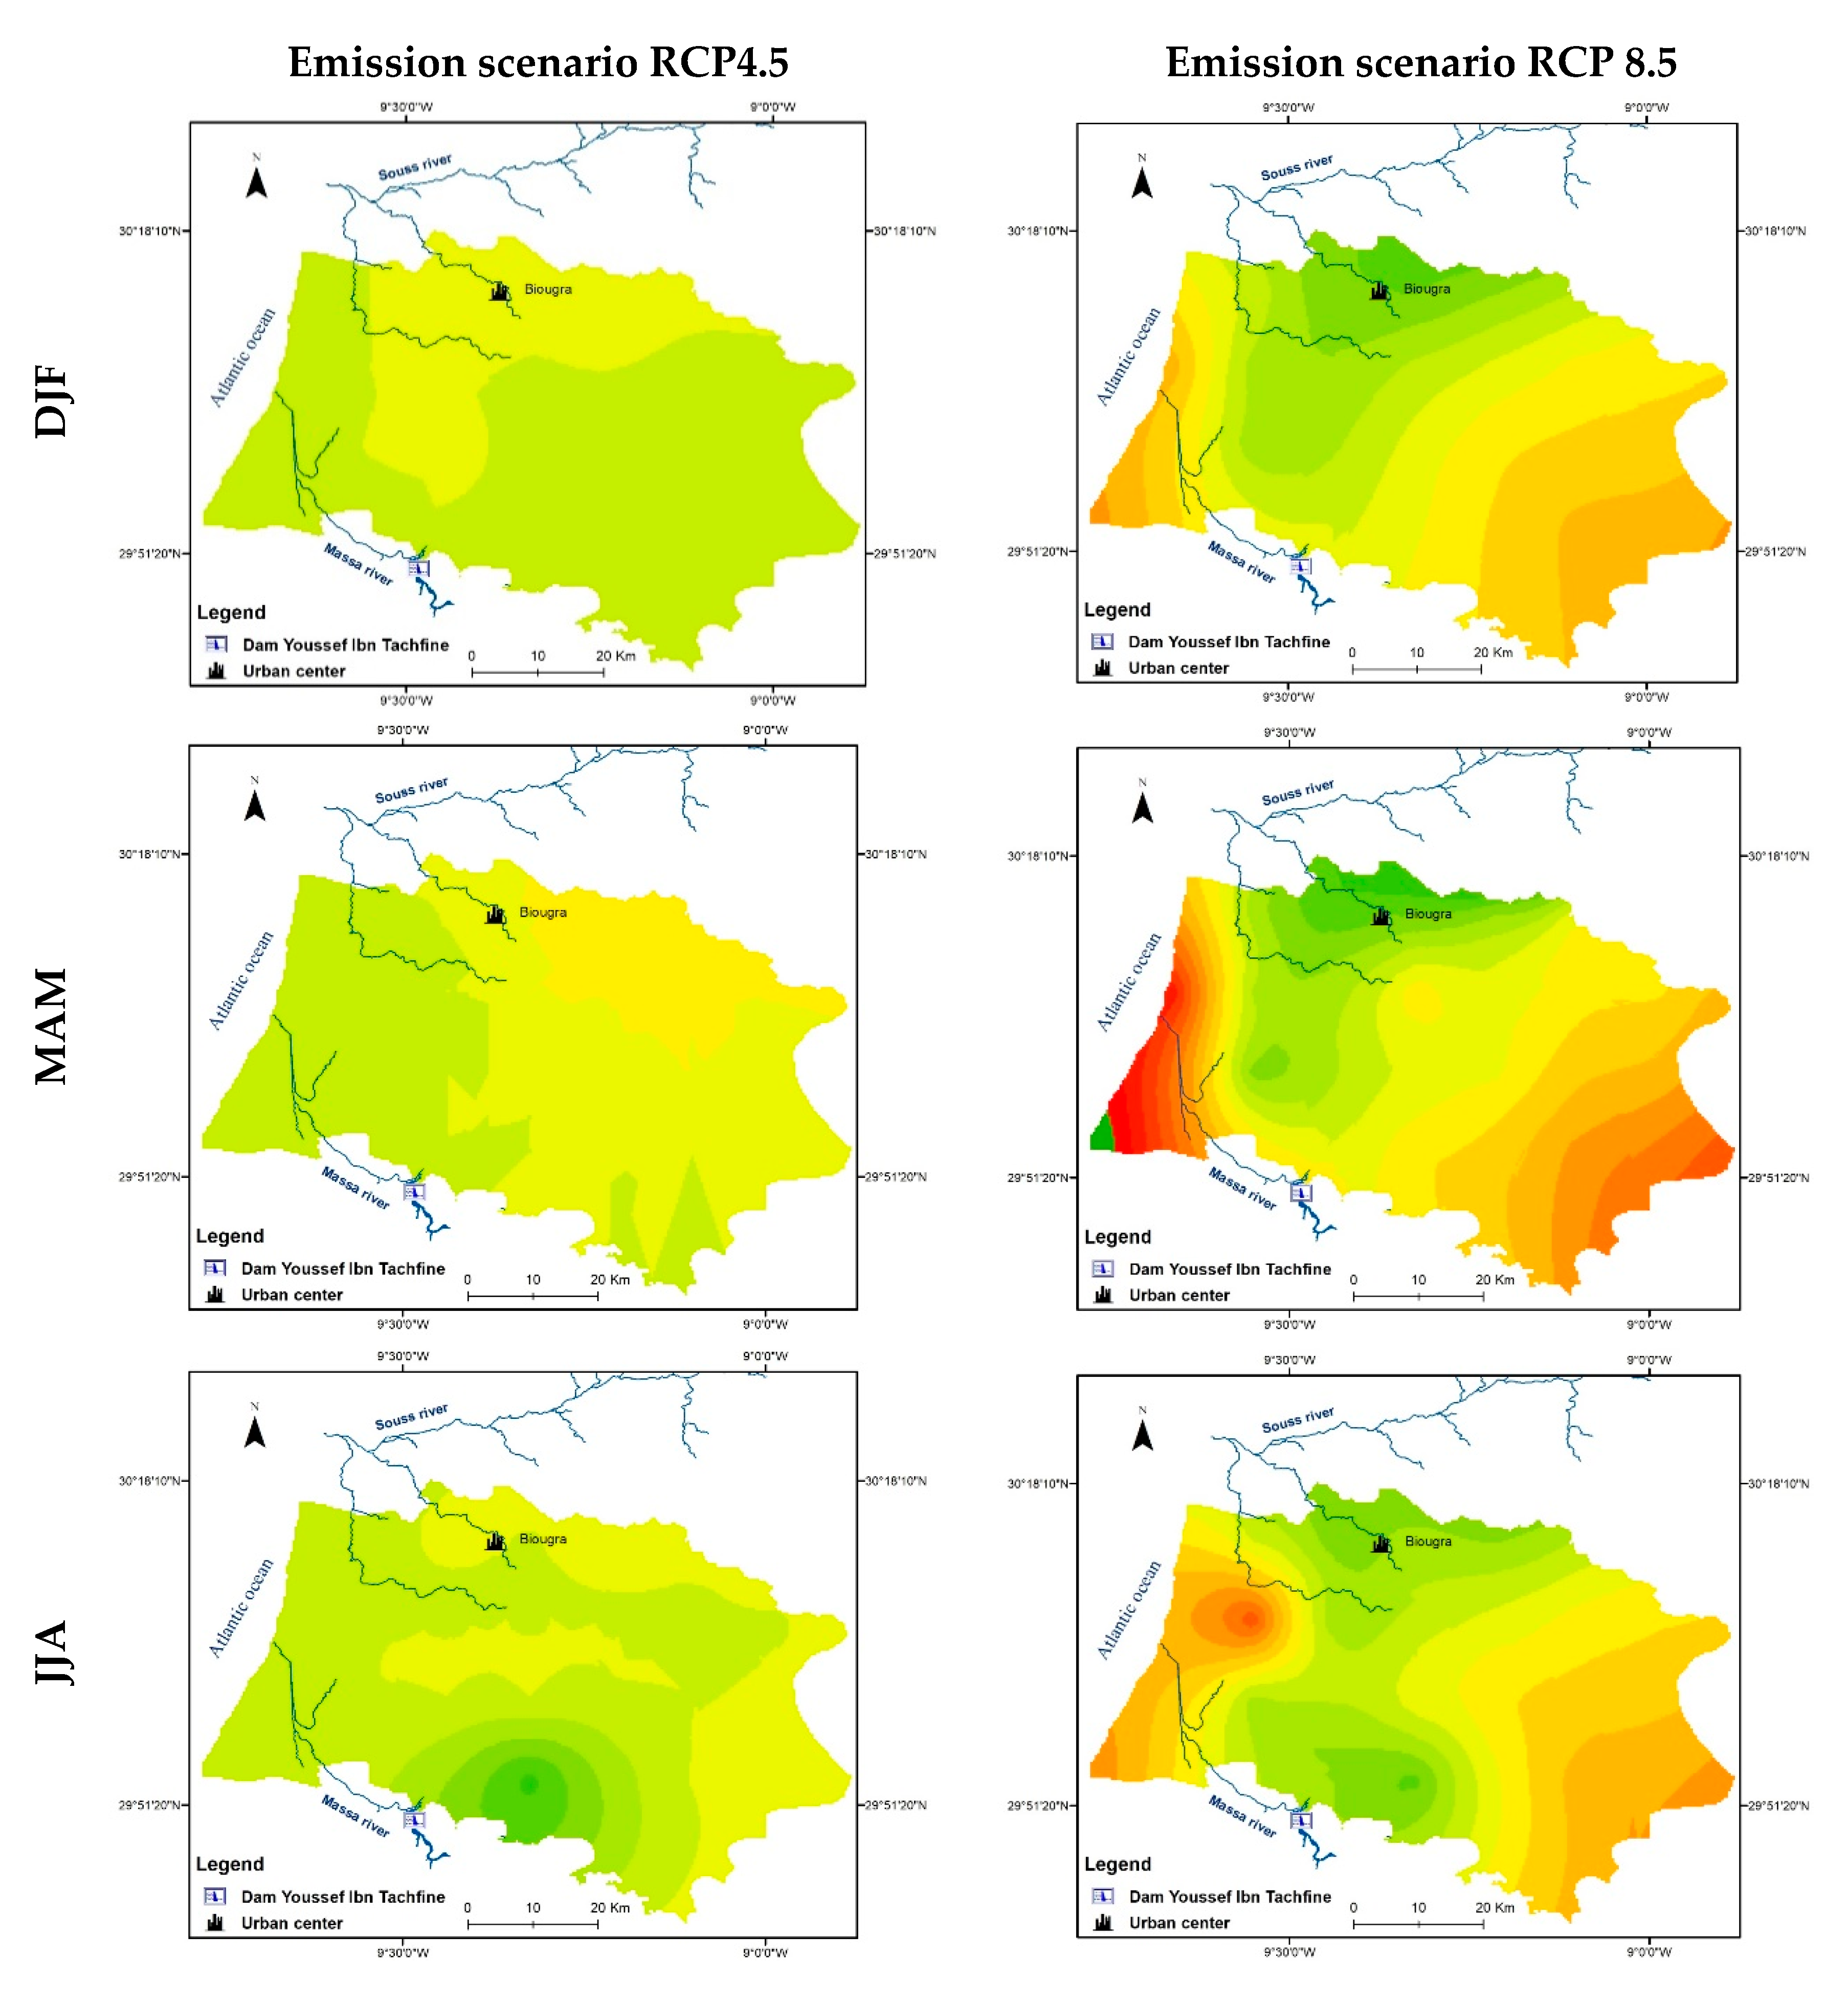
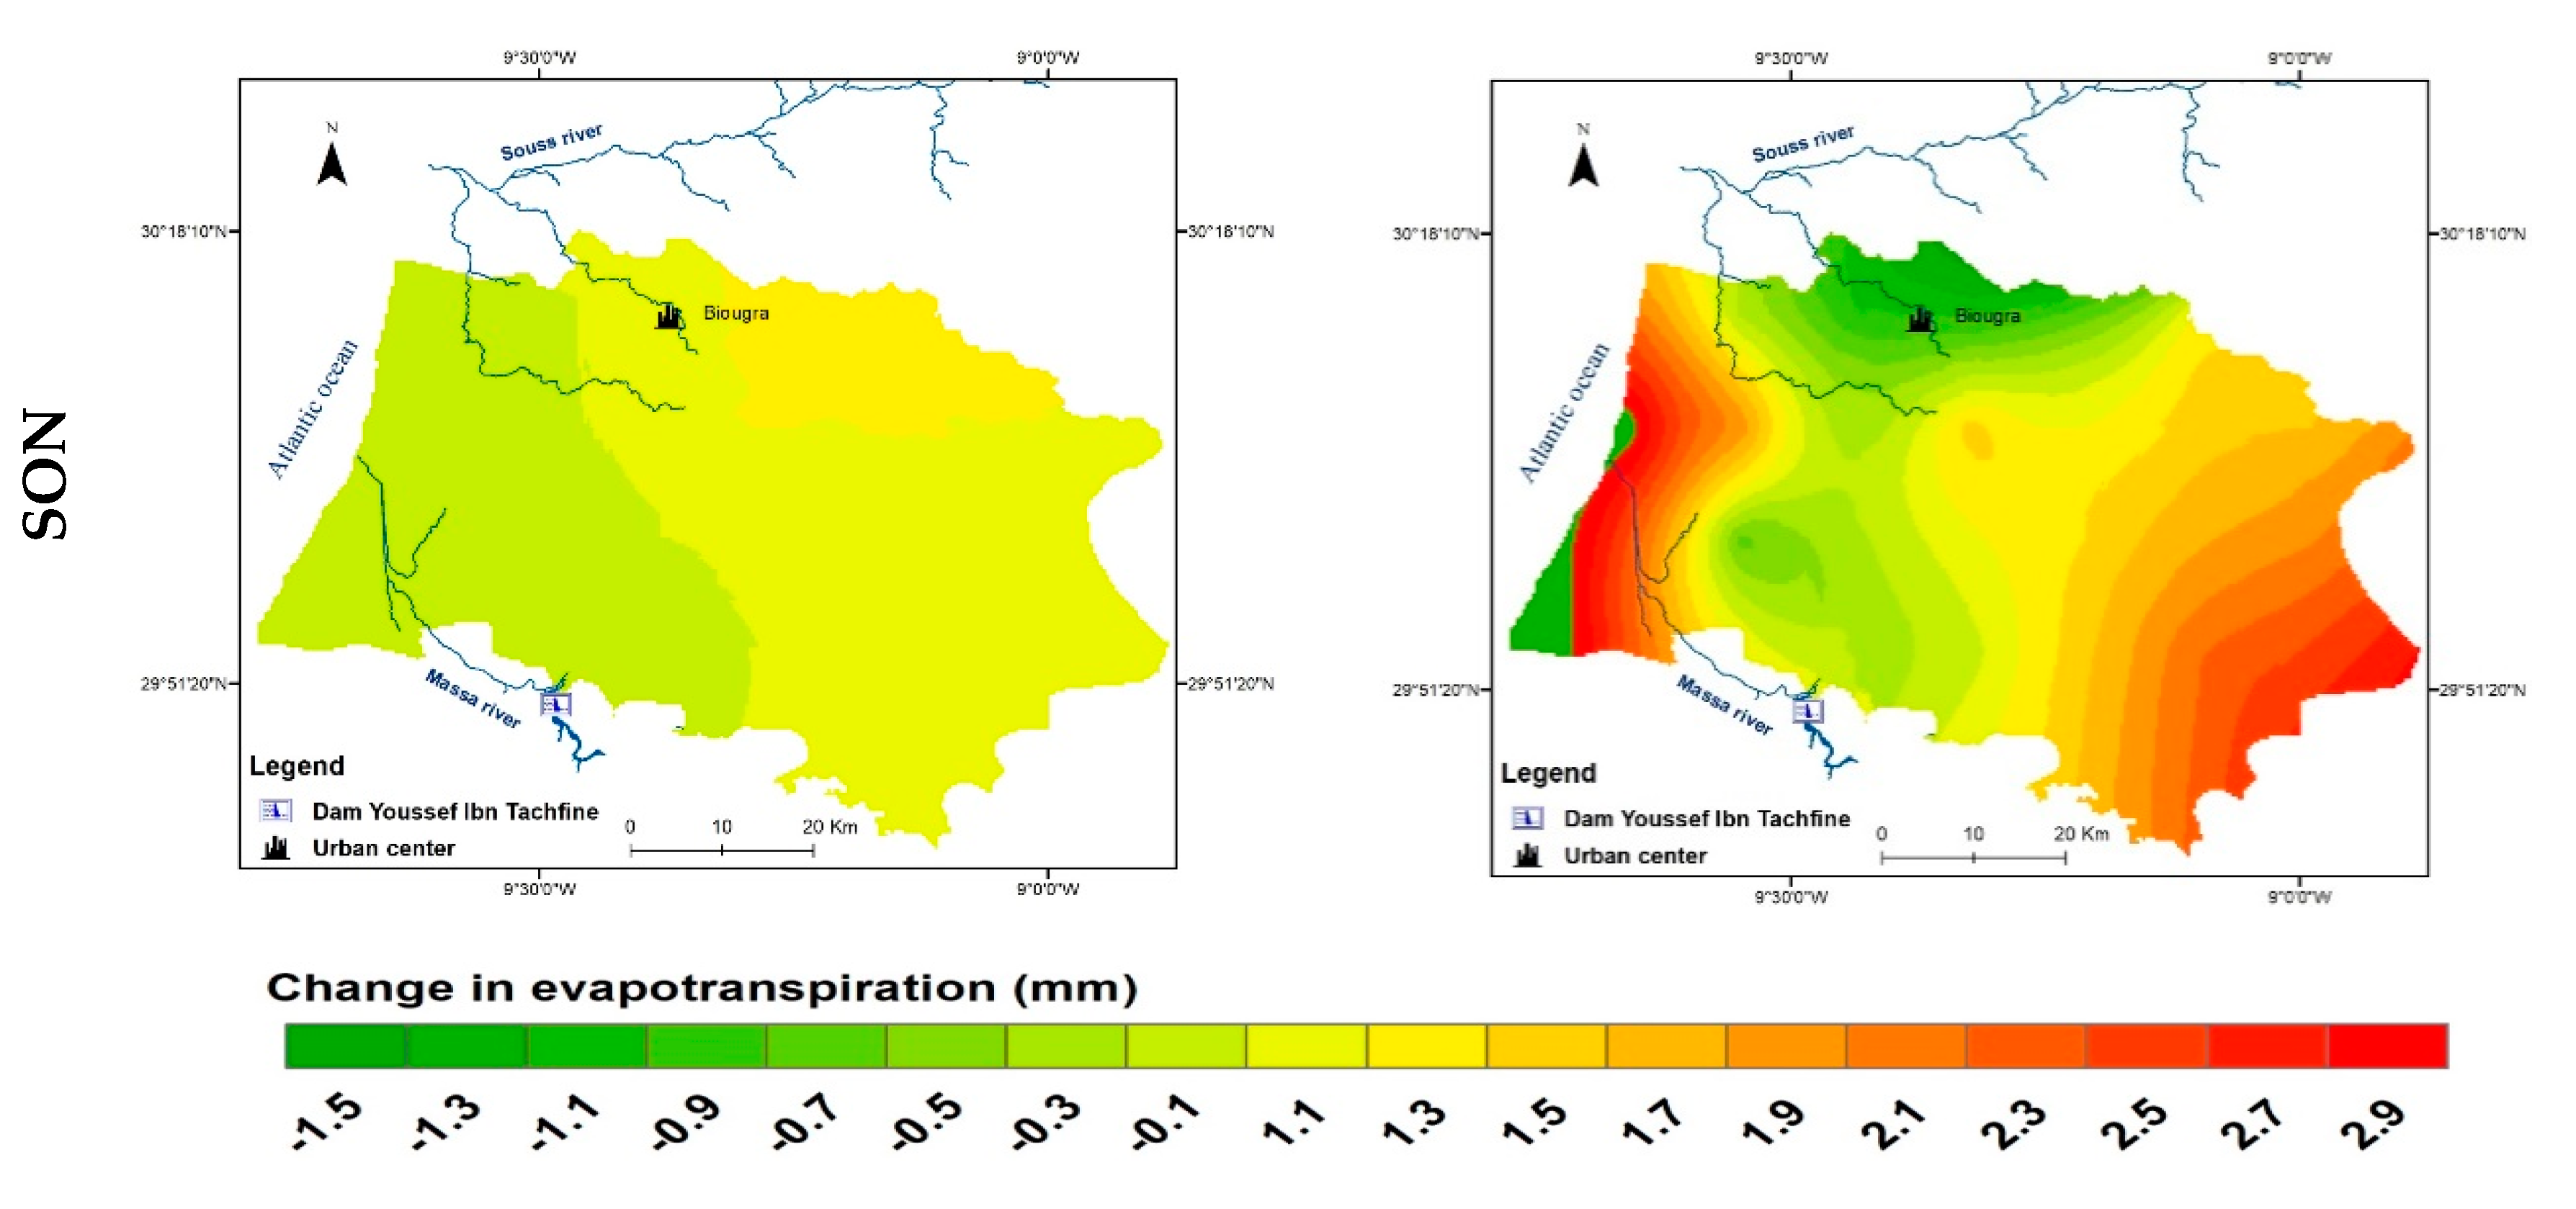
DJF: December, January, February; MAM: March, April, May; JJA: June, July, August; SON: September, October, November.
Figure 7 represents the seasonal spatial distribution of evapotranspiration change ΔET0 = (ET future–ET historical) during 2030–2049, obtained using the kriging interpolation method.
The result indicated an increase in evapotranspiration between 2031–2050, estimated at 3.65% under the RCP4.5 scenarios and 5.56% under the RCP8.5 scenarios, respectively, leading to an increase in the crops’ daily water consumption. This result confirms the finding of Saadi et al. [
15], who predicted an increase in annual reference evapotranspiration is 92.3 ± 42.1 mm (6.7%) as a result of annual precipitation reduction of 39.1 ± 55.1 mm and air temperature increase of 1.57 ± 0.27 °C (from 0.84 to 2.31 °C for 2000–2050. The result also showed a slight spatial variation of ΔETo during the cold season (DJF). ΔETo varied between 0.0012 mm and 0.14 mm under RCP 4.5 and −0.59 mm and 0.98 mm under RCP8.5. During the warm season (JJA), ΔETo varied from −0.06 mm to 0.41 mm under RCP4.5 and from −1.35 mm and 2.77 mm under RCP8.5.
The spatial distributions of seasonal ΔETo were mainly influenced by temperature, which is expected to increase by 2 °C, and precipitation, which will be reduced by 10% to 30% over the same period, 2030–2049 [
8].
4.3. Length of Crop Season under Climate Change
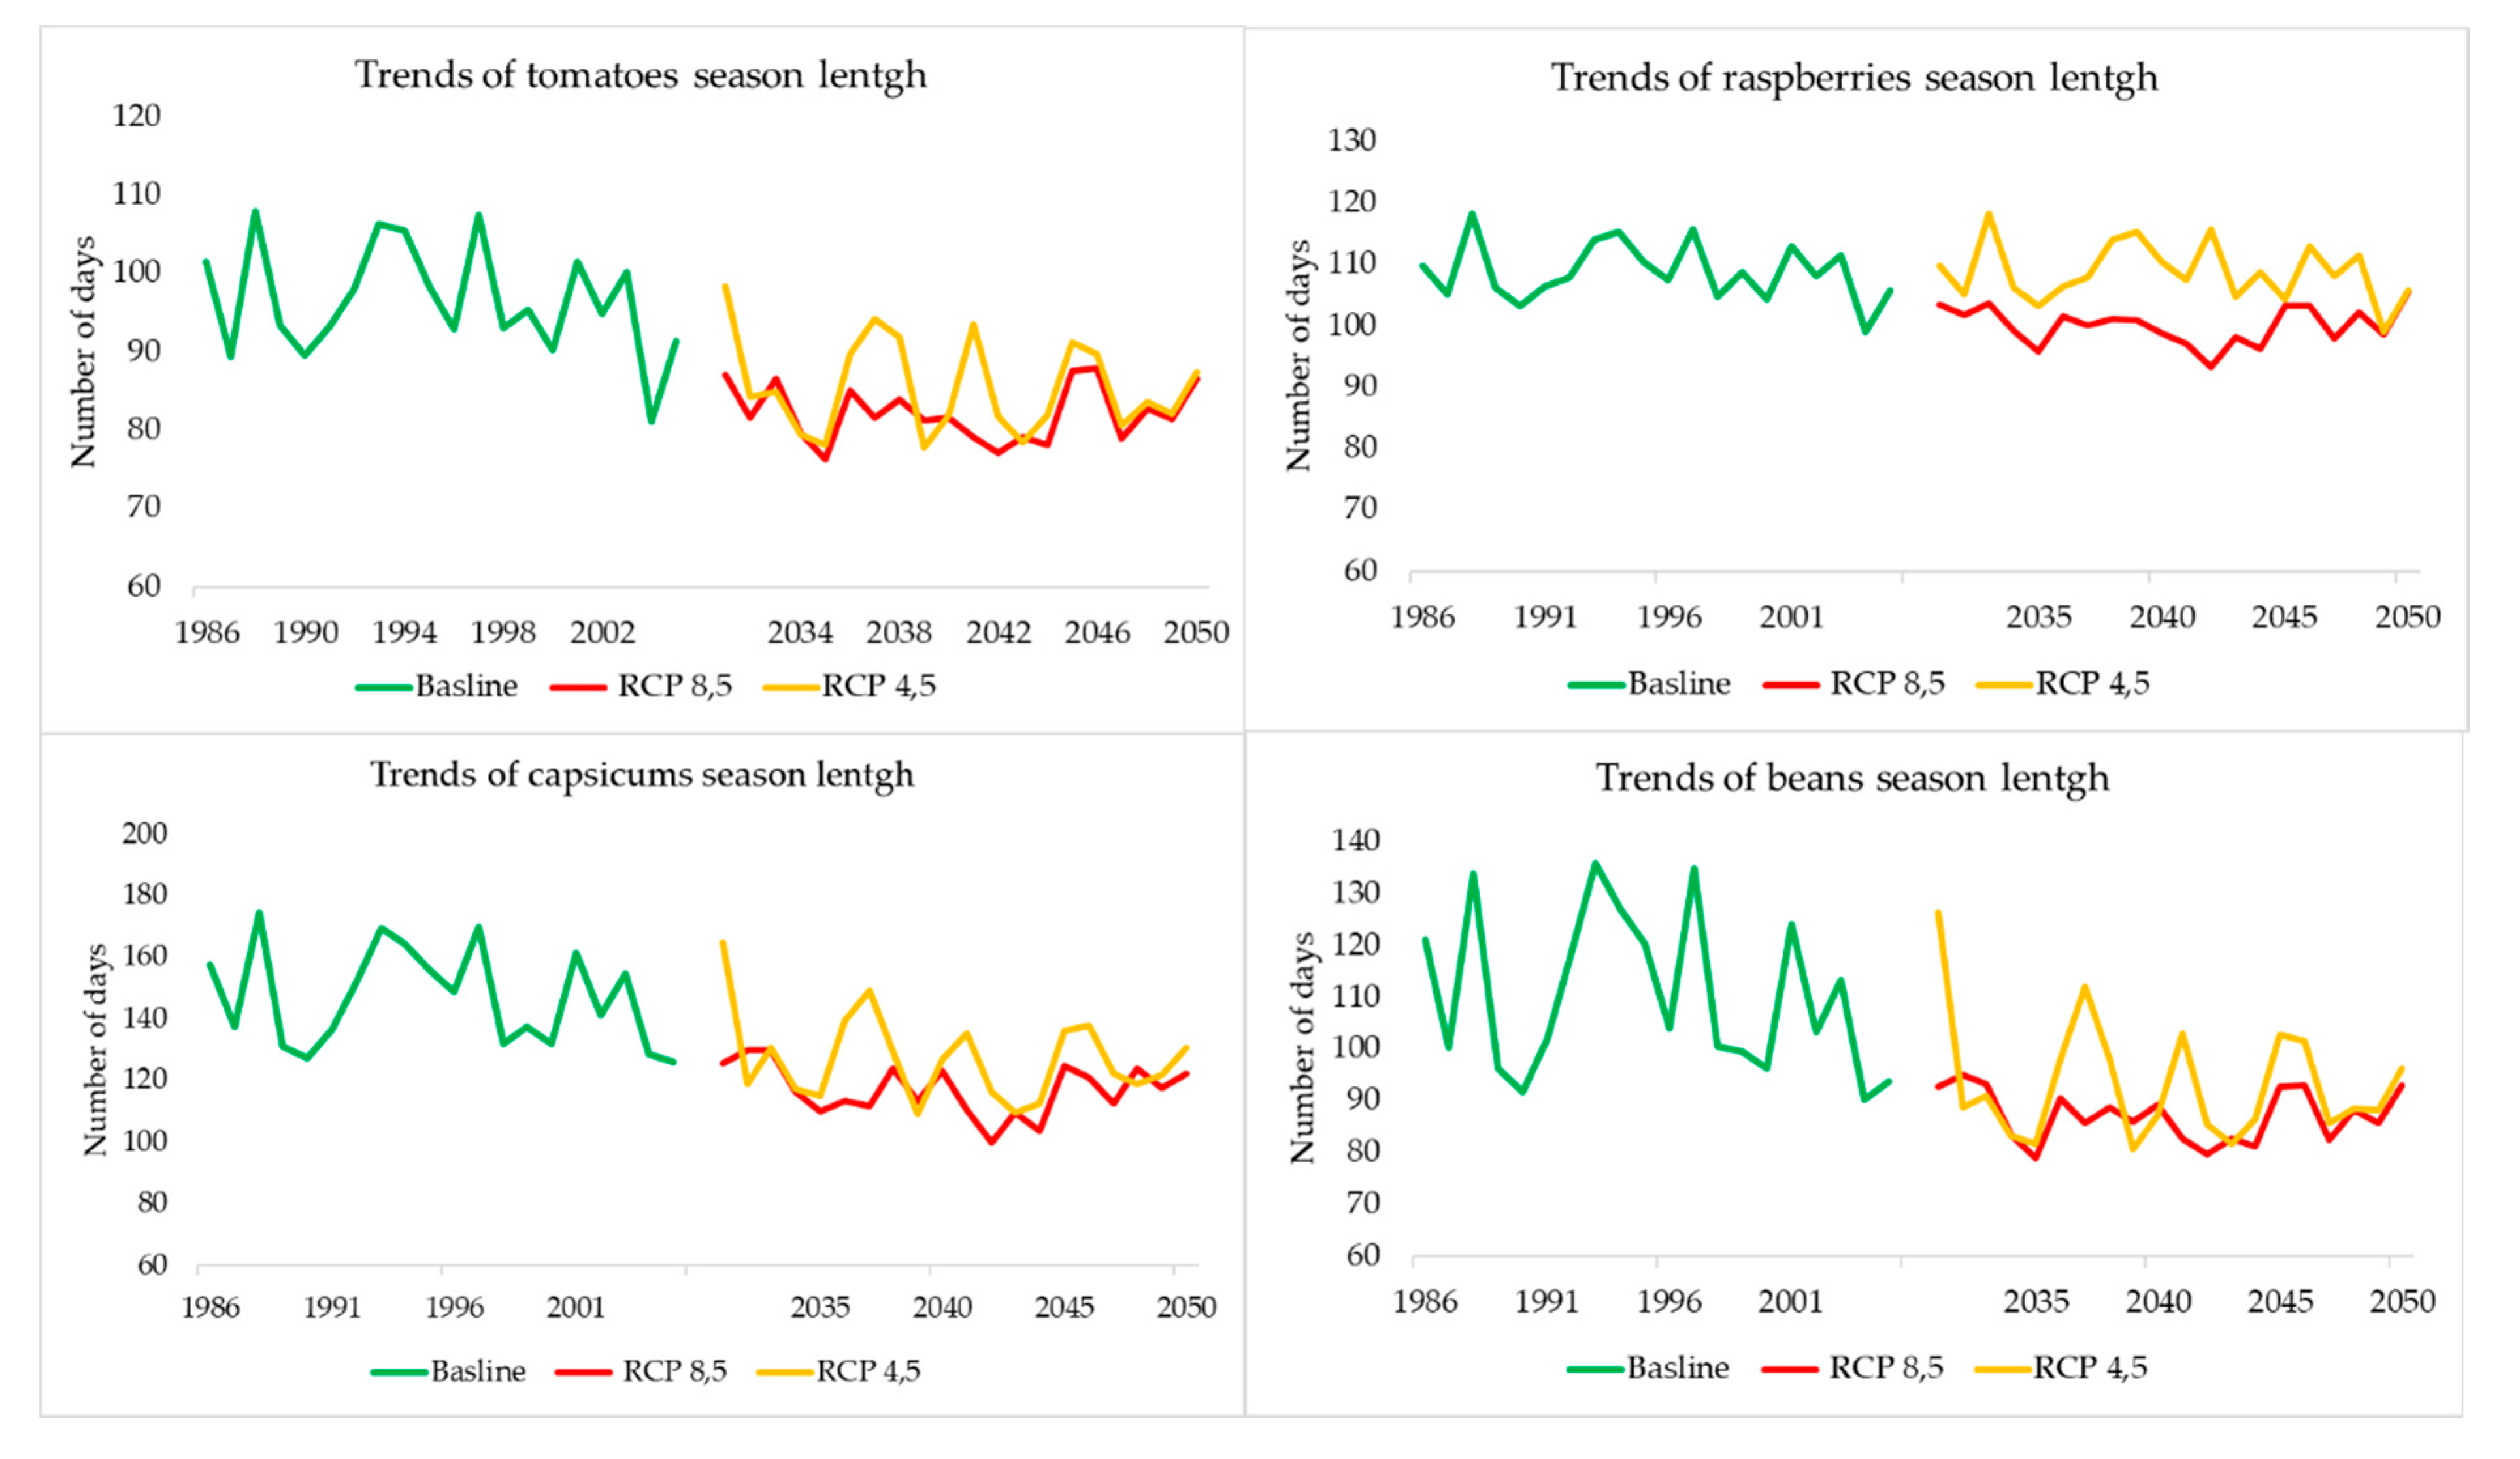
The length of the growing season is an important indicator of plant productivity. Longer growing seasons may increase plant productivity and allow for new planting opportunities in agricultural settings. However, related changes in pest species, droughts, and other climate extremes may limit the extent to which these gains are realized.
Projected GDD in 2031–2050 showed a strong shortening in the number of days between planting and maturity, as compared to the baseline 1985–2006, mainly under the RCP8.5 emission scenario, with 15% for tomatoes, 20% for capsicums, 21% for beans, and 8% for raspberries (
Figure 8).
Our results are supported by several studies worldwide for different crops that have revealed the sensitivity of the crop growing season length to climate change.
In the Mediterranean region, [
15] demonstrated that the potential cultivable areas of tomato may increase 24%, and the average length of the growing season was estimated to be shorter in 2050 by 12 days. Furthermore, [
35] found that the decrease in cycle duration could reach 32% (50 days) in 2090, according to the RCP8.5 scenario. In addition, [
15] previously showed that the predicted temperature rise could induce a reduction in the LCS, ranging from 22 to 41 days, as a consequence of 2.3–3.8 °C increases in air temperature. Reference [
28] linked the potential rise in temperature associated with climate change in North Africa to an expected shortening of the growing seasons’ length and a reduction in crop yields.
Our findings also converge with studies carried out in southwestern Iran, that suggested a shortening of the wheat-growing season length of 7.5 and 9.3% under RCP4.5 and RCP8.5, respectively, for 2040–2070 with respect to the baseline, 1980–2010. [
36]. Reference [
37] reported that temperatures during the growth period for winter wheat under climate change would increase significantly compared to baseline, while the length of the growing season would decrease. In Europe, [
29] found that climate change is expected to lead to a reduction in the growing period of determinate crops (e.g., cereals), and an increase for indeterminate crops (e.g., root crops).
4.4. Crop Water Productivity
Farmers are generally concerned with the total production, but in the actual situation of water scarcity, the focus has shifted to the optimization of factors in crop production, particularly the availability (and suitability) of either land or water.
Crop water productivity is an important index to evaluate water savings for farmers and scientists. It is inversely related to vapor pressure [
2]. Crop water productivity can be increased significantly if the amount of applied water is reduced. Applied water is broadly dependent on temperature, which is projected to be influenced by climate change. Reference [
38] found that, in warmer conditions, the length of the crop growth period will be shortened, which will result in a reduction in crop water consumption and possible crop productivity loss.
Water productivity in
Table 8 is elaborated from the data provided by farmers in Chtouka Ait Baha regarding yield and irrigation. There was a high difference in the water productivity of the crops studied. Blackberries were the least water productive, and tomatoes were the most water productive but had the highest water consumption, which seems aberrant.
Taylor et al. [
4] compared the production of Moroccan and French tomatoes off-season and found that throughout the entire life cycle studied, the cultivation of tomatoes contributes to water deprivation, the eutrophication of freshwater, eco-toxicity, and the depletion of metals, while the transport of the tomato from Morocco to France has been the main contributor to climate change, land acidification, marine eutrophication, and the depletion of fossils.
The water productivity of berries (blackberries 2.5 kg m3, raspberries 2.86 kg m3, and blueberries 4.29 kg m3, and strawberries 8.33 kg m3) is less than half that of other market crops (peppers 13.33 kg m3, beans 11.76 kg m3) for almost the same amount of applied irrigation water. The high doses of irrigation applied to berries are due to the high selling price and, therefore, to high economic profitability.
Water productivity relies on the economic profitability of the crops, and, consequently, on the selling prices of these crops and those of the factors of production, including the irrigation water, which remains low [
24].
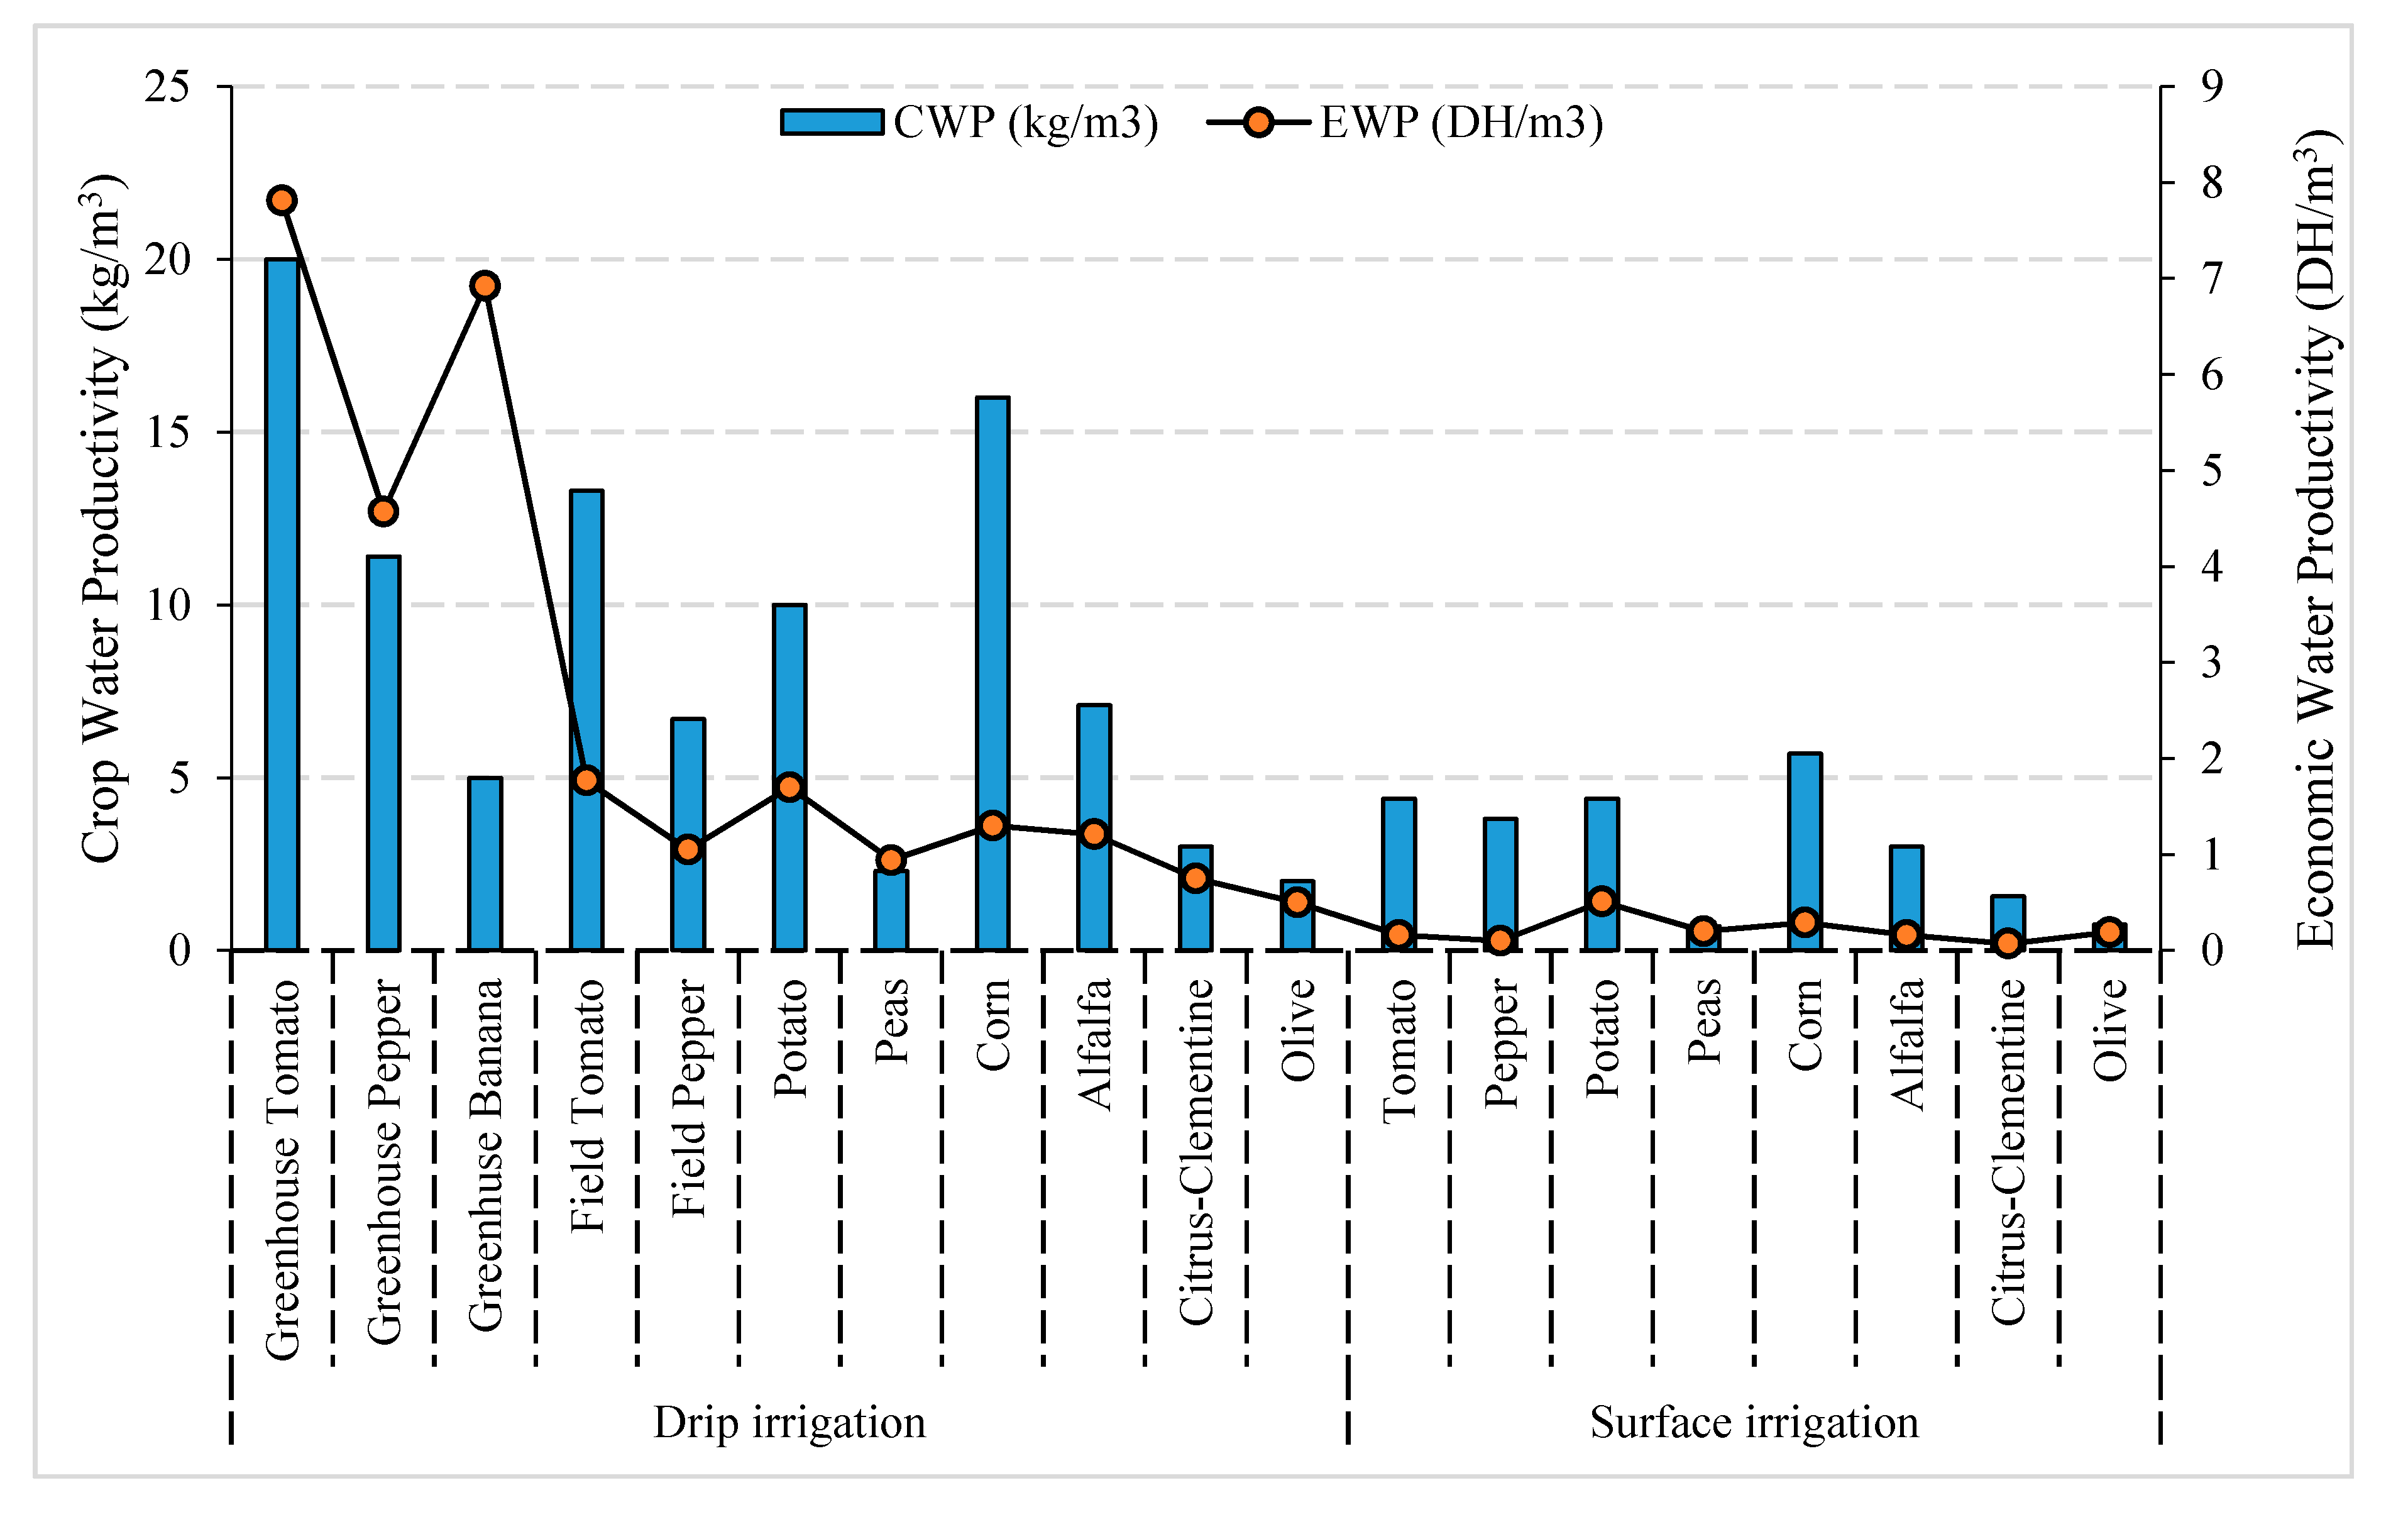
Figure 9 shows the economic and crop water productivity for the main crops cultivated in the Souss–Massa region under two types of irrigation systems (drip and surface irrigation).
The data presented indicated that crop and economic water productivity were both important under the drip system compared to the surface irrigation system. Production under greenhouse conditions was increased by 50% and 34.1% for tomatoes, respectively, and by 70% and 33.5% for peppers [
40]. This finding clearly indicates that drip irrigation and the greenhouse cropping system can significantly improve crop and economic water productivity.
Seif-ennasr et al. [
8] indicated that the current status of the water balance in the Chtouka Ait Baha region is facing a deficit of 60 Mm
3, taking into account both groundwater and surface water. Climate change will affect this water balance, and the over-exploitation of groundwater, mainly from agricultural activity, will aggravate it. To safeguard water resources, some action plans have been established, such as the desalination of seawater, that will be a substitute source of water resources in the area. The objective of the desalination plant is to meet an annual need of 90 Mm
3 of desalinated water with a rate of 250,000 m
3/day. It will allow the region to compensate for a deficit of 60 Mm
3, with a capacity of 125,000 m
3/day for drinking water and 125,000 m
3/day for feeding irrigation network covering about 13,600 ha [
41].
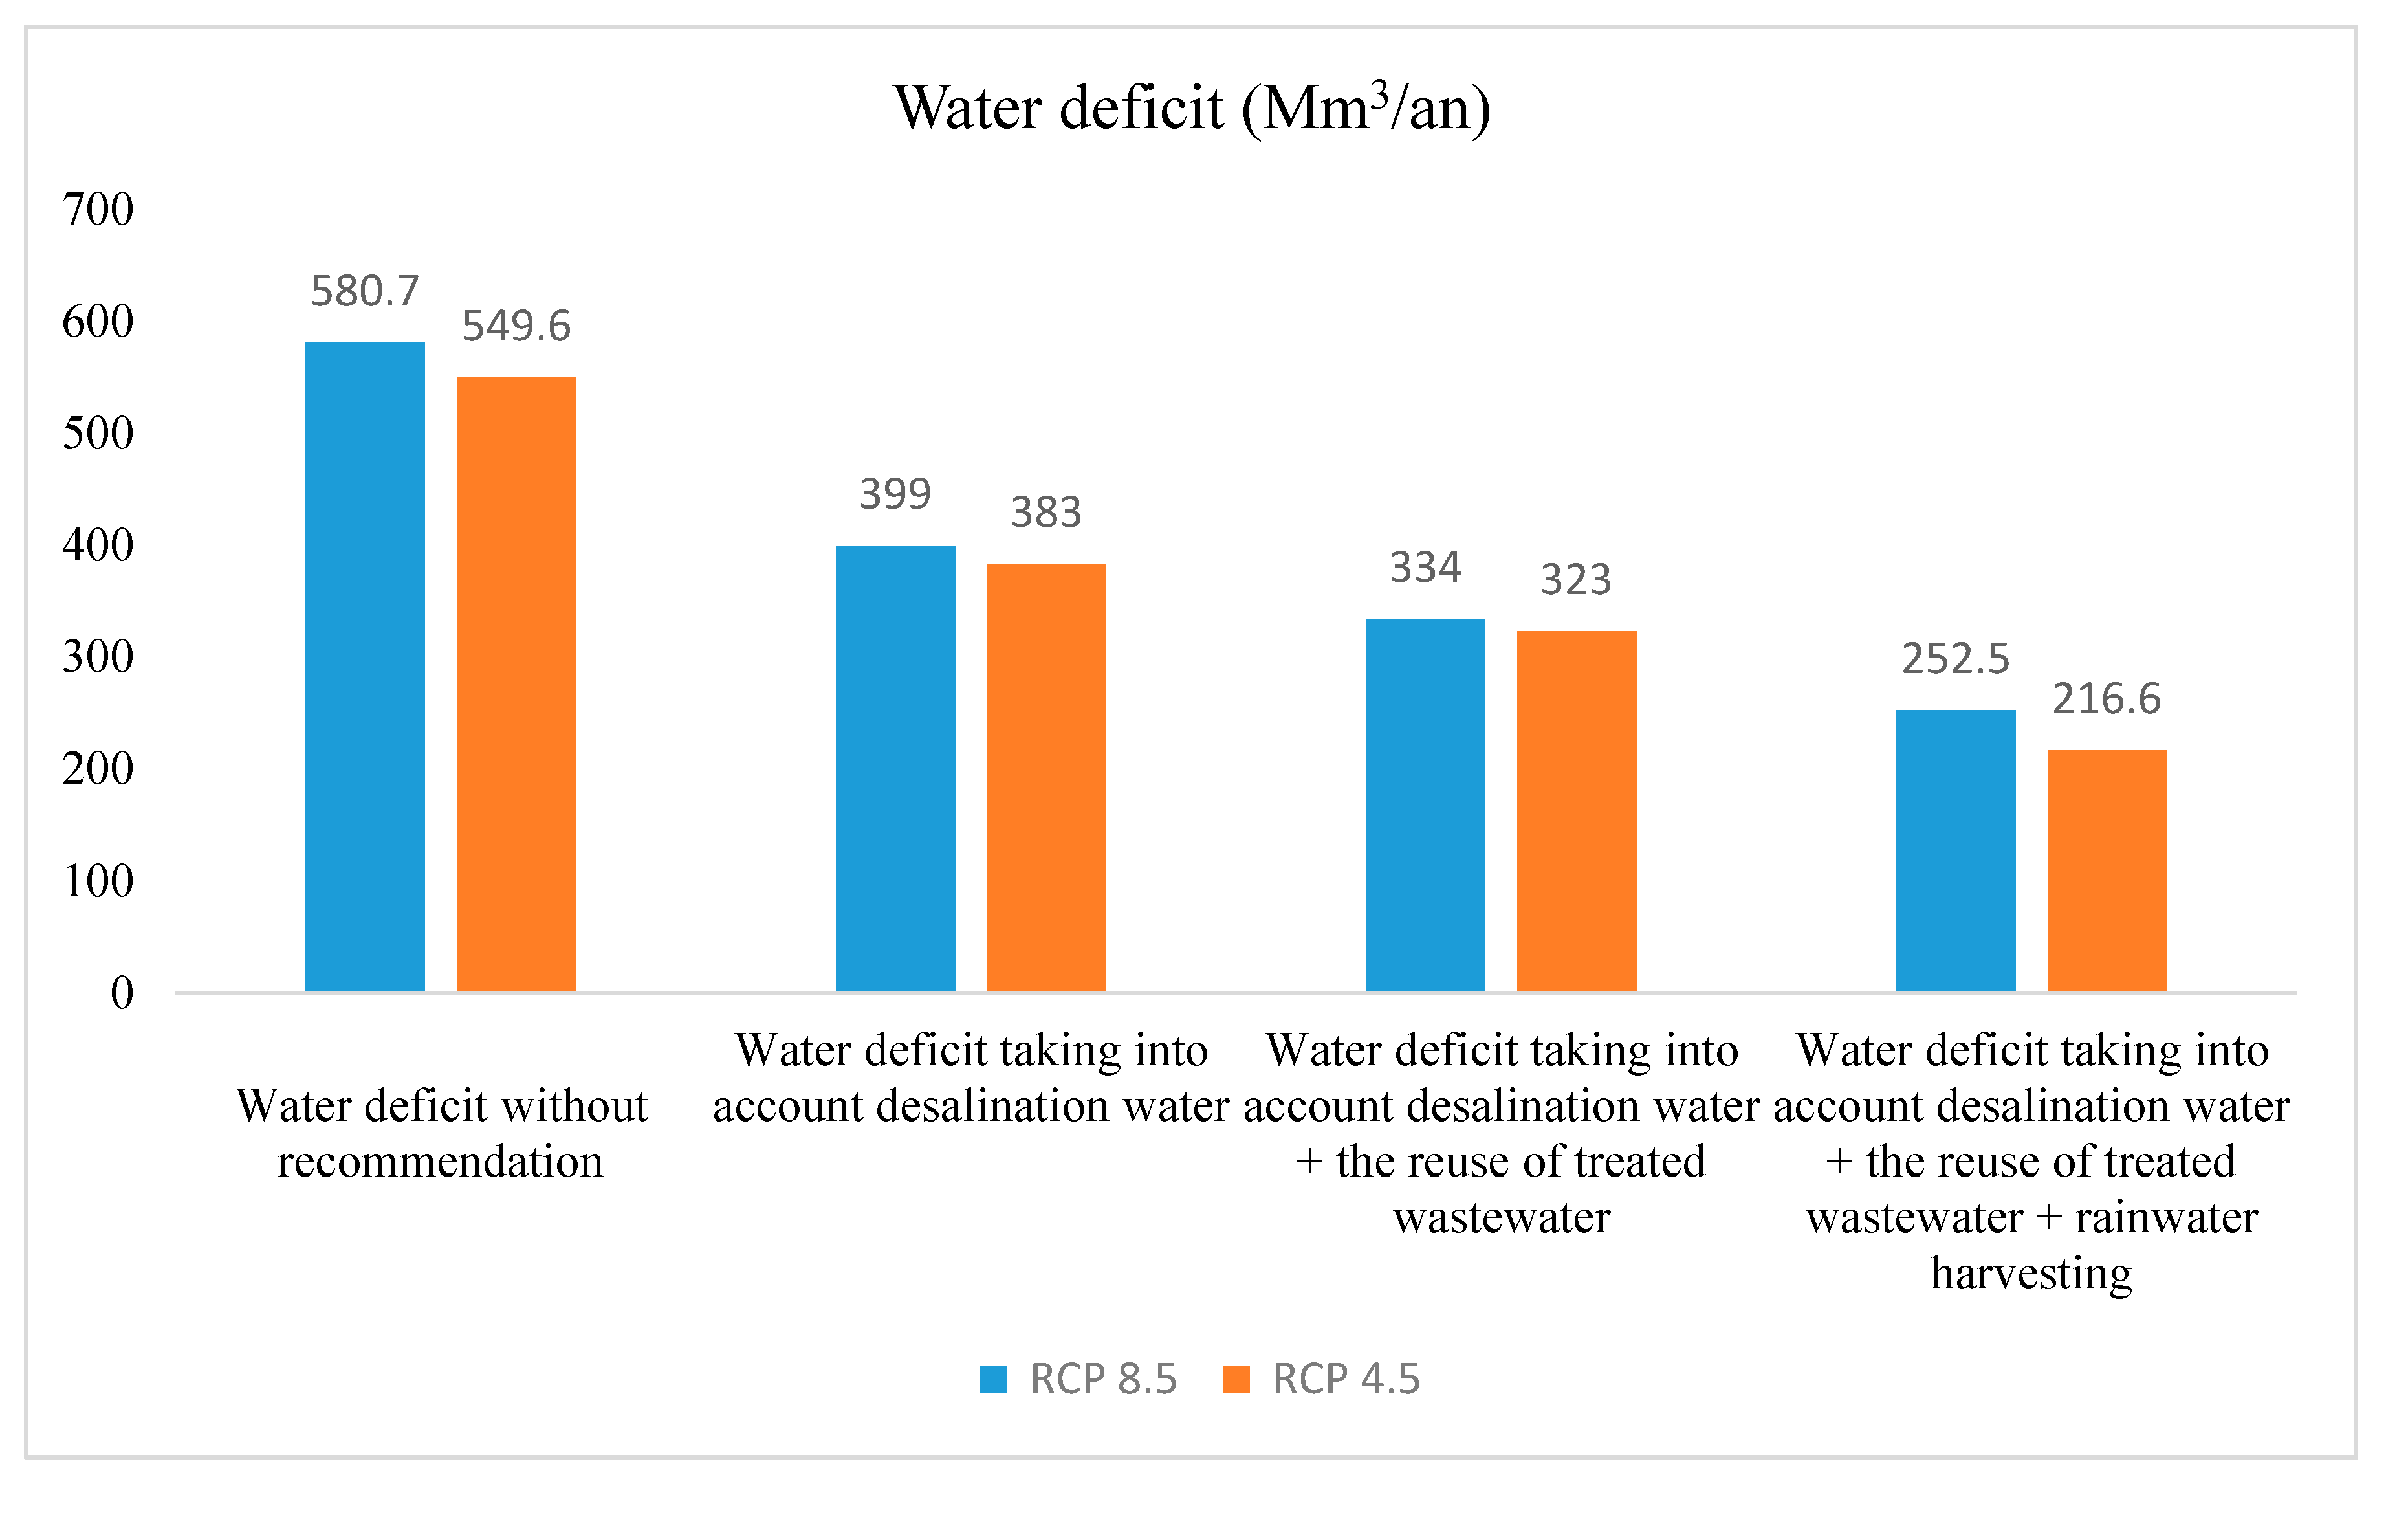
Faced with the disastrous situation that the Souss–Massa basin will experience regarding the availability of water resources as a result of climate change, the use of unconventional water resources seems to be the most appropriate option; this includes establishing desalination plants, reusing treated water, and collecting rainwater (
Figure 10).
In addition to unconventional water resources, water resources can be saved in the agriculture sector by improving the efficiency of irrigation systems and by appropriately choosing crops.
5. Conclusions
The Chtouka Ait Baha region is the most productive region in Morocco in terms of horticultural production, especially export-protected agriculture.
The aim of this study was the identification and assessment of suitable land for agricultural cultivation. Thus, the GIS-assisted MCDM analysis was used to generate land suitability maps, which were then compared to the current land use map. The suitability study was conducted using four criteria reflecting the land, slope, climate properties, and soil structure of the area.
The study estimates that the area of suitable lands classes (Highly, moderately, and marginally suitable) will decrease by 23% under the RCP 8.5 scenario and by 9% under RCP 4.5. While the area of unsuitable lands will increase. This loss in land suitability projected at the end of the century requires important political and management efforts to maintain agricultural activity and avoid any weakening of the socio-economic situation in the area.
Crop season length is projected to be shortened by 8% to 21% depending on the crops, thus significantly reducing their water consumption. This shortening of the cycle and decrease in water consumption may negatively impact yields. This result highlights a future need for significant agricultural improvement in cropping plans and the introduction of new technologies to maintain crop productivity in response to potential yield loss.
The combination of GIS and MCDM is a powerful tool to evaluate the land suitability for agriculture. These tools allow results to be obtained with important applications in farming systems as they will help farmers choose crops and varieties according to the length of crop season (LCS) and considering land suitability under climate change and variability in the Chtouka area. However, spatial decision problem solving involves a large set of evaluation criteria with conflicting resolution and units. Furthermore, criteria are evaluated by a number of individuals (farmers, agronomists, stakeholders, etc.) who have conflicting ideas, preferences, objectives, etc.
As a perspective on this study, it would be interesting to integrate water availability and the use of high-resolution climate data to assess land suitability more accurately. In addition, acreage classes can be included as an indicator of agricultural suitability. Furthermore, future improvements should include the loss of land suitability due to soil erosion and salinization, in addition to the competition between different economic sectors, such as forestry and urbanization for the same piece of land.
Author Contributions
Conceptualization, M.S.-E., Z.E.A.E.M., and L.B.; methodology, M.S.-E., Z.E.A.E.M., and L.B.; software, M.S.-E.; resources, L.B.; data curation, M.S.-E., A.H.; writing original draft preparation, M.S.-E., Z.E.A.E.M., and. L.B.; writing review and editing, M.S.-E., Z.E.A.E.M., E.H.B., R.C.-A., A.H., and, L.B.; project administration, R.C.-A. and L.B. All authors have read and agreed to the published version of the manuscript.
Funding
This research received no external funding.
Acknowledgments
The authors express their gratitude to the Hydraulic Basin Agency of Souss–Massa and the agricultural department for access to their database. This work was carried out within the GLOBAQUA and WASA project. We thank the CHARISMA Project for the assistance with the Hassan 2 Academy of Sciences and techniques. We thank three reviewers and the editor for their constructive remarks that significantly improved the quality of this paper.
Conflicts of Interest
The authors declare no conflict of interest.
Appendix A
Figure A1.
Field survey design used in our study.
Figure A1.
Field survey design used in our study.
The individual answers are kept confidential and inaccessible. Only aggregated results were analyzed, and they were only available as a percentage of the local respondents’ overall opinions. The answers from this questionnaire were used to estimate the need and demand for irrigation water in the region.
Table A1.
Field survey.
| Date | | | | | | |
|---|
| 1 | Farm GPS coordinates | | | | | |
| 2 | Farmer name | | | | | |
| 4 | Education | Illiterate | Primary school | | High school | University |
| 5 | Land location | | | | | |
| 6 | Commune | | | | | |
| 7 | Land tenure | | | | | |
| 8 | Soil texture | (1) Sandy | (2) Sandy clay | (3) Clay | (4) Light clay and limestone | |
| 9 | Total land area | | | | | |
| 10 | Planted area | | | | | |
| 11 | Varieties | Variety 1 | Variety 2 | Variety 3 | Variety 4 | Variety 5 |
| 12 | Plants’ age | | | | | |
| 13 | Density | | | | | |
| 14 | Average yield (Kg/Ha) | | | | | |
| 15 | Planting date | | | | | |
| 16 | End of season | | | | | |
| 17 | Irrigated crops (Y/N) | | | | | |
| 18 | Irrigation source | Dam water | | Well | | Others |
| 19 | Well depth (m) | | | | | |
| 20 | Pump technique | Traditional | | Vertical | | Submersible |
| 21 | Pump flow (QM/H) | | | | | |
| 22 | Pump motor | Electrical | | Diesel | | |
| 23 | Water meter availability | Yes | | No | | |
| 24 | Irrigation method | Dripper | Sprinklers | Open tube | Channels | |
| 25 | Irrigation frequency | | | | | |
| 26 | Irrigation quantity per m3/total farm | | | | | |
| 27 | Irrigation duration per hour | | | | | |
| 28 | Irrigation costs per m3 or hour | | | | | |
| 29 | Average irrigation per m3/total farm | | | | | |
| 30 | Average irrigation per m3/ha | | | | | |
| 31 | Average irrigation per H/total farm | | | | | |
| 32 | Average irrigation per H/Ha | | | | | |
| 33 | Irrigation adequacy from the farmer’s standpoint | Quite enough | | To a certain degree | | Not enough |
| 34 | If irrigation is inadequate, what is the required increase percentage? | | | | | |
| 35 | Suitability of water quality for irrigation from the farmer’s standpoint | Quite good | | To a certain degree | | Salty |
| 36 | Monitoring of water quality | Yes | | No | | |
| 37 | Type and frequency of monitoring | Physico-chemical | | Microbiological | | |
| 38 | Method used to calculate water requirements | Local agricultural institute data | Drainage trays for substrate growing | Evaporation meters | Water tension meters (soil moisture content) | Farm rain gauges |
| 39 | Unit commonly used by the grower (minutes or m3) | | | | | |
| 40 | Irrigation water EC measurement | | | | | |
| 41 | Total irrigation volume (m3) | | | | | |
| 42 | Total irrigation volume (m3/ha) | | | | | |
| 43 | Monthly irrigation volume | | | | | |
| 44 | Monthly irrigation volume (m3/ha) | | | | | |
| 45 | Irrigation volume per season | | | | | |
| 46 | Irrigation volume per season (m3/ha) | | | | | |
| 47 | Interested in the desalinated water | Yes | | No | | |
| 48 | Comments | | | | | |
Appendix B
Figure A2.
Land use/land cover obtained using satellite images (Sentinel 2A, R10m).
Figure A2.
Land use/land cover obtained using satellite images (Sentinel 2A, R10m).
References
- Gricu, M.A. L’agriculture Marocaine en chiffres. Available online: http://www.agriculture.gov.ma/sites/default/files/agriculture_en_chiffres_2014-vf.pdf (accessed on 7 October 2020).
- Kang, Y.; Khan, S.; Ma, X. Climate change impacts on crop yield, crop water productivity and food security—A review. Prog. Nat. Sci. 2009, 19, 1665–1674. [Google Scholar] [CrossRef]
- Mozny, M.; Tolasz, R.; Nekovar, J.; Sparks, T.; Trnka, M.; Zalud, Z. The impact of climate change on the yield and quality of Saaz hops in the Czech Republic. Agric. For. Meteorol. 2009, 149, 913–919. [Google Scholar] [CrossRef]
- Mohammad, V. Importance of solar radiation, temperature, relative humidity, and wind speed for calculation of reference evapotranspiration. Arch. Agron. Soil Sci. 2014, 239–255. [Google Scholar] [CrossRef]
- Joerin, F.; Thériault, M.; Musy, A. Using GIS and outranking multicriteria analysis for land-use suitability assessment. Int. J. Geogr. Inf. Sci. 2001, 15, 153–174. [Google Scholar] [CrossRef]
- Bandyopadhyay, S.; Jaiswal, R.K.; Hegde, V.S.; Jayaraman, V. Assessment of land suitability potentials for agriculture using a remote sensing and GIS based approach. Int. J. Remote Sens. 2009, 879–895. [Google Scholar] [CrossRef]
- Hatfield, J.L.; Prueger, J.H. Temperature extremes: Effect on plant growth and development. Weather Clim. Extremes 2015, 10, 4–10. [Google Scholar] [CrossRef] [Green Version]
- Seif-Ennasr, M.; Zaaboul, R.; Hirich, A.; Nils, G.; Bouchaou, L.; El, Z.; El, A.; Hassane, E.; Mcdonnell, R.A.; Choukr-allah, R. Science of the Total Environment Climate change and adaptive water management measures in Chtouka Aït Baha region (Morocco). Sci. Total Environ. 2016, 573, 862–875. [Google Scholar] [CrossRef]
- Ort, D.; Thomson, A.M.; Wolfe, D. Climate Impacts on Agriculture: Implications for Crop Production. Agron. J. 2011, 203, 351–370. [Google Scholar] [CrossRef] [Green Version]
- Jones, P.G.; Thornton, P.K. The potential impacts of climate change on maize production in Africa and Latin America in 2055. Glob. Environ. Chang. 2003, 13, 51–59. [Google Scholar] [CrossRef]
- Alexandrov, V.; Hoogenboom, G. The impact of climate variability and change on crop yield in Bulgaria. Agric. For. Meteorol. 2000, 104, 315–327. [Google Scholar] [CrossRef]
- Challinor, A.J.; Wheeler, T.R.; Craufurd, P.Q.; Ferro, C.A.T.; Stephenson, D.B. Adaptation of crops to climate change through genotypic responses to mean and extreme temperatures. Agric. Ecosyst. Environ. 2007, 119, 190–204. [Google Scholar] [CrossRef] [Green Version]
- Jalota, S.K.; Kaur, H.; Kaur, S.; Vashisht, B.B. Impact of climate change scenarios on yield, water and nitrogen-balance and -use efficiency of rice-wheat cropping system. Agric. Water Manag. 2013, 116, 29–38. [Google Scholar] [CrossRef]
- Amisigo, B.A.; Mccluskey, A.; Swanson, R. Modeling Impact of Climate Change on Water Resources and Agriculture Demand in the Volta Basin and other Basin Systems in Ghana. Sustainability 2015, 7, 6957–6975. [Google Scholar] [CrossRef] [Green Version]
- Saadi, S.; Todorovic, M.; Tanasijevic, L.; Pereira, L.S.; Pizzigalli, C.; Lionello, P. wheat and tomato crop evapotranspiration, irrigation requirements and yield. Agric. Water Manag. 2015, 147, 103–115. [Google Scholar] [CrossRef]
- Lazzara, P.; Rana, G. The Crop Coefficient (K c) Values of the Major Crops Grown under Mediterranean Climate; C.R.A: Bari, Italy, 1998; p. 28. [Google Scholar]
- Badr, G.; Hoogenboom, G.; Davenport, J.; Smithyman, J. Estimating Growing Season Length Using Vegetation Indices Based on Remote Sensing: A Case Study for Vineyards in Washington state. Trans. ASABE 2015, 58, 551–556. [Google Scholar] [CrossRef]
- Allen, R.G.; Pereira, L.S.; Raes, D.; Smith, M.; Ab, W. Crop Evapotranspiration—Guidelines for Computing Crop Water Requirements; F.A.O.: Rome, Italy, 1998; p. 15. [Google Scholar]
- Guti, A.; Orozco, A.; Vargas, G. Phenological and ecophysiological responses of Capsicum annuum var. glabriusculum to native arbuscular mycorrhizal fungi and phosphorus availability. Environ. Exp. Bot. 2017, 138, 193–202. [Google Scholar] [CrossRef]
- Roy, J. La Culture du Framboisier Remontant Rubus idaeus L. Sous Grands Tunnels, Une Possibilete au Quebec? Université Laval: Québec, QC, Canada, 2008; p. 25. [Google Scholar]
- Chattopadhyay, N.; Hulme, M. Evaporation and potential evapotranspiration in India under conditions of recent and future climate change. Agric. For. Meteorol. 1997, 87, 55–73. [Google Scholar] [CrossRef]
- Ndiaye, P.M.; Bodian, A.; Diop, L.; Djaman, K. Sensitivity Analysis of the Penman-Monteith Reference Evapotranspiration to Climatic Variables: Case of Burkina Faso. J. Water Resour. Prot. 2017, 9, 1364–1376. [Google Scholar] [CrossRef] [Green Version]
- Kijne, J.; Barker, R. Water Productivity in Agriculture: Limits and Opportunities for Improvement; CABI Publishing: Wallingford, UK, 2004; p. 332. [Google Scholar]
- Feizizadeh, B.; Blaschke, T. Land suitability analysis for Tabriz County, Iran: A multi-criteria evaluation approach using GIS. J. Environ. Plann. Manag. 2013, 1–23. [Google Scholar] [CrossRef]
- Kwiesielewicz, M.; Van Uden, E. Inconsistent and contradictory judgments in pairwise comparison method in the AHP. Comput. Oper. Res. 2004, 31, 713–719. [Google Scholar] [CrossRef]
- Saaty, T.L. A scaling method for priorities in hierarchical structures. J. Math. Biol. 1977, 15, 234–281. [Google Scholar] [CrossRef]
- Saaty, T.L. Decision making—The Analytic Hierarchy and Network Processes (AHP/ANP). Int. J. Syst. Sci. Eng. 2004, 13, 1–35. [Google Scholar] [CrossRef]
- CENTRA Technology, Inc.; Scitor Corporation. NothAfrica: The Impact of Climate Change to 2030: Geopolitical Implications. Available online: https://www.dni.gov/files/documents/climate2030_north_africa.pdf (accessed on 7 October 2020).
- Olesen, J.E.; Bindi, M. Consequences of climate change for European agricultural productivity, land use and policy. European J. Agron. 2002, 16, 239–262. [Google Scholar] [CrossRef]
- Schaldach, R.; Koch, J.; Aus Der Beek, T.; Kynast, E.; Flörke, M. Current and future irrigation water requirements in pan-Europe: An integrated analysis of socio-economic and climate scenarios. Glob. Planet. Change 2012, 94–95, 33–45. [Google Scholar] [CrossRef]
- Herrera-Pantoja, M.; Hiscock, K.M. Projected impacts of climate change on water availability indicators in a semi-arid region of central Mexico. Environ. Sci. Policy 2015, 54, 81–89. [Google Scholar] [CrossRef]
- Pervez, S.; Henebry, G.M. Regional Studies Assessing the impacts of climate and land use and land cover change on the freshwater availability in the Brahmaputra River basin. J. Hydrol. Regional Studies 2015, 3, 285–311. [Google Scholar] [CrossRef] [Green Version]
- Jeevananda, S. Sensitivity of some potential evapotranspiration estimation methods to climate change. Agric. For. Meteorol. 1995, 77, 121–125. [Google Scholar] [CrossRef]
- Samani, Z. Estimating Solar Radiation and Evapotranspiration Using Minimum Climatological Data. J. Irrig. Drain. Eng. 2000, 126, 265–267. [Google Scholar] [CrossRef]
- Bouras, E.; Jarlan, L.; Khabba, S.; Er-Raki, S.; Dezetter, A.; Sghir, F.; Tramblay, Y. Assessing the impact of global climate changes on irrigated wheat yields and water requirements in a semi-arid environment of Morocco. Sci. Rep. 2019, 9, 1–14. [Google Scholar] [CrossRef]
- Eyni-Nargeseh, H.; Deihimfard, R.; Rahimi-Moghaddam, S.; Mokhtassi-Bidgoli, A. Analysis of growth functions that can increase irrigated wheat yield under climate change. Meterol. Appl. 2019, 1–10. [Google Scholar] [CrossRef] [Green Version]
- Deihimfard, R.; Eyni-Nargeseh, H.; Mokhtassi-Bidgoli, A. Effect of Future Climate Change on Wheat Yield and Water Use Efficiency Under Semi-arid Conditions as Predicted by APSIM-Wheat Model. Int. J. Plant Prod. 2018, 12, 115–125. [Google Scholar] [CrossRef]
- Mo, X.; Guo, R.; Liu, S.; Lin, Z.; Hu, S. Impacts of climate change on crop evapotranspiration with ensemble GCM projections in the North China Plain. Clim. Chang. 2013, 120, 299–312. [Google Scholar] [CrossRef]
- Bouchaou, L.; Hirich, A.; Choukr-allah, R.; Bouaakaz, B.; Malki, M.; Abahous, H.; Nrhira, A. Climate change and water valuation in Souss-Massa region: Managementand adaptive measures. In Panta Rhei., Proceedings of the 10th World Congress of EWRA on Water Resources and Environment; Tsakiris, G., Tsihrintzis, V.A., Vangelis, H., Tigkas, D., Eds.; EWRA: Catania, Italy, 2017; pp. 835–843. [Google Scholar]
- Elame, F.; Lionboui, H.; Redouane, C. Water Use Efficiency and Valuation in Agriculture in the Souss-Massa. In The Souss—Massa River Basin, Morocco. The Handbook of Environmental Chemistry; Springer: Cham, Switzerland, 2016; pp. 275–283. [Google Scholar] [CrossRef]
- Hirich, A.R.; Nrhira, A.; Malki, M.; Bouchaou, L. Contribution of Seawater Desalination to Cope with Water Scarcity in Souss-Massa Region in Southern Morocco. In The Souss—Massa River Basin, Morocco. The Handbook of Environmental Chemistry; Springer: Cham, Switzerland, 2016; Volume 53, pp. 213–226. [Google Scholar] [CrossRef]
- Modélisation des Impacts des Changements Climatiques sur L’équilibre Offre-demande en eau et sur les Bilans Hydriques; ABHSMD: Agadir, Morocco, 2019.
| Publisher’s Note: MDPI stays neutral with regard to jurisdictional claims in published maps and institutional affiliations. |
Figure 1.
Location and elevation of the study area (Chtouka Ait Baha).
Figure 1.
Location and elevation of the study area (Chtouka Ait Baha).
Figure 2.
Rainfall and temperature trend of average Coordinated Regional Climate Downscaling Experiment (CORDEX) models outputs under representative concentration pathways (RCP) 4.5 and RCP 8.5 emission scenarios.
Figure 2.
Rainfall and temperature trend of average Coordinated Regional Climate Downscaling Experiment (CORDEX) models outputs under representative concentration pathways (RCP) 4.5 and RCP 8.5 emission scenarios.
Figure 3.
Land suitability factors (a) soil texture, (b) slope, (c) land use, (d) T baseline, (e) T projected under RCP4.5, (f) T projected under RCP8.5.
Figure 3.
Land suitability factors (a) soil texture, (b) slope, (c) land use, (d) T baseline, (e) T projected under RCP4.5, (f) T projected under RCP8.5.
Figure 4.
GIS-based (Geographic Information System) multiple criteria decision making (MCDM) methodology for land suitability analysis.
Figure 4.
GIS-based (Geographic Information System) multiple criteria decision making (MCDM) methodology for land suitability analysis.
Figure 5.
Land suitability map (a) baseline, (b) under the RCP4.5 scenario, and (c) under the RCP 8.5 scenario.
Figure 5.
Land suitability map (a) baseline, (b) under the RCP4.5 scenario, and (c) under the RCP 8.5 scenario.
Figure 6.
Land suitability classes (upper) baseline, (minddle) under the RCP4.5 scenario, and (lower) under the RCP 8.5 scenario.
Figure 6.
Land suitability classes (upper) baseline, (minddle) under the RCP4.5 scenario, and (lower) under the RCP 8.5 scenario.
Figure 7.
Projection of seasonal evapotranspiration change under climate scenarios RCP 4.5 and RCP 8.5 for 2030–2049.
Figure 7.
Projection of seasonal evapotranspiration change under climate scenarios RCP 4.5 and RCP 8.5 for 2030–2049.
Figure 8.
Length of crop season (number of days) for tomatoes, beans, capsicums, and raspberries as projected under RCP 4.5 and RCP 8.5 emission scenarios.
Figure 8.
Length of crop season (number of days) for tomatoes, beans, capsicums, and raspberries as projected under RCP 4.5 and RCP 8.5 emission scenarios.
Figure 9.
Economic (EWP) and crop water productivity (CWP) for the main crops cultivated under two types of irrigation systems (drip and surface irrigation) in the Souss–Massa region [
39].
Figure 9.
Economic (EWP) and crop water productivity (CWP) for the main crops cultivated under two types of irrigation systems (drip and surface irrigation) in the Souss–Massa region [
39].
Figure 10.
Impact of the use of unconventional water resources on the water balance in the Souss–Massa region [
42].
Figure 10.
Impact of the use of unconventional water resources on the water balance in the Souss–Massa region [
42].
Table 1.
Maturity growing degree day (GDD) for each investigated crop [
18,
19,
20].
Table 1.
Maturity growing degree day (GDD) for each investigated crop [
18,
19,
20].
| Crops | Maturity GDD | Tbase |
|---|
| Tomatoes | 1500 | 7 |
| Capsicums | 1300 | 8 |
| Raspberries | 2300 | 7.2 |
| Beans | 1300 | 10 |
Table 2.
Data collection of land suitability factors.
Table 2.
Data collection of land suitability factors.
Table 3.
The scale for pairwise comparison.
Table 3.
The scale for pairwise comparison.
| Intensity of Importance | Definition | Explanation |
|---|
| 1 | Equal importance | Two parameters contribute equally to the objective |
| 3 | Moderate importance of one over another | Experience and judgment slightly favor one parameter over another |
| 5 | Essential or strong importance | Experience and judgment strongly favor one parameter over another |
| 7 | Demonstrated importance | A parameter is strongly favored, and its dominance demonstrated in practice |
| 9 | Absolute importance | The evidence favoring one parameter is of the highest possible order of affirmation |
| 2,4,6,8 | Intermediate value between the two adjacent judgments | When compromise is needed |
Table 4.
Main criteria rating based on the pairwise comparison matrix.
Table 4.
Main criteria rating based on the pairwise comparison matrix.
| | Temperature | Soil Texture | Land Use | Slope | Weight |
|---|
| Temperature | 1 | 3 | 2 | 3 | 0.44 |
| Soil texture | 1/3 | 1 | 1/2 | 3 | 0.19 |
| Land use | 1/2 | 2 | 1 | 3 | 0.28 |
| Slope | 1/3 | 1/3 | 1/3 | 1 | 0.10 |
Table 5.
Weights of the parameters and scores of the sub-parameters.
Table 5.
Weights of the parameters and scores of the sub-parameters.
| Criteria | Weight | Influence | Sub-Criterion (with Ranges) | Score |
|---|
| Soil texture | 0.19 | 19 | Sandy clay loam | 9 |
| Sandy clay | 7 |
| Loam | 5 |
| Silty loam | 3 |
| Clay loam | 1 |
| Slope | 0.10 | 10 | Moderate (0–6.29) | 10 |
| Stiff (6.29–13.17) | 6 |
| steep (22.04–33.49) | 3 |
| Precipitous (33.49–72.99) | 1 |
| Land use | 0.28 | 28 | Ocean | 1 |
| Oued | 1 |
| Dam | 1 |
| Forest (Argan) | 3 |
| Forest | 5 |
| Building | 1 |
| Roads | 1 |
| Agricultural area (non-irrigated crops) | 7 |
| Bare soil | 7 |
| Uncultivated area | 7 |
| Agricultural area (irrigated crops) | 9 |
| Temperature | 0.44 | 44 | Optimal temperature (15 °C–25 °C) | 10 |
| Moderate suitable temperature (25 °C–30 °C)/(12 °C–15 °C) | 7 |
| Marginally suitable temperature (30 °C–40 °C)/(8 °C–12 °C) | 4 |
| Not suitable temperature (<8 °C/>40 °C) | 1 |
Table 6.
Accuracy matrix.
Table 6.
Accuracy matrix.
| Suitability Class | Point Verified | Correctly Classified Points | % of Correctly Classified Points |
|---|
| Highly suitable | 20 | 13 | 65% |
| Moderately suitable | 20 | 12 | 60% |
| Marginally suitable | 20 | 14 | 70% |
| Moderately unsuitable | 20 | 11 | 55% |
| Highly unsuitable | 10 | 7 | 70% |
| Total | 90 | 57 | 64% |
Table 7.
Sensitivity and correlation coefficient of climatic parameters with the reference evapotranspiration.
Table 7.
Sensitivity and correlation coefficient of climatic parameters with the reference evapotranspiration.
| | RHavg | P | Rs | Tmin | Tmean | Tmax | Ws |
|---|
| | R | CS | R | CS | R | CS | R | CS | R | CS | R | CS | R | CS |
| S01 | −0.428 | 0.078 | −0.219 | 0.898 | 0.882 | 0.00027 | 0.476 | 0.275 | 0.632 | 0.254 | 0.623 | 0.186 | 0.402 | 0.305 |
| S02 | −0.371 | 0.042 | −0.214 | 2.356 | 0.902 | 0.00015 | 0.464 | 0.217 | 0.643 | 0.156 | 0.685 | 0.107 | 0.276 | 0.192 |
| S03 | −0.590 | 0.091 | −0.208 | 2.073 | 0.891 | 0.00030 | 0.438 | 0.335 | 0.639 | 0.381 | 0.742 | 0.289 | 0.309 | 0.237 |
| S04 | −0.561 | 0.098 | −0.285 | 0.425 | 0.874 | 0.00031 | 0.483 | 0.423 | 0.729 | 0.417 | 0.782 | 0.338 | 0.337 | 0.365 |
| S05 | −0.683 | 0.091 | −0.367 | 0.259 | 0.816 | 0.00024 | 0.665 | 0.380 | 0.879 | 0.343 | 0.878 | 0.268 | 0.100 | 0.257 |
| S06 | −0.597 | 0.081 | −0.356 | 0.200 | 0.907 | 0.00022 | 0.628 | 0.351 | 0.863 | 0.326 | 0.848 | 0.240 | 0.273 | 0.288 |
| S07 | −0.541 | 0.095 | −0.148 | 1.967 | 0.887 | 0.00029 | 0.608 | 0.395 | 0.784 | 0.411 | 0.807 | 0.321 | 0.351 | 0.487 |
| S08 | −0.639 | 0.103 | −0.251 | 0.323 | 0.836 | 0.00030 | 0.507 | 0.448 | 0.702 | 0.442 | 0.761 | 0.339 | 0.231 | 0.273 |
Table 8.
Actual water productivity of different crops in Chtouka Ait Baha.
Table 8.
Actual water productivity of different crops in Chtouka Ait Baha.
| Crop | Yield (Kg ha−1) | Amount of Applied Water (m3 ha−1) | Water Productivity (kg m3) |
|---|
| BEANS | 40,000 | 3400 | 11.76 |
| BLACKBERRIES | 10,000 | 4000 | 2.5 |
| BLUEBERRIES | 15,000 | 3500 | 4.29 |
| CAPSICUMS | 80,000 | 6000 | 13.33 |
| CITRUS | 40,000 | 8570 | 4.67 |
| ZUCCHINI | 35,000 | 4000 | 8.75 |
| CUMCUBERS | 60,000 | 9000 | 6.67 |
| EGGPLANT | 20,000 | 9000 | 2.22 |
| MELONS | 40,000 | 4500 | 8.89 |
| AROMATIC AND MEDICINAL PLANTS | 25,000 | 1500 | 16.67 |
| PEACH | 25,000 | 5000 | 5 |
| PEAS | 30,000 | 4000 | 7.5 |
| RASPBERRIES | 10,000 | 3500 | 2.86 |
| STRAWBERRIES | 50,000 | 6000 | 8.33 |
| SWEET CORN | 15,000 | 2000 | 7.5 |
| TOMATOES | 200,000 | 7000 | 28.57 |
© 2020 by the authors. Licensee MDPI, Basel, Switzerland. This article is an open access article distributed under the terms and conditions of the Creative Commons Attribution (CC BY) license (http://creativecommons.org/licenses/by/4.0/).


 ,
, 


