Abstract
In this research, one aspect of the climate that is not commonly referred to, namely, the long-term changes in the components of the atmospheric energy, is investigated. In this respect, the changes in four energy forms are considered, namely, Kinetic Energy (KE), Thermal Energy (TE), Internal Energy (IE), Potential Energy (PE) and Latent Energy (LE); the Energy Conversion (EC) between Kinetic Energy and Potential plus Internal Energy (PIE) is also considered. The area considered in this long-term energetics analysis covers the entire Mediterranean basin, the Middle East and a large part of North Africa. This broad geographical area has been identified by many researchers as a hot spot of climate change. Analyses of climatic data have indeed shown that this region has been experiencing marked changes regarding several climatic variables. The present energetics analysis makes use of the ERA-Interim database for the period from 1979 to 2018. In this 40-year period, the long-term changes in the above energetics components are studied. The monthly means of daily means for all the above energy forms and Energy Conversion comprise the basis for the present research. The results are presented in the form of monthly means, annual means and spatial distributions of the energetics components. They show the dominant role of the subtropical jet-stream in the KE regime. During the study period, the tendency is for KE to decrease with time, with this decrease found to be more coherent in the last decade. The tendency for TE is to increase with time, with this increase being more pronounced in the most recent years, with the maximum in the annual mean in KE noted in 2015. The sum of Potential and Internal energies (PIE) and the sum of Potential, Internal and Latent energies (PILE) follow closely the patterns established for TE. In particular, the strong seasonal influence on the monthly means is evident with minima of PIE and PILE noted in winters, whereas, maxima are registered during summers. In addition, both PIE and PILE exhibit a tendency to increase with time in the 40-year period, with this increase being more firmly noted in the more recent years. Although local conversion from KE into PIE is notable, the area averaging of EC shows that the overall conversion is in the direction of increasing the PIE content of the area at the expense of the KE content. EC behaves rather erratically during the study period, with values ranging from 0.5 to 3.7 × 10² W m−2. Averaged over the study area, the Energy Conversion term operates in the direction of converting KE into PIE; it also lacks a seasonal behavior.
1. Introduction
Several studies have pointed to the Mediterranean, Middle East and North Africa (MedMENA) region as a hot spot of climate change [1,2,3]. The present research examines one aspect of the climate that is not frequently referred to. In particular, this study examines the long-term changes in components of the atmospheric energetics.
The study of atmospheric energetics comprises an instructive diagnostic tool for the effective appreciation of the energy balance aspect of atmospheric dynamics [4,5]. The forms of energy that are considered in the present study are: Kinetic Energy (KE—is the energy of the atmosphere due to its motion; only horizontal motion is considered in the calculation of this component); Thermal Energy (TE—is equal to enthalpy, which is the sum of the Internal Energy and the energy associated with the pressure of the air on its surroundings); Internal Energy (IE—the energy contained within the atmosphere related to the microscopic energy of the air molecules); Potential Energy (PE—the amount of work that would have to be done, against the force of gravity, to lift the air to that location from mean sea level); Latent Energy (LE—the energy associated with the presence of atmospheric water vapour being equal to the energy required to convert liquid water into water vapour). The Potential and Internal Energies are combined into a single form of energy, denoted by PIE. When we add to this latter combined form the Latent Energy, we obtain a form of combined energies, which embraces Potential, Internal and Latent forms of energy, denoted by PILE. The Energy Conversion (denoted by EC) represents one contribution to the amount of energy being converted between KE and PIE (positive values of EC indicate conversion from KE to PIE, while conversion in the reverse direction is indicated by negative values). All the symbols and abbreviations used in this study are tabulated in Appendix A.
The inclusion in this study of all the energy forms involved in atmospheric energetics provides a multifaceted elucidatory framework in which the long-term changes in the components of the atmospheric energetics can be analyzed concurrently. The temporal characteristics of the Lorenz energy cycle of the Earth’s global atmosphere in response to climate change have been examined by Pan et al. [6] and Li. et al. [7], using global data from different sources. In these two studies, energy forms have been decomposed into zonal and eddy components and their trends have been investigated, together with the trends in other components of the Lorenz energy cycle.
The objective of this study is to investigate whether any long-term changes in the energetics components presented above over the MedMENA region can be traced by using a long record of the respective energetics integrals based on reanalysis data. An attempt is made in the present study to link some of the observed trends to large-scale features over this region, like the tropospheric jet-streams and the Hadley meridional circulation.
It is beyond the scope of this investigation to study the complete energy balance over this area but rather to explore, through a spatiotemporal analysis, whether long-term changes in atmospheric energetics components are evident. The set of equations in hybrid coordinates that can be used to study a complete energy balance over a limited area is given by Prezerakos and Michaelides [8]. The study of the complete energy balance over a limited area should take into account additional terms representing lateral boundary fluxes, as well as pressure work (see [4,5,9,10]).
2. Data
The present analysis makes use of the ERA-Interim vertical integral data for the entire 40-year period for which the European Centre of Medium-Range Weather Forecasts (ECMWF) makes it available via its internet portal. These data are the monthly means of daily means of all the energy forms and energy conversion, at a horizontal resolution of 1° × 1°, in the period from January 1979 to December 2018.
The south–north and west–east boundaries of the area considered in the present analysis are 15° N–50° N and 10° W–60° E, respectively, embracing the entire Mediterranean basin, the southern European region, the Middle East and a large part of North Africa.
The ERA-Interim atmospheric model and reanalysis system uses cycle 31r2 of ECMWF’s Integrated Forecast System (IFS), configured for 60 levels in the vertical, with the top level at 0.1 hPa and a spatial horizontal resolution of the data set at approximately 80 km.
A detailed documentation of the ERA-Interim archive is given by Berrisford et al. [11]. In addition, Dee et al. [12] describe the configuration and performance of the ERA-Interim reanalysis system. Additional details of the modelling and data assimilation system used to produce ERA-Interim can be found in the IFS documentation Cy31r1 [13].
The ERA-Interim reanalyses produced by ECMWF refer to several variables available at either pressure or model levels. For the needs of the present work, the particular group of reanalysis data termed as “the monthly means of daily means of vertical integrals” are utilized. In the ERA-Interim database, this group of variables are ready-for-use only in the hybrid vertical coordinate system used in the ECMWF model (see [12]).
The hybrid system adopted here consists of a terrain following coordinate σ = p/ps near the surface (where, p is pressure and ps is the surface pressure), but with a gradual transition to a pressure coordinate with height. As Trenberth et al. [14] note, the model’s vertical coordinates are strongly preferred when vertical integrals are calculated, as in the present study. This is because the evaluated integrals are as accurate as possible and the lower boundary conditions are handled more easily. Such incorporation of the hybrid coordinate in the calculations of the vertical integrals is an important advantage. However, a limitation of these vertical integrals is that they do not allow an analysis to be conducted based on mean and eddy components, as it was previously performed by Michaelides [4,5] who used ECMWF data on pressure coordinates.
3. Methodology
The geographical area for which the data were retrieved and which the subsequent calculations referred to is shown in Figure 1.
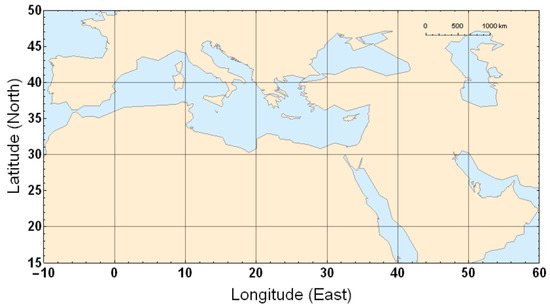
Figure 1.
The Mediterranean, Middle East and North Africa (MedMENA) region.
The energetics components discussed above are suitably described in terms of mathematical functions of the above fields which are vertically integrated, as detailed in Appendix B. These vertical integrals are subsequently solved numerically throughout the entire atmosphere’s vertical extent, by using the corresponding variables’ values at the 60 ECMWF model levels adopted in the ERA-Interim data energy integrals [11]. The vertical integration and its respective numerical analogue are elaborated in Appendix C.
The energetics components in the form of vertical integrals as explained above, are further processed to yield numerical quantities that refer to the above geographical area. In this paper, on the one hand, the term mean is used to denote an arithmetic mean of a variable over a number of times (e.g., annual mean is the arithmetic mean over twelve months); on the other hand, the term average (e.g., zonal average or area average) refers to “weighted” averages, where the weights are geometric elements on the spherical Earth, as explained in the following.
The zonal average of a quantity is represented by a one-dimensional (horizontal) integral, which is numerically solved. The zonal average refers to a “weighted” average of a quantity along a latitude circle, where the weights are the arc lengths corresponding to the longitudinal grid distance, as elaborated in Appendix C.
The area average of a quantity is represented by a double integral, which is also numerically solved. The area average refers to a “weighted” average of a quantity over the study area, where the weights are the area elements defined by the longitudinal and longitudinal grid distances with respect to the respective grid-boxes on the spherical Earth. Appendix C also explains the mathematical formulations of area averaging.
For each month in the 40-year period, the monthly means of the energetics components have been calculated. In addition, for each year in the period 1979–2018, the spatial distribution of the annual means of each of the energetics components has been evaluated by using the twelve corresponding monthly means of daily means in the original data base.
The results are presented in the form of monthly means, annual means and spatial distributions of the energetics components. The figures presented in this study refer only to four selected years from the bulk of the available forty years, in order to save space in the paper. The years selected for presentation in the paper are the first and last ones, as well as two intermediate years in the 40-year study period. All the forty latitudinal distributions for all the energetics components are available in the supplementary material as animated slides (see the Supplementary Materials Section). These animations may be used to attend the full temporal evolution of the zonally averaged energy contents.
4. Results
To meet the objective of this study, that is to expose any temporal changes in the monthly and annual means of the energetics components, as well as of their zonal and spatial distributions, the results of the energetics analysis are presented below, in various forms for the energetics components, such as times series of monthly and annual means, annual means of zonal (latitudinal) averages and spatial distributions of annual means over the MedMENA region.
4.1. Kinetic Energy
The graph of the 40-year distribution of the monthly mean of the area average of KE is shown in Figure 2 (left). The strong seasonality inherent in this distribution is apparent: in each year, maxima of Kinetic Energy occur during the winter period, whereas, during the summer, KE exhibits minimal values. It is considered that the winter-time maxima are partly associated with the occasional intrusion and enhancement of the polar front jet-stream over the northern part of the study area. However, the prevailing upper-tropospheric level feature over the study area is the subtropical jet-stream. In winter, the subtropical jet stream axis over north Africa and the Middle East is predominantly located at the 200 hPa isobaric level and in the meridional zone between 20° N and 35° N [15]. During summer, the subtropical jet-stream migrates further north; with a much weaker core, it is found at around 42° N and at a slightly higher level. Performing a Ljung–Box autocorrelation test (which tests the randomness in the data) with a time lag of twelve months, it has produced extremely low values of the relevant test statistic [16], in support of the view that the pattern in Figure 2 left is not random but a seasonality of KE content could be inferred.
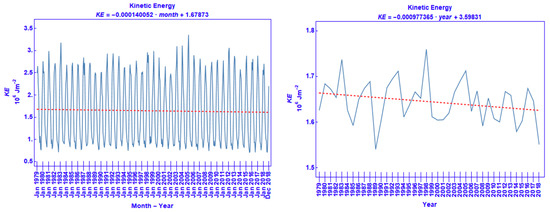
Figure 2.
The course of the monthly means of the area average of KE from 1979 to 2018 (left) and the course of the annual means of the area average of KE from 1979 to 2018 (right). The red dashed line represents the linear regression fitted to the data; its mathematical formulation is shown on top.
The time series of the annual mean of the area average of KE is shown in Figure 2 right. The annual variations of the KE content are noteworthy, with the values ranging from a minimum of 1.55 × 10⁶ J m−2 in 1989 to a maximum of 1.76 × 10⁶ J m−2 in 1998. In spite of the large annual fluctuations, there exists a tendency for the KE content to decrease with time; this decrease is more coherent in the last decade. The elapsed time between two consecutive peaks or two consecutive troughs is variable; it ranges from 3 to 7 years between the peaks and 3 to 5 years between the troughs. A Ljung–Box autocorrelation test was carried out with the respective statistic obtaining the lowest values at a time lag of 2 and 3 years.
The latitudinal distribution of the zonal average of KE in the four selected years is shown in Figure 3. From a minimum in the subtropical latitudes, KE gradually increases northwards, up to about 27° N where KE is maximized; as already noted above, this maximum is largely explained by the presence of the subtropical jet-stream which, however, appears to shift north–south during this 40-year period. The noticeable occasional increases in KE noted between 22.5° N and 32.5° N (i.e., in years 1992 and 2005) should also be ascribed to the strengthening of the subtropical jet-stream. Between consecutive years, this shifting amounts to 2–3 degrees. Bearing in mind that the descending limb of the meridional Hadley cell is closely associated with the presence of the subtropical jet-stream, this shifting of the latter could be interpreted as being associated with the north–south shifting of the descending limb of the Hadley cell affecting the area under subsiding air. It is also worth noting that this maximum in KE exhibits a variability in strength amounting to up to 2% between years in the period.


Figure 3.
The latitudinal distribution of the zonal average of the annual mean of KE for selected years.
Further north, KE decreases up to about 42° N but it then increases again, as the belt of the westerly polar front jet-stream makes its presence noticeable over the north part of the MedMENA region. Higher or lower values (e.g., year 2018) between 40° N and 45° N should be linked to the strengthening or weakening of this jet-stream and the associated baroclinicity of the atmosphere, respectively.
The spatial distributions of the annual mean of KE over the geographical area studied are shown in Figure 4. The signature of the subtropical jet-stream is always present with the east–west axis of its core located at around 27° N. For some years, this axis is shifted north or south of this mean location by 2–3 degrees. In some years, the zone of maximum KE is split into two separate cores (e.g., year 2018). In years when the jet core is stronger, KE exceeds 2 × 10⁶ J m−2.
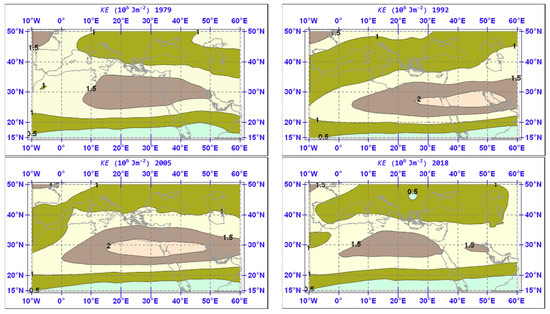
Figure 4.
The annual mean spatial distribution of KE for selected years. Isopleths are drawn for every 0.5 × 10⁶ Jm−2.
4.2. Thermal Energy
The graph of the 40-year course of the monthly mean of the area average of TE is shown in Figure 5 left. As with KE, an intense seasonality in also noted with the TE distribution. However, compared to KE, the time of occurrence of TE maxima and minima is reversed: maxima of TE occur during the summer period, whereas, during the winter, TE exhibits its annual minimum values.
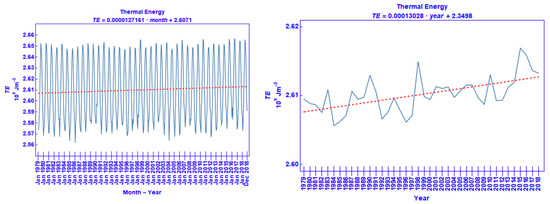
Figure 5.
The same as Figure 2, but for TE.
The course of the annual mean of TE over the 40-year distribution is shown in Figure 5 right. It is worth noting that by comparing the range of values of KE to those of TE (i.e., contrasting Figure 2 and Figure 5, respectively), the latter is generally three orders of magnitude larger than the former. In both the monthly means and annual means, there is a tendency for TE to increase with time. In particular, this increase is more pronounced in the most recent years with the maximum in the annual mean being noted in 2015. A comprehensive description of the reasons behind this temporal behavior in TE is not an easy task. A number of physical processes can lead to a temporal change in TE. Virtually any process that can lead to a change of the temperature regime can be a potential candidate.
Interpreting this increase in TE by directly referring it to the global warming due to anthropogenic activities is a simplistic and unthoughtful jumping-into-conclusions shortcut. Indeed, global warming may have a major role to play but this cannot be quantified in this study. Other processes may be responsible as well, as for example a net lateral transfer of TE into the area of study (this process can be very important for an analysis of limited area energetics, but it has not been encompassed in this study).
North Africa is a huge reservoir of mineral dust, and is the source of more than half of the global production of atmospheric mineral aerosols [17]. Research suggests that the role of mineral aerosols could be very important in the modification of the atmospheric radiative balance [18]. During the night, the top of the mineral aerosol layer is cooled via emission of thermal (long-wave) radiation to space, but during daytime the heating of the dust layer by solar irradiance generally dominates. Direct heating of the dust layer is due to absorption of solar (short-wave) radiation in the dust layer, originating directly from solar radiation coming from above the layer, but also from short-wave radiation that is reflected by the Earth’s surface from below. Solar radiation is partly absorbed by the dust layer suspended above the Earth’s surface, leading to its warming.
With the transfer of the aerosols originating from north Africa to the immediate vicinity but also to large distances, including the Mediterranean Sea and the European continent, such effects can have a significant role in the radiative balance of a wider area. In addition, African dust emissions vary greatly both on a seasonal scale but also from year to year [19], further complicating the study of its impacts on climate.
The radiative energy balance at the top of the atmosphere between the incoming solar radiation and the outgoing long-wave radiation is crucial in determining the large-scale atmospheric circulation and hence the climate [20]. The role of aerosols may be very important in the alteration of the radiation balance in the atmosphere due to the absorption and scattering of solar and thermal radiation [18,21]. Dust storm emissions appear to decrease in some parts of the world, including the north African desert [22,23]. Therefore, it may be possible that global warming has an effect on the area’s TE through the change of dust load induced by a changing temperature regime, bearing in mind that the area under study is largely covered by deserts, which are important sources of atmospheric dust.
The aerosol radiative effect is characterized by large uncertainties. For example, Kok et al. [24] found that the direct dust–climate feedback is likely in the range of −0.04 to +0.02 Wm −2 K−1. Even more so, the precise spatial dependence of the climate response to such aerosol radiative effect outside of the dust cloud is unidentified. The radiative effect of increasing atmospheric aerosols is appraised to result in a net cooling of the atmosphere but an accurate quantification of this cooling has proved to be extremely difficult [25,26]. Temporal changes in the aerosol content can have an effect on the near-surface temperature regime. Kishcha et al. [27] have studied the correlation between the changes in the aerosol content over the Sahara and the temperature changes in the lowest atmospheric layers; they found that this can be quite complex: extensive areas of the Sahara exhibit a positive correlation but areas with negative correlation are also noted.
The extension of the descending limb of the Hadley cell further northwards (which was inferred above from the northward shifting of the sub-tropical jet-stream), implies that a larger area is covered by descending air, which is adiabatically heated. This may have a role to play in the increasing trend of the area averaged TE.
The latitudinal distribution of the zonal average of TE in selected years is shown in Figure 6. Maximum values of around 2.54 × 10⁹ Jm−2 are noted at 45° N and minimum values of around 2.45 × 10⁹ Jm−2 are noted at 40° N; secondary maxima and minima are also noted to be persistently occurring at particular latitudes. The general form of the graphs appears to be quite similar in all years, however, small differences exist between years.
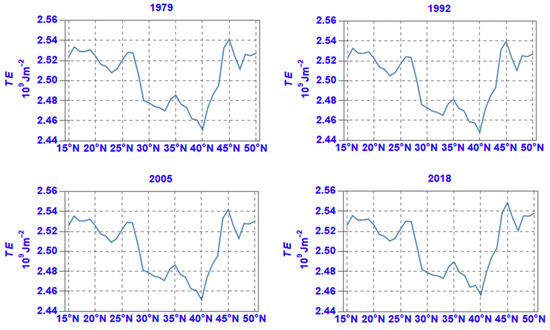
Figure 6.
Same as Figure 3 but for TE.
In a previous study, Michaelides [28] has found that the latitudinal distributions of the zonal averages of TE bear a signature of the underlying surface and ascribed it to the effect of the vertical coordinate adopted (a similar behavior was found for the longitudinal distributions of the meridional averages, but these are not are presented in this study). Indeed, as explained above, ERA-Interim incorporates a hybrid vertical coordinate system, which is terrain-following near the Earth’s surface but gradually changes into a pressure coordinate with height; this has a profound effect on the value of the TE integral. Adopting a formulation for the energy integrals that are based on the hybrid vertical coordinate system implies that the lower boundary, which is used in the integration for calculating TE, is represented by the ground elevation. Therefore, a more elevated ground implies a higher lower-level boundary. Therefore, there is no contribution to the TE integral from zero elevation up to the elevation of the ground (this is also valid for all integrals on which this study is based). In order to demonstrate this non-fixed bias of the TE integral values on elevation, a statistical treatment of the relationship between elevation and Thermal Energy is discussed in Section 4.
The spatial distributions of the annual mean of TE are shown in Figure 7 for selected years. These are delineated for selected years, as explained above in Section 3 for KE; the distributions for all years are available as supplementary material, too. From these spatial distributions, it is observed that maxima in TE, in excess of 2.6 × 10⁹ Jm−2, are persistently noted mostly over the aquatic surfaces (e.g., central Mediterranean, the Black and Red Seas and the Persian Gulf). The minima in TE are persistently noted over high elevation (e.g., Alps, Turkish Plateau, Atlas Mountains). This geographical persistence is ascribed to the hybrid vertical coordinate system, as explained above.
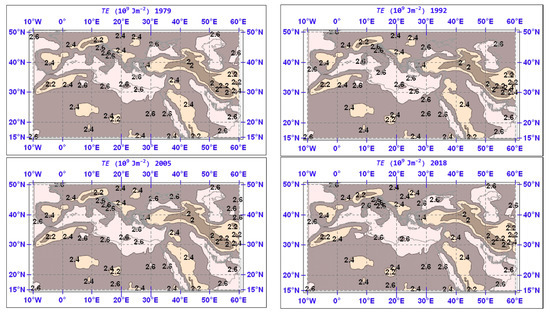
Figure 7.
Same as Figure 4 but for TE. Isopleths are drawn for every 0.2 × 10⁹ Jm−2.
4.3. Potential Plus Internal Energy
Following Margules’ [29] proposition that PE and IE can collectively be treated as a single form of energy, these two forms of energy are commonly combined into what we term here as Potential plus Internal Energy (PIE, which is equivalent to the Total Potential Energy term used by several authors in atmospheric energetics studies [30,31]). PIE can be converted into KE and vice versa.
The graph of the 40-year distribution of the monthly mean of the area average of PIE is shown in Figure 8 left. A similar seasonality with that of IE is noted: in each year, minima of PIE occur during the winter period, whereas, during the summer, PIE is exhibits maximum values. Figure 8 right depicts the time series of the annual means of the area average of the sum of Potential and Internal energies (PIE). By comparing Figure 5 and Figure 8, it becomes evident that, in general, the patterns for TE and PIE are quite similar. It is worth noting that TE and IE are not identical quantities, nor they are linearly related (as it might be inferred from Equations (A2) and (A3)). Indeed, cp and cv refer to the specific heats at constant pressure and constant volume of moist air, respectively, and their ratio is not constant (i.e., in general, IE/TE ≠ cp/cv). Nevertheless, the similarity between the patterns of TE and PIE, depicted in Figure 5 and Figure 8, prompted some examination of the respective data and found that the average ratio of TE over PIE is 0.984 and the correlation coefficient of these two quantities is almost 1.

Figure 8.
The same as Figure 2, but for PIE.
It is worth mentioning at this point that the set of the available vertical integrals for energy in the ERA-Interim data set does not exclusively include IE; however, IE is accounted for implicitly, as part of PIE (also, as part of PILE) only, taking into consideration the identity expressed by Equation (A7).
The latitudinal distribution of the zonal average of PIE in selected years is shown in Figure 9. The explanation for the bias of PIE on ground elevation is the same as for the TE given above. Indeed, the effect of elevated ground on the latitudinal zonal averages of the PIE integral is similar to the effect of the elevated ground on the latitudinal zonal averages of TE discussed above. To this, the integration of the surface geopotential (or orography in m−2 s−2) must be added, as seen from Equation (A6).
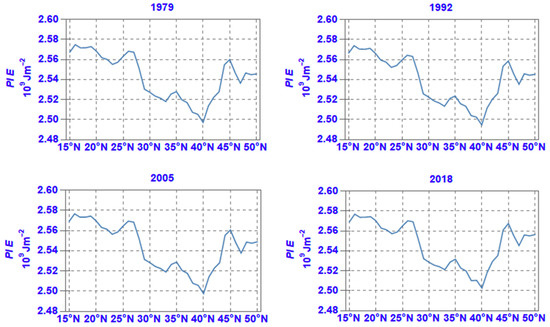
Figure 9.
Same as Figure 3 but for PIE.
The effect of ground elevation and surface geopotential on the spatial allocation of minima and maxima is also experienced in the selected spatial distributions of the annual mean of PIE over the study area depicted in Figure 10. Small changes between years are noted, with maxima in excess of 2.6 J m−2 occurring over the sea and low-lying areas, whereas, minima are noted over higher elevation.
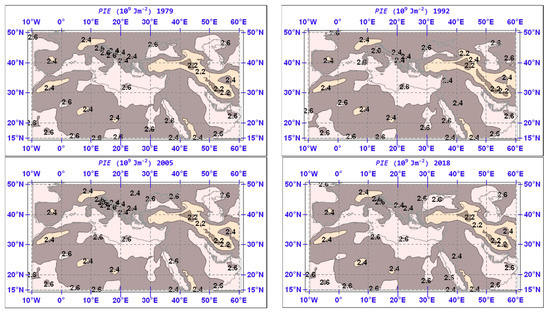
Figure 10.
Same as Figure 4 but for PIE. Isopleths are drawn for every 0.2 × 10⁹ Jm−2.
4.4. Potential, Internal Plus Latent Energies
The graphs of the 40-year distribution of the monthly and annual means of the area average of PILE are shown in Figure 11 left and right, respectively. The strong seasonal influence on the monthly means is evident: minima of PILE are noted in winters, whereas, maxima are registered during summers. The time series of PILE follows closely that of PIE. As explained above, PILE is the sum of PIE and LE. In general, by adding LE to PIE to obtain PILE, it increases the latter with respect to the former by about 1.7%.
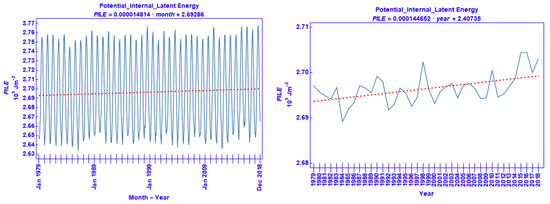
Figure 11.
The same as Figure 2, but for PILE.
The latitudinal distribution of the zonal average of PILE in selected years is shown in Figure 12.
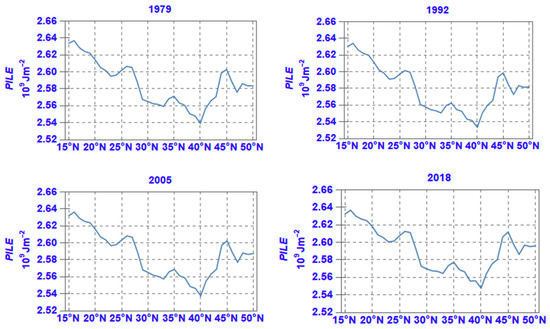
Figure 12.
Same as Figure 3 but for PILE.
Latent Energy is not directly converted into KE; also, KE is not directly converted into LE [32]. However, indirect conversions can occur: condensation converts LE into IE, while evaporation converts IE into LE. Since an appreciable part of the study area is comprised of aquatic surfaces (i.e., the Mediterranean Sea and parts of the Atlantic and Indian Oceans) interacting with the overlying atmospheric layers (from an energetics viewpoint), it is worth completing the picture of energy conversions by bringing into consideration oceanic versus atmospheric energy conversions. Evaporation from the ocean converts oceanic IE into LE; the latter may be subsequently converted into IE through condensation, as indicated above.
The spatial distributions for selected years of the annual mean of PILE are shown in Figure 13. The similarity with the distributions of PIE is outstanding, since the Latent Energy added to PIE for obtaining PILE is around 1.7%, as explained above.
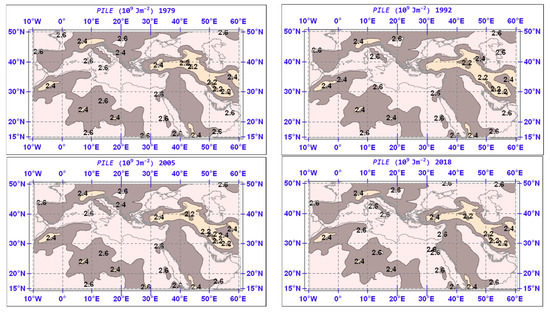
Figure 13.
Same as Figure 4 but for PILE. Isopleths are drawn for every 0.2 × 10⁹ Jm−2.
4.5. Energy Conversion
The Energy Conversion, denoted by EC (see Equation (A10)), represents one contribution to the amount of energy that is converted from KE to PIE and vice versa (negative values indicate a conversion from PIE to KE). Energy conversion has long been associated with the process of the rising of warm air masses and sinking of cold air masses [33].
The course of the monthly means of the area average of EC during the 40-year study period is shown in Figure 14 left. The most important outcome inferred from this diagram is that KE is converted into PIE, overall. Although local conversion from KE into PI is possible, the area averaging of this component shows that the conversion is in the direction of increasing the PIE content of the area. No clear seasonality in EC is noted, but EC behaves rather erratically during the study period, with values ranging from 0.5 to 3.7 × 10² W m−2.
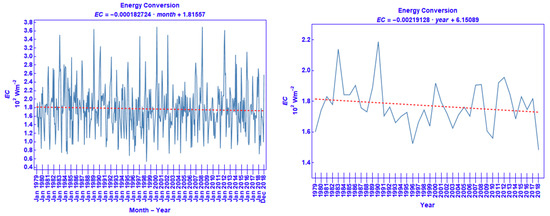
Figure 14.
The same as Figure 2, but for EC.
Figure 14 right displays the course of the annual means of the area average of EC. As should be expected from the discussion above, the conversion values appearing in this figure are positive for all years, implying an overall conversion from KE into PIE. Interannual variations are quite noticeable, with an overall tendency for this conversion to decrease with time.
The latitudinal distribution of the zonal average of EC in selected years is shown in Figure 15. It is noted that these zonal averages of EC demonstrate positive values at all latitudes, but not the northernmost ones of the region (this is not seen in the graphs of Figure 15 but can be spotted in the slide animations in the respective supplementary material). This fact implies that at almost all latitudes, EC converts KE into PIE, on average.


Figure 15.
Same as Figure 3, but for EC.
Comparing the latitudinal distributions of the zonal average of the annual mean of KE (Figure 3 and those for EC (Figure 15), it can be noted that the shapes of the respective curves are quite similar. In fact, the maximum in KE, which as discussed in Section 4.1 is closely associated to the presence of the subtropical jet-stream, coincides with the maximum in conversion from KE into PIE (the same observation holds for all years, as it can be confirmed from the supplementary material for KE and EC).
The spatial distributions of the annual mean of EC over the MedMENA region and for selected years are shown in Figure 16. Although large variations are noted between years, regarding the localization, direction and intensity of conversion, there appears to be a tendency for the positive values and negative values to occur over some geographical areas, although this cannot be generalized. In general, the greatest values are noted over the central Mediterranean and the northeast African coast. In some years, such local maxima exceed 6 × 10² Wm−2. The areas with negative values are located over the northwestern African region, western Europe and the Middle East, with localized EC minima of less than −4 × 10² Wm−2 in some places.
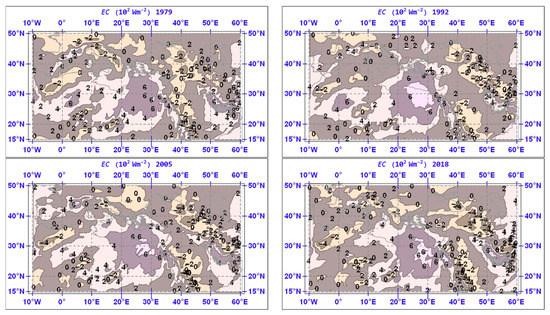
Figure 16.
Same as Figure 4, but for EC. Isopleths are drawn for every 2 × 10² Wm−2.
The effect of the terrain-following vertical coordinate should be expected in all energy integrals, (see Section 4.2, Section 4.3, Section 4.4). However, in the case of EC, it must be clarified that the situation is more intricate due to the fact that within different layers conversion may proceed in different directions (either negative or positive values are possible), so that the integral quantity is the result of contributions from both negative and positive energy conversions in different layers.
5. Discussion
The study has revealed the complexity of the energy-related processes in the Earth’s atmosphere and the difficulty in exactly interpreting the results of the analysis made. When the study refers to only part of the atmosphere, as in the present case, the interpretation of the results is even more difficult because of interactions with the surroundings. However, a study of the energetics over an open limited area of the atmosphere should be considered within the framework of the contribution of this region to the global energetics [9,10].
From the zonal averages and spatial distributions of KE content, the decisive role of the subtropical jet-stream in the KE regime is confirmed, although with variations in its average position and strength between years. This study confirms a long-known fact that KE is only a small fraction of the atmospheric energy [30,31]. This is true even for the limited area studied here, which embraces a tropospheric jet-stream of significant strength, like the subtropical one, throughout the year. Comparing orders of magnitude, the KE content is found to be three orders less than any of the TE, PIE and PILE energy forms.
A trend for TE to increase with time has been noted. An attempt was made in the present study to link the increasing trend in TE with possible changes in dust load, which might be caused by global warming. Since global warming has been found to cause a decrease in dust storm emissions in some parts of the World, including the north African desert, it is argued that an effect on TE is possible through a subsequent induced change in the radiative energy balance. In a dynamic and synoptic study of dust storms over Saudi Arabia, Mashat et al. [34] have investigated the atmospheric energetics conditions during the evolution of dust storms over this area; their study has revealed important localized energy imports, exports and conversions during the evolution of dust events.
In general, the contribution of LE to the combined form of PE, IE and LE (i.e., PILE) is about 1.7%. Bearing in mind the comments in the previous paragraph regarding the relative magnitudes of KE and PIE, it may be inferred that the bulk of energy in the atmosphere over MedMENA is mostly related to the PIE reservoir.
The energy integrals representing TE, PIE, and PILE exhibit a strong geographic bias in regard to ground elevation. This is manifested in a noticeable persistence in the spatial distributions of these energy quantities, where local minima tend to coincide with higher elevation, whereas, local maxima with lower elevation. This elevation–energy content relationship is also reflected in the zonal averages, where the minima in an energetics component’s zonal averages tend to coincide with the maxima in the zonal averages of the ground elevation (i.e., average elevation along a latitude circle); on the contrary, maxima in an energetics component’s zonal averages tend to coincide with the minima in the zonal averages of the ground elevation. To study this further, Michaelides [28] calculated (for a comparable time period) the correlation coefficient between all the grid-point values of the annual averages of the energetics components, on the one hand, and the grid-point values of the Earth’s elevation from the USGS (United States Geographical Survey) Digital Elevation Model at the same resolution as the ERA-Interim data, on the other hand. It was found that for both TE and PILE, the correlation coefficient was persistently negative, ranging from −0.857 to −0.864 for the former and from −0.830 to −0.845 for the latter: higher values of the energy integrals are related to low elevation and lower values of the energy integrals are related to high elevation.
Regarding KE, however, the calculations by Michaelides [28] reveal very low correlation coefficients between the grid-point values of the annual averages of the KE, on the one hand, and the grid-point values of the Earth’s elevation from the USGS Digital Elevation Model, on the other hand, ranging from −0.150 to 0.05. The strong signature of the subtropical jet-stream is clearly seen in KE spatial distributions and zonal averages, although notable differences are noted between different time periods regarding both the positioning and the strength of this feature.
6. Concluding Remarks
A study of the energetics comprises an enlightening diagnostic tool in the study of atmospheric dynamics and thermodynamics. In the present study, four energy forms, namely, TE, IE, PIE, and LE together with an Energy Conversion term, EC, have been examined by using the energy integral formulations and respective data from the ERA-Interim data base. The ERA-Interim energy integrals are analyzed for a 40-year time-period, in an attempt to identify temporal changes and trends over MedMENA, which is known for being a climatically sensitive region. The four forms of energy and the Energy Conversion term that were studied exhibit some interesting temporal changes and trends that can be traced during this period. The area average of KE tends to decrease over time; on the contrary, the area average of TE has a tendency to increase with time. The area average of PIE and PILE follow the same pattern as IE with a similar tendency during the 40-year period. The results of this study confirm that KE is three orders of magnitude less than PIE. It was also found that PILE, which results from adding LE to PIE, follows the patterns of the latter with the resulting increase amounting to about 1.7%.
The ERA-Interim reanalyses are produced on hybrid surfaces, which in the lowest layers are defined relative to the pressure field, following the topography of the Earth. It has been revealed in this study that this has a profound effect on the zonal and spatial averages of some forms of energy.
The above analysis has stressed the need for a very thoughtful interpretation of the results obtained by using long series of energy integrals, particularly when these are averaged zonal-wise or area-wise. For climate and long-term averages, conservation of energy and mass is essential [35,36]. However, there are many reasons why the atmospheric reanalyses do not conserve mass exactly [37]. In the present study, interactions between the limited area studied and the surroundings, including boundary transfers, have not been considered. All of the above must be taken into account in the interpretation of the results but this is not possible unless additional energetics components are used in a complete energy balance analysis [8]. A future more complete analysis taking into account all of these is planned.
Supplementary Materials
The following are available online at https://www.mdpi.com/2073-4433/11/9/976/s1, Video S1: KE spatial distributions; Video S2: KE zonal averages; Video S3: TE spatial distributions; Video S4: TE zonal averages; Video S5: PIE spatial distributions; Video S6: PIE zonal averages; Video S7: PILE spatial distributions; Video S8: PILE zonal averages; Video S9: EC spatial distributions; Video S10: EC zonal averages; File S11: Statistics Metrics.
Funding
Silas Michaelides was supported by the EMME-CARE project that has received funding from the European Union’s Horizon 2020 Research and Innovation Programme, under grant agreement no. 856612, as well as matching co-funding by the Government of the Republic of Cyprus.
Acknowledgments
The European Centre for Medium-Range Weather Forecasts (ECMWF) is hereby acknowledged for providing the ERA-Interim data used in this study, through its website: https://apps.ecmwf.int/datasets/data/interim-full-moda/levtype=sfc/. The author expresses his gratitude for the constructive comments by four anonymous reviewers, which have led to improvements in the manuscript.
Conflicts of Interest
The author declares no conflict of interest.
Appendix A

Table A1.
List of symbols and abbreviations.
Table A1.
List of symbols and abbreviations.
| Symbol/Abbreviation | Explanation |
|---|---|
| Specific heat of (moist) air at constant pressure | |
| Specific heat of (moist) air at constant volume | |
| EC | Energy Conversion |
| g | Earth’s gravitational acceleration |
| IE | Internal Energy |
| KE | Kinetic Energy |
| L | Latent heat of evaporation = 2.5008 × 10⁶ J kg−1 |
| LE | Latent Energy |
| PE | Potential Energy |
| PIE | Potential + Internal Energy |
| PILE | Potential +Internal + Latent Energy |
| p | Pressure |
| ps | Surface pressure |
| q | Specific humidity |
| R | Gas constant for air |
| Τ | Temperature (in K) |
| t | Time |
| TE | Thermal Energy |
| Wind velocity vector | |
| η | Hybrid vertical coordinate |
| σ | =p/ps; Near-surface terrain following vertical coordinate |
| Geopotential | |
| Surface geopotential (or Orography) | |
| ω | =dp/dt; Pressure tendency (or Vertical velocity) |
| Zonal average of variable X | |
| Area average of variable X |
Appendix B
Mathematical formulations of the energy integrals.
The fields of meteorological variables required for the formulation and calculation of the energetics components studied here are the temperature (T in K), the horizontal wind vector (), decomposed into its eastward and northward components (in m s−1), and specific humidity (in kg kg−1). In addition to these, an invariant field, namely, the surface geopotential (in m2 s−2) is also required.
The Kinetic Energy integral is obtained by integrating the dot product of the velocity vector through the entire atmospheric column and dividing it by 2:
In the energy integrals presented here, the quantity plays the role of a density factor in the coordinate system adopted (see Trenberth, Step Carol, 2002).
The Internal Energy integral is defined by:
where cv is the specific heat of air for constant volume.
The Thermal Energy is given by:
where cp is the specific heat of air for constant volume.
The Potential Energy is defined as
where, φ is the geopotential.
The sum of Potential and Internal energies is given by:
The expression for PIE above, is equivalent to
as it can be shown that
where, φs is the surface geopotential. The above relationship is valid only when interpreting it in an expression for the vertical integral of the sum of Potential and Internal energies.
The sum of Potential, Internal and Latent energies is:
where, L is the latent heat of evaporation and q is the specific humidity.
When we add to the above integral the Kinetic Energy, we obtain the Total energy integral (i.e., the sum of Internal, Potential, Latent and Kinetic energies):
The Energy Conversion term is expressed as:
where R is the gas constant for atmospheric air and ω = dp/dt is the pressure tendency linked to vertical motions as follows: ω < 0 for ascending motion ω > 0 for descending motion.
Appendix C
Vertical integration, Zonal and Area averaging: Integrals and numerical analogues.
The vertical integral of a quantity X is defined by a mass weighted integral of this quantity in the vertical from the bottom to the top of the atmosphere:
where plays the role of a density factor (see [38]). The numerical approximation of the above vertical integral, as it is determined by the variables values Xk, at each of the 60 ECMWF model levels, where, k = 1, 2, …, 60, is given by [11]:
In this paper, the term mean is used to denote an arithmetic mean of a variable over a number of times (e.g., annual mean is the arithmetic mean over twelve months); the term average refers to a “weighted” average with respect to arc length along a latitude circle, or grid-square area on the spherical Earth, resulting from the numerical solution of the respective zonal or area average integrals (e.g., zonal average or area average, respectively).
A zonal average of a variable X taken over an arc of a latitude circle defined by meridians λ1 and λ2 is defined by:
where, λ denotes longitude. For a given latitude φ corresponding to grid numbered f in the south–north direction, the numerical analogue of the above integral is given by the relationship:
where, is the value of the variable at the grid-point denoted by f and l, (f is determined in the south–north direction (i.e., f = 1,2,3,…m) and l is determined in the west–east direction (i.e., l = 1,2,3,…n). taken over all grid-points
An area average of a variable X over an area bounded by latitude circles φ1 and φ2 and by meridians λ1 and λ2 is defined as follows:
where, φ is latitude. The numerical analogue used for the calculations is given by:
where, the summation for f is taken over all grid-points in the south–north direction (i.e., f = 1,2,3,…m) and for l is taken over all grid-points in the west–east direction (i.e., l = 1,2,3,…n).
References
- Lelieveld, J.; Hadjinicolaou, P.; Kostopoulou, E.; Chenoweth, J.; Maayar, M.E.; Giannakopoulos, C.; Hannides, C.; Lange, M.A.; Tanarhte, M.; Tyrlis, E.; et al. Climate change and impacts in the Eastern Mediterranean and the Middle East. Clim. Chang. 2012, 114, 667–687. [Google Scholar] [CrossRef]
- Cook, B.I.; Anchukaitis, K.J.; Touchan, R.; Meko, D.M.; Cook, E.R. Spatiotemporal drought variability in the mediterranean over the last 900 years. J. Geophys. Res. 2016, 121, 2060–2074. [Google Scholar] [CrossRef] [PubMed]
- Bucchignani, E.; Mercogliano, P.; Panitz, H.J.; Montesarchio, M. Climate change projections for the Middle East–North Africa domain with COSMO-CLM at different spatial resolutions. Adv. Clim. Chang. Res. 2018, 9, 66–80. [Google Scholar] [CrossRef]
- Michaelides, S.C. Limited area energetics of Genoa cyclogenesis. Mon. Weather Rev. 1987, 13–26. [Google Scholar] [CrossRef]
- Michaelides, S.C. A spatial and temporal energetics anlysis of a baroclinic disturbance in the Mediterranean. Mon. Weather Rev. 1992, 120, 1224–1243. [Google Scholar] [CrossRef]
- Pan, Y.; Li, L.; Jiang, X.; Li, G.; Zhang, W.; Wang, X.; Ingersoll, A.P. Earth’s changing global atmospheric energy cycle in response to climate change. Nat. Commun. 2017, 8, 1–8. [Google Scholar] [CrossRef] [PubMed]
- Li, L.; Ingersoll, A.P.; Jiang, X.; Feldman, D.; Yung, Y.L. Lorenz energy cycle of the global atmosphere based on reanalysis datasets. Geophys. Res. Lett. 2007, 34, 1–5. [Google Scholar] [CrossRef]
- Prezerakos, N.G.; Michaelides, S.C. A composite diagnosis in sigma coordinates of the atmospheric energy balance during intense cyclonic activity. QJR. Meteorol. Soc. 1989, 115, 463–486. [Google Scholar] [CrossRef]
- Smith, P.J. On the contribution of a limited region to the global energy budget. Tellus 1969, 21, 202–207. [Google Scholar] [CrossRef][Green Version]
- Smith, P.J.; Horn, L.H. A computational study of the energetics of a limited region of the atmosphere. Tellus 1969, 21, 193–201. [Google Scholar] [CrossRef][Green Version]
- Berrisford, P.; Dee, D.; Fielding, K.; Fuentes, M.; Kallberg, P.; Kobayashi, S.; Uppala, S.; Simmons, A. The ERA-Interim Archive. Version 2.0. 2011. Available online: https://www.ecmwf.int/en/elibrary/8174-era-interim-archive-version-20 (accessed on 10 September 2020).
- Dee, D.P.; Uppala, S.M.; Simmons, A.J.; Berrisford, P.; Poli, P.; Kobayashi, S.; Andrae, U.; Balmaseda, M.A.; Balsamo, G.; Bauer, P.; et al. The ERA-Interim reanalysis: Configuration and performance of the data assimilation system. Q. J. R. Meteorol. Soc. 2011, 137, 553–597. [Google Scholar] [CrossRef]
- ECMWF. IFS Documentation CY31R1. 2007. Available online: https://www.ecmwf.int/en/publications/search/?solrsort=sort_labelasc&secondary_title=%22IFSDocumentationCY31R1%22 (accessed on 5 June 2020).
- Trenberth, K.E.; Caron, J.M.; Stepaniak, D.P. The atmospheric energy budget and implications for surface fluxes and ocean heat transports. Clim. Dyn. 2001, 17, 259–276. [Google Scholar] [CrossRef]
- Asiri, M.A.; Almazroui, M.; Awad, A.M. Synoptic features associated with the winter variability of the subtropical jet stream over Africa and the Middle East. Meteorol. Atmos. Phys. 2020. [Google Scholar] [CrossRef]
- Ljung, G.M.; Box, G.E.P. On a measure of lack of fit in time series models. Biometrika 1978, 65, 297–303. [Google Scholar] [CrossRef]
- Schütz, L.; Jaenicke, R.; Petrick, H. Saharan dust transport over the north Atlantic ocean. In Desert Dust: Origin, Characteristics and Effect on Man; Péwé, T.L., Ed.; Geological Society of America: Boulder, CO, USA, 1981; pp. 87–100. [Google Scholar]
- Kaufman, Y.J.; Tanré, D.; Boucher, O. A satellite view of aerosols in the climate system. Nature 2002, 419, 215–223. [Google Scholar] [CrossRef]
- Ben-Ami, Y.; Koren, I.; Altaratz, O.; Kostinski, A.; Lehahn, Y. Discernible rhythm in the spatio/temporal distributions of transatlantic dust. Atmos. Chem. Phys. 2012, 12, 2253–2262. [Google Scholar] [CrossRef]
- Haywood, J.M.; Allan, R.P.; Culverwell, I.; Slingo, T.; Milton, S.; Edwards, J.; Clerbaux, N. Can desert dust explain the outgoing longwave radiation anomaly over the Sahara during July 2003? J. Geophys. Res. D Atmos. 2005, 110, 1–14. [Google Scholar] [CrossRef]
- Miller, R.L.; Tegen, I. Climate response to soil dust aerosols. J. Clim. 1998, 11, 3247–3267. [Google Scholar] [CrossRef]
- Zhu, C.; Wang, B.; Qian, W. Why do dust storms decrease in northern China concurrently with the recent global warming? Geophys. Res. Lett. 2008, 35, 1–5. [Google Scholar] [CrossRef]
- Evan, A.T.; Flamant, C.; Gaetani, M.; Guichard, F. The past, present and future of African dust. Nature 2016, 531, 493–495. [Google Scholar] [CrossRef]
- Kok, J.F.; Ward, D.S.; Mahowald, N.M.; Evan, A.T. Global and regional importance of the direct dust-climate feedback. Nat. Commun. 2018, 9. [Google Scholar] [CrossRef] [PubMed]
- Kaufman, Y.J.; Tanré, D.; Dubovik, O.; Karnieli, A.; Remer, L.A. Absorption of sunlight by dust as inferred from satellite and ground-based remote sensing. Geophys. Res. Lett. 2001, 28, 1479–1482. [Google Scholar] [CrossRef]
- Granados-Muñoz, M.J.; Sicard, M.; Román, R.; Antonio Benavent-Oltra, J.; Barragán, R.; Brogniez, G.; Denjean, C.; Mallet, M.; Formenti, P.; Torres, B.; et al. Impact of mineral dust on shortwave and longwave radiation: Evaluation of different vertically resolved parameterizations in 1-D radiative transfer computations. Atmos. Chem. Phys. 2019, 19, 523–542. [Google Scholar] [CrossRef]
- Kishcha, P.; Alpert, P.; Barkan, J.; Kirschner, I.; Machenhauer, B. Atmospheric response to Saharan dust deduced from ECMWF reanalysis (ERA) temperature increments. Tellus B Chem. Phys. Meteorol. 2011, 55, 901–913. [Google Scholar] [CrossRef]
- Michaelides, S. Atmospheric energetics components over the Mediterranean, Middle East and North Africa for the period 1979–2017. In Proceedings of the 14th International Conference on Meteorology, Climatology and Atmospheric Physics (COMECAP 2018), Alexandroupoli, Greece, 15–17 October 2018; Kourtidis, K., Nastos, P., Moustris, K., Founda, D., Paschalidou, A., Eds.; Hellenic Meteorological Society: Athens, Greece, 2018; pp. 300–305, ISBN 978-960-98220-4-6. [Google Scholar]
- Margules, M. Über die Energie der Stürme (On the energy of storms-originally published by the Imperial Central Institute for Meteorology, Vienna, Austria, 1903; pp. 1–26). In The Mechanics of the Earth’s Atmosphere-A collection of Translations; Abbe, C., Ed.; English translation by Smithsonian Institution: Washington, WA, USA, 1904; Volume 51, pp. 533–595. [Google Scholar]
- Lorenz, E.N. Available Potential Energy and the Maintenance of the General Circulation. Tellus 1955, 7, 157–167. [Google Scholar] [CrossRef]
- Lorenz, E.N. The Nature and Theory of the General Circulation of the Atmosphere; World Meteorological Organization: Geneva, Switzerland, 1967. [Google Scholar]
- Lorenz, E.N. Energetics of atmospheric circulation. Int. Dict. Geophys. 1965, 66, 1–9. [Google Scholar]
- White, R.M.; Saltzman, B. On conversions between potential and kinetic energy in the atmosphere. Tellus 1956, 8, 357–363. [Google Scholar] [CrossRef]
- Mashat, A.W.S.; Awad, A.M.; Assiri, M.E.; Labban, A.H. Dynamic and synoptic study of spring dust storms over northern Saudi Arabia. Theor. Appl. Climatol. 2020, 140, 619–634. [Google Scholar] [CrossRef]
- Trenberth, K.E. Climate diagnostics from global analyses: Climate diagnostics from global analyses: Conservation of mass in ECMWF analyses. J. Clim. 1991, 4, 707–722. [Google Scholar] [CrossRef]
- Trenberth, K.E. Using atmospheric budgets as a constraint on surface fluxes. J. Clim. 1997, 10, 2796–2809. [Google Scholar] [CrossRef]
- Trenberth, K.E.; Fasullo, J.T. Applications of an updated atmospheric energetics formulation. J. Clim. 1991, 31, 6263–6279. [Google Scholar] [CrossRef]
- Trenberth, K.E.; Stepaniak, D.P.; Caron, J.M. Accuracy of atmospheric energy budgets from analyses. J. Clim. 2002, 15, 3343–3360. [Google Scholar] [CrossRef]
© 2020 by the author. Licensee MDPI, Basel, Switzerland. This article is an open access article distributed under the terms and conditions of the Creative Commons Attribution (CC BY) license (http://creativecommons.org/licenses/by/4.0/).