1. Introduction
The 2019 World Athletics Championships, held on 27 September at Khalifa International Stadium, Doha, drew people’s attention in discussing whether it was appropriate to hold a marathon event in the difficult conditions of air temperature up to 32 °C and humidity reaching over 70%. As a result, the International Olympic Committee made the decision to move the 2020 Olympic marathon and walking events from the capital to the northern Japanese city of Sapporo due to concerns over the predicted heat conditions within the Tokyo urban area. As mentioned above, outdoor activities and better ways to adapting to thermal conditions have no doubt been issues of international attention for years.
Taiwan is located in the subtropical zone, with both high temperatures and humidity, and it is difficult to maintain thermal comfort most of the time. Especially in southern Taiwan, the outdoor conditions can be more difficult than in the other parts in Taiwan. According to the Race Events in Taiwan Organization [
1], there have been over 4000 running events held in Taiwan since 2010, which shows that running has become a very popular outdoor activity for people in Taiwan. This leads to the study purpose of assessing the thermal performance among those running events held in southern Taiwan. Since people in Taiwan have become fond of running events in recent years, and given that there have not been many research studies done regarding the outdoor thermal risks for running participants in Taiwan, this study focuses on the thermal and health impacts on runners, fans, event staffs, and the residents of the neighborhood.
PM
2.5 penetrates the respiratory tract more deeply at a higher rate, and by depositing in the respiratory bronchioles and alveoli, which then eventually causes other disorders [
2]. PM
2.5 has been proven to be harmful to public health, increasing the incidence of respiratory symptoms, reducing lung function, and aggravating respiratory and cardiovascular diseases [
3]. Moreover, PM
2.5 can also act as a carrier of other harmful constituents, which shows that PM
2.5 can significantly increase the risk of respiratory tract diseases [
4].
It has been shown that weather parameters and air pollutants are related. Furthermore, there have been studies investigating the synergistic effects of air pollution and individual meteorological parameters on health [
5,
6,
7,
8]. Increases in temperature mat also lead to increases in ozone and SO
2 concentrations [
9,
10]. Since there are many factors related to air quality beside temperature, such as precipitation, wind direction, cross-boundary transportation, and pollutant emissions, comprehensive environmental data is required for analyzing the interaction between thermal environment and air pollutants. In this study, we took PM
2.5 concentration to define air quality level during the events, and to investigate thermal environment and air quality. Additionally, the positive correlation between shading and outdoor pedestrian distance in a hot–humid climate was addressed [
11]. Furthermore, the results of the higher Sky View Factor (SVF), in reference to more solar radiation exposure, which causes discomfort in summer, was also scientifically recognized. Lin’s research in 2010 [
12] found that SVF, representing the shading levels from buildings/trees, could change 93% of Taiwan people’s behavior in moving to shaded areas while visiting a public square in summer. Therefore, the interaction between thermal indices and SVF/solar radiation levels were discussed in this study in order to better understand the relationship between shading and thermal comfort for different running events held in different seasons. The definition and the related information of the thermal indices are found in the Methods section in this article.
The aims of this study are to apply real time monitoring data with the SVF captured at different locations and to initiate a different method of assessing the thermal environment. This is preliminary research for simulating the thermal performance before scheduled events or activities in the future.
2. Methods
2.1. Study Area and Settings
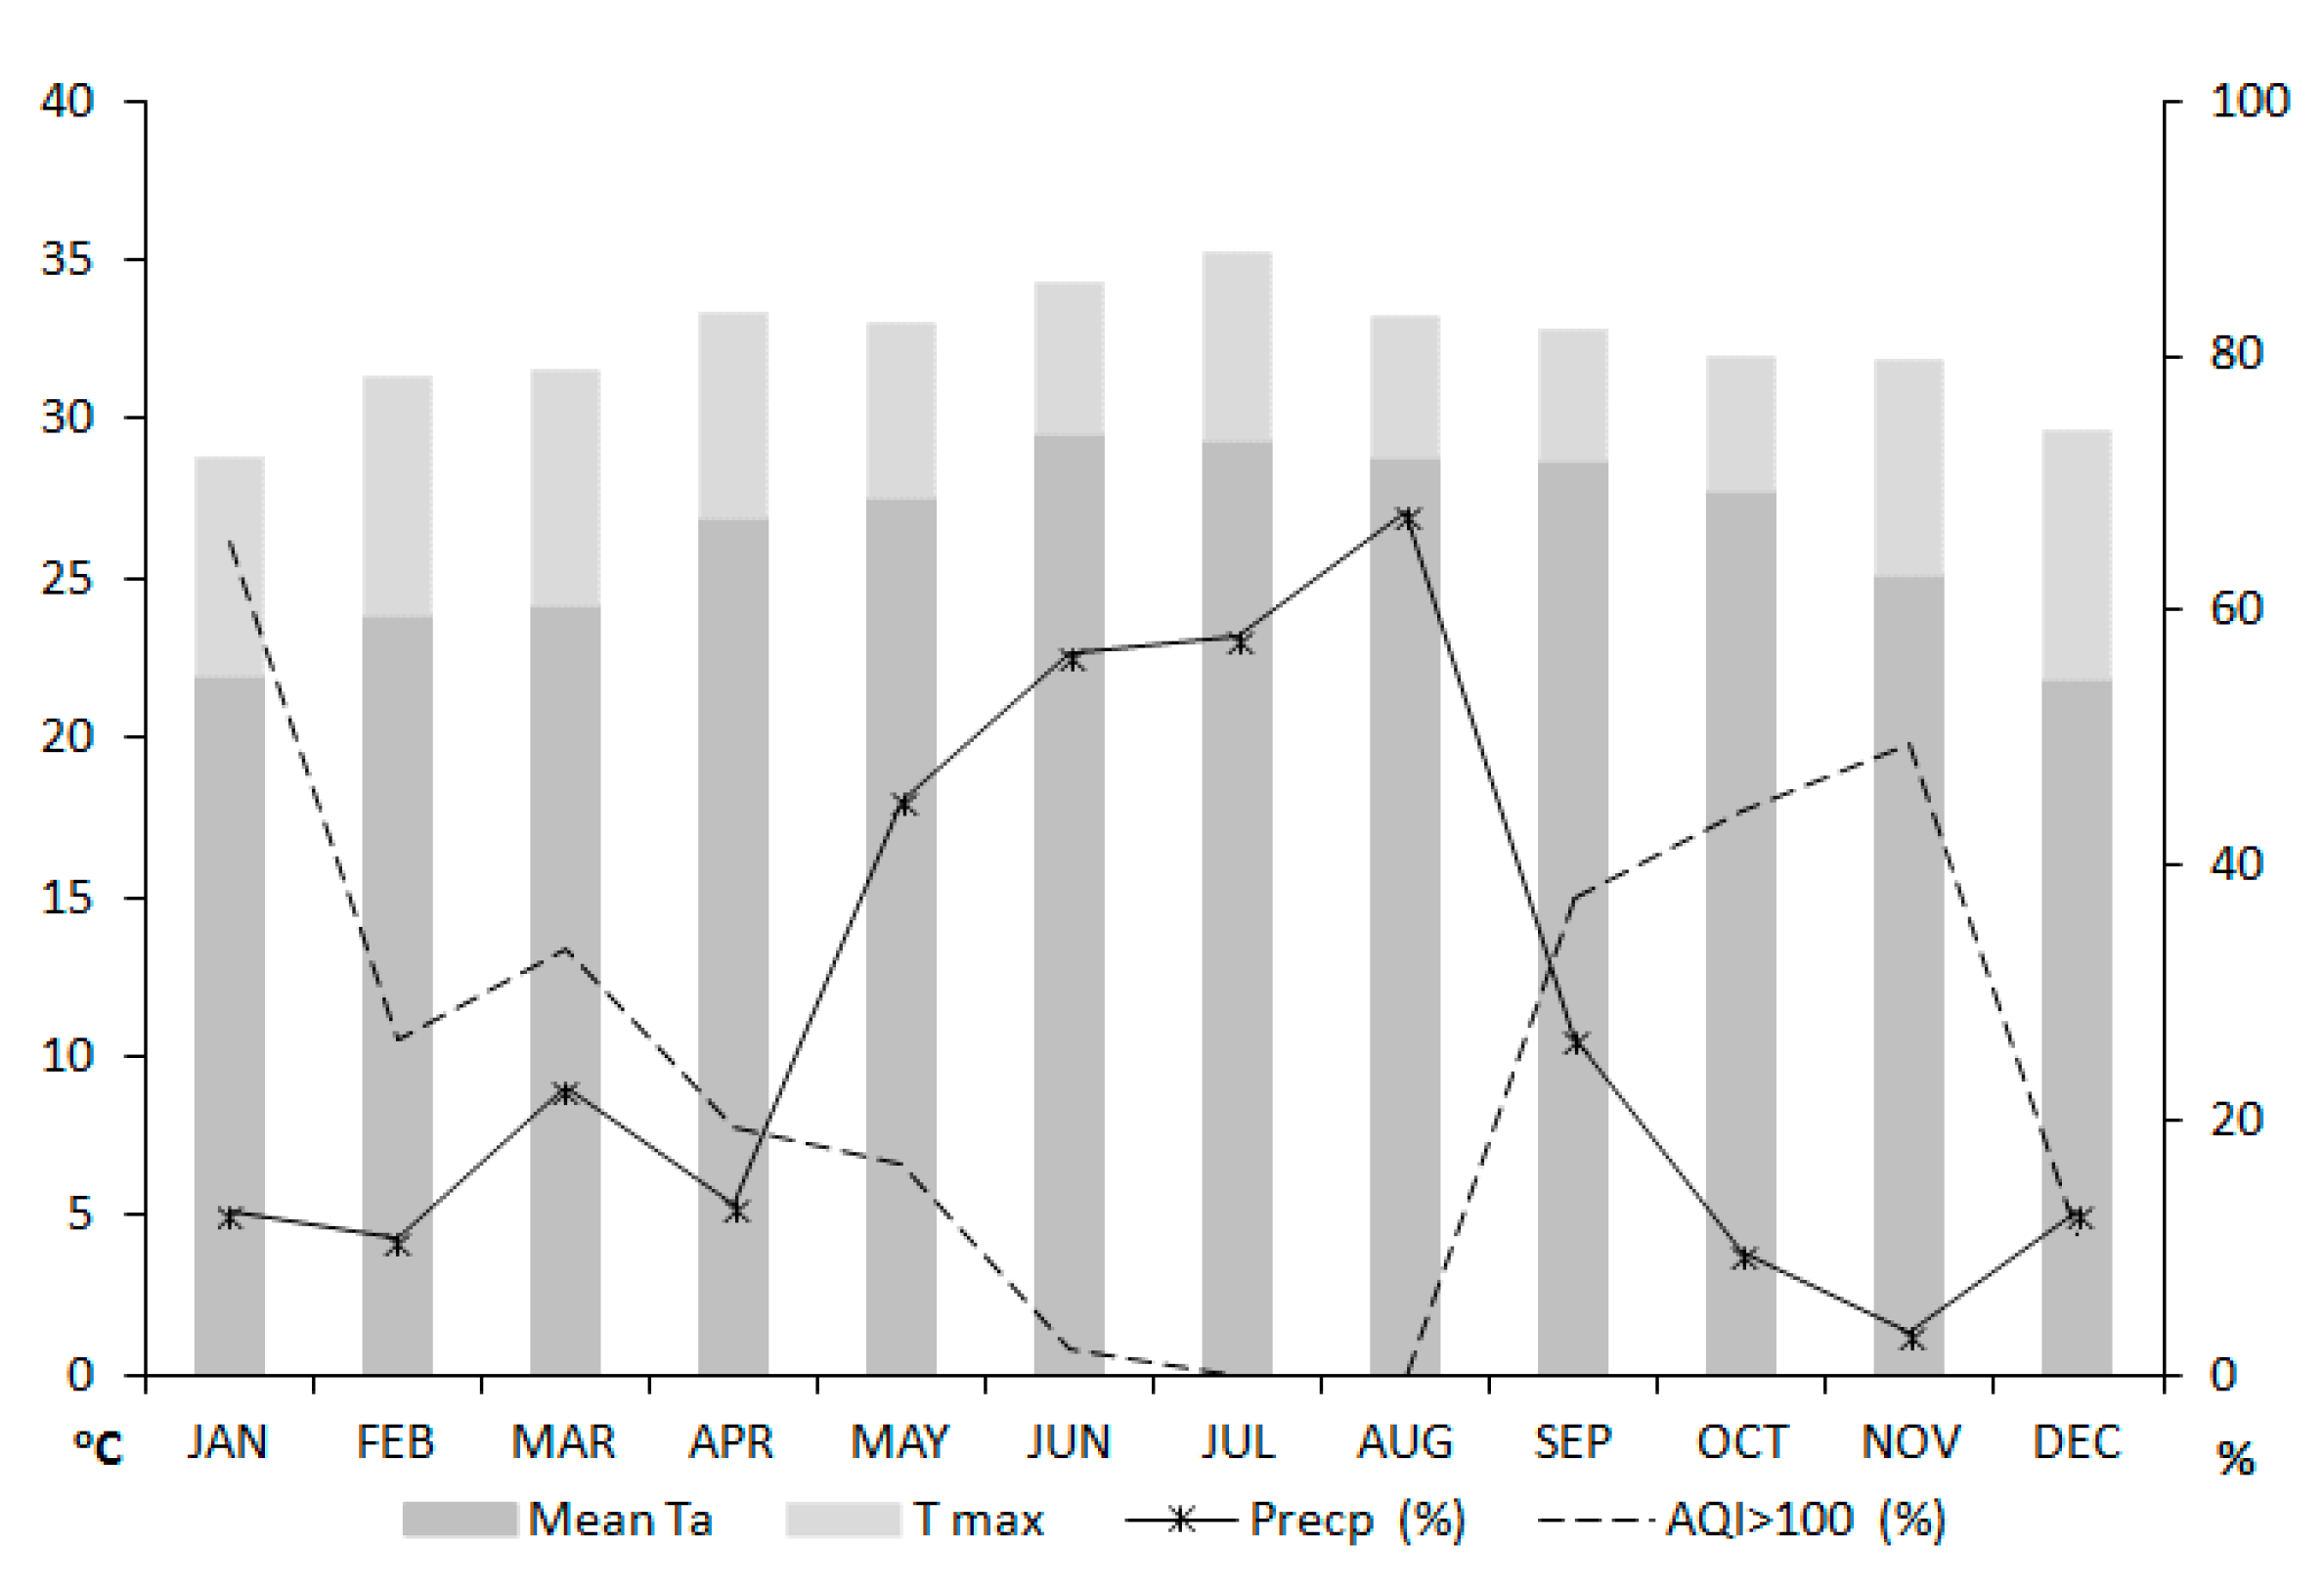
Kaohsiung is not only the largest city with the highest population in southern Taiwan, but it is also a sunny city with over 2400 sunshine hours annually. The 2019 monthly mean air temperature (Ta), highest temperature (T max), the percentage of precipitation (Precp), and the percentage of having an Air Quality Index (AQI) >100 of Kaohsiung City are shown in
Figure 1.
The mean Ta is always higher than 20 °C, and T max can reach 30 °C or even higher from February to November, which indicates the thermal condition is basically “warm–hot” all the time. Based on the distribution of Precp, summer is the main rainy season with over 50% precipitation that might effectively reduce the heat impact in summer from time to time. Precipitation can be viewed as one of the most efficient ways to clearing the air via washing down the pollutants/particles, and the good correlation between Precp and AQI >100 can be found from May to December. Through general background analysis, the thermal condition remained mostly “warm-hot” in Kaohsiung; summer is the best season for having outdoor activities, while winter is the least preferred season regarding air quality. Since thermal factors can be affected by other environmental/biological factors besides temperature and humidity, more detailed factors and relationships of interaction must be required for further study.
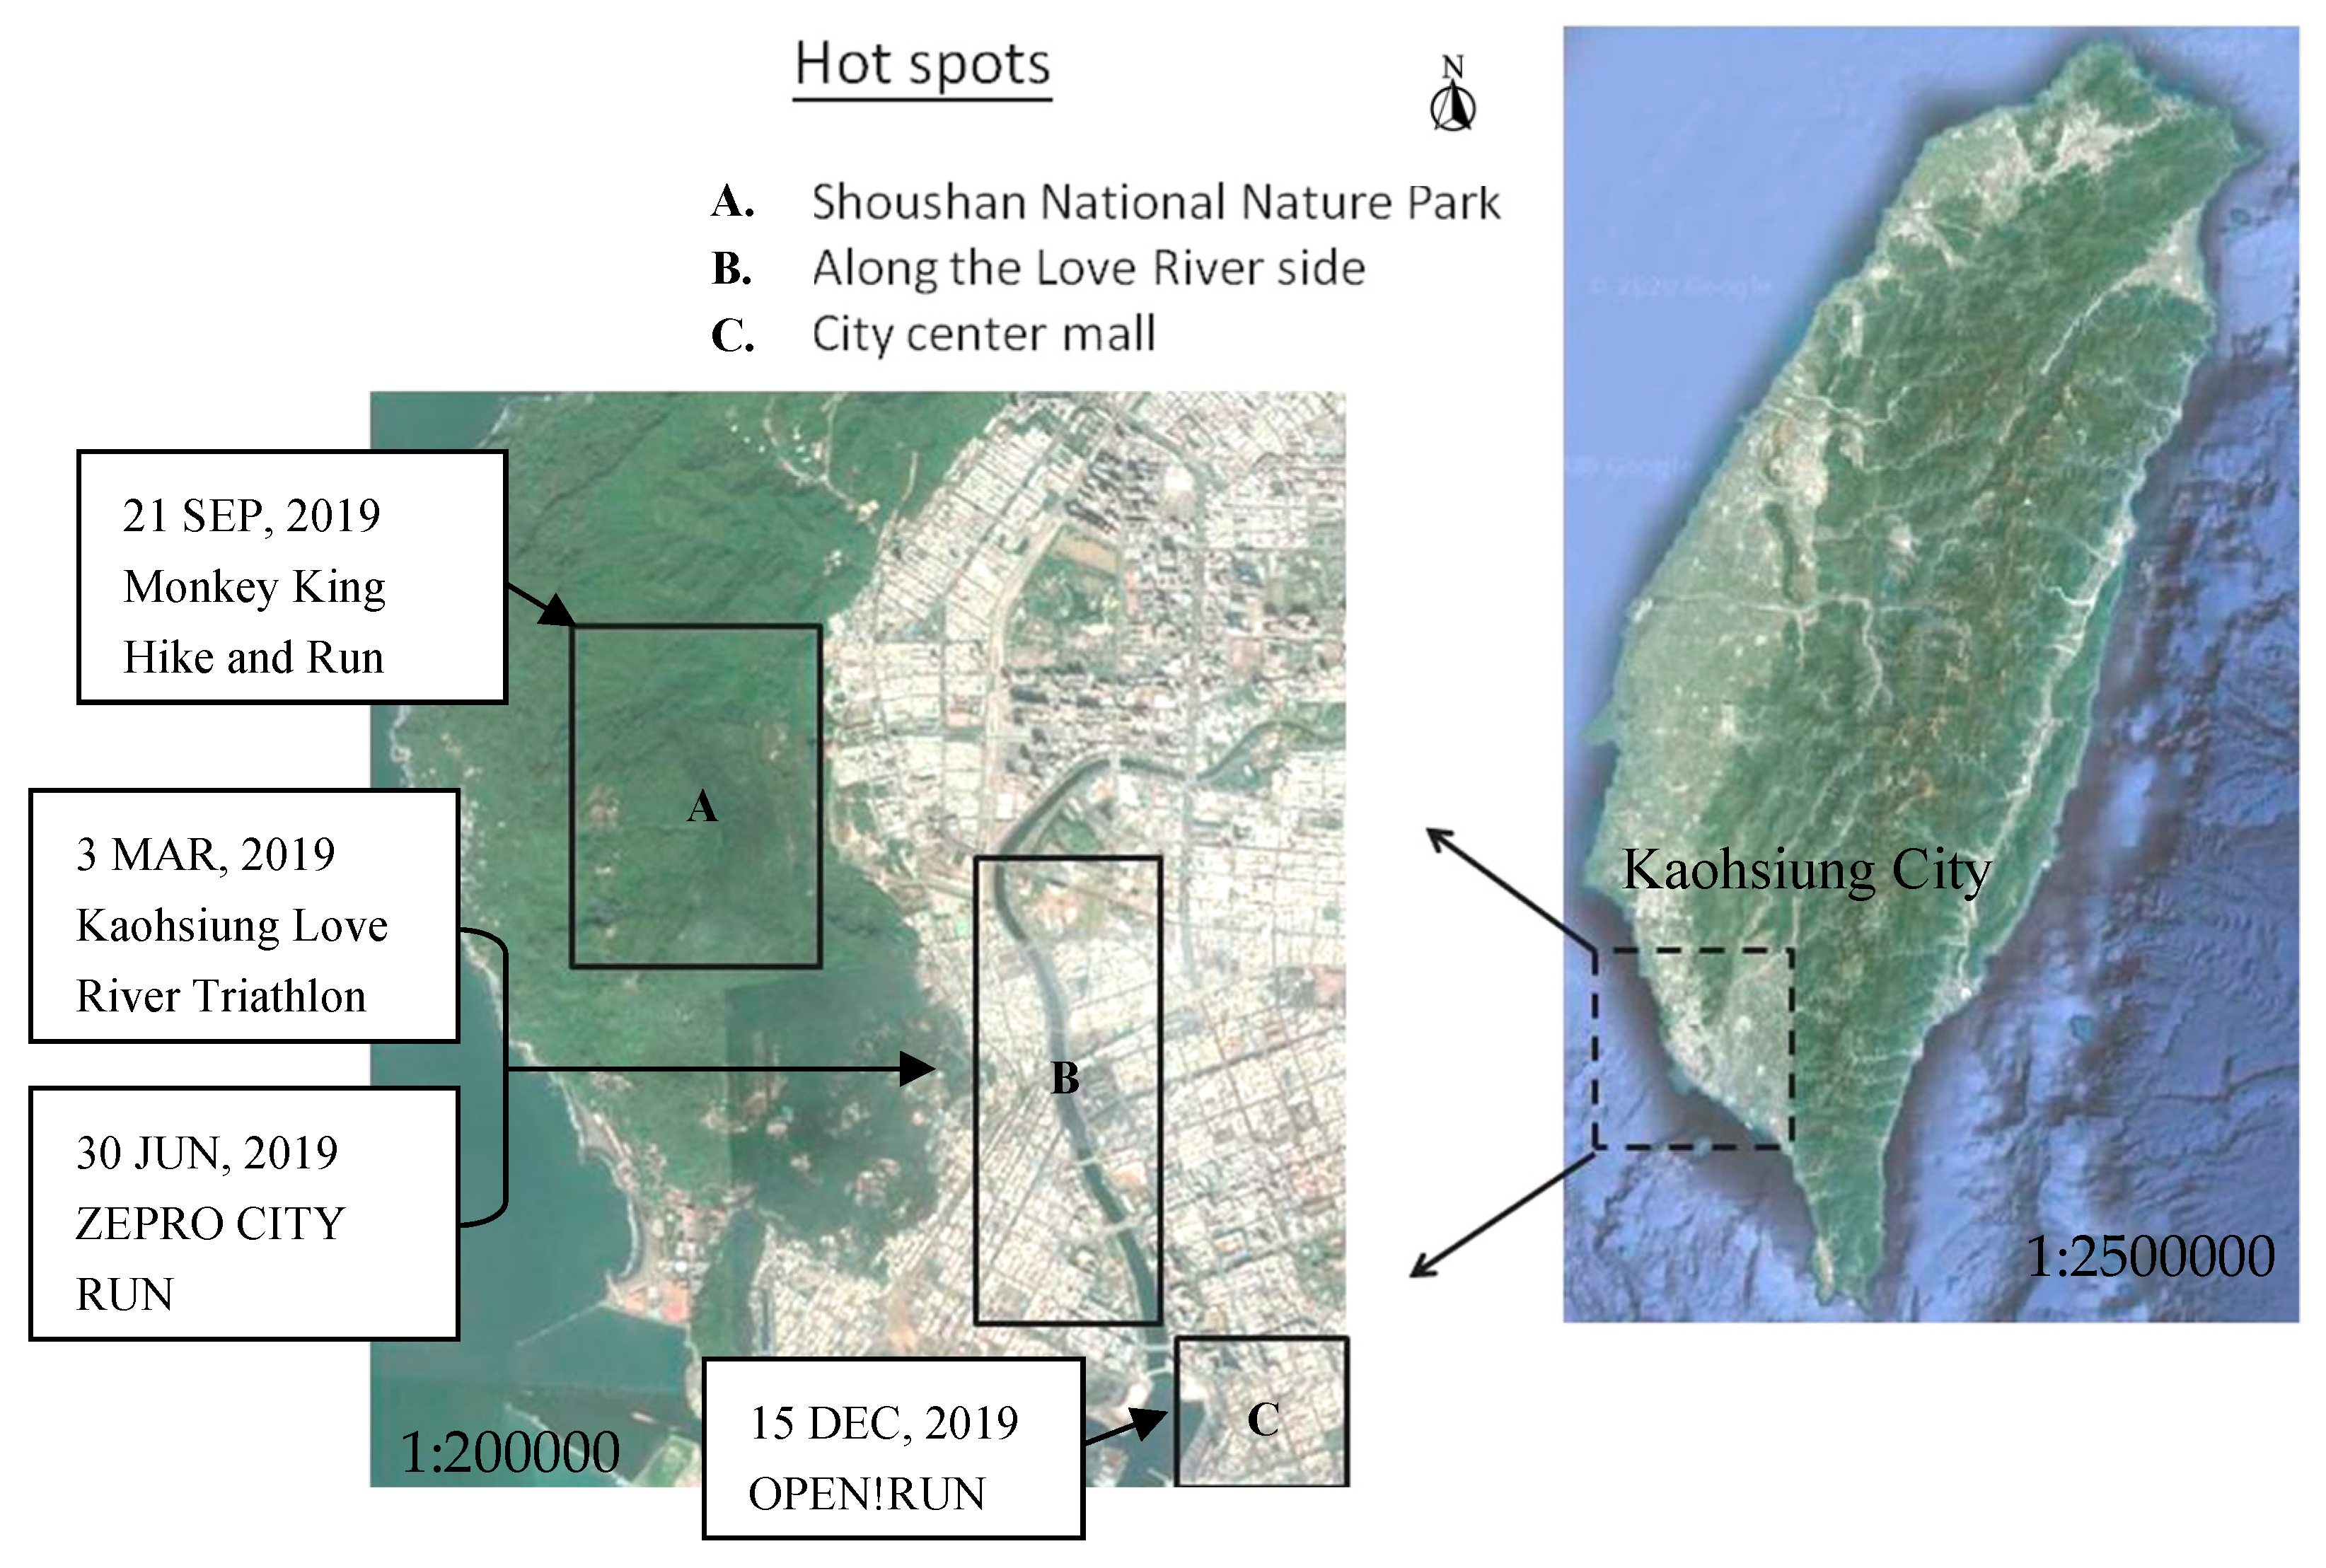
In this study, we chose travel hot spots where thousands of visitors gather on weekends or holidays in Kaohsiung. Shoushan National Nature Park, Love River, and the city center mall were selected as the focus areas, as shown in
Figure 2. To better understand the assessment of the thermal environment and air quality in hot-humid regions, there were four running events held at those hot spots in March, June, September, and December, 2019, respectively, which were selected as cases for analyzing the seasonal thermal and air condition in Kaohsiung. These four running events are described in detail in
Section 3.
In this study, the modified physiologically equivalent temperature (mPET) was viewed as the main thermal indicator applied to define whether the thermal discomfort condition was reached, since it was developed for general application in different climate zones and with scientific evidence that it could (1) provide a more realistic core temperature and mean skin temperature than the PET model, (2) obtain a more realistic estimation of human thermal sensation than PET and the universal thermal climate index (UTCI; the reference air temperature to a condition causing the same model response as actual conditions), and (3) show a good correlation between human biometeorological factors and thermal environments [
14]. Nevertheless, the wet bulb globe temperature (WBGT; a parameter to evaluate the environment thermal load of human body), mean radiant temperature (Tmrt; the mean temperature of the surrounding surface from the environmental radiation to the human body), and UTCI were also applied here as thermal indicators to obtain a more comprehensive perspective.
People from different regions have different thermal sensations and tolerance; the neutral temperature range for people in Taiwan is “PET 26–30 °C”, while it is “PET 18–23 °C” for people from Western/Central Europe [
15]. An mPET ≥ 30 °C could be viewed as one of the thresholds leading to thermal discomfort for people in Taiwan.
The air temperature (Ta) in summer was assumed to be 30 °C under the sun, and Tmrt could rise up to 60 °C [
16], which indicated the thermal risk of overexposure under direct sunlight. Furthermore, it has been shown that heat stroke and confusion can occur once the body temperature is forced to increase to over 40 °C [
17]. In this study, Tmrt ≥ 40 °C was viewed as the thermal baseline of overheating the body to 40 °C via the heat exchange process.
Since the heat stress standard or warning levels for the general public have not yet been officially announced in Taiwan, the guideline of the WBGT standard for the prevention of heat disorder approved by the Japan Ministry of the Environment and the Japan Sports Association [
18,
19] was used, which states that when WBGT ≥ 25 °C, the heat stress risk increases and should be viewed as reaching a “warning” level. Therefore, WBGT ≥ 25 °C was cited as one of the thermal indicator thresholds for causing thermal discomfort in this study.
The air quality index (AQI) standards for Taiwan, which are categorized into six levels, namely “Good (0 ≤ AQI ≤ 50)”, “Moderate (50 ≤ AQI ≤ 100)”, “Unhealthy for Sensitive Groups (101 ≤ AQI ≤ 150)”, “Unhealthy (151 ≤ AQI ≤ 200)”, “Very unhealthy (201 ≤ AQI ≤ 300)”, and “Hazardous (AQI ≥ 301)”, and PM2.5 ≥ 35μg/m3 (referring to AQI > 100) were applied here to define the air quality to be poor–unhealthy and with risks of causing discomfort for outdoor activities.
2.2. Environmental Data Applied
The data applied and the process phases are summarized in
Scheme 1, and more details regarding the real time monitoring data, Sky View Factor, and the definition of thermal indices are described as follows.
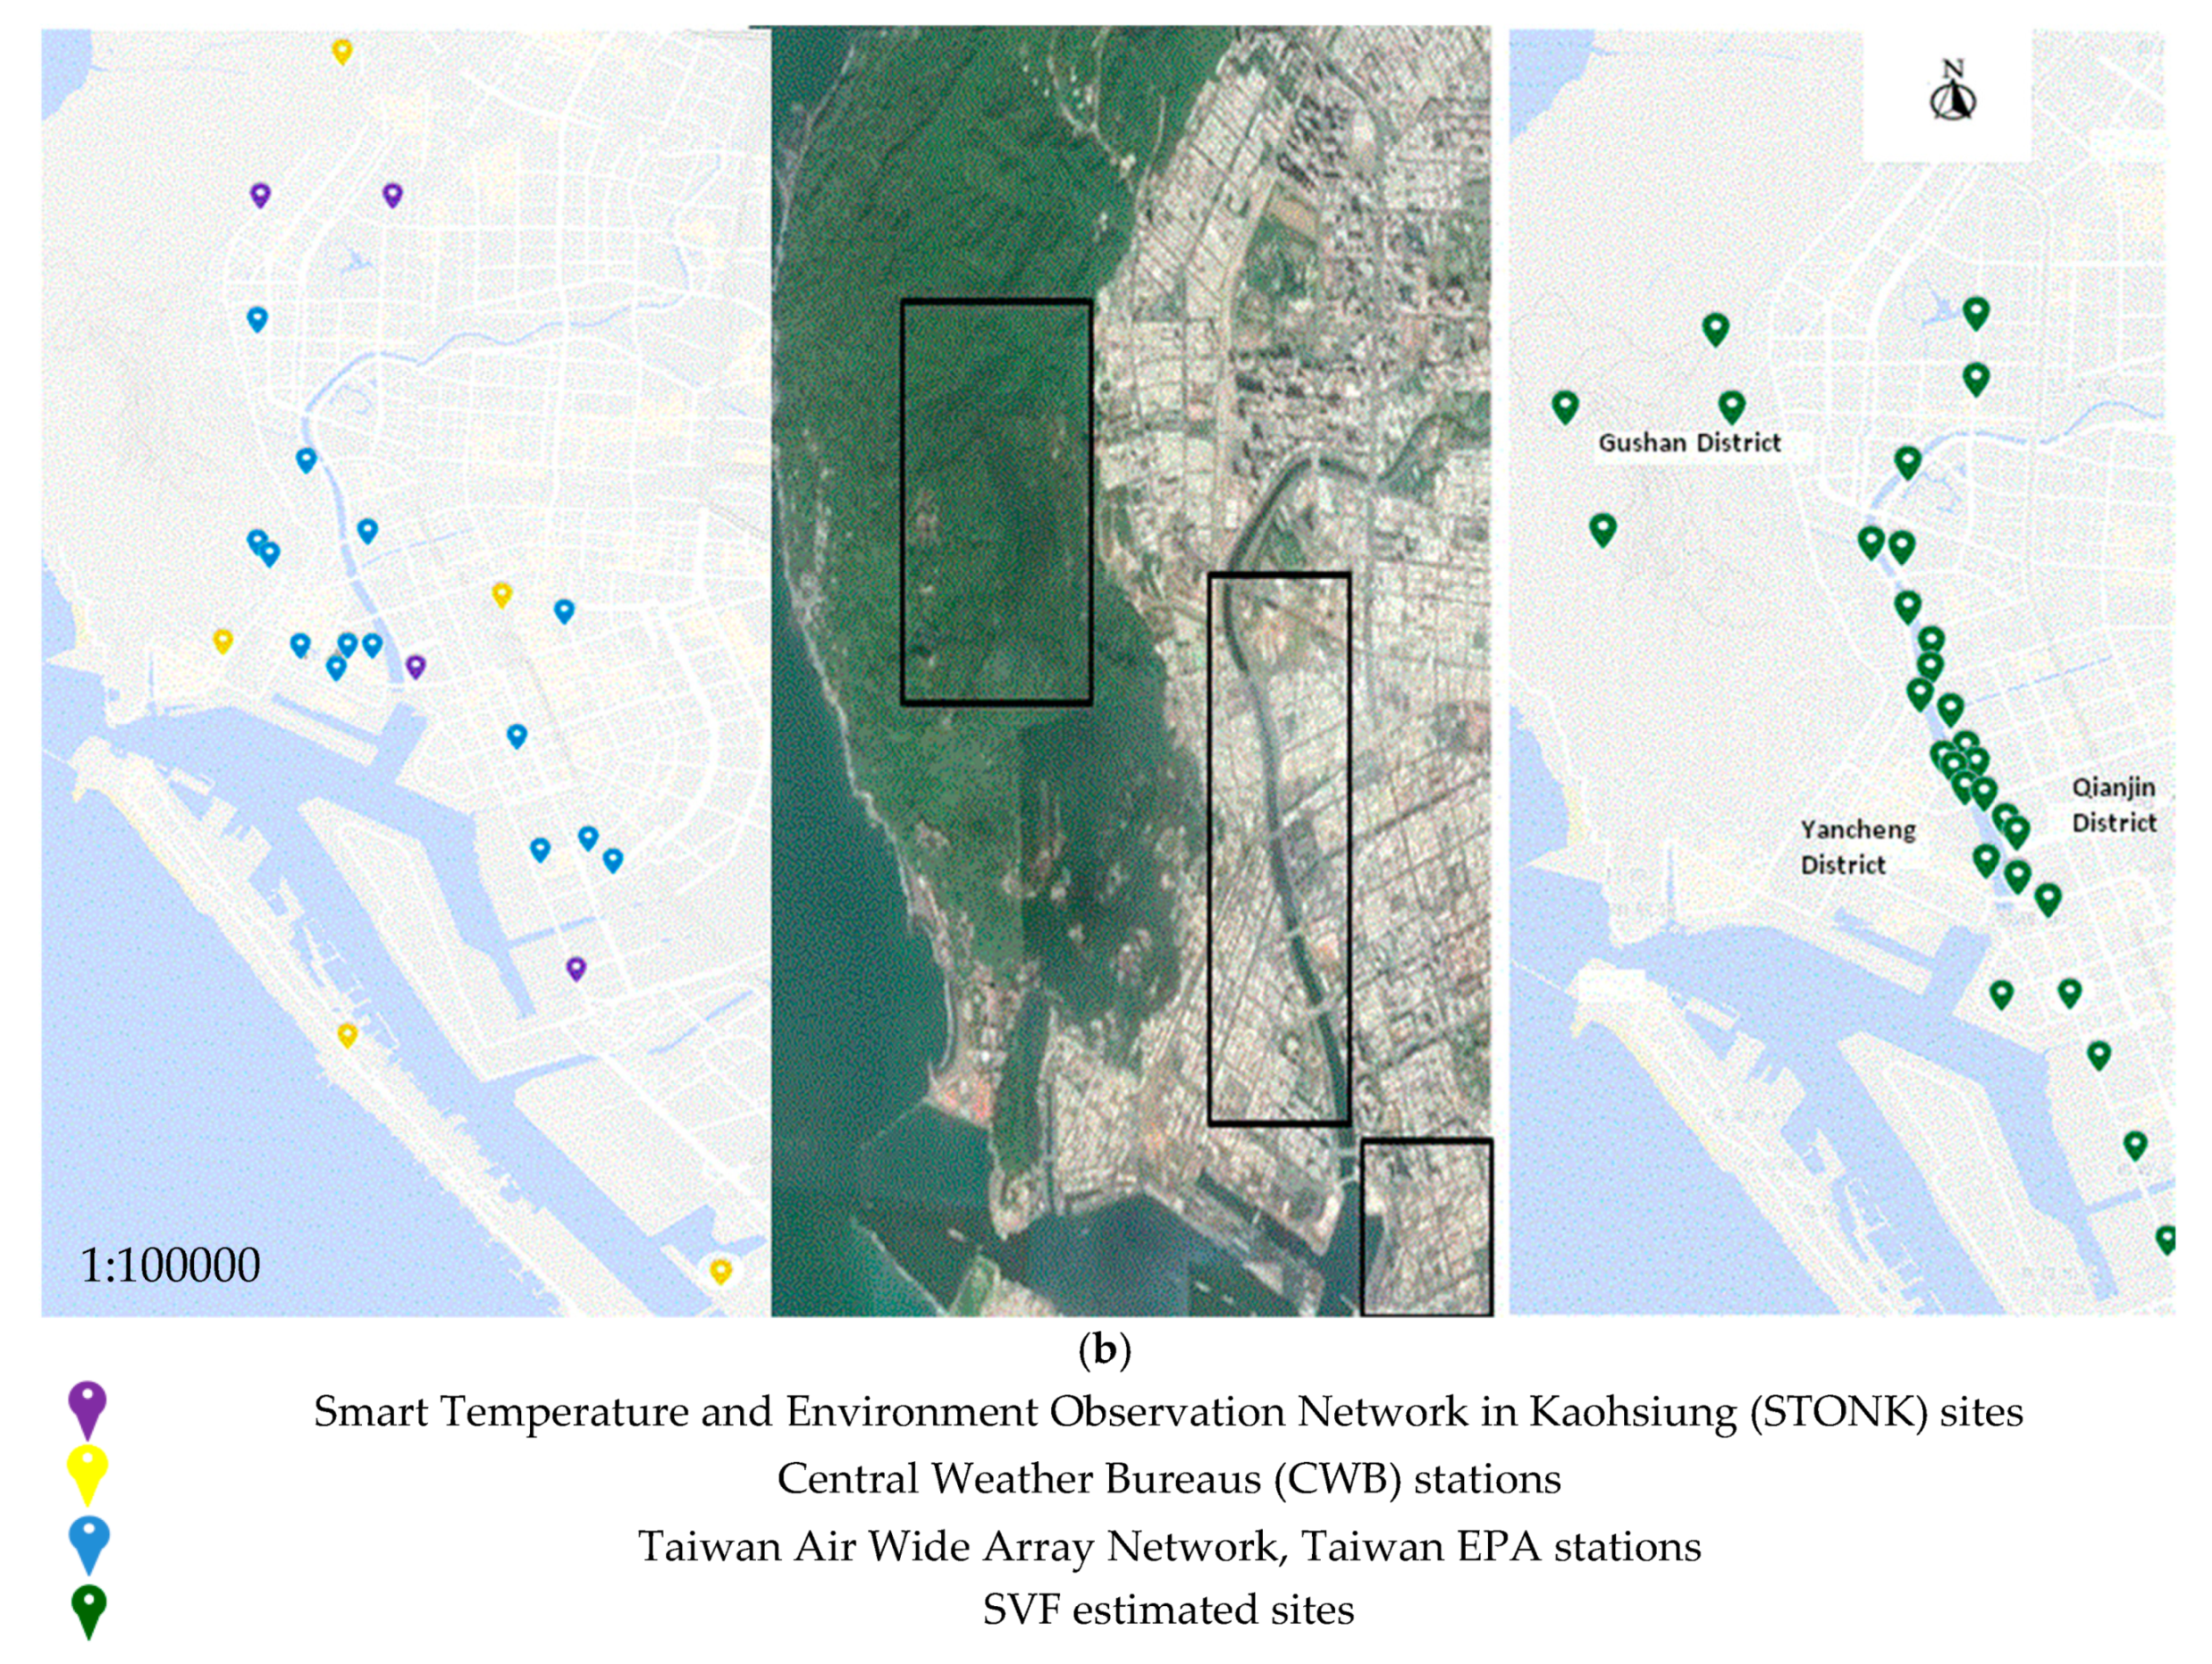
The Building and Climate Lab (BCLab) at the National Cheng Kung University (NCKU) has established the Smart Temperature and Environment Observation Network in Kaohsiung (STONK), as shown in
Figure 3a. Since 2018, there have been 34 monitoring sites among travel spots, busy streets, and parks in the Kaohsiung urban area. We used UnaSense sensors from UnaBiz SigFox to monitor the air temperature (detection range −20~70 °C, with ±1 °C accuracy) and relative humidity (detection range 0~100%, with ±2% RH accuracy) among all 34 sites. Sensors for the IoT (Internet of Things) were applied and installed 2~2.5 m above the ground at each site for better sensing of the environmental conditions at the pedestrian scale.
As seen in
Figure 3b, in this study, the data we applied included real time air temperature and relative humidity data from four STONK stations; real time wind speed and solar radiation data from five Central Weather Bureaus (CWB) stations; real time PM
2.5 concentration data from 14 stations of the Taiwan Air Wide Array Network, Taiwan EPA; and SVF estimated at 31 sites via GSV2SVF—an interactive GIS tool [
20]. GSV2SVF transformed Google Street View (GSV) images into fisheye images. With fisheye images, we could estimate sky/tree/building view factors and then calculate the SVF.
2.3. Wet Bulb Globe Temp (WBGT) Estimation
WBGT is an estimation method by ISO 7243 used to quantify the heat stress under a constant direct sunlight environment [
21] in the outdoors with solar exposure conditions.
where Tw is wet bulb temperature and Tg is globe temperature, and Td is dry bulb temperature, shown here as air temperature (Ta).
With more than 10 years of environmental monitoring data at the station operated by BCLab NCKU, Ta, RH, and Tg data were defined to be under quality control and reliable. The monitored Ta and RH data were applied to a psychrometric chart, and then Tw was derived from the formulas. By analyzing the co-relationship among the Ta (°C), solar radiation (W/m
2), and wind velocity (m/s) monitoring data obtained every 5 min for entire 2018, the method and function in estimating Tg (°C) for southern Taiwan was developed according to the method in previous study [
22]. This was applied for WBGT estimation in this study.
where Tg is globe temperature, Ta is air temperature, sol is solar radiation, and wind is wind velocity.
2.4. mPET/Tmrt/UTCI Estimation
By providing the real time air temperature, relative humidity, wind speed, global radiation, and the SVF taken at sites among the four running routes by time, a RayMan Pro model was used in this study for estimating PET, mPET, Tmrt, and UTCI [
23,
24].
According to the Annex B—Metabolic rates of different activities in ISO 7730 [
25], the initial condition settings for running event participants are as follows: (1) “Runners” are defined as the slow runners who complete a 10 km route within 2 h at a rate of 5 km/h and a metabolic rate of 200 W/m
2, and (2) “walkers” are defined as those who stay longer at the event area with relatively slower pedestrian movements, which could be associated with the possible moving patterns of the neighborhood residents, fans, and the staff of the running events. Walkers were assumed to complete the 10 km route in more than 4 h at a rate of 2~2.5 km/h and a metabolic rate of 110 W/m
2.
As for clothing, in order to focus primarily on the thermal environment in this study, a daily clothes wearing option of underwear, shirt, trousers, socks, and shoes with a clothing insulation (Icl) of 0.7 was generally applied in this study for all participants in the four running events [
26,
27]
Physiologically equivalent temperature (PET) can be viewed as one thermal indicator that is accepted worldwide, and modified physiologically equivalent temperature (mPET), using the same classification with PET, can better simulate clothing variations among different thermal conditions. As a result, mPET can be more precise in estimating real situations of thermal comfort in different climate zones. Therefore, in this study, mPET was chosen to represent the performance as the primary thermal comfort indicator for running events [
14,
28].
3. Results
Four seasonal events were selected, and the runners had to run 10 km within 2 h. The hypothesis applied here asserted that the walkers, which could include neighborhood residents, fans, and staff participating in the event, or any possible members, would stay at the same venue longer to completing the 10 km route within 4 h using relatively slower movements.
3.1. Analysis of the Spring Running Event
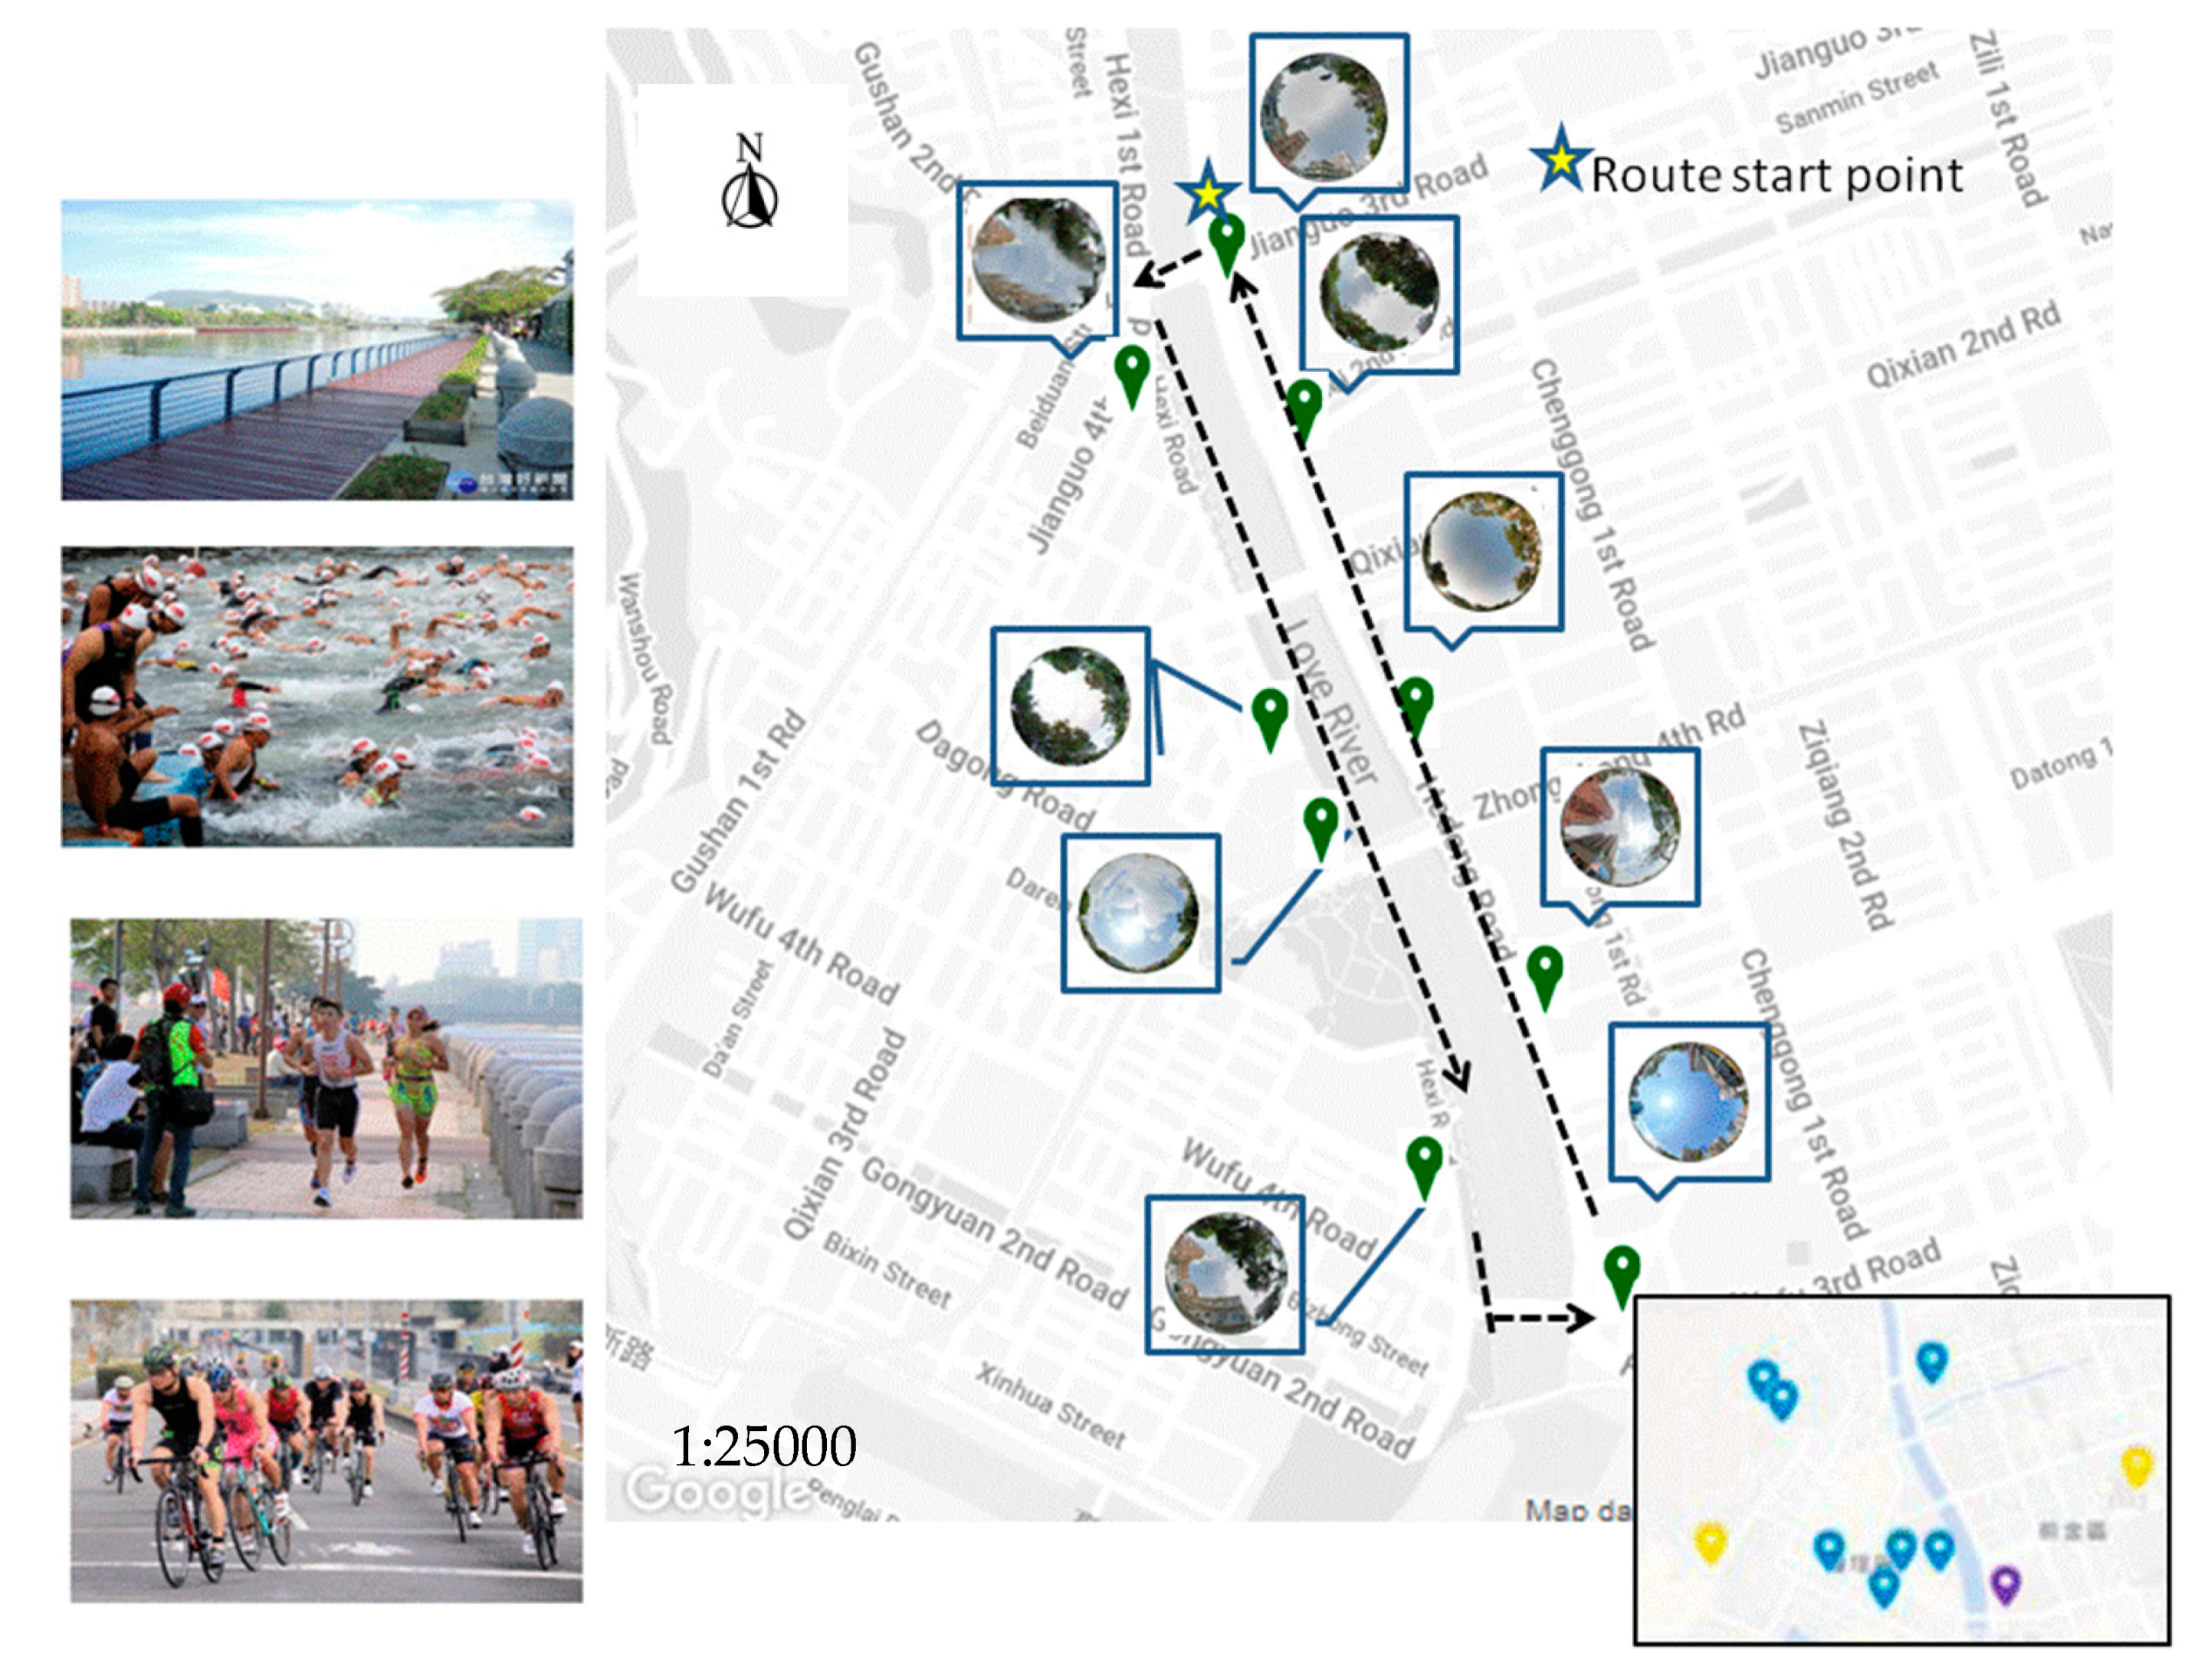
The Kaohsiung Love River Triathlon is an annual event with a longstanding reputation among sports enthusiasts; the previous one was held on 3 March 2019. With a large number of participants, this event was selected as the spring running event in this study. Three types of exercising modes, namely swimming, cycling, and running, were included in the triathlon, and here we only took the running schedule during 8:30 a.m.–10:30 a.m. into consideration in analyzing the thermal and air quality conditions for runners and walkers. We also analyzed the conditions from 6:30 a.m.–10:30 a.m. for walkers. The route, activity photos, and the fisheye photos obtained from nine sites are shown in
Figure 4.
As shown in
Figure 5a, the solar radiation increased to 160 W/m
2 at 8:50 a.m. and remained at that value until 10:00 a.m., after which it then declined to approximately 90 W/m
2. The SVF values among the nine sites were estimated to be between 0.31 and 0.82. The air temperature and WBGT were quite steady, with no significant variations caused by the influences of solar radiation or SVF, while Tmrt, mPET, and UTCI rose along with the solar radiation. An mPET over 30 °C was recorded since 9:00 a.m., which indicated the possibility of having thermal discomfort for the runners.
This event was initiated quite early in the morning at 6:30 a.m.; therefore; there was little solar radiation until 8:00 a.m. for walkers, as shown in
Figure 5b. The air temperature and WBGT were steady and of a slightly increasing tendency with time, while Tmrt, mPET, and UTCI increased rapidly at 9:00 a.m. Neither mPET over 30 °C nor Tmrt over 40 °C were found, nor was the PM
2.5 concentration monitored over 35 μg/m
3; the thermal and air condition for walkers could be viewed as low risk of having thermal discomfort.
3.2. Analysis of the Summer Running Event
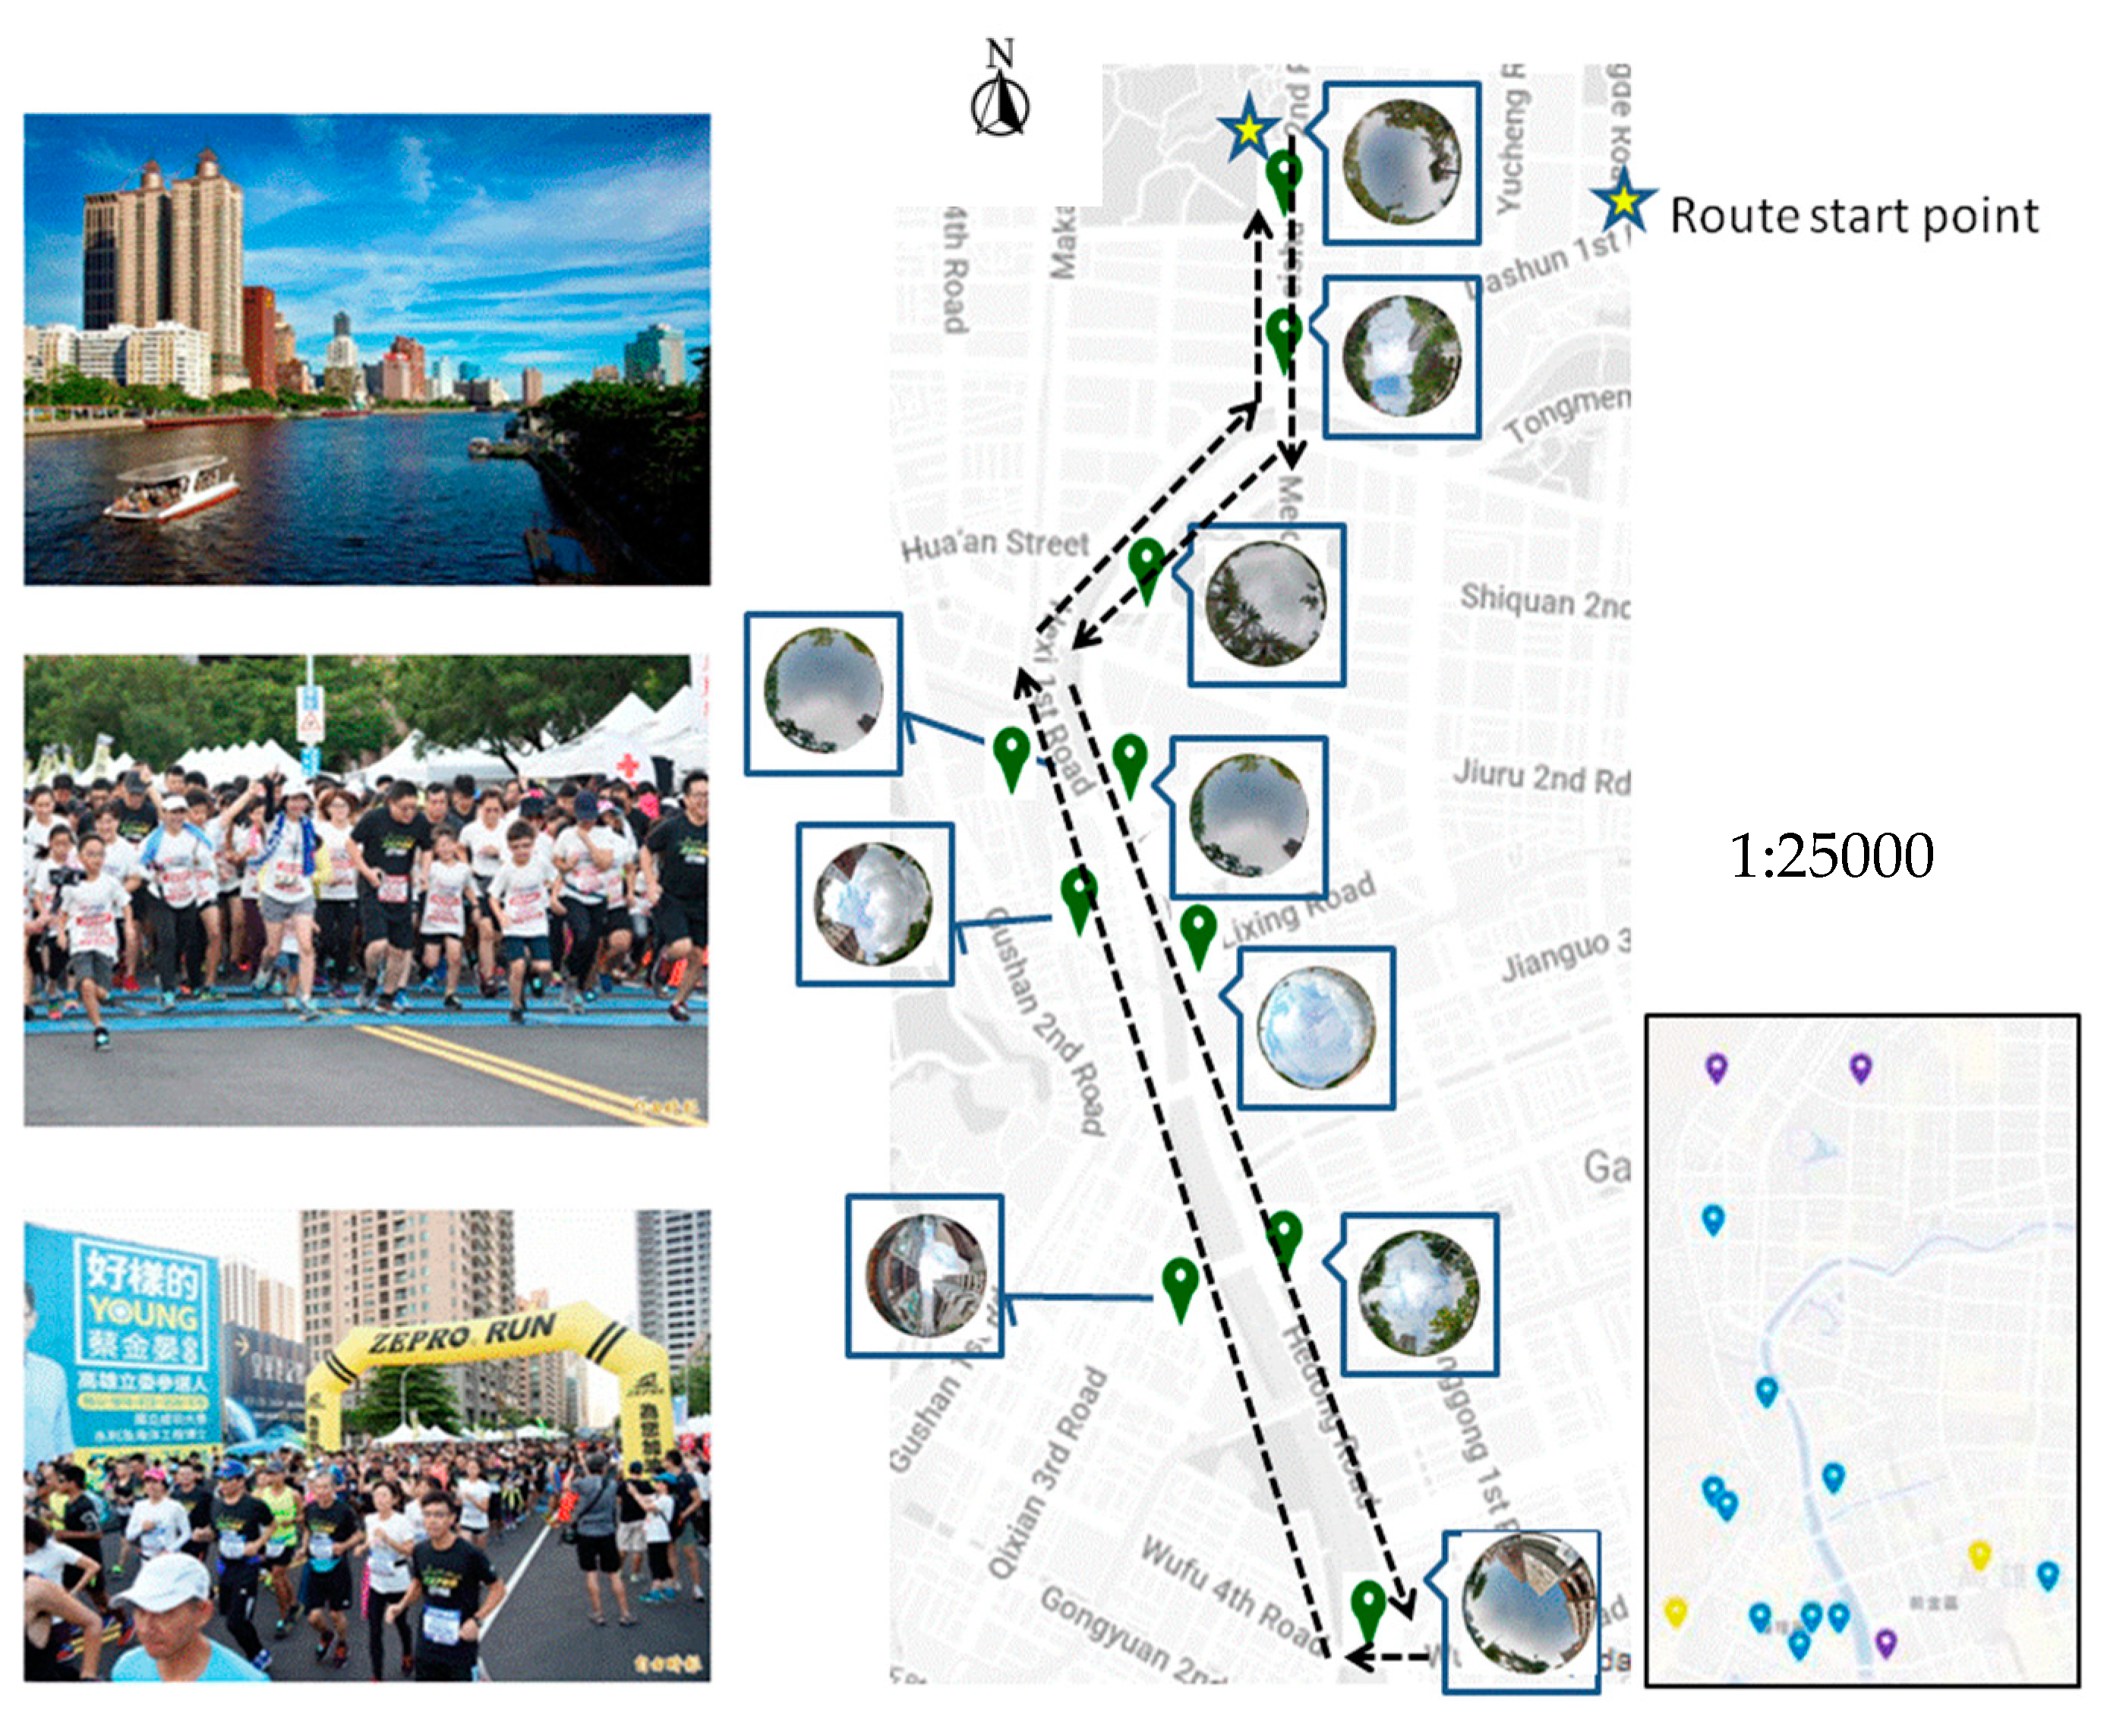
The ZEPRO City Run held on 30 June 2019 was a charity run event supported by a local company promoting the marathon, and which had been hosting annual running events among several cities since 2016. Up until 2020, there had been more than 200 thousand participants joining the events. This could be viewed as one of the most successful running events in popularizing both exercise and healthy life styles in Taiwan. Thus, it was selected as the summer running event in this study. Here, we took the running schedule from 6:00 a.m. to 8:00 a.m. into consideration for analyzing the thermal and air quality condition for runners. Moreover, we also analyzed the conditions from 6:00 a.m. to 10:00 a.m. for walkers. The route, activity photos, and the fisheye photos took from 10 sites are shown in
Figure 6.
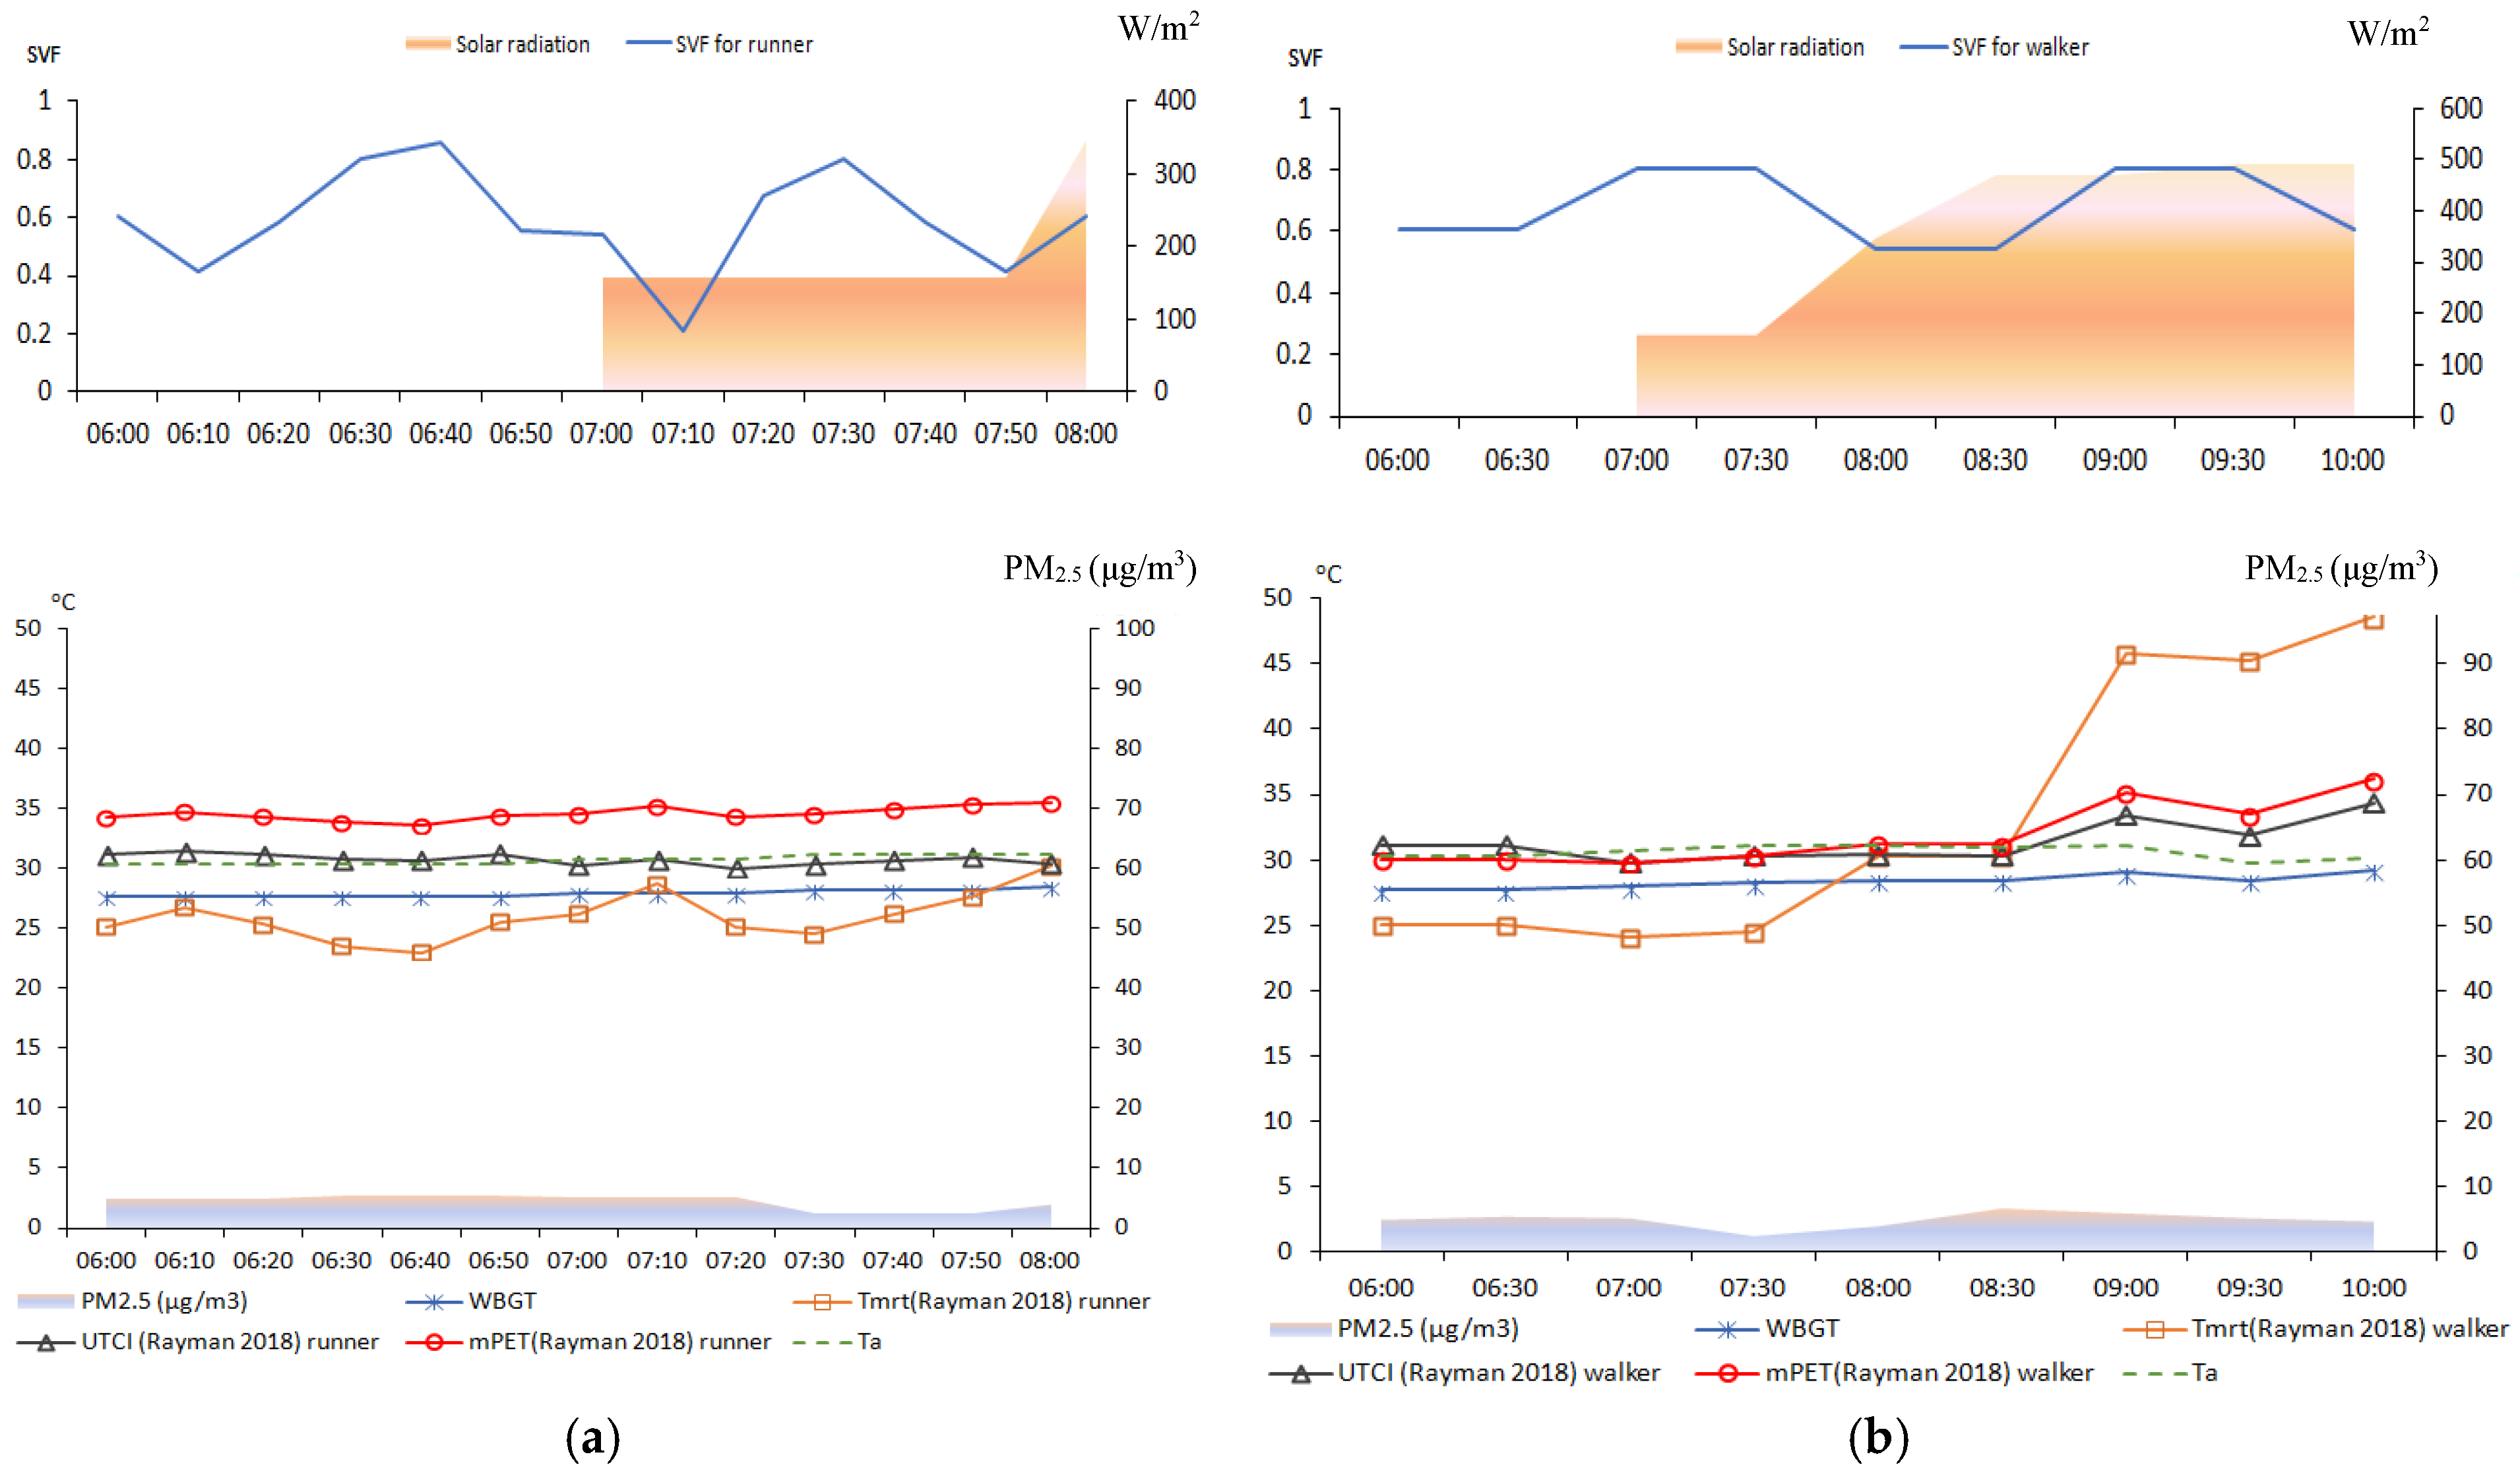
To avoid the predictable extremely hot condition in the summer daytime, this event was initiated even earlier in the morning, at 6:00 a.m.; therefore, there was little solar radiation until 7:00 a.m. As seen in
Figure 7a, the solar radiation increased to 158 W/m
2 at 7:00 a.m. and remained at that value until 8:00 a.m., then climbed up to approximately 347 W/m
2. The SVF values among the 10 sites were estimated between 0.20 and 0.86 with relatively rapid changes among sites. The distributions of real time air temperature and estimated WBGT/mPET/UTCI were relatively steady, with no variations specifically caused by the differences in solar radiation or SVF. Nevertheless, air temperature, mPET, and UTCI were all above 30 °C, while WBGTs were all above 25 °C during the entire running duration. The mPET even rose to over 35 °C after 7:00 a.m., which indicated with near certainty that runners were feeling discomfort; even with good air quality (PM
2.5 concentration around 5 μg/m
3, which is well below 35 μg/m
3), the situation would still have become more difficult over time.
As for walkers’ conditions, as shown in
Figure 7b, solar radiation increased from 158 W/m
2 to 491 W/m
2 during 7:30 a.m.–9:00 a.m., which led mPET, Tmrt, and UTCI to increase markedly. Due to the synergistic effect triggered by both higher solar radiation and SVF, Tmrt even jumped to over 45 °C after 9:00 a.m. Compared to the other thermal indicators’ rising tendencies, the air temperature and WBGT were steady and remained above 30 °C and 25 °C, respectively, for the entire time. With the thermal indicators rising above and breaking the thermal discomfort thresholds most of the time, it is clear that the walkers would have had strong feelings of discomfort, and the situation would have become worse with time.
3.3. Analysis of the Autumn Running Event
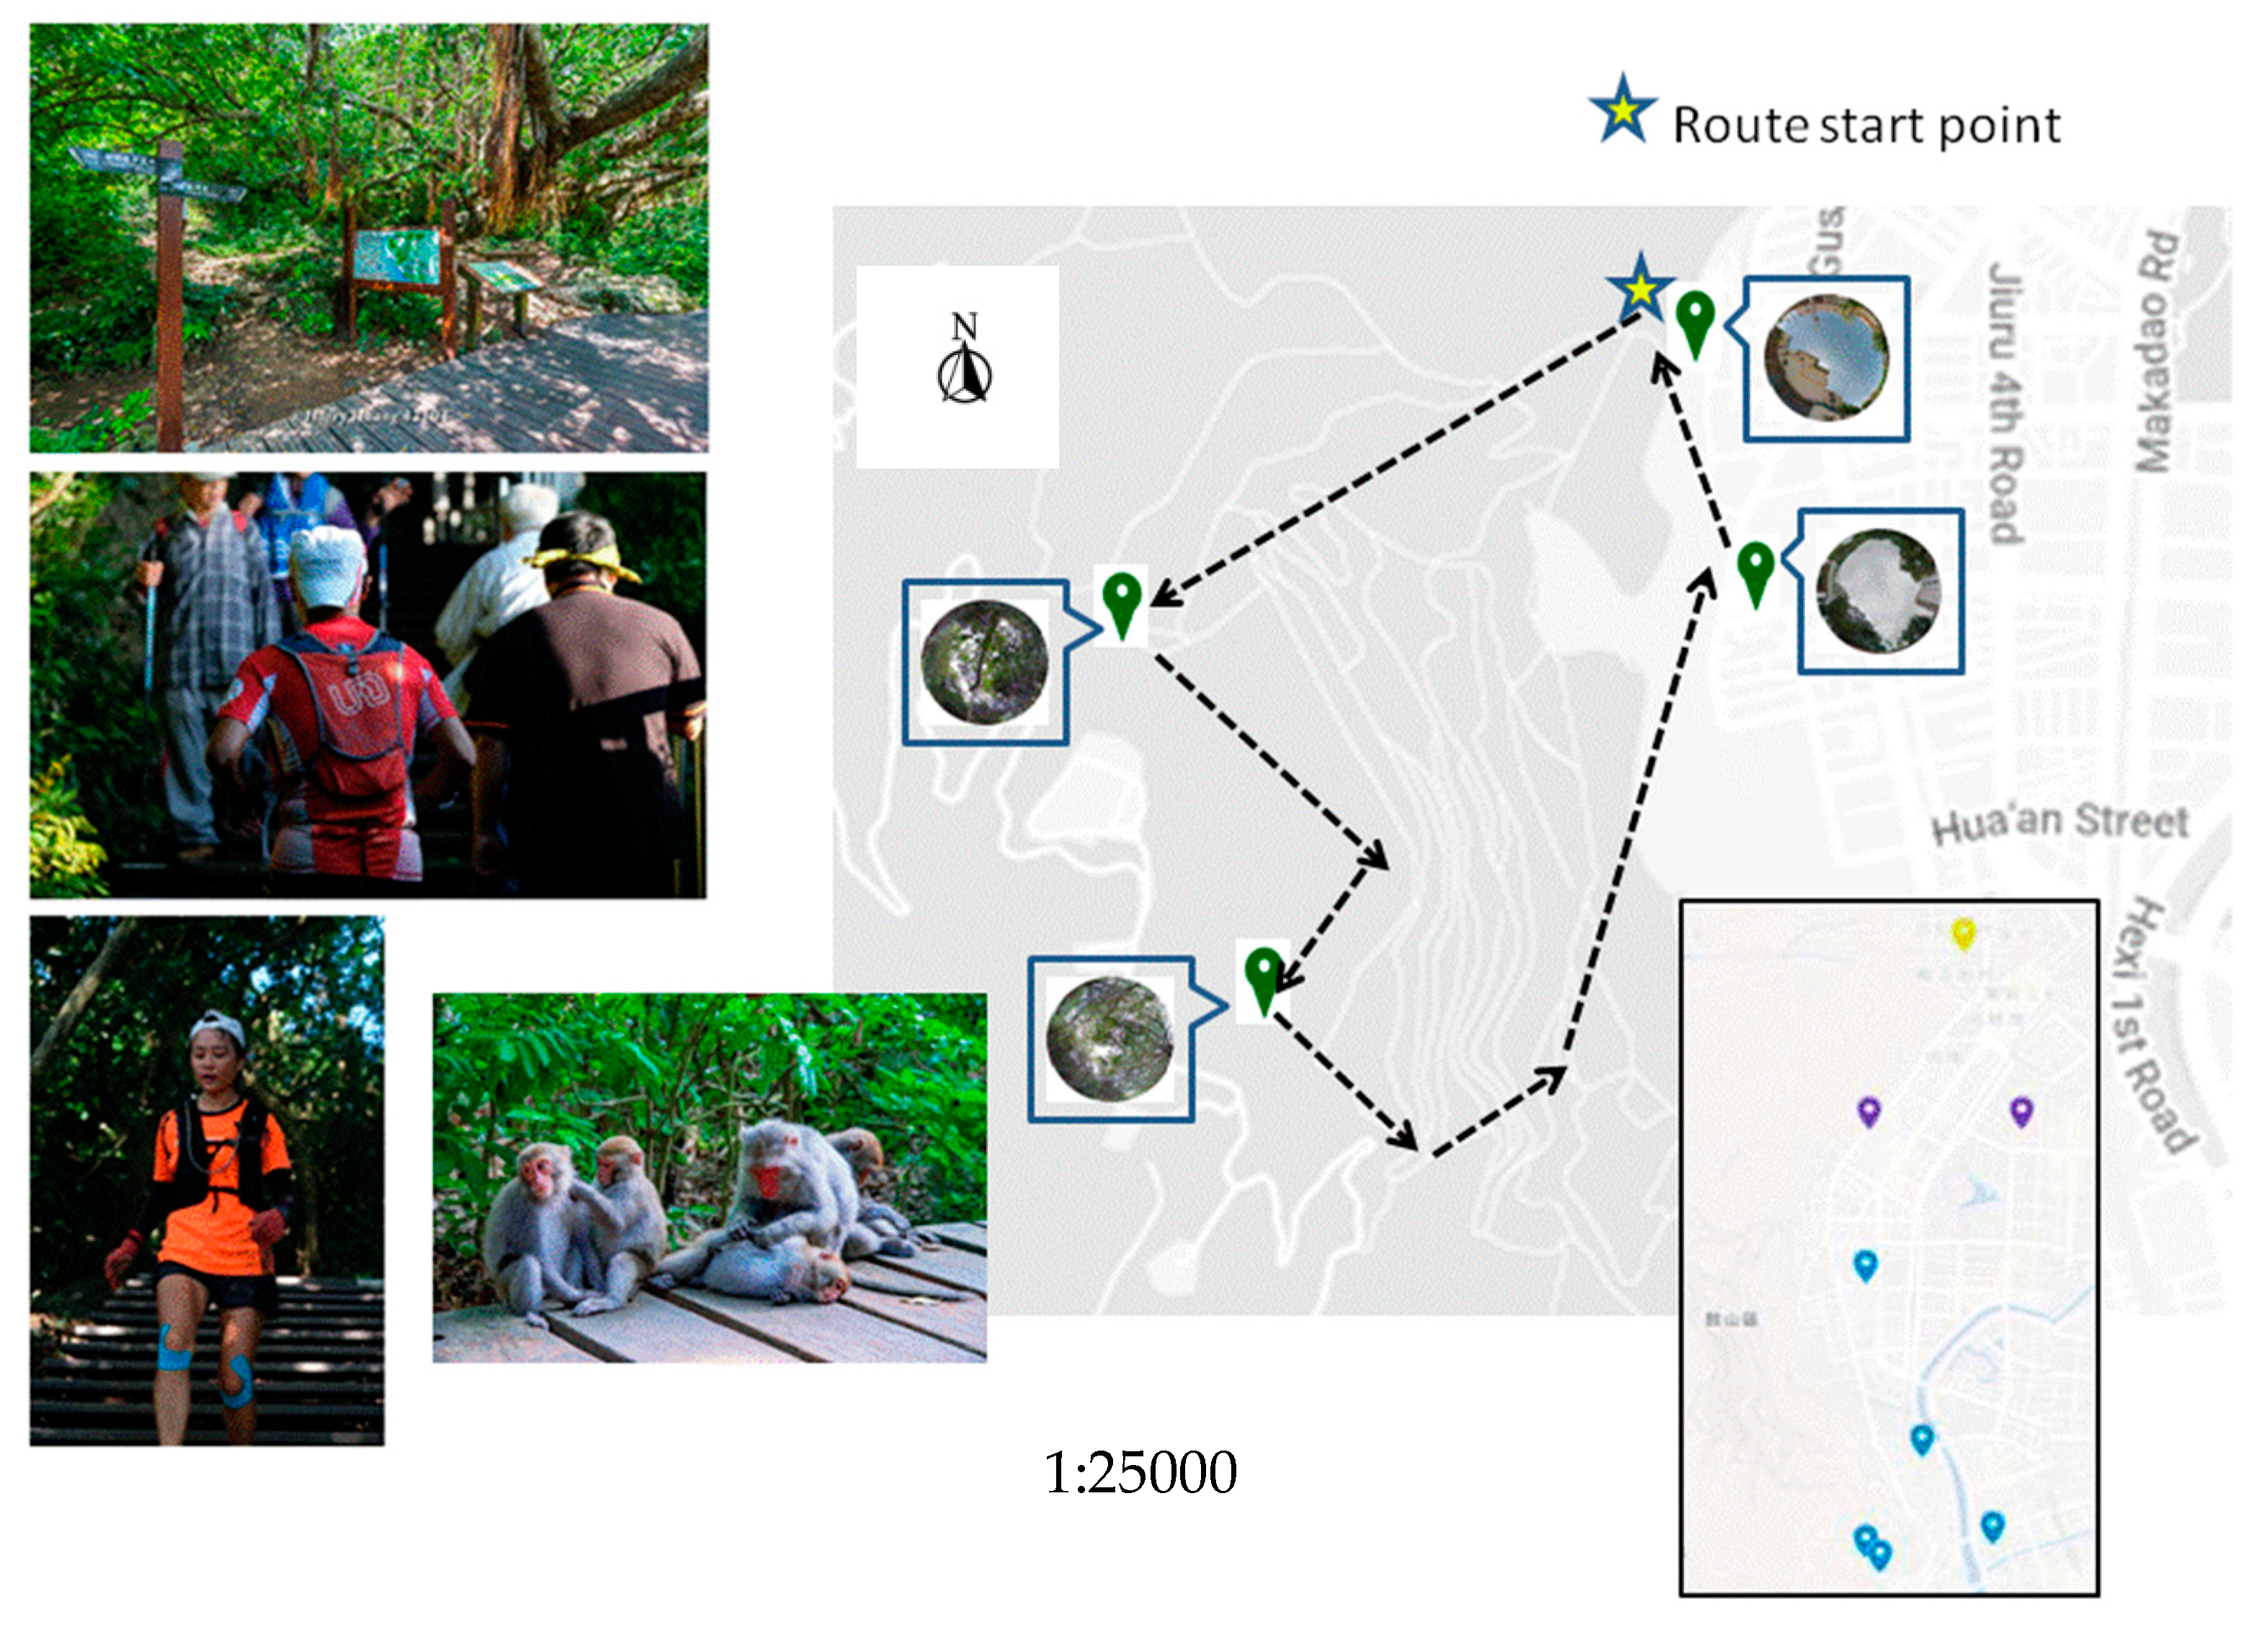
The Kaohsiung Shoushan mountain area has been viewed as one of the hot spots for local citizens to relax and get close to the forest and greenspace. According to the statistical information provided by the Kaohsiung Tourism Bureau, there were more than 660 thousand individuals visiting the Shoushan mountain area in 2019. Therefore, the Monkey King Hike and Run held at the Shoushan mountain area on 21 September 2019 was selected as the autumn running event in this study. Here, we took the running–hiking schedule of 6:00 a.m.–8:00 a.m. into consideration in analyzing the thermal and air quality conditions for runners. We also analyzed the conditions from 6:00 a.m. to 10:00 a.m. for walkers. The route, activity photos, and the fisheye photos taken from four sites are shown in
Figure 8.
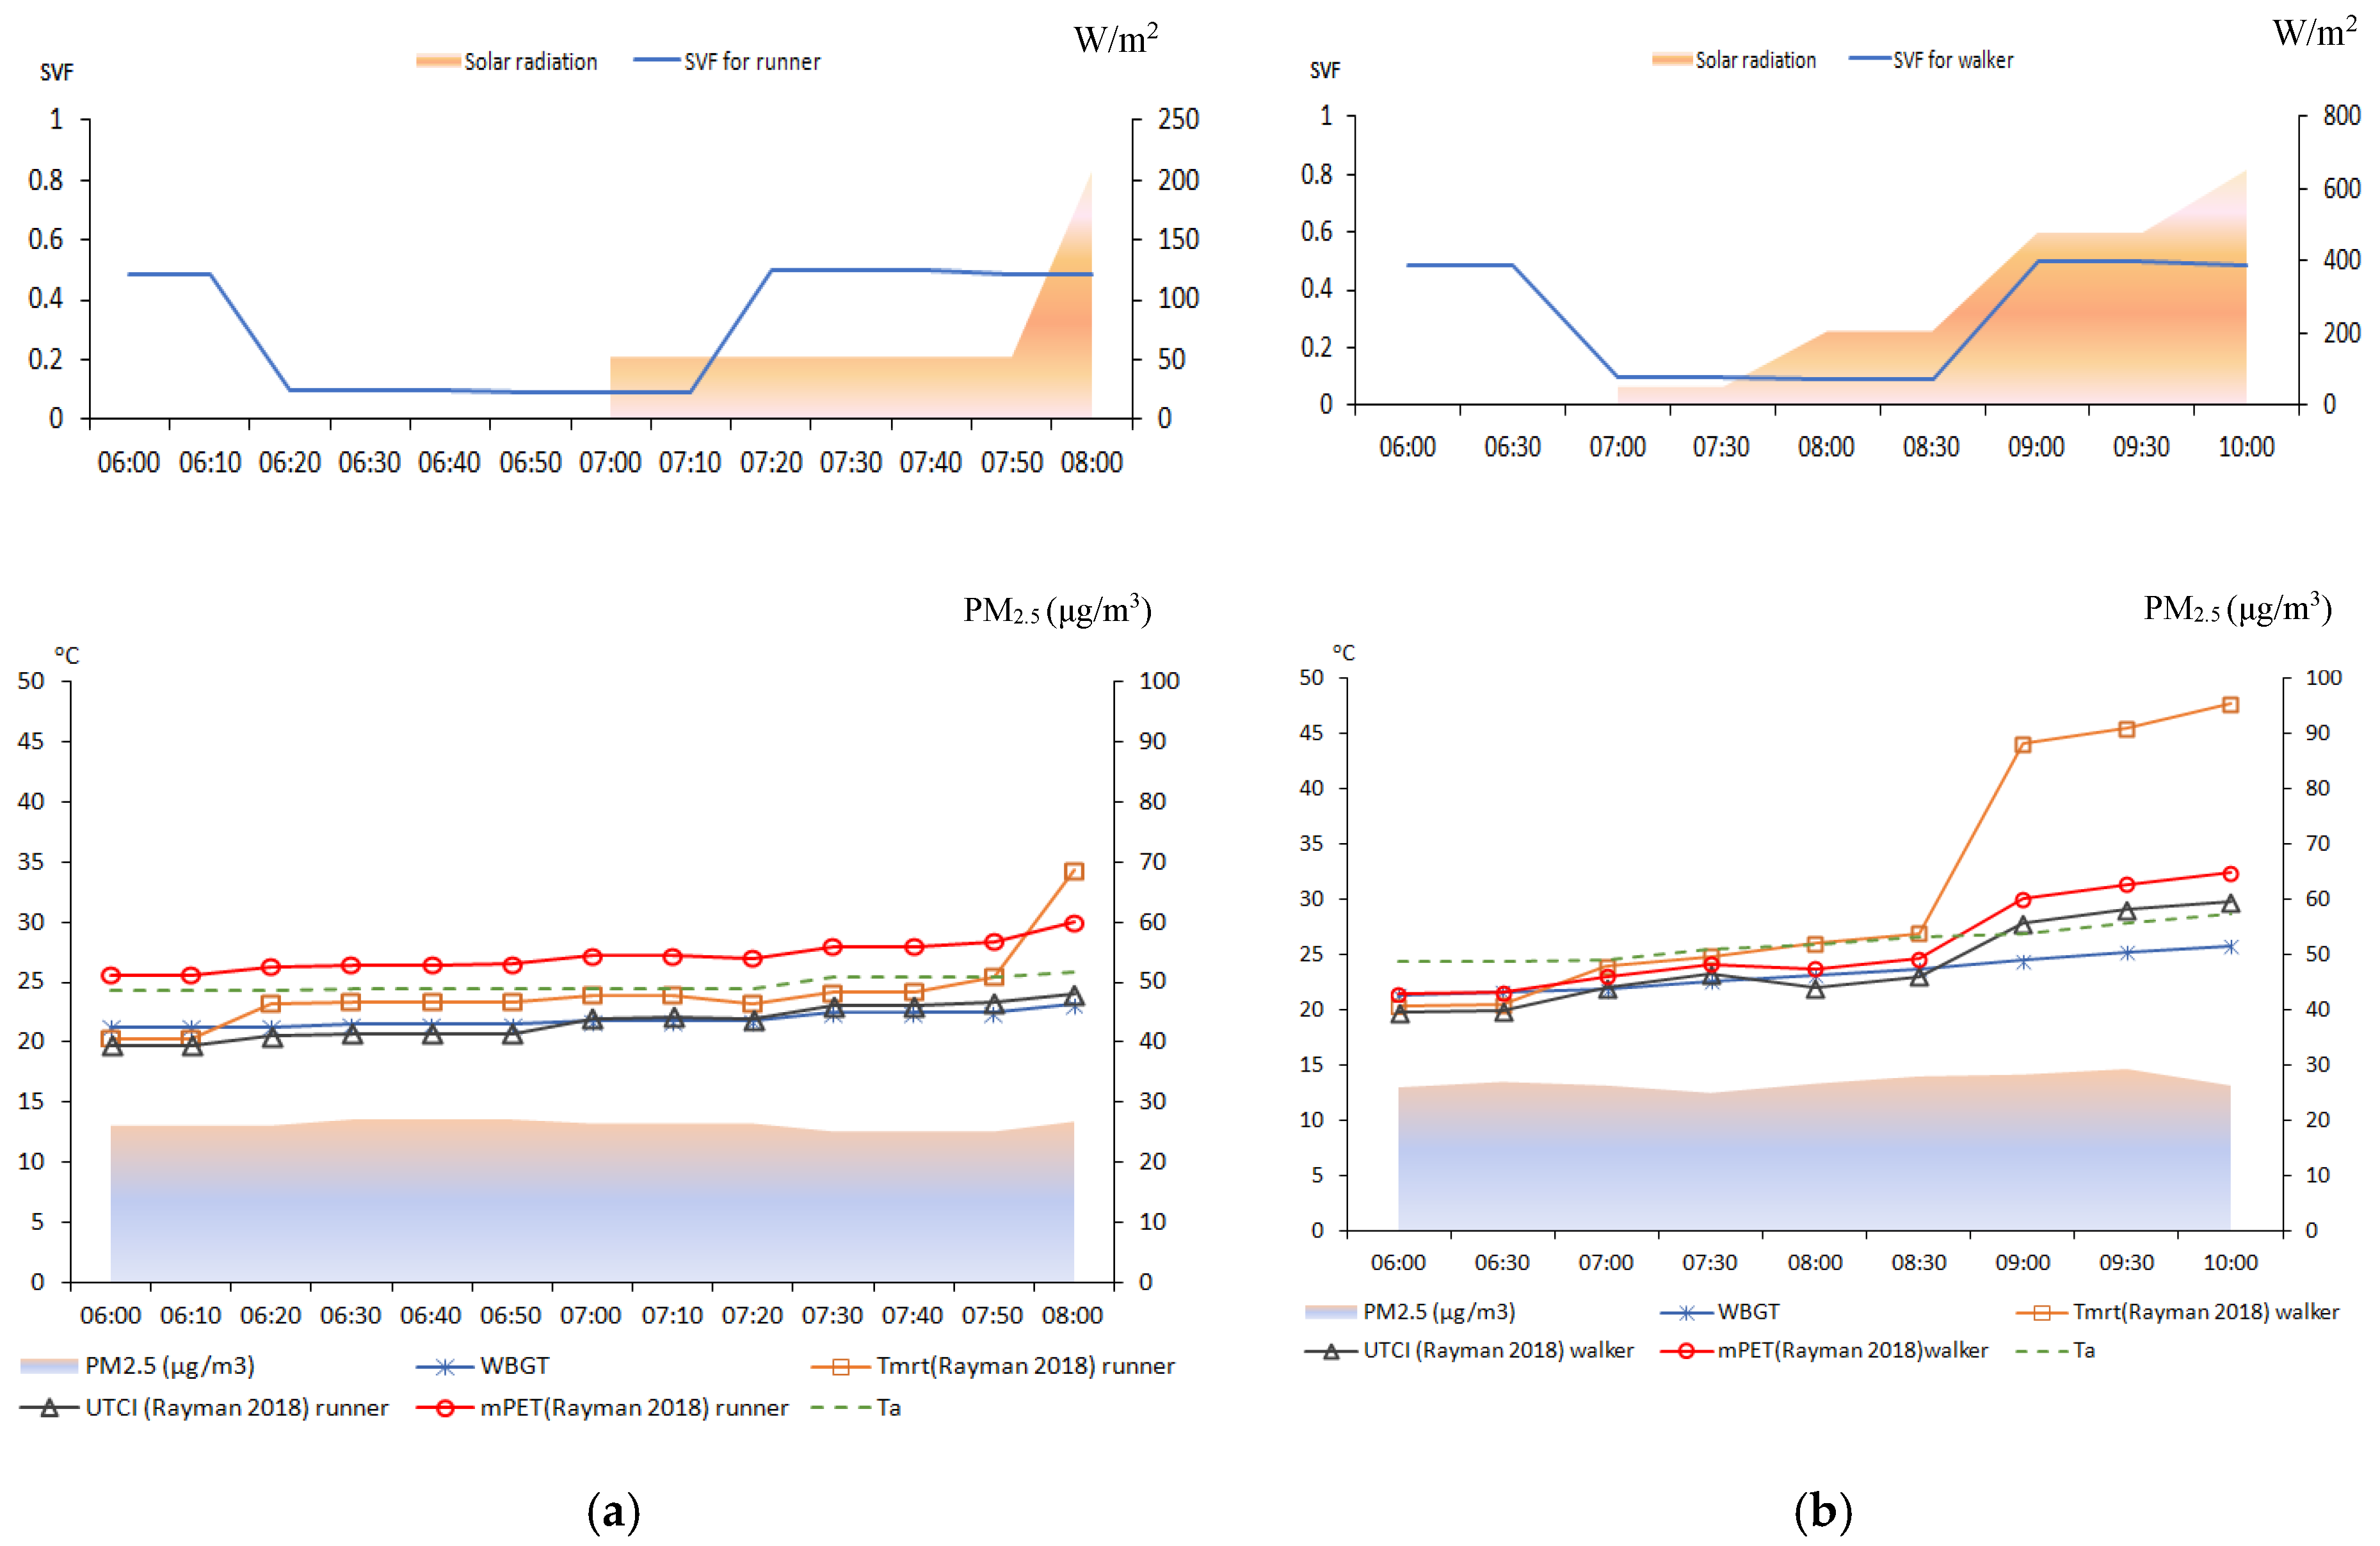
In
Figure 9a, there was very little solar radiation until 7:00 a.m., and the value gradually increased from 53 W/m
2 to 208 W/m
2 by the end of the running and hiking process. With the shade offered by the trees in the mountain area, SVF values from 6:20 a.m. to 7:10 a.m. were between 0.088 and 0.095, an increase of less than 0.1. The distribution for all thermal indicators had generally quite steady and smooth trends, along with a PM
2.5 concentration around 26 μg/m
3 as a moderate condition, which indicated that both thermal and air quality conditions could be viewed as low risk in causing thermal discomfort for runners.
For walkers, solar radiation increased three times—at 8:00 a.m., 9:00 a.m., and 10:00 a.m., with values of 208 W/m
2, 481 W/m
2, and 656 W/m
2, respectively. Since the radiation was lower, with low SVF values from 7:00 a.m. to 8:30 a.m., all thermal indicators demonstrated a low risk of having thermal discomfort before 8:30 a.m., as seen in
Figure 9b. Due to the synergistic effect triggered by both higher solar radiation and SVF values at 9:00 a.m., Tmrt rose sharply to 44 °C and kept climbing to 48 °C at 10:00 a.m. The mPET and WBGT had an increasing tendency, with the values over 30 °C and 25 °C, respectively, after 9:00 a.m., and the result showed that walkers would have felt very uncomfortable after 9:00 a.m.
3.4. Analysis of the Winter Running Event
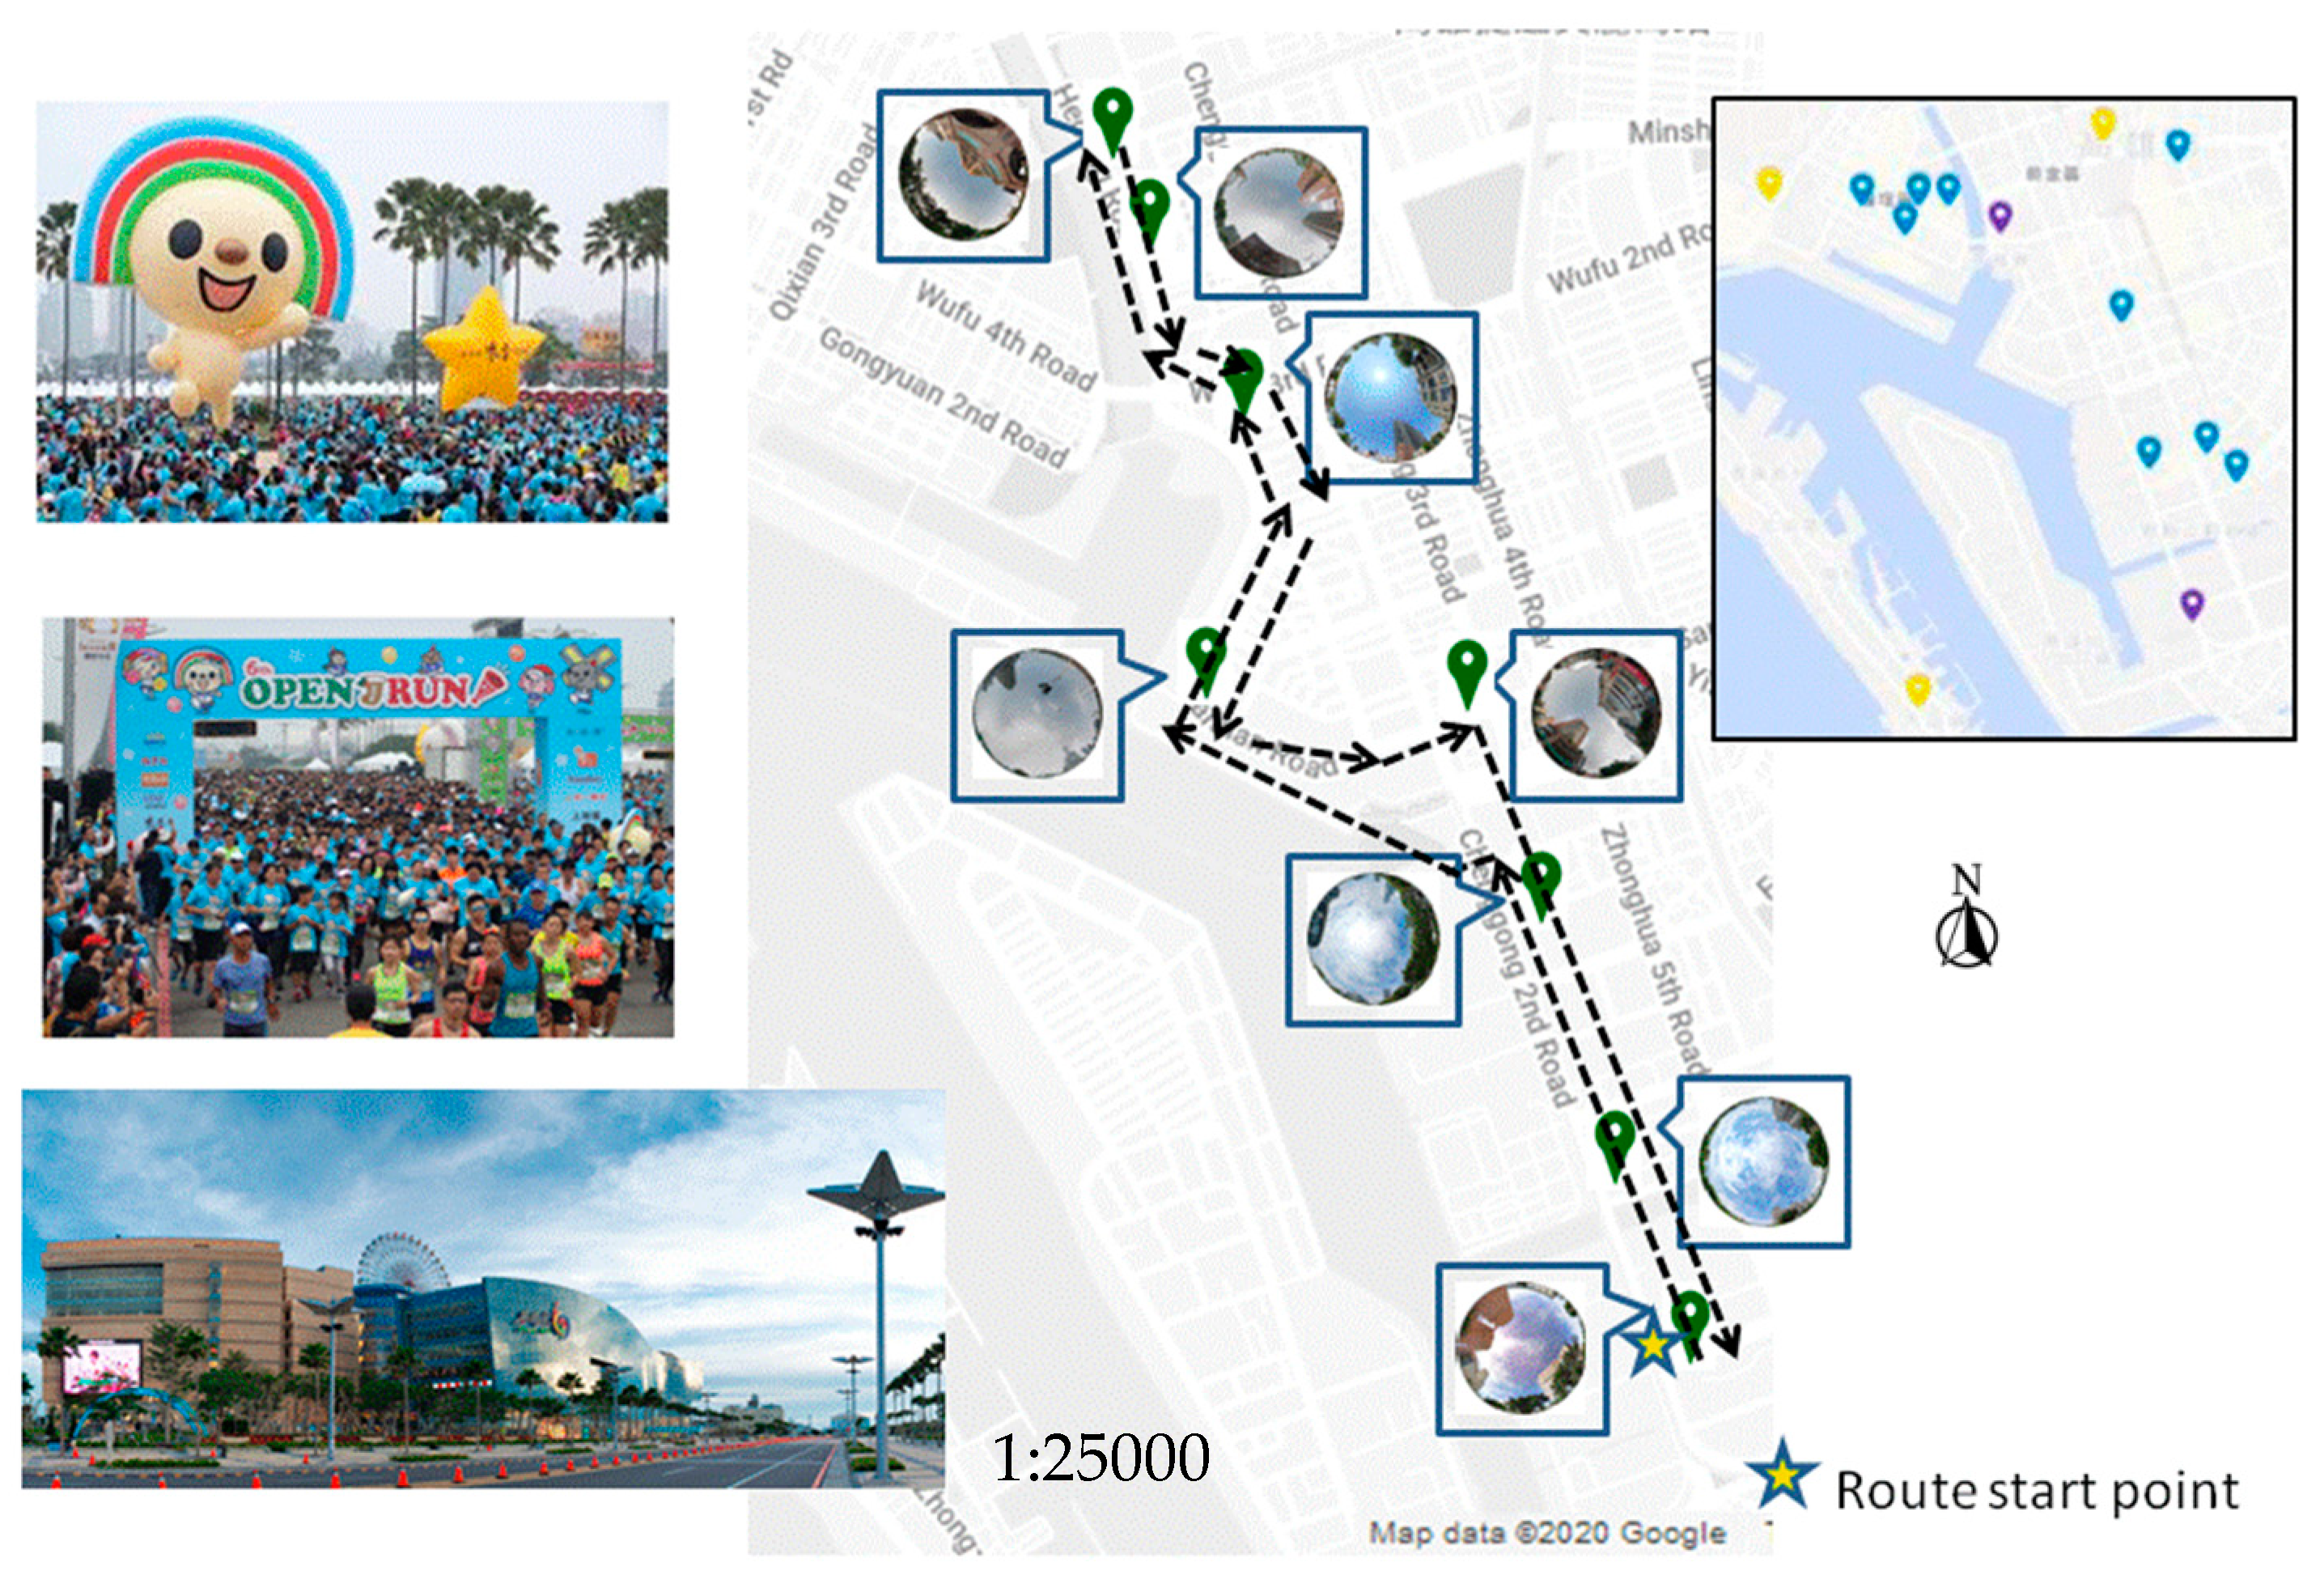
The OPEN RUN was held on 15 December 2019, and it was a parent–child run event supported by a local business enterprise that has hosted annual running events at the center of the commercial area in Kaohsiung city since 2013. There were more than 120 thousand participants—parents and children—joining the running event to promote the value of creating closer family engagement by running together. This running event can be viewed as one of the most representative parent–child activities in Taiwan for years. Since children’s body temperature would generally be higher than adults, to better understand the thermal and air quality condition for children and adults, this event was selected as the winter running event in this study. Here we took the running schedule from 7:30 a.m. to 9:30 a.m. into consideration to analyze the thermal and air quality conditions for runners. Moreover, we also analyzed the conditions from 6:30 a.m. to 10:30 a.m. for walkers. The route, activity photos, and the fisheye photos taken from eight sites are shown in
Figure 10.
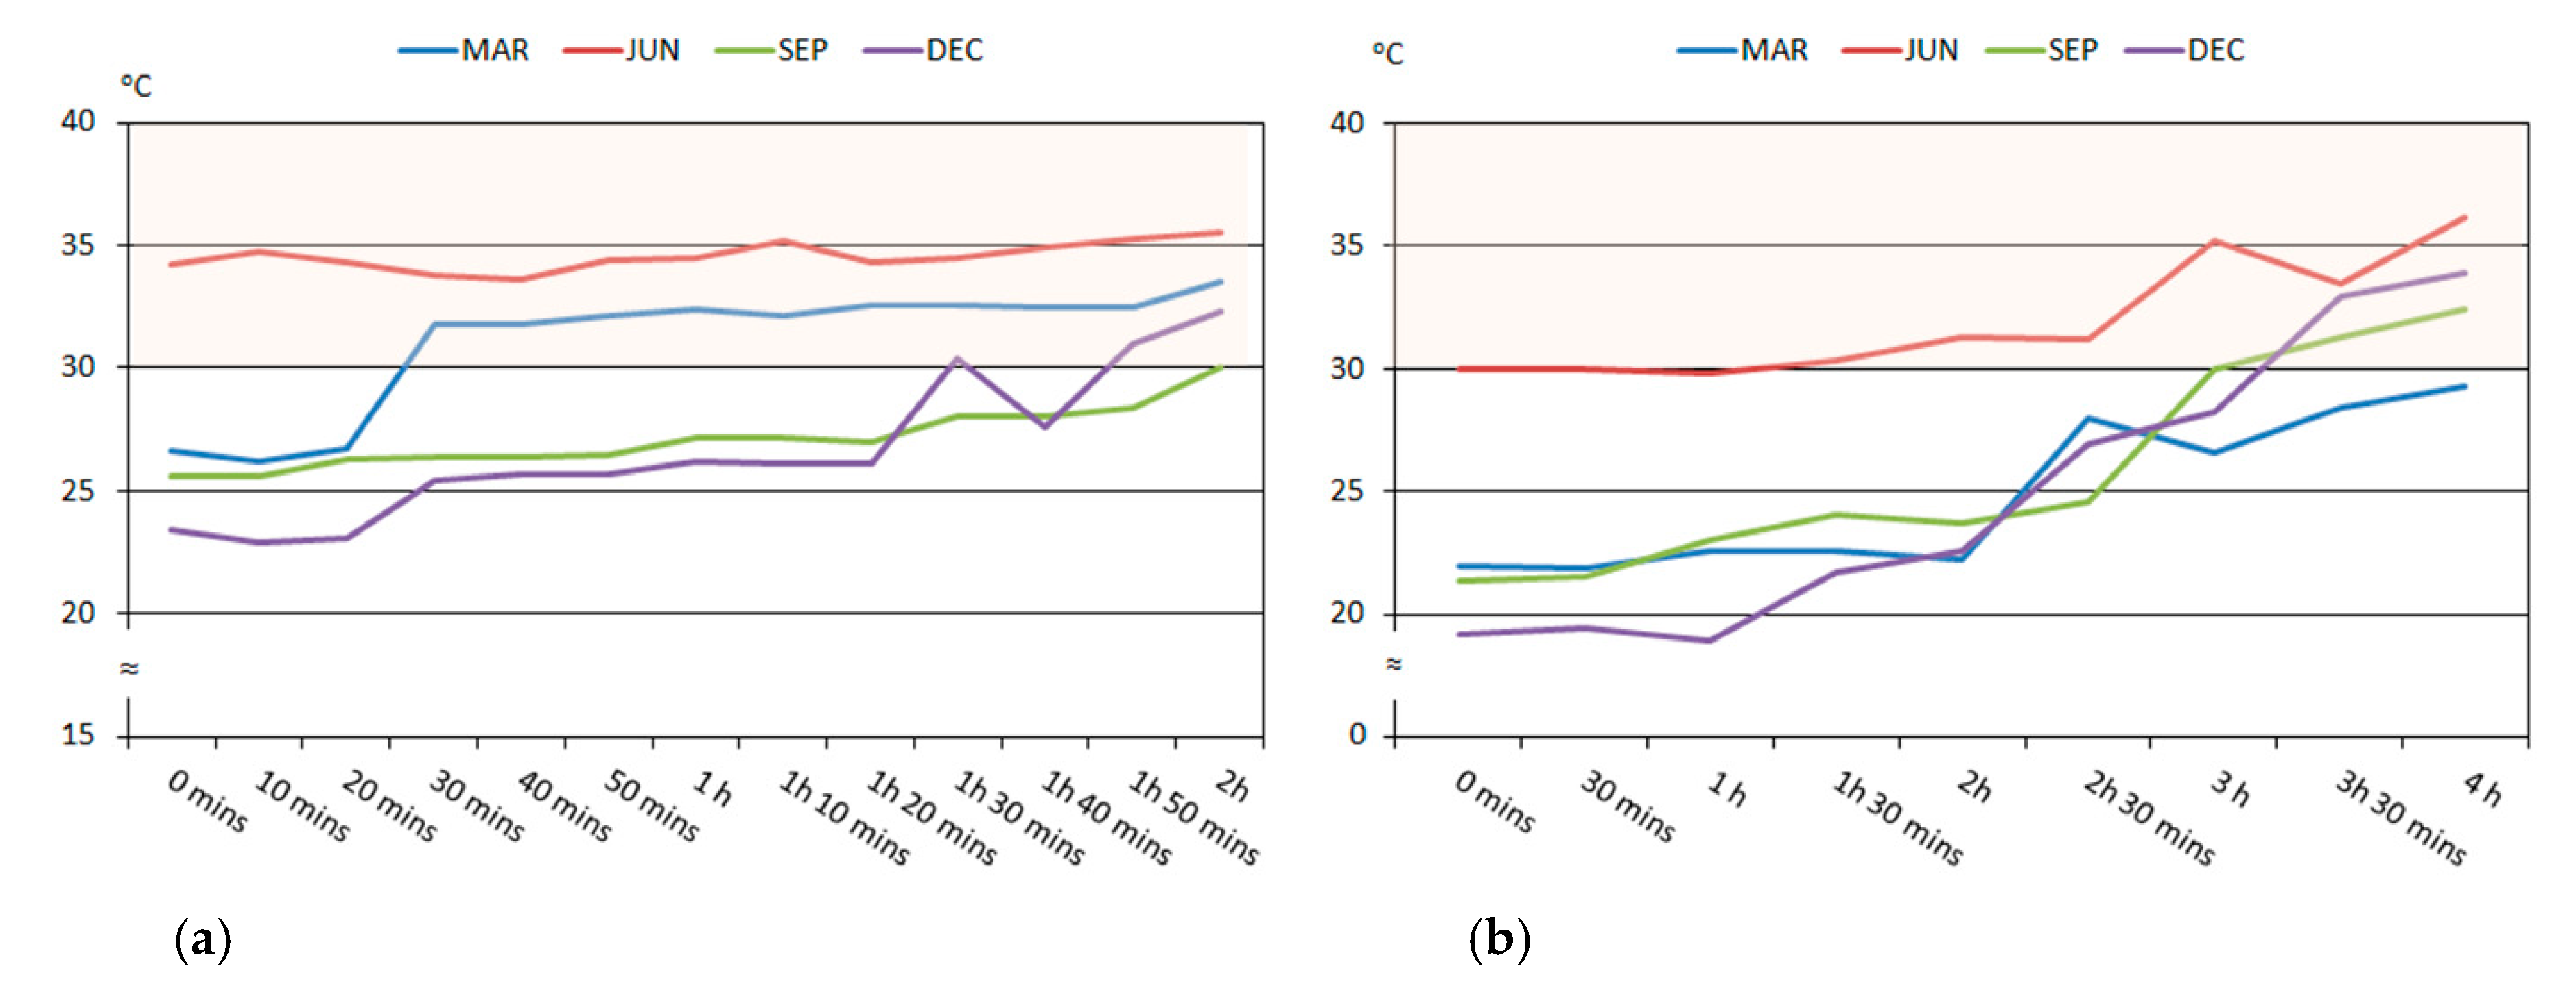
As seen in
Figure 11a, the solar radiation increased to 62.5 W/m
2 at 8:00 a.m. and remained at that value until 9:00 a.m., then climbed up to approximately 325 W/m
2. The SVF values among the eight sites were estimated between 0.4 and 0.8. The air temperature and WBGT were quite steady, with no variations specifically caused by the influences of solar radiation or SVF, while Tmrt, mPET, and UTCI rose along with the solar radiation. The mPET was over 30 °C from 9:00 a.m., and the Tmrt value increased to 38 °C around 9:30 a.m. The PM
2.5 concentration reached 43.6 μg/m
3, which is defined as “Unhealthy for Sensitive Groups” and remained over 35 μg/m
3 until 9:00 a.m. The above facts indicated the possibility for runners, including children and adults, to be exposed to unhealthy conditions during the event by having (1) not very good air quality before 9:00 a.m., and (2) thermal discomfort after 9:00 a.m.
This event began quite early in the morning, at 6:30 a.m.; therefore, there was little solar radiation until 8:00 a.m. for walkers, as shown in
Figure 11b. The air temperature and WBGT were steady and of a slightly increasing tendency over time, while Tmrt was specifically influenced by higher solar radiation and showed apparent increasing trends at 9:00 a.m. and 10:00 a.m. As a result, mPET and UTCI increased after 8:00 a.m., and then reached over 30 °C by 10:00 a.m. Furthermore, Tmrt also increased to over 40 °C by 10:00 a.m. With the PM
2.5 over 35μg/m
3 most of the time, the walkers were exposed to an unhealthy air quality condition for the entire 4 h and also had risk of thermal discomfort after 10:00 a.m.
3.5. Summary
Although there are many factors related to outdoor thermal comfort, such as urban form, building type, age, gender, nationality, cloud cover, variation of individuals’ moving speed, clothing, the preference for staying in shaded areas, etc., it has been well documented that a better understanding of climate and outdoor thermal comfort can be helpful for improving the quality of life within built environment [
29,
30,
31]. Furthermore, the thermal conditions are also quite different among different regions. While warm outdoor and sunny conditions play an essential role in encouraging people living in temperate climates to go outdoors, shade is the key factor in making better pedestrian strategies for thermal comfort adaptations in sub-tropical/tropical climates with predominantly hot–humid conditions [
32,
33,
34,
35,
36,
37].
With the analysis of the thermal and environmental conditions, using PM2.5 concentration and four thermal indicators (WBGT, mPET, UTCI, and Tmrt) at four selected running events held at popular spots in Kaohsiung in different seasons, in general, it was found that air quality conditions were relatively worse and unhealthier in winter. With the synergistic effect derived by both higher solar radiation and SVF, the thermal condition became very difficult for both runners and walkers on the route during certain periods of time for all seasons. In this study, we simply applied the real time monitoring data nearby, assumed the runners/walkers were similarly dressed and moved with steady speeds, and we estimated thermal indicators to analyze the outdoor thermal performance. Obtaining more comprehensive data would be very important for further study.
The findings of this study are (1) most environmental data applied here were from real time monitoring, and it was predictable that the results in estimating the thermal indicators or the correlation between factors would not be perfect from one time to another, (2) WBGT values for those four events, regardless of whether they were for runners or walkers, were the most steady and correlated well with the air temperature only, and there was little variation caused by the influences of participants behaviors, solar radiation, or SVF, (3) mPET, UTCI, and Tmrt were able to respond to the changes of solar radiation and SVF at different sites by time, and (4) mPET could not only put the environmental factors into consideration, but also the human metabolic rates/clothing conditions.
4. Discussion
4.1. Seasonal mPET Variation and the Comparison
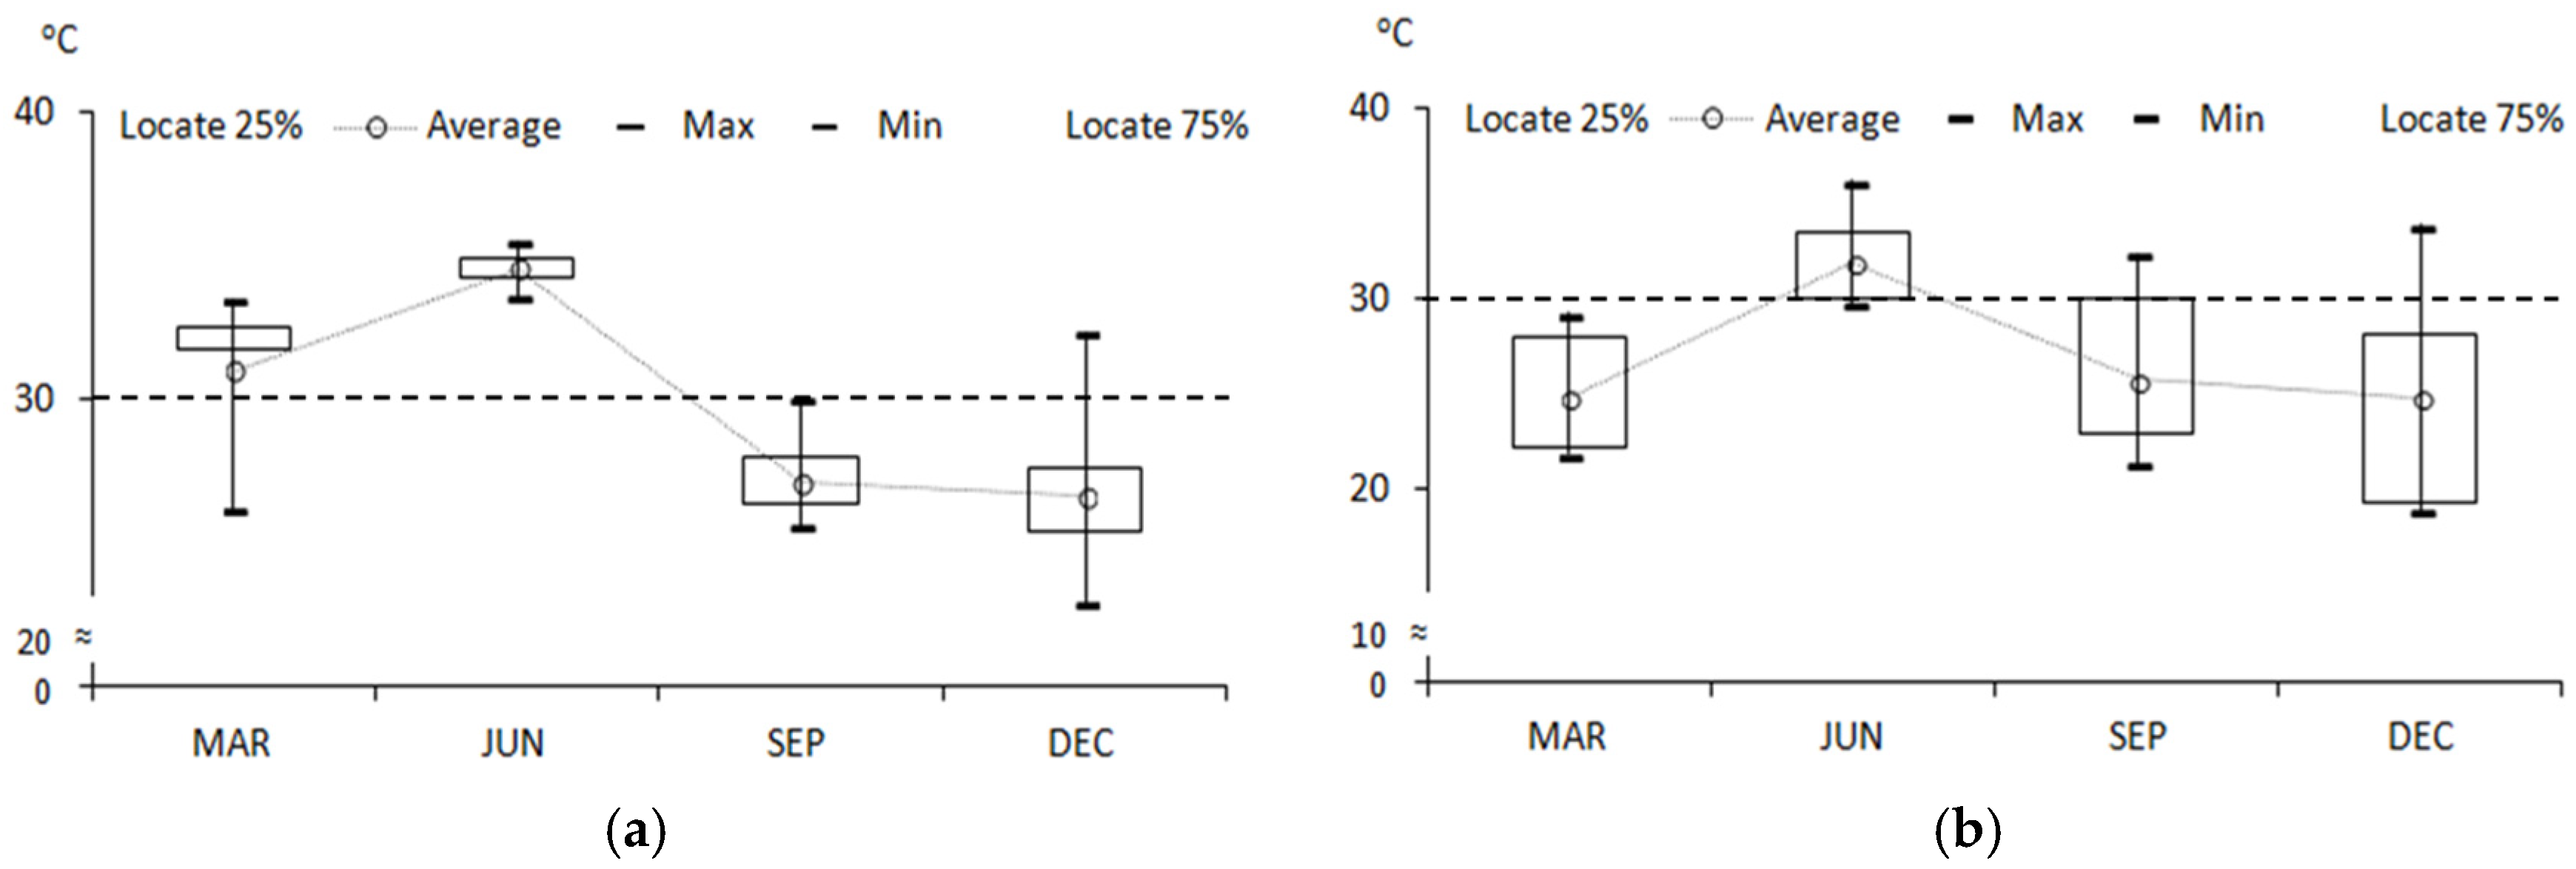
As seen in
Figure 12a, the values for June were higher, which were followed by the values for March, September, and December, fitted to the general expectation of “summer is hotter”. Autumn and winter events had the most mPET values lower than 30 °C, which can be viewed as having greater potential to reach thermal comfort requirements. There were several rapidly changing points in March and December distributions, and those changes were basically caused by the sudden variations of solar radiation and SVF among different sites by time.
As seen in
Figure 12b, walkers stayed at the venue longer, and even with lower metabolic rates compared to runners, the possibility for walkers to have thermal discomfort was estimated to be higher. Therefore, due to the longer time under outdoor exposure, the residents, fans, and staff for the running events should be more aware of the thermal conditions over time.
For both runners and walkers, the highest peaks of average/max/min mPET all occurred at the summer event, as seen in
Figure 13a,b. It was also shown that the mPET values were more evenly dispersed for walkers than for runners. By defining mPET over 30 °C as the threshold in feeling thermal discomfort for people in Taiwan, runners would feel too hot for most of the time (between locate 25~75%) in spring and summer events while walkers would feel too hot for most of the time only at summer events. Nevertheless, even walkers would feel quite comfortable for the most of the time in spring, autumn, and winter. Regarding the max mPET over 30 °C taking place, walkers would still have to face conditions of discomfort from time to time. In general, autumn running event would be viewed as safest in avoiding thermal discomfort for runners, and spring events for walkers.
4.2. The Effects of SVF and Solar Radiation
For planning a running event, it was essentially very important to decide the route and running schedules for different running groups (42 km, 21 km, 10 km, 6 km, and so on) [
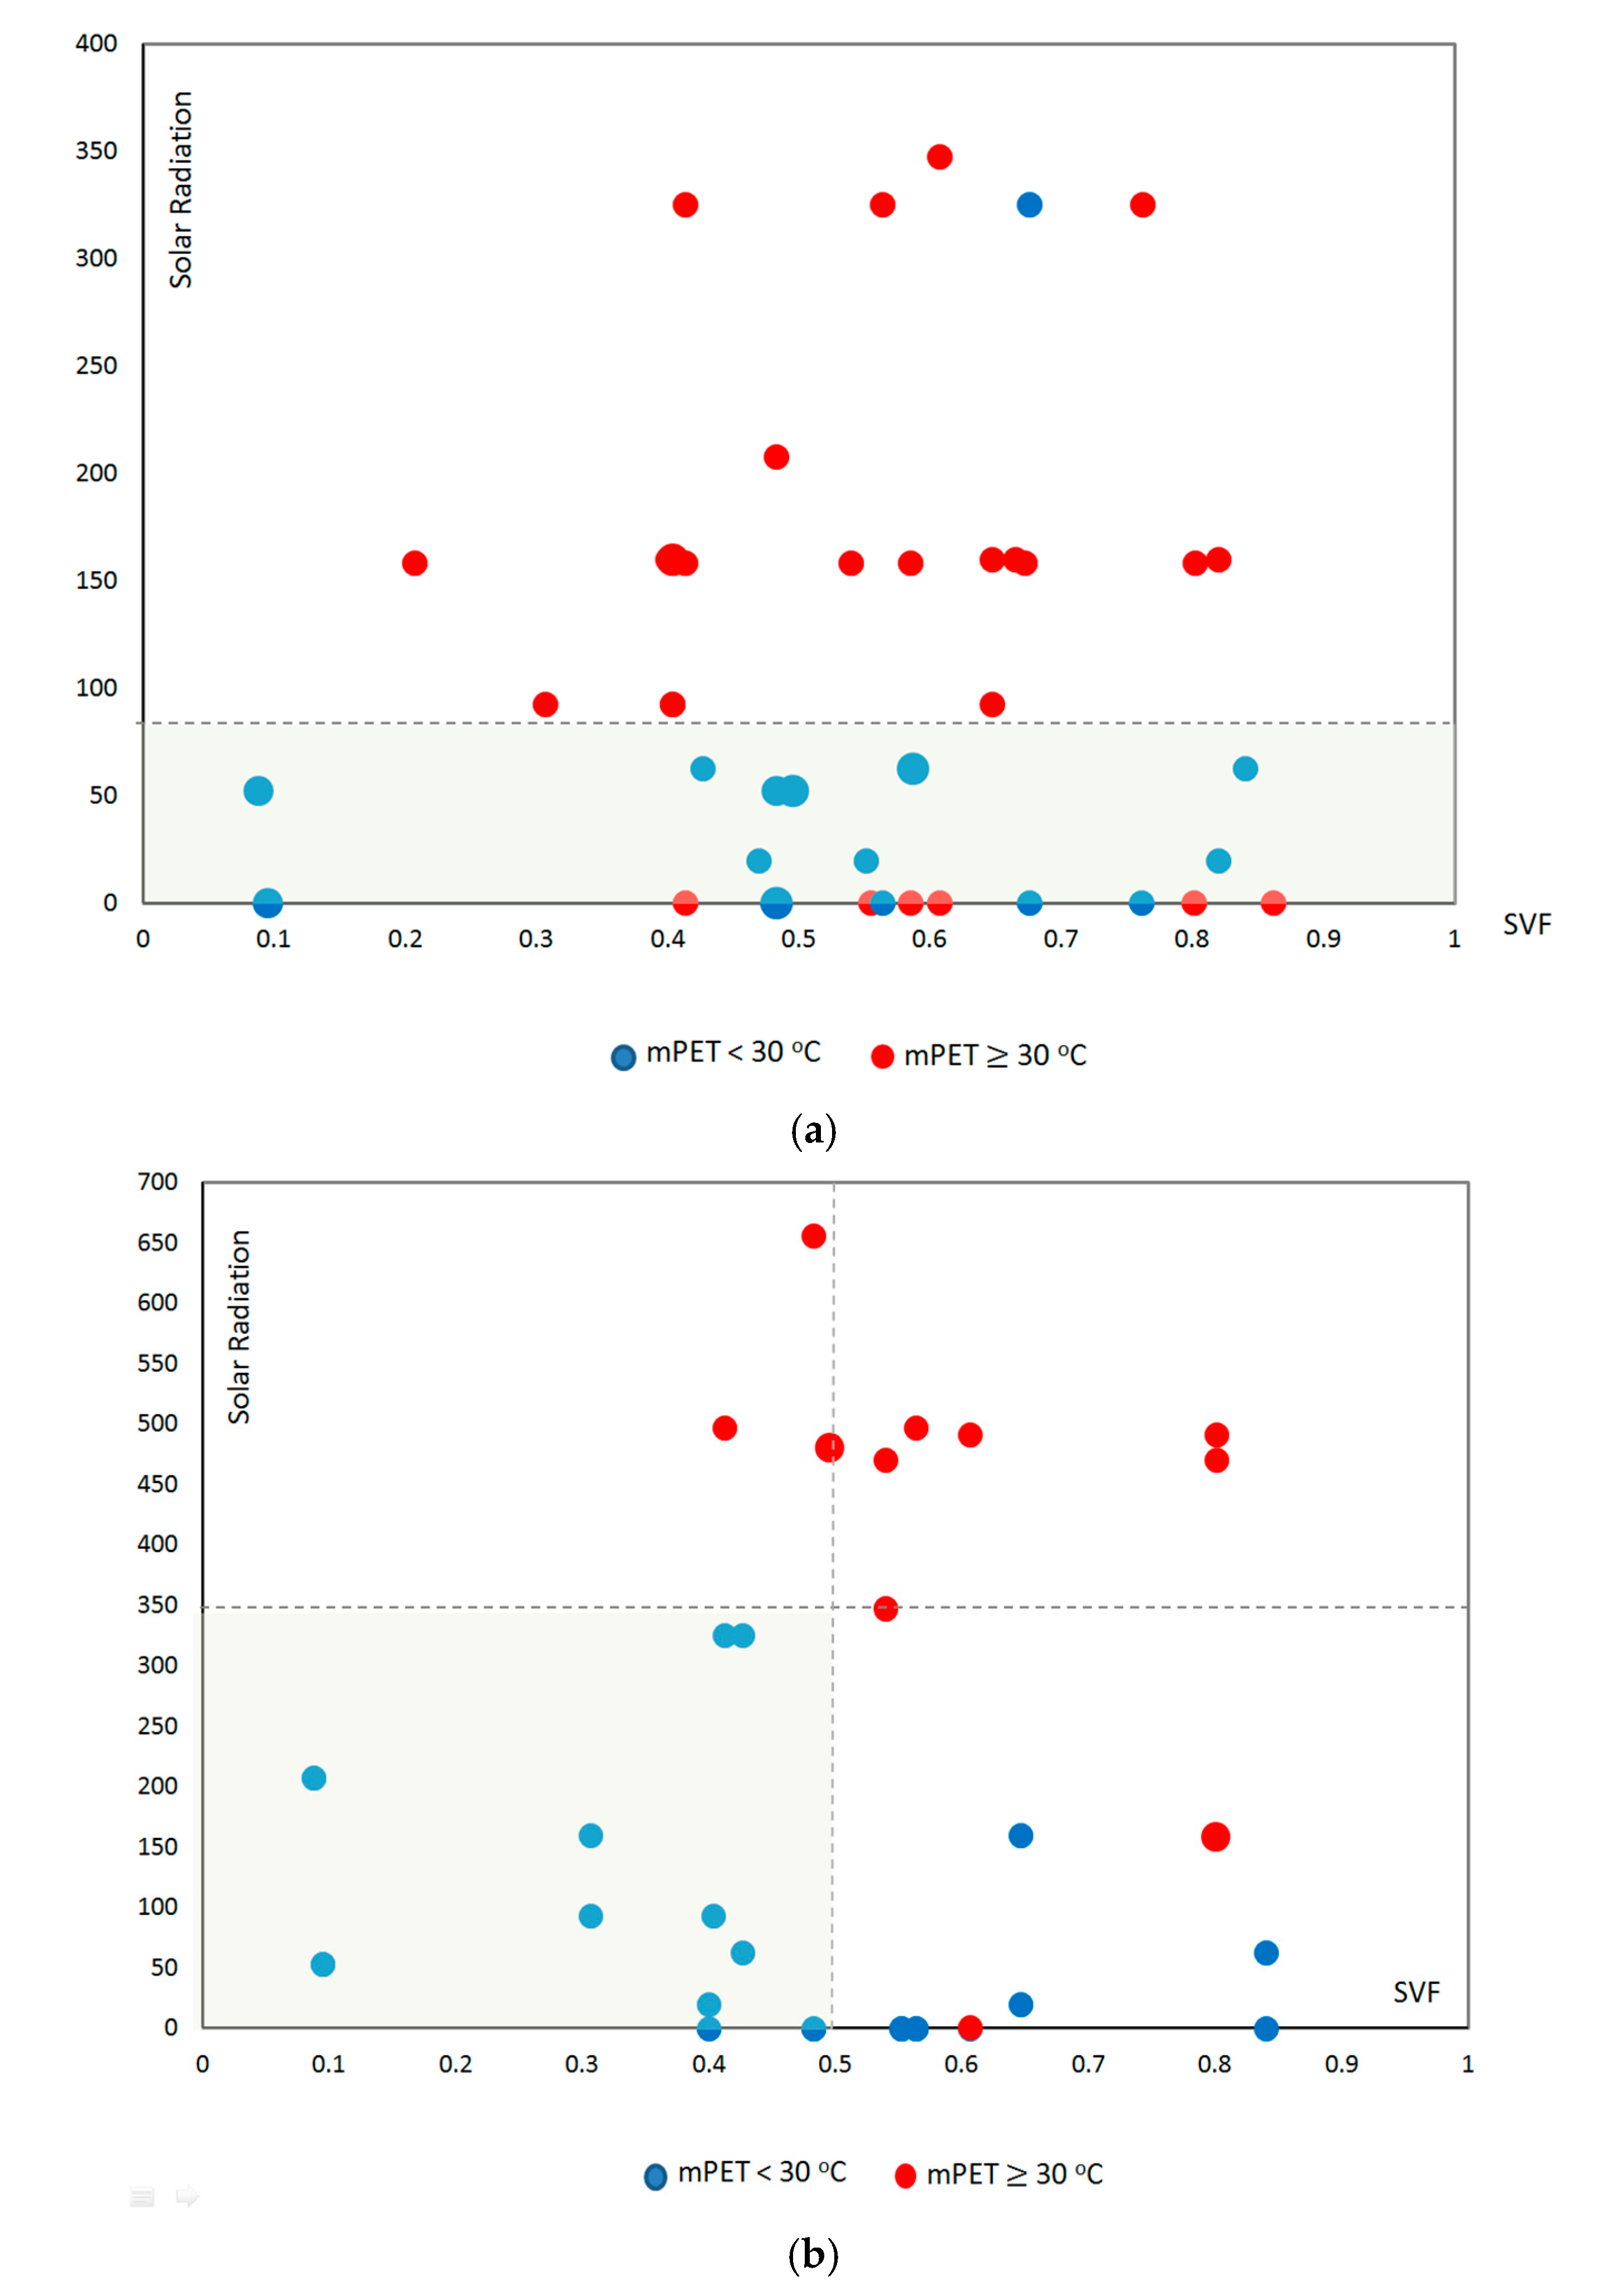
38]. In this study, with the fisheye photos taken at sites along with the route for those events, it was possible to calculate the accurate and detailed SVF at different parts of the route. There was not much we could do to change the solar radiation from the source, but SVF could be significantly important in adjusting the final influences. In this study, the SVF was assumed to be the same during each 10 min duration for runners and 30 min duration for walkers. Furthermore, the mPET correlations with solar radiation and SVF for runners/walkers are shown in
Figure 14a,b.
In
Figure 14a, the correlation of mPET ≥ 30 °C/mPET < 30 °C for runners was seldom related to higher/lower SVF but more connected to higher/lower solar radiation. This addressed the fact that the higher solar radiation would mostly contribute to the risk of having thermal discomfort (mPET ≥ 30 °C). For walkers, the correlation between solar radiation/SVF and mPET is shown in
Figure 14b. The values of mPET < 30 °C were located at the lower solar radiation/SVF area, while mPET ≥ 30 °C was distributed mostly at the higher radiation/SVF area.
4.3. The Application of Risk Assessment for Events
As seen in
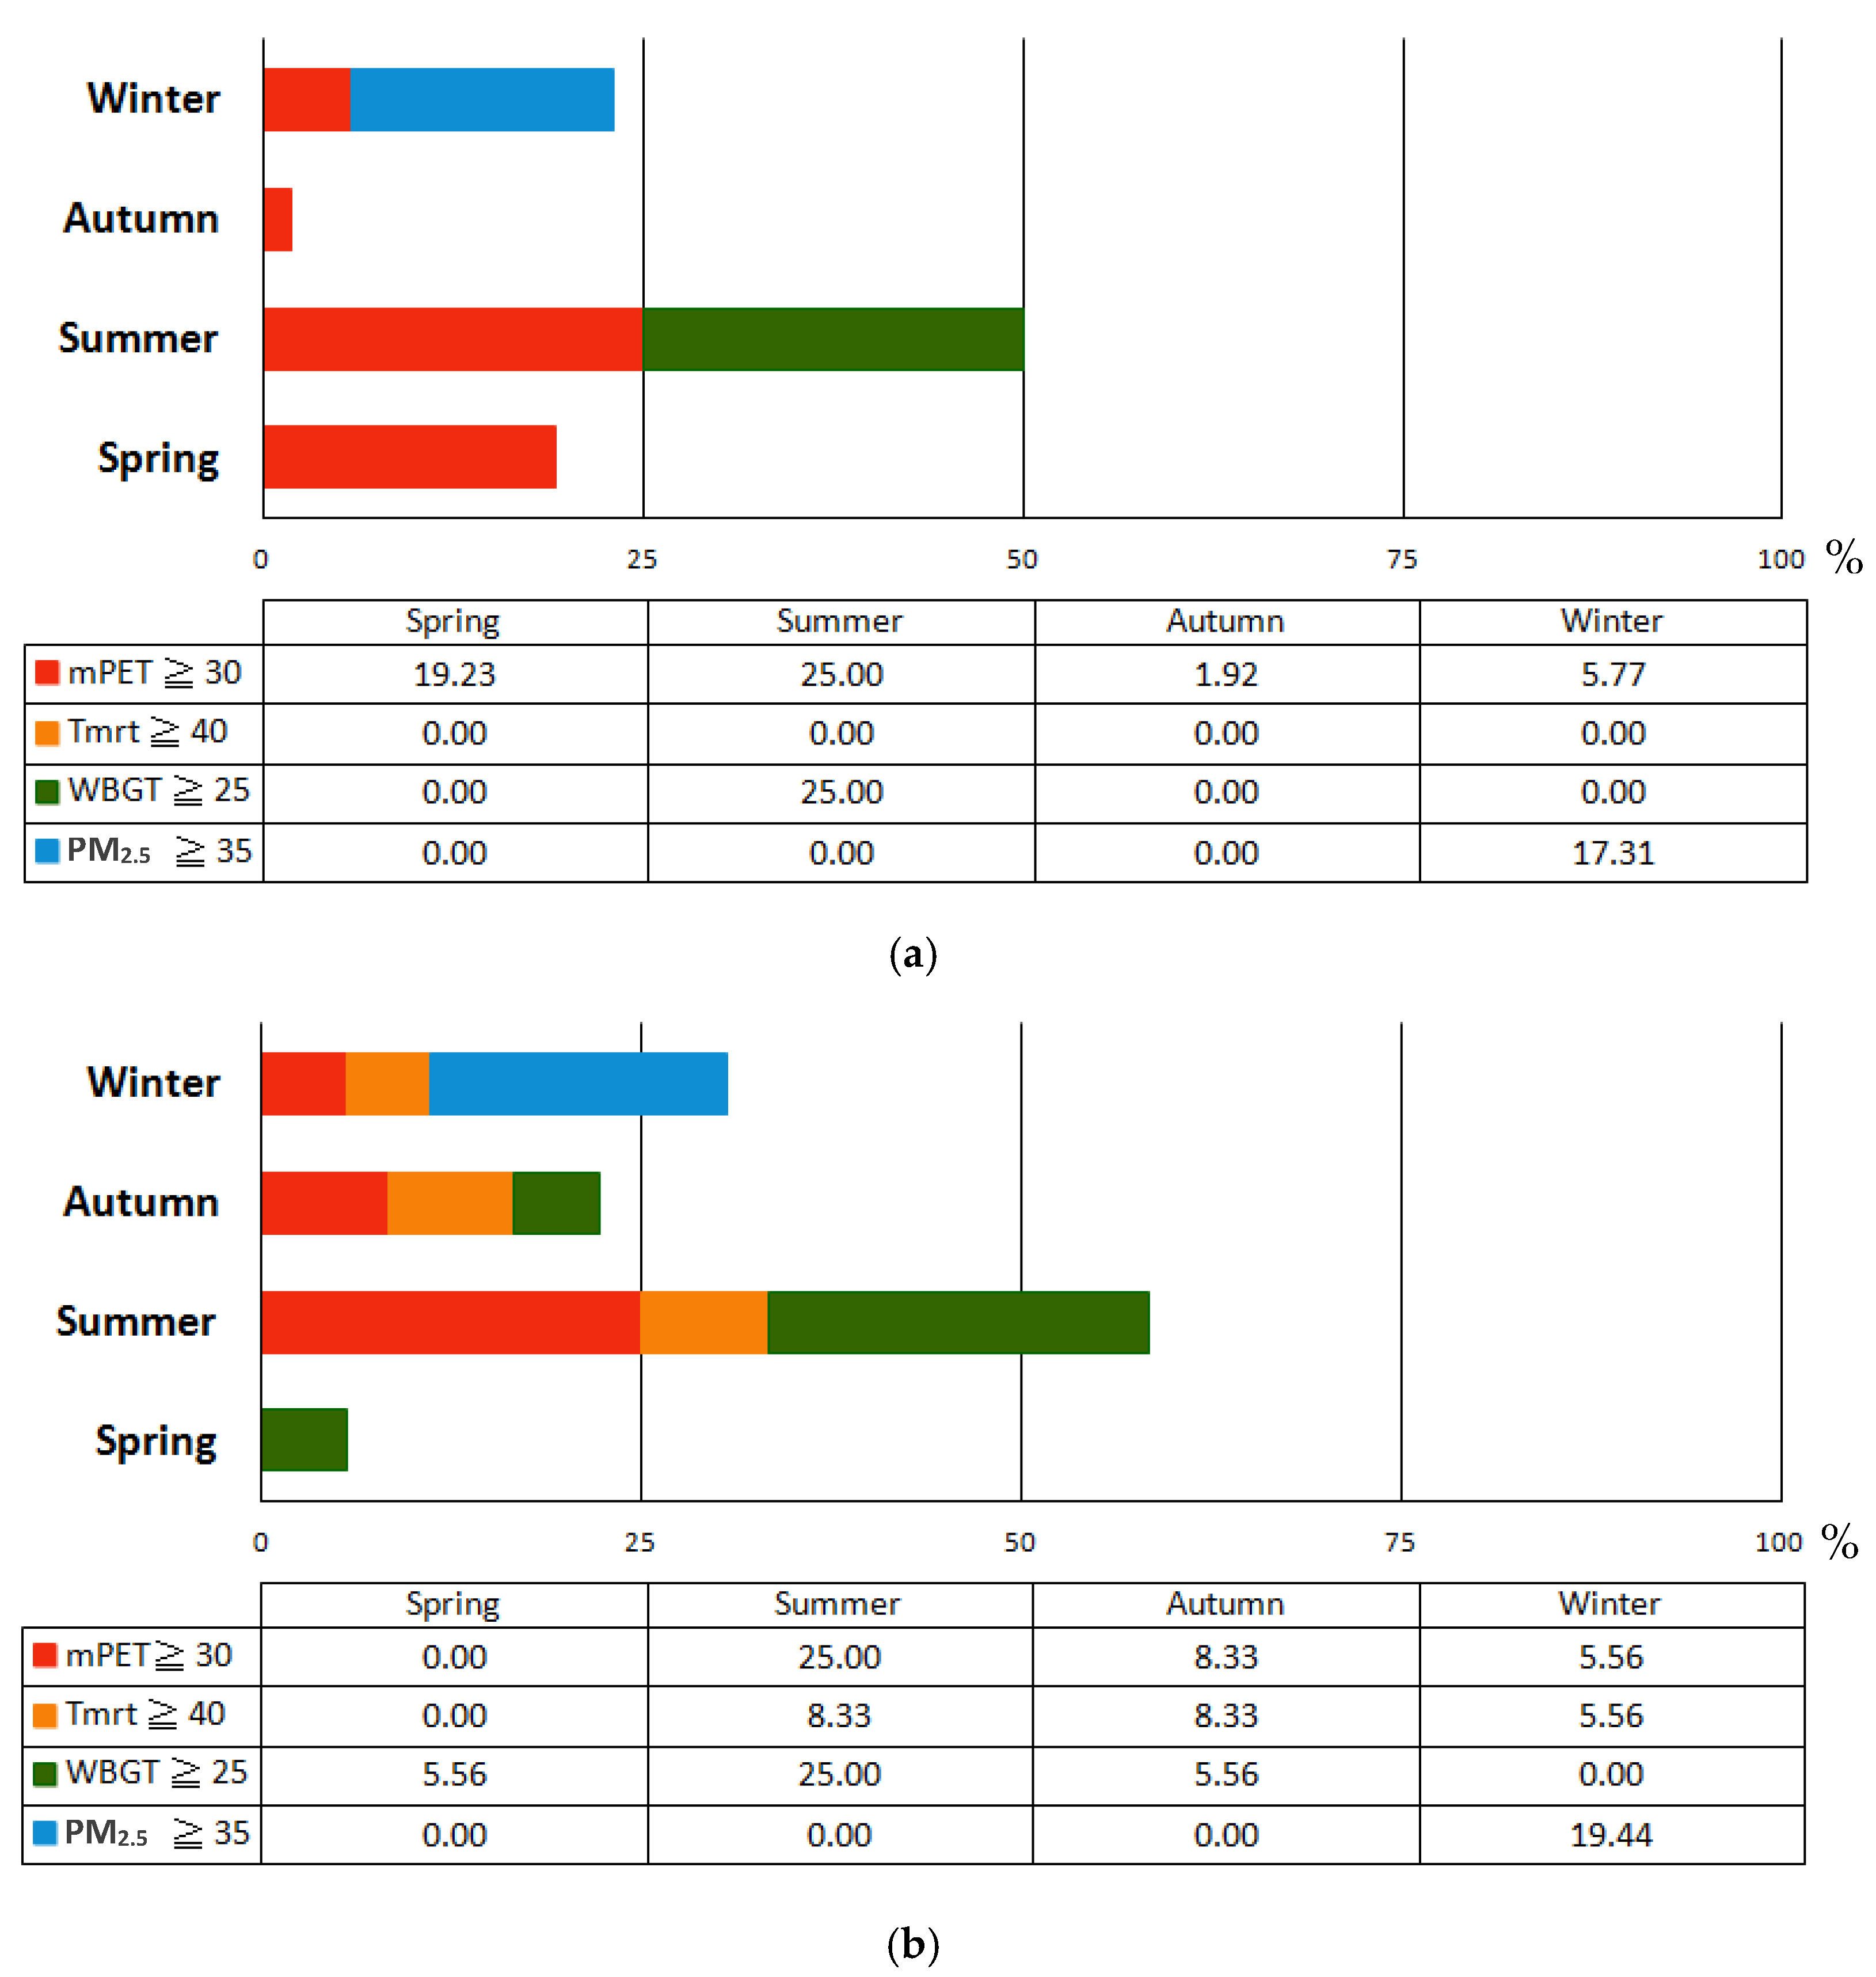
Figure 15a,b, by estimating the percentage (%) of having thermal indicators over the thresholds during running events, the risks in having thermal discomfort for runners and walkers were determined. Furthermore, the discomfort situations were defined here as (1) mPET ≥ 30 °C, (2) Tmrt ≥ 40 °C, (3) WBGT ≥ 25 °C, and (4) PM
2.5 concentration ≥ 35 μg/m
3. As a result, autumn running events are the most appropriate for runners, while spring running events are most appropriate for walkers. Due to the extreme high temperature conditions, the organizers even initiated the event in the early morning for reducing the discomfort caused by heat; the summer event was no doubt the least suitable one for both runners and walkers regarding thermal comfort.
The PM2.5 concentration in winter, especially in the city center where the traffic is busy during both week days or during the weekend, was essentially found to be worse than other seasons in Kaohsiung. Even though the temperature was likely to be lower than in other seasons, the air quality was defined to be unhealthy. Therefore, it should be well considered to not hold outdoor activities during winter in Kaohsiung, unless (1) they are held at locations away from the city center, or (2) better diffusion conditions are confirmed.
For walkers exposing themselves to the outdoor environment longer than runners, the discomfort risks were higher in summer, autumn, and winter, which indicated the fact that even the walkers, who had lower metabolic rate and took relatively slow/steady pedestrian movements, would likely be in even more danger of having feelings of discomfort regarding air quality and thermal conditions. In this study, walkers were assumed to stay outdoors for longer hours, and the result might be useful for neighborhood residents, fans, or running event staff under similar environmental conditions.
It is practical for running event organizers to assess whether the time and the route are scheduled with relatively safe standards, and to arrange appropriate adjustments, such as location of rest stations or creation of shading or cooling applications at the thermal discomfort sections. By setting different thermal discomfort levels regarding participants’ distribution, age, or nationalities, it is also possible to obtain detailed analysis for different groups of participants’ thermal conditions in time, and also to be able to prepare for having discomfort conditions in advance.
5. Conclusions
Through the analysis of selected running events in this study, it was quite obviously shown that the air temperature (Ta) and WBGT were quite steady, with no significant variations caused by the influences of solar radiation or SVF, while Tmrt, mPET, and UTCI varied along with the solar radiation and SVF. For activities that shift/extend the venue, such as running events, marches, or daily leisure walk for residents, more detailed information regarding thermal variations within short periods of time are required. The sensibility of (1) capturing rapid environmental changes from one site to another, and (2) transferring to thermal performance leading to discomfort would be really important concerns for selecting appropriate indicators.
Since thermal discomfort can be caused by many factors, such as air temperature, relative humidity, wind speed, metabolic rate, clothing type, solar radiation, SVF, etc., it would be helpful to use environmental monitoring data for obtaining the most current situations. Especially for activities with numerous participants involved, the more comprehensively the factors leading to discomfort are analyzed, the better we can understand and even respond in order to improve the situation. Concerning not only the environmental factors but also the biological differences under different activities and clothing types, by applying real time monitoring environmental data, mPET can be used to comprehensively assess the thermal conditions for different groups of people.
Air quality is a concern that cannot be ignored, because it can lead to both feelings of discomfort and threats to health, which certainly affect all kinds of outdoor activities, even those under comfortable thermal conditions. Furthermore, PM2.5 can be viewed as the main target worthy of concern, as particulates can pass the alveolus and run through the entire body via the blood vessels. Through long term analysis, the background air quality conditions in different months and seasons can be clearly seen, so it is suggested to reduce the frequency of having outdoor activities in winter in Kaohsiung to avoid exposure to unhealthy conditions. Otherwise, selecting locations (1) away from the busy traffic areas/hours and (2) with better diffusion conditions should be seriously considered.
With the application of real time monitoring environmental data, we can assess the current thermal condition among the routes in time for selected running events by applying predicted environmental data plus current SVF estimated at several sites. It is possible to simulate/demonstrate the thermal performance for a scheduled running route before the event. Based on the interaction between solar radiation and SVF by time, it is also possible for the organizers to plan a “most comfortable route” for participants in different activity intensities. Nevertheless, people from different regions react quite differently to the same thermal conditions, by having different thresholds for thermal discomfort; it is also practical to provide the “Discomfort Risk Assessment” for participants from different regions, of different ages, and of different activities in the near future.


