Article

A 422-Year Reconstruction of the Kaiken River Streamflow, Xinjiang, Northwest China

1
Key Laboratory of Tree-Ring Physical and Chemical Research of China Meteorological Administration/Key Laboratory of Tree-Ring Ecology of Xinjiang Uigur Autonomous Region, Institute of Desert Meteorology, China Meteorological Administration, Urumqi 830002, China
2
Yunnan Key Laboratory of International Rivers and Transboundary Eco-Security, Institute of International Rivers and Eco-Security, Yunnan University, Kunming 650031, China
*
Author to whom correspondence should be addressed.
Atmosphere 2020, 11(10), 1100; https://doi.org/10.3390/atmos11101100
Submission received: 5 October 2020 / Accepted: 11 October 2020 / Published: 14 October 2020
(This article belongs to the Special Issue Past Climate Reconstructed from Tree Rings)

Abstract

:
Our understanding of Central Asian historical streamflow variability is still limited because of short instrumental hydrologcial records. Based on tree-ring cores collected from three sampling sites in Kaiken River basin near Tien Shan, a regional tree-ring width chronology were developed. The correlation analysis showed that the runoff of Kaiken River from previous August to current June was significantly correlated with the regional chronology, and the high correlation coefficient was 0.661 (P < 0.01). Based on the regional chronology, the August-June runoff of Kaiken River has been reconstructed over the past 422 year, and it accounted for 43.7% of actual runoff variance during the common period 1983–2013. The reconstruction model is reliable, and the trend of observed and reconstructed data is relatively consistent. The results of multi-taper spectral analysis for the runoff reconstruction indicated some remarkable cycles for the past 422 years; the 11.5-year cycles correspond to the solar cycle and is found widely in runoff reconstructions in Central Asia. This may imply a solar influence on the hydroclimate variations of Tien Shan. The runoff reconstruction of Kaiken River compares well with runoff reconstructions the Urumqi River and Manas River, and implies that there is a common driving factor for the runoff in central Tien Shan, China. The analysis of linkages between climate variation and the runoff reconstruction of Kaiken River shows that there is a relationship between extremes in runoff variation and abnormal atmospheric circulations. Our 422-year steamflow reconstruction provides long-term perspective on current and 20th century hydrological events in central Tien Shan, is useful for aids sustainable water management and addresses regional climate change challenges.

1. Introduction

Economic development, as well as urbanization and the increasing population, raises doubts over the supply of water resources to meet the growing needs of society in semiarid and arid areas around the world [1,2,3,4]. Understanding of temporal-spatial hydrological variations is thus vital to improve our knowledge about water resources in drylands [5,6,7,8]. However, instrumental hydrological records over Central Asia are short and sparse in spatial distribution, especially in Tien Shan, China. High-resolution hydrology proxy records, such as history records and tree rings, are needed to interpret the Central Asian hydrological changes. The Kaiken River basin is located in the northern slope of Tien Shan, Central Asia. It originates from the Bogda peak in central Tien Shan. It is the largest river in Qitai, Xinjiang. The average annual runoff of Kaiken River is 1.6 × 10⁸ m3. As a basic of national commodity grain, Qitai plays an important role in Xinjiang’s food security. During the historical period, the Kaiken River is always the most important water source for irrigation for the Qitai Oasis agriculture, and until 2004, the irrigation water still accounted for more than 97.6% of the utilization of water resources, which affected on agricultural and animal husbandry production in Qitai [9]. At the same time, the Kaiken River and the neighboring Manas and Urumqi rivers are the main sources of fresh water for the Central Asian largest urban agglomeration, included Shihezi and Urumqi. Adequate runoff into the oasis cities is important to the social and economic wellbeing of the local people. Thus, to address the challenge of climate change, especially drought, the prudent water resource planning requires the reliable hydrological knowledge on different time-scales.
Tree rings are playing an increasingly vital role in revealing past climatic and environmental change [10,11,12,13,14,15]. To date, there are tree-ring based runoff reconstructions based on for Central Asia [16,17,18,19,20,21,22,23], and the tree-ring widths of Picea schrenkiana from Tien Shan are potentially sensitive to hydrological changes [16,24]. Nevertheless, runoff reconstructions are still insufficient in the vast areas of Central Asia for interpreting the recent hydrological variability in a long-term perspective. However, it is still an open question whether the long-term runoff variation in different areas of Tien Shan is synchronous. In this research, we developed a new regional tree-ring width chronology of Picea schrenkiana from the Kaiken River basin, central Tien Shan, China. We analyzed the relationships between the radial growth of Picea schrenkiana and hydroclimate factors. Based on tree-ring width data, we developed August–June runoff reconstruction for Kaiken River over the period 1592–2013 CE. This new runoff record is compared with existing runoff reconstructions from other parts of central Tien Shan. Such long-term runoff records have important socioeconomic implications for agriculture and the animal husbandry of Tien Shan, China.

2. Materials and Methods

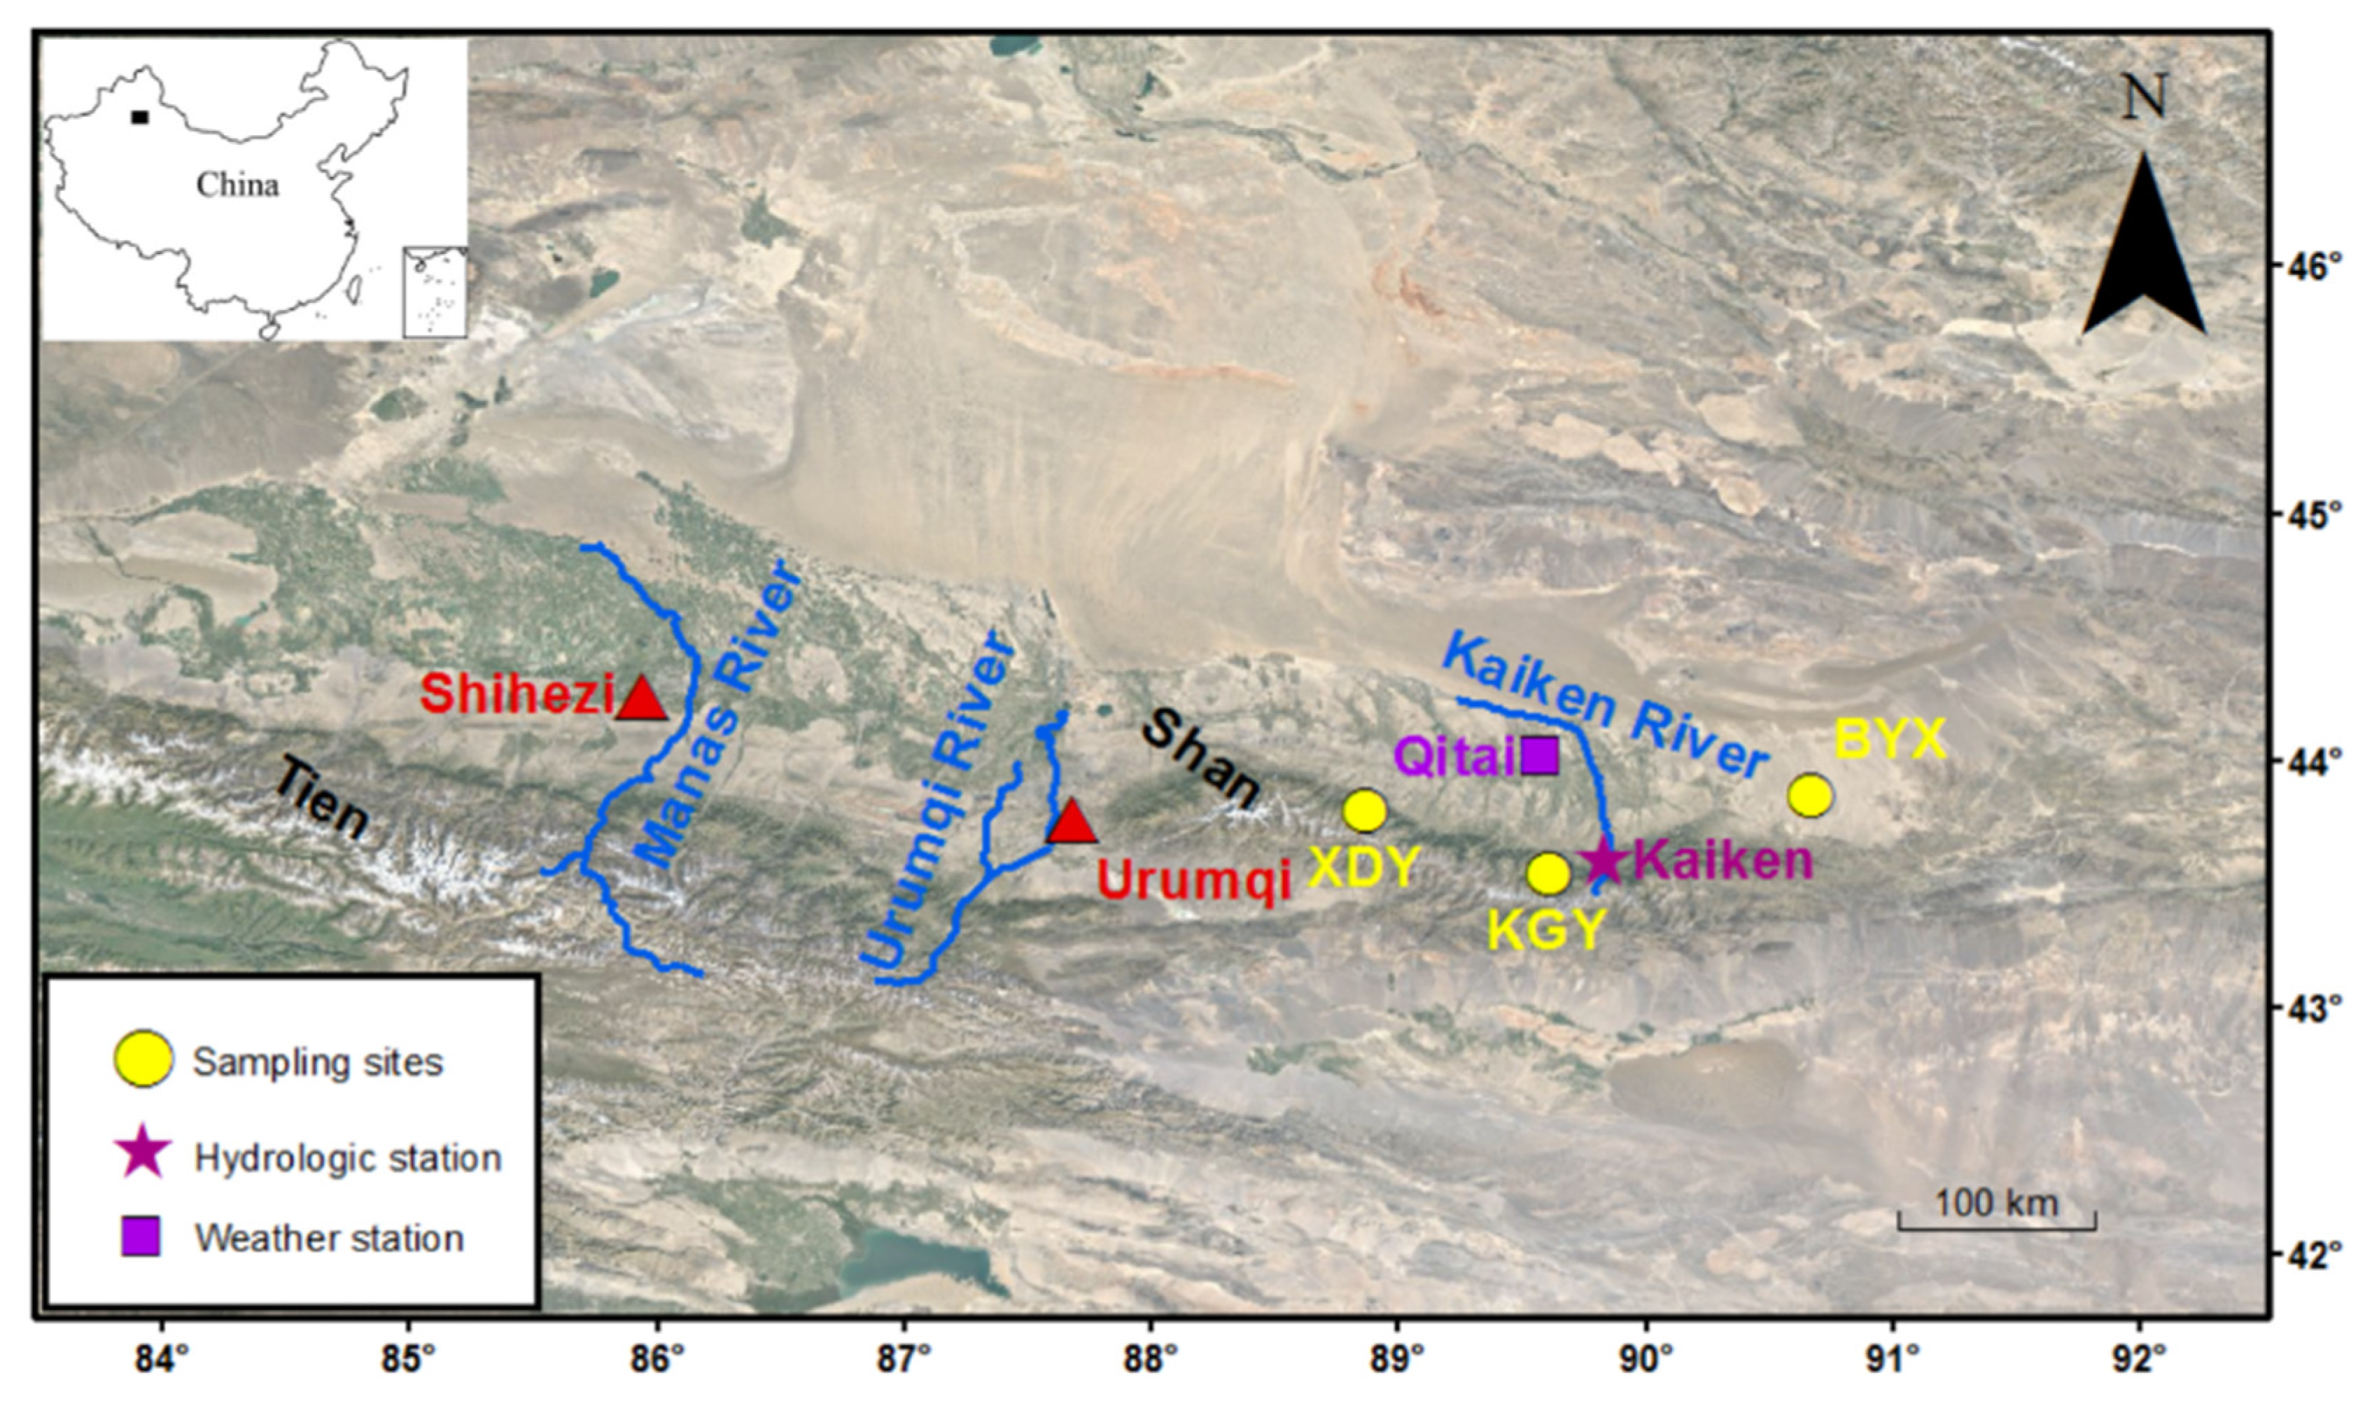
2.1. Study Area Description

The Kaiken River is located at the southern margin of Zhungeer Basin in Qitai, Xinjiang, and originated from the Bogda peak in central Tien Shan, China. With a drainage area of 280 km2 and a length of 64 km. The tree-ring width data that formed the base for the runoff reconstruction came from central Tien Shan which are situated between 43°30′ to 44° N, 88°30′ to 90°50′ E (Figure 1). The sampling sites information is shown in Table 1. The dominant tree species in central Tien Shan is Schrenk spruce (Picea schrenkiana). At sampling sites, spruce trees grew in open stands with thin and rocky soil in the understory of the forests.

2.2. Tree-Ring Chronology

All tree-ring samples were selected from isolated living trees with relatively homogeneous environment. Tree-ring samples were chosen from three different sites in central Tien Shan in August 2008 and July 2014. Two cores per tree were obtained from the relatively old spruce trees at breast height. Tree-ring sampling activities were mainly concentrated in the spruce forests to arrange 1500 to 2500 m a.l.s. Three different sampling sites are hardly affected by human activities and provided 144 cores from 72 trees in total. After dried, mounted on wooden holders, and polished with 400 grit sandpaper to enhance tree-ring bound, annual ring widths of all cores were measured by a manual Henson micrometer (LINTAB™, Rinntech, Heidelberg, Germany) with a 0.01 mm precision. The computer program COFECHA [25,26] was applied to check cross-dated results of tree-ring series. The regional tree-ring width chronology (STD) were developed by the software ARSTAN. Due to the similar growth environment and average high correlation with the master series (r = 0.59), detrended data from all cores were combined into a regional chronology after cross-dated again. Each individual ring-width series was detrended by fitting a negative exponential curve. More than the 0.85 threshold value of the express population signal (EPS) is considered acceptable of chronology quality [27].

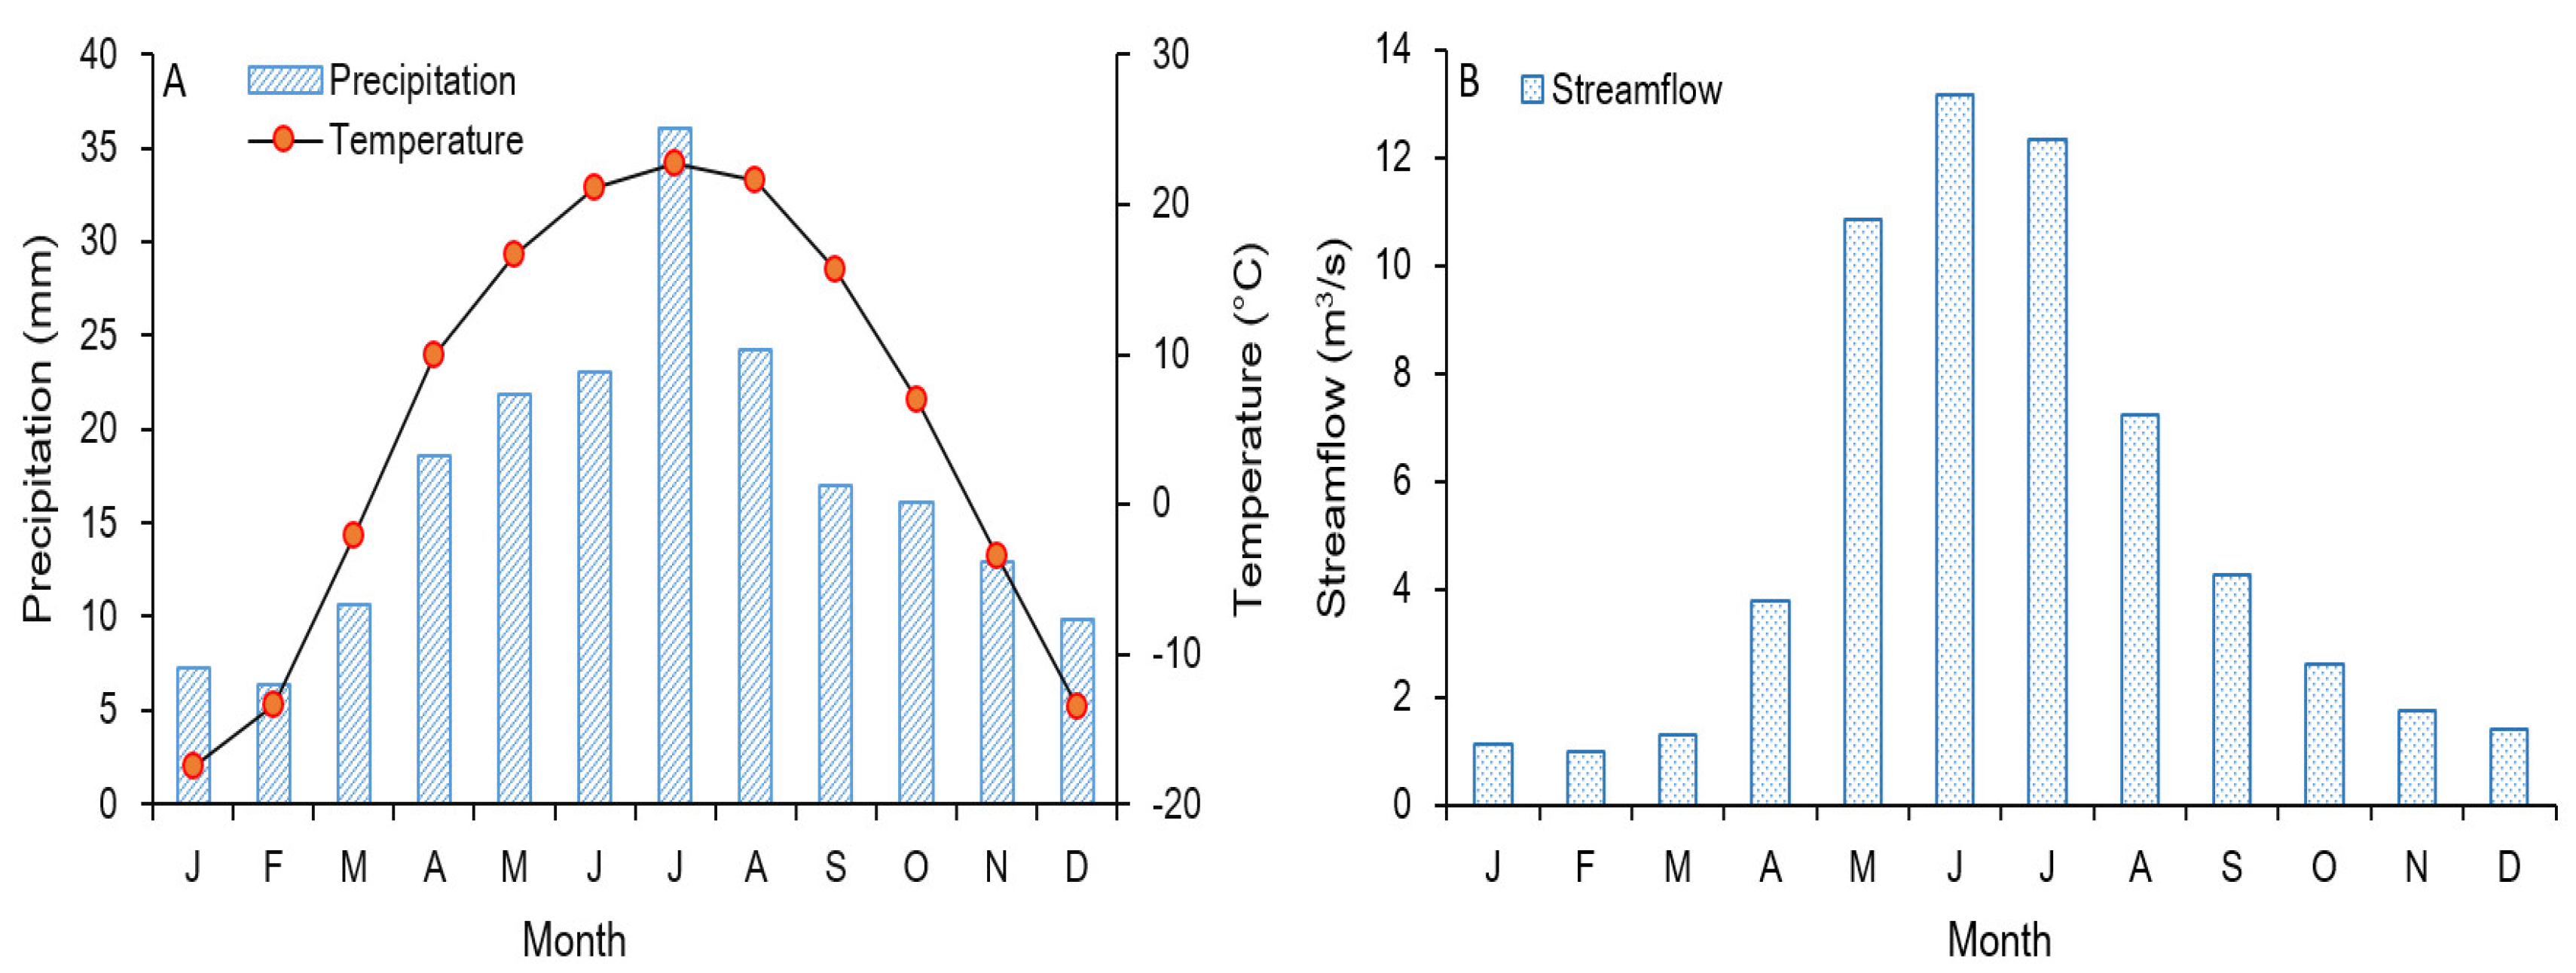
2.3. Hydroclimate Data

Several observed data were used in this research, including runoff data from the Kaiken River (89°50′ E, 43°36′ N, 1520 m a.s.l.) and regional climate data (Qitai, 89°27′ E, 44°03′ N, 1061.2 m a.s.l.) (Figure 1). The monthly total precipitation and mean temperature from 1983 to 2013 at the Qitai meteorological station were showed in Figure 2A. The annual total precipitation and mean temperature are 296.8 mm and 5.4 °C. July is the hottest and wettest month (mean temperature 22.8°C and total precipitation 36 mm) while January is the coldest month (mean temperature −17.4°C). The mean annual runoff of the Kaiken River is 5.1 m3/s during the period 1983–2013. Figure 2B shows monthly mean runoff of the Kaiken River from 1983 to 2013. The seasonal distributions of runoff and precipitation and runoff is very different (Figure 2B). There is only one peak (in July) in the monthly precipitation distribution, while there are one peak with high runoff months (May–July). The runoff peak is directly linked to the meltwater input from snowpack of Tien Shan during the warm season.

2.4. Statistical Analysis

To understand historical runoff changes, correlation analysis was applied to identify the response of tree-ring widths to hydroclimate. Monthly total precipitation, monthly mean runoff and monthly mean temperature were used for correlation analysis, over a span of 14 months from prior August to current September. A linear regression model was computed between the predictors (tree-ring width series) and the predict runoff for the calibration period 1983–2013. Because the actual runoff record is relatively short, the ‘leave-one-out’ method was used to assess the reliability of the mode [28]. Verification statistical parameters used included the reduction of error (RE), the sign test (ST), sign test of the first difference (FST) and the product means test (PMT) [29].

3. Results and Discussion

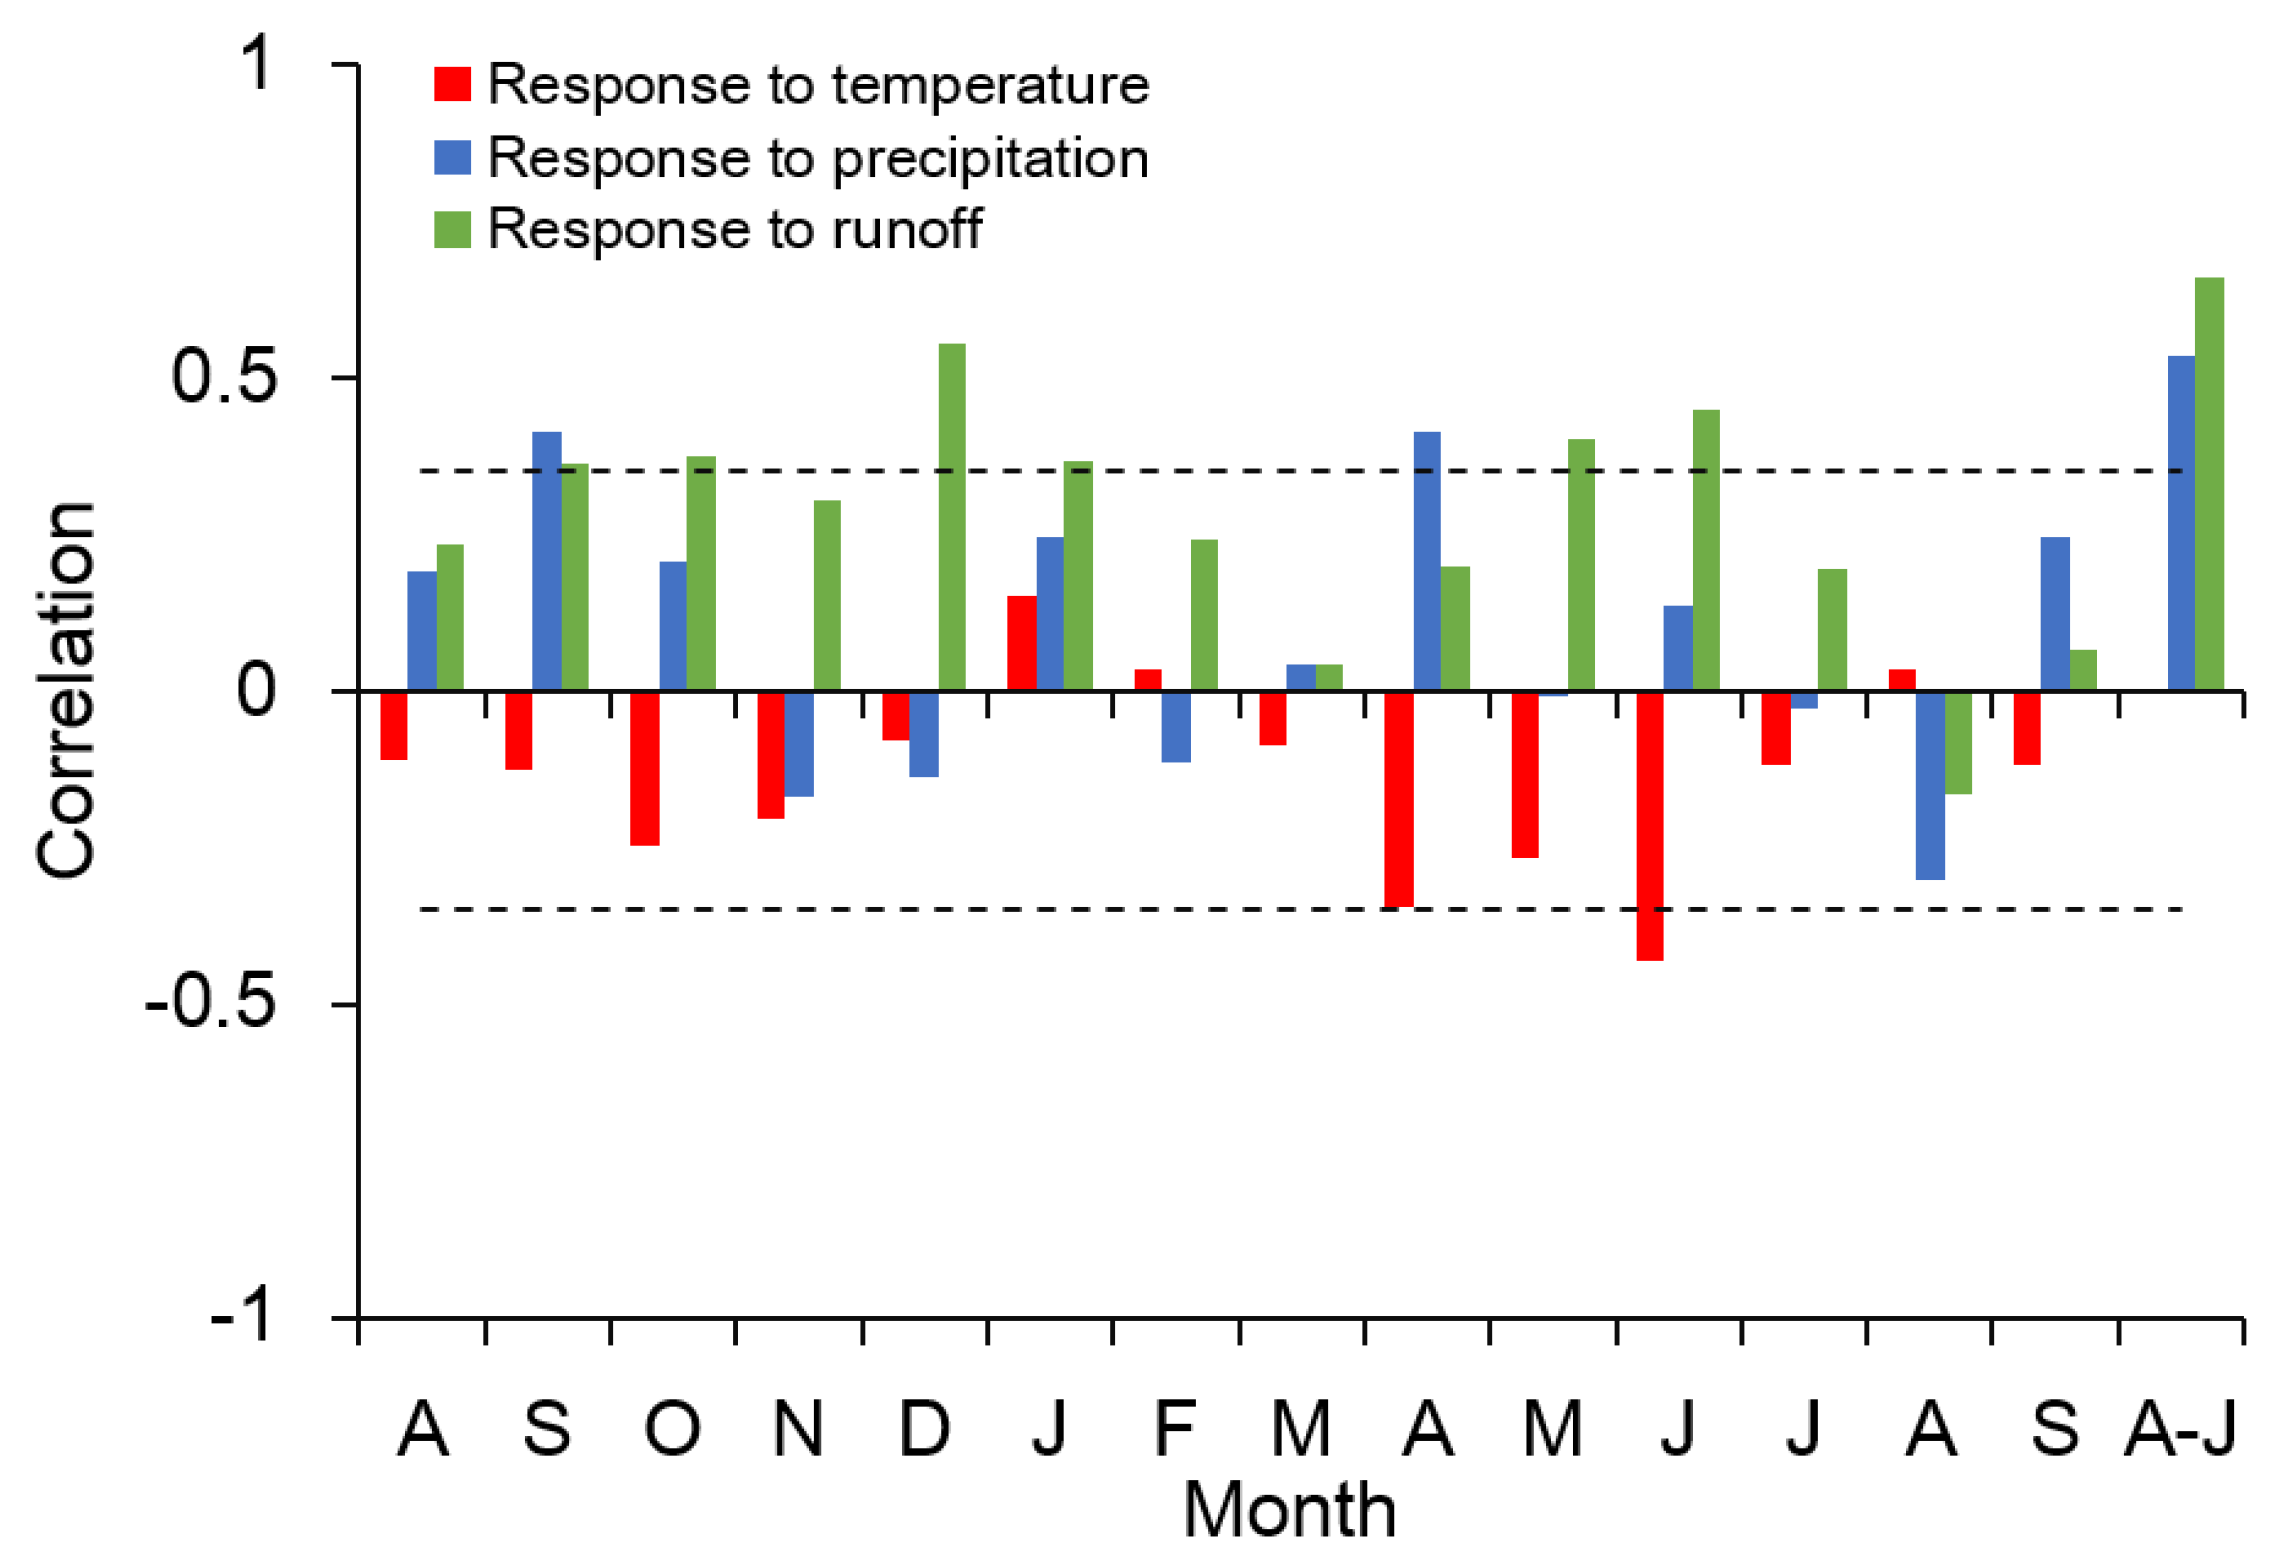
3.1. Hydroclimate-Growth Analysis

Figure 3 shows the correlations between tree-ring width series and monthly total precipitation from prior August to current September, and indicates significant positive correlations (p < 0.05) in prior September and current April. Based on various multi-month combination, the highest correlation (r = 0.53, p < 0.01) was found between tree-ring width series and total August–June precipitation. Significant positive correlations (p < 0.05) between monthly runoff and tree-ring width series were occur at prior September, October and December, and current January, May and June. The highest correlation between tree-ring width series and seasonal runoff combinations were 0.661 (p < 0.01) for prior August to current June. Correlation between August–June runoff and precipitation was 0.55 (p < 0.01) for 1983 to 2013. Thus, precipitation has significantly influences on the growth of spruce tree and the runoff variations in the Kaiken River basin. In addition, correlation coefficients between tree-ring width series and monthly mean temperature are relatively weak, and only June temperature has significantly influence on tree growth.
Tree-ring width series and runoff correlate to variations of August–June precipitation and June temperature, revealing that corresponding signals from climate factors were contained within tree-ring records and runoff. The strong link between runoff and tree-ring width series supports this conclusion. Recognizing this interlinkage, it was assumed that the physiological linkage between climate factors and tree-ring growth provides some useful explanations for revealing the linkage between the climate-integrated variations of tree-ring growth and the runoff [30]. Our research has showed the physiological linkage between tree-ring growth and fluctuations in August–June precipitation and June temperatures. Seasonal distribution of runoff (with May–July peak) and the significant positive correlation detected between August–June precipitation and tree-ring growth/runoff in this study likely reflect high precipitation, especially for the winter snowpack synchronized with above mean runoff years. Good moisture conditions at the end of the previous growth season and heavy snow in winter can provide enough water for the next year’s tree growth, and more water for high mountains and spruce forests is converted into runoff [31,32,33,34]. Thus, high August–June precipitation is indicative of both increased runoff and luxuriant spruce tree growth. High June temperatures enhance evapotranspiration and decrease soil moisture content, and lead to reduced earlywood growth and runoff [35,36].

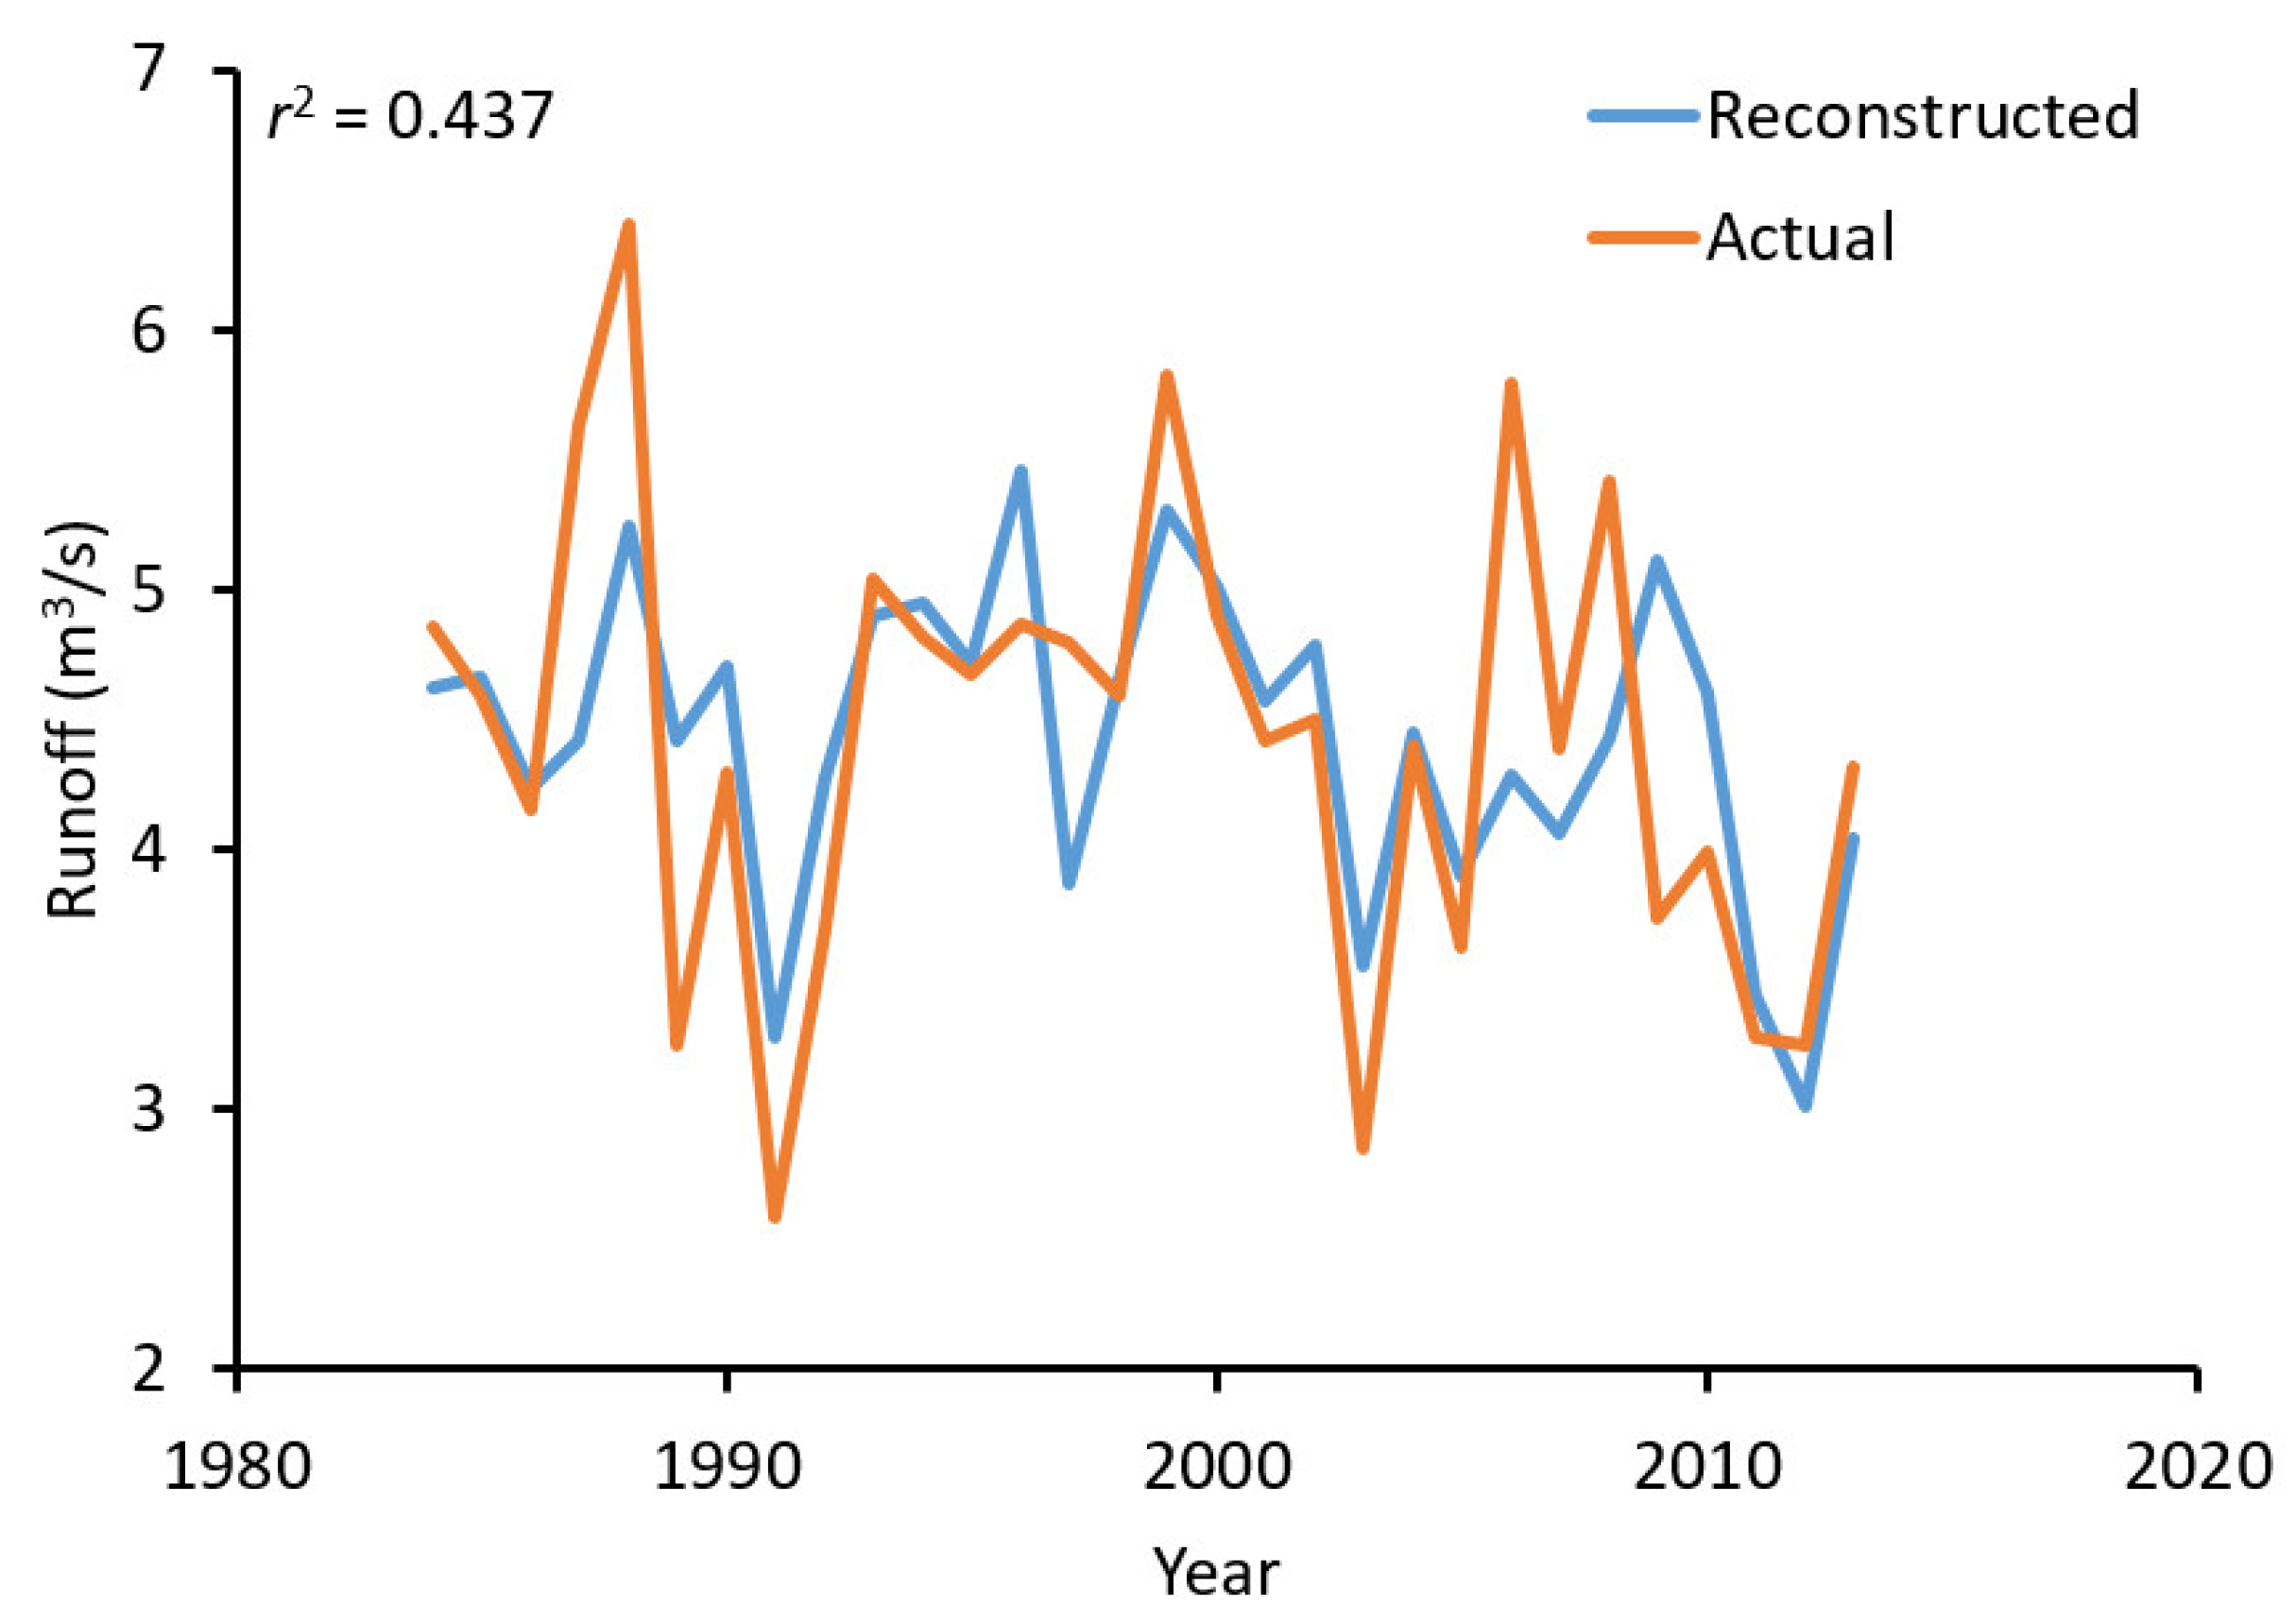
3.2. Runoff Reconstruction of the Kaiken River

Based on the above correlation analysis results, a linear regression model was developed to indicate the August-June runoff variations of the Kaiken River. The transfer model was designed as follows:
Y = 4.411X − 0.027
The dependent variable Y is August–June runoff of the Kaiken River, and the independent variable X is the regional tree-ring chronology. During the calibration period 1983–2013, the regional tree-ring chronology accounts for 43.7% of total variance of the actual runoff data (41.7% after adjustment for loss of degrees of freedom). Figure 4 shows a comparison of actual and reconstructed August–June runoff of the Kaiken River, and reveals that the reconstructed runoff is consistent with the actual runoff during the calibration period 1983–2013. The results of reduction of error (RE) the sign test (ST), sign test of the first difference (FST) and product mean test (PMT) are showed in Table 2.
All evaluative statistics exceed the 0.01 confidence level, and demonstrate that the credibility of regression model. We further compared the runoff reconstruction with drought reconstruction of eastern Tien Shan [8], and high correlation (r = 0.76, p < 0.01) as found between the series during the common period 1725–2013. Therefore, based on this model and the 0.85 EPS threshold value, the runoff variations of the Kaiken River have been reconstructed for the period 1592–2013 CE (Figure 5).

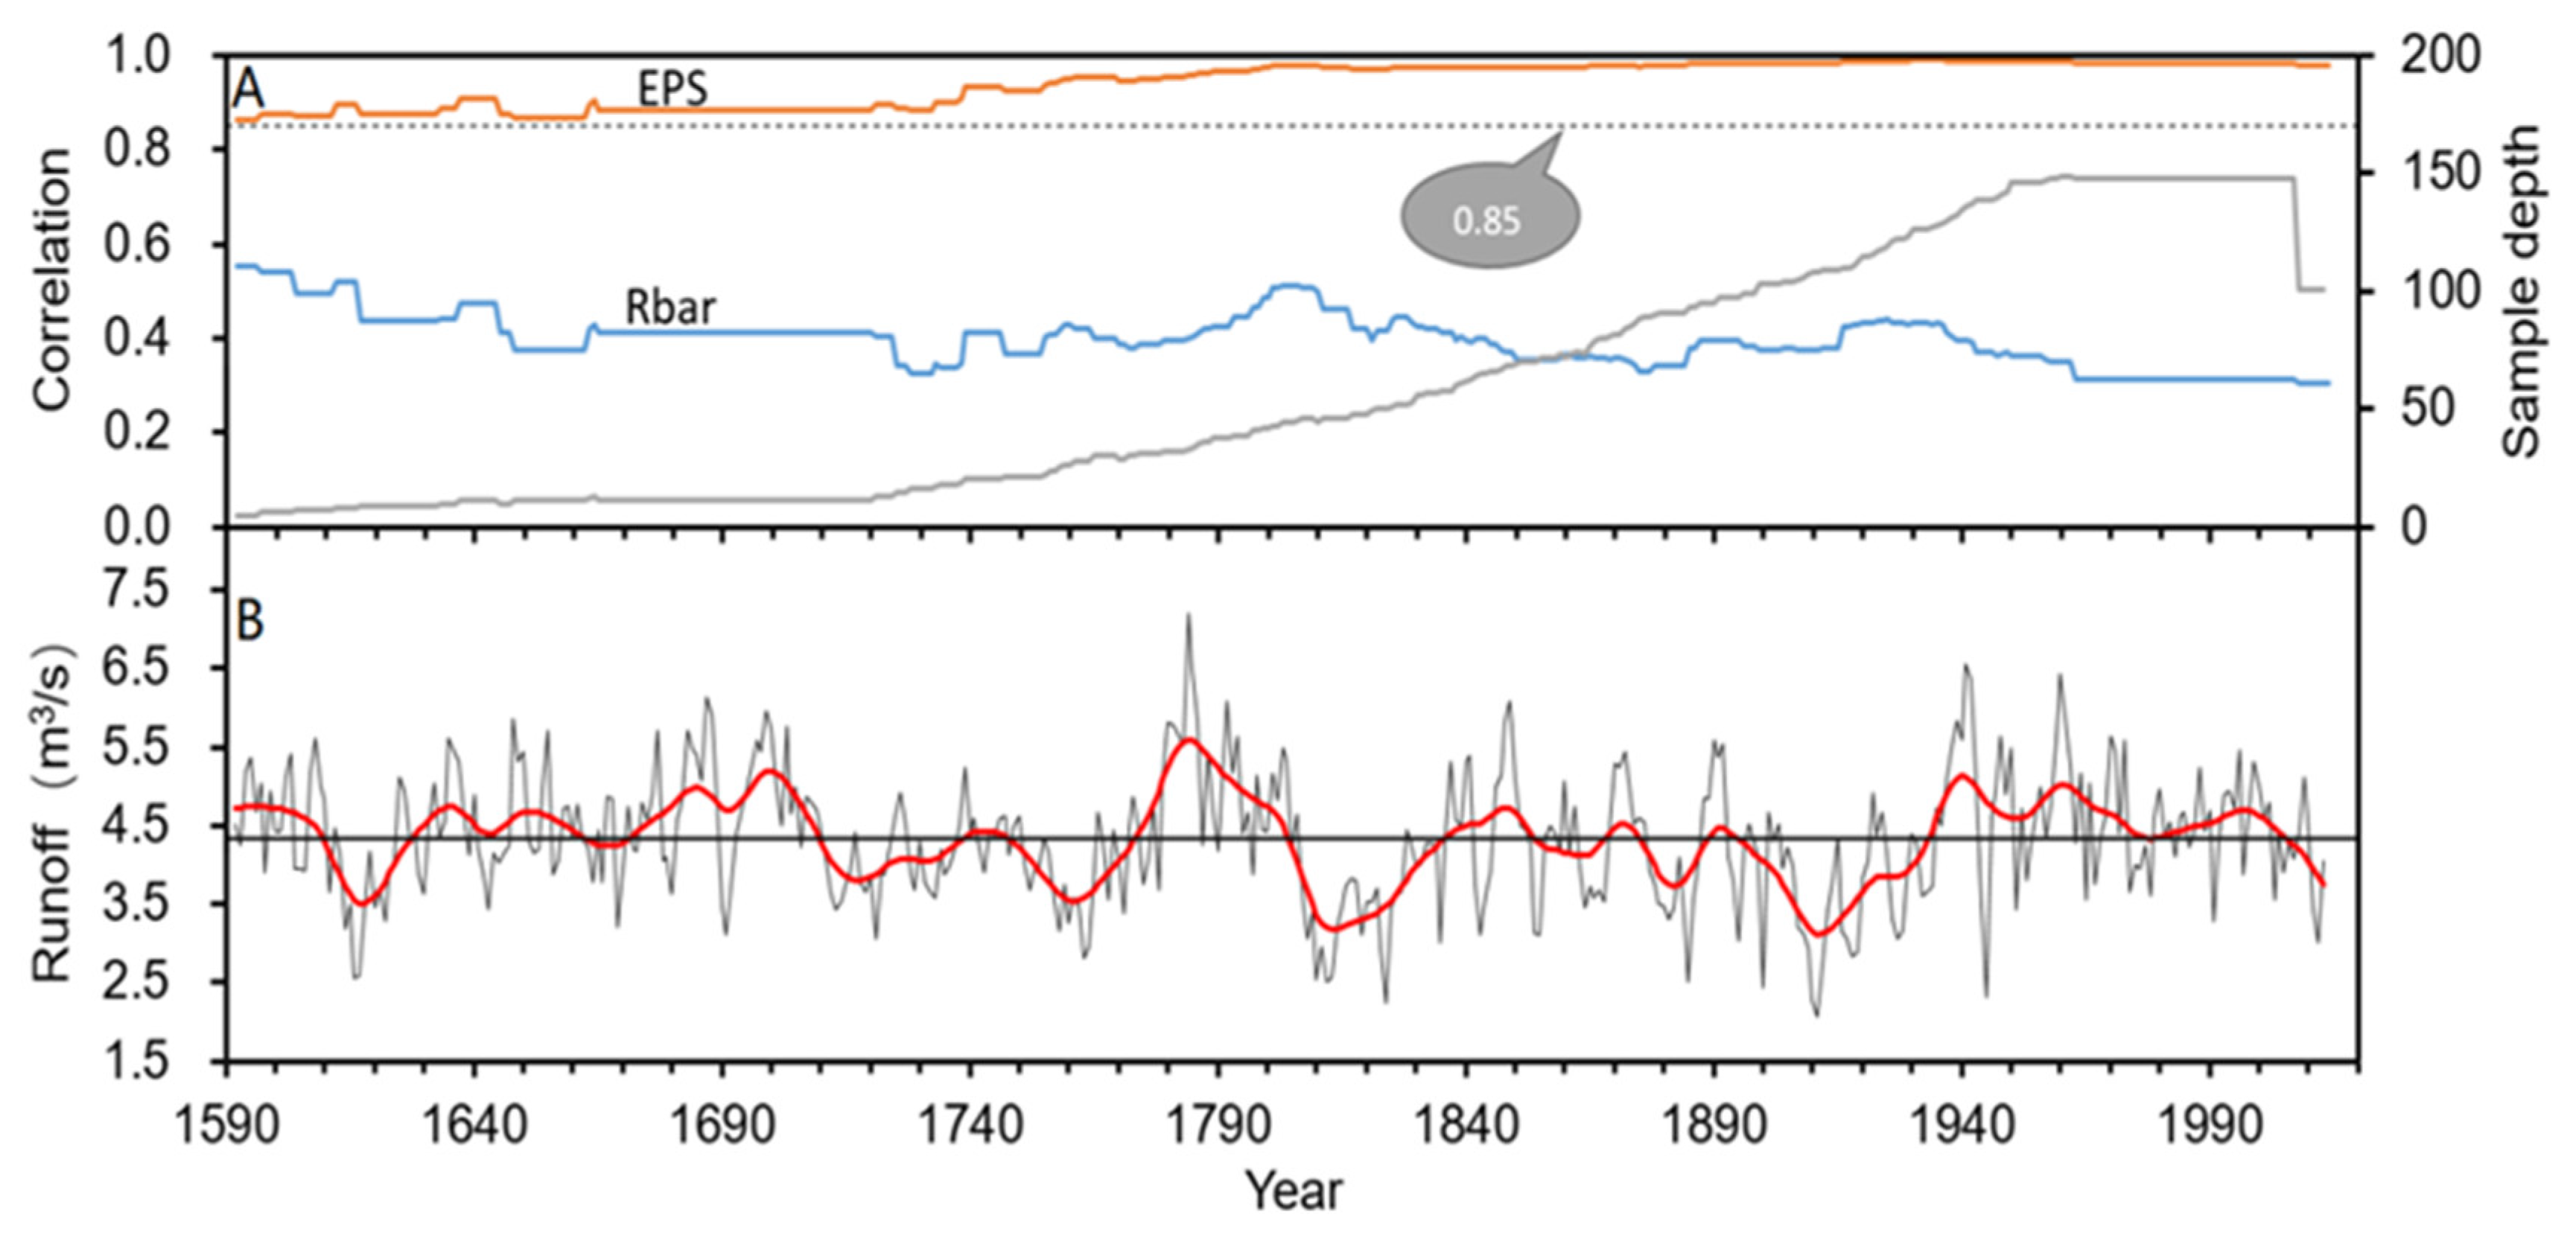
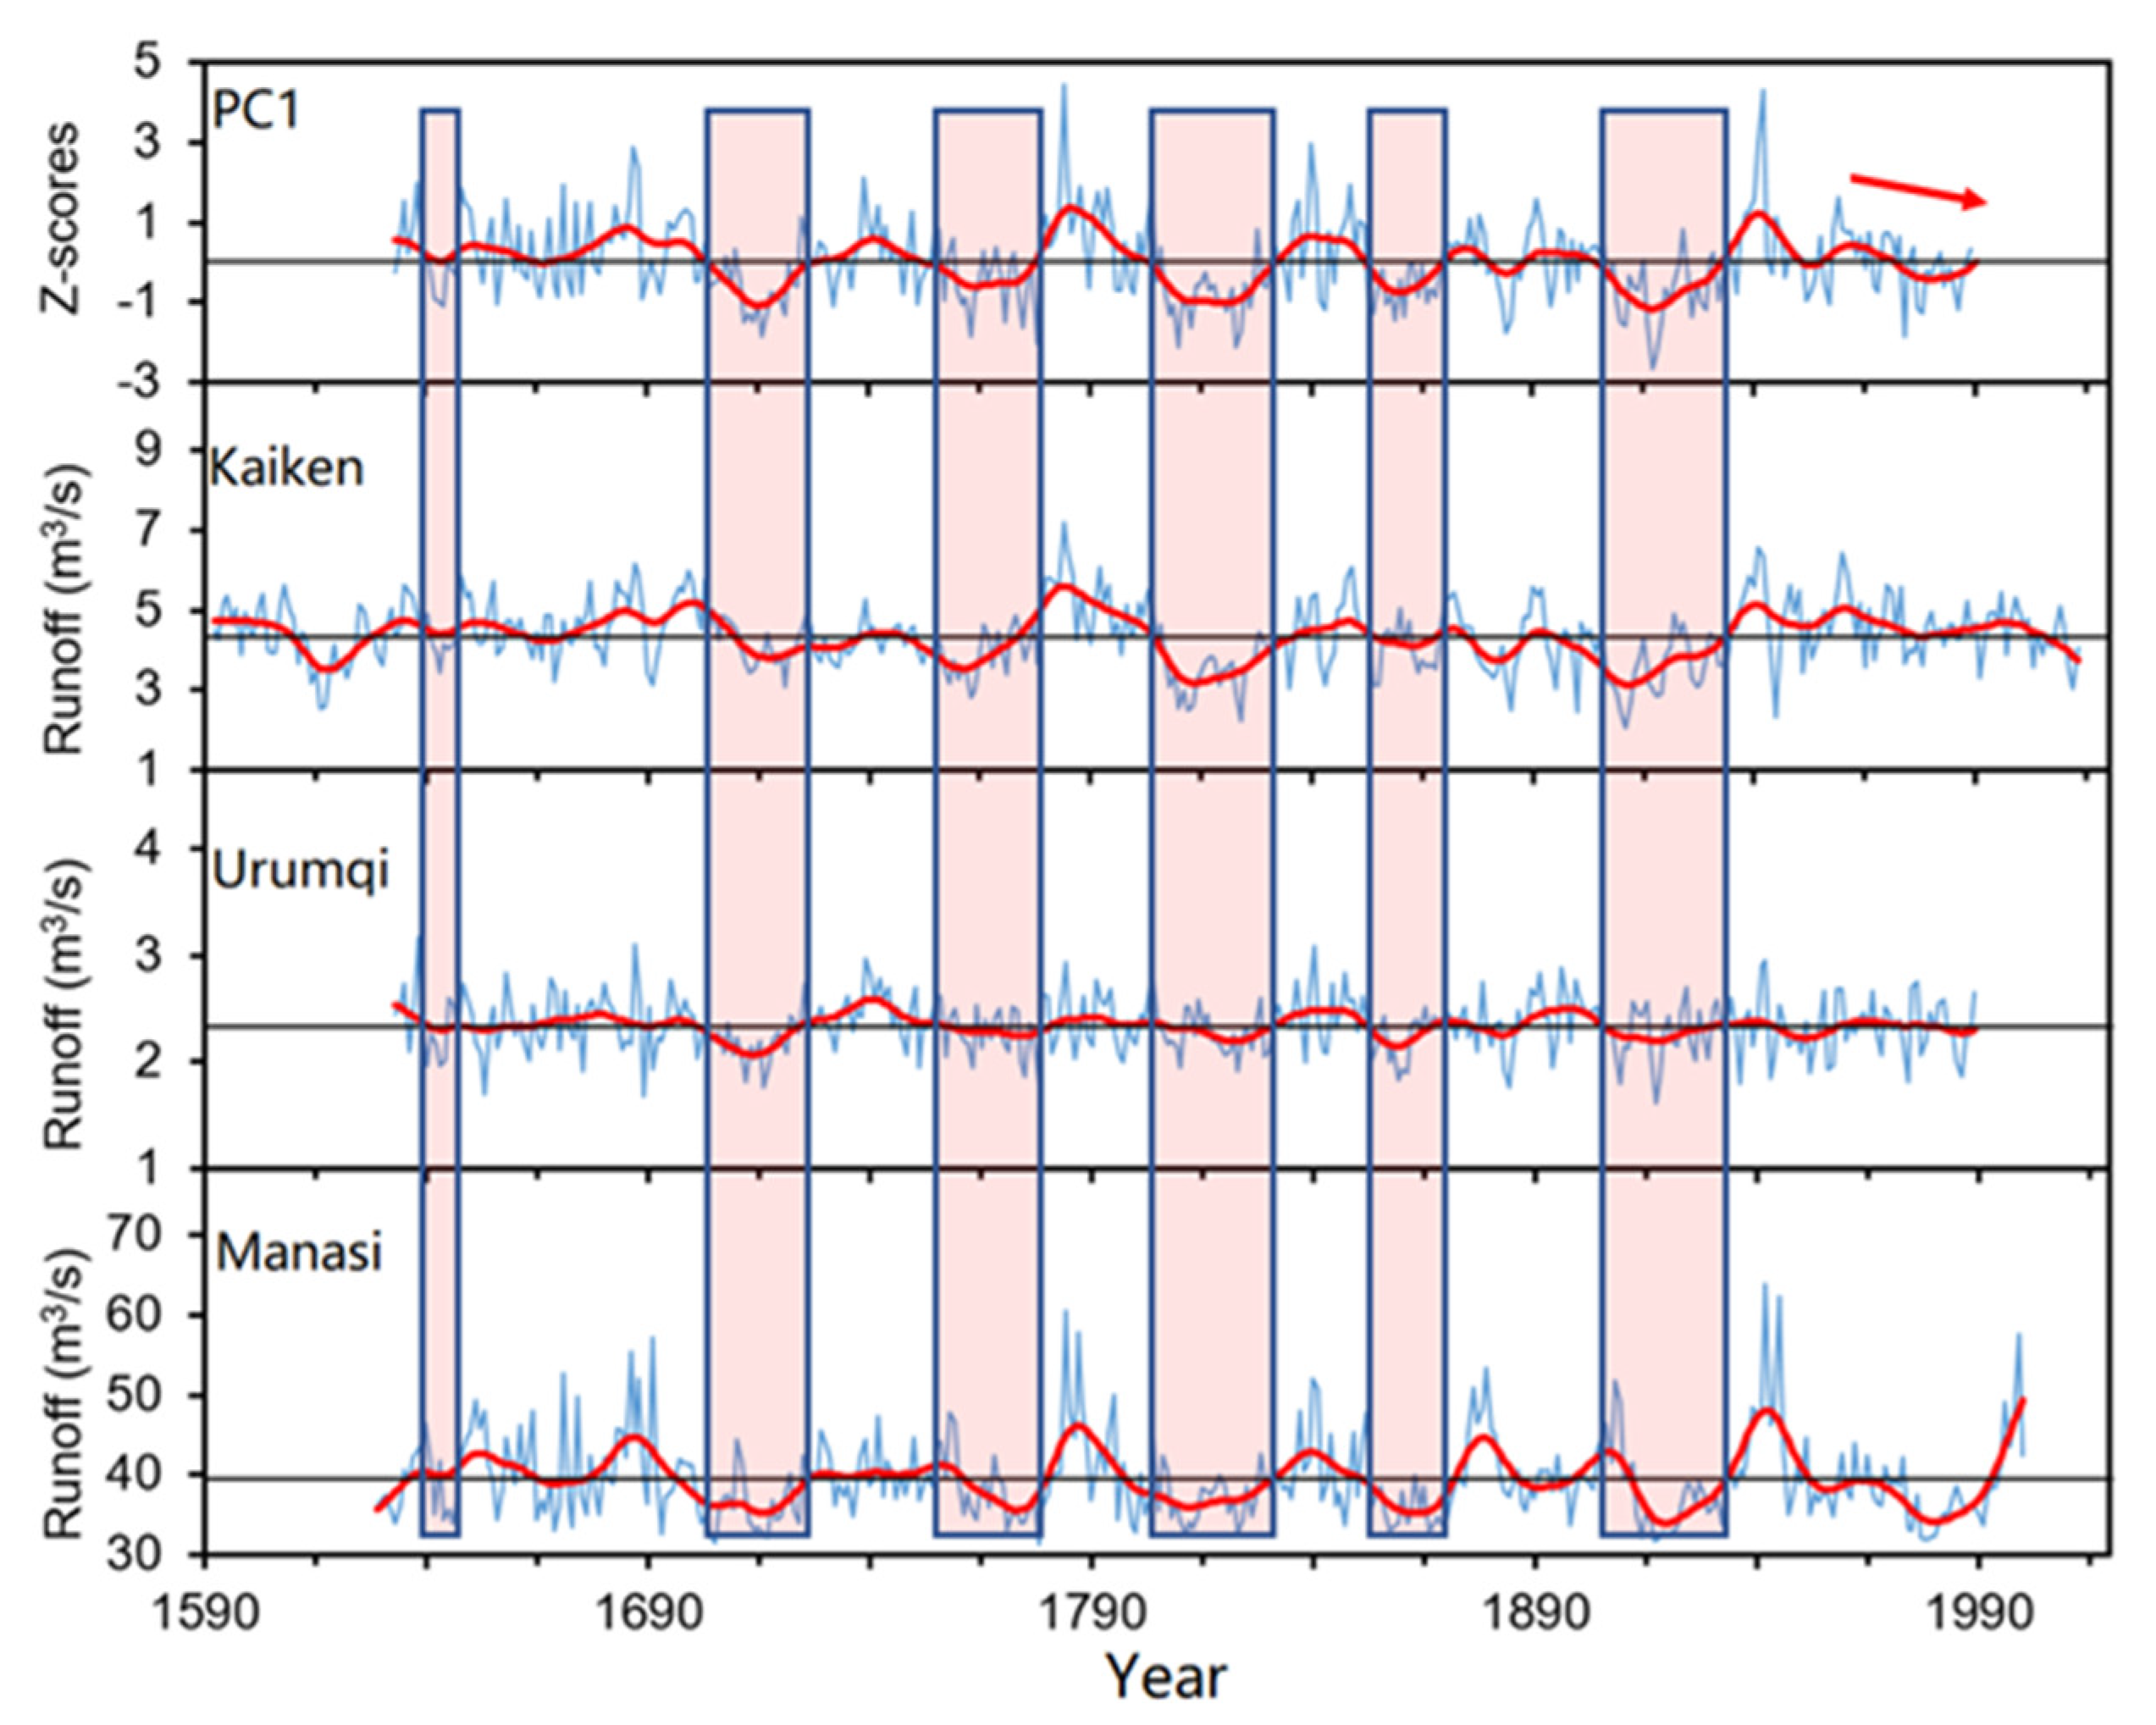
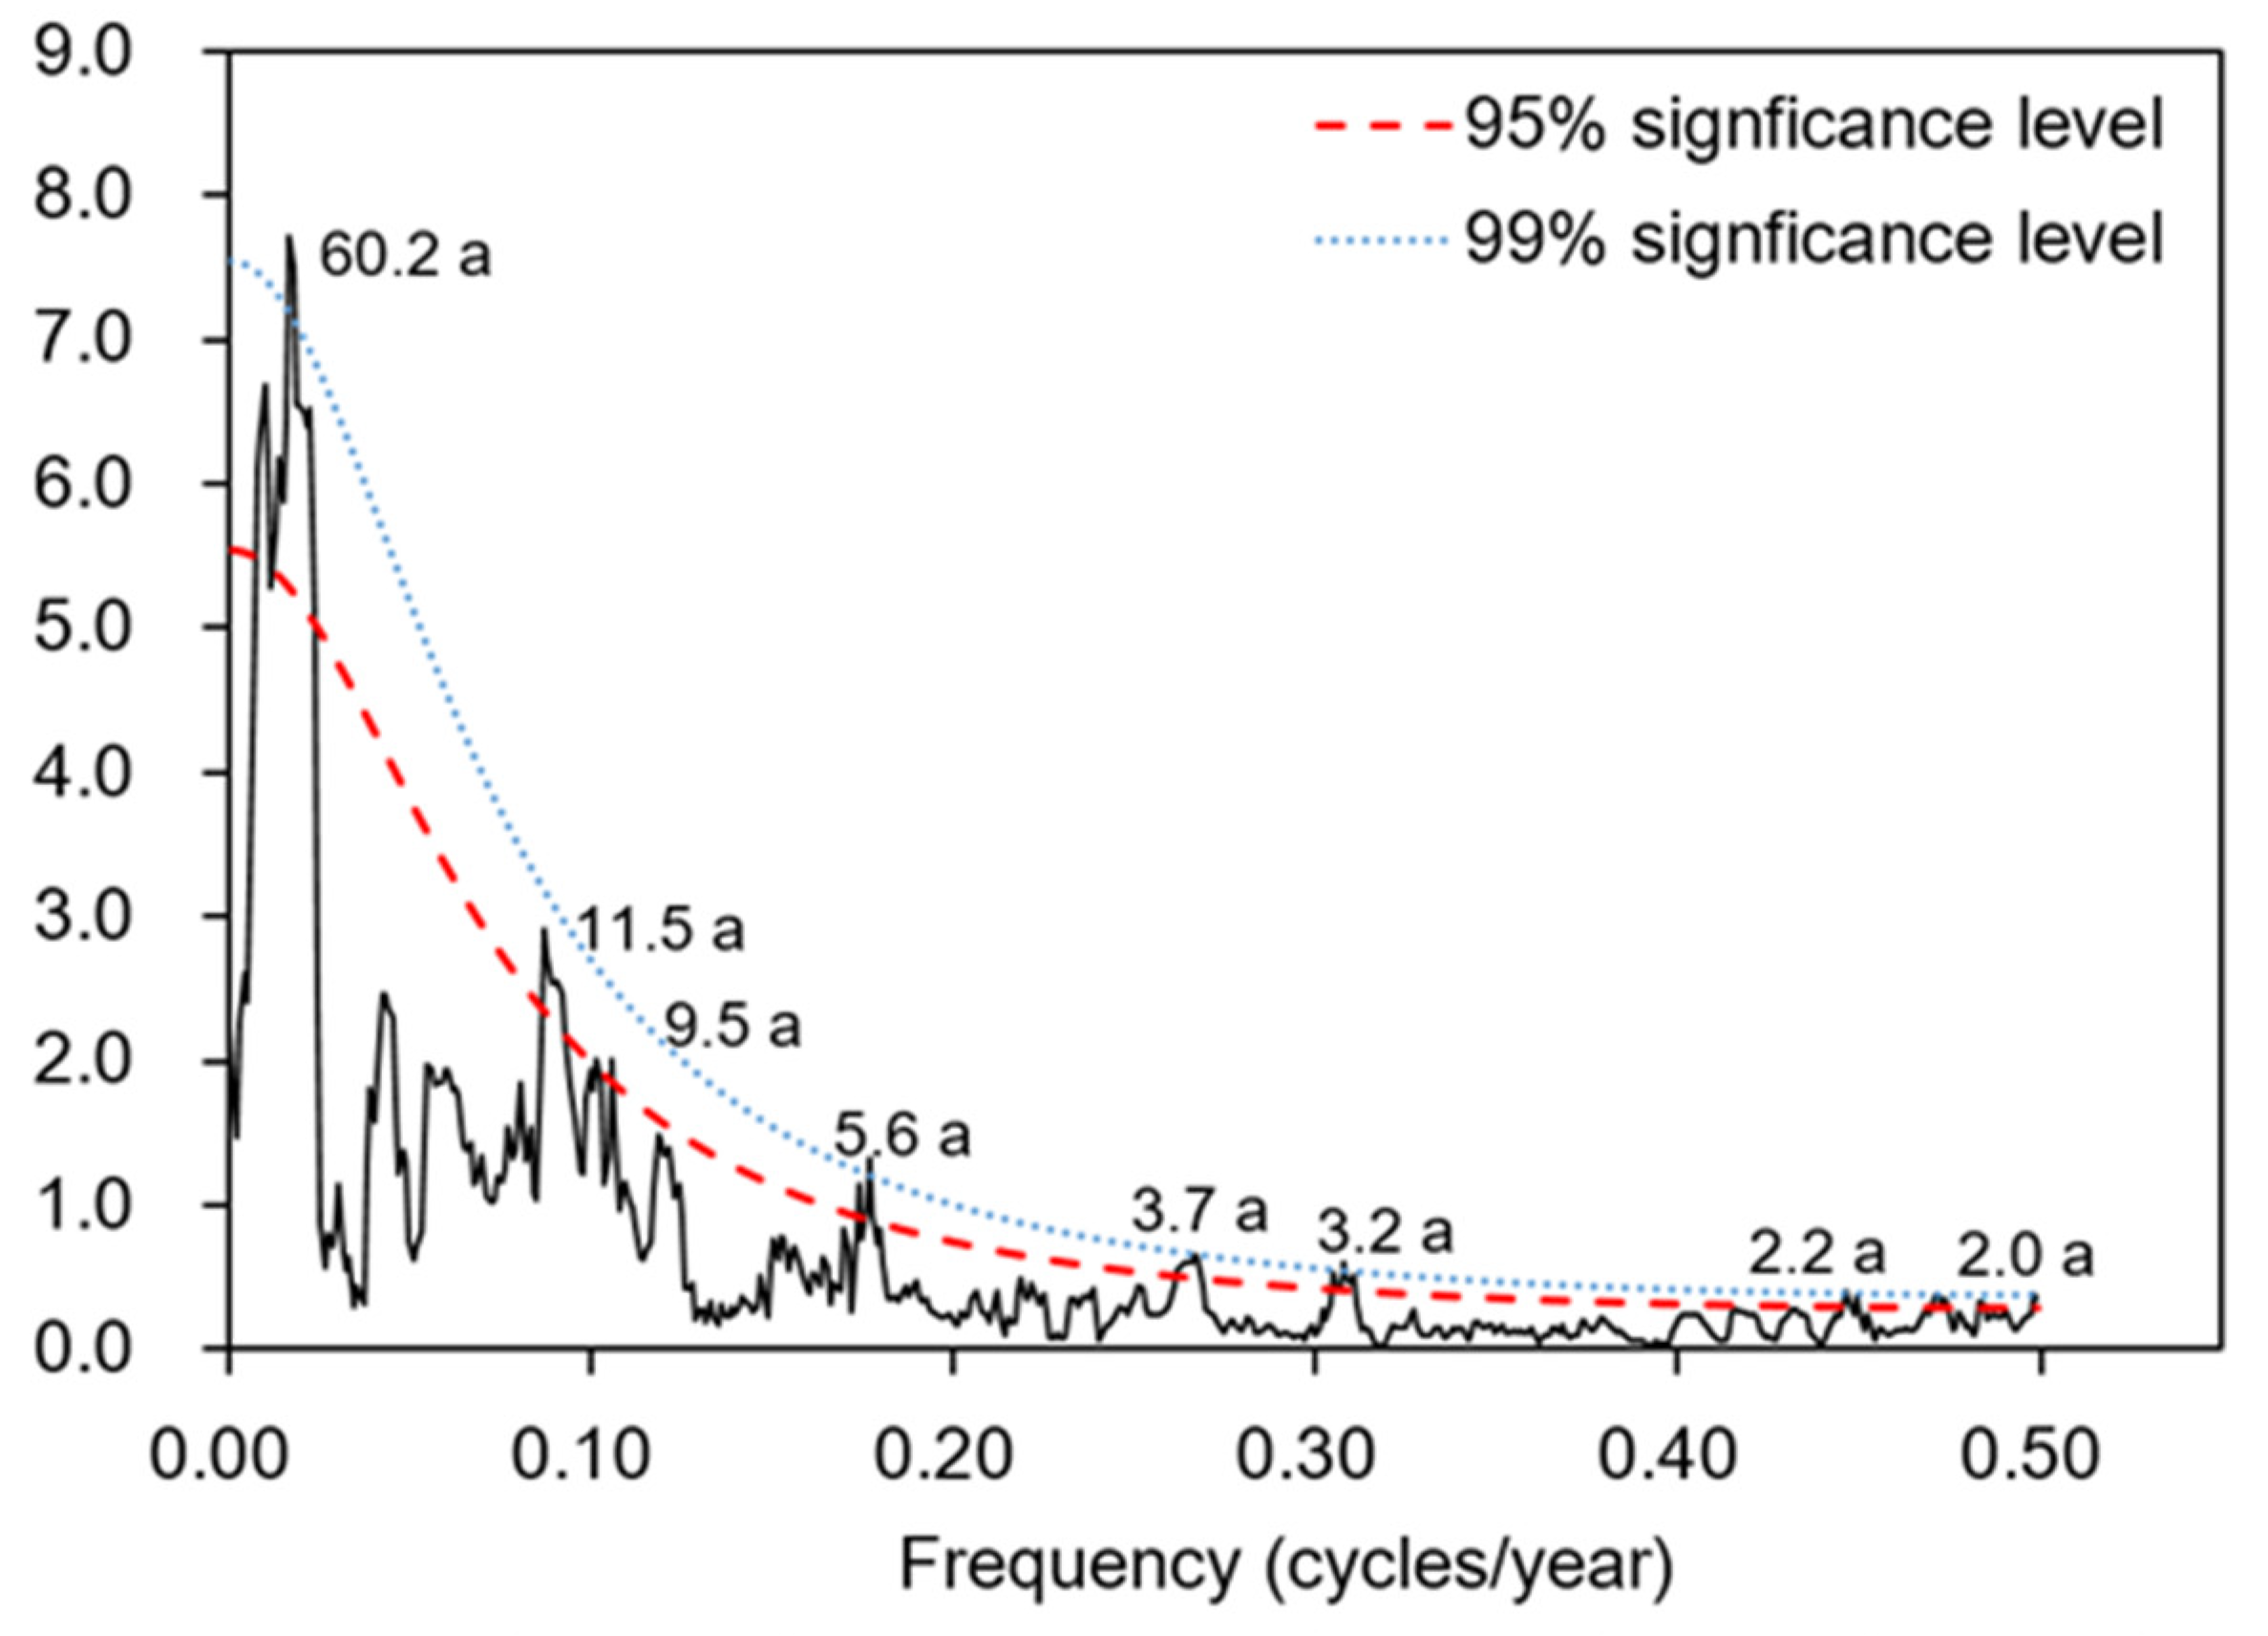
3.3. The Characteristics of the Runoff Reconstruction

The August–June runoff reconstruction of the Kaiken River spanned 422 years; the average runoff is 4.33 m3/s and the standard deviation (σ) is 0.82 m3/s. The thick line is the 21-year low-pass filtered values. The reconstruction series includes seven high runoff periods (the 21-year low-pass values > 4.33 m3/s continuously for more than 10 years), including 1592 to 1609 CE, 1628 to 1662 CE, 1672 to 1709 CE, 1739–1748 CE, 1774–1804 CE, 1836–1853 CE, 1934-2005 CE, and four dry periods (the 21-year low-pass values < 4.33 m3/s continuously for more than 10 years), including 1610 to 1627 CE, 1663 to 1671 CE, 1710 to 1738 CE, 1749–1773 CE, 1805–1835 CE, 1854–1868 CE, 1876–1888 CE, 1895–1933 CE (Figure 5B).
Several tree-ring based runoff reconstructions for surrounding river basin have recently been developed. Yuan et al. [16] developed an October–September runoff reconstruction since 1629 CE for the Manasi River, capturing 51% of the total variance in the calibration period (1956–2000). Yuan et al. [28] developed 15 Schrenk spruce tree-ring width chronologies and reconstructed annual (January–December) runoff of the Urumqi River for the period 1633–1989. The calibration model explained 69.4% of the observed runoff variances for the period from 1958 to 1989. Correlations between the Kaiken reconstruction and other runoff reconstructions by Yuan et al. [16,37], computed over the common periods, are 0.25 and 0.33, respectively, and increase to 0.38 and 0.43 after 21-year low-pass filtering. Our runoff reconstruction reflects similar high/low runoff intervals in the neighboring areas as runoff reconstructions (Figure 6). As showed by first principal component (PC1), regional low runoff conditions during the 1641–1644, 1704–1727, 1753–1777, 1804–1832, 1853–1869 and 1905–1932 found in this study occurred synchronously in the Urumqi and Manasi River basin. The common runoff signals found in the three runoff reconstructions suggest that our reconstruction represents broad-scale regional runoff variations. The low runoff period 1641–1644 and 1753–1777 is also two well-documented historical droughts the Ming Dynasty drought [38] and the Strange Parallels drought [39], and demonstrated that large-scale drought extreme events in Central and eastern Asia can effectively affect the runoff variation of arid areas in Asian inland. Many studies also reported that the 1917–1919 drought was most severe [40,41,42]. Of particular interest is the downward trend during the 1950s–2010s. Although the regional climate is still warm and wet [43], evaporation increases with the rise in temperatures lead to the decline of runoff, especially in the eastern Xinjiang and Mongolia [18,44,45].
Multi-taper method spectral analysis [46] was employed to reveal the characteristics of the runoff variation of the Kaiken in the frequency domain. The analysis over the range of our runoff reconstruction indicated low- and high-frequency periodicities (Figure 7). The low-frequency (60.2 years) and high-frequency peaks (5.6, 3.2, and 2.2 years) exceed the 0.01 confidence level based on a red noise null continuum. Other significant high-frequency periodicities were found at 11.5 year, 9.5 year, 3.7 year, and 2.0 year (95%) (Figure 7).
The August–June runoff reconstruction of the Kaiken River presented in this article are characterized by cyclical fluctuations of above and below mean runoff. The 11.5-year cycle resembles other findings in neighboring areas and implies the impact of solar activity on Central Asian runoff there [17,18,21]. The appearance of these low and high frequency cycles (60.2, 5.6, 3.7, 3.2, 2.2, and 2.0 years) suggests that the oscillations of the ocean-atmosphere system have impacted on the hydrologic cycle of the Kaiken River basin for the past 422 years, such as North Atlantic Oscillation (NAO) and Arctic Oscillation (AO) [44,47,48]. Over the historical period, runoff reconstruction for the Kaiken River show significant correlation with the January–June NAO index (r = −0.23, p < 0.01) and the January–February AO index (r = −0.21, p < 0.01) [49] during the common period 1850–2013. Some studies have revealed that the positive NAO and AO phase could lead to the precipitation decrease in Central Asia, include Xinjiang, owing to decrease in eastward water-vapor transport from Europe to Central Asia, which causes an increase in column water vapor content in Central Asia, and vice versa [48,49,50].
The 500-hPa vector wind composite anomalies of the highest and lowest reconstructed runoff (n = 10) in the period 1948–2013 support the connection with AO and NAO (Figure 8). High reconstructed runoff year mean 500 hPa winds exhibit strong westerly and northwesterly flow over Central Asia (Figure 8A), indicating a strong phase of the westerlies. This is consistent with the enhanced westerly flow of cold air from the high latitude areas, which should lead to increased snowfall in Central Asia, and providing sufficient water tree growth and runoff formation in the following year. During the lowest runoff years, the opposite pattern occurs. As discussed above, runoff variation in our study area is related to the intensification of the mid-latitude westerly circulation.

4. Conclusions

The correlation analyses indicated that the tree-ring width of spruce trees have significant correlation with the runoff of the Kaiken River, and the highest correlation between the seasonalized runoff and tree rings was found in August–June. The results of the research reveal the feasibility of combining actual runoff data and tree-ring width series for runoff reconstruction for the Kaiken River. The runoff reconstruction has revealed the runoff variations of the Kaiken River during 1592–2013 CE. Comparison with runoff reconstructions for the Urimqi and Manasi rivers indicates high coherency in the timing of high/low runoff periods across central Tien Shan (China), i.e., low runoff period 1641–1644, 1704–1727, 1753–1777, 1804–1832, 1853–1869, and 1905–1932. In addition, a downward runoff trend occurred in Central Tien Shan since the 1950s. The analysis of synoptic climatology and periodic analysis suggest the runoff variability in the Kaiken River may have strong linkages with large-scale atmospheric circulation variations, such as AO and NAO. Although the runoff reconstructions are preliminary, our reconstruction provides new insights into runoff variations in Tien Shan, Central Asia. More dendrohydrological studies will be needed to enable us to better understand problems such as the forcings responsible for Central Asian runoff variability and re-evaluation of water resources management, and so on.

Author Contributions

Conceived and designed the experiments: F.C. and Y.C. Performed the experiments: F.C. and Y.C. Analyzed the data: H.Z. and F.C. Contributed reagents/ materials/analysis tools: H.Z., F.C., H.S., Y.C., S.Y. and T.Z. Contributed to the writing of the manuscript: H.Z., F.C., H.S., Y.C., S.Y. and T.Z. All authors have read and agreed to the published version of the manuscript.

Funding

This work was supported by the Natural Science Foundation of Xinjiang Uygur Autonomous Region (Grant No. 2017D01B55).

Acknowledgments

We thank the Xinjiang Meteorological Bureau for providing climate data.

Conflicts of Interest

The authors declare that the research was conducted in the absence of any commercial or financial relationships that could be construed as a potential conflict of interest.

References

  1. Karthe, D.; Chalov, S.; Borchardt, D. Water resources and their management in central Asia in the early twenty first century: Status, challenges and future prospects. Environ. Earth Sci. 2014, 73, 487–499. [Google Scholar] [CrossRef]
  2. Mekonnen, M.M.; Hoekstra, A.Y. Four billion people facing severe water scarcity. Sci. Adv. 2016, 2, e1500323. [Google Scholar] [CrossRef] [PubMed] [Green Version]
  3. Chen, Y.; Li, W.; Deng, H.; Fang, G.; Li, Z. Changes in Central Asia’s Water Tower: Past, Present and Future. Sci. Rep. 2016, 6, 35458. [Google Scholar] [CrossRef] [PubMed] [Green Version]
  4. Huang, J.; Yu, H.; Guan, X.; Wang, G.; Guo, R. Accelerated dryland expansion under climate change. Nat. Clim. Chang. 2015, 6, 166–171. [Google Scholar] [CrossRef]
  5. Sorg, A.; Bolch, T.; Stoffel, M.; Solomina, O.; Beniston, M. Climate change impacts on glaciers and runoff in Tien Shan (Central Asia). Nat. Clim. Chang. 2012, 2, 725–731. [Google Scholar] [CrossRef]
  6. Yao, J.; Mao, W.; Yang, Q.; Xu, X.; Liu, Z. Annual actual evapotranspiration in inland river catchments of China based on the Budyko framework. Stoch. Environ. Res. Risk Assess. 2016, 31, 1409–1421. [Google Scholar] [CrossRef]
  7. Solomina, O.; Maximova, O.; Cook, E. Picea schrenkiana ring width and density at the upper and lower tree limits in the Tien Shan Mts (Kyrgyz Republic) as a source of paleoclimatic information. Geogr. Environ. Sustain. 2014, 7, 66–79. [Google Scholar] [CrossRef] [Green Version]
  8. Chen, F.; Shang, H.; Yuan, Y. Dry/wet variations in the eastern Tien Shan (China) since AD 1725 based on Schrenk spruce (Picea schrenkiana Fisch. et Mey) tree rings. Dendrochronologia 2016, 40, 110–116. [Google Scholar] [CrossRef]
  9. Zhang, L.; Yang, Y.; Liu, C.F. The change of water resources utilization and its responses to the environment in Qitai county over the past 300 years. J. Arid Land Resour. Environ. 2012, 7, 35–40. (In Chinese) [Google Scholar]
  10. Girona, M.M.; Morin, H.; Lussier, J.-M.; Walsh, D. Radial Growth Response of Black Spruce Stands Ten Years after Experimental Shelterwoods and Seed-Tree Cuttings in Boreal Forest. Forests 2016, 7, 240. [Google Scholar] [CrossRef] [Green Version]
  11. Pearson, C.; Salzer, M.; Wacker, L.; Brewer, P.W.; Sookdeo, A.; Kuniholm, P. Securing timelines in the ancient Mediterranean using multiproxy annual tree-ring data. Proc. Natl. Acad. Sci. USA 2020, 117, 8410–8415. [Google Scholar] [CrossRef] [PubMed] [Green Version]
  12. Navarro, L.; Morin, H.; Bergeron, Y.; Girona, M.M. Changes in Spatiotemporal Patterns of 20th Century Spruce Budworm Outbreaks in Eastern Canadian Boreal Forests. Front. Plant Sci. 2018, 9, 1905. [Google Scholar] [CrossRef] [PubMed] [Green Version]
  13. Martin, M.; Girona, M.M.; Morin, H. Driving factors of conifer regeneration dynamics in eastern Canadian boreal old-growth forests. PLoS ONE 2020, 15, e0230221. [Google Scholar] [CrossRef] [PubMed]
  14. Bräuning, A.; De Ridder, M.; Zafirov, N.; García-González, I.; Dimitrov, D.P.; Gärtner, H. Tree-Ring Features: Indicators of Extreme Event Impacts. IAWA J. 2016, 37, 206–231. [Google Scholar] [CrossRef] [Green Version]
  15. Labrecque-Foy, J.-P.; Morin, H.; Girona, M.M. Dynamics of Territorial Occupation by North American Beavers in Canadian Boreal Forests: A Novel Dendroecological Approach. Forests 2020, 11, 221. [Google Scholar] [CrossRef] [Green Version]
  16. Yuan, Y.; Shao, X.; Wei, W.; Yu, S.; Gong, Y.; Trouet, V. The Potential to Reconstruct Manasi River Streamflow in the Northern Tien Shan Mountains (NW China). Tree-Ring Res. 2007, 63, 81–93. [Google Scholar] [CrossRef] [Green Version]
  17. Cook, E.R.; Palmer, J.G.; Ahmed, M.; Woodhouse, C.A.; Fenwick, P.; Zafar, M.U.; Wahab, M.; Khan, N. Five centuries of Upper Indus River flow from tree rings. J. Hydrol. 2013, 486, 365–375. [Google Scholar] [CrossRef] [Green Version]
  18. Davi, N.K.; Pederson, N.; Leland, C.; Nachin, B.; Suran, B.; Jacoby, G.C. Is eastern Mongolia drying? A long-term perspective of a multidecadal trend. Water Resour. Res. 2013, 49, 151–158. [Google Scholar] [CrossRef] [Green Version]
  19. Chen, F.; Yuan, Y.; Davi, N.; Zhang, T. Upper Irtysh River flow since AD 1500 as reconstructed by tree rings, reveals the hydroclimatic signal of inner Asia. Clim. Chang. 2016, 139, 651–665. [Google Scholar] [CrossRef]
  20. Chen, F.; He, Q.; Bakytbek, E.; Yu, S.; Zhang, R. Reconstruction of a long streamflow record using tree rings in the upper Kurshab River (Pamir-Alai Mountains) and its application to water resources management. Int. J. Water Resour. Dev. 2016, 33, 976–986. [Google Scholar] [CrossRef]
  21. Zhang, R.; Yuan, Y.; Gou, X.; Yang, Q.; Wei, W.; Yu, S.; Zhang, T.; Shang, H.; Chen, F.; Fan, Z.; et al. Streamflow variability for the Aksu River on the southern slopes of the Tien Shan inferred from tree ring records. Quat. Res. 2016, 85, 371–379. [Google Scholar] [CrossRef]
  22. Zhang, T.; Yuan, Y.; Chen, F.; Yu, S.; Zhang, R.; Qin, L.; Jiang, S. Reconstruction of hydrological changes based on tree-ring data of the Haba River, northwestern China. J. Arid. Land 2018, 10, 53–67. [Google Scholar] [CrossRef] [Green Version]
  23. Panyushkina, I.; Meko, D.M.; Macklin, M.G.; Toonen, W.H.J.; Mukhamadiev, N.S.; Konovalov, V.G.; Ashikbaev, N.Z.; Sagitov, A.O. Runoff variations in Lake Balkhash Basin, Central Asia, 1779–2015, inferred from tree rings. Clim. Dyn. 2018, 51, 3161–3177. [Google Scholar] [CrossRef]
  24. Wang, H.-Q.; Chen, F.; Ermenbaev, B.; Satylkanov, R. Comparison of drought-sensitive tree-ring records from the Tien Shan of Kyrgyzstan and Xinjiang (China) during the last six centuries. Adv. Clim. Chang. Res. 2017, 8, 18–25. [Google Scholar] [CrossRef]
  25. Holmes, R.L. Computer-assisted quality control in tree-ring dating and measurement. Tree Ring Bull. 1983, 43, 69–95. [Google Scholar]
  26. Holmes, R.L.; Adams, R.K.; Fritts, H.C. Tree-Ring Chronologies of Western North America: California, Eastern Oregon and Northern Great Basin with Procedures used in the Chronology Development Work Including Users Manuals for Computer Programs COFECHA and ARSTAN; University of Arizona: Tucson, AZ, USA, 1986. [Google Scholar]
  27. Wigley, T.M.L.; Briffa, K.R.; Jones, P.D. On the average value of correlated time series, with applications in dendroclimatology and hydrometeorology. J. Clim. Appl. Meteorol. 1984, 23, 201–213. [Google Scholar] [CrossRef]
  28. Michaelsen, J. Cross-Validation in Statistical Climate Forecast Models. J. Clim. Appl. Meteorol. 1987, 26, 1589–1600. [Google Scholar] [CrossRef] [Green Version]
  29. Fritts, H.C. Tree-Rings and Climate; Academic Press: London, UK, 1976. [Google Scholar]
  30. Meko, D.M.; Woodhouse, C.A.; Morino, K. Dendrochronology and links to streamflow. J. Hydrol. 2012, 412, 200–209. [Google Scholar] [CrossRef]
  31. Woodhouse, C.A. A 431-Yr Reconstruction of Western Colorado Snowpack from Tree Rings. J. Clim. 2003, 16, 1551–1561. [Google Scholar] [CrossRef]
  32. Watson, E.; Luckman, B.H. An exploration of the controls of pre-instrumental streamflow using multiple tree-ring proxies. Dendrochronologia 2005, 22, 225–234. [Google Scholar] [CrossRef]
  33. Axelson, J.N.; Sauchyn, D.J.; Barichivich, J. New reconstructions of streamflow variability in the South Saskatchewan River Basin from a network of tree ring chronologies, Alberta, Canada. Water Resour. Res. 2009, 45. [Google Scholar] [CrossRef] [Green Version]
  34. Masiokas, M.H.; Villalba, R.; Luckman, B.H.; Mauget, S. Intra-to multidecadal variations of snowpack and streamflow records in the Andes of Chile and Argentina between 30°and 37° S. J. Hydrometeorol. 2010, 11, 822–831. [Google Scholar] [CrossRef]
  35. LeBlanc, D.; Terrell, M. Dendroclimatic analyses using Thornthwaite–Mather–Type evapotranspiration models: A bridge between dendroecology and forest simulation models. Tree-Ring Res. 2001, 57, 55–66. [Google Scholar]
  36. Fan, Z.; Bräuning, A.; Cao, K.-F. Tree-ring based drought reconstruction in the central Hengduan Mountains region (China) since A.D. 1655. Int. J. Clim. 2008, 28, 1879–1887. [Google Scholar] [CrossRef]
  37. Yuan, Y.; Wei, W.; Chen, F.; Yu, S. Tree ring reconstruction of annual total runoff for the Urumqi river on the northern slope of Tien Shan mountains. Quat. Sci. 2013, 33, 501–510. (In Chinese) [Google Scholar]
  38. Zheng, J.; Xiao, L.; Fang, X.; Hao, Z.; Ge, Q.; Li, B. How climate change impacted the collapse of the Ming dynasty. Clim. Chang. 2014, 127, 169–182. [Google Scholar] [CrossRef]
  39. Cook, E.R.; Anchukaitis, K.J.; Buckley, B.M.; D’Arrigo, R.D.; Jacoby, G.C.; Wright, W.E. Asian Monsoon Failure and Megadrought During the Last Millennium. Science 2010, 328, 486–489. [Google Scholar] [CrossRef] [Green Version]
  40. Esper, J.; Schweingruber, F.H.; Winiger, M. 1300 years of climatic history for Western Central Asia inferred from tree-rings. Holocene 2002, 12, 267–277. [Google Scholar] [CrossRef] [Green Version]
  41. Chen, F.; Yuan, Y.-J.; Chen, F.-H.; Wei, W.-S.; Yu, S.-L.; Chen, X.-J.; Fan, Z.-A.; Zhang, R.; Zhang, T.-W.; Shang, H.-M.; et al. A 426-year drought history for Western Tian Shan, Central Asia, inferred from tree rings and linkages to the North Atlantic and Indo–West Pacific Oceans. Holocene 2013, 23, 1095–1104. [Google Scholar] [CrossRef]
  42. Chen, F.; Mambetov, B.; Maisupova, B.; Kelgenbayev, N. Drought variations in Almaty (Kazakhstan) since AD 1785 based on spruce tree rings. Stoch. Environ. Res. Risk Assess. 2016, 31, 2097–2105. [Google Scholar] [CrossRef]
  43. Shi, Y.; Shen, Y.; Kang, E.; Li, D.; Ding, Y.; Zhang, G.; Hu, R. Recent and Future Climate Change in Northwest China. Clim. Chang. 2006, 80, 379–393. [Google Scholar] [CrossRef]
  44. Davi, N.; Jacoby, G.; Fang, K.; Li, J.; D’Arrigo, R.; Baatarbileg, N.; Robinson, D. Reconstructing drought variability for Mongolia based on a large-scale tree ring network: 1520–1993. J. Geophys. Res. Space Phys. 2010, 115. [Google Scholar] [CrossRef] [Green Version]
  45. Chen, F.; Yuan, Y.-J. Streamflow reconstruction for the Guxiang River, eastern Tien Shan (China): Linkages to the surrounding rivers of Central Asia. Environ. Earth Sci. 2016, 75, 1049. [Google Scholar] [CrossRef]
  46. Mann, M.E.; Lees, J.M. Robust estimation of background noise and signal detection in climatic time series. Clim. Chang. 1996, 33, 409–445. [Google Scholar] [CrossRef]
  47. Mazzarella, A.; Scafetta, N. Evidences for a quasi 60-year North Atlantic Oscillation since 1700 and its meaning for global climate change. Theor. Appl. Clim. 2011, 107, 599–609. [Google Scholar] [CrossRef] [Green Version]
  48. Dai, X.; Wang, P.; Zhang, K. A study on precipitation trend and fluctuation mechanism in northwestern China over the past 60 years. Acta Phys. Sin. 2013, 62, 527–537. [Google Scholar]
  49. Li, J.; Wang, J.X.L. A modified zonal index and its physical sense. Geophys. Res. Lett. 2003, 30. [Google Scholar] [CrossRef]
  50. Hu, Z.; Zhou, Q.; Chen, X.; Qian, C.; Wang, S.; Li, J. Variations and changes of annual precipitation in Central Asia over the last century. Int. J. Clim. 2017, 37, 157–170. [Google Scholar] [CrossRef]
Figure 1. Map of sampling sites, meteorological station, hydrological station and main rivers in central Tien Shan, China.
Atmosphere 11 01100 g001
Figure 2. (A) Monthly total precipitation and monthly mean temperature records at the Qitai meteorological station from 1983 to 2013. (B) The monthly average streamflow of Kaiken River from 1983 to 2013.
Atmosphere 11 01100 g002
Figure 3. Correlation coefficients between radial growth of spruce trees and total monthly precipitation monthly mean temperature, and monthly mean runoff in the Kaiken River. Correlations are computed from the previous August to current September over 1983–2013. Dashed lines indicate the 95% confidence level.
Atmosphere 11 01100 g003
Figure 4. Comparison of the actual and reconstructed August-June runoff of the Kaiken River for the common period 1983–2013.
Atmosphere 11 01100 g004
Figure 5. (A) The sample depth, running series of mean correlation (Rbar) and expressed population signal (EPS) of the regional tree-ring chronology. (B) Reconstructed (black line) and 21-year low-pass filtered (red line) runoff of the Kaiken River from 1592 to 2013. Central horizontal line (dotted line) shows average value of reconstructed runoff series.
Atmosphere 11 01100 g005
Figure 6. The first principal component (PC1) of the runoff reconstructions of Kaiken, Urimqi and Manasi rivers. Graphical comparison of various runoff reconstructions for Kaiken, Urimqi and Manasi rivers derived from tree rings. All runoff reconstructions were smoothed with a 21-year low-pass filter to emphasize long-term fluctuations.
Atmosphere 11 01100 g006
Figure 7. MTM spectral density of the runoff reconstruction of the Kaiken River. The dash and dotted lines indicate the 0.05 and 0.01 confidence level, respectively.
Atmosphere 11 01100 g007
Figure 8. Composite anomaly maps of 500-hPa vector wind (from prior August to current June) for the 10 highest (A) and 10 lowest (B) runoff years for the runoff reconstruction of the Kaiken River during the period 1948–2013.
Atmosphere 11 01100 g008
Table 1. Information about the sampling sites in the Kaiken River Basin.
Site CodeLatitude (N)Longitude (E)Elevation (m)
BYX43°36′920″90°27′755″2360
XDY43°47′48.21″88°51′41.30″2000
KGY43°32′19.14″89°36′51.11″2230
Table 2. Statistical characteristics of the verification of the streamflow reconstruction.
RR2R2adjFSTFSTtRE
0.6450.4170.39620.0023+/7− *22+/6− *2.76 *0.32
R: multiple correlation coefficient; R2: explained variance; R2adj: Adjusted explanatory variance; FST: sign test of the first difference; ST: sign test; t: product mean; RE: reduction of error; * Significant at the 99% confidence level.
Publisher’s Note: MDPI stays neutral with regard to jurisdictional claims in published maps and institutional affiliations.

