Article

Combination of Tree Rings and Other Paleoclimate Proxies to Explore the East Asian Summer Monsoon and Solar Irradiance Signals: A Case Study on the North China Plain

1
The State Key Laboratory of Loess and Quaternary Geology, Institute of Earth Environment, Chinese Academy of Sciences, Xi’an 710061, China
2
Center for Excellence in Quaternary Science and Global Change, Chinese Academy of Sciences, Xi’an 710061, China
3
Interdisciplinary Research Center of Earth Science Frontier (IRCESF) and Joint Center for Global Change Studies (JCGCS), Beijing Normal University, Beijing 100875, China
4
School of Human Settlements and Civil Engineering, Xi’an Jiaotong University, Xi’an 710049, China
5
School of Environmental Science and Engineering, Key Laboratory of Subsurface Hydrology and Ecological Effects in Arid Region, Chang’an University, Xi’an 710061, China
6
Dongdashan Natural Reserve, Ganzhou District, Zhangye 734000, China
*
Authors to whom correspondence should be addressed.
Atmosphere 2020, 11(11), 1180; https://doi.org/10.3390/atmos11111180
Submission received: 15 October 2020 / Revised: 27 October 2020 / Accepted: 28 October 2020 / Published: 1 November 2020
(This article belongs to the Special Issue Past Climate Reconstructed from Tree Rings)

Abstract

:
Paleoclimate research, which involves the study of climate and environmental changes in historical and geological periods, is typically conducted using high-resolution paleoclimatic proxies, such as tree rings, historical documentations, stalagmite, and ice core. Although each paleoclimate proxy has its own merits in paleoclimatic research, reconstructions based on a single proxy may suffer from shortcomings, including insufficient reliability and low coverage of the representative area. It may be possible to overcome these shortcomings by combining multi-paleoclimatic proxies to understand paleoclimatic changes. In this study, we attempt to combine tree-ring stable oxygen isotope ratio (δ18O), tree-ring width, and stalagmite thickness data as well as historical records to establish a 320-year (1675–1994) time series using principal component analysis in the water-scarce North China Plain (NCP). The results show that the first principal component (PC1) series is closely related to regional precipitation and the maximum temperature in summer. The spatial correlation pattern indicates that the PC1 series can represent the regional hydroclimate variation not only in the NCP but also in all of northern China. The significant (p < 0.001) correlations between the PC1 series and several East Asian summer monsoon (EASM) indices prove that the PC1 reflects the intensity of the EASM. The PC1 series is consistent with the interannual variations of two reconstructed solar activity correlation indexes (r = 0.48 and 0.46, n = 320, and p < 0.001). The results indicate that the hydroclimate variation in the NCP is affected by large-scale atmospheric circulations, such as EASM and solar activity, and shows the potential of combining multiple paleoclimate proxies for analyzing regional climate change.

1. Introduction

In the past century, the global climate has experienced warming-based changes, which have affected nature in various ways [1]. The number of climate disasters in the 1990s was five times higher than that in the 1950s in certain regions [2]. Climate change is causing huge adverse impacts on human activities, including production, thereby restricting social and economic development. In order to predict climate change trends, it is necessary to understand climate variations that occurred in the past. Most of the existing meteorological data concerning Asia is of short-term nature and cannot meet the requirements for long-term climate research of the past. In order to overcome the obstacle posed by short timescale meteorological records, it is necessary to employ high-resolution paleoclimatic proxies. For example, Liu [3] reconstructed the average temperature of Arxan, Inner Mongolia, from May to September during 1822–2008 based on the tree-ring width chronology of Larix gmelinii collected from the region. Lei [4] established the tree-ring width chronology of Pinus tabulaeformis in the Yishan area of Shandong Province and reconstructed the regional wetness index during 1755–2007. The reconstruction showed an increasing trend after the late 1960s and the reconstructed wetness index series was compared with the dryness/wetness index (DWI) and the area of land affected by drought and flood in China. Wang [5] analyzed the microlayer thickness and δ18O of stalagmites from Kaiyuan Cave located in the western part of the Shandong Peninsula, China, and found that the microlayer thickness was not only related to the changes in climatic factors, but also the degree of climate stability. Xu [6] analyzed lake sediment changes since 15 ka in the Gonghai lake of Shanxi Province, China, and found that the climate was the wettest during the 8 ka BP–15 ka BP period.
The paleoclimatic proxies have significantly deepened our understanding of climate change before instrumental periods. However, a single paleoclimatic proxy for climate reconstruction may suffer from shortcomings or cause uncertainties in the results. For example, stalagmite samples are easy to obtain and the stalagmite data over a large period are sensitive to climate events. Thus, these data serve as an additional indicator for paleoclimate research. However, the growth conditions of stalagmites are complex, thereby affecting the accuracy of microlayer dating [7]. Given their accurate dating, high resolution, a large number of copies, strong continuity, and wide distribution, tree rings have become an important substitute indicator for high-resolution paleoclimate research [8,9,10,11]. The growth of trees is closely related to the surrounding environment; however, the scale of research using these data is limited to hundreds to thousands of years. In other words, it is difficult to obtain samples over a longer period. Moreover, a divergence problem exists between tree-ring width and temperature at high latitudes. There is a wealth of climate change information preserved in historical documents in China. The efforts of many scholars have helped in extracting climate-related information from these documents. However, due to problems with digitization, series can only be graded according to the degree of the disaster, which is expressed as the DWI. It is undeniable that the DWI plays an irreplaceable role in indicating historical extreme events.
The North China Plain (NCP), which includes Beijing, Tianjin, Shanxi, Hebei, and Inner Mongolia, has a high population density and is an important agricultural and industrial base for China. Due to global warming, the temperature in this region accelerated by 1.5 °C between 1951 and 2009 [12]. Precipitation has shown a downward trend since 1965 [13]. Moreover, climate change has caused a dry and hot climate in this region [14]. The high temperature has accelerated the surface water evaporation rate, resulting in the depletion of water resources in the NCP. The amount of water resources per capita in this region is 526 m3, which is much lower than the internationally recognized “poor waterline” of 1000 m3 per capita [15]. To compound matters, the frequency of extreme drought has increased over the years, recording a growth rate of 0.21 times per 10 years [16]. In order to understand the characteristics of historical climate change and the factors affecting them in the region, it is necessary to conduct a multi-proxy comprehensive climate change survey. This study uses the principal component analysis method in combination with the following data: representative tree-ring δ18O, tree-ring width, stalagmite thickness, and dryness/wetness index extracted from historical documents literature. We intend to extract a principal component series that can accurately represent climate change in the NCP, as well as analyze its main meteorological indicators and the large-scale climatic dynamics and external stress factors that affect this change.

2. Data and Methods

2.1. Climatological Data of the Study Area

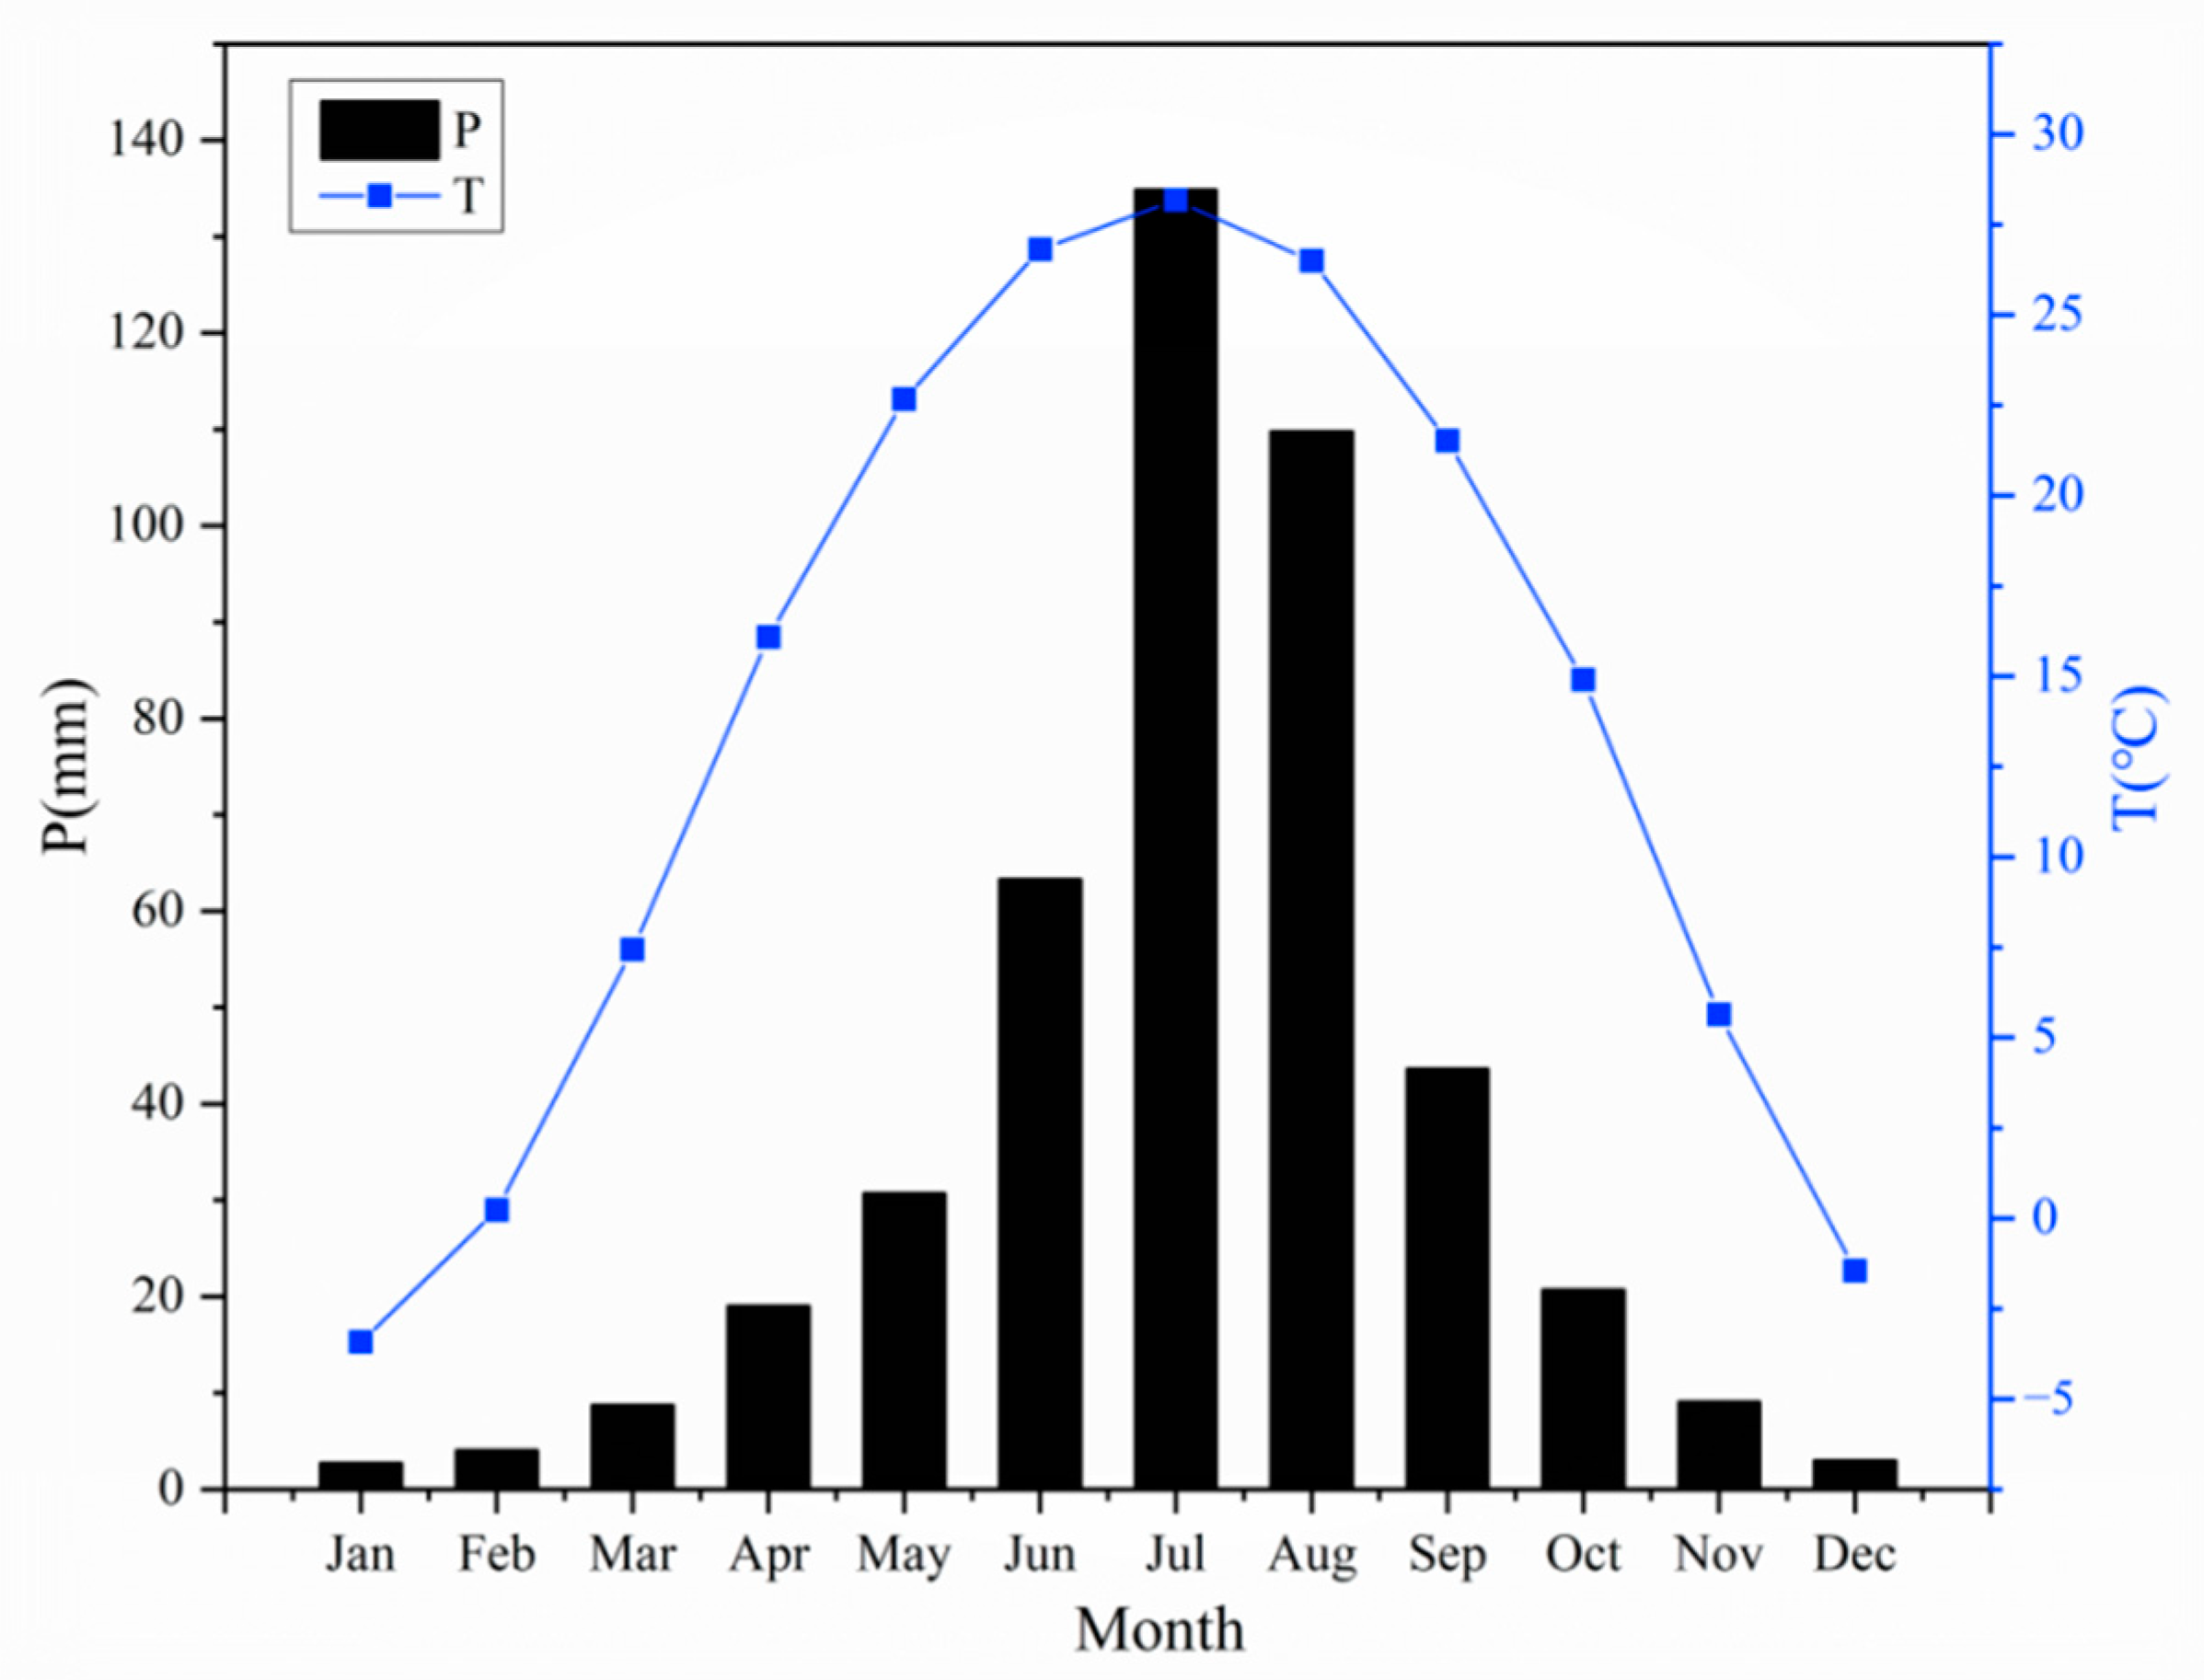
The climatic data used in this study were sourced from the Climatic Research Unit (CRU; www.cru.uea.ac.uk/) grid data. The grid range of the meteorological data was selected according to the spatial correlation range of the principal component series, and the monthly meteorological data were represented as averages. According to the results, we extracted the regional (35.5° N–44° N, 105° E–119° E) temperature and regional (36° N–46° N, 113° E–120° E) precipitation to carry out further analysis. The sampling sites were shown in Figure 1. Although the CRU grid data records are available from 1901, the instrumental data collection began in 1955. Thus, we chose 1955 as the start of the target period for this work. According to the final correlation, the principal component series exhibited the most significant correlation with mean precipitation and maximum temperature within the range of grid data. Thus, we extracted the data of these two parameters. According to the calculation, the highest annual average temperature in the NCP was 13.758 °C and the highest temperature in July was 28.170 °C. The average annual rainfall in the NCP was 37.486 mm and the maximum rainfall in July was 134.881 mm. Thus, the climate of the NCP showed a seasonal cycle of rain and heat in the same period (Figure 2).

2.2. Principal Component Analysis

Principal component analysis is a commonly used statistical method, which employs the idea of dimension reduction and allows the use of multiple relevant variables after linear transformation as a set of uncorrelated variables. As most of these variables are representatives of multiple related original signals [17], this method not only ensures the integrity of the original variables, but also achieves dimension reduction, concentrates information [18], and overcomes the one-sidedness of research that uses single variables. At present, principal component analysis is widely used in agriculture, water conservancy, meteorology, and resource research.
Assuming that the dataset is an M-dimensional vector with n numbers, the intent of the principal component is to reduce the n numbers from M dimensions to P dimensions (i.e., P < M). The larger the variance of the random variable, the larger the amount of information it contains [19]. Therefore, only a few variables with large variance after the dimension reduction need to be retained. Principal components are extracted in the following steps: (1) Standardize the original time series and transform each original vector into an orthogonal vector X. (2) Calculate the normalized covariance matrix S. Then, calculate the eigenvalue and eigenvector according to the covariance. (3) Apply the formula Pi = I/σ to calculate the variance contribution rate. Then, calculate the cumulative variance contribution rate, which should be greater than 85%, to determine the number of principal components. (4) Calculate the weight coefficient of each principal component with the maximum variance method. (5) Find the weighted sum of each principal component and the normalized weight coefficient to obtain the equation for the principal component calculations.

2.3. Multiple Paleoclimate Proxies and Their Principal Component Analysis

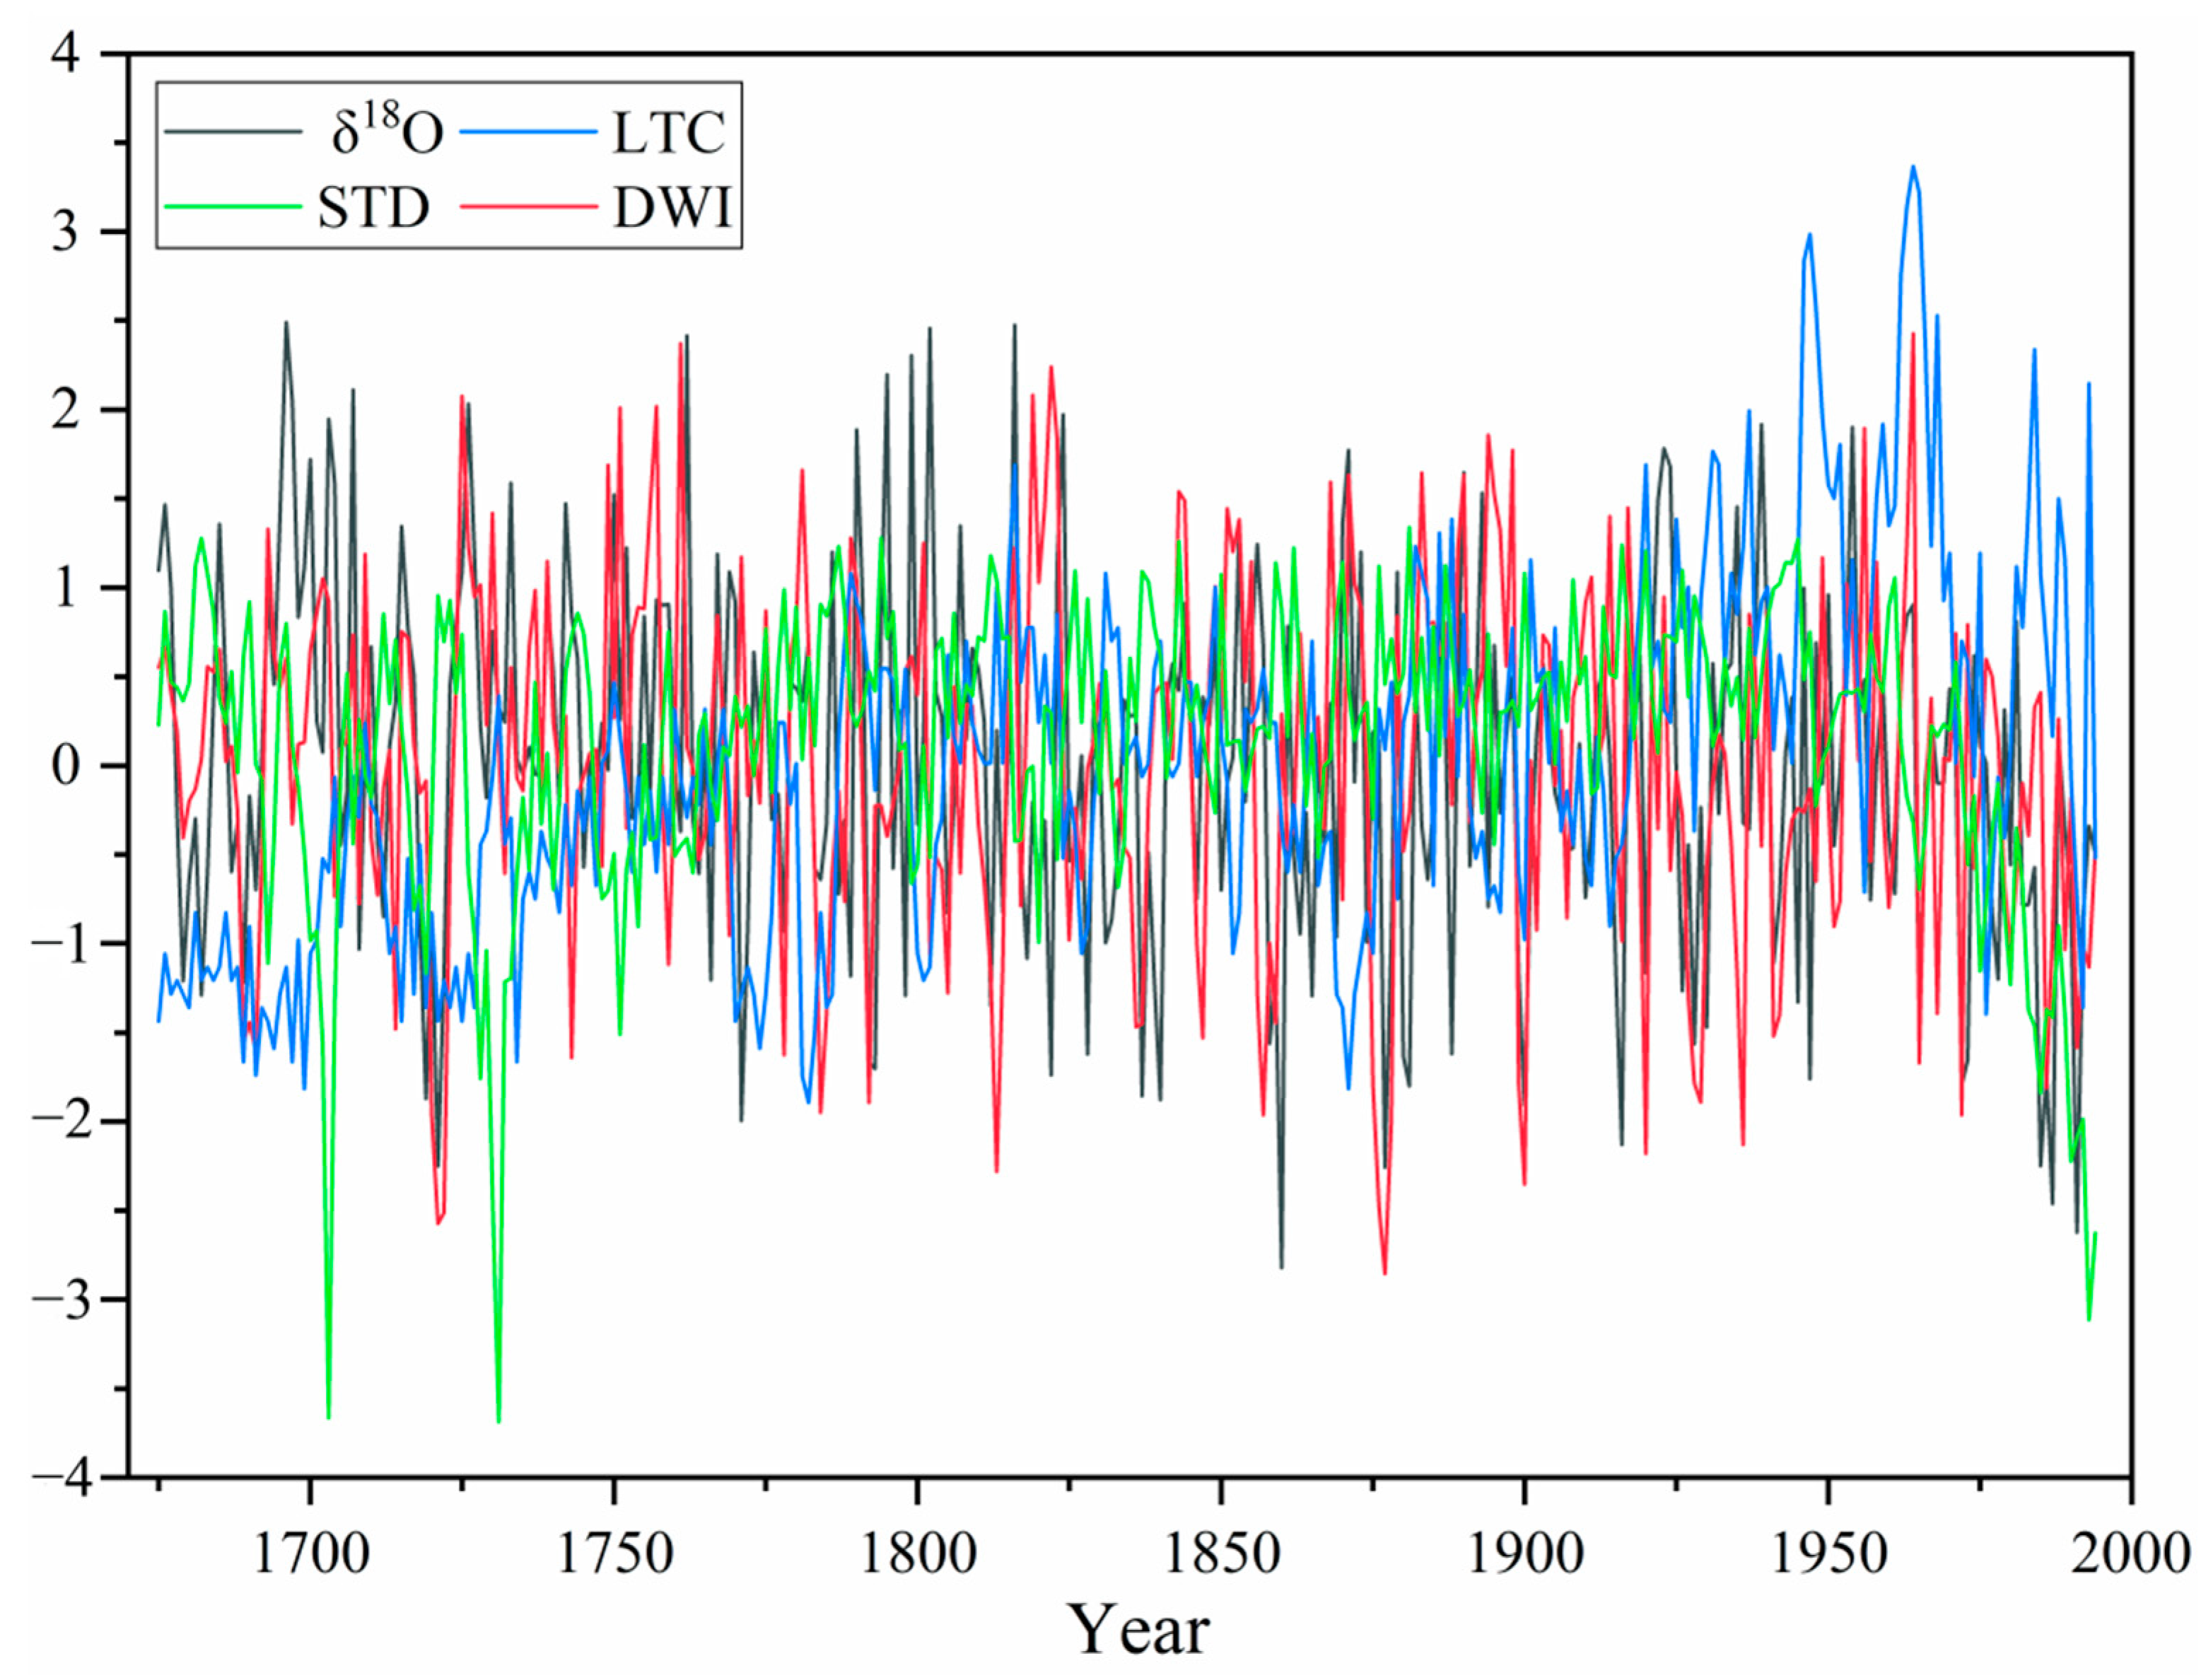
The following four time series were used in this study (Figure 3): The first time series involved the width chronology of Pinus bungeana in Yulin area of Shandong Province, as established by Liu [20]. The second time series comprised the δ18O series of tree-ring width in Luya Mountain of Shanxi Province, as established by Li [21]. The third time series comprised the layer thickness of stalagmites in Beijing’s Shihua cave, as reported by Tan [22]. The last time series contained the DWI of the NCP region, as reported by Shen [23] based on historical literature and geographic information system. These four time series represent large time scales, and their climatic significance is relatively clear. After conducting the first principal component (PC1), they were used to generate a main series that retains the majority of the signals of the original series. The equation for calculating the first principal component (PC1) is as follows:
Principal component = 0.38 × δ18O − 0.39 × DWI + 1.52 × LTC − 0.66 × STD
In the above equation, δ18O denotes the tree-ring δ18O chronology of Luya Mountain of Shanxi Province, as reported by Li [21], DWI is the dryness–wetness index of the NCP, as extracted by Shen [23], LTC is the stalagmite thickness chronology, as established by Tan [22], and STD is the standard chronology of tree-ring width in Yulin area of Shandong Province, as reported by Liu [20]. Taking the common interval of the four series, the first principal component during 1675–1994 was extracted according to Equation (1) (Figure 4). The first principal component could explain 83.8% of the total variance in the original four records.
To investigate coefficient of association between different time series, the Pearson’s correlation coefficient was employed in this study. It is generally expected that time series may have autocorrelation; the effective degrees of freedom (EDOF) was calculated between two time series by following equation suggested by Bretherton et al. [24]:
EDOF = N × [(1 − r1 × r2)/(1 + r1 × r2)]
where r1 and r2 are the first-order autocorrelations of individual time series; N is the overlapping length of two time series.

3. Results and Discussion

3.1. Spatial Representation of the Principal Component Analysis Series

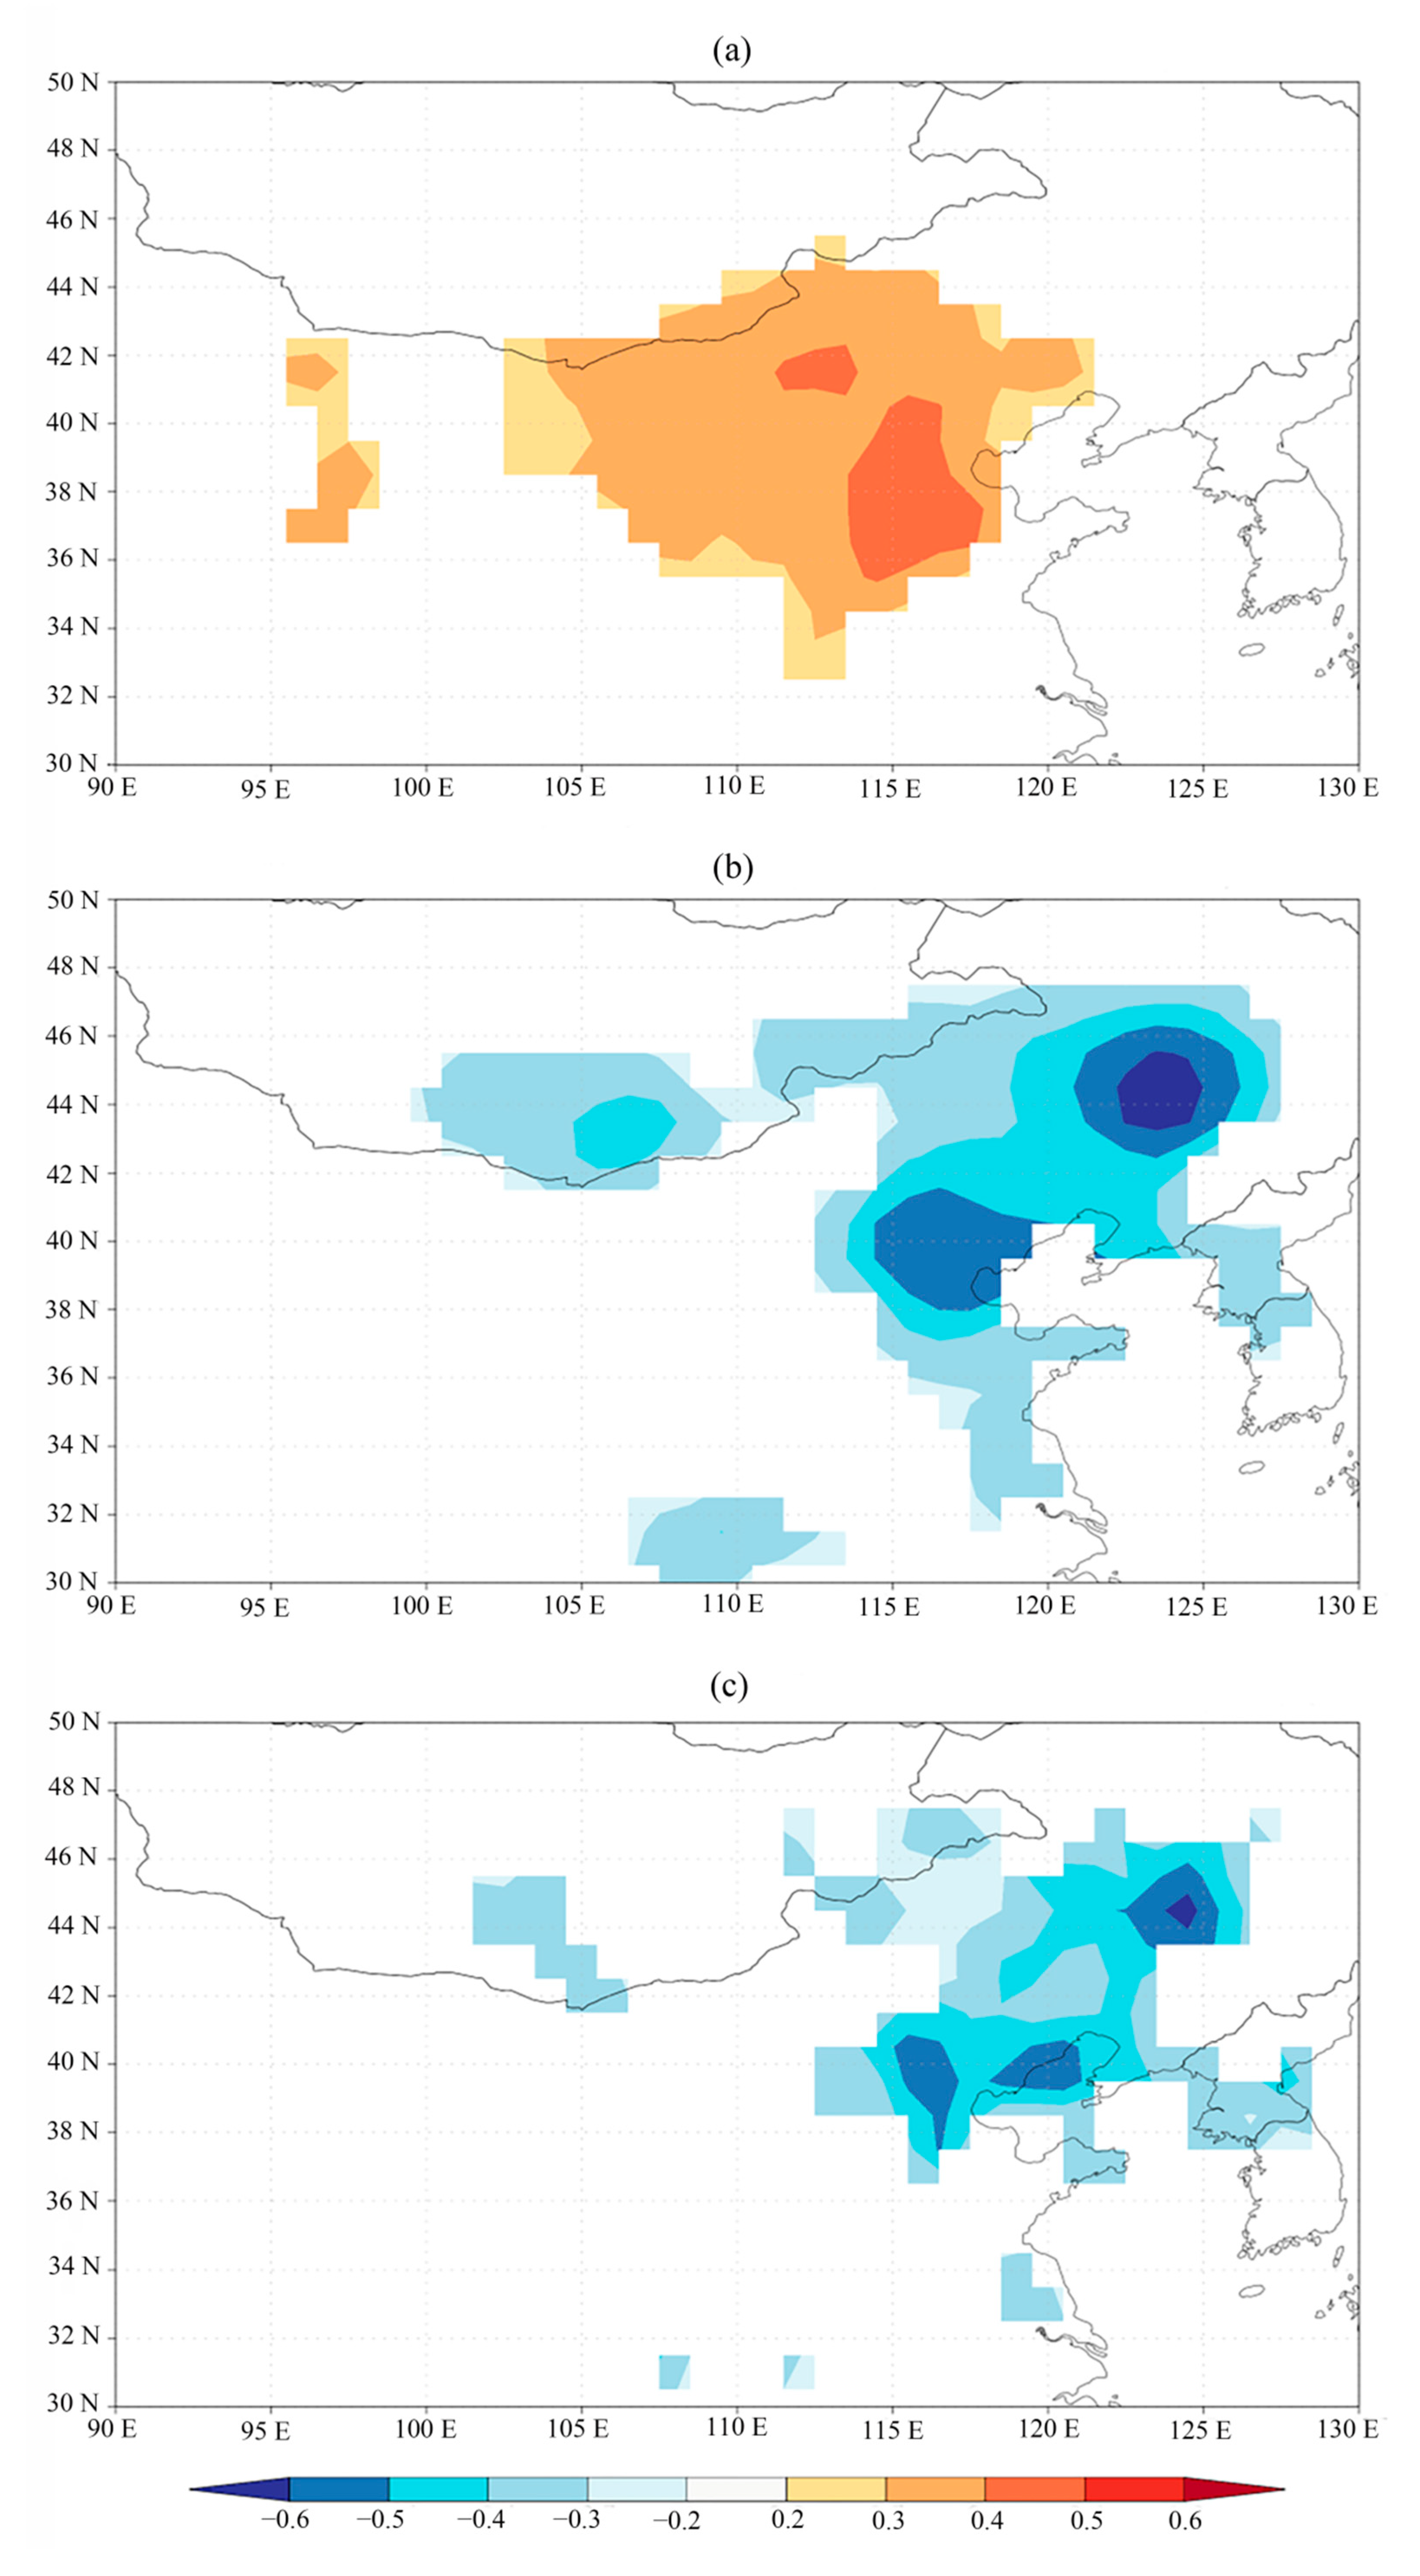
In order to judge whether the PC1 series can represent hydroclimatic changes over long time periods, the extracted PC1 series and CRU grid climate data were analyzed via online spatial correlation analysis [25] (Figure 5). The results show that the PC1 series has a significant negative correlation with precipitation from May to June, and the highest absolute correlation coefficient is 0.7. Except for Shandong, the coastal areas of Hebei, eastern Inner Mongolia, and other NCP regions, the representative regions also include Liaoning, Jilin, and other regions in the northeast, thus representing a wide range and a higher correlation coefficient. In addition, the PC1 series exhibits a positive correlation with the highest temperature grid data from June to August, and the highest spatial correlation coefficient is 0.5, which is mainly distributed in Shanxi, Hebei, and Inner Mongolia, thereby representing a wide range of temperature changes in the NCP. As precipitation and temperature play important roles in regional dry and wet changes, the PC1 series extracted by this study shows a good correlation with precipitation and temperature in the NCP. The PC1 series can, thus, represent the hydroclimatic changes in the NCP and even in northern China. A warming/drying trend is shown in PC1 from 1650 to 1960s, which was also observed by Liu [26] and Sun [27]. The trend since 1950s is similar with that during 1820–1860, implying climate background of two durations may be caused by similar reasons. As reported by Man [28] and Zhuo [29], large volcanic eruptions have been contributed to East Asian Monsoon precipitation during early to middle 19th century, while Liu [26] indicated that the recently weakening of Asian Summer Monsoon may be caused by anthropogenic aerosols.

3.2. Variation in the East Asian Summer Monsoon Reflected by the Principal Component Analysis Series

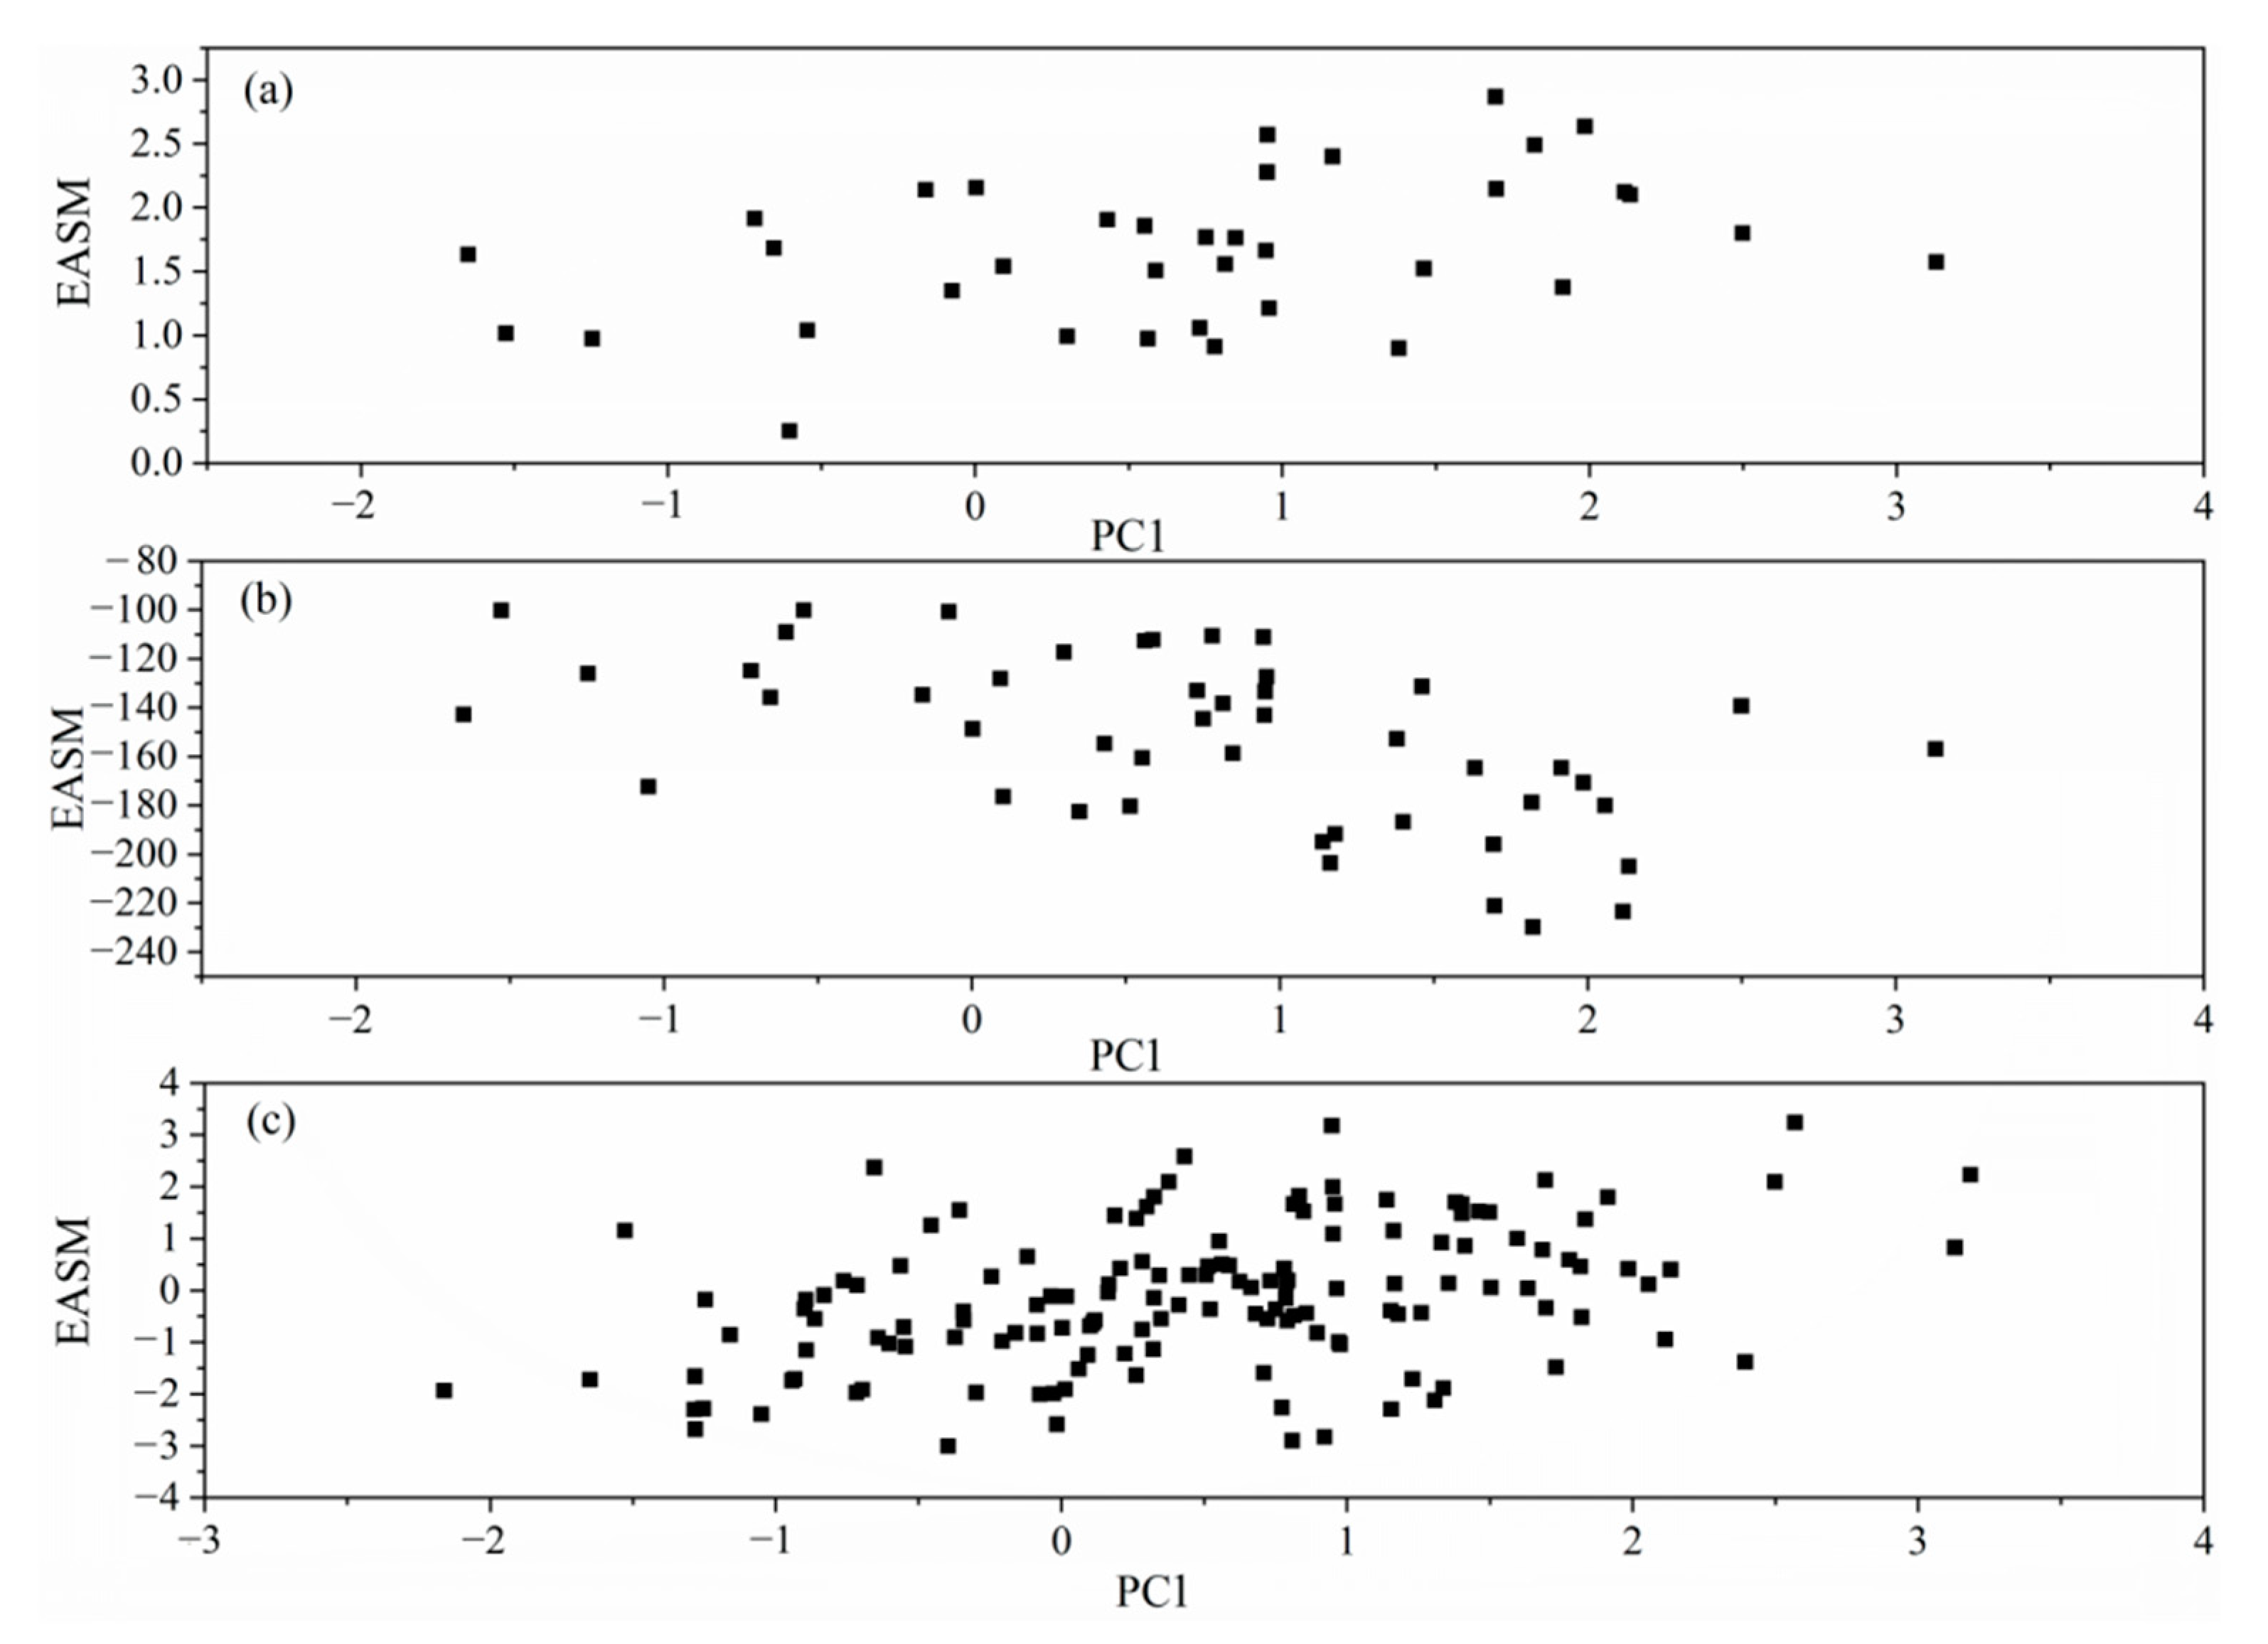
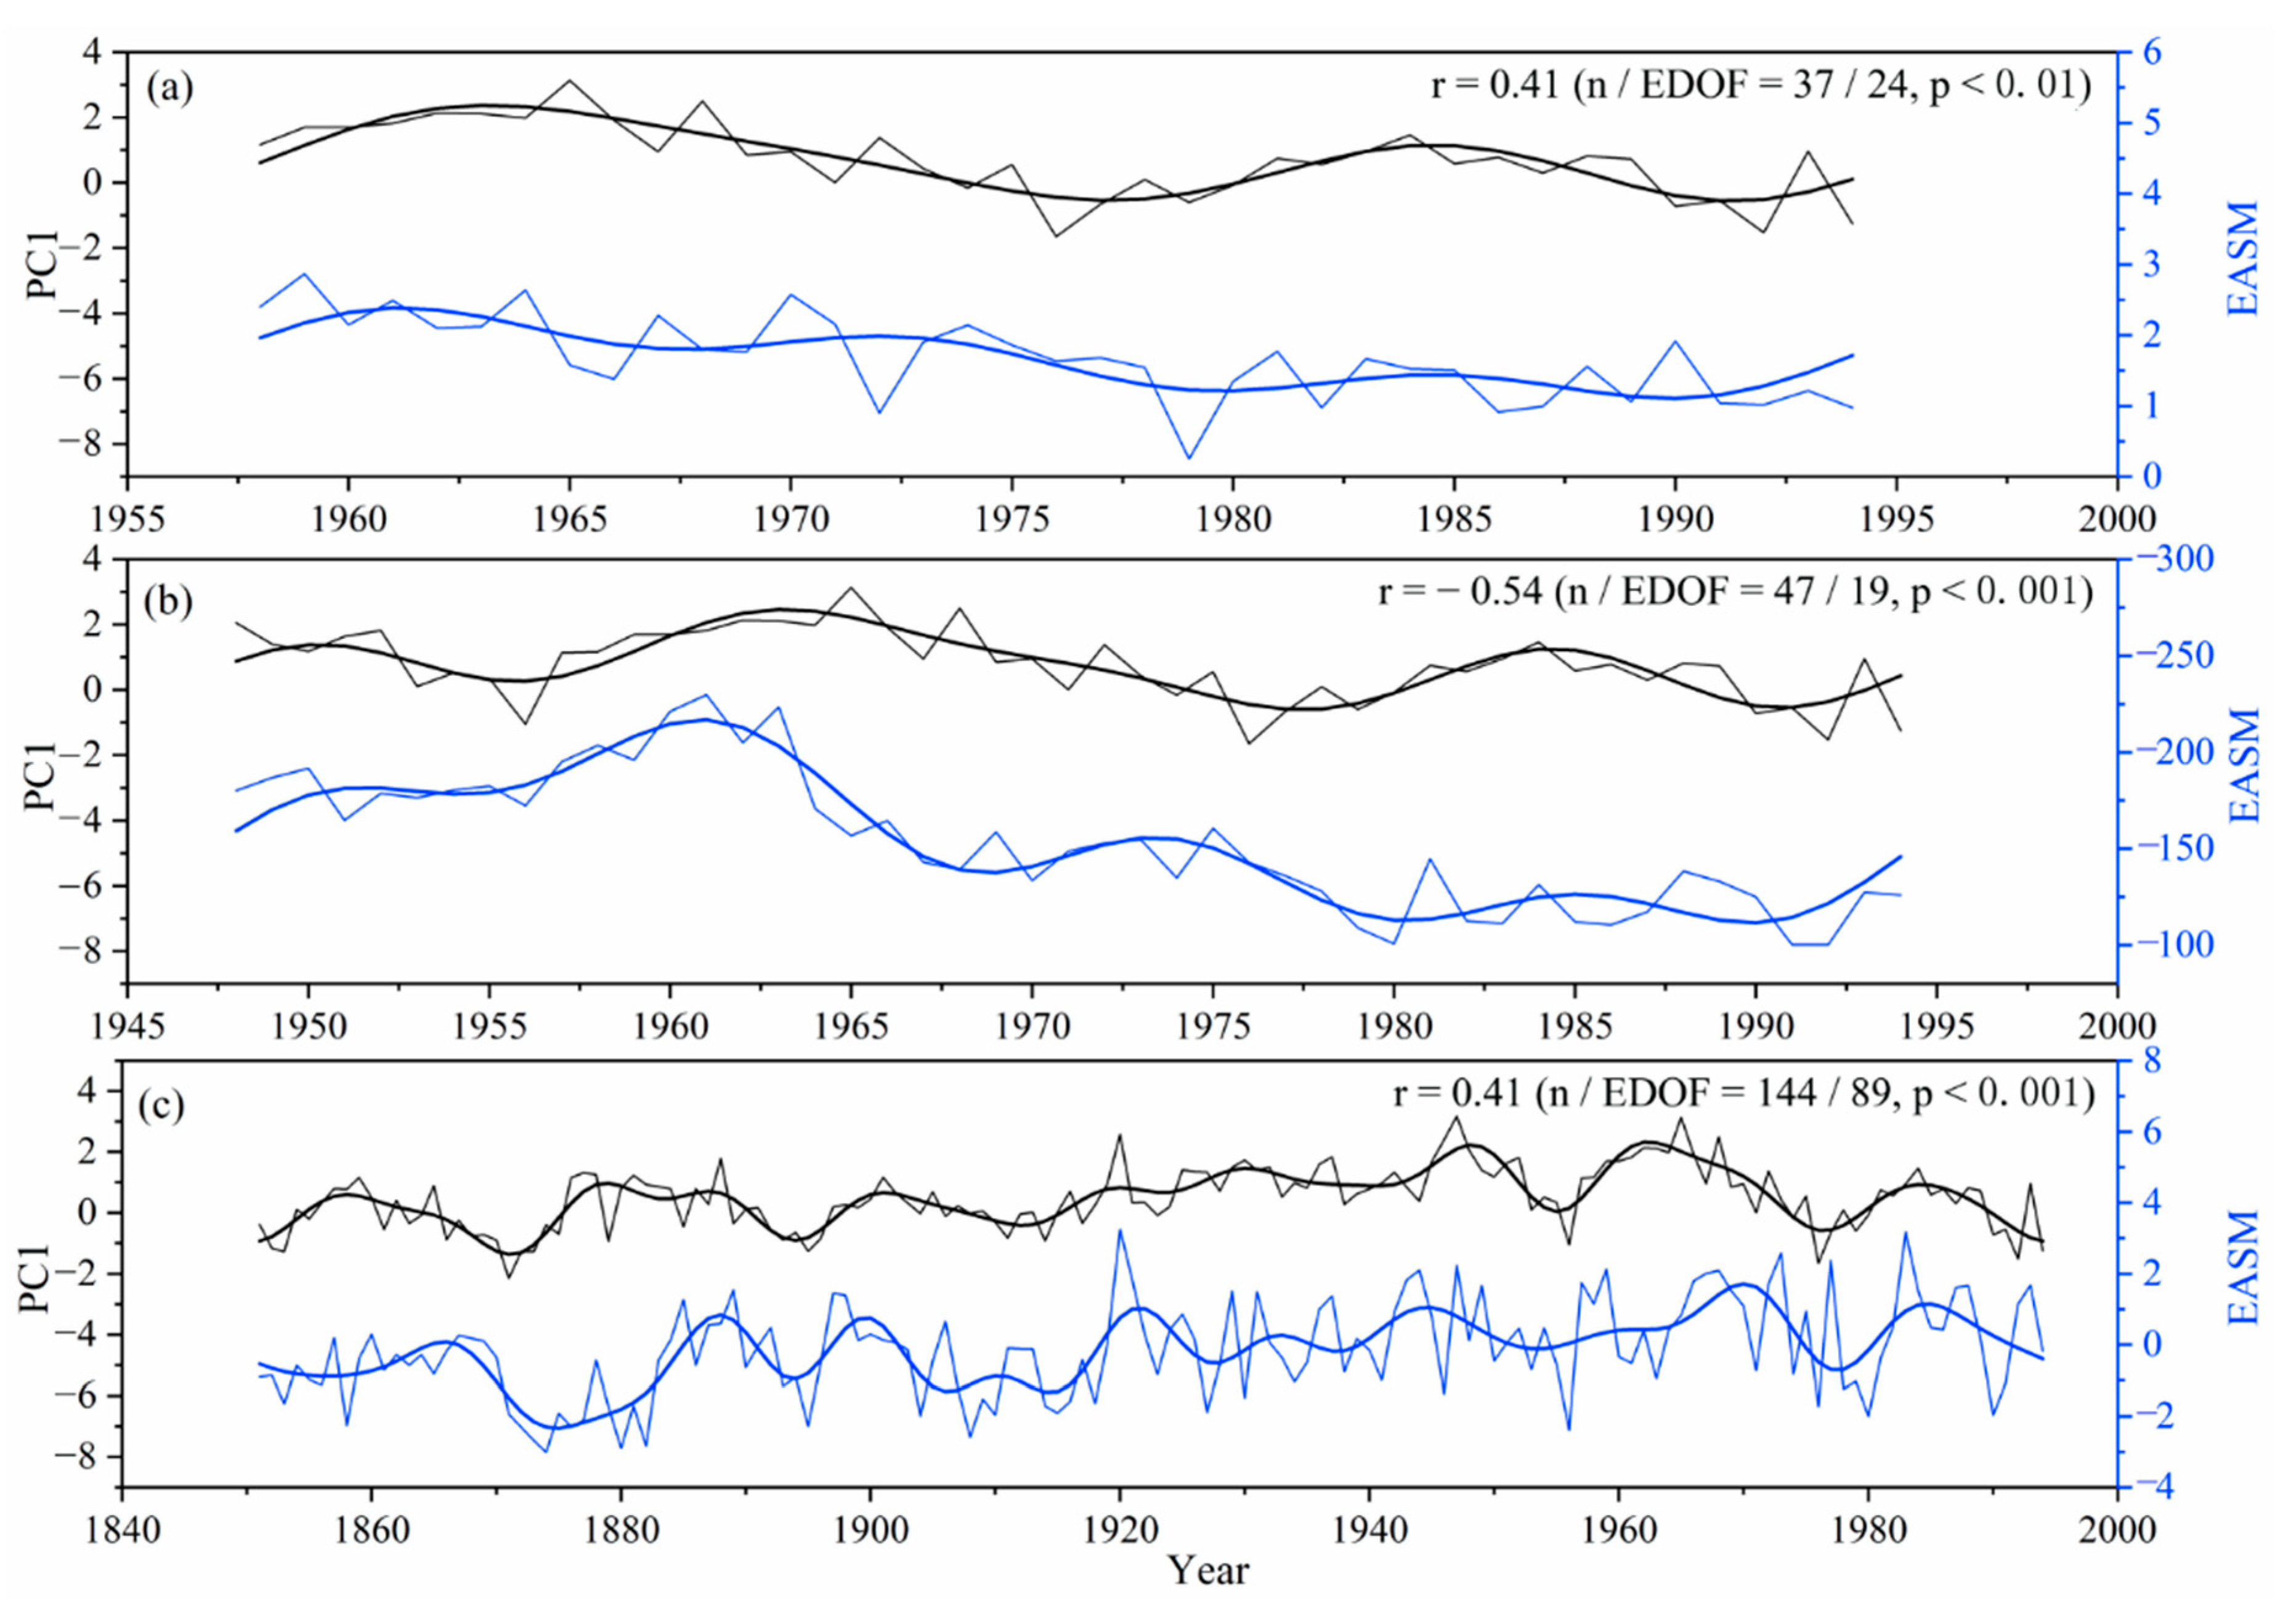
The NCP is subjected to the East Asian monsoon, and the precipitation in summer largely depends on the strength of the monsoon [30]. In order to examine the relationship between the PC1 and the East Asian summer monsoon (EASM), we compared the PC1 series with several definitions of the EASM index and found a good correlation between the PC1 series and three summer monsoon series (Figure 6 and Figure 7).
Compared with the EASM index during 1851–1994 in Wang [31], we found that the time period showing the best correlation is from May–June, and the correlation coefficient is 0.41 (n = 144 and p < 0.001). Compared with the EASM index series during 1948–1994 in Guo [32], we observed that the time period with the best correlation is June–July, and the correlation coefficient is −0.54 (n = 47 and p < 0.001). Compared with the EASM index series during 1958–1994 in Lau [33], we noted that the correlation between April and September is the best, and the corresponding correlation coefficient is 0.41 (n = 37 and p < 0.01). The correlation coefficients of the PC1 series for the above three monsoon series are higher than those of the compared series, and the variation trend is consistent (Figure 7; the thick lines denote 10-year low-pass filtering curves), indicating that climate change in the NCP was strongly influenced by the EASM.

3.3. Relationship between the Principal Component Analysis Series and the El Nino–Southern Oscillation

The term ENSO depicts the El Nino–Southern oscillation that occurs in the equatorial central and eastern Pacific Ocean. ENSO is a large-scale air–sea oscillatory phenomenon [34]. The ENSO cycle includes two different cold and warm phases of La Nina and El Nino. When El Nino occurs, a wide range of sea surface temperature (SST) anomalies occurs in the East equator Pacific region, such as a typical increase in SST, leading to a decrease in the air pressure. La Nina events, contrary to El Nino, are characterized by a decrease in the SST and an increase in air pressure in the eastern equatorial Pacific region. Many studies have shown that a long-distance teleconnection exists between ENSO and the East Asian climate (e.g., [21]).
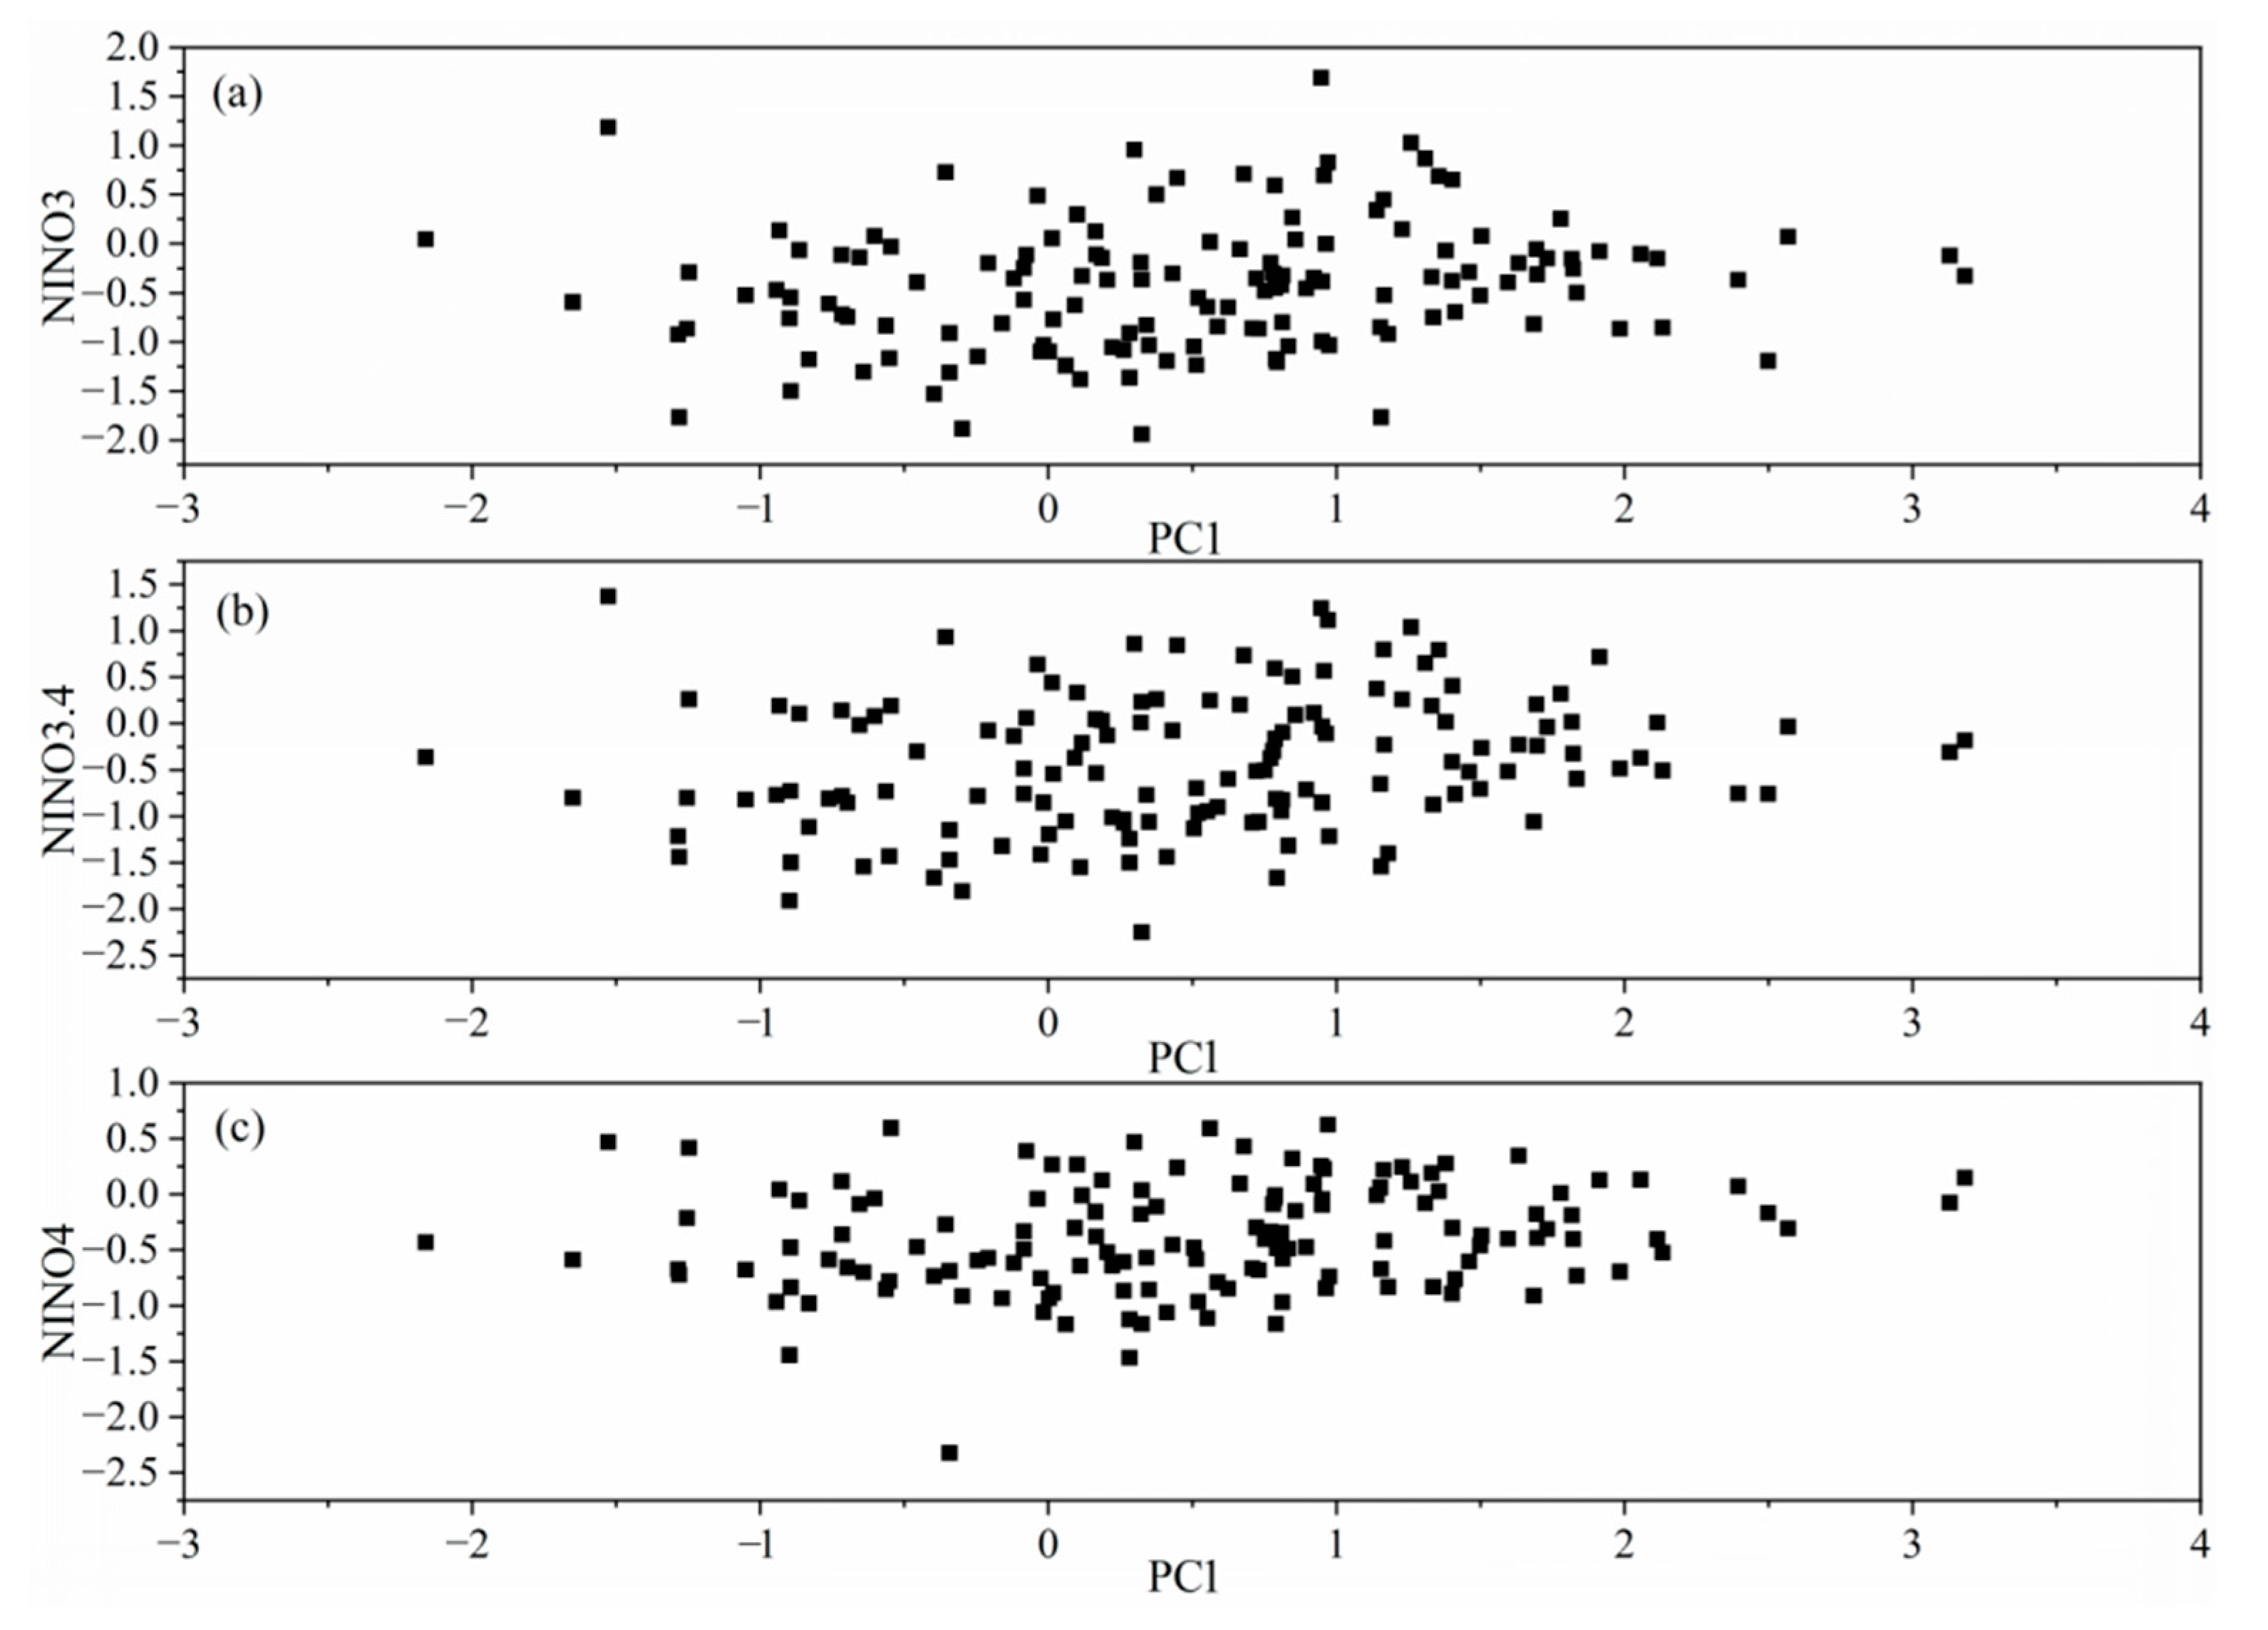
When an ENSO event occurs, it causes the subtropical high to strengthen in the western Pacific, making it difficult for the water vapor in the air to precipitate. The westward movement of the subtropical high primarily increases the intensity of the monsoon in China, leading to droughts and flood disasters in the monsoon area [35]. The study area, the NCP, is located in the monsoon area, and thus the extracted PC1 series and ENSO index were analyzed. As per our calculations with NINO3 (ERSST v5), March to April shows the best correlation with a correlation coefficient of 0.18 (n = 141 and p < 0.05) (Figure 8a and Figure 9a). The NINO3.4 region is the birthplace of the El Nino phenomenon. Correlation analysis with NINO3.4 (ERSST v5) showed that the month with the best correlation ranges from March to April, and the correlation coefficient is 0.2 (n = 141 and p < 0.02) (Figure 8b and Figure 9b). The correlation analysis with NINO4 (ERSST v5) showed that the month with the best correlation ranges between May and June, and the correlation coefficient is 0.193 (n = 141 and p < 0.05) (Figure 8c and Figure 9c).
In order to further explore the relationship between the PC1 series and large temporal-scale SST variation, spatial correlation analysis was carried out between the PC1 series and the ERSST and HadISST global grid data [25]. The results show a positive correlation between the PC1 series and SST (Figure 10). The correlation is strong, and the highest correlation coefficient is 0.5. Based on the above analysis, the principal component series was extracted, and it exhibits a good correlation with ENSO and a significant spatial teleconnection with SST, indicating that the hydroclimatic changes in the NCP may be affected by ENSO. Pascolini-Campbell [36] indicated that ENSO should be distinguished as Central Pacific (CP) and Eastern Pacific types, Figure 10 shows that climate over the NCP is probably affected by CP El Nino. In fact, Liu [37] and Li [38] also found CP El Nino impacts on hydroclimate variations in Northwest China and Southeast China, respectively.

3.4. Relationship between the Principal Component Analysis Series and Solar Activity

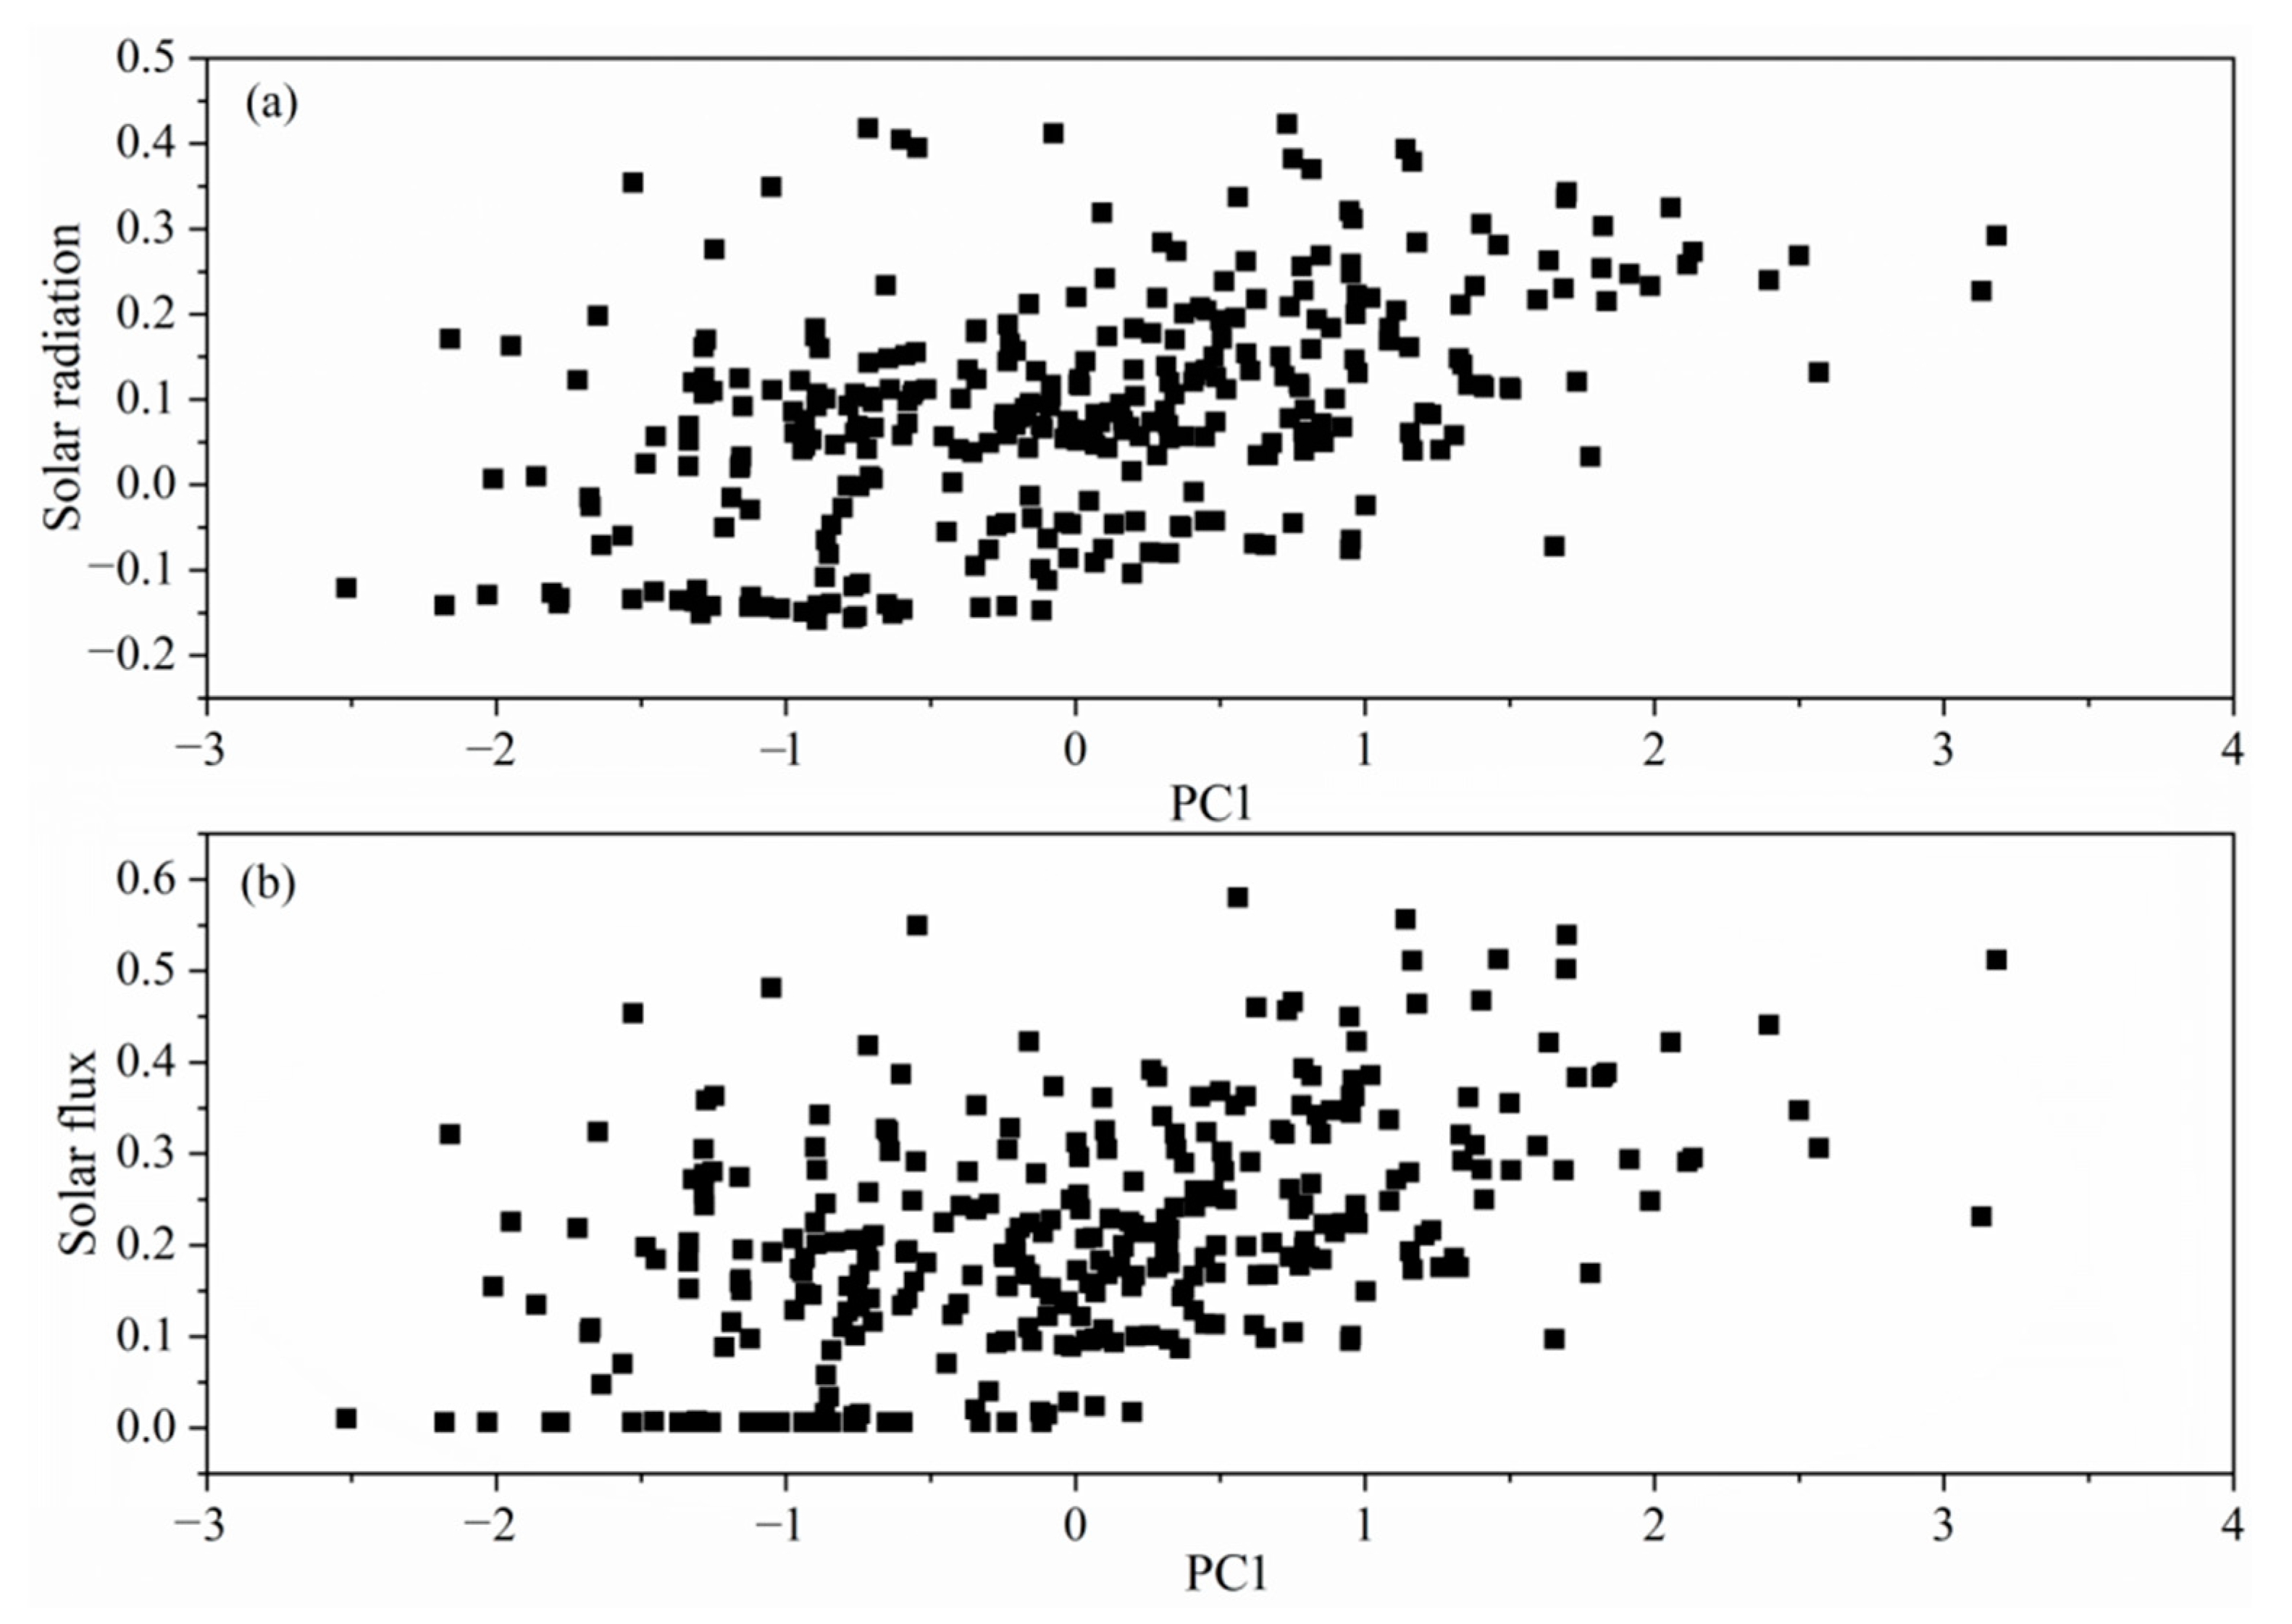
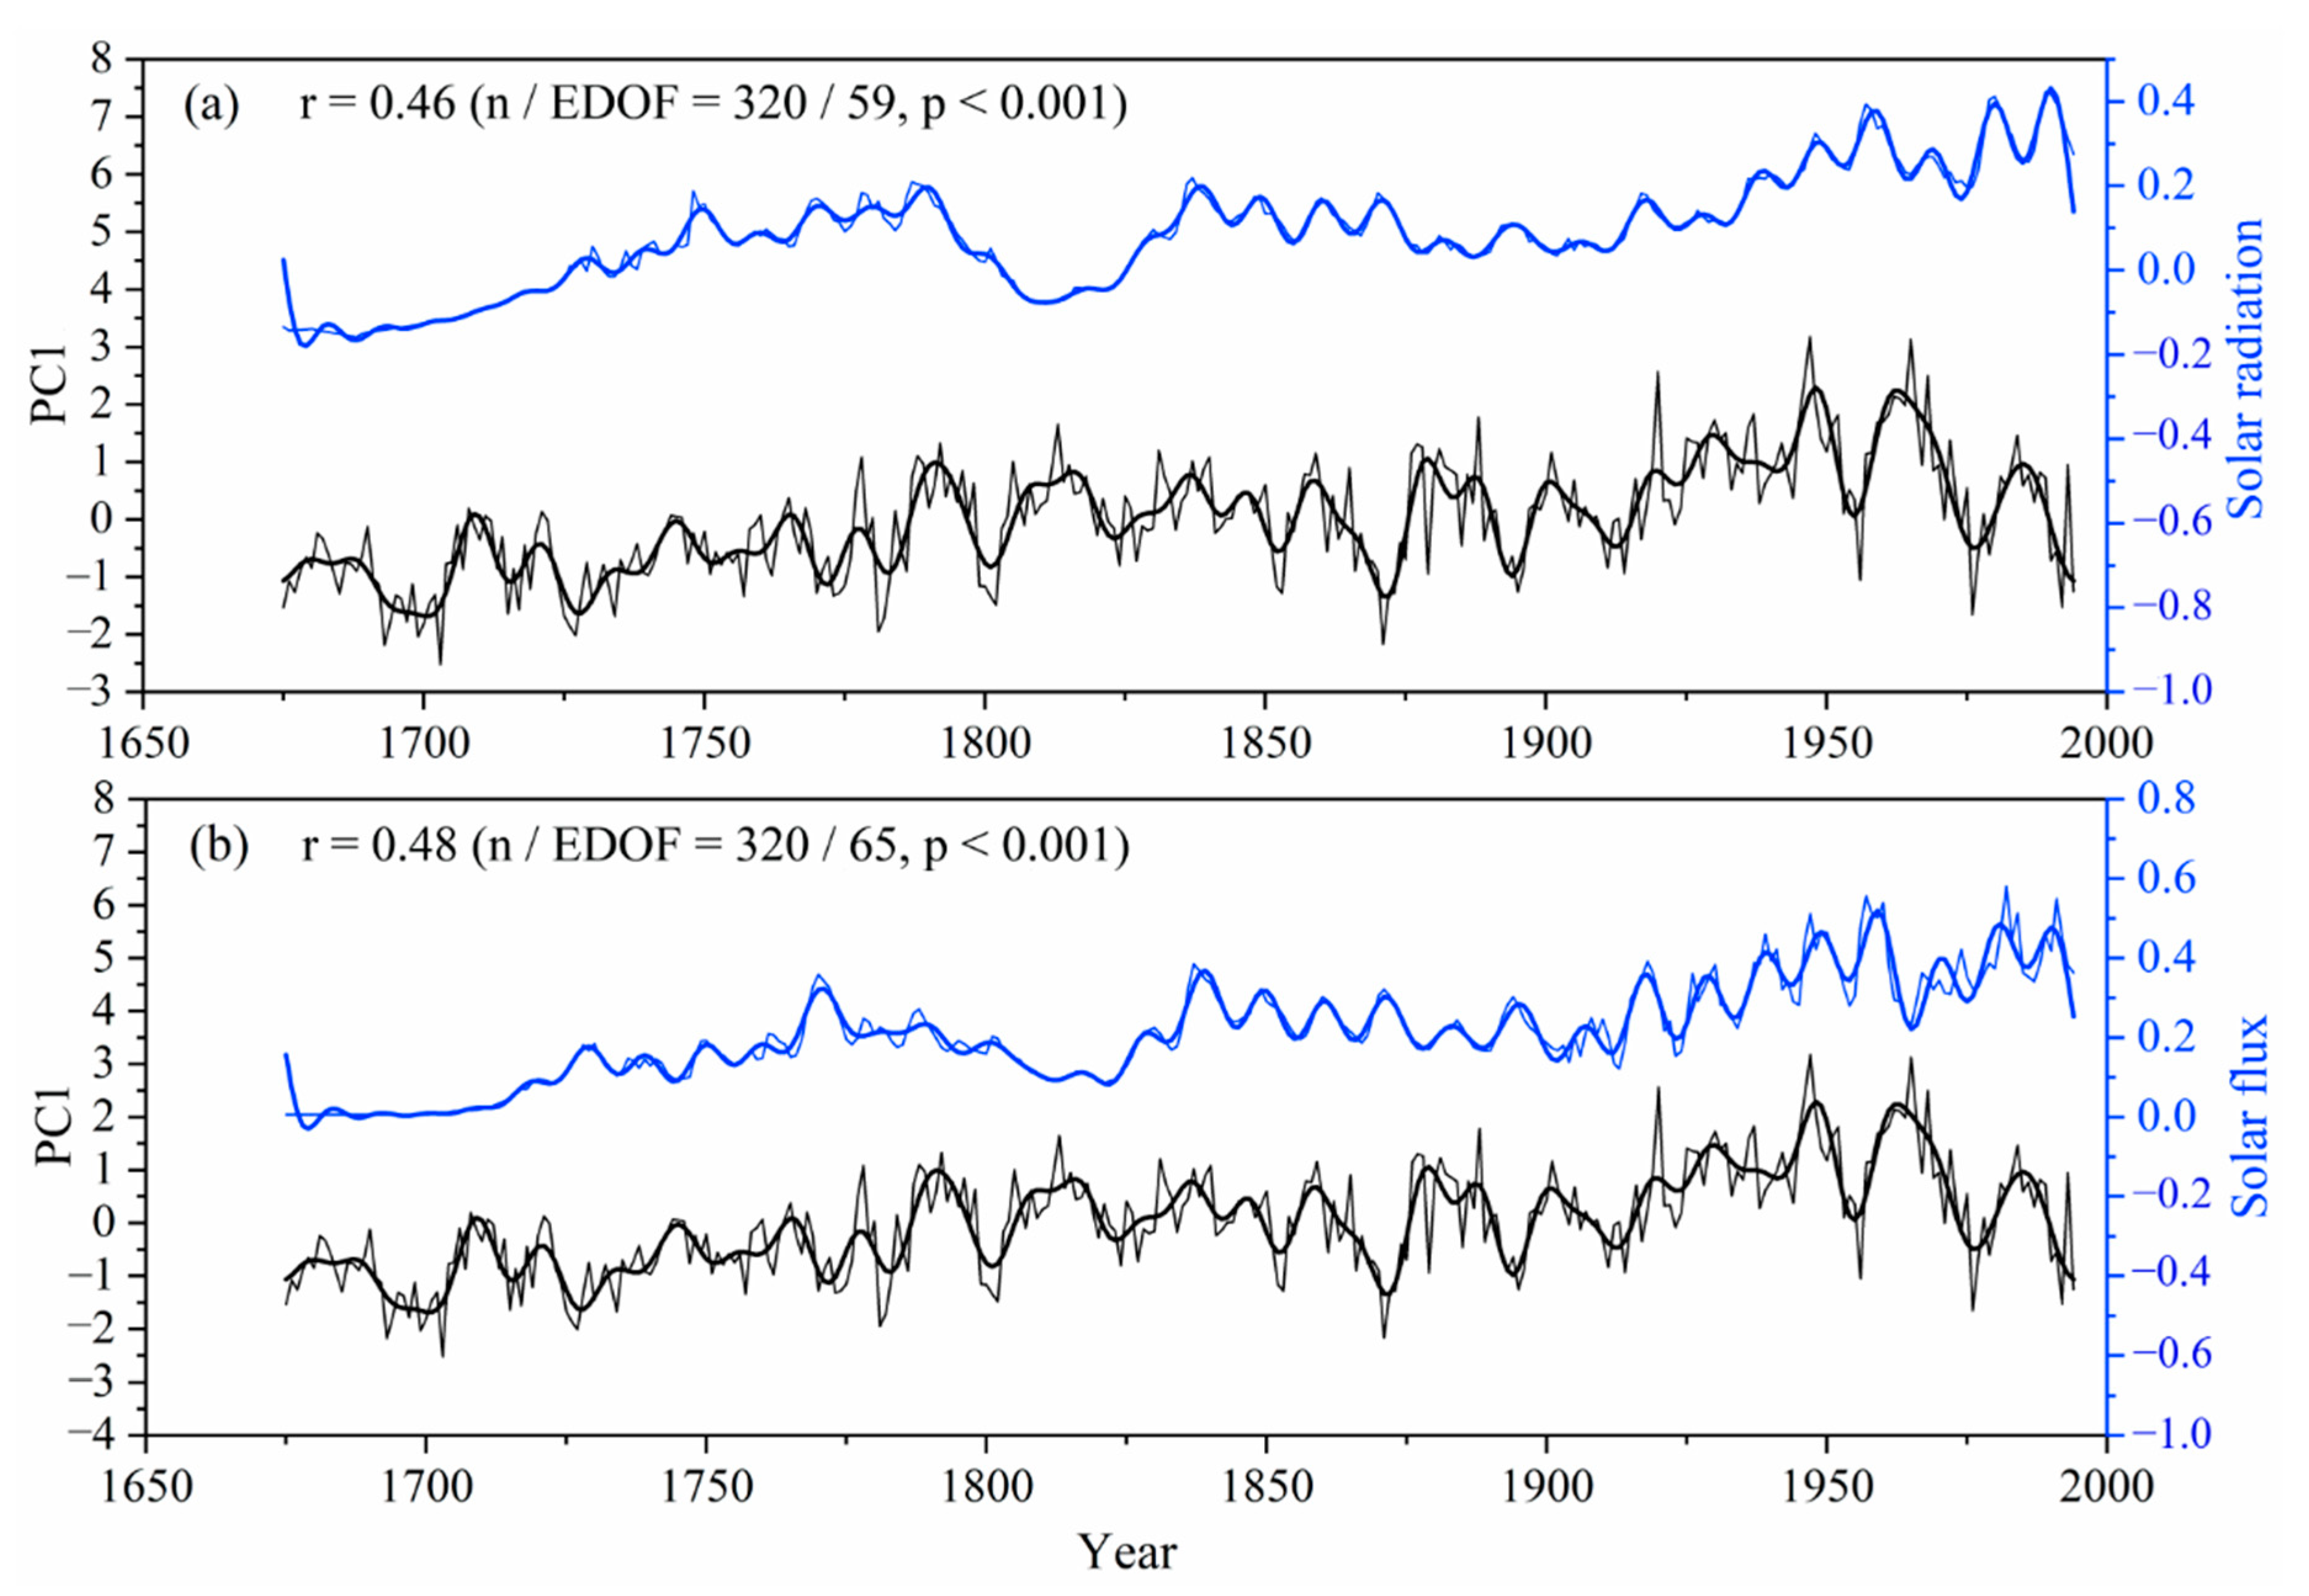
In order to understand the relationship between the PC1 series and solar activity, the series was compared with solar activity correlation indexes, such as sunspots, solar radiation, total solar irradiance, and solar flux. The results show a good correlation between the PC1 series and the annual solar flux (Figure 11b and Figure 12b; the thick lines represent 10-year moving averages), as reconstructed by Lockwood [39]. A good correlation is also observed with solar radiation (Figure 11a and Figure 12a; the thick lines are 10-year low-pass filtering curves), as reported by Mann [40]. The correlation coefficients are 0.48 (n = 320 and p < 0.001) and 0.46 (n = 320 and p < 0.001), respectively.
The sun is the closest star to Earth. Nuclear fusion occurs incessantly, and the heat generated by fusion continues to reach Earth. Therefore, solar energy is the primary energy source of all living activities on Earth. The study of the influence of solar activity on Earth’s climate began in the 17th century. Research has shown that the interannual variation in solar activity is closely related to the interannual variation in Earth’s climate [41]. Abnormal solar activity also exerts a great impact on Earth. For example, trough year, active year, and sunspot cycle are related to precipitation in different regions of Earth; solar flare activity is known to disturb Earth’s electromagnetic field, sometimes severely.
The NCP is located in the East Asian monsoon region. In summer, the northern hemisphere experiences high solar radiation intensity. A large temperature difference arises due to the difference in heat absorption capacity between the sea and the land, increasing the intensity of the summer monsoon. Thus, the water vapor formation over the ocean increases, leading to summer precipitation accounting for a large proportion of annual precipitation in eastern China. Given the complex mechanisms of climate change and limited research on the sun, the relationship between solar activity and climate change should continue to be explored carefully in future climate research.

4. Conclusions

The NCP is a core area in North China. It has been experiencing an increasingly serious regional water shortage, which has negatively impacted people’s daily lives and regional economic development. Therefore, an urgent investigation on the background of this regional climate change is required to identify its possible control factors. As using single paleoclimatic proxies for long-term climate reconstruction poses many shortcomings, this study used four separate data sources relevant to the NCP, namely stalagmite thickness, tree-ring width, tree-ring oxygen isotope ratio, and historical documents based dry/wet index, to conduct the first-ever PC1 in the literature on this topic. The obtained long-term PC1 series spanned 320 years. The results of the correlation analysis showed that the first PC1 series represented summer precipitation and maximum temperature changes in the NCP, thus exhibiting climatic significance. In order to explore the influencing factors of climate change in the NCP and determine whether an external driving mechanism exists, correlation analysis was conducted between the PC1 series and large-scale atmospheric circulation factors. The results showed that the PC1 was not only influenced by the EASM but was also externally driven by solar activity. In addition, as suggested by Zhuo [29] and Man [28], volcanic activity may be potentially important for East Asian climates, we need more and long high-resolution paleoclimate proxies to explore possible connection between volcanic activity and climate variation over the NCP in the future.

Author Contributions

Data curation, Y.L. and Q.L.; formal analysis, R.D. and R.L.; methodology, H.S.; Y.W., and G.L.; writing—original draft, Q.L. and Y.L.; writing—review and editing, Q.L. All authors have read and agree to published version of the manuscript.

Funding

This study was financially supported by the National Natural Science Foundation of China (Grant Nos. 41873021, 41991251, and U1803245); Youth Innovation Promotion Association of CAS (No. 2017451); West Light Foundation of CAS; Young Star of Science and Technology, Shaanxi Province; and Cultivating Foundation of SKLLQG. This work is a contribution of The Belt and Road Centre of Environmental Studies, Institute of Earth and Environment, Chinese Academy of Sciences.

Conflicts of Interest

The authors declare no conflict of interest.

References

  1. Jin, L. Principles of Urban. Disaster Science; China Meteorological Press: Beijing, China, 1997. [Google Scholar]
  2. Li, S.Y.; Ma, J.J.; Xuan, C.Y.; Wang, J. Analysis of extreme weather events in Beijing during 1951–2008. Clim. Environ. Res. 2012, 17, 244–250. [Google Scholar]
  3. Liu, Y.; Xiang, N.; Song, H.M. Tree-ring records in Arxan, Inner Mongolia for the past 187 years. J. Earth Environ. 2012, 3, 862–867. [Google Scholar]
  4. Lei, Y.; Liu, Y.; Song, H.; Sun, B. A wetness index derived from tree-rings in the Mt. Yishan area of China since 1755 AD and its agricultural implications. Chin. Sci. Bull. 2014, 59, 3449–3456. [Google Scholar] [CrossRef]
  5. Wang, Q.; Zhou, H.Y.; Cheng, K.; Chi, H.; Wang, H.; Wang, C.; Ma, Q. Stalagmite records of climatic and environmental changes on western Shandong peninsula in the past 1000 years: Lamina thickness. Mar. Geol. Quat. Geo. 2015, 6, 133–138. [Google Scholar]
  6. Xu, Y.B. Compound Specific Carbon and Hydrogen Isotopes of Long Chain N-Alkane Extracted from Past 15 ka Lacustrine Sediments of Gonghai Lake, Shanxi Province, and Their Paleoclimatic Significance. Dissertation (Master’s Thesis), Lanzhou University, Lanzhou, China, 2014. [Google Scholar]
  7. Chi, H.; Zhang, Z.H.; Zhao, Q. Paleoclimate and paleoenvironmental records of the Karst in the past 1000 years. J. Ludong Univ. 2016, 32, 278–283. [Google Scholar]
  8. Wu, X.D.; Shao, X.M. Status of dendroclimatological study and its prospects in China. Adv. Earth Sci. 1993, 1, 31–35. [Google Scholar]
  9. Cook, E.R.; Anchukaitis, K.J.; Buckley, B.M.; D’Arrigo, R.D.; Jacoby, G.C.; Wright, W.E. Asian Monsoon Failure and Megadrought During the Last Millennium. Science 2010, 328, 486–489. [Google Scholar] [CrossRef] [Green Version]
  10. Büntgen, U.; Tegel, W.; Nicolussi, K.; McCormick, M.; Frank, D.; Trouet, V.; Kaplan, J.O.; Herzig, F.; Heussner, K.-U.; Wanner, H.; et al. 2500 Years of European Climate Variability and Human Susceptibility. Science 2011, 331, 578–582. [Google Scholar] [CrossRef] [Green Version]
  11. Liu, Y.; Xie, L.; Li, Q.; Cai, Q. Growth-climate response analysis between tree-ring width and March-September mean minimum temperature in Dongda Mountain, Gansu, China since 1820 AD. J. Earth Environ. 2012, 3, 900–907. [Google Scholar]
  12. Zhang, Y.C.; Wu, K.; Yu, J.J.; Xia, J. Characteristics of precipitation and air temperature variation during 1951-2009 in North China. J. Nat. Res. 2011, 26, 1930–1941. [Google Scholar]
  13. Ma, X.B. Climate characteristics of water resources in North China. Plat. Meteo. 1999, 18, 520–524. [Google Scholar]
  14. Duo, A.; Zhao, W.J.; Gong, Z.N.; Zhang, M.; Fan, Y.B. Temporal analysis of climate change and its relationship with vegetation cover on the north china plain from 1981 to 2013. Acta Ecol. Sin. 2017, 37, 576–592. [Google Scholar] [CrossRef]
  15. Xu, R.T.; Wu, Y. Water resources in north China face difficulties and solutions. Edu. Geo. 2014, 18, 57–58. [Google Scholar]
  16. Hu, S.Q.; Cao, Z.C.; Liu, T.T. Change features of extreme drought events in North China. Meteo. Environ. Sci. 2017, 24, 121–125. [Google Scholar]
  17. Fu, Y.; Tao, F.; Hao, H.Y.; Cao, Y.; Chen, H.J.; Lin, H.T. Establishment of quality evaluation index system for dehydrated litchi. J. Chin. Inst. Food Sci. Technol. 2013, 13, 158–164. [Google Scholar]
  18. Kong, H.Y.; An, G.A.; Shi, S.J.; Zhang, L.Z.; Xing, Y. Comprehensive evaluation of water environmental quality based on PCA analysis. Pollut. Control. Technol. 2019, 32, 6–8. [Google Scholar]
  19. Ni, Y.N. The Application of Stoichiometry in Analytical Chemistry; Science Press: Beijing, China, 2004; pp. 161–169. [Google Scholar]
  20. Liu, Y.; Lei, Y.; Song, H.M.; Bao, J.; Sun, B.; Linderhoim, H.W. The annual mean lowest temperature reconstruction based on Pinus bungeanas (Pinus bungeana Zucc) ring width in the Yulin region, Shandong, China since AD 1616. J. Earth Environ. 2010, 1, 28–35. [Google Scholar]
  21. Li, Q.; Nakatsuka, T.; Kawamura, K.; Liu, Y.; Song, H. Hydroclimate variability in the North China Plain and its link with El Niño-Southern Oscillation since 1784 A.D.: Insights from tree-ring celluloseδ18O. J. Geophys. Res. Space Phys. 2011, 116, 116. [Google Scholar] [CrossRef] [Green Version]
  22. Tan, M.; Liu, T.; Hou, J.; Qin, X.; Zhang, H.; Li, T. Cyclic rapid warming on centennial-scale revealed by a 2650-year stalagmite record of warm season temperature. Geophys. Res. Lett. 2003, 30, 30. [Google Scholar] [CrossRef]
  23. Shen, C.; Wang, W.-C.; Hao, Z.; Gong, W. Characteristics of anomalous precipitation events over eastern China during the past five centuries. Clim. Dyn. 2007, 31, 463–476. [Google Scholar] [CrossRef]
  24. Bretherton, C.S.; Widmann, M.; Dymnikov, V.P. The effective number of spatial degrees of freedom of a time-varying field. J. Clim. 1999, 12, 1990–2009. [Google Scholar] [CrossRef]
  25. KNMI Explorer. Available online: http://climexp.knmi.nl (accessed on 16 August 2019).
  26. Liu, Y.; Cai, W.; Sun, C.; Song, H.; Cobb, K.M.; Li, J.; Leavitt, S.W.; Wu, L.; Cai, Q.; Liu, R.; et al. Anthropogenic Aerosols Cause Recent Pronounced Weakening of Asian Summer Monsoon Relative to Last Four Centuries. Geophys. Res. Lett. 2019, 46, 5469–5479. [Google Scholar] [CrossRef] [Green Version]
  27. Sun, C.; Liu, Y.; Cai, Q.; Li, Q.; Song, H.; Fang, C.; Liu, R. Similarities and differences in driving factors of precipitation changes on the western Loess Plateau and the northeastern Tibetan Plateau at different timescales. Clim. Dyn. 2020, 55, 1–14. [Google Scholar] [CrossRef]
  28. Man, W.; Zhou, T.; Jungclaus, J.H. Effects of Large Volcanic Eruptions on Global Summer Climate and East Asian Monsoon Changes during the Last Millennium: Analysis of MPI-ESM Simulations. J. Clim. 2014, 27, 7394–7409. [Google Scholar] [CrossRef]
  29. Zhuo, Z.; Gao, C.; Pan, Y. Proxy evidence for China’s monsoon precipitation response to volcanic aerosols over the past seven centuries. J.Geophys. Res. Atmos. 2014, 119, 6638–6652. [Google Scholar] [CrossRef]
  30. Huang, R.H.; Gu, L.; Chen, J.L.; Huang, G. Recent progresses in studies of the temporal-spatial variations of the east monsoon system and their impacts on climate anomalies in China. Chin. J. Atmos. Sci. 2008, 32, 691–719. [Google Scholar]
  31. Wang, Y.; Wang, B.; Oh, J.-H. Impact of the Preceding El Nino on the East Asian Summer Atmosphere Circulation. J. Meteorol. Soc. Jpn. 2001, 79, 575–588. [Google Scholar] [CrossRef] [Green Version]
  32. Guo, Q.Y. The summer monsoon intensity index in East Asia and its variation. Acta. Geo. Sin. 1983, 50, 207–217. [Google Scholar]
  33. Lau, K.-M.; Kim, K.-M.; Yang, S. Dynamical and Boundary Forcing Characteristics of Regional Components of the Asian Summer Monsoon. J. Clim. 2000, 13, 2461–2482. [Google Scholar] [CrossRef]
  34. Zhang, J.; Yang, J.L.; Gao, F. Relationship between ENSO events and precipitation in Zhaoyuan city from 1981 to 2010. Meteo. J. Inner Mongolia. 2017, 24, 17–21. [Google Scholar]
  35. Li, H.; Zhou, S.W.; Wang, Y.F. A review on relationship between subtropical high anomaly over West Pacific and summer precipitation in the middle-lower reaches of the Yangtze River. J. Meteo. Environ. 2013, 29, 93–102. [Google Scholar]
  36. Pascolini-Campbell, M.; Zanchettin, D.; Bothe, O.; Timmreck, C.; Matei, D.; Jungclaus, J.H.; Graf, H.-F. Toward a record of Central Pacific El Niño events since 1880. Theor. Appl. Clim. 2014, 119, 379–389. [Google Scholar] [CrossRef]
  37. Liu, Y.; Cobb, K.M.; Song, H.; Li, Q.; Li, C.Y.; Nakatsuka, T.; An, Z.; Zhou, W.; Cai, Q.; Li, J.; et al. Recent enhancement of central Pacific El Niño variability relative to last eight centuries. Nat. Commun. 2017, 8, 15386. [Google Scholar] [CrossRef] [Green Version]
  38. Li, Q.; Liu, Y.; Nakatsuka, T.; Zhang, Q.B.; Ohnishi, K.; Sakai, A.; Kobayashi, O.; Pan, Y.; Song, H.; Liu, R.; et al. Oxygen stable isotopes of a network of shrubs and trees as high-resolution plaeoclimatic proxies in Northwestern China. Agric. For. Meteorol. 2020, 107929. [Google Scholar] [CrossRef]
  39. Lockwood, M.; Rouillard, A.P.; Finch, I.D. The rise and fall of open solar flux during the current grand solar maximum. Astrophys. J. 2009, 700, 937–944. [Google Scholar] [CrossRef]
  40. Mann, M.E.; Cane, M.A.; Zebiak, S.E.; Clement, A. Volcanic and Solar Forcing of the Tropical Pacific over the Past 1000 Years. J. Clim. 2005, 18, 447–456. [Google Scholar] [CrossRef] [Green Version]
  41. Xiao, Z.N.; Zhong, Q.; Yin, Z.Q.; Zhou, L.; Song, Y.; Han, Y. Advances in the research of impact of decadal solar cycle on modern climate. Adv. Earth Sci. 2013, 28, 1335–1348. [Google Scholar]
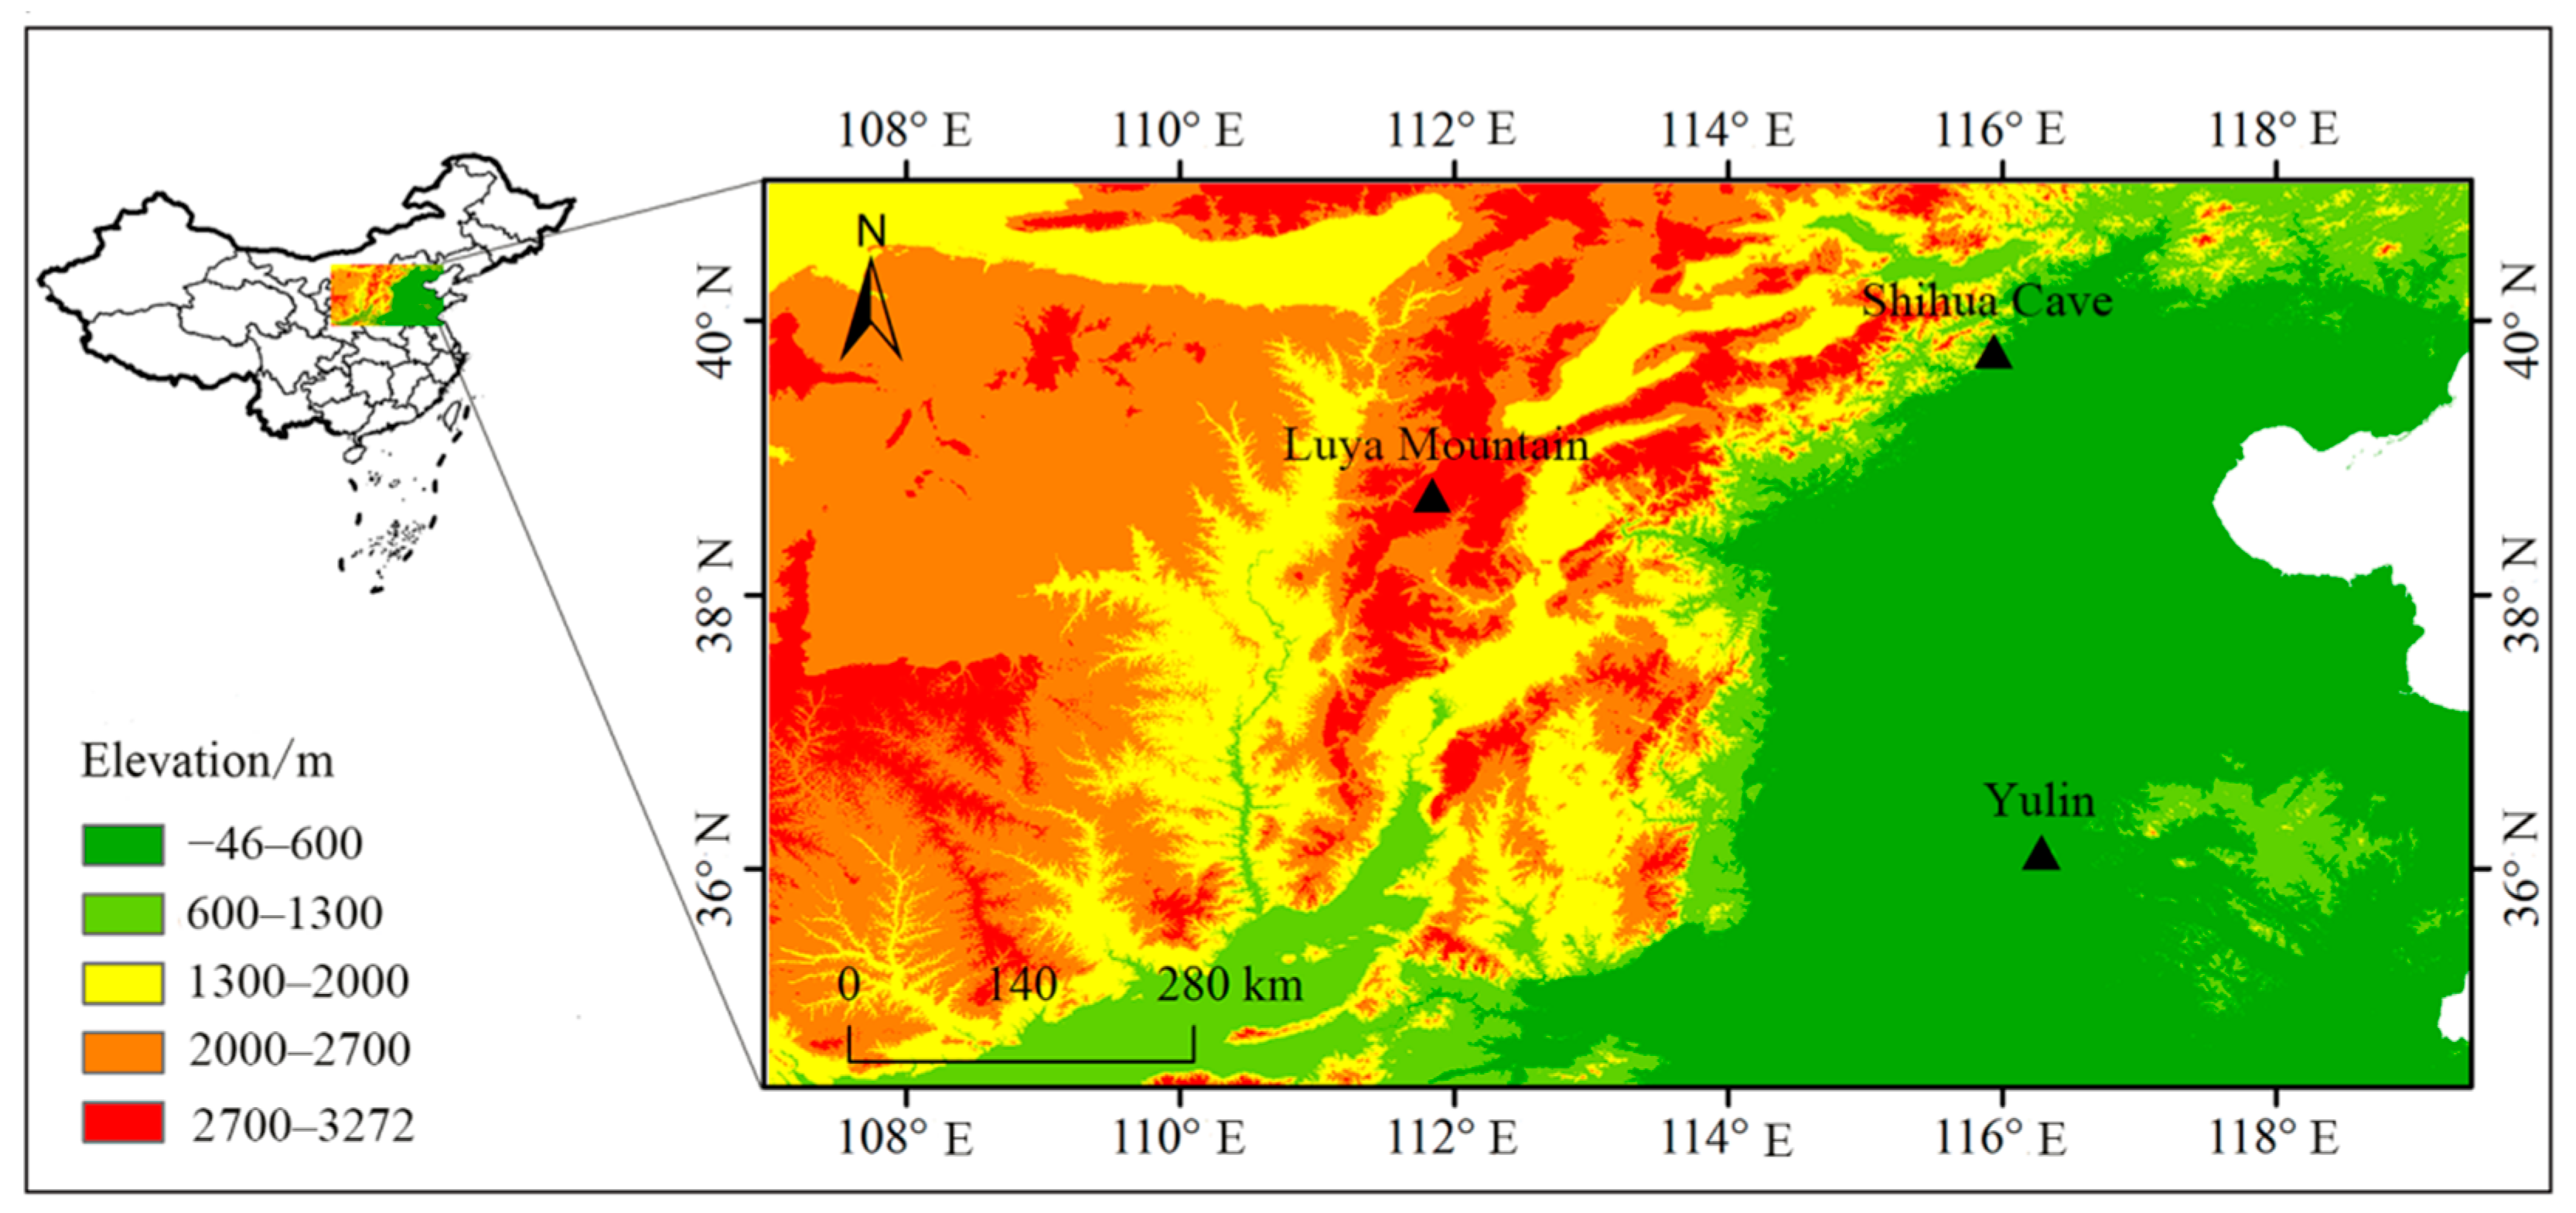
Figure 1. Map showing the study area and sampling sites.
Atmosphere 11 01180 g001
Figure 2. Mean monthly precipitation (P) and monthly maximum temperature (Tmax) in the North China Plain (NCP) during 1955–1994.
Atmosphere 11 01180 g002
Figure 3. Four standardized individual series used for the principal component analysis. δ18O means tree-ring δ18O in Luya Mountain of Shanxi Province (Li [21]); LTC means the layer thickness of stalagmites in Beijing’s Shihua cave (Tan [22]); STD indicates tree-ring width chronology in Shandong Province (Liu [20]); DWI indicates regional dryness/wetness index based on historical literature and geographic information system over whole the North China Plain (Shen [23]).
Atmosphere 11 01180 g003
Figure 4. Time series of the first principal component extracted from the four paleoclimate proxies.
Atmosphere 11 01180 g004
Figure 5. Spatial correlations patterns between first principal component (PC1) and (a) June–August averaged Climatic Research Unit (CRU) TS 4.03 maximum temperature (Tmax) (1951–1994 CE) and (b) May–June averaged CRU TS 4.03 precipitation (1951–1994 CE) and (c) May–June averaged GPCC (Global Precipitation Climatology Centre) 1.0 precipitation (1951–1994 CE). Correlations not significant at the 90% level have been masked out on the map.
Atmosphere 11 01180 g005
Figure 6. PC1 and East Asian summer monsoon (EASM) indices scatter plot (a) Lau [33], (b) Guo [32], and (c) Wang [31].
Atmosphere 11 01180 g006
Figure 7. Comparison between the PC1 series and EASM indices defined by (a) Lau [33], (b) Guo [32], and (c) Wang [31]. The thick lines are 10-year low-pass filter series.
Atmosphere 11 01180 g007
Figure 8. Scatter diagrams between PC1 and the (a) NINO3, (b) NINO3.4, and (c) NINO4 indices.
Atmosphere 11 01180 g008
Figure 9. Comparison between the PC1 series (d) and the (a) NINO3, (b) NINO3.4, and (c) NINO4 anomalies. The thick lines depict 10-year low-pass filter series.
Atmosphere 11 01180 g009
Figure 10. Spatial correlation patterns between the PC1 series and the (a) June–July averaged HadISST 1 SST (1951–1994 CE) and (b) June–July averaged ERSST v5 SST (1951–1994 CE). Correlations not significant at the 90% level have been masked out on the map.
Atmosphere 11 01180 g010
Figure 11. PC1 and the (a) solar radiation and (b) solar flux indices scatter plot.
Atmosphere 11 01180 g011
Figure 12. Correlations of the PCA series with (a) solar radiation and (b) solar flux.
Atmosphere 11 01180 g012
Publisher’s Note: MDPI stays neutral with regard to jurisdictional claims in published maps and institutional affiliations.