Article

The Potential of Using Tree-Ring Chronology from the Southern Coast of Korea to Reconstruct the Climate of Subtropical Western North Pacific: A Pilot Study

1
Department of Oceanography, Chonnam National University, Gwangju 61186, Korea
2
Department of Earth Sciences, University of Gothenburg, 405 30 Gothenburg, Sweden
*
Author to whom correspondence should be addressed.
Atmosphere 2020, 11(10), 1082; https://doi.org/10.3390/atmos11101082
Submission received: 11 August 2020 / Revised: 7 October 2020 / Accepted: 9 October 2020 / Published: 11 October 2020
(This article belongs to the Special Issue Past Climate Reconstructed from Tree Rings)

Abstract

:
Tree-ring width (TRW) chronologies have successfully been used as climate proxies to infer climate variabilities over the past hundreds to thousands of years worldwide beyond observational records. However, these data are scarce over parts of subtropical East Asia, and especially over the Korean Peninsula. In this pilot study, Korean red pine (Pinus densiflora Siebold and Zucc.) TRW chronologies from Mt. Mudeung and Mt. Wolchul, South Korea, were developed, and their local- to large-scale climatic responses were investigated. Mt. Mudeung TRW had a positive association with local temperature in the preceding December and April. Mt. Wolchul TRW had a positive association with local temperature in the preceding December and most of the early summer to autumn months, and with local precipitation in February and October. On a large scale, both TRWs retained meaningful temperature and monsoon precipitation signals over East Asia and sea surface temperature signals over the Western North Pacific. The results suggest that the subtropical trees from South Korea can be used to infer past long-term climate variability at both local and large scales over East Asia and the Western North Pacific, such as the East Asian summer monsoon, the Kuroshio Current, the Western North Pacific Subtropical High, and El Niño–Southern Oscillation.

1. Introduction

Understanding past climate variations is an essential task to increase our knowledge of complex climate processes needed for predicting future climate changes. Natural archives, such as tree rings, have successfully been utilized to reconstruct long-term climate variability in the past. Tree-ring data, featured by their annual resolution and precise dating, have been widely used to reconstruct the past variability of temperature, precipitation, drought, and even large-scale circulation features for hundreds to thousands of years [1,2,3,4,5,6,7,8,9].
Despite their worldwide availability and abundance, there are still regions such as subtropical East Asia (including the coastal region of Western North Pacific) where there is a lack of tree-ring data [10]. This is the most highly populated region in the world, where climate has a profound impact on socioeconomical activities [11]. Over recent decades, the Western North Pacific region has experienced the strongest warming rate of all oceans (up to 0.87 °C/decade at 38° N, 142° E for the 1981–2005 period) [12,13,14], and this trend is expected to continue along with global warming [15,16,17]. Therefore, a long-term context of the observed changes is needed to fully estimate the rate of anthropogenic influence. In general, the warm and humid climate of the region [18] is favorable for tree growth. However, this can make tree growth become less sensitive to climatic factors, and consequently, tree-ring data from East Asia are not often used for climate reconstructions. Although some previous studies have utilized tree-ring data to reconstruct climate variabilities in this region, most have mainly focused on a highly local scale [19,20,21,22,23,24,25,26,27]. The enhancement of the tree-ring data network for this region is needed to increase our understanding of large-scale climate variability, such as the East Asian monsoon or Western Pacific oceanic variability, in a long-term context; however, this is a challenging task.
Recently, Zhang et al. [28] suggested the potential of using tree-ring width (TRW) data from Jeju island, the southernmost island in subtropical Korea, to reveal the long-term climate variability over the Western North Pacific, as well as possibly the intensity of the Kuroshio Current. However, the study was based on only two tree species from a single location. To reconstruct large-scale oceanic conditions, more chronologies from a larger area are needed. In the present study, we present two newly developed Korean red pine (Pinus densiflora Siebold and Zucc.) TRW chronologies collected from two mountains (Mt. Mudeung and Mt. Wolchul) on the southern coast of the Korean Peninsula, which is located in the northernmost region to where the Kuroshio Current reaches. The aim of the study was to explore the potential of using a regional TRW dataset to reconstruct climate conditions over East Asia and the Western North Pacific. First, we investigated tree-growth responses of the new TRW chronologies to local- and large-scale climate conditions, and then we explored if oceanic signals such as sea surface temperature (SST) could be obtained from the TRW chronologies.
This paper is organized as follows. Section 2 provides a description of the data and methods used in this study, including the processes of developing the new TRW chronologies. The results are described and discussed in Section 3. A summary and conclusions are given in Section 4.

2. Materials and Methods

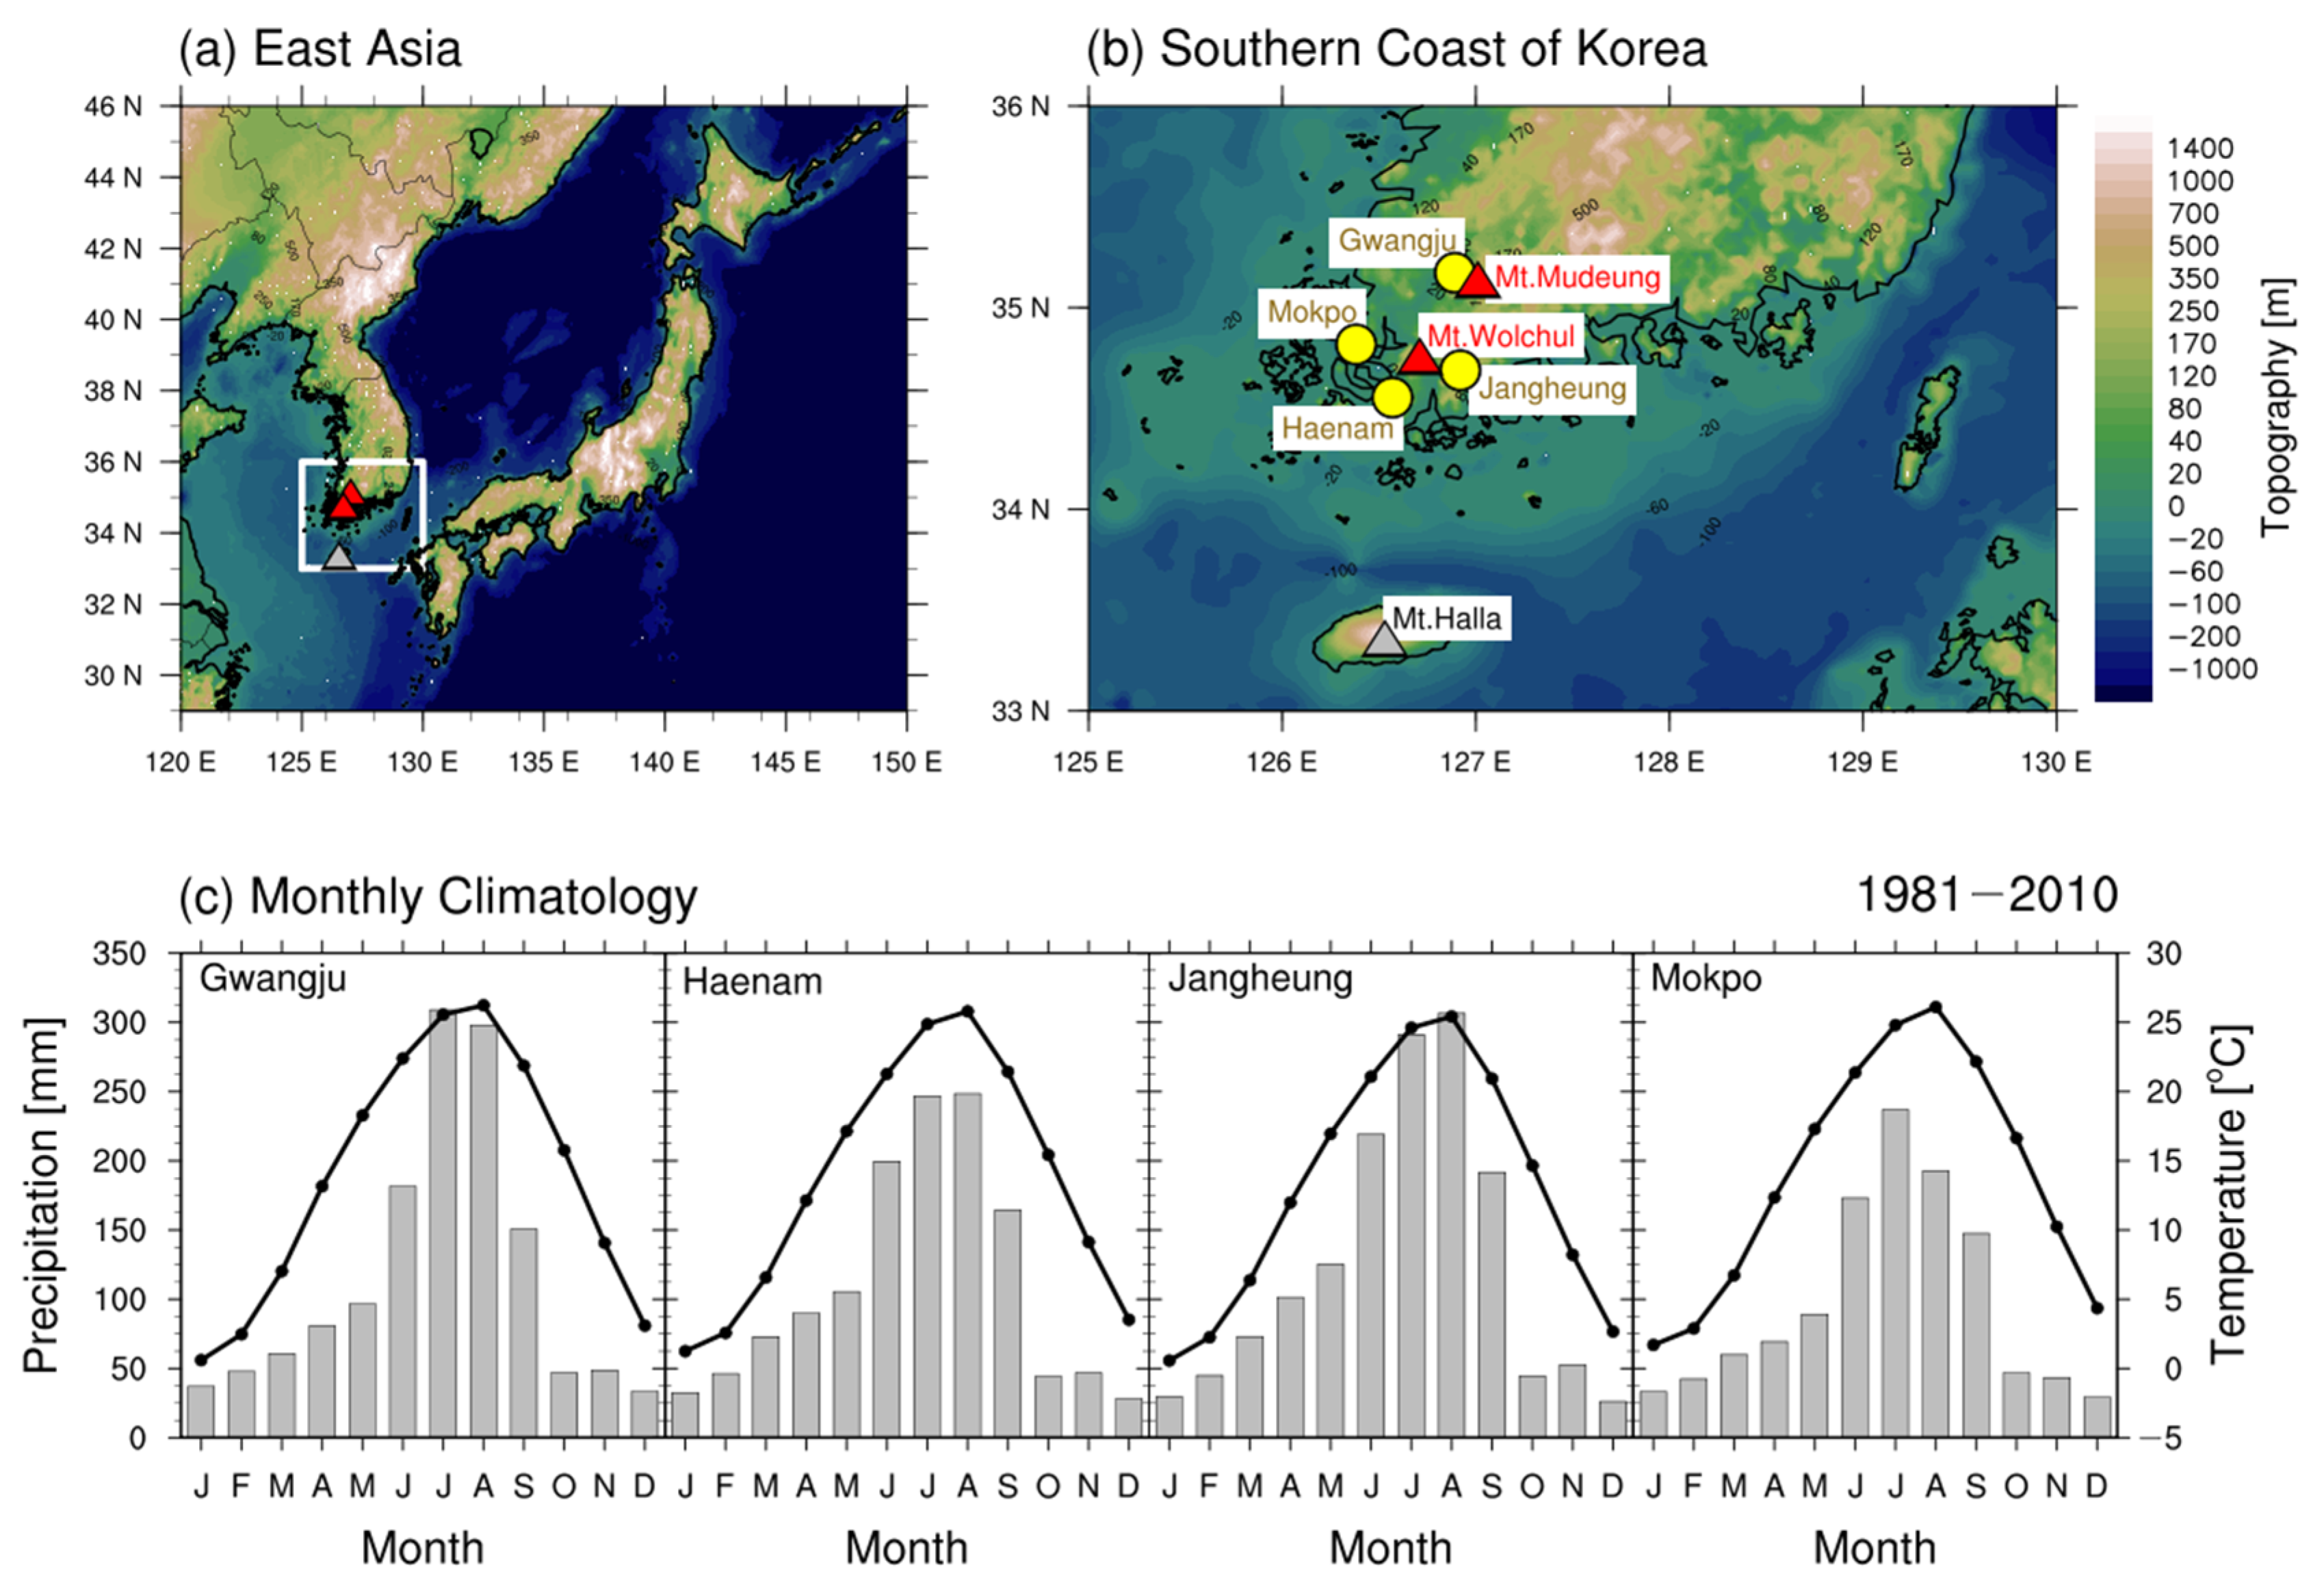
2.1. Study Area and Climate

Mt. Mudeung (35° N, 127° E, 1187 m a.s.l.) and Mt. Wolchul (34° N, 126° E, 809 m a.s.l.) are located in the southern coastal region of the Korean Peninsula (Figure 1a,b). The climate of the region is classified as warm oceanic or humid subtropical, according to the Köppen climate classification scheme [18]. Surface air temperature (SAT) exhibits a clear seasonal cycle, with its maximum in August and minimum in January (Figure 1c). Due to the influence of the East Asian monsoon, there is the maximum precipitation from June to September (Figure 1c), contributing approximately two-thirds of the total annual precipitation. Relatively fertile soil overlies basement rocks over the sampling site in Mt. Mudeung. Korean red pines, surrounded by dwarf deciduous shrubs, grow on relatively open land without much competition for sunlight. The sampling site in Mt. Wolchul has a rockier environment than Mt. Mudeung. However, the vegetation is quite dense at our sampling site, where Korean red pines are mixed with other relatively short (small-sized) deciduous tree species and shrubs. Both mountains are part of the national nature reserves of South Korea, so there is a substantial number of well-preserved Pinus densiflora [29,30], a species that has been previously and widely used in tree-ring studies in this region [31,32,33].

2.2. Tree-Ring Sampling and Development of TRW Chronologies

Tree-ring sampling was performed close to the local altitudinal tree-growth limits of Korean red pine, which are approximately 800 and 600 m a.s.l. (meters above sea level) at Mt. Mudeung and Mt. Wolchul, respectively. At least two cores (>90° apart along the cross-section of the tree) were sampled from each tree at approximately 1.2 m above ground using an increment borer with a 0.5 mm diameter. In total, 151 cores from 51 trees and 64 cores from 27 trees were collected at Mt. Mudeung and Mt. Wolchul, respectively.
All the tree-ring samples were air-dried and glued to wooden laths to facilitate measurement. The samples were then polished with progressively finer sandpapers to enhance the visibility of the annual rings. Individual TRWs were measured with a precision of 0.01 mm using a stereomicroscope coupled to a Lintab 6 movable measurement table, combined with Time Series Analysis Program (TSAP) software (Version 4.69h) (both from Rinntech, Heidelberg, Germany). To ascertain the year in which each tree ring was formed, the cores were cross-dated by comparing the growth patterns of TRWs among each other, both visually as well as by using the TSAP software. Subsequently, possible measurement mistakes were checked by using the COFECHA software (Version 6.02P) [34,35].
The measured and cross-dated TRW series of the same tree were averaged to generate one TRW series for individual trees and then standardized to remove nonclimatic growth trends using the ARSTAN software (Version 44h3) [36,37]. The age trend was mostly expressed as a negative exponential curve. However, some young trees occasionally show a partially positive growth trend, which can be caused by rapid growth. Therefore, when the negative exponential curve was inapplicable, a Hugershoff curve or a horizontal line was utilized as the age trend depending on the characteristics of the individual TRW series. For the samples from Mt. Mudeung, one was expressed as the horizontal line and two were expressed as the Hugershoff curves. For Mt. Wolchul, two were expressed as the Hugershoff curves. The standardization was performed by dividing the ring width with the corresponding value of the fitted curve for each year. The standardized individual TRW time series were then averaged into a standard chronology for each site. Then, the standard chronology was further processed into the residual chronology by removing autocorrelation.
The expressed population signal (EPS) criterion was applied to evaluate the robustness of the TRW chronologies. The EPS estimates how closely a chronology obtained from a finite number of tree-ring series resembles a hypothetical chronology based on an infinite number of series [10]. Usually, an EPS value of 0.85 is defined as a threshold for a reliable chronology (i.e., EPS > 0.85) [38]. In this study, EPS values were calculated in a 15-year window with a lag of one year.

2.3. Climatic Data

Monthly SAT (monthly mean of daily mean, maximum, and minimum SAT) and total precipitation data from four meteorological stations belonging to the Korea Meteorological Administration (https://data.kma.go.kr) [39] that are closest to the two mountains, at Gwangju, Haenam, Jangheung, and Mokpo (see Figure 1b for the locations), were used to investigate the influence of local climate on the tree growth for the 1973–2018 period. The four stations’ elevations are 72, 16, 45, and 45 m a.s.l., respectively. Because there is no meteorological station close to Mt. Wolchul (within 20 km), we used data from Haenam, Jangheung, and Mokpo stations to analyze local climatic responses of tree growth in Mt. Wolchul, whereas data from Gwangju station were used to analyze the local climatic response of tree growth in Mt. Mudeung.
For the large-scale analysis, gridded data of monthly mean SAT, total precipitation, mean SST and mean geopotential height at 850 hPa (GPH850) from global observational or reanalysis datasets were used. SAT was derived from the Hadley Centre-Climatic Research Unit Version 4 (HadCRUT4) dataset [40], which has a resolution of 5° latitude × 5° longitude, for the 1979–2018 period. Precipitation was derived from the CPC Merged Analysis of Precipitation (CMAP) dataset [41], which has a resolution of 2.5° × 2.5°, for the 1979–2018 period. SST was derived from the Hadley Centre Global Sea Ice and Sea Surface Temperature (HadISST) dataset [42], which has a resolution of 1° × 1°, for the 1971–2016 period. GPH850 was derived from the Japanese 55-year Reanalysis (JRA-55) dataset [43], which has a resolution of 1.25° × 1.25°, for the 1971–2016 period. All climatic analysis and figures in this study were conducted and plotted by using the National Center for Atmospheric Research (NCAR) Command Language (NCL) [44]. In all figures, correlations were calculated after removing the long-term linear trends of variables for the analysis period.

3. Results and Discussions

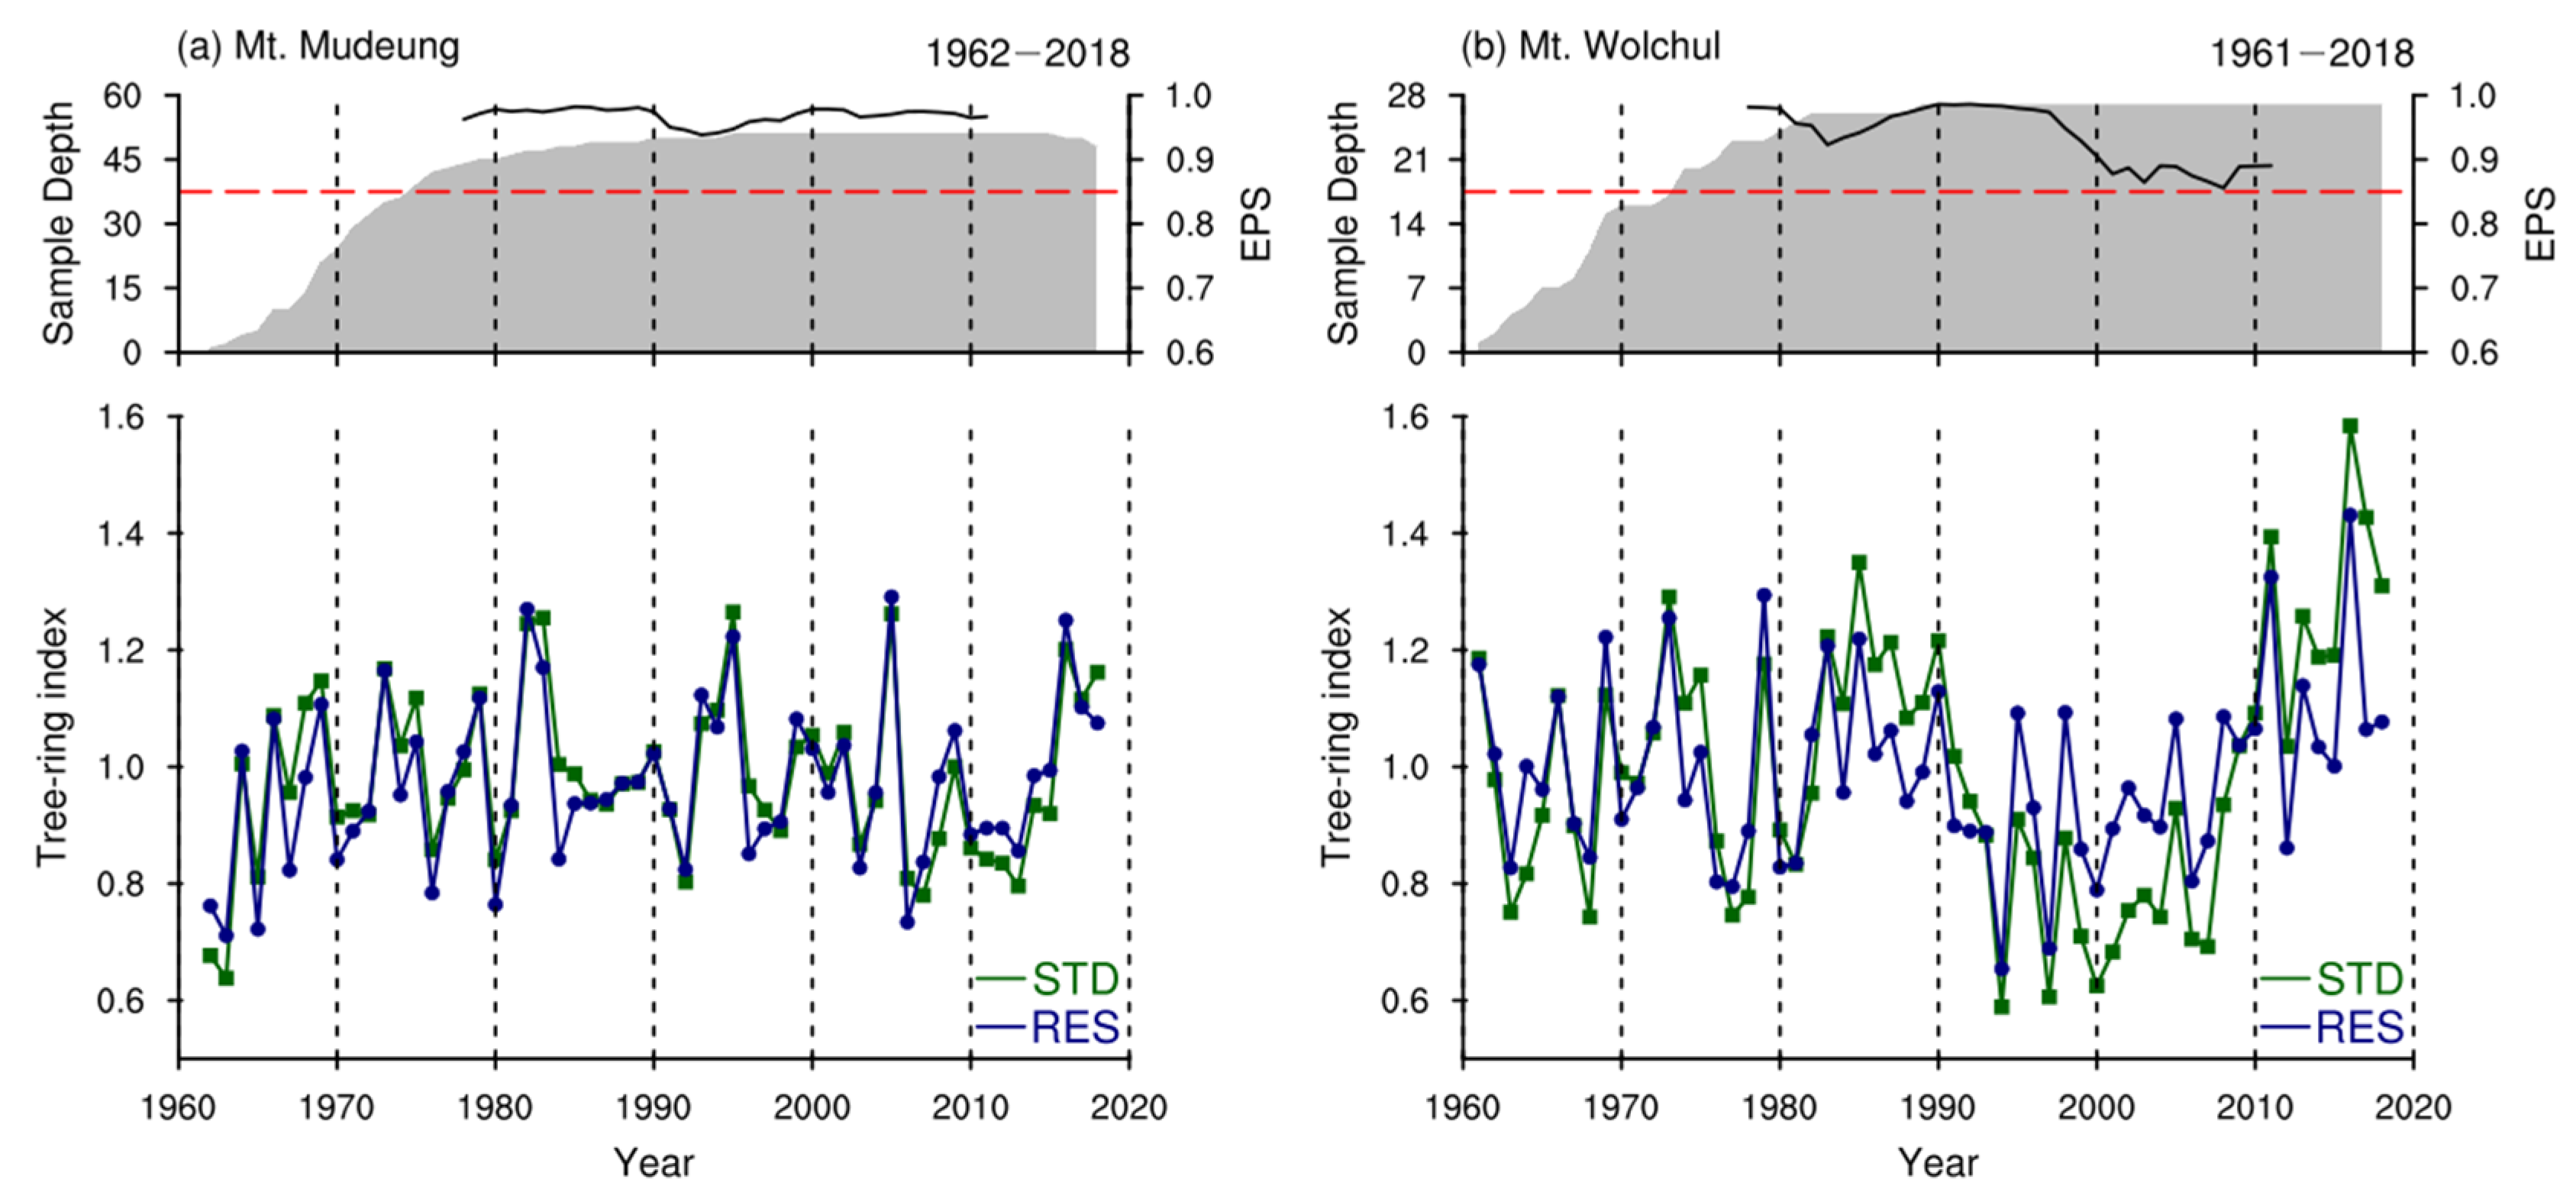
3.1. Characteristics of TRW Chronologies from Mt. Mudeung and Mt. Wolchul

Figure 2 shows the TRW standard and residual chronologies of Mt. Mudeung and Mt. Wolchul. The Mt. Mudeung and the Mt. Wolchul chronologies covered the periods of 1962–2018 and 1961–2018, respectively. As shown in Table 1, the mean age of sampled trees from Mt. Mudeung and Mt. Wolchul were 46 years and 48 years, respectively. The mean sensitivities of the Mt. Mudeung and the Mt. Wolchul chronologies were 0.22 and 0.25, respectively. They had almost the same interseries correlation among the sampled trees (0.55 for Mt. Mudeung and 0.57 for Mt. Wolchul). We used the chronologies for the 1971–2018 period for further analysis by taking the hypothesis that TRW chronology is regarded as reliable when EPS values (which were calculated in a 15-year window with a lag of one year in this study) are above 0.85 and the number of trees is greater than five (number of cores > 10) [38].
For both Mt. Mudeung and Mt. Wolchul, there were no large differences between the standard and residual chronologies in terms of linear trends as well as decadal and interannual variability (r = 0.91, p < 0.01 for Mt. Mudeung, r = 0.82, p < 0.01 for Mt. Wolchul, for the 1971–2018 period). Except for the earlier parts with few samples, Mt. Mudeung chronology shows a slight decadal variability since 1980 and the Mt. Wolchul chronology shows a strong trend since 1990. However, it is unclear whether the trend is a cycle of decadal or multidecadal variability. Interestingly, the Mt. Mudeung residual chronology was significantly correlated with the Mt. Wolchul residual chronology (r = 0.44, p < 0.01, for the 1971–2018 period), whereas the correlation between the standard chronologies from Mt. Mudeung and Mt. Wolchul was not significant (r = 0.23, p > 0.10, for the 1971–2018 period). This may suggest that the residual chronologies are slightly better at retaining common signals from large-scale climate variability that affects tree growth at both sites; in that case, common signals exist.

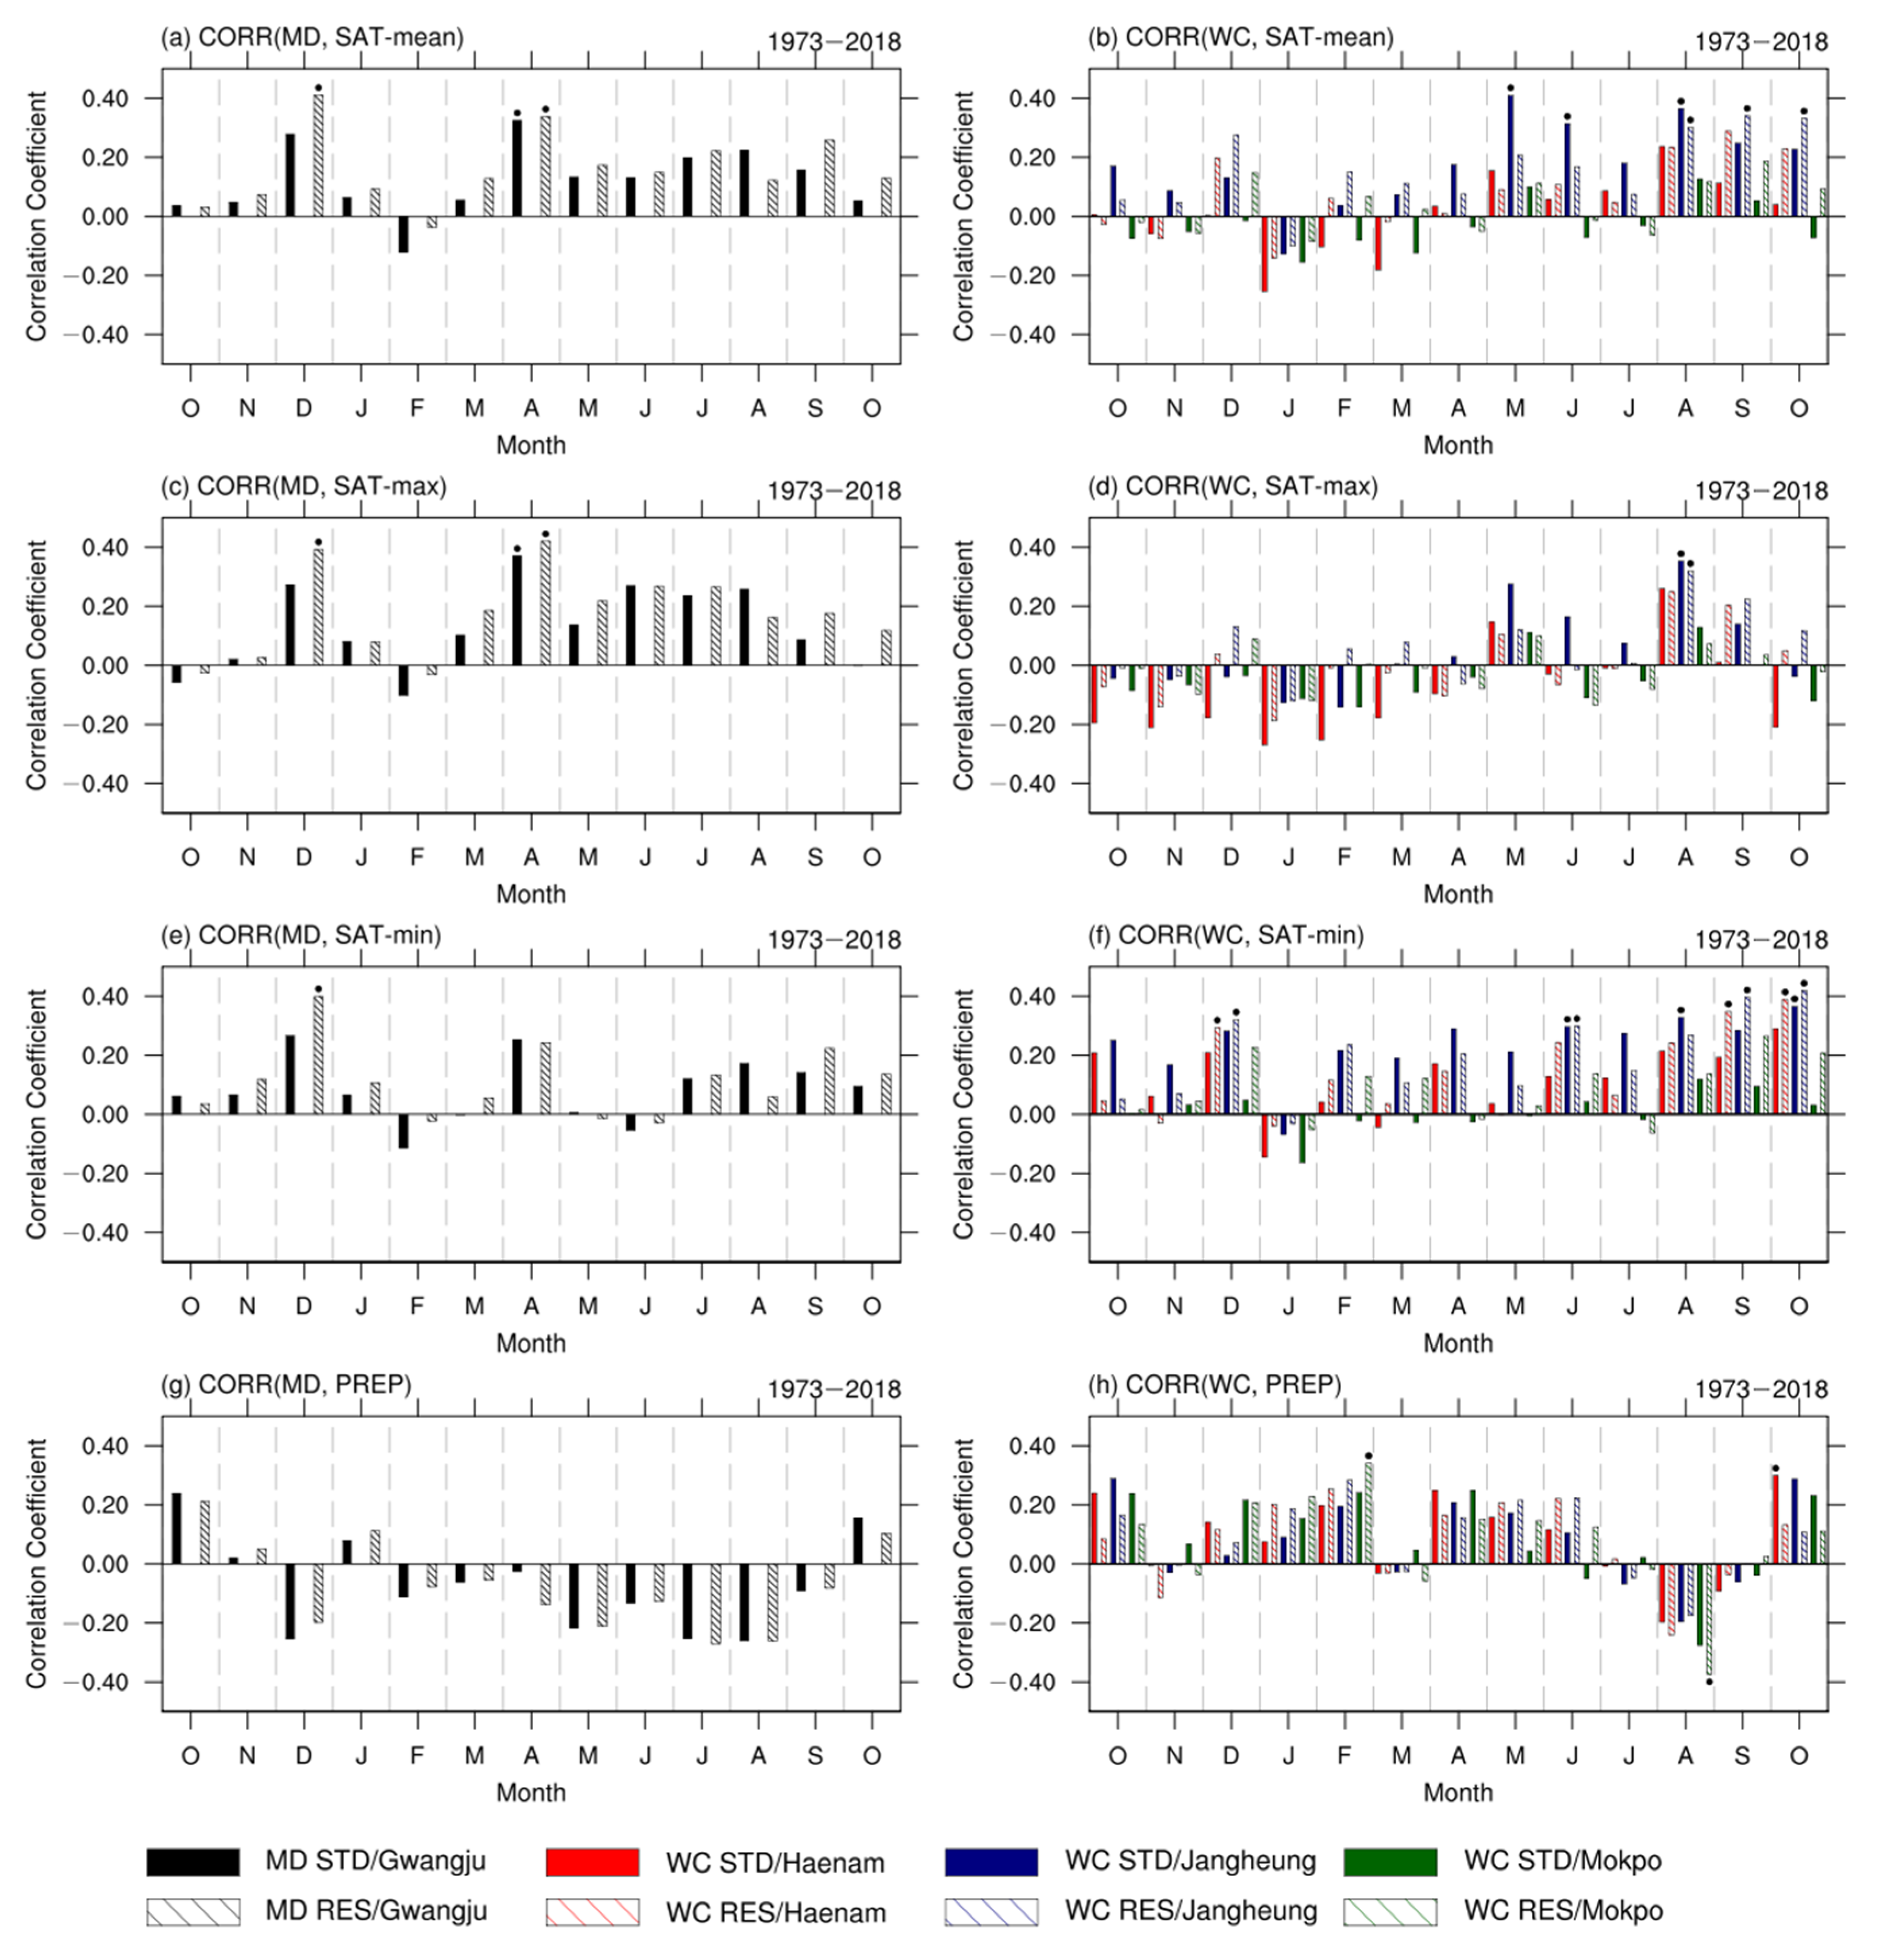
3.2. Climatic Responses of TRW Chronologies from Mt. Mudeung and Mt. Wolchul

To investigate local climatic influences on the tree growth at Mt. Mudeung and Mt. Wolchul, we calculated correlations of the TRW standard and residual chronologies with the monthly SAT (mean, maximum, and minimum) and precipitation derived from the nearest meteorological stations (Figure 3). There are significantly (p < 0.05) positive correlations of Mt. Mudeung tree growth with the SAT from the preceding December and April. Specifically, the residual chronology shows a stronger association with SAT compared to the standard chronology. The positive correlations of tree growth with SAT during the preceding winter and spring prior to the growing season are in accordance with climatic responses previously obtained from the tree growth on Mt. Halla and Mt. Chiri, South Korea [28,33]. Park and Yadav [33] argued that photosynthesis produced during the dormant season plays an essential role in tree growth during the ensuing growth season. The influence of precipitation on tree growth on Mt. Mudeung is generally weak and there was no significant correlation between them.
The climatic association of the tree growth at Mt. Wolchul is more diverse than the tree growth at Mt. Mudeung. It has significantly positive correlations with SAT in the preceding December and most of the early summer to autumn months (i.e., May, June, August, September, and October) and with precipitation in February and October. The positive association with SAT and precipitation during late summer to autumn (until October) may imply the importance of climatic conditions at the end of the growing season to tree growth at Mt. Wolchul [28]. Additionally, Figure S1 shows the observed August to October mean of daily minimum SAT time series from Jangheung station and its reconstructed values based on a linear regression model with the Mt. Wolchul TRW chronology for the 1973–2018 period. Cross-validation statistics of the regression model, shown in Table S1, indicate moderate performance of the regression model, implying the dendroclimatological potential of the Mt. Wolchul TRW chronology to reconstruct late summer to autumn SAT variability. The positive influence from February precipitation may have been caused by the rocky and dry environment of Mt. Wolchul. As Linderholm [45] suggested, precipitation from dry sites in the winter and spring, prior to the growing season, can enhance the tree growth. This is because precipitation, mostly falling as snow in February, will act as an insulator of the tree-root system and the reduction of frost depth. Further, snowmelt will provide additional water for trees at the dry site at the beginning of the growing season.
These results show that the tree growth at Mt. Mudeung and Mt. Wolchul represents local-scale climatic signals to some extent. We further examined the climate–growth relationship in a larger domain. Figure 4 shows the spatial correlations of the Mt. Mudeung and Mt. Wolchul residual chronologies with SAT and precipitation over East Asia. In accordance with the local climatic responses, the Mt. Mudeung tree growth shows positive correlations with SAT over most of East Asia in April, and these are especially significant over the Korean Peninsula and southern Japan (Figure 4a). Although correlations with local precipitation were not significant, significantly negative correlations were found with summer (May–July) precipitation, counterintuitively, over the Korean Peninsula and southern Japan (Figure 4b). This negative association is not likely caused by the direct impact of precipitation on tree growth as summer rainfall in South Korea is mostly from intense monsoon precipitation, which mostly becomes runoff. One possible interpretation for this oddity is the contribution of sunlight duration on the tree growth on Mt. Mudeung; specifically, the amount of sunlight negatively correlates with precipitation, which is often the case in the summer season [28,33]. Otherwise, the Mt. Mudeung tree growth has positive correlations with summer precipitation over the northern Philippine Sea and the Sea of Okhotsk, which resembles a tripolar East-Asian summer monsoon precipitation pattern [46]. This implies the Mt. Mudeung tree growth may contain climate signals from systematic large-scale climate variabilities, not just signals that are linked to local variabilities.
Interestingly, the Mt. Wolchul tree growth showed significantly negative correlations with early summer (May–June) SAT over most of Mongolia and eastern China (Figure 4c), whereas its correlations with local SAT were positive (Figure 3). This may be because the East Asia summer monsoon is associated with summer SAT variations over this region [47,48]. Yu et al. [48] argued that SAT cooling over northeastern Asia can induce southward shifts of the upper-level westerly jet stream over East Asia and then weaken the East Asian summer monsoon, which results in a tendency toward increased droughts (decreased rainfall) in northeastern Asia and increased floods (increased rainfall) in southeastern Asia, especially near the Yangtze River Valley. Correspondingly, the Mt. Wolchul tree growth showed positive correlations with summer (May–July) precipitation over southeastern China (around Yangtze River Valley) and the Korean Peninsula (Figure 4d). Both Mt. Mudeung and Mt. Wolchul TRW chronologies retained not only local- but also East-Asian-scale climatic signals, implying their potential as climate proxies to reconstruct the large-scale climate variability.

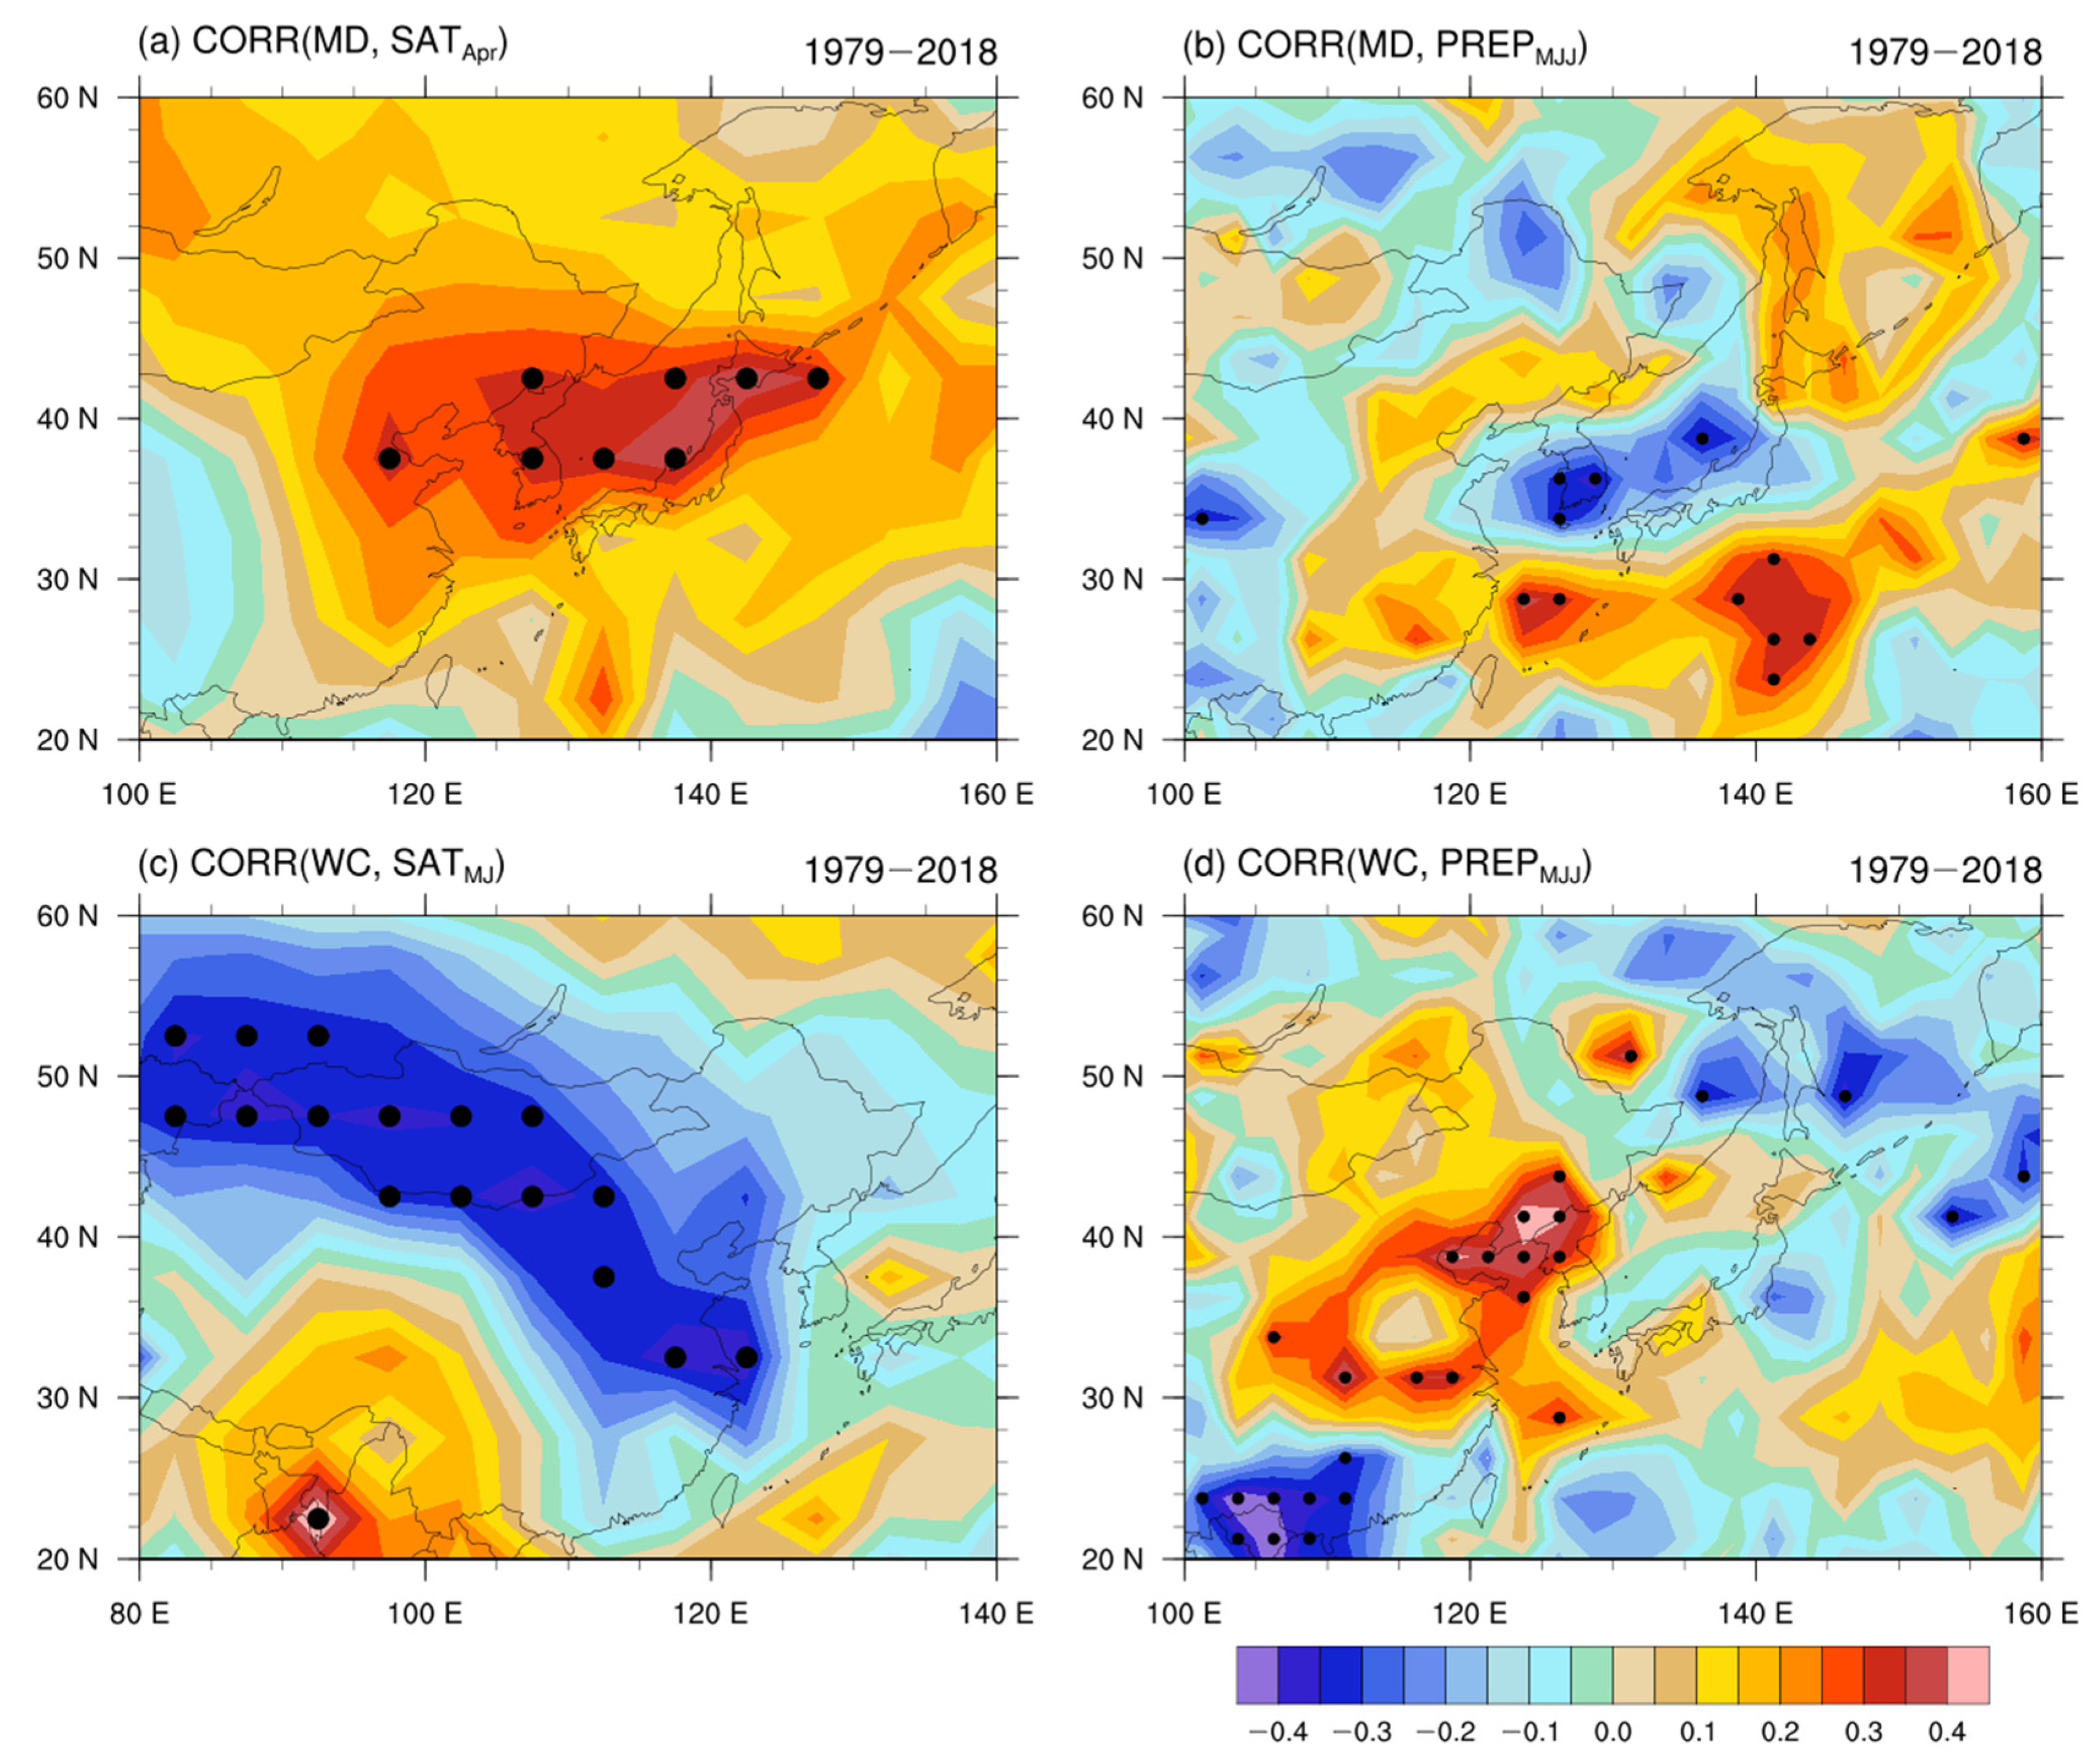
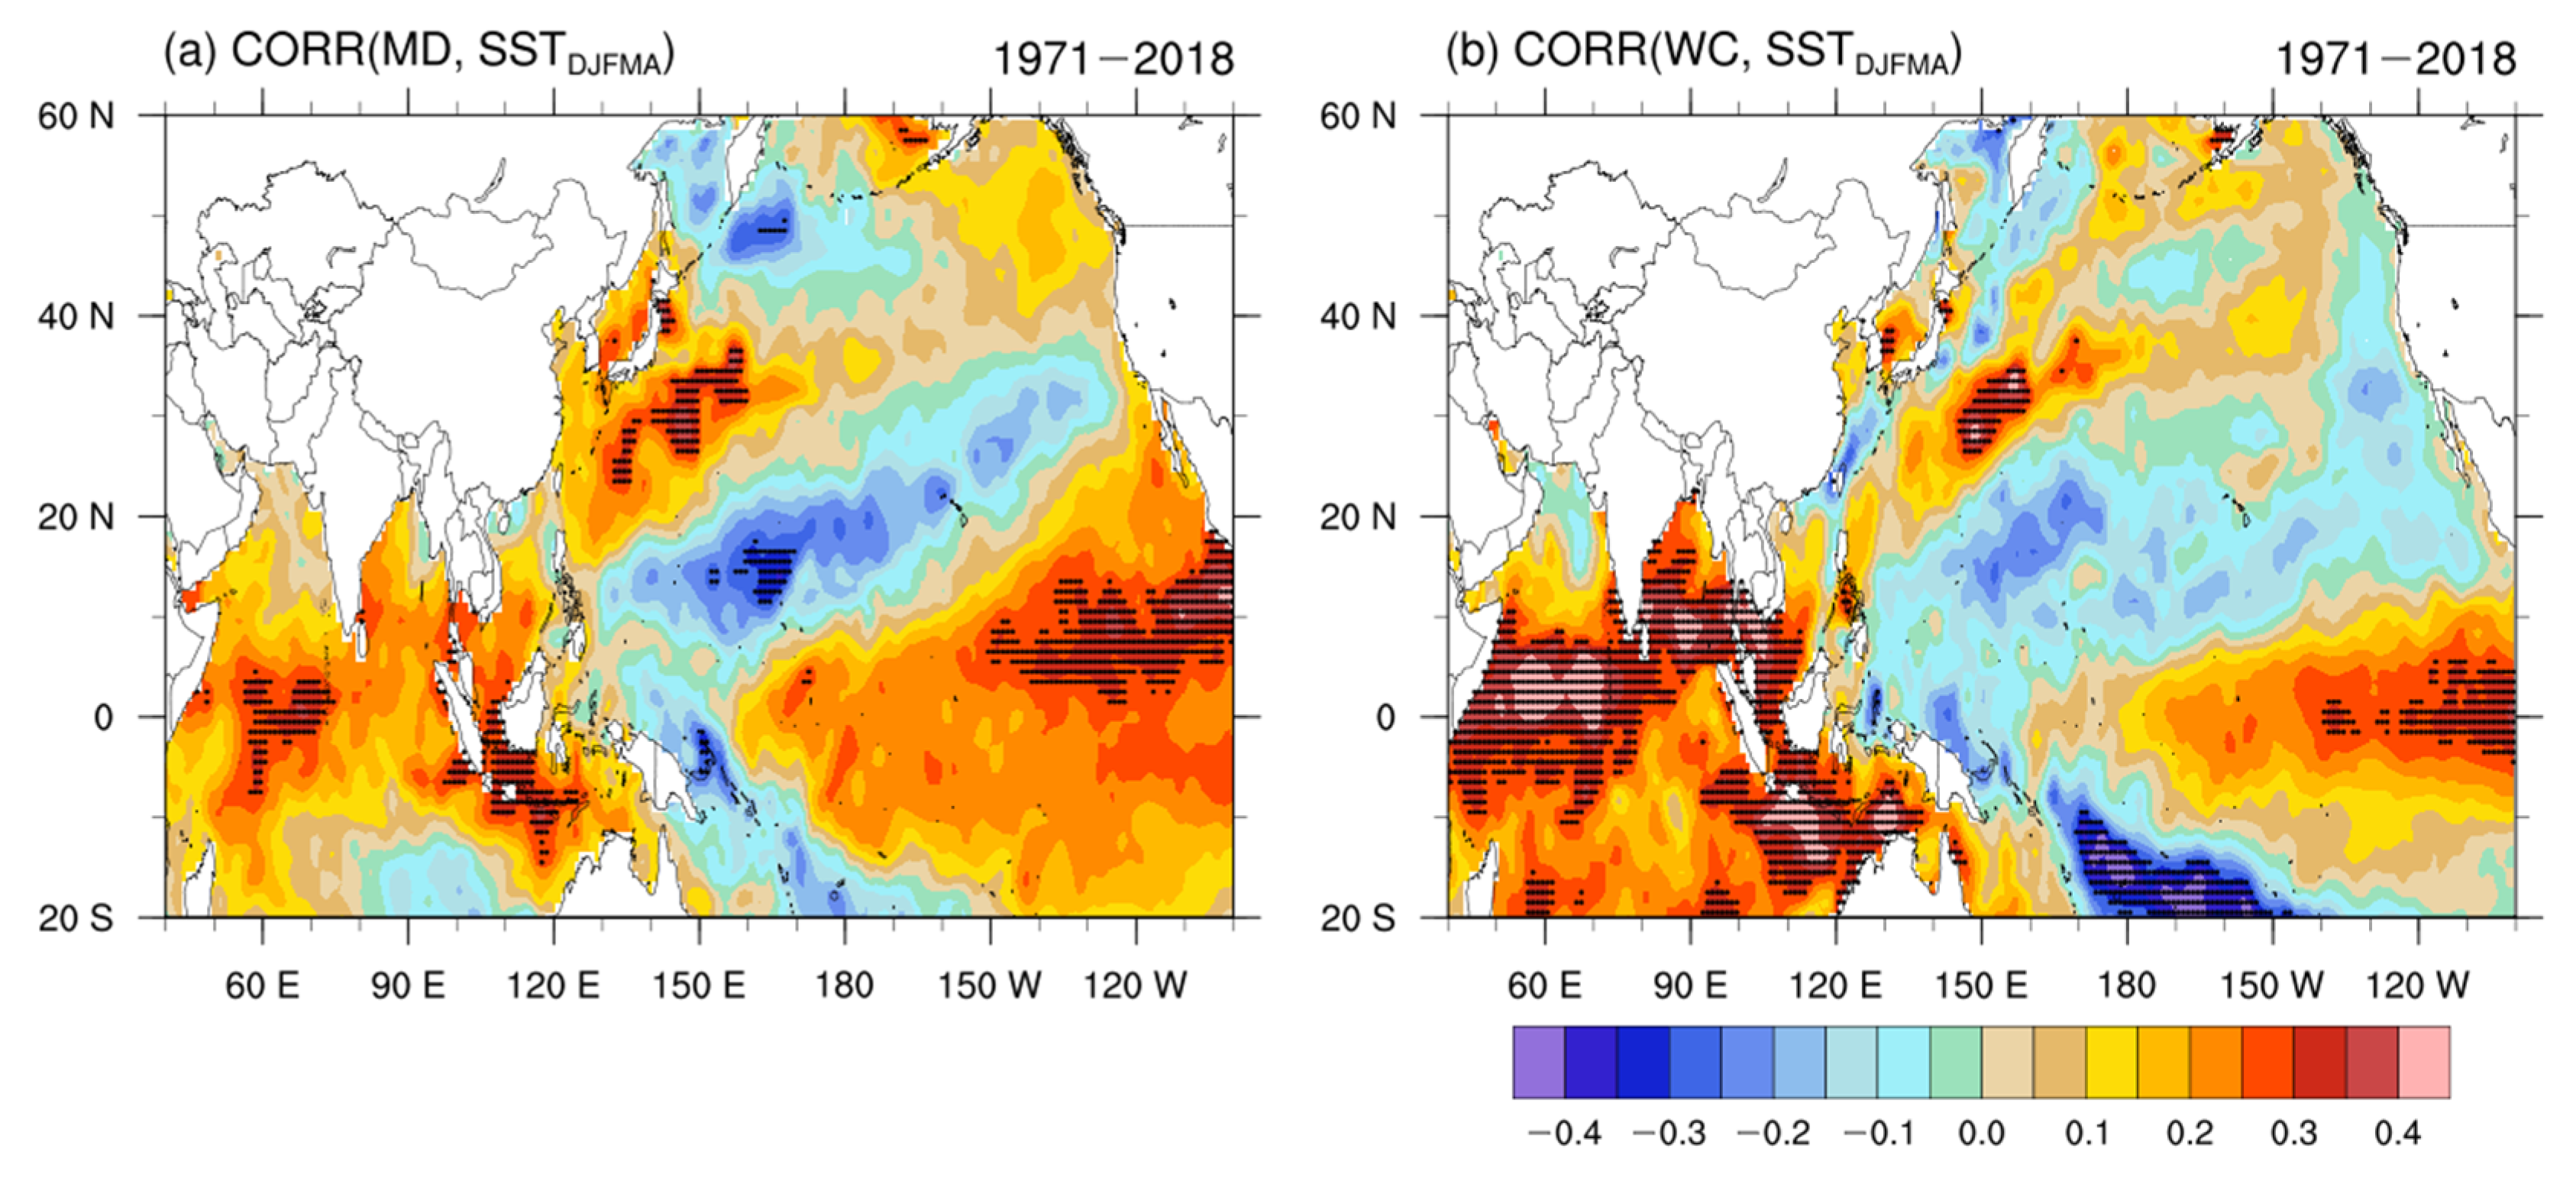
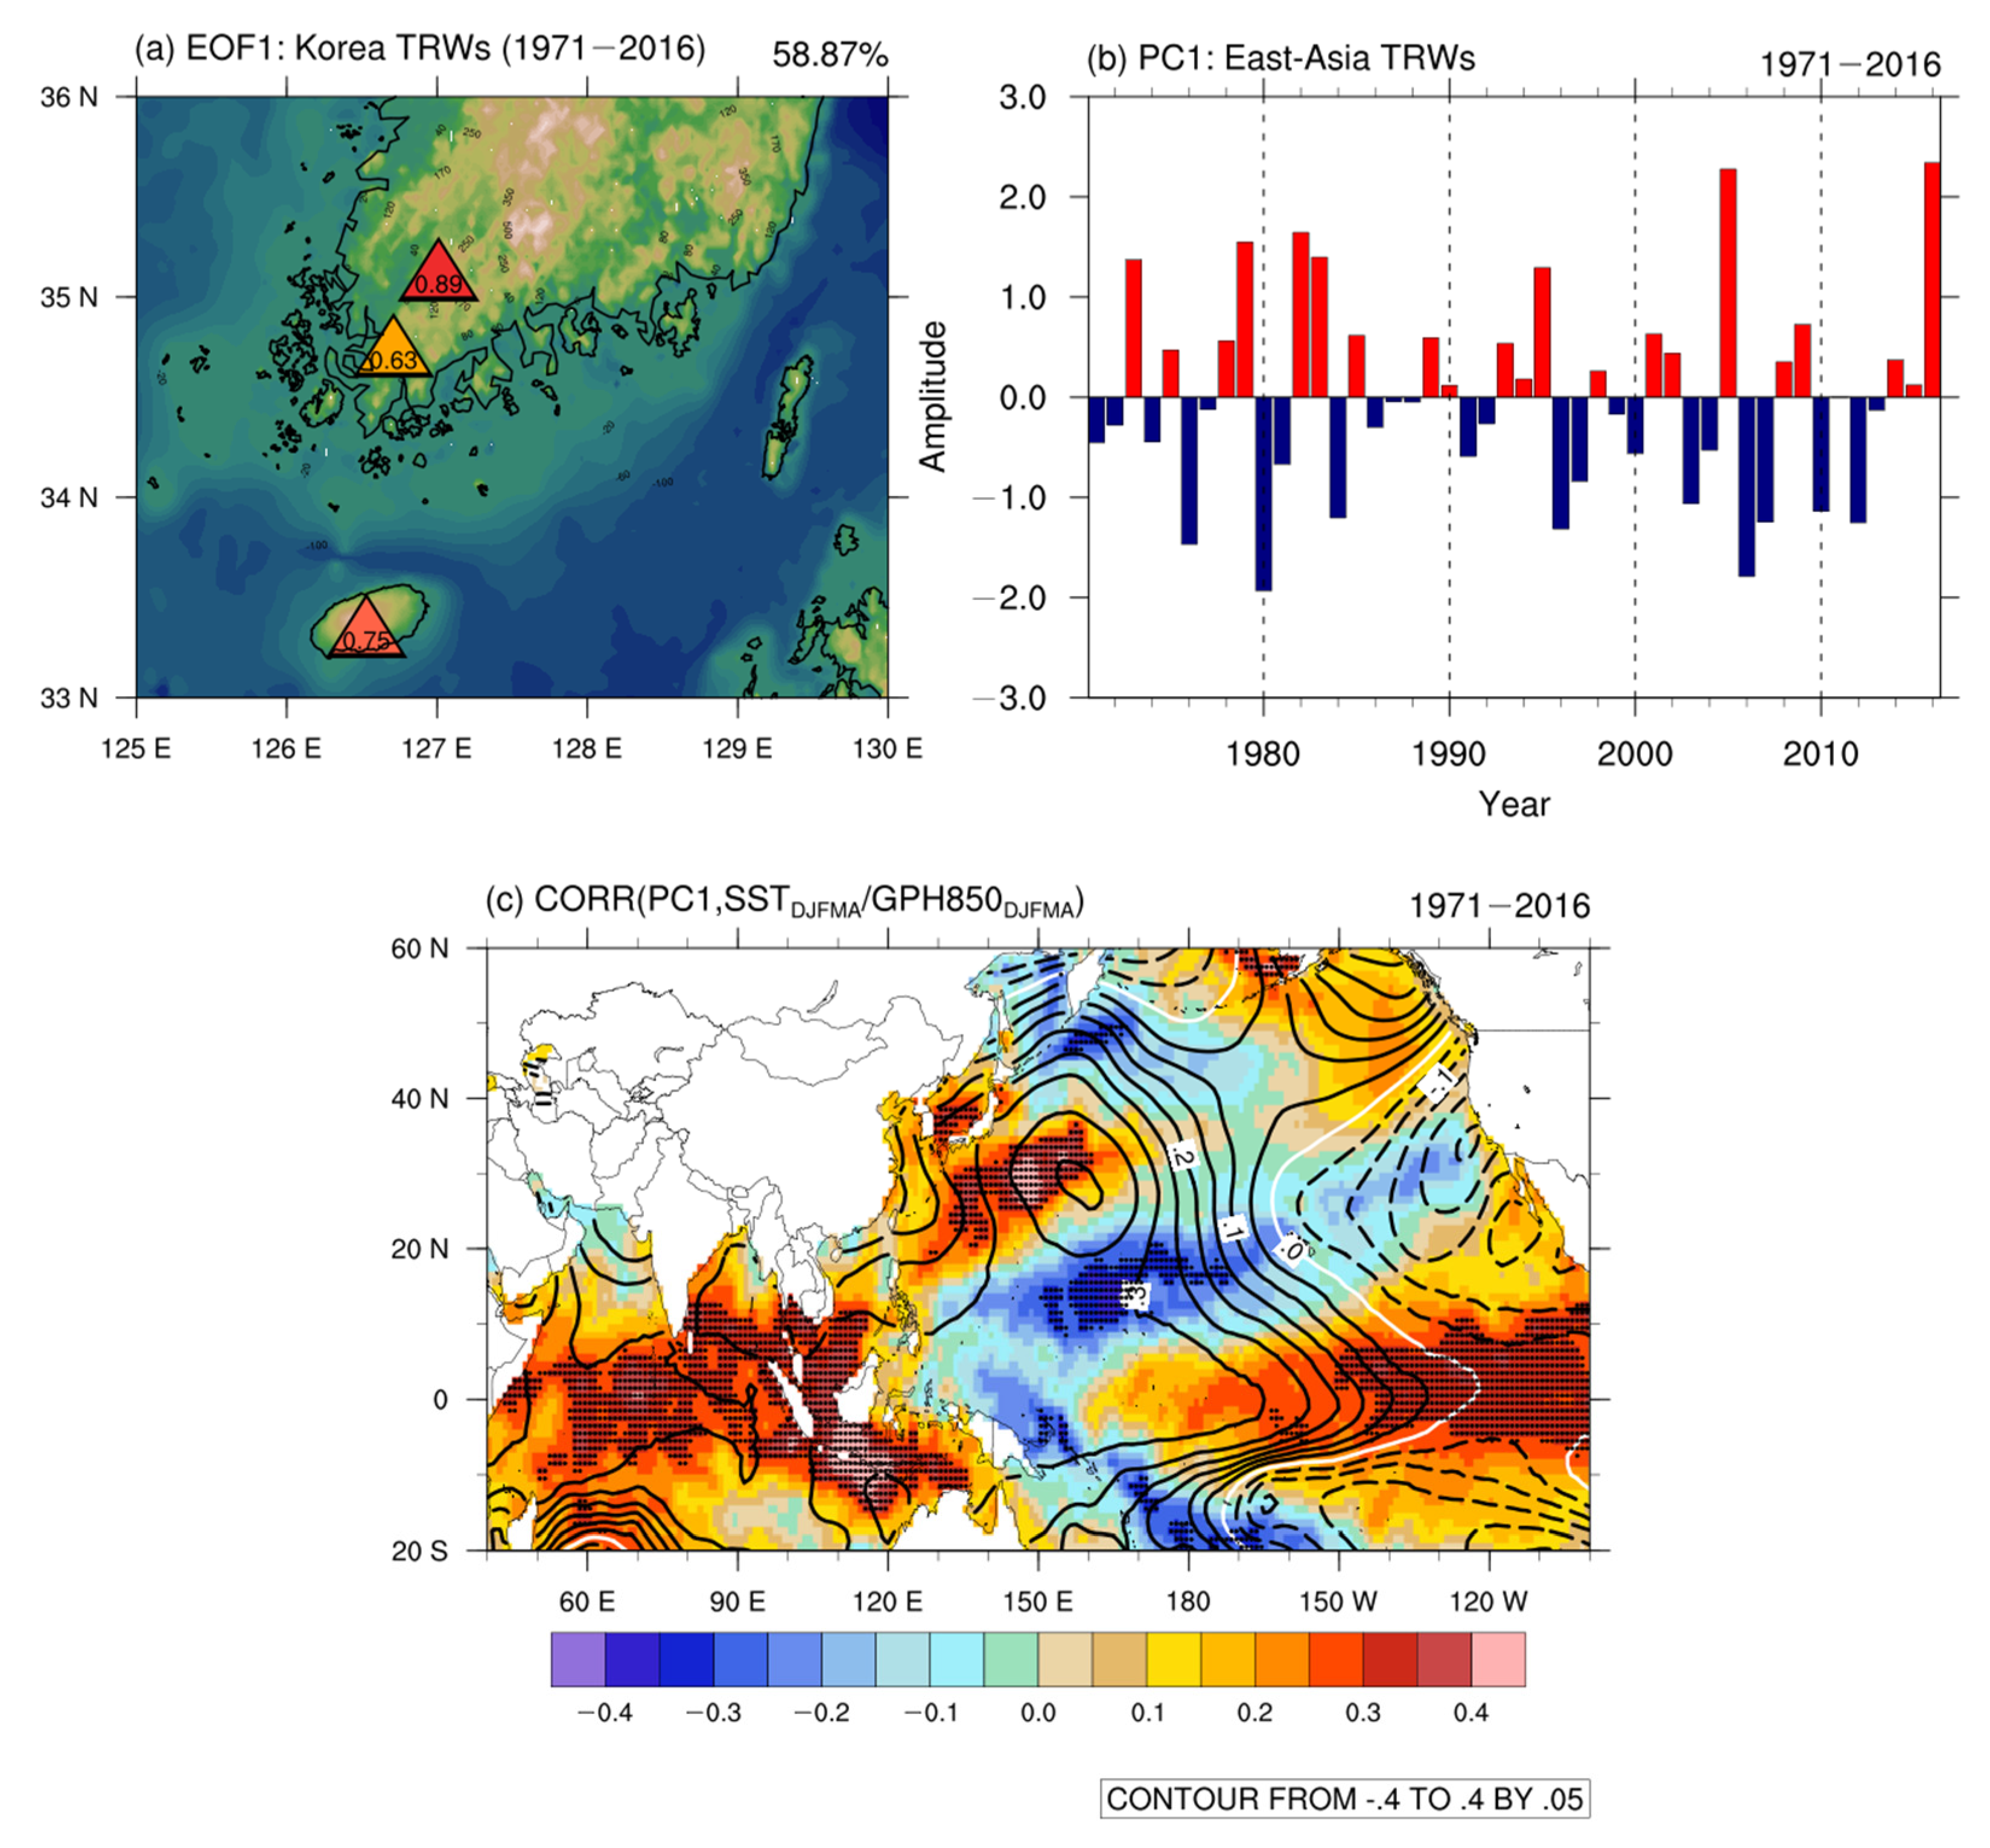
3.3. Oceanic Signals of the Tree Growth over the Western North Pacific

We further examined the association of the tree growth at Mt. Mudeung and Mt. Wolchul with SST to test their potential to reconstruct climate over the Western North Pacific; this was because the tree growth thoroughly captured East-Asian-scale climatic variations as well as at the local-scale (Figure 3 and Figure 4), which are strongly associated with the Western North Pacific variabilities [49,50,51,52,53]. Figure 5 shows the spatial correlations of the residual chronologies from Mt. Mudeung and Mt. Wolchul with SST for the preceding winter to early spring (i.e., the preceding December to April). Both residual chronologies represent a similar correlation pattern with the SST. There are positive correlations between the Mt. Mudeung tree growth and the SST over the Western North Pacific, the Indian Ocean, and the equatorial eastern Pacific. Compared to the Mt. Mudeung tree growth, the Mt. Wolchul tree growth shows stronger correlations over the Indian Ocean. These correlation patterns of tree growth with the SST are closely in accordance with the positive correlations of Mt. Halla pine tree growth with SST in the preceding winter (i.e., the preceding December to February) and April, shown in Zhang et al. [28].
Furthermore, based on the residual chronologies of Korean red pine from Mt. Mudeung, Mt. Wolchul, and Mt. Halla, the dominant South Korea tree-growth variability was extracted. The three chronologies were subjected to empirical orthogonal function (EOF) analysis for the 1971–2016 period. Figure 6a,b shows the first EOF leading pattern (EOF1) and associated first principal component time series (PC1). EOF1 represents that the chronologies at three mountains variate with the same phase. This pattern explained a substantial portion (around 59%) of the total variance and it was clearly separated from other modes according to North’s rule of asymptotic errors [54]. The PC1 is dominated by year-to-year variability. Figure 6c shows the spatial correlations of PC1 with the preceding winter to early spring (i.e., the preceding December to April) SST and GPH850. The overall pattern is similar to those in Figure 5, but more distinct oceanic signals are shown over the Western North Pacific, the Indian Ocean, and the equatorial eastern Pacific. The SST and GPH850 signals over the Western North Pacific represent the enhanced Western North Pacific anticyclone and warm Kuroshio Current, which are closely related to the East Asian climate. This supports that the South Korea TRW chronologies can act as useful climate proxies to reconstruct the climate variabilities over the Western North Pacific.
These correlation patterns (Figure 5 and Figure 6) are reminiscent of SST anomalies found during the peak and decaying phase of El Niño [55]. The PC1 exhibits coherent positive values after 82/83, 97/98, and 15/16 El Niño, the top three strongest El Niño, implying the possibility of the El Niño influence on the tree growth in South Korea. Correspondingly, the PC1 has a significant (p < 0.05) correlation with the winter (i.e., the preceding December to February) Niño 3.4 index (the area-averaged SST time series of 5° S–5° N and 170° W–120° W): 0.31 for the 1971–2016 period. The Mt. Mudeung and Mt. Wolchul residual chronologies have slightly significant (p < 0.10) correlations with the winter Niño 3.4 index: 0.27 for both Mt. Mudeung and Mt. Wolchul, for the 1971–2016 period. Wang et al. [53] demonstrated that warm SST over the equatorial eastern Pacific can develop an anticyclonic circulation over the Western North Pacific via Rossby wave responses and thermodynamic atmosphere–ocean interactions through inducing cold SST over the west of the warm pool and warm SST over the Western North Pacific. Under the anomalously warm SST condition over the Western North Pacific and the Indian Ocean, which plays a key role in maintaining the subtropical anticyclone [50], the induced subtropical anticyclone, which bridges the East Asian climate and Pacific SST, may persist until spring and summer after the peak of El Niño, causing anomalously warm and wet conditions along the Kuroshio Extension [53]. Namely, the strengthening of a subtropical anticyclone over the Western North Pacific during El Niño winter and following spring can enhance tree growth in South Korea by providing warm and wet air at the beginning of the growing season.

4. Summary and Conclusions

Two new TRW chronologies of Korean red pine from Mt. Mudeung and Mt. Wolchul on the southern coast of the Korean Peninsula were developed, and their climatic responses at both local and large scales were investigated. Although the lengths of the chronologies were short, the results nonetheless demonstrated their dendroclimatological potentials to reconstruct both local- and large-scale climatic variability over East Asia and the Western North Pacific. Mt. Mudeung pine tree growth had a positive association with local SAT from the preceding December and April. The overall climatic responses of Mt. Wolchul pine tree growth were more diverse than those at Mt. Mudeung. There was a positive association of Mt. Wolchul pine tree growth with the local SAT in preceding December and most of the early summer to autumn months (i.e., May, June, August, September, and October) and with local precipitation in February and October. Both the Mt. Mudeung and Mt. Wolchul pine tree growth thoroughly retained local- and East-Asian-scale temperature and monsoon precipitation signals. Furthermore, they showed oceanic signals with the preceding winter to spring (i.e., the preceding December to April) SST over the Western North Pacific, the Indian Ocean, and the equatorial eastern Pacific. The correlation pattern coincided with the anomalous SST pattern during the peak and decaying phase of El Niño, suggesting its lagged impacts on tree growth in South Korea. Further, the relation of the TRW chronologies with SST and GPH850 over the Western North Pacific corroborated that South Korea TRW growth can be used to reconstruct the climatic variability over the Western North Pacific, such as temperatures over the Kuroshio Extension and subtropical anticyclone occurrences.
In our future study, we plan to increase the number of samples from older trees at the same and similar locations or at nearby mountains such as Mt. Chiri (1915 m a.s.l.) and Mt. Deogyu (1614 m a.s.l.). Moreover, there are many temples in the mountainous regions of South Korea, and many of these temples are built for several hundred years or more, which can be a source to extract old tree-ring data. Then, we aim to extend the TRW chronologies as long as possible and thus to reconstruct the long-term variability of Kuroshio Current as implied in the current results. Many recent studies have suggested that greenhouse gas increases will lead to changes in the Kuroshio Current, which have substantial influences on the climate in oceanic East Asia. However, the extent of the attribution is unclear because of the lack of observational data. The understanding of long-term changes in the Kuroshio Current may provide insights into the reliability of future predictions.

Supplementary Materials

The following are available online at https://www.mdpi.com/2073-4433/11/10/1082/s1, Figure S1: Time series of observed and reconstructed Jangheung August–October mean of daily minimum SAT, Table S1: Split half calibration/verification statistics for Jangheung August–October SAT reconstruction.

Author Contributions

Conceptualization, M.-S.K., P.Z., and J.-H.J.; fieldworks, M.-S.K., P.Z., and Y.K.; laboratory measurement, M.-S.K.; investigation, M.-S.K.; visualization, M.-S.K.; writing—original draft preparation, M.-S.K.; writing—review and editing, P.Z., S.-H.W., H.W.L., and J.-H.J.; supervision, J.-H.J. All authors have read and agreed to the published version of the manuscript.

Funding

This research was funded by the Korea Meteorological Administration Research and Development Program (Grant KMI2018-07010) and the National Research Foundation of Korea (Grant NRF-2016R1A6A1A03012647). Peng Zhang was supported by the Swedish Research Council for Sustainable Development (FORMAS), Grant No. 2018-02858.

Acknowledgments

We would like to appreciate the three anonymous reviewers for their constructive suggestions and careful comments.

Conflicts of Interest

The authors declare no conflict of interest.

References

  1. Neukom, R.; Steiger, N.; Gómez-Navarro, J.J.; Wang, J.; Werner, J.P. No Evidence for Globally Coherent Warm and Cold Periods over the Preindustrial Common Era. Nature 2019, 571, 550–554. [Google Scholar] [CrossRef]
  2. PAGES 2k Consortium; Neukom, R.; Barboza, L.A.; Erb, M.P.; Shi, F.; Emile-Geay, J.; Evans, M.N.; Franke, J.; Kaufman, D.S.; Lücke, L.; et al. Consistent Multi-Decadal Variability in Global Temperature Reconstructions and Simulations over the Common Era. Nat. Geosci. 2019, 12, 643–649. [Google Scholar] [CrossRef] [Green Version]
  3. Zhang, P.; Ionita, M.; Lohmann, G.; Chen, D.; Linderholm, H.W. Can Tree-Ring Density Data Reflect Summer Temperature Extremes and Associated Circulation Patterns over Fennoscandia? Clim. Dyn. 2017, 49, 2721–2736. [Google Scholar] [CrossRef] [Green Version]
  4. Wilson, R.; Miles, D.; Loader, N.J.; Melvin, T.; Cunningham, L.; Cooper, R.; Briffa, K. A Millennial Long March–July Precipitation Reconstruction for Southern-Central England. Clim. Dyn. 2013, 40, 997–1017. [Google Scholar] [CrossRef]
  5. Ahmed, M.; Anchukaitis, K.J.; Asrat, A.; Borgaonkar, H.P.; Braida, M.; Buckley, B.M.; Büntgen, U.; Chase, B.M.; Christie, D.A.; Cook, E.R. Continental-Scale Temperature Variability During the past Two Millennia. Nat. Geosci. 2013, 6, 339–346. [Google Scholar]
  6. Steinman, B.A.; Abbott, M.B.; Mann, M.E.; Stansell, N.D.; Finney, B.P. 1500 Year Quantitative Reconstruction of Winter Precipitation in the Pacific Northwest. Proc. Natl. Acad. Sci. USA 2012, 109, 11619–11623. [Google Scholar] [CrossRef] [PubMed] [Green Version]
  7. Cook, E.R.; Anchukaitis, K.J.; Buckley, B.M.; D’Arrigo, R.D.; Jacoby, G.C.; Wright, W.E. Asian Monsoon Failure and Megadrought During the Last Millennium. Science 2010, 328, 486–489. [Google Scholar] [CrossRef] [PubMed] [Green Version]
  8. Gray, S.T.; Graumlich, L.J.; Betancourt, J.L.; Pederson, G.T. A Tree-Ring Based Reconstruction of the Atlantic Multidecadal Oscillation Since 1567 A.D. Geophys. Res. Lett. 2004, 31. [Google Scholar] [CrossRef]
  9. Cook, E.R.; D’Arrigo, R.D.; Mann, M.E. A Well-Verified, Multiproxy Reconstruction of the Winter North Atlantic Oscillation Index Since A.D. 1400. J. Clim. 2002, 15, 1754–1764. [Google Scholar] [CrossRef]
  10. St. George, S.S. An Overview of Tree-Ring Width Records Across the Northern Hemisphere. Quat. Sci. Rev. 2014, 95, 132–150. [Google Scholar] [CrossRef]
  11. Lee, M.-H.; Ho, C.-H.; Kim, J.; Song, C.-K. Assessment of the Changes in Extreme Vulnerability over East Asia Due to Global Warming. Clim. Chang. 2012, 113, 301–321. [Google Scholar] [CrossRef]
  12. Wang, Y.L.; Wu, C.R.; Chao, S.Y. Warming and Weakening Trends of the Kuroshio During 1993–2013. Geophys. Res. Lett. 2016, 43, 9200–9207. [Google Scholar] [CrossRef] [Green Version]
  13. Wu, L.; Cai, W.; Zhang, L.; Nakamura, H.; Timmermann, A.; Joyce, T.; McPhaden, M.J.; Alexander, M.; Qiu, B.; Visbeck, M.; et al. Enhanced Warming over the Global Subtropical Western Boundary Currents. Nat. Clim. Chang. 2012, 2, 161–166. [Google Scholar] [CrossRef]
  14. Park, Y.-H.; Yoon, J.-H.; Youn, Y.-H.; Vivier, F. Recent Warming in the Western North Pacific in Relation to Rapid Changes in the Atmospheric Circulation of the Siberian High and Aleutian Low Systems. J. Clim. 2012, 25, 3476–3493. [Google Scholar] [CrossRef]
  15. Kamae, Y.; Mei, W.; Xie, S.-P. Ocean Warming Pattern Effects on Future Changes in East Asian Atmospheric Rivers. Environ. Res. Lett. 2019, 14. [Google Scholar] [CrossRef]
  16. Mitchell, D.; AchutaRao, K.; Allen, M.; Bethke, I.; Beyerle, U.; Ciavarella, A.; Forster, P.M.; Fuglestvedt, J.; Gillett, N.; Haustein, K.; et al. Half a Degree Additional Warming, Prognosis and Projected Impacts (HAPPI): Background and Experimental Design. Geosci. Model Dev. 2017, 10, 571–583. [Google Scholar] [CrossRef] [Green Version]
  17. Yang, H.; Lohmann, G.; Wei, W.; Dima, M.; Ionita, M.; Liu, J. Intensification and Poleward Shift of Subtropical Western Boundary Currents in a Warming Climate. J. Geophys. Res. Ocean. 2016, 121, 4928–4945. [Google Scholar] [CrossRef] [Green Version]
  18. Kottek, M.; Grieser, J.; Beck, C.; Rudolf, B.; Rubel, F. World Map of the Köppen-Geiger Climate Classification Updated. Meteorol. Z. 2006, 15, 259–263. [Google Scholar] [CrossRef]
  19. Chen, F.; Opała-Owczarek, M.; Owczarek, P.; Chen, Y. Summer Monsoon Season Streamflow Variations in the Middle Yellow River Since 1570 CE Inferred from Tree Rings of Pinus Tabulaeformis. Atmosphere 2020, 11, 717. [Google Scholar] [CrossRef]
  20. Sun, C.; Liu, Y.; Song, H.; Mei, R.; Payomrat, P.; Wang, L.; Liu, R. Tree-Ring-Based Precipitation Reconstruction in the Source Region of Weihe River, Northwest China Since AD 1810. Int. J. Climatol. 2018, 38, 3421–3431. [Google Scholar] [CrossRef]
  21. Shi, J.; Lu, H.; Li, J.; Shi, S.; Wu, S.; Hou, X.; Li, L. Tree-Ring Based February–April Precipitation Reconstruction for the Lower Reaches of the Yangtze River, Southeastern China. Glob. Planet. Chang. 2015, 131, 82–88. [Google Scholar] [CrossRef] [Green Version]
  22. Cai, Q.; Liu, Y.; Lei, Y.; Bao, G.; Sun, B. Reconstruction of the March–August PDSI Since 1703 AD Based on Tree Rings of Chinese Pine (Pinus Tabulaeformis Carr.) in the Lingkong Mountain, Southeast Chinese Loess Plateau. Clim. Past 2014, 10, 509–521. [Google Scholar] [CrossRef] [Green Version]
  23. Yi, L.; Yu, H.; Ge, J.; Lai, Z.; Xu, X.; Qin, L.; Peng, S. Reconstructions of Annual Summer Precipitation and Temperature in North-Central China Since 1470 AD Based on Drought/Flood Index and Tree-Ring Records. Clim. Chang. 2012, 110, 469–498. [Google Scholar] [CrossRef]
  24. Fang, K.; Gou, X.; Chen, F.; Liu, C.; Davi, N.; Li, J.; Zhao, Z.; Li, Y. Tree-Ring Based Reconstruction of Drought Variability (1615–2009) in the Kongtong Mountain Area, Northern China. Glob. Planet. Chang. 2012, 80–81, 190–197. [Google Scholar] [CrossRef]
  25. Duan, J.; Zhang, Q.-B.; Lv, L.; Zhang, C. Regional-Scale Winter-Spring Temperature Variability and Chilling Damage Dynamics over the past Two Centuries in Southeastern China. Clim. Dyn. 2012, 39, 919–928. [Google Scholar] [CrossRef]
  26. Yonenobu, H.; Eckstein, D. Reconstruction of early spring temperature for central Japan from the tree-ring widths of Hinoki cypress and its verification by other proxy records. Geophys. Res. Lett. 2006, 33. [Google Scholar] [CrossRef]
  27. Park, W.-K.; Yadav, R.R. Reconstruction of May Precipitation (AD 1731–1995) in West-Central Korea from Tree Rings of Korean Red Pine. Asia Pac. J. Atmos. Sci. 1998, 34, 459–465. [Google Scholar]
  28. Zhang, P.; Jeong, J.-H.; Linderholm, H.W.; Jeong, J.-Y.; Salo, R.; Kim, B.-M.; Kim, M.-S. The Potential of Using Tree-Ring Data from Jeju Island to Reconstruct Climate in Subtropical Korea and the Western North Pacific. Asia Pac. J. Atmos. Sci. 2019, 55, 293–301. [Google Scholar] [CrossRef]
  29. Hong, H.-H.; Jang, J.-W.; Sun, E.-M.; Kim, B.-A.; Kim, S.-J.; -Seo, S.-R.; Im, H.-T. Floristic Study of Mt. Mudeung. Korean J. Environ. Biol. 2013, 31, 121–153. [Google Scholar] [CrossRef]
  30. Oh, K.; Jeong, S.; Kim, Y. Actual Vegetation and Plant Community Structure in the Wolchulsan National Park. Korean J. Environ. Ecol. 1999, 17, 26–34. [Google Scholar]
  31. Lim, J.-H.; Park, G.-E.; Moon, N.-H.; Moon, G.-H.; Shin, M.-Y. Analysing the Relationship Between Tree-Ring Growth of Pinus densiflora and Climatic Factors Based on National Forest Inventory Data. J. Korean Soc. For. Sci. 2017, 106, 249–257. [Google Scholar] [CrossRef]
  32. Choi, H.-A.; Lee, W.-K.; Byun, J.-G.; Kwak, H.-B.; Kim, S.-R.; Byun, W.-H. Spatial Distribution and Radial Growth Response of Pinus densiflora to Climatic and Topographic Factors in Central Urban Forest of Seoul, Korea. J. For. Plan. 2011, 16, 163–169. [Google Scholar] [CrossRef]
  33. Park, W.-K.; Yadav, R.R. A Dendroclimatic Analysis of Pinus densiflora from Mt. Chiri in Southern Korea. Ann. For. Sci. 1998, 55, 451–459. [Google Scholar] [CrossRef] [Green Version]
  34. Grissino-Mayer, H.D. Evaluating Crossdating Accuracy: A Manual and Tutorial for the Computer Program COFECHA. Tree-Ring Res. 2001, 57, 205–221. [Google Scholar]
  35. Holmes, R.L. Computer-Assisted Quality Control in Tree-Ring Dating and Measurement. Tree-Ring Bull. 1983, 43, 69–78. [Google Scholar]
  36. Cook, E.R. A Time Series Analysis Approach to Tree Ring Standardization. Ph.D. Thesis, University of Arizona, Tucson, AZ, USA, 1985. [Google Scholar]
  37. Fritts, H.C. Tree Rings and Climate; Academic Press: London, UK, 1976. [Google Scholar]
  38. Wigley, T.M.L.; Briffa, K.R.; Jones, P.D. On the Average Value of Correlated Time Series, with Applications in Dendroclimatology and Hydrometeorology. J. Clim. Appl. Meteor. 1984, 23, 201–213. [Google Scholar] [CrossRef]
  39. KMA (Korea Meteorological Administration) ASOS (Automatic Synoptic Observation System) station data. Available online: https://data.kma.go.kr (accessed on 29 March 2019).
  40. Morice, C.P.; Kennedy, J.J.; Rayner, N.A.; Jones, P.D. Quantifying Uncertainties in Global and Regional Temperature Change Using an Ensemble of Observational Estimates: The HadCRUT4 Data Set. J. Geophys. Res. 2012, 117. [Google Scholar] [CrossRef]
  41. Xie, P.; Arkin, P.A. Global Precipitation: A 17-Year Monthly Analysis Based on Gauge Observations, Satellite Estimates, and Numerical Model Outputs. Bull. Am. Meteor. Soc. 1997, 78, 2539–2558. [Google Scholar] [CrossRef]
  42. Rayner, N.A.; Parker, D.E.; Horton, E.; Folland, C.K.; Alexander, L.V.; Rowell, D.; Kent, E.; Kaplan, A. Global Analyses of Sea Surface Temperature, Sea Ice, and Night Marine Air Temperature Since the Late Nineteenth Century. J. Geophys. Res. 2003, 108. [Google Scholar] [CrossRef]
  43. Kobayashi, S.; Ota, Y.; Harada, Y.; Ebita, A.; Moriya, M.; Onoda, H.; Onogi, K.; Kamahori, H.; Kobayashi, C.; Endo, H.; et al. The JRA-55 Reanalysis: General Specifications and Basic Characteristics. J. Meteorol. Soc. Jpn. 2015, 93, 5–48. [Google Scholar] [CrossRef] [Green Version]
  44. NCAR. The NCAR Command Language; Software, Version 6.6.2; UCAR/NCAR/CISL/TDD: Boulder, CO, USA, 2019. [Google Scholar] [CrossRef]
  45. Linderholm, H.W. Climatic Influence on Scots Pine Growth on Dry and Wet Soils in the Central Scandinavian Mountains, Interpreted from Tree-Ring Width. Silva Fenn. 2001, 35, 415–424. [Google Scholar] [CrossRef] [Green Version]
  46. Hirota, N.; Takahashi, M. A Tripolar Pattern as an Internal Mode of the East Asian Summer Monsoon. Clim. Dyn. 2012, 39, 2219–2238. [Google Scholar] [CrossRef]
  47. Zhu, C.; Wang, B.; Qian, W.; Zhang, B. Recent Weakening of Northern East Asian Summer Monsoon: A Possible Response to Global Warming. Geophys. Res. Lett. 2012, 39. [Google Scholar] [CrossRef]
  48. Yu, R.; Wang, B.; Zhou, T. Tropospheric Cooling and Summer Monsoon Weakening Trend over East Asia. Geophys. Res. Lett. 2004, 31. [Google Scholar] [CrossRef] [Green Version]
  49. Ham, Y.-G.; Na, H.-Y.; Oh, S.-H. Role of Sea Surface Temperature over the Kuroshio Extension Region on Heavy Rainfall Events over the Korean Peninsula. Asia Pac. J. Atmos. Sci. 2019, 55, 19–29. [Google Scholar] [CrossRef]
  50. Wang, B.; Xiang, B.; Lee, J.Y. Subtropical High Predictability Establishes a Promising Way for Monsoon and Tropical Storm Predictions. Proc. Natl. Acad. Sci. USA 2013, 110, 2718–2722. [Google Scholar] [CrossRef] [Green Version]
  51. Lee, S.-S.; Seo, Y.-W.; Ha, K.-J.; Jhun, J.-G. Impact of the Western North Pacific Subtropical High on the East Asian Monsoon Precipitation and the Indian Ocean Precipitation in the Boreal Summertime. Asia Pac. J. Atmos. Sci. 2013, 49, 171–182. [Google Scholar] [CrossRef]
  52. Lee, E.J.; Yeh, S.W.; Jhun, J.G.; Moon, B.K. Seasonal Change in Anomalous WNPSH Associated with the Strong East Asian Summer Monsoon. Geophys. Res. Lett. 2006, 33. [Google Scholar] [CrossRef]
  53. Wang, B.; Wu, R.; Fu, X. Pacific–East Asian Teleconnection: How Does ENSO Affect East Asian Climate? J. Clim. 2000, 13, 1517–1536. [Google Scholar] [CrossRef]
  54. North, G.R.; Bell, T.L.; Cahalan, R.F.; Moeng, F.J. Sampling Errors in the Estimation of Empirical Orthogonal Functions. Mon. Wea. Rev. 1982, 110, 699–706. [Google Scholar] [CrossRef]
  55. Larkin, N.K.; Harrison, D.E. ENSO Warm (El Niño) and Cold (La Niña) Event Life Cycles: Ocean Surface Anomaly Patterns, Their Symmetries, Asymmetries, and Implications. J. Clim. 2002, 15, 1118–1140. [Google Scholar] [CrossRef]
Figure 1. Locations of the tree-ring sampling sites and meteorological stations. In (a,b), red triangles denote the locations of Mt. Mudeung and Mt. Wolchul and the gray triangle denotes the location of Mt. Halla, from our previous study [28]. Yellow circles denote the locations of the four meteorological stations (Gwangju, Haenam, Jangheung, and Mokpo) nearby Mt. Mudeung and Mt. Wolchul in (b). Monthly climatology of surface air temperature (SAT) (dotted lines) and precipitation (gray bars) at the four stations for the 1981–2010 period are shown in (c).
Atmosphere 11 01082 g001
Figure 2. The tree-ring width (TRW) standard (green) and residual (navy) chronologies (solid lines at lower panels) of Korean red pine from (a) Mt. Mudeung and (b) Mt. Wolchul. In the upper panels, gray shadings denote their sample depth (number of trees), and black solid lines denote expressed population signal (EPS) variabilities with the EPS threshold of 0.85 (red dashed lines).
Atmosphere 11 01082 g002
Figure 3. Correlations of the Mt. Mudeung (left panel; a, c, e, and g) and Mt. Wolchul (right panel; b, d, f, and h) standard (fully filled bars) and residual (striped bars) chronologies with monthly mean (a,b), maximum (c,d), and minimum (e,f) SAT and total precipitation (g,h) from Gwangju (black), Haenam (red), Jangheung (navy), and Mokpo (green) stations for the 1973–2018 period. Black dots denote the correlations that are statistically significant at the p < 0.05 level.
Atmosphere 11 01082 g003
Figure 4. Spatial correlations of (i) the residual chronology from Mt. Mudeung (upper panel) with (a) April SAT (Hadley Centre-Climatic Research Unit Version 4 (HadCRUT4) [40]) and (b) May to July precipitation (CPC Merged Analysis of Precipitation (CMAP) [41]), and of (ii) the residual chronology from Mt. Wolchul with (c) May to June SAT and (d) May to July precipitation for the 1979–2018 period. Black dots denote the correlations that are statistically significant at the p < 0.05 level.
Atmosphere 11 01082 g004
Figure 5. Spatial correlations of the residual chronologies from (a) Mt. Mudeung and (b) Mt. Wolchul from the preceding December to April sea surface temperature (SST) (Hadley Centre Global Sea Ice and Sea Surface Temperature (HadISST) [42]) for the 1971–2018 period. Black dots denote the correlations that are statistically significant at the p < 0.05 level.
Atmosphere 11 01082 g005
Figure 6. (a) The first empirical orthogonal function (EOF) leading mode of the residual chronologies from Mt. Mudeung, Mt. Wolchul, and Mt. Halla and (b) its corresponding PC time series for the 1971–2016 period. (c) Spatial correlations of the first PC time series with preceding December to April SST (shading; HadISST [42]) and GPH850 (contour; Japanese 55-year Reanalysis (JRA-55) [43]) data for the 1971–2016 period. Black dots denote the correlations that are statistically significant at the p < 0.05 level.
Atmosphere 11 01082 g006
Table 1. Statistics of tree-ring data from Mt. Mudeung (MD) and Mt. Wolchul (WC).
CodeNumber of CoresNumber of TreesMean AgeMean SensitivityInterseries CorrelationFirst-Order Autocorrelation
MD15151460.2180.5440.798
WC6427480.2510.5670.839

