Article

Complex Characterization of Fine Fraction and Source Contribution to PM2.5 Mass at an Urban Area in Central Europe

1
Faculty of Physics and Applied Computer Science, AGH University of Science and Technology, 30 Mickiewicza Ave, 30-059 Krakow, Poland
2
Faculty of Energy and Fuels, AGH University of Science and Technology, 30 Mickiewicza Ave., 30-059 Krakow, Poland
*
Author to whom correspondence should be addressed.
Atmosphere 2020, 11(10), 1085; https://doi.org/10.3390/atmos11101085
Submission received: 10 September 2020 / Revised: 7 October 2020 / Accepted: 8 October 2020 / Published: 13 October 2020

Abstract

:
It is well documented that Southern Poland is one of the most polluted areas in Europe due to the highest airborne concentrations of particulate matter (PM). Concentrations of fine particles are especially high in winter. Apart from detailed number concentrations, it is essential to accurately identify and quantify specific particulate pollution sources. Only a few Polish research centers are involved in such experiments—among them is Krakow research group. For the most part, research focuses on collecting 24-h average samples from stationary PM samplers at ambient monitoring sites and quantifying the specific elements and chemical constituents in PM. This approach includes modeling methods that can use the variability in physical and chemical PM characteristics as an input dataset to identify possible sources of the particles. The objective of this paper is to provide research results based on data collected from June 2018 to May 2019 from a single monitoring station at a central urban site. Careful comparison of data obtained prior to a 2019 law prohibiting solid fuel burning in the city of Krakow with data (2019–2020) when a regulation went into effect should indicate progress by noting lower PM levels. This work has shown that the method applied and Krakow results might be of interest to the broader community in regions of high PM concentration.

1. Introduction

The high concentration of airborne particulate matter (APM) is a global problem that is associated with exacerbated human health risks. Airborne PM may be responsible for cardiovascular and pulmonary diseases, but first of all, it is responsible for excessive mortality. In Europe alone, the excess in annual mortality rate due to ambient air pollution is about 412,000 [1]. It is well-known that PM, which is a chemically non-specific pollutant, can originate from varied emission sources and have diverse chemical composition [2]. Also, the health effects of PM are thought to be strongly related to particle size. Note that fine particles have more adverse effects, since they can penetrate deeper into the respiratory tract than coarse particles [3,4]. PM2.5 (fine particles) refers to particles less than 2.5 micrometers in aerodynamic diameter. The primary source of PM2.5 is biomass and fossil fuel combustion including the energy use and production in households [2,5].
PM2.5 is one of the most dangerous forms of particulate matter air pollution, due to its potential for oxidative damage to the human body. Numerous studies link the PM2.5 exposure to the deaths from cardiovascular diseases. Furthermore, PM2.5-induced oxidative stress is conducive to vascular (endothelial) dysfunction and inflammation, which can simplify the development of hypertension, atherosclerosis, diabetes and other diseases [6,7,8].
Interestingly, the annual average limits in various countries are different. The annual average limit for PM2.5 in the European Union countries (including Poland) is 20 µg/m3. By comparison, the limit in Canada is 10 µg/m3, while in Australia, the annual PM2.5 limit is 8 µg/m3 [9].
The problem of air pollution in Poland is important. Numerous studies indicate that the air quality in Poland is one of the worst in the EU [10]. This may be connected with the fact that coal combustion is the significant source of PM in Poland [3,11]. In Krakow, the annual PM2.5 limit is regularly exceeded. In 2018 only, the average value of PM2.5 was 29 µg/m3 [12].
In order to improve air quality management, it is important to identify possible sources of pollution. Several methods are available.
  • Methods based on evaluating measuring data; to identify the sources, a basic numerical data treatment is applied.
  • Methods based on emission inventories and/or dispersion models to simulate aerosol emission, formation, transport and deposition.
  • Methods based on statistical evaluation of PM chemical data acquired at receptor sites (receptor models). The fundamental principle of receptor modeling is that mass and species conservation can be assumed and a mass balance analysis can be used to identify and apportion the sources of airborne PM in the atmosphere [13]. Among them, there is Positive Matrix Factorization (PMF), which is a result of the works of Paatero and Tapper [14], and is an advanced source-receptor method of analysis. Owing to this technique, PM2.5 sources can be identified with a number of factors and it is possible to estimate their contribution in each factor [14,15].
Some information about sources of PM particles can be derived from Scanning Electron Microscopy with energy dispersive spectrometer measurements [16]. The air protection program for the Małopolskie Voivodeship states that the main emission sources included in the Central Emission Base and their shares are as follows: municipal and household sector 88% of PM2.5, industry 4% of PM2.5, transport 4% of PM2.5 and agriculture 4% of PM2.5 [17].
The aim of this study was to estimate concentrations of chemical elements and ions in fine particulate matter (PM2.5). The results are presented in tables and graphs. This study is a continuation of a research study on air pollution in Krakow, which was initiated a few years ago. Therefore, we compared current results with the results obtained in the previous studies [18,19].

2. Experiments

2.1. Sampling

Krakow, the second big city in the country and the capital of Malopolska Province, is located in South Poland and situated in the valley of the Vistula River (see map in Figure 1). Krakow has an estimated population of 780,000 people, and together with the surrounding suburb towns, it constitutes the 1.5 million Krakow Agglomeration [20]. The city with mean population density of 2371 inhabitants per km2 is crossed by a network of railways and roads. There are several emission sources such as: coal fired power plants (Elektrocieplownia Krakow S.A., Elektrownia CEZ Skawina S.A., Elektrownia Siersza Trzebinia), a steel factory (ArcelorMittal Poland S.A., Krakow), chemical factories (Grupa Azoty S.A. Tarnow, Synthos Dwory 7 S.A. Oswiecim), as well as a hard coal mine (Katowicki Holding Weglowy S.A., Jastrzebska Spolka Weglowa), a steel factory (Arcelor Mittal Poland S.A., Silesia), the production of metals and metal products, coking plants (Przyjazn, Bo-Carb, Kombinat Koksowniczy w Zabrzu) and the production of building materials, cements, glass in the Silesia region [21].
The average annual temperature is about 8.7 °C, precipitation is 671.5 mm and the amount of rainy days is 175 [22]. From the year 2015 to 2019, when PM2.5 concentrations were monitored by the Environmental Protection Agency (EPA), average values at the urban background location were around 29–32 µg/m3.
For the aims of the current work, PM2.5 samples were collected continuously during one year at the urban background site at the AGH University of Science and Technology (see map in Figure 1). Twenty-four-hour samples were taken every 3rd day, from 7 June 2018 to 27 May 2019 by a low volume Sven Leckel PM sampler. The PM2.5 samples were collected on 46.2 mm diameter PTFE filters under an air flow rate of 2.3 m3/h. Altogether, 114 samples were acquired during this campaign.

2.2. Chemical Analyses

The filters were weighed according to PN-EN 12,341 standard before and after exposition (weighed five times). They are to be conditioned before at the temperature 20 ± 1 °C and relative humidity 50 ± 5% for 48 h.
Particle samples deposited on the PTFE filters were analyzed for the elements: Si, P, S, Cl, K, Ca, Ti, V, Cr, Mn, Fe, Ni, Zn, Cu, Br, Sr, Rb, Pb, As and the element concentrations quantified by energy dispersive X-ray fluorescence (EDXRF). Elemental analysis was performed in the laboratory of X-ray fluorescence. The measurements were carried out under the following conditions: voltage of 55 kV, current of 30 mA and measuring time of 2400 s under atmospheric air. The spectrometer was calibrated using thin film standards (Micromatter, USA) and verified by the analysis of NIST standard SRM 2783 (Air Particulate Matter on Filter Media).
Determination of ion concentrations (Na+, K+, Mg2+, Ca2+, NH4+, NO3, Cl, SO42−) was performed with isocratic ion chromatography on an ICS-1100 instrument (Thermo Scientific) equipped with an autosampler AS-DV. Separations were accomplished using an Ion Pac AS22 (4 × 250 mm) analytical column, (mobile phase: 4.5 mM Na2CO3 + 1.4 mM NaHCO3), and a CS16 (5 × 250 mm) analytical column (mobile phase: 12 mM MSA) for anions and cations, respectively. Samples (25 µL injection volume) were separated with a flow rate of 1.2 mL min−1 of mobile phase. The separated ions were determined after electrochemical suppression using AERS 500 (4 mm) and CERS 500 (4 mm) suppressors for anions and cations, respectively.
Calibration was performed against external standards diluted from stock solutions supplied by Thermo Scientific. The limit of detection (defined as 3 × standard deviation for the field blank samples) for the method for atmospheric samples is presented in another paper [18].

2.3. Source Apportionment

2.3.1. Enrichment Factors

Enrichment Factors (EF) analysis was performed, and the natural and anthropogenic origins of the elements were assessed.
EFs were calculated from the formula presented by Belis, C.A. et al. [23]:
E F = X P M R P M X c r u s t R c r u s t ,
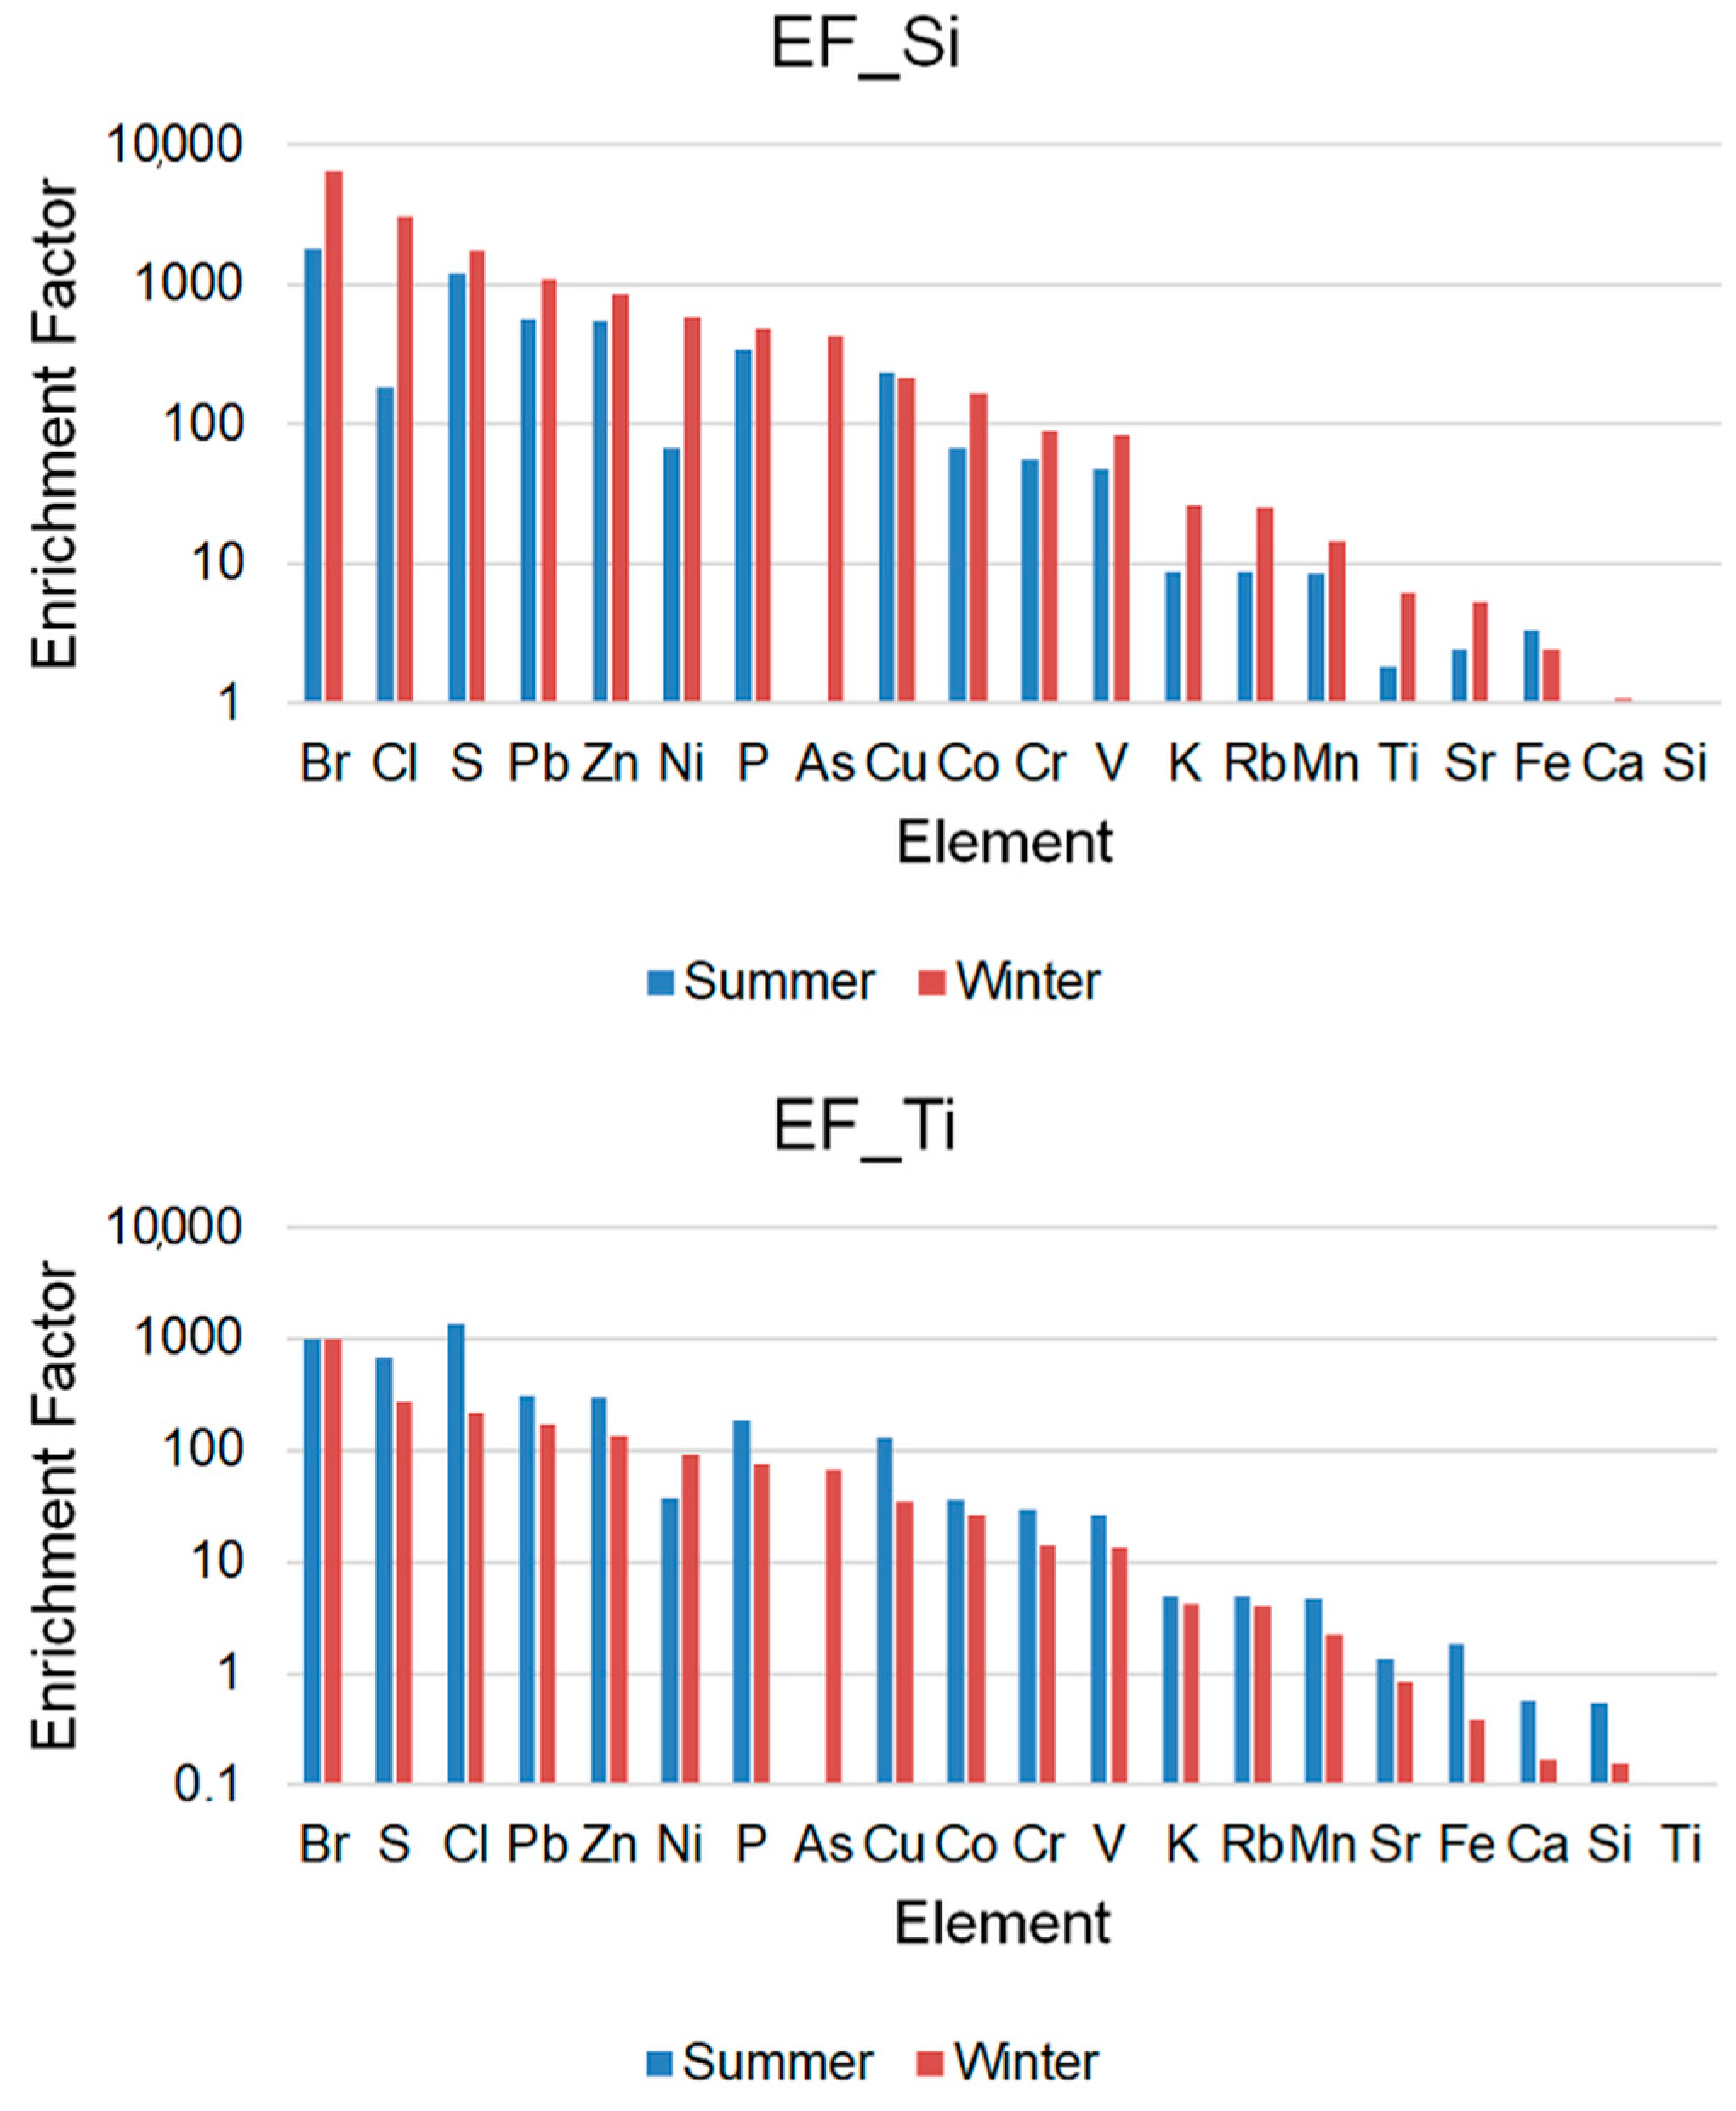
where X and R are the concentrations of the element under consideration and the reference element, respectively. PM and crust mean the concentrations in PM and in the Earth’s crust. Three groups of element sources are presented: (1) EF < 10 indicates the crustal origin of the element; (2) 10 < EF < 100 indicates a mixed origin of the elements (natural and anthropogenic); (3) EF > 100 indicates an anthropogenic origin of a given element. The calculations of EF were performed separately for Si and Ti as reference elements (if Si is the reference element EFSi = 1, or else if Ti is taken as the reference element EFTi = 1). The same conclusions about the natural or anthropogenic origin of the elements were drawn on the base of both calculations. Abundances of elements in the Earth’s crust were taken from the paper [24].

2.3.2. Positive Matrix Factorization Analysis

In addition to the chemical species, it is important to identify the sources of particulate matter origin. Having at least several dozen particulate matter samples with the chemical species well determined, the positive matrix factorization (PMF) method can be used to quantify their sources [18,19]. The PMF method, on the basis of the matrix of chemical species of particulate matter samples, calculates the matrix of participation of a given number of factors and profiles of these factors [25]. The profile determines the share of individual components in a given factor and is the basis for the physical assignment of a given factor to identify the sources of particulate matter. In this method, the number of factors is set arbitrarily. In practice, calculations are made for a different number of factors and the number for which the source of particulate matter can be clearly determined is selected. The EPA PMF 5.0 software, developed by the United States Environmental Protection Agency (US EPA), was used to model the particulate matter sources.
In the presented study, four factors emerged based on the following chemical species: S, Cl, K, Ca, Ti, V, Cr, Mn, Fe, Co, Ni, Cu, Zn, Br, Rb, Sr, Pb, NO3, CHOO, NH4+ and Na+. Almost all these data were classified as “strong,” which resulted in a high signal-to-noise ratio. Only Ti, V, Ni and Sr were classified as “weak” species. “Strong” data are when the uncertainty of the measurement is small in relation to the measured signal, and “weak” is when the uncertainty is large in relation to the signal. “Weak” data are taken with less weight in PMF modeling [25].
Other element and ion concentrations, in many samples, were less than the detection limits and they were not taken in PMF modeling. This selection allowed us to obtain the following values of the model minimizing function: Q(robust) was 9701 and Q(True) was 14,679.

3. Results and Discussion

3.1. Chemical Analyses

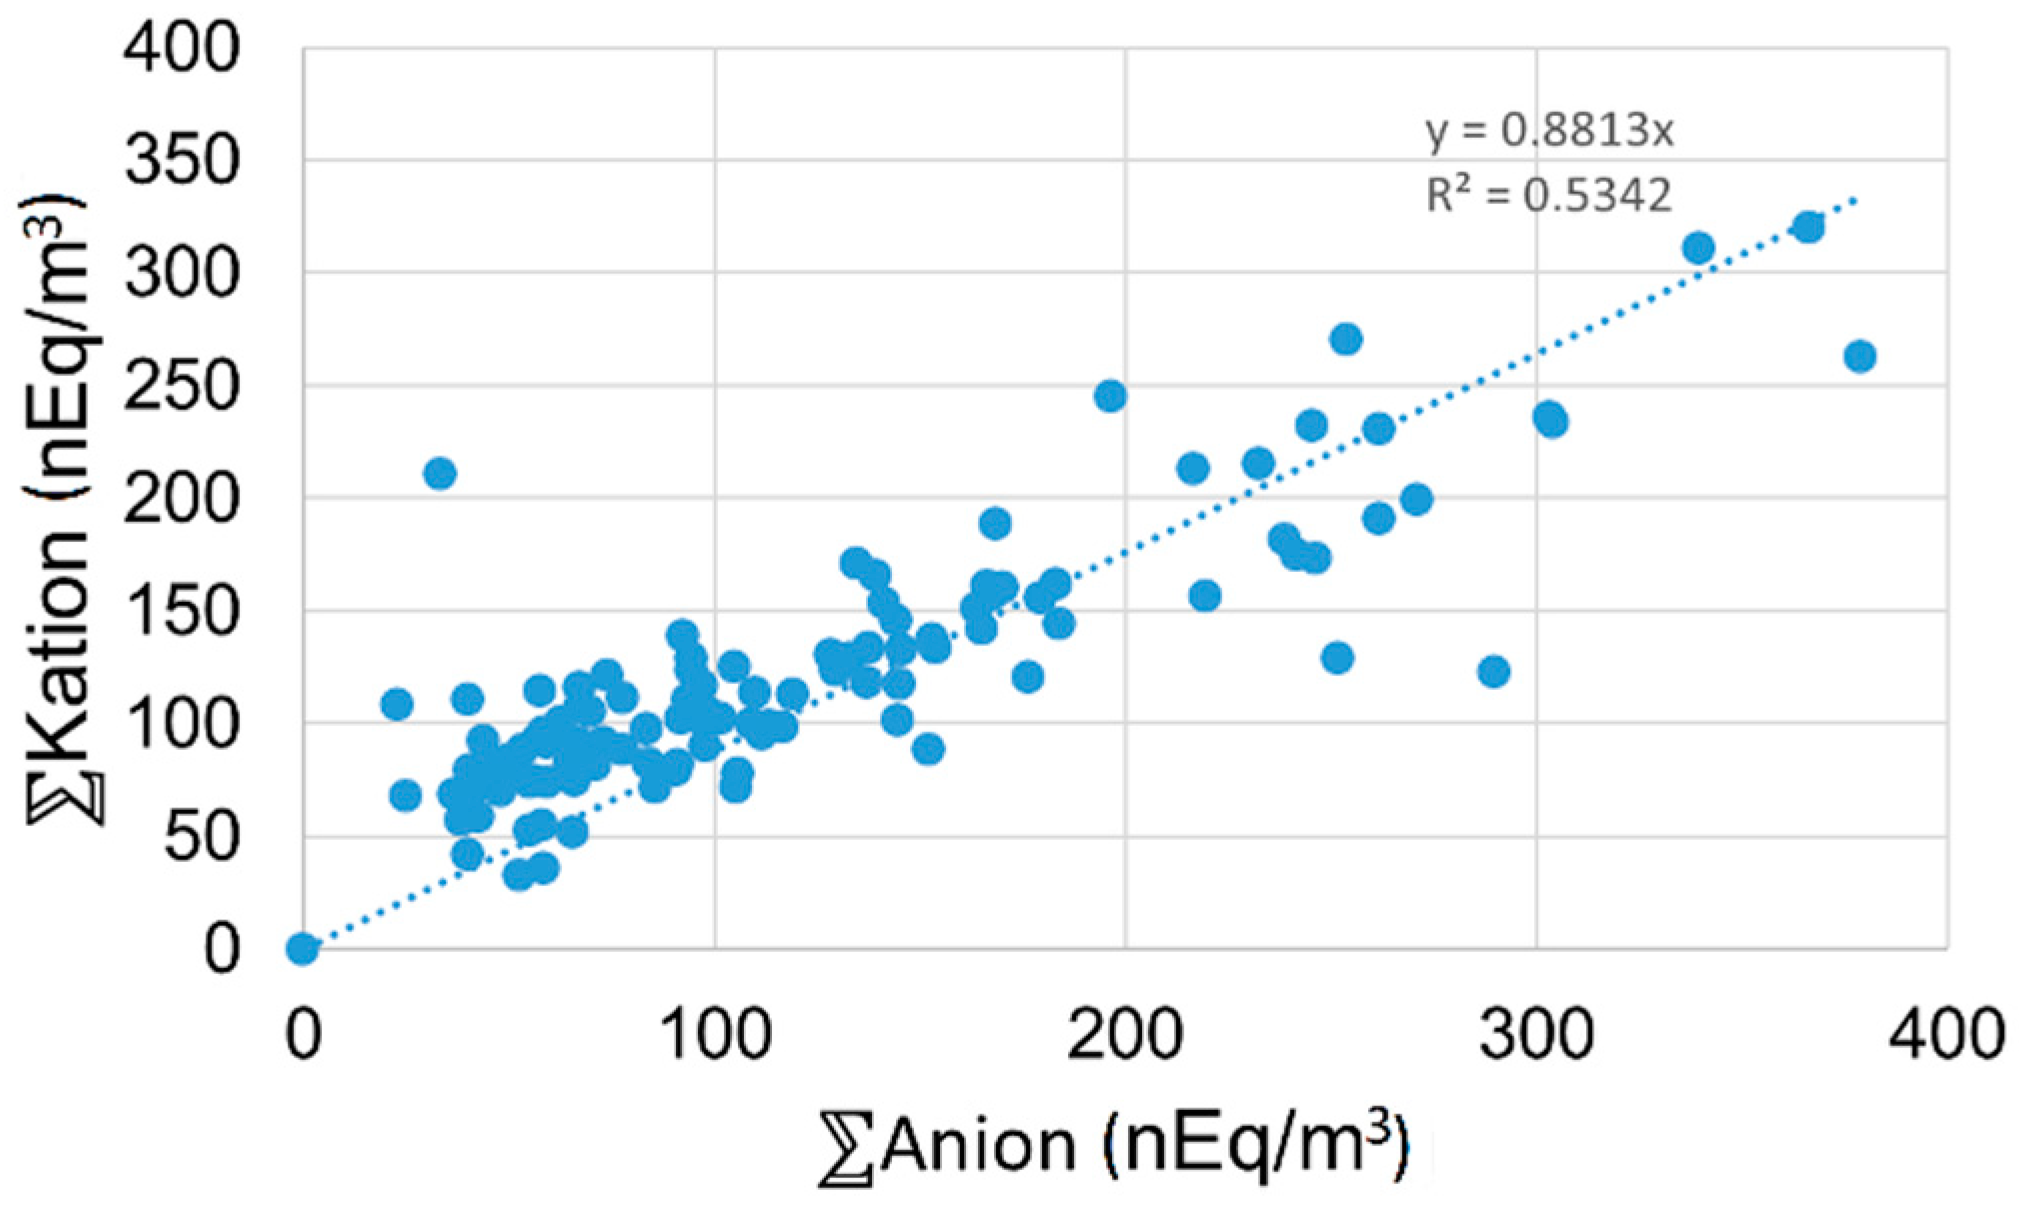
Table 1 contains PM2.5 elemental and ion concentrations for samples collected in 2018/2019 in Krakow. The average annual PM2.5 concentration in Krakow in 2018/2019 was equal to 24 ± 13 µg/m3. This value is comparable to the EU annual limit value 25 µg/m3 [26], and is higher than recommended by the World Health Organization (WHO) value of 10 µg/m3 [27]. The lowest value was observed in summer 2018. The PM2.5 concentration value for winter 2019 was 2.34 times higher than for summer 2018. They were equal to 34.8 ± 19 µg/m3 and 14.8 ± 4.1 µg/m3, respectively. In our previous studies conducted in 2014/2015 and 2016/2017, for winter, the PM2.5 concentrations were equal to 57 µg/m3 and 60 µg/m3, respectively [18,19]. Such a strong decline of PM2.5 concentration during winter can be connected with local authority regulations and activities lowering the number of houses heated by low quality coal during cold seasons. In September 2019, a regulation went into effect according to which the use of coal and wood for heating is forbidden in the city. However, a comparison of the level of PM concentration in the longer time span is more complex. The value for summer in the recent study does not much differ from the previous results—they were equal to 12.7 µg/m3 and 12 µg/m3 for 2014/2015 and 2016/2017, respectively [18,19]. The average annual contribution of measured elements to PM2.5 mass was 11.7% (2.8 µg/m3); if the contribution of sulfur is subtracted, this number is equal to 6.8% of PM2.5 mass. The average annual contribution of SIA (Secondary Inorganic Aerosols) was equal to 27.9% (6.7 µg/m3). The highest value was observed in winter 23.3% (8.6 µg/m3))—and the lowest in spring—35.2% (6.06 µg/m3) In our previous study [18] conducted in 2016/2017, the average annual contribution of SIA was equal to 27% (9.0 µg/m3), and together with the average contribution of measured elements at that time, it was 5.3% (1.8 µg/m3). Blaszczak et al. reports that SIA in Szczecin was 5.42 µg/m3, and in Trzebinia 7.35 µg/m3 at urban background stations [28]. When compared with other countries, similar values were observed in Kosetice (The Czech Republic—6.57 µg/m3), Riso (Denmark—6.43 µg/m3) and Cabauw-Zijdeweg (the Netherlands—7.89 µg/m3) [28]. Shortly before the current work, the EDXRF system was modified so that more elements could be detected (for example Si, S, P). As a result, the average annual contribution of carbon and the rest of the chemical components was about 68% of PM2.5 mass for the year 2016/2017. In the present work, SIA and all the elements (without S) average annual contribution was 34.7%. The rest of the components and carbon have the contribution of only 65.3% of PM2.5 mass. In the present study (2018/2019), the concentrations of the following elements: Cl (630 ± 590 ng/m3), K (230 ± 140 ng/m3), Ca (50 ± 30 ng/m3), Fe (150 ± 120 ng/m3), Cu (5.9 ± 5.0 ng/m3), Zn (75 ± 56 ng/m3), Br (7.5 ± 4.1 ng/m3) and Pb (12.5 ± 9.8 ng/m3) were significantly lower than in our previous work conducted in 2016/2017 in Krakow. The concentration of V (4.3 ± 2.6 ng/m3), Cr (5.1 ± 3.7 ng/m3), Mn (9.0 ± 6.0 ng/m3) and Ni (5.9 ± 8.0 ng/m3) in 2018/2019 were increased in comparison to 2016/2017. The concentration of NO3, SO42−, NH4+, Na+ and Cl are definitely lower in the present study than in the year 2016/2017. Several elements and ion concentrations show strong seasonal variations. Higher concentrations of Cl, K, Ti, Co, Ni, Br and Rb were observed in winter 2019 than in summer 2018. The ratios of winter/summer were in the range of 2.33 to 13.7 for these elements. These elements are related to house heating during the cold season. For the elements Si, Ca, Fe and Cu, higher concentrations were observed for summer in comparison to winter. These elements originate in the Earth’s crust, and are connected with dust resuspension and/or construction works. The ratios winter/summer were in the range 0.61–0.85. The concentrations of NO3, NH4+ and Cl were definitely higher in winter than in summer. Ratios winter/summer were 2–5. On the contrary, concentrations of SO42− were on the same level during all seasons 2018/2019 and it was equal to 3 µg/m3. Juda-Rezler et al. for Warsaw obtained 2.72 µg/m3 and 1.77 µg/m3 for winter and summer, respectively [29]. In our previous study, concentrations of SO42− were 6.35 µg/m3 and 2.44 µg/m3 in winter and summer, respectively [18]. In winter SO42− originates from coal combustion, but in summer, long-range transport of sulfates-rich aerosols and coal combustion in power plants probably dominate [29]. This may be due to the stronger solar radiation in summer, increasing both temperature and the formation of OH radicals, therefore promoting the formation of secondary sulfate, which is transported at longer distances than the gaseous precursors [30]. The correlation of the equivalent concentration of cations with the equivalent concentration of anions is presented in Figure 2.

3.2. Source Apportionment

3.2.1. Enrichment Factors

Enrichment factors were calculated for two seasons (winter, summer), using Si and Ti as references. Figure 3 presents EFs for the analyzed elements. For the following elements, EFs were lower than 10 for both Si and Ti as the reference elements: Si, K, Ca, Ti, Mn, Fe and Sr. This indicates natural sources of the elements considered. However, K has not only a natural origin, but can be emitted from biomass burning as well. Similarly, Ca can also come from cement industry and construction works. Mn, Fe may be related to the steel industry. Juda-Rezler at al. have a similar range of EFs for K, Mn, Fe [29] Typically, the elements with enrichment factors higher than 100 indicate anthropogenic origin. In this group of elements, S, Cl, Cu, Zn, As, Br and Pb were found. Juda-Rezler at al. have EFs higher than 100 for Cu, Zn and Pb [29]. Cl, S, As, Br and Pb were related to coal combustion. They present seasonal variations in concentration, with higher values in the heating season. Cu, Zn and Pb were connected with industry and Cu, Zn with traffic (vehicle exhaust Cu, Zn, and non-exhaust Cu, Zn). The rest of the analyzed elements had EFs between 10 and 100 and they can have both natural and anthropogenic origins. To this group belongs P, V, Cr, Co, Ni and Rb. Juda-Rezler at al. have an EF between 10 and 100 for Cr, Ni [29].

3.2.2. Positive Matrix Factorization (PMF)

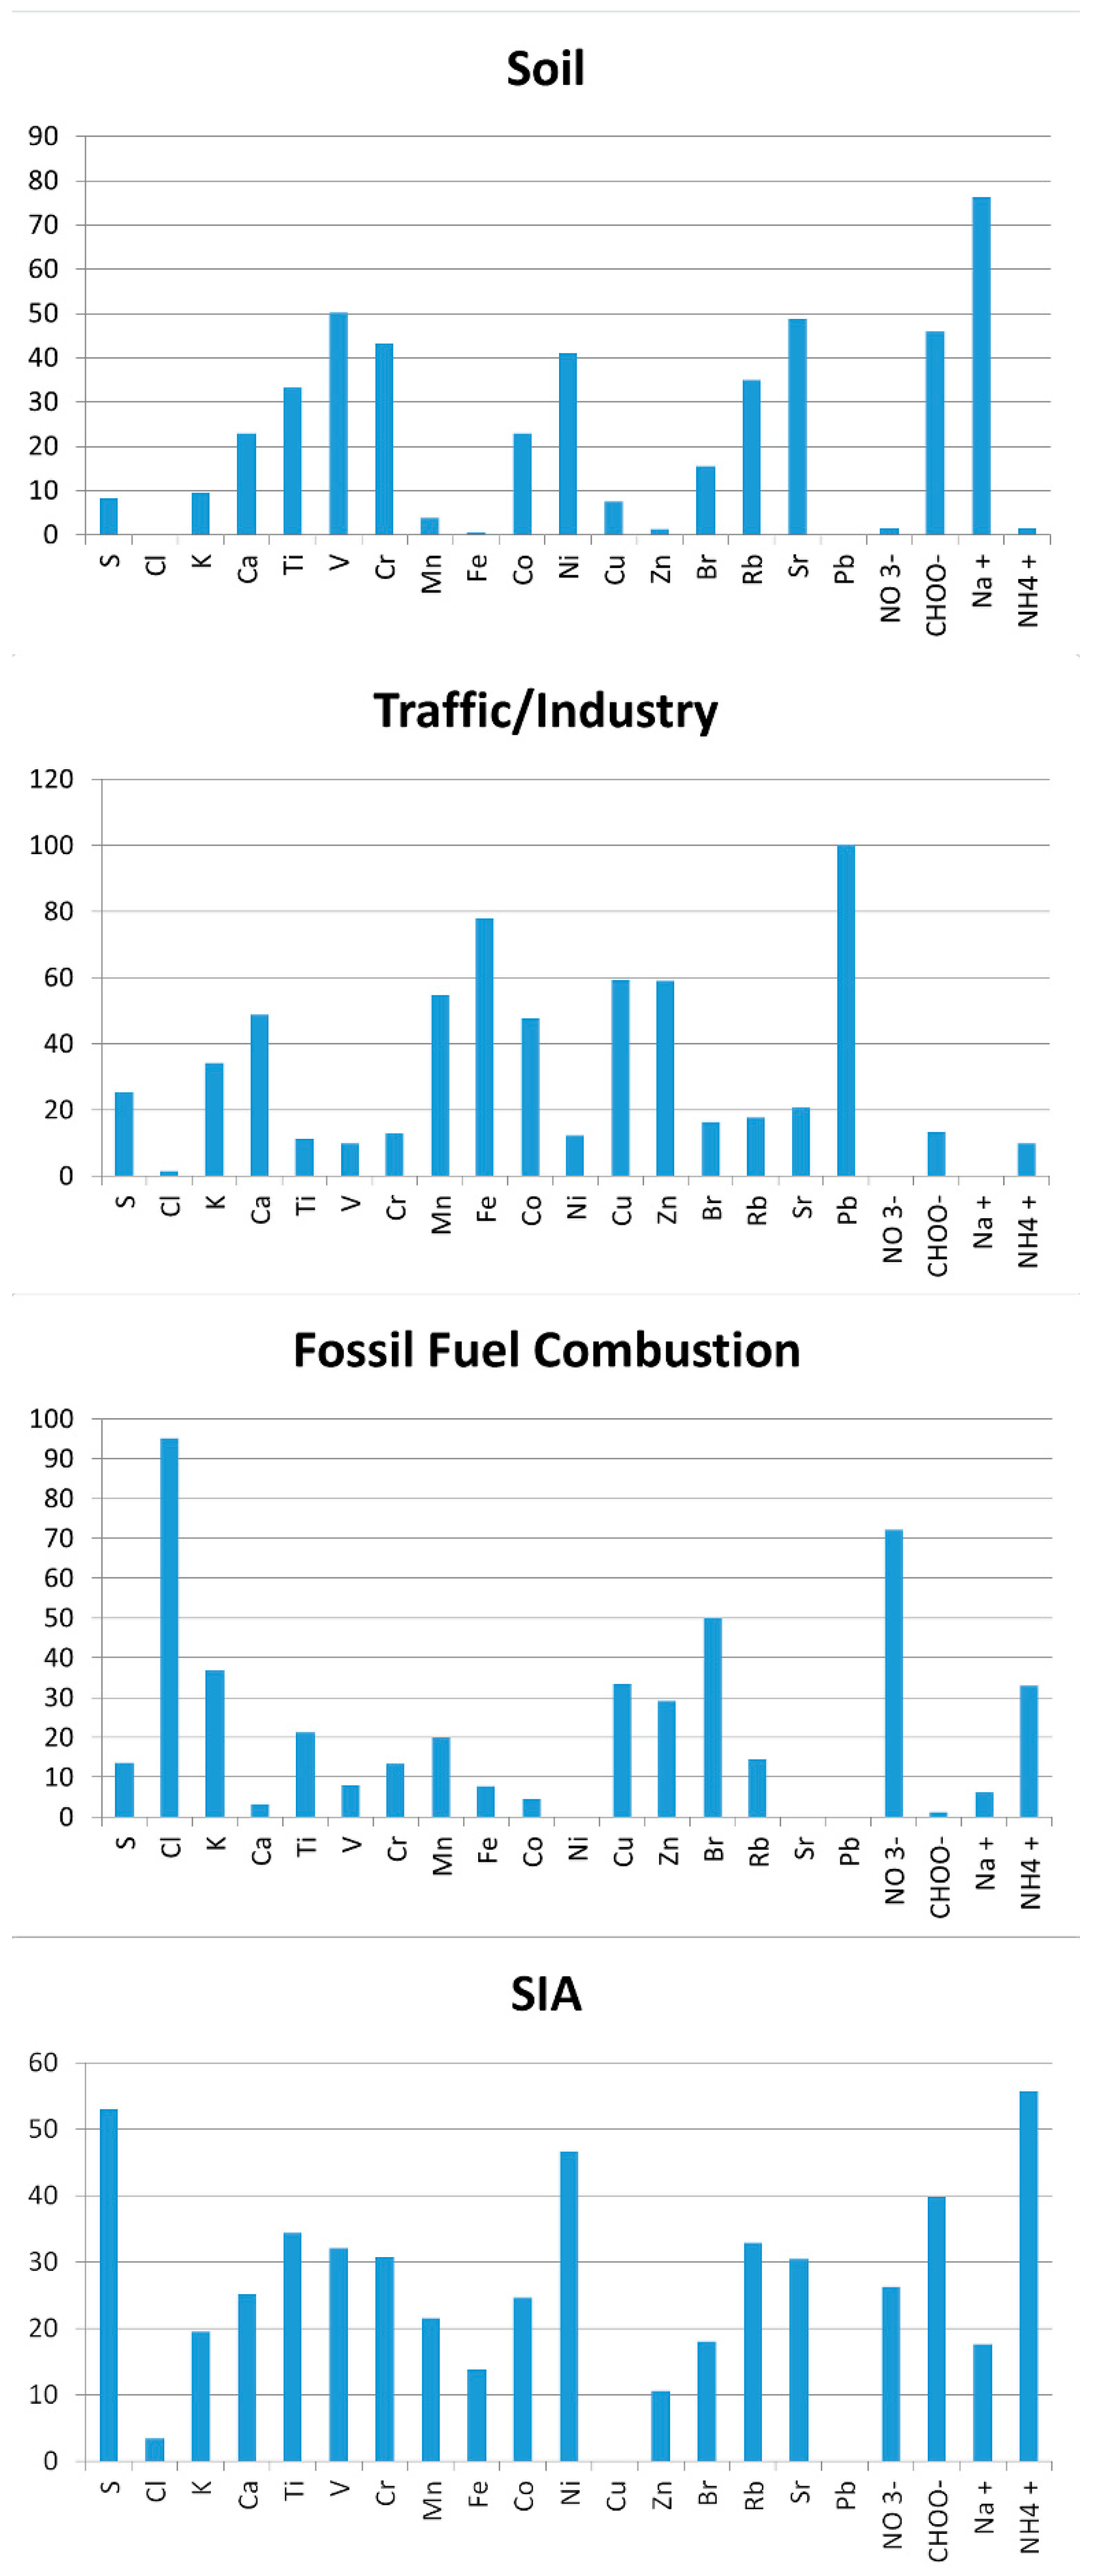
Figure 4 shows PMF factor profiles of the identified sources. Four factors were obtained from PMF analysis. They were attributed to the following sources: Soil, Traffic/Industry, Fossil Fuel Combustion and Secondary Inorganic Aerosols (SIA).
The first factor was characterized by Na+ (76% of mass), Sr (49% of mass), Ni (41% of mass), Cr (43% of mass), V (50% of mass), Rb (35% of mass), Ti (33% of mass) and Ca (23% of mass). Ca, Ti and Sr have EFs below 10, which suggests the natural origin of these elements. Ni, Cr, V and Rb have EFs below 100, so these elements can originate from natural or anthropogenic sources. The above-mentioned elements can originate from soil; thus, this factor was attributed to soil. Na+ was observed at regional background monitoring stations in Poland with concentrations of about 0.212 µg/m3, and in this study at 0.37 µg/m3 [30,31]. Ni is the 24th most abundant element in the Earth’s crust. The most Ni is used in the production of stainless steel and other nickel alloys. It is a natural as well as an anthropogenic element. The natural sources include: windblown dust derived from the weathering of rocks and soils, volcanic emissions, forest fires and vegetation. Ni can also come from the combustion of coal, diesel oil, fuel oil and the incineration of waste and sewage. Cr comes from the wind erosion of soil, and Sr is from soil. Ti and Ca are crustal elements [32]. The contribution of this factor to PM2.5 was equal to 4.1% (1.7–9.4%). In concentration units, it was 1.04 µg/m3 (0.9–1.4 µg/m3). The concentration of this source is rather stable during the year.
The second factor is represented by Pb (100% of mass), Fe (78% of mass), Cu (59% of mass), Zn (59% of mass), Mn (55% of mass), Ca (49% of mass), Co (48% of mass), K (34% of mass) and S (25% of mass). The industrial source is identified by the following elements: Pb, Fe, Zn, Cu and Mn. The EF for Pb, Zn and Cu was higher than 100, demonstrating anthropogenic origin. Co, Cu, Zn, Mn and S are traffic related elements (exhaust and non-exhaust). Ca can be attributed to construction works [31,33]. Fe and Mn have an EF below 10 and can probably indicate natural origin. These elements can originate from the steel industry as well as the ferrous and nonferrous metal industry. Thus, this factor was attributed to Traffic/Industry. The contribution of this factor to PM2.5 mass was equal to 24% (5–49%). In concentration units, it was 6.2 µg/m3 (0.89–18.34 µg/m3). This source contribution is different for each season. In May, the lowest value 8.3% (0.89 µg/m3) was observed, while in November, the highest value, equal to 48.6% (18.34 µg/m3), was observed.
The third factor is described by Cl (95% of mass), Br (50% of mass), NO3 (72% of mass), K (37% of mass), Cu (33% of mass) and NH4+ (33% of mass). The above elements are anthropogenic. Cl comes from the combustion of coal, and K is an indicator of biomass burning [33]. K is also present in fly ash emitted from power plants in several types of industrial emissions. It is also present in numerous minerals (e.g., clays, feldspars) and can be related to natural dust (e.g., from soil). Concentration of these chemical species show seasonal variations. This factor is attributed to fossil fuel combustion. The contribution of this source was equal to 36% (1.9–76%). In concentration units, it was 9.25 µg/m3 (0.26–28.45 µg/m3). The concentration of this source shows seasonal variations with the highest value in winter. The lowest value was observed in June at 1.9% (0.26 µg/m3), and the highest in December at 76% (28.45 µg/m3).
The fourth factor is described by NH4+ (56% of mass), S (53% of mass), Ni (47% of mass), Ti (34% of mass), V (32% of mass), Cr (31% of mass), Rb (33% of mass), Sr (30% of mass) and NO3 (26% of mass). It is recognized as secondary inorganic aerosols [34]. The contribution of this source to PM2.5 mass was equal to 20% (8–40%). In concentration units, it was 5.2 µg/m3 (3.7–10.58 µg/m3). This source has the lowest contribution in June of 3.7 µg/m3 (28%), and the highest in January with 10.58 µg/m3 (18%).
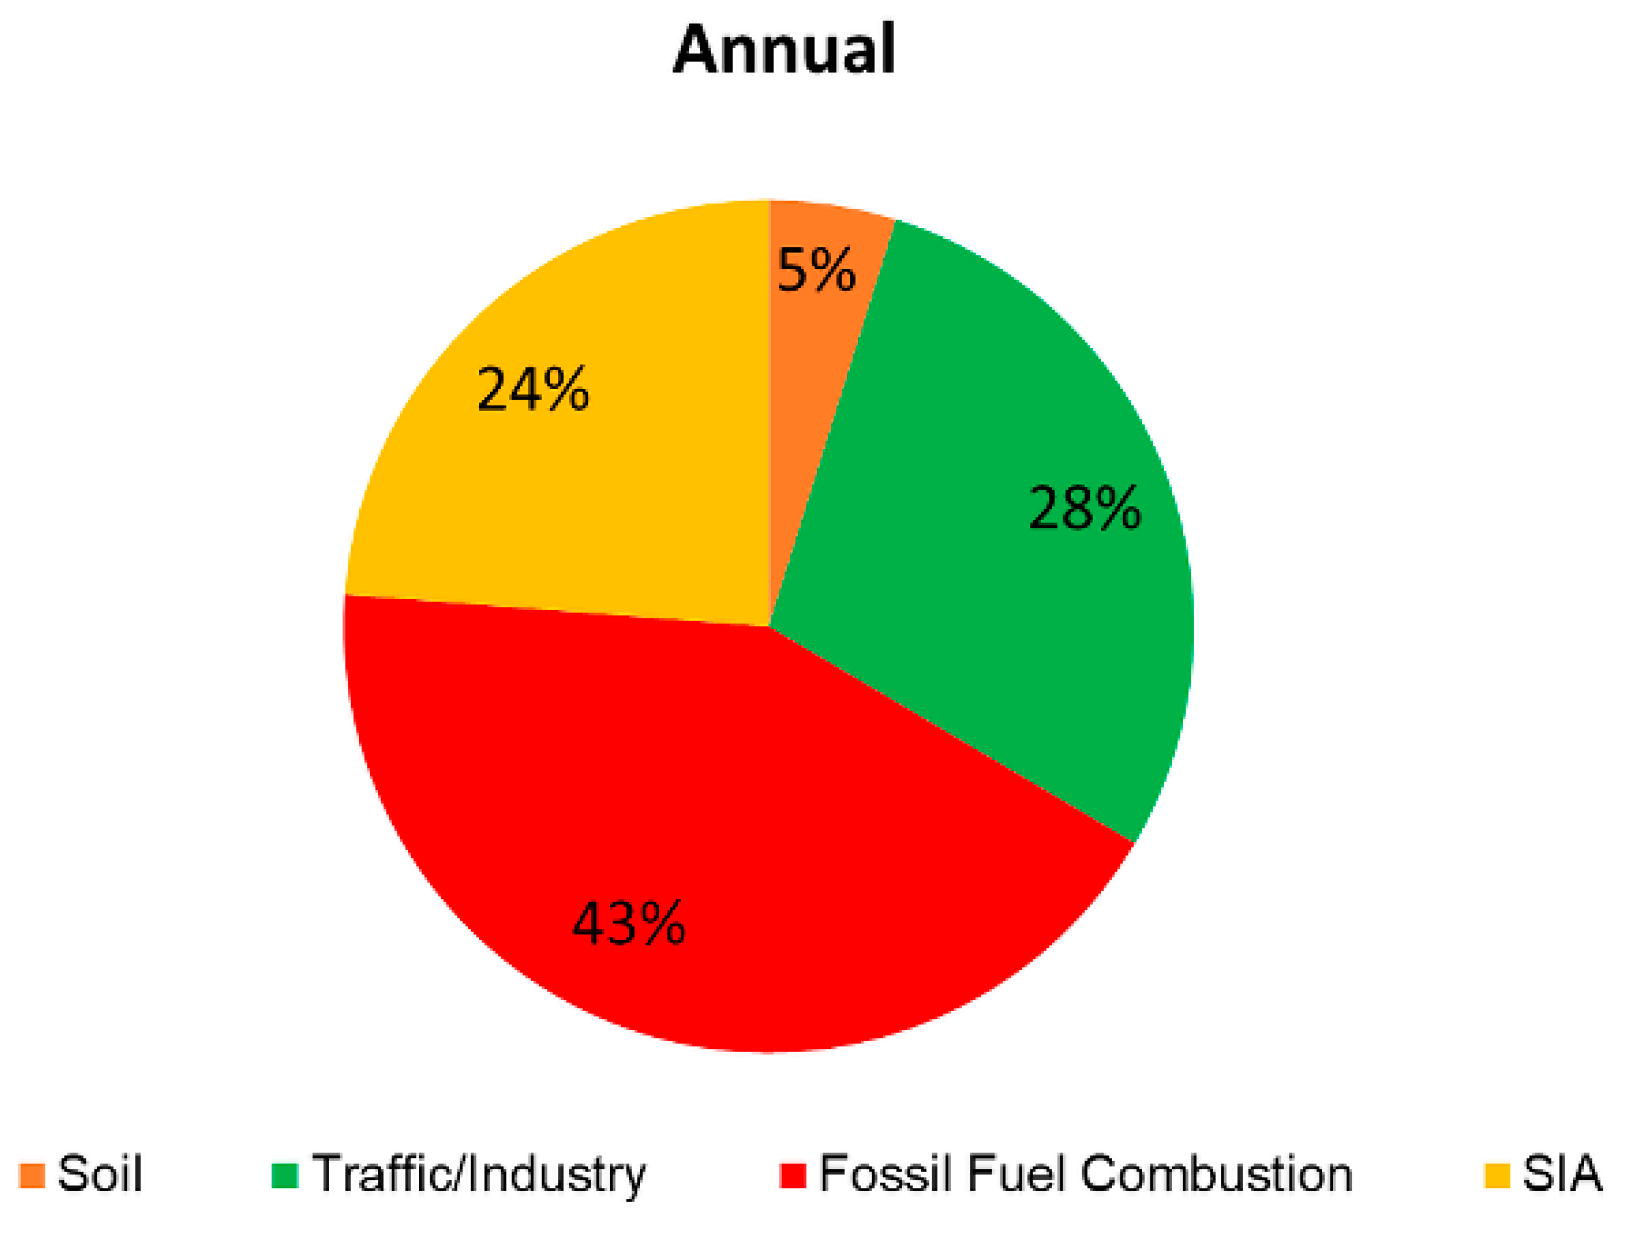
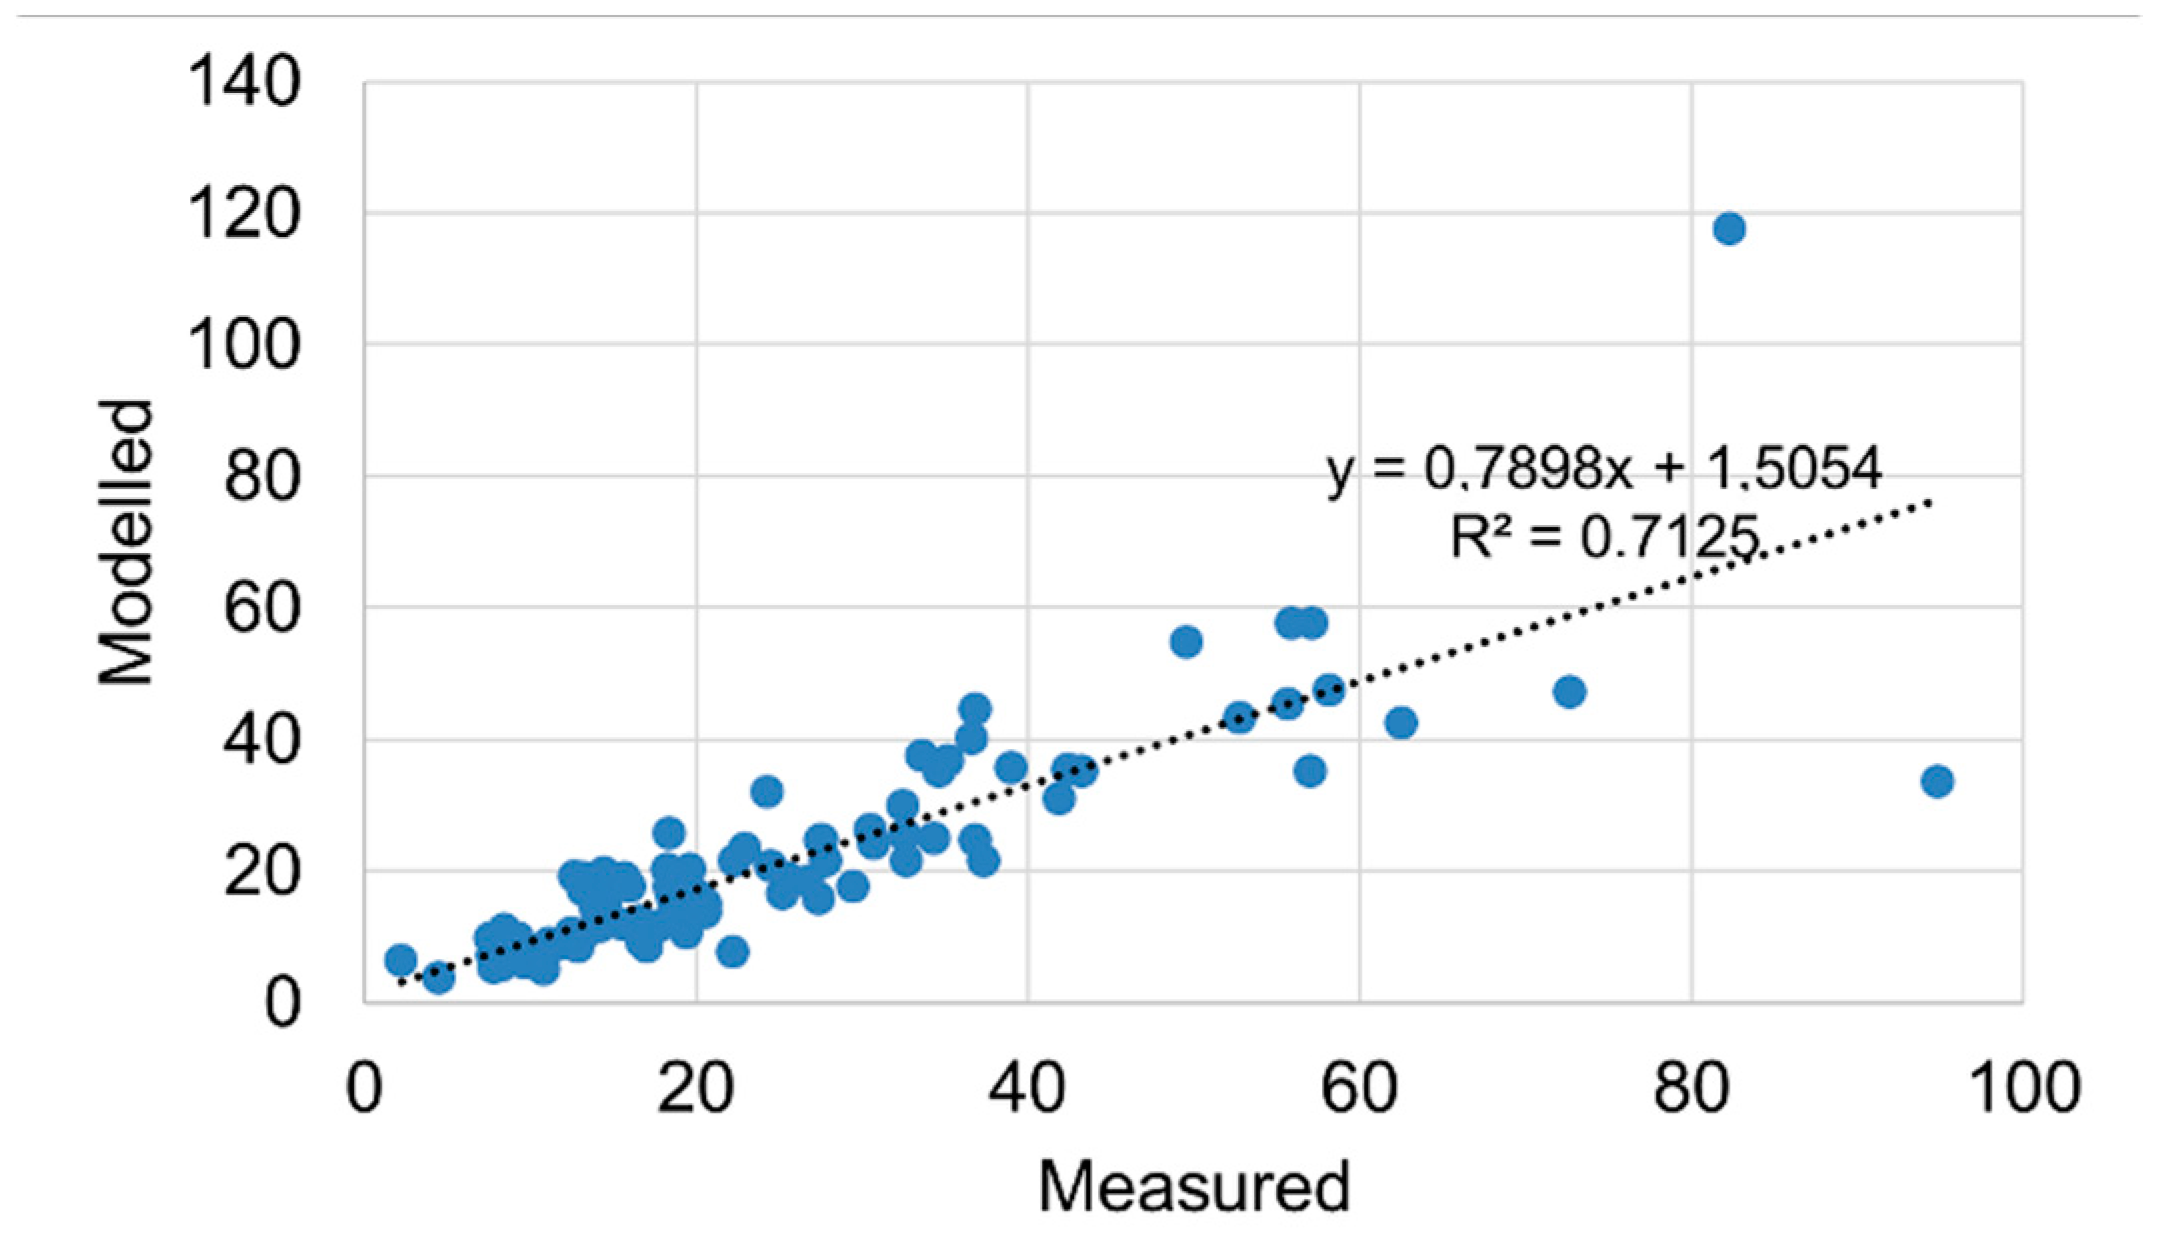
The contribution of identified sources to PM2.5 mass is presented in Figure 5 and Figure 6. Measured versus modeled PM2.5 is presented in Figure 7.
Table 2 contains the results from this study and, for comparison, from our previous studies performed in Krakow. What can be drawn from the table is that the PM2.5 concentration was lowered by 28% in the last year. The contributions of traffic/industry and soil decreased by 1.44 µg/m3 (2.2%). The contribution in percentage of fossil fuel for this study is higher than in the previous one (12%), but in µg/m3, it is 0.91 µg/m3. The contribution of SIA in the present study was lower than in 2016/2017.

4. Conclusions

The conclusions of the research carried out are as follows:
  • During the summer period, secondary inorganic aerosols and particles from traffic and industry have the dominant contribution to particulate matter. The contribution of these sources is over 80% of PM. The contribution of secondary inorganic aerosols is slightly lower in relation to dust from traffic and industry. As for the absolute values, it is on average about 4–5 µg/m3 for secondary inorganic aerosols and 6 µg/m3 for traffic and industry.
  • In winter, the dominant source for particulate matter is the combustion of solid fuels. In absolute values, it is on average about 25 µg/m3, which is over 60% of the PM. In the second place, there are secondary inorganic aerosols with a contribution of about 20%. The mean absolute value is slightly higher than in summer, and amounts to 6 µg/m3. For autumn and spring, these are intermediate values between summer and winter.
  • The large jump in the concentration of particulate matter from traffic and industry in the period to November 2018 and from December 2018 remains to be explained. Until November, the average concentration of PM from this source was about 8.5 µg/m3, and from December, the average was about 3.4 µg/m3. In the PMF model, this source is characterized by such elements as Fe, Cu and Zn, the concentrations of which in the periods considered are adequately different.
  • These results will be the basis for assessing the effects of the introduction of the ban on solid fuel combustion in Krakow from autumn 2019.

Author Contributions

Conceptualization, L.S., A.T.-F.; methodology, L.S., A.S., P.F., K.S., L.F., Z.S.; software, Z.S., A.T.F.; validation, L.S., Z.S., A.T.-F., K.S., A.S., P.F.; formal analysis, A.T.-F., A.S., P.F.; investigation, L.S.; resources, L.S., K.S.; writing—original draft preparation, L.S., A.T.-F., Z.S.; writing—review and editing, L.S., A.T.-F., Z.S. supervision, L.S.; project administration, L.S.; funding acquisition, L.S., K.S. All authors have read and agreed to the published version of the manuscript.

Funding

This research received no external funding.

Acknowledgments

The International Atomic Energy Agency, project number RER/7/011 partially financed this work together with the subsidy of the Ministry of Science and Higher Education, grant numbers 16.16.220.842. and 16.16.210.476. AS and PF has been partly supported by the EU Project POWR.03.02.00-00-I004/16. The work was performed at AGH University of Science and Technology.

Conflicts of Interest

The authors declare no conflict of interest.

References

  1. European Environment Agency (EEA). Air Quality in Europe—2019; Report no. 10; European Environment Agency (EEA): Copenhagen, Denmark, 2019. [Google Scholar]
  2. Ito, K.; Christensen, W.F.; Eatough, D.J.; Henry, R.C.; Kim, E.; Laden, F.; Lall, R.; Larson, T.V.; Neas, L.; Hopke, P.K.; et al. PM source apportionment and health effects: 2. An investigation of intermethod variability in associations between source-apportioned fine particle mass and daily mortality in Washington, DC. J. Expo. Sci. Environ. Epidemiol. 2006, 16, 300–310. [Google Scholar] [CrossRef] [PubMed] [Green Version]
  3. Kristensson, A.; Ausmeel, S.; Pauraite, J.; Eriksson, A.; Ahlberg, E.; Byčenkienė, S.; Degórska, A. Source Contributions to Rural Carbonaceous Winter Aerosol in North-Eastern Poland. Atmosphere 2020, 11, 263. [Google Scholar] [CrossRef] [Green Version]
  4. Cho, S.H.; Tong, H.; McGee, J.K.; Baldauf, R.W.; Krantz, Q.T.; Gilmour, M.I. Comparative Toxicity of Size-Fractionated Airborne Particulate Matter Collected at Different Distances from an Urban Highway. Environ. Health Perspect. 2009, 117, 1682–1689. [Google Scholar] [CrossRef] [PubMed] [Green Version]
  5. Weagle, C.L.; Snider, G.; Li, C.; van Donkelaar, A.; Philip, S.; Bissonnette, P.; Burke, J.; Jackson, J.; Latimer, R.; Stone, E.; et al. Global Sources of Fine Particulate Matter: Interpretation of PM2.5 Chemical Composition Observed by SPARTAN using a Global Chemical Transport Model. Environ. Sci. Technol. 2018, 52, 11670–11681. [Google Scholar] [CrossRef] [PubMed]
  6. Du, Y.; Xu, X.; Chu, M.; Guo, Y.; Wang, J. Air particulate matter and cardiovascular disease: The epidemiological, biomedical and clinical evidence. J. Thorac. Dis. 2016, 8, E8–E19. [Google Scholar] [PubMed]
  7. Lelieveld, J.; Klingmüller, K.; Pozzer, A.; Pöschl, U.; Fnais, M.; Daiber, A.; Münzel, T. Cardiovascular disease burden from ambient air pollution in Europe reassessed using novel hazard ratio functions. Eur. Heart J. 2019, 40, 1590–1596. [Google Scholar] [CrossRef] [Green Version]
  8. Münzel, T.; Gori, T.; Al-Kindi, S.; Deanfield, J.; Lelieveld, J.; Daiber, A.; Rajagopalan, S. Effects of gaseous and solid constituents of air pollution on endothelial function. Eur. Heart J. 2018, 39, 3543–3550. [Google Scholar] [CrossRef] [Green Version]
  9. Giannadaki, D.; Lelieveld, J.; Pozzer, A. Implementing the US air quality standard for PM2.5 worldwide can prevent millions of premature deaths per year. Environ. Health 2016, 15, 88. [Google Scholar] [CrossRef] [Green Version]
  10. Zieliński, A.; Wielgus, A.; Dreliszak, J.; Zukow, W. Air pollution—Selected health effects in Poland. J. Educ. 2018, 8, 2391–8306. [Google Scholar]
  11. Wielgosinski, G.; Czerwińska, J. Smog Episodes in Poland. Atmosphere 2020, 11, 277. [Google Scholar] [CrossRef] [Green Version]
  12. Glowny Inspektorat Ochrony Srodowiska. Roczna Ocena Jakości Powietrza W Województwie Malopolskim; Glowny Inspektorat Ochrony Srodowiska: Krakow, Poland, 2019. [Google Scholar]
  13. Viana, M.; Kuhlbusch, T.A.J.; Querol, X.; Alastuey, A.; Harrison, R.M.; Hopke, P.K.; Winiwarter, W.; Vallius, M.; Szidat, S.; Prévôt, A.S.H.; et al. Source apportionment of particulate matter in Europe: A review of methods and results. Aerosol Sci. 2008, 39, 827–849. [Google Scholar] [CrossRef]
  14. Paatero, P.; Tapper, U. Positive matrix factorization: A non-negative factor model with optimal utilization of error estimates of data values. Environmetrics 1994, 5, 111–126. [Google Scholar] [CrossRef]
  15. Belis, C.; Favez, O.; Mircea, M.; Diapouli, E.; Manousakas, M.-I.; Vratolis, S.; Gilardoni, S.; Paglione, M.; Decesari, S.; Mocnik, G.; et al. European Guide Air Pollut. Source Apportionment Recept Models; Publications Office of the European Union: Luxembourg, 2014. [Google Scholar]
  16. Wilczynska-Michalik, W.; Pietras, B.; Samek, L.; Furman, L.; Latkiewicz, A.; Rzeznikiewicz, K.; Michalik, M. Submicron Particles in Air Pollution in Krakow. Aura 2015, 8, 4–7. (In Polish) [Google Scholar]
  17. Air Protection Program for the Małopolskie Voivodeship 2020. Available online: https://powietrze.malopolska.pl/program-ochrony-powietrza/ (accessed on 9 October 2020).
  18. Samek, L.; Stegowski, Z.; Styszko, K.; Furman, L.; Fiedor, J. Seasonal contribution of assessed sources to submicron and fine particulate matter in a Central European urban area. Environ. Pollut. 2018, 241, 406–411. [Google Scholar] [CrossRef] [PubMed]
  19. Samek, L.; Stegowski, Z.; Furman, L.; Styszko, K.; Szramowiat, K.; Fiedor, J. Quantitative Assessment of PM2.5 Sources and Their Seasonal Variation in Krakow. Water Air Soil Pollut. 2017, 228, 290. [Google Scholar] [CrossRef] [Green Version]
  20. Krakow Population. Available online: http://www.krakow-info.pl (accessed on 28 August 2020).
  21. Rybak, J.; Wróbel, M.; Bihałowicz, J.S.; Rogula-Kozłowska, W. Selected Metals in Urban Road Dust: Upper and Lower Silesia Case Study. Atmosphere 2020, 11, 290. [Google Scholar] [CrossRef] [Green Version]
  22. Available online: http://meteo2.ftj.agh.edu.pl/meteo (accessed on 14 August 2020).
  23. Belis, C.A.; Karagulian, F.; Larsen, B.R.; Hopke, P.K. Critical review and meta-analysis of ambient particulate matter source apportionment using receptor models in Europe. Atmos. Environ. 2013, 69, 94–108. [Google Scholar] [CrossRef]
  24. Rudnick, R.L.; Gao, S. The composition of the continental crust. In Treatise on Geochemistry—The Crust; Rudnick, R.L., Holland, H.D., Turekian, K.K., Eds.; Elsevier: Oxford, UK, 2003; pp. 1–64. [Google Scholar]
  25. Karagulian, F.; Belis, C.A. Enhancing source apportionment with receptor models to foster the air quality directive implementation. Int. J. Environ. Pollut. 2012, 50, 190–199. [Google Scholar] [CrossRef]
  26. UNION, PEAN. Directive 2008/50/EC of the European Parliament and the Council of 21 May 2008. Off. J. Eur. Union 2008, 51, 1–361. [Google Scholar]
  27. WHO Air Quality Guadelines for Particulate Matter, Ozone, Nitrogen Dioxide and Sulfur Dioxide: Global Update 2005-Summary of Risk Assessment. Available online: http://apps.who.int/iris/bitstream/10665/69477/1/WHO_SDE_PHE_OEH_06.02_eng.pd (accessed on 25 April 2018).
  28. Blaszczak, B.; Widziewicz-Rzonca, K.; Ziola, N.; Klejnowski, K.; Juda Rezler, K. Chemical Characteristic of Fine Particulate Matter in Poland in Relation with data from Selected Rural and Urban Bacground Stations in Europe. Appl. Sci. 2019, 9, 98. [Google Scholar] [CrossRef] [Green Version]
  29. Juda-Rezler, K.; Reizer, M.; Maciejewska, K.; Blaszczak, B.; Klejnowski, K. Characterization of atmospheric sources at a Central European urban background site. Sci. Total Environ. 2020, 713, 136729. [Google Scholar] [CrossRef] [PubMed]
  30. Almeida, S.M.; Manousakas, M.; Diapouli, E.; Kertesz, Z.; Samek, L.; Hristova, E.; Sega, K.; Padilla Alvarez, R.; Belis, C.A.; Eleftheriadis, K. The IAEA European Region Study GROUP, Ambient particulate matter source apportionment using receptor modelling in Euroean and Central Asia urban areas. Environ. Pollut. 2020, 266, 115199. [Google Scholar] [CrossRef] [PubMed]
  31. Raport GIOS. Ocena Zanieczyszczeń Powietrza Na Stacjach Monitoringu Tła Regionalnego W Polsce W 2014 Roku W Zakresie Pyłu Pm10, Pm2.5 Oraz Depozycji Metali I Wwa, Państwowy Monitoring Srodowiska; Inspekcja Ochrony Srodowiska: Warsaw, Poland, 2015. [Google Scholar]
  32. Kabata-Pendias, A.; Pendias, H. Biogeochemia Pierwistków Sladowych; PWN: Warsaw, Poland, 1999. [Google Scholar]
  33. Yu, L.; Wang, G.; Zhang, R.; Zhang, L.; Song, Y.; Wu, B.; Li, X.; An, K.; Chu, J. Characterization and Source Apportionment of PM2.5 in an Urban Environment in Beijing. Aerosol Air Qual. Res. 2013, 13, 574–583. [Google Scholar] [CrossRef] [Green Version]
  34. Manousakas, M.; Diapouli, E.; Papaefthymiou, H.; Migliori, A.; Karydas, A.G.; Padilla-Alvarez, R.; Bogovac, M.; Kaiser, R.B.; Jaksic, M.; Bogdanovic-Radovic, I.; et al. Source apportionment by PMF on elemental concentrations obtained by PIXE analysis of PM10 samples collected at the vicinity of lignite power plants and mines in Megalopolis, Greece. Nuc. Instrum. Meth. B 2015, 349, 114–124. [Google Scholar] [CrossRef]
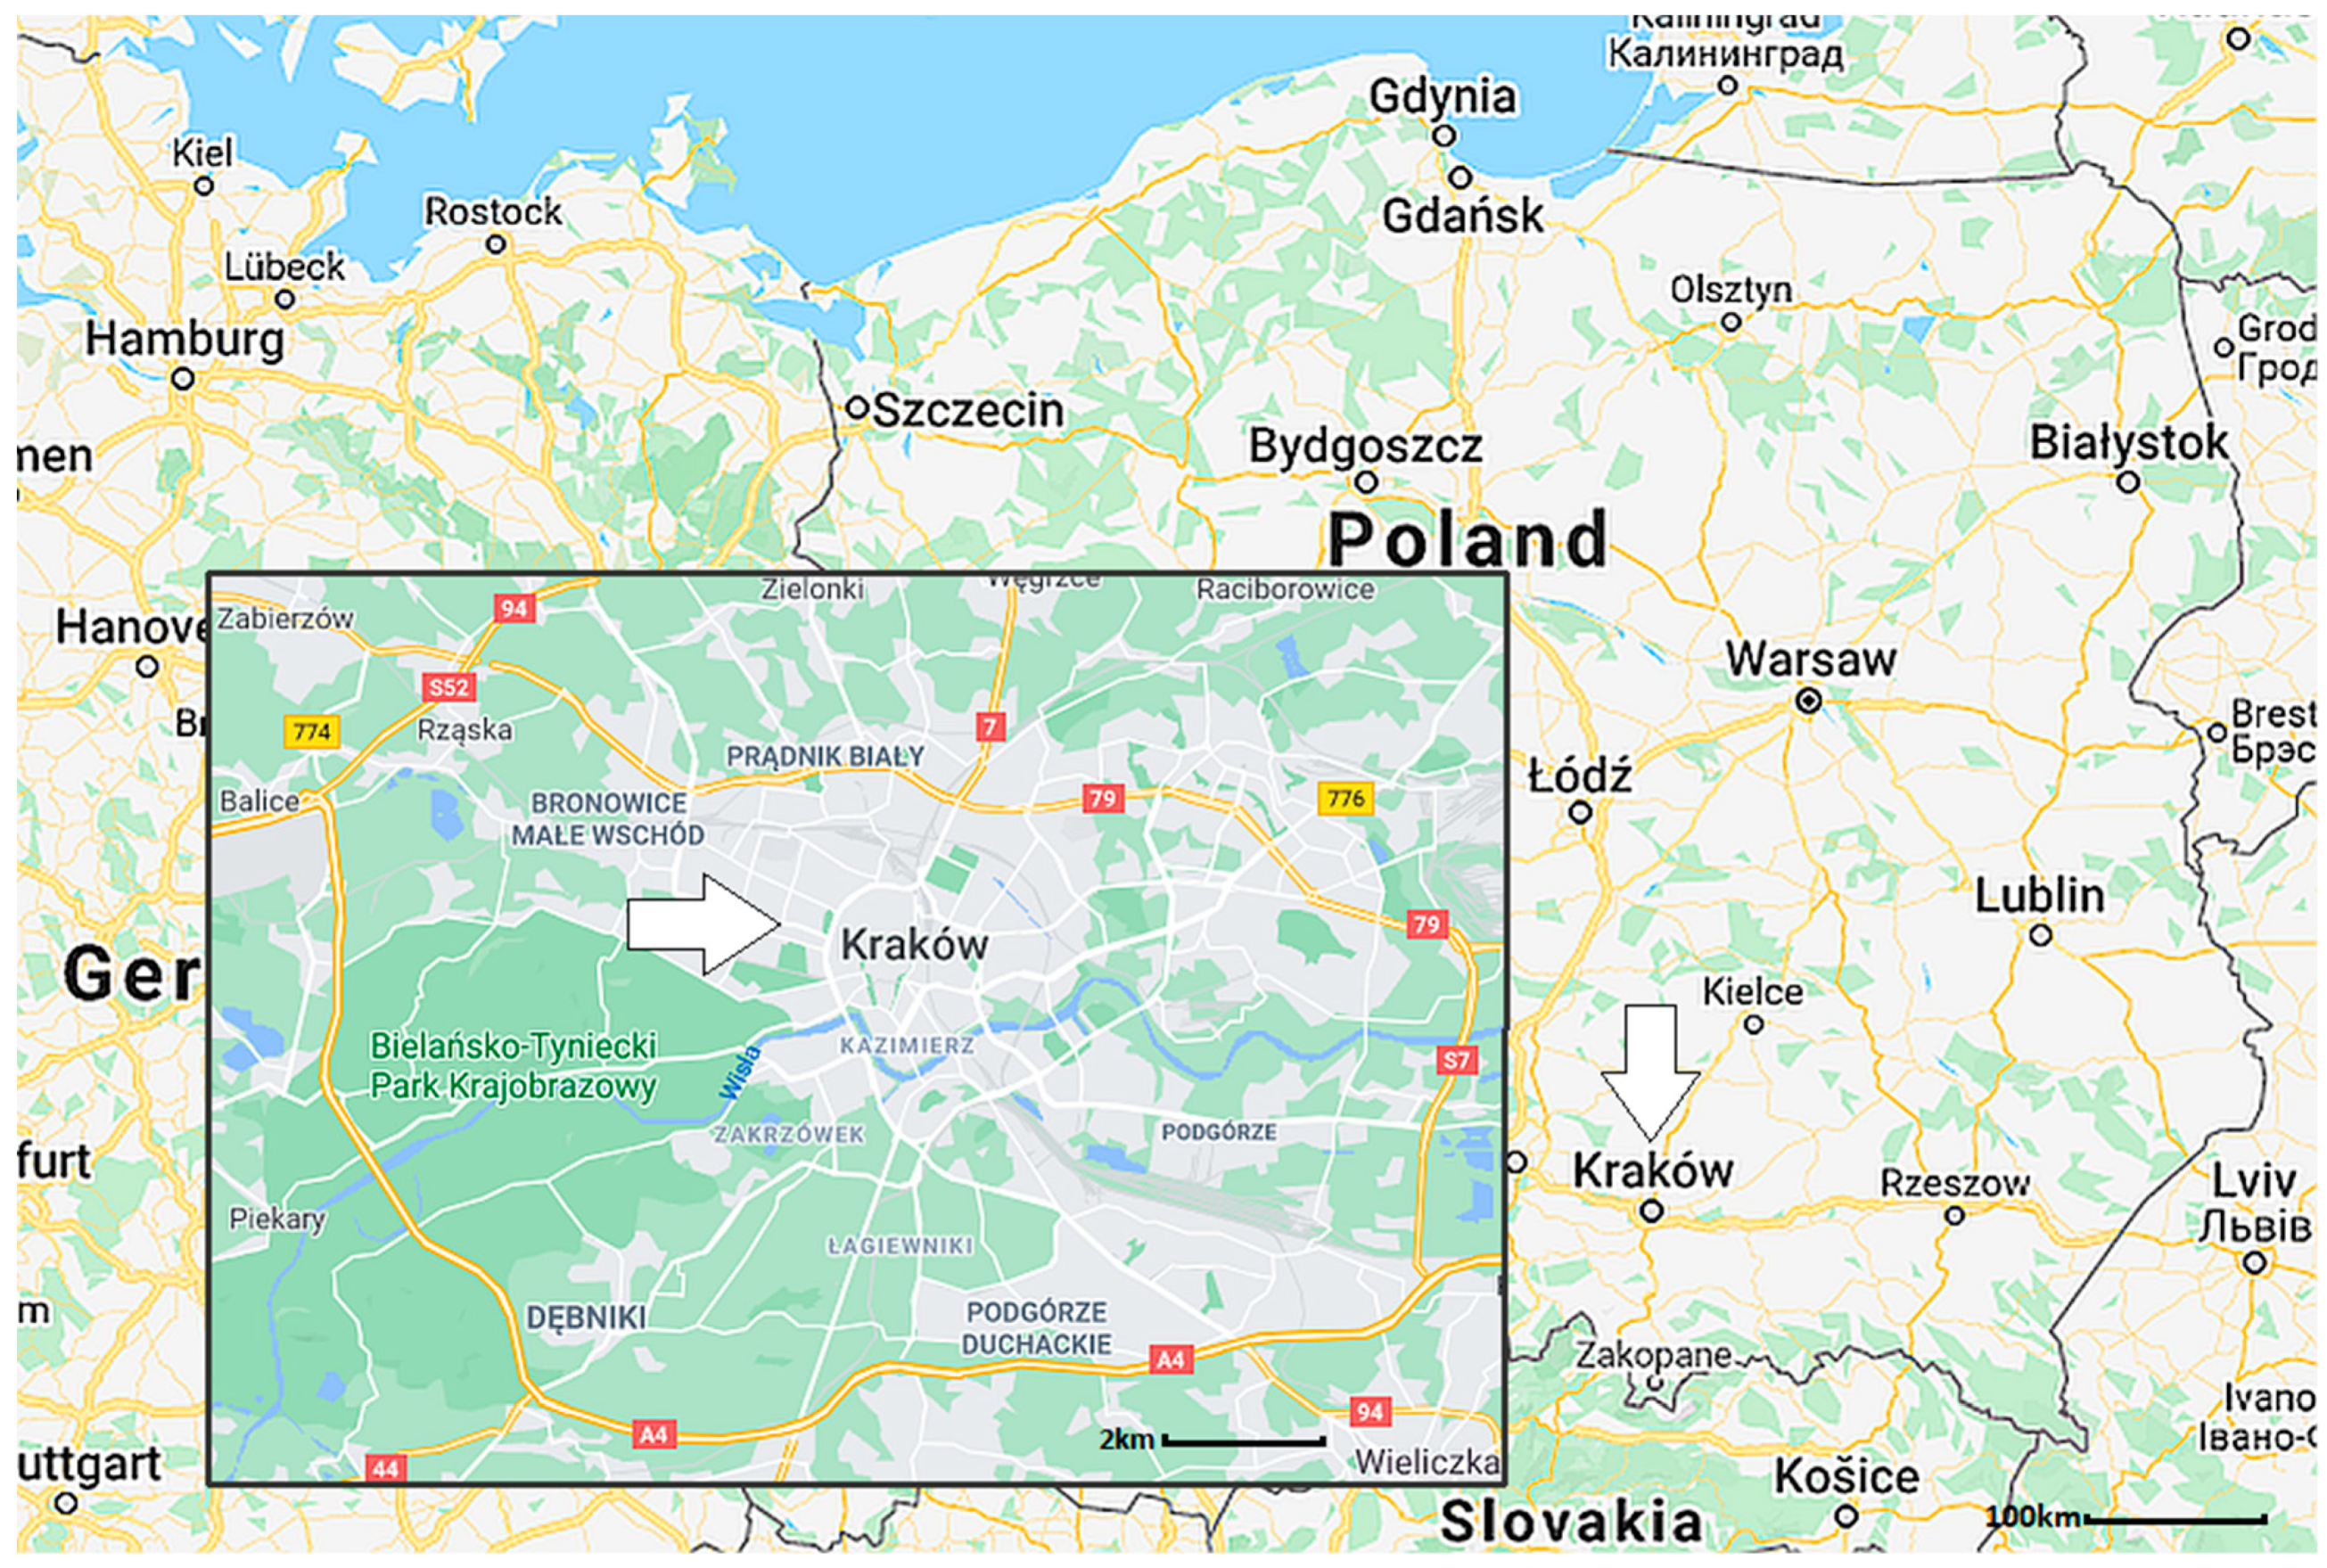
Figure 1. Sampling site.
Atmosphere 11 01085 g001
Figure 2. Correlation of the equivalent concentration of cations with the equivalent concentration of anions.
Atmosphere 11 01085 g002
Figure 3. Enrichment factors (EFs) for the analyzed elements, with Si and Ti as reference elements.
Atmosphere 11 01085 g003
Figure 4. Positive matrix factorization (PMF) factor profiles.
Atmosphere 11 01085 g004
Figure 5. The monthly contribution of sources to PM2.5 mass in µg/m3.
Atmosphere 11 01085 g005
Figure 6. The average annual contribution of sources to PM2.5 mass in %.
Atmosphere 11 01085 g006
Figure 7. Presents comparison of modelled by PMF and measured PM2.5. data.
Atmosphere 11 01085 g007
Table 1. PM2.5 (in µg/m3) elemental and ion concentrations (in ng/m3) in Krakow. (W/S is Winter/Summer).
Element/IonSummer 2018Autumn 2018Winter 2019Spring 2019AnnualW/SLLD
PM2.514.8 ± 4.128 ± 1234,8 ± 1917 ± 824 ± 132.34
Si300 ± 92<LLD249 ± 94<LLD177 ± 430.83300
P103 ± 2957 ± 24120 ± 28<LLD39 ± 251.1648
S1122 ± 3401303 ± 5801344 ± 660836 ± 3401160 ± 5001.2060
Cl102 ± 66669 ± 5401393 ± 710358 ± 300630 ± 59013.721
K130 ± 48282 ± 120318 ± 180139 ± 68230 ± 1402.4615
Ca56 ± 25150 ± 6447 ± 1730 ± 1750 ± 300.858.6
Ti7.0 ± 0.811 ± 720 ± 117.3 ± 3.67.1 ± 3.62.866.4
V6.95 ± 2.80<LLD10.1 ± 4.9<LLD4.3 ± 2.61.455.4
Cr7.51 ± 4.404.21 ± 1.5010.20 ± 4.30<LLD5.1 ± 3.71.364.3
Mn7.65 ± 3.2013.14 ± 8.0010.74 ± 4.504.81 ± 2.209.0 ± 6.01.401.2
Fe154 ± 75270 ± 21094 ± 5260 ± 37150 ± 1200.612.2
Co1.70 ± 0.492.6 ± 1.13.5 ± 1.80.94 ± 0.462.4 ± 1.42.051.0
Ni4.71 ± 2.502.18 ± 0.4033 ± 40<LLD5.9 ± 8.07.071.0
Cu9.8 ± 7.510.4 ± 6.17.4 ± 4.21.9 ± 1.05.9 ± 5.00.761.0
Zn54 ± 32136 ± 10070 ± 3631 ± 2075 ± 561.301.0
Br4.31 ± 1.307.64 ± 3.6012.6 ± 4.704.8 ± 2.307.5 ± 4.12.920.8
Rb1.11 ± 0.500.71 ± 0.252.6 ± 2.80.7 ± 0.21.2±1.02.330.8
Sr1.15 ± 0.461.18 ± 0.862.07 ± 2.50.82 ± 0.761.0 ± 1.01.790.8
Pb14.1 ± 4.221.9 ± 12.022.9 ± 9.3<LLD12.5 ± 9.81.620.8
NO3670 ± 2802450 ± 18003320 ± 20002330 ± 14002240 ± 17004.9640
SO42−3050 ± 12003330 ± 15003020 ± 17002500 ± 11002990 ± 14000.9920
Cl230 ± 130680 ± 3601440 ± 7801290 ± 900920 ± 7106.3090
NH4+960 ± 3001640 ± 8101890 ± 8001220 ± 5001450 ± 7001.9770
Na+290 ± 140390 ± 170410 ± 140360 ± 130370 ± 1401.4090
LLD Low Detection Limit; 2018-12-19 High Ni conc. 343 ng/m3.
Table 2. Comparative results of the source contributions to PM2.5.
Source2014/2015 Krakow [19]2016/2017 Krakow [18]2018/2019 Krakow
Present Study
%µg/m3%µg/m3%µg/m3
PM2.5-34.4-33.5-24
Coal Combustion22.97.8830.510.21439.3
Biomass Burning15.65.37
Secondary Sulphate17.15.8838.612.93245.2
Secondary Nitrate19.36.63
Industry/Soil2.50.8625.88.64287.2
Traffic8.32.86