Article

Influence of Disc Temperature on Ultrafine, Fine, and Coarse Particle Emissions of Passenger Car Disc Brakes with Organic and Inorganic Pad Binder Materials

1
Institute of Automotive Engineering (FZD), Technical University of Darmstadt, 64287 Darmstadt, Germany
2
Institute of Energy and Environmental Technology (IUTA e.V.), 47229 Duisburg, Germany
3
Daimler AG, Research and Development, 71059 Sindelfingen, Germany
4
LF GmbH & Co. KG, 51377 Leverkusen, Germany
*
Author to whom correspondence should be addressed.
Atmosphere 2020, 11(10), 1060; https://doi.org/10.3390/atmos11101060
Submission received: 14 September 2020 / Revised: 28 September 2020 / Accepted: 29 September 2020 / Published: 5 October 2020
(This article belongs to the Special Issue Advancements in the Reduction of Submicron Particle Concentrations)

Abstract

:
Passenger car disc brakes are a source of ultrafine, fine, and coarse particles. It is estimated that 21% of total traffic-related PM10 emissions in urban environments originate from airborne brake wear particles. Particle number emission factors are in the magnitude of 1010 km−1 wheel brake during real-world driving conditions. Due to the complexity of the tribological processes and the limited observability of the friction zone between brake disc and pad, the phenomena causing particle emission of disc brakes are only partially understood. To generate a basis for understanding the emission process and, based on this, to clarify which influencing variables have how much potential for reduction measures, one approach consists in the identification and quantification of influencing variables in the form of emission maps. The subject of this publication is the influence of disc brake temperature on ultrafine, fine, and coarse particle emissions, which was investigated with a systematic variation of temperature during single brake events on an enclosed brake dynamometer. The systematic variation of temperature was achieved by increasing or decreasing the disc temperature stepwise which leads to a triangular temperature variation. Two types of brake pads were used with the main distinction in its chemical composition being organic and inorganic binder materials. The critical disc brake temperature for the generation of ultrafine particles based on nucleation is at approximately 180 °C for pads with an organic binder and at approximately 240 °C for pads with inorganic binder materials. Number concentration during those nucleation events decreased for successive events, probably due to aging effects. PM10 emissions increased by factor 2 due to an increase in temperature from 80 °C to 160 °C. The influence of temperature could be only repeatable measured for disc brake temperatures below 180 °C. Above this temperature, the emission behavior was dependent on the temperature history, which indicates also a critical temperature for PM10 relevant emissions but not in an increasing rather than a decreasing manner.

1. Introduction

Disc brakes emit ultrafine, fine, and coarse particles into the ambient air. According to estimations, 21% of total traffic-related PM10 emissions in urban environments originate from airborne brake wear particles [1] and particle number emission factors are in the magnitude of 1010 km−1 wheel brake−1 during real-world driving conditions [2]. While PM10 relevant fine and coarse particles are generated due to mechanical friction processes, ultrafine particles in the magnitude of 10 nm are generated by nucleation [3,4]. Nucleation occurs during braking events above a critical temperature, probably when organic materials start decomposition and gases evaporate from the brake pad, condensate in the cooling airflow, and agglomerate to nanometer-sized particles. A typical time series of a nucleation event is shown in Figure 1. Nucleation caused by braking events above a critical temperature is a well-known phenomenon and was described by several authors on pin-on-disc tribometers as well as on full-scale brake dynamometers while temperature’s influence on PM10 emissions is only known on a tribometer or rather not independently from other variables. The current state of research regarding the temperature’s influence on PM10 and particle number emissions is summarized below.
Ramousse et al. [5] performed a differential thermal analysis of brake pad materials in combination with a mass spectrometer analysis. Their investigation revealed that decomposition of the pad’s binder starts at 250 °C, coal decomposes in two stages between 300 and 700 °C, iron between 500 and 800 °C and graphite between 600 and 800 °C.
Nosko et al. performed measurements on a pin-on-disc tribometer with sliding speeds of up to 2.6 m/s [6,7,8]. The temperature was varied by slowly increasing sliding speed. He found a critical temperature for ultrafine particle generation of approximately 170 °C. Coarse and fine particle emissions between electrical mobility diameters or optical diameters of 100 nm and 10 µm increased and were described with emission coefficients normalized on the friction energy.
Alemani et al.’s [9] investigations on a pin-on-disc test rig showed a strong temperature influence on the steady-state number concentration, which exceeds the sensitivities of surface pressure, friction velocity, and friction power. His measurements also showed a sudden increase of 4 orders for the number concentration in the range of 170–190 °C, which is in accordance with the investigations of other researchers. He assumes a decomposition process of phenolic binders in the friction lining as a possible cause for this increase.
Experiments on a pin-on-disc test rig by Pericone et al. [10] match with the observations described above where an increase in the number concentration of ultrafine particles by 4 to 6 orders of magnitude occurs when a transition temperature of 165–190 °C is exceeded.
In measurements carried out by Sachse et al. [11] on a dynamometer without enclosure, a shift of the maximum in particle’s number size distribution from 100 nm to 20 nm was found at different starting temperatures of the brake event. Sachse mentions a critical temperature of 180 °C, from which the number concentration increases by at least one order of magnitude.
Agudelo et al. [12] investigated the influence of the average initial rotor temperature on the particle number emission rate during various standardized driving cycles on an enclosed dynamometer test bench. The highest average emission rates occurred at the highest average temperatures. There is an obvious trend of high emission rates at high temperatures, but the temperature influence was not varied independently.
Kukutschová et al. [13] (p. 1005) measured nucleation events in dynamometer tests at average rotor temperatures of 300 °C, which is a significantly higher temperature than in other publications. Based on a differential thermal analysis Kukutschová found a heterogeneous ignition process of binder (300 °C), charcoal (400 °C), graphite (550 °C), and Iron (750 °C).
Investigations on an enclosed dynamometer by Mathissen and Farwick zum Hagen et al. [2,14,15,16] also found critical temperatures for the generation of nucleation particles at approximately T D i s c = 150 °C Experiments with used parts revealed that the nucleation events were not reproducible after a mileage of 6000 km [15]. During the LACT (Los Angeles City Traffic) driving cycle no correlation between PM10 and temperature was found [2].
As literature describes the decomposition of pad materials and an increase of particle number emissions and PM10 (only tribometer study) due to increasing temperatures, the following five research questions are derived from the current state of research to generate potential reduction approaches:
Ultrafine particle emission:
1.
Is it possible to prevent nucleation processes or to increase the critical temperature by replacing organic compounds in the brake pad e.g., organic binder materials?
2.
How does thermal decomposition processes of pad materials influence the reproducibility of nucleation events?
Fine and coarse particle emission (PM10):
3.
How can the influence of disc temperature on PM10 emissions be quantified on a full-scale dynamometer setup?
4.
How does thermal decomposition processes of pad materials affect the temperature dependency of PM10 emissions?
5.
How does thermal decomposition processes of pad materials influence the reproducibility of the measurement of emission maps for PM10 depending on temperature?
The investigation of those research questions is subject of this paper and the methodology used to answer these questions as well as the experimental setup is described in the next section.

2. Methodology

2.1. Experimental Setup

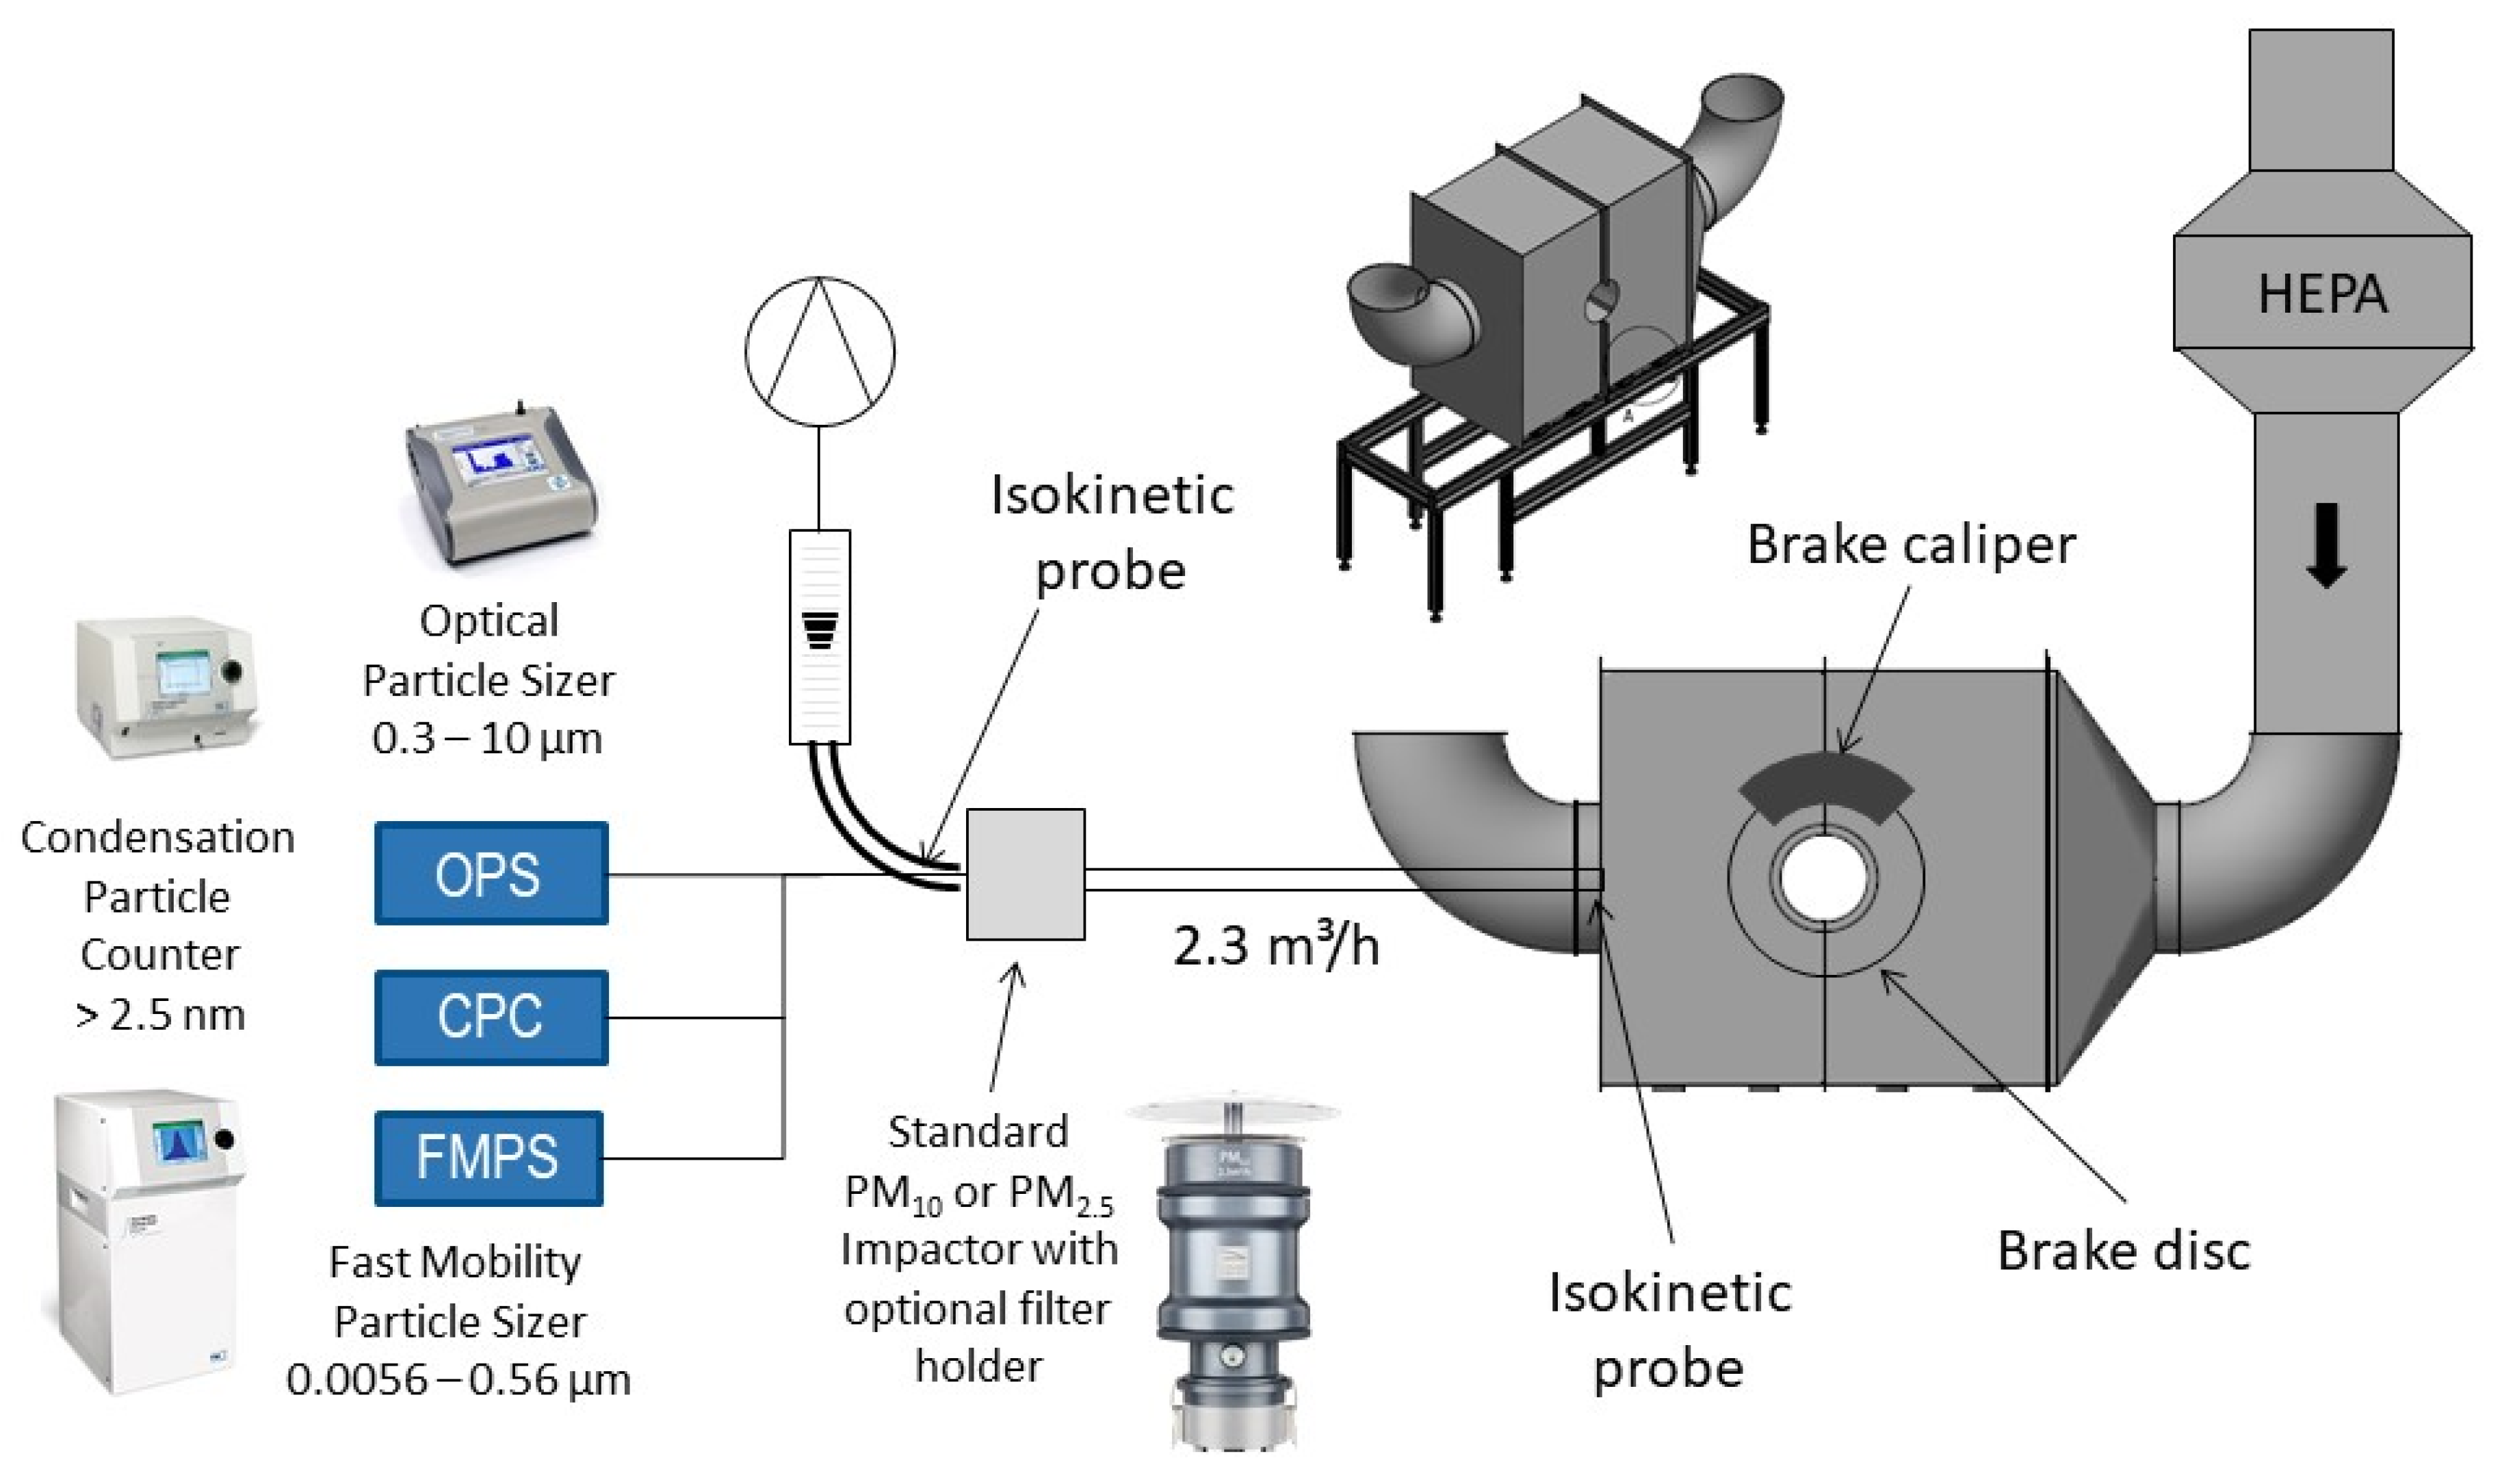
The experimental setup consists essentially of an enclosure on a brake dynamometer that surrounds the brake. HEPA (High-Efficiency Particulate Air) filtered air flows with 1625 m3/h through the enclosure and transports the emitted brake wear particles to the outlet of the enclosure. A PM10 impactor according to EN12341 ensures that only particles according to the PM10 definition, i.e., 50% of the particles with an aerodynamic diameter of 10 µm can reach the particle measurement devices. At the outlet of the enclosure, an isokinetic probe is used to representatively sample aerosol for measurement with an Optical Particle Sizer (TSI OPS 3330), a Fast Mobility Particle Sizer (TSI FMPS 3091), and a Condensation Particle Counter (TSI CPC 3776). The experimental setup was developed by the Institute of Environmental and Energy Technology (IUTA e.V.). A more detailed description can be found in previous publications [3,17] and a visualization of the setup is shown in Figure 2.
For this study, a 342 mm × 32 mm (diameter × thickness) cast-iron disc brake with a fixed caliper and two types of pads was used to compare the behavior of organic and inorganic binder materials on the critical temperature of nucleation events and PM10 emissions:
  • Serial ECE pad material (FER8104) with a conventional organic phenolic resin binder
  • Prototypical pads with an inorganic binder based on a silicate, which is thermally stable up to 800 °C
Both pads were preconditioned with three AK-Master Burnish sections as well as ten additional exhaust-WLTP test cycles.

2.2. Ultrafine Particles (Research Questions 1 & 2)

The effect of temperature on the emission behavior of ultrafine particles is investigated in one pressure-velocity operating point of the brake (p = 20 bar; v = 80 km/h) with time-controlled drag braking events (Δt = 6 s) to increase and decrease the integral disc temperature and to achieve a single triangular variation of the temperature between 75 °C and 250 °C. To decrease statistical variances and to estimate the influence of adaption or thermal aging processes, five drag brake events per temperature step are performed. Integral disc temperature measurement is performed with a thermocouple installed in the inner friction ring at a radially centered position approximately 0.5 mm below the friction surface.

2.3. Fine and Coarse Particles (PM10) (Research Questions 3, 4, & 5)

The investigation of temperature’s influence on PM10 emissions is divided into two parts. As a first step, the emission behavior in the whole temperature range (below and above the critical temperature) will be covered to identify potential changes in the PM10 emission rate above the critical temperature. The design of the experiment is identical to the temperature triangles described in Section 2.2.
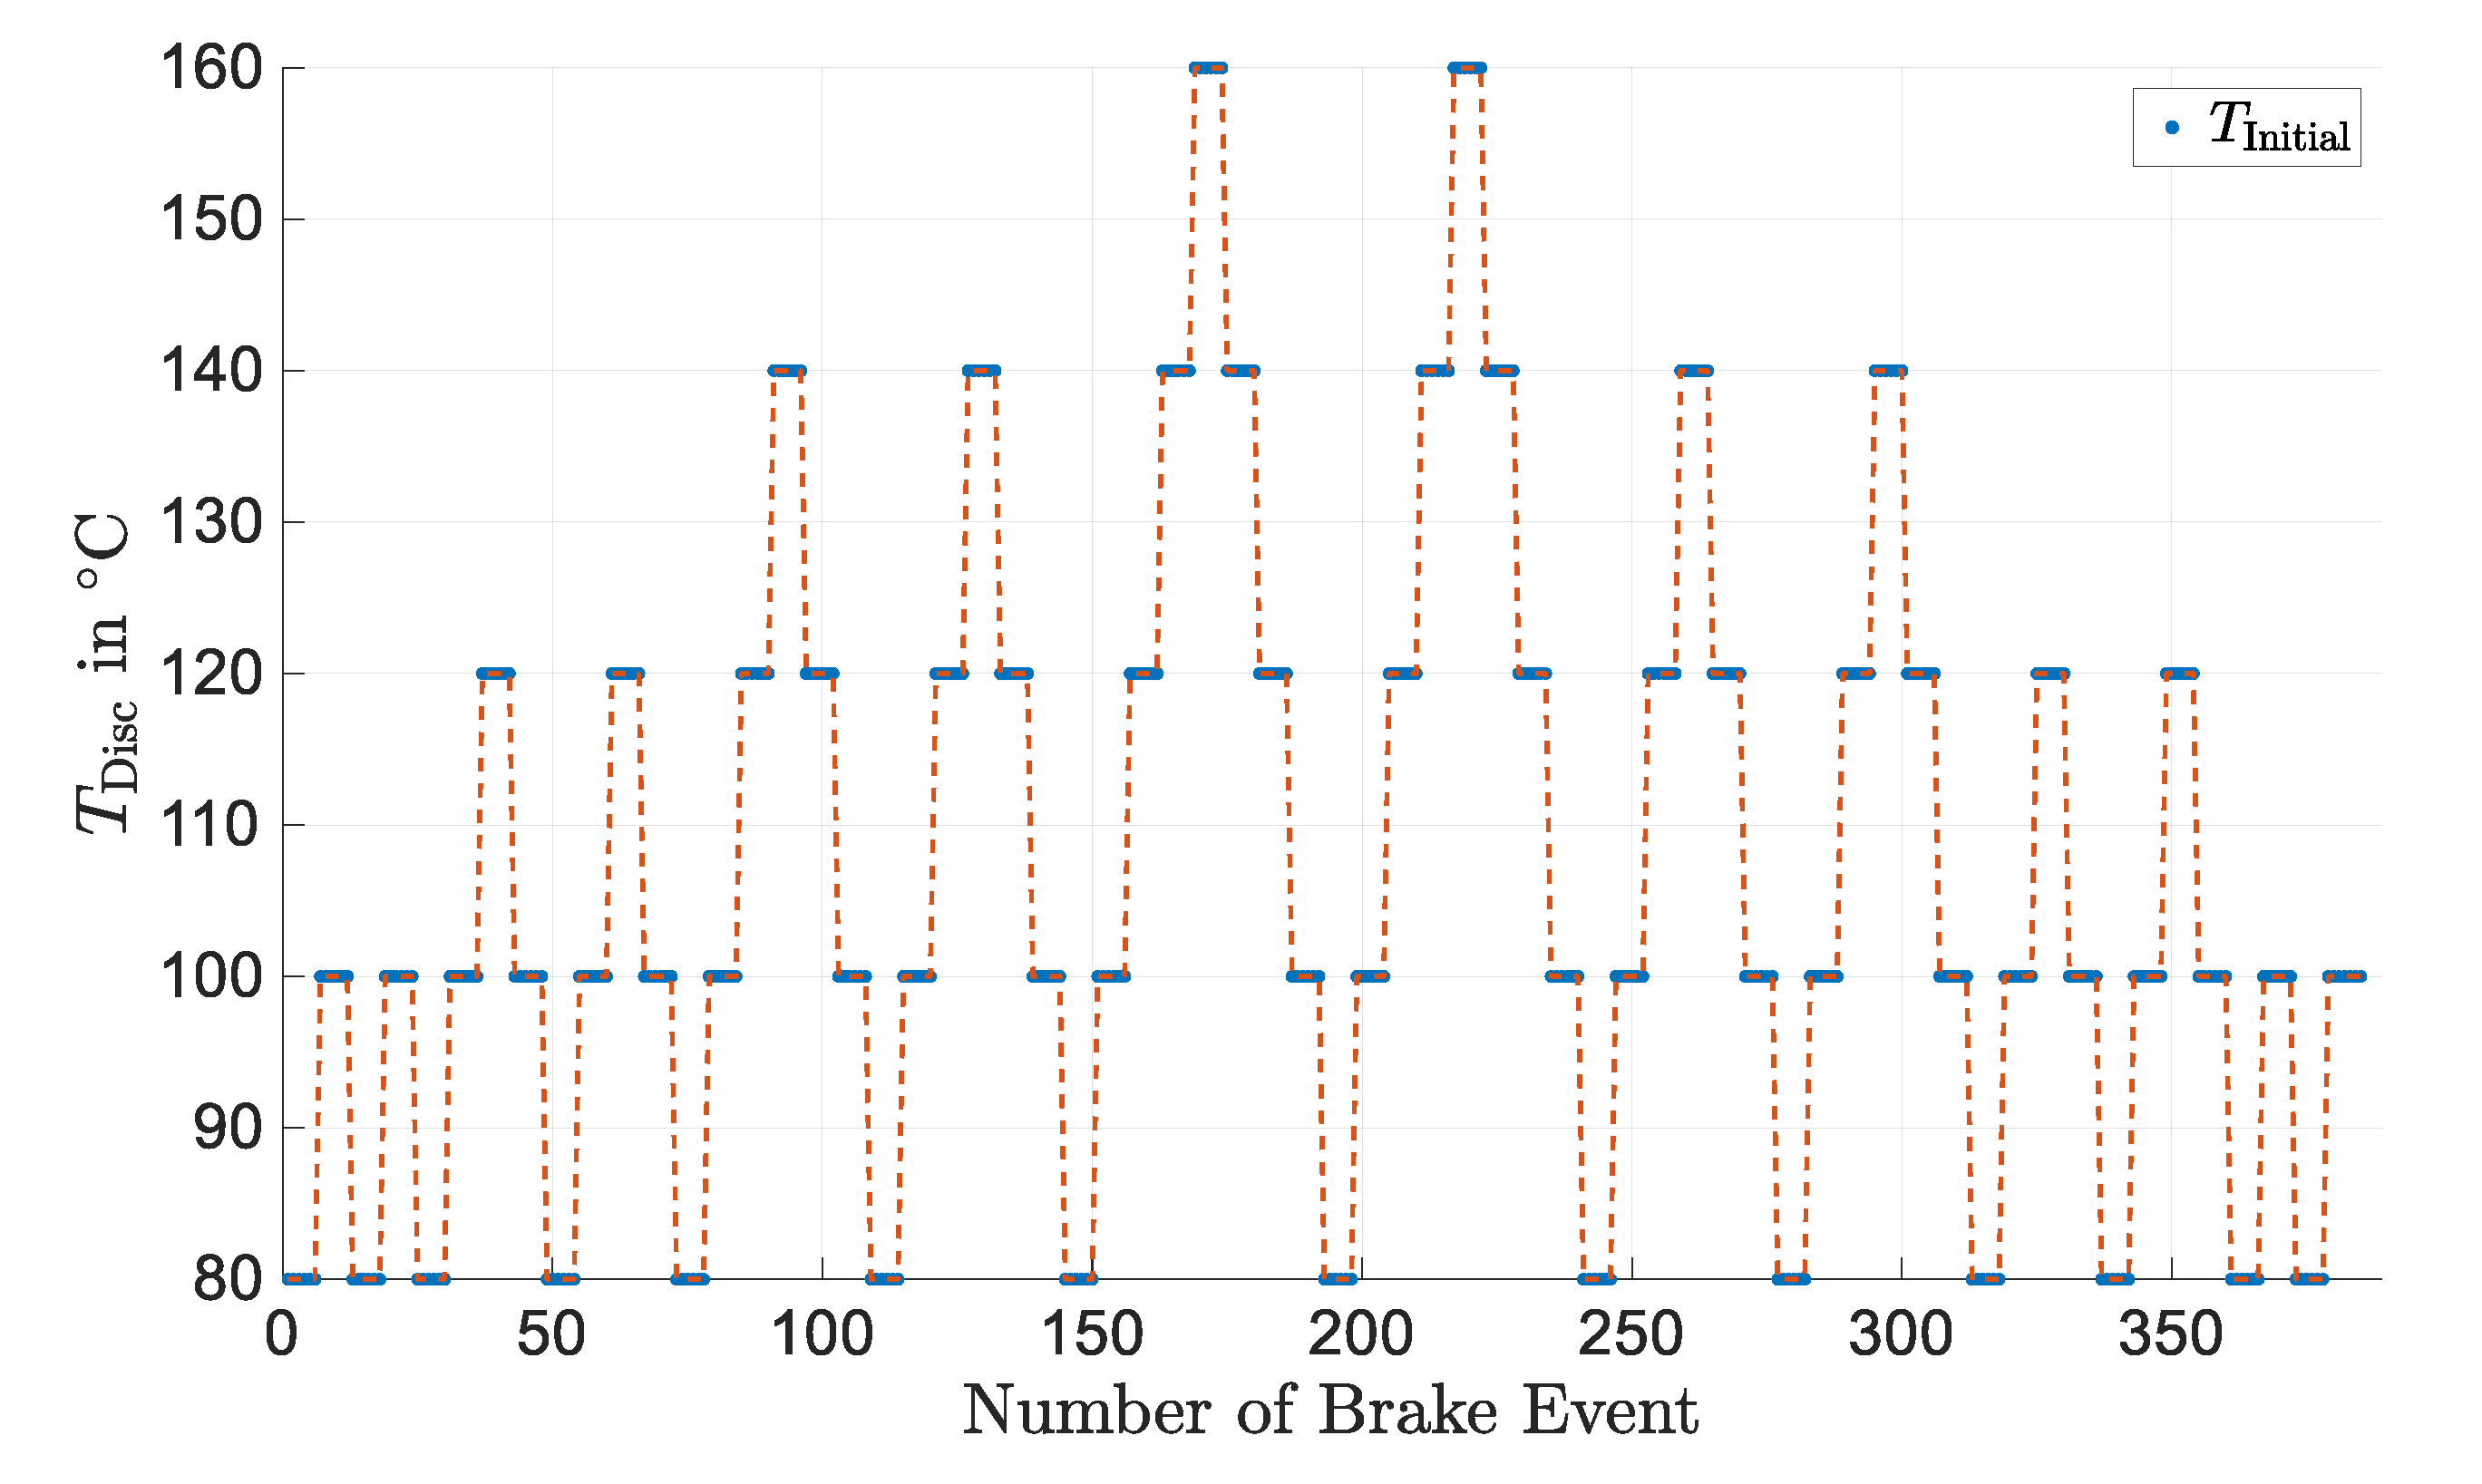
As a second step, the PM10 emission rate below the transition temperature is investigated with a similar but advanced triangular test signal with multiple triangles. In this case, the design of the experiment consists not only of a single temperature triangle but of 7 triangle pairs with a changing number of temperature steps according to Figure 3. The purpose of this test signal is the investigation of reproducibility below the critical temperature. Possible interactions between temperature, brake pressure, and velocity are investigated because four different torque-velocity operating points with the same friction power are used for this test (see Table 1). The torque-velocity-operating-points are tested pairwise in the combination of 1&4 and 2&3 during one triangle test in that manner that 3 repetitions of each operating point are performed in a row at one temperature step. Consequently, one temperature step consists of 2 · 3 = 6 drag braking events, which are also time controlled but with a shorter brake duration of t = 4 s.

3. Results

3.1. Ultrafine Particles

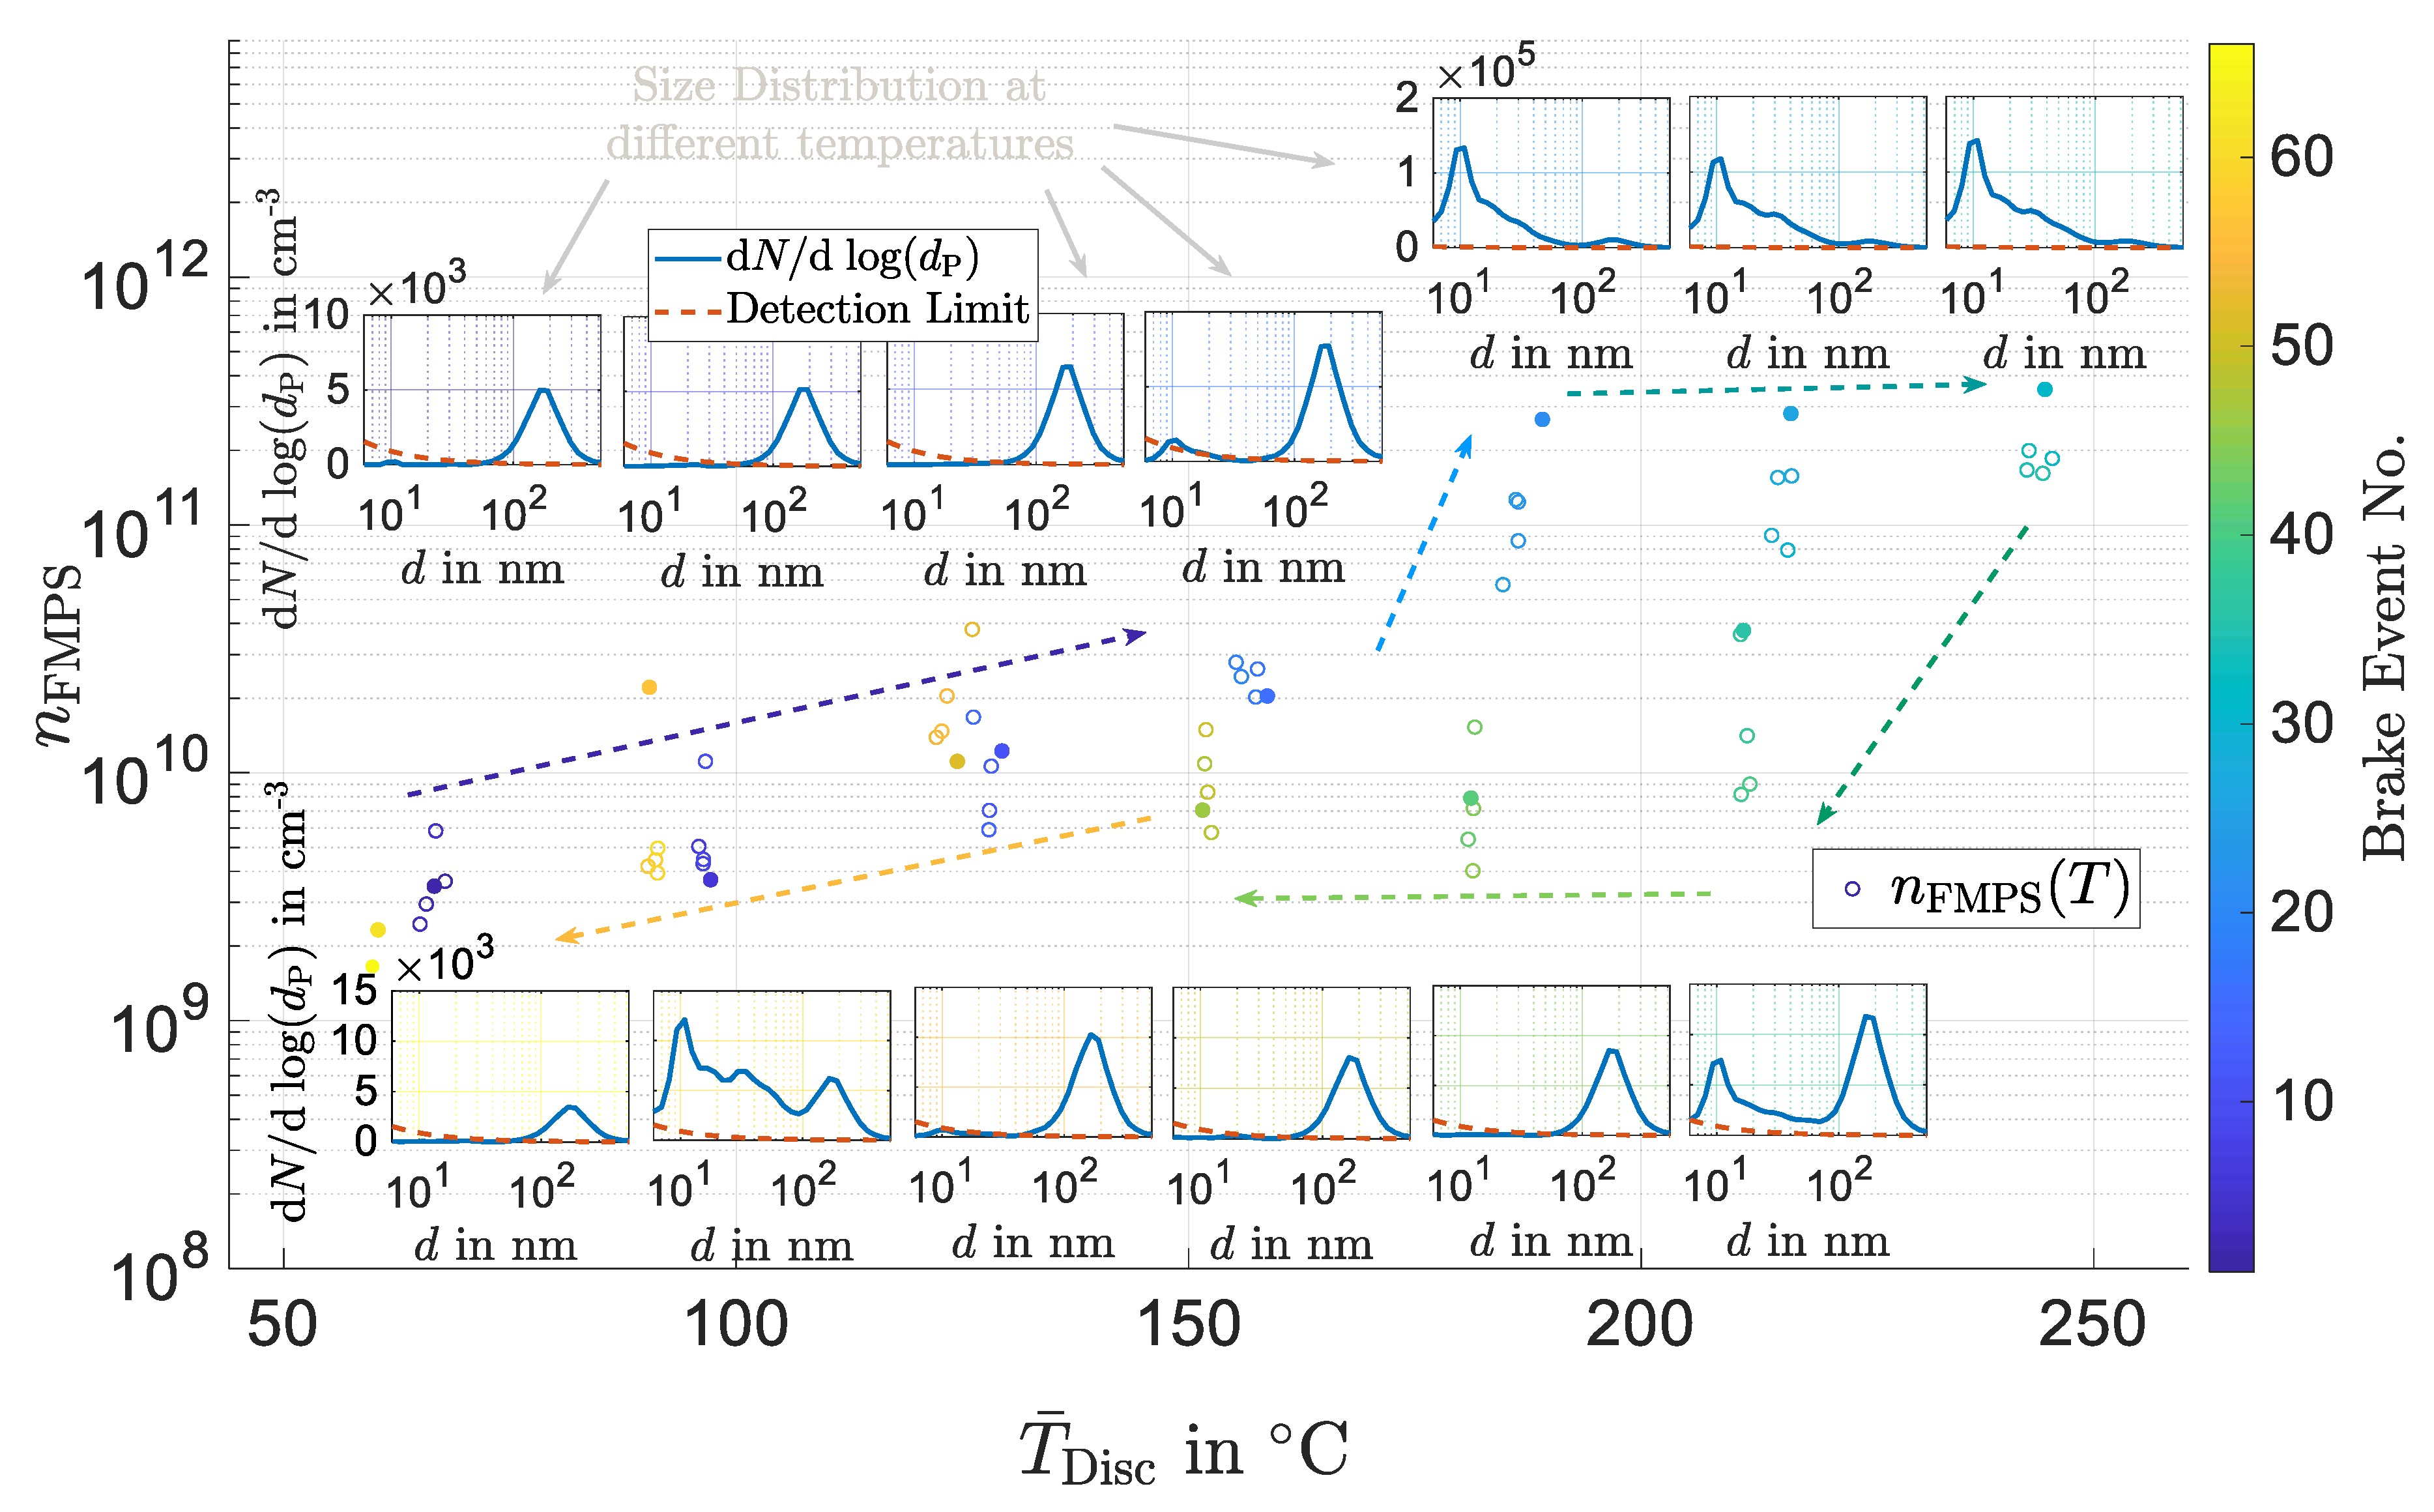
The temperature-dependent particle number emission detected by the FMPS is plotted in Figure 4 for the brake pads with an organic binder material. An explanation of the method for the calculation of the total number of particles per brake event can be found in Appendix A (Figure A1). For all five brake events of each temperature step the total number of emitted particles per brake event is marked as circles. The total number of particles of the first brake event per step is marked as a closed circle while the following four events are marked as open circles. Brake events of the triangle’s ascending side are highlighted blue, events near the apex are highlighted green, and events on the descending side yellow according to the color bar on the right side of the diagram, which indicates the chronological order of the braking events during the experiment. Additionally, the chronological order is visualized by colored arrows. For the first brake event of each temperature step the electrical mobility diameter’s size distribution is plotted above (for the ascending triangle side) or below (descending triangle side) the particle number data points. Those data points are assigned to the size distribution plots by identical point/grid-color and by identical horizontal position.
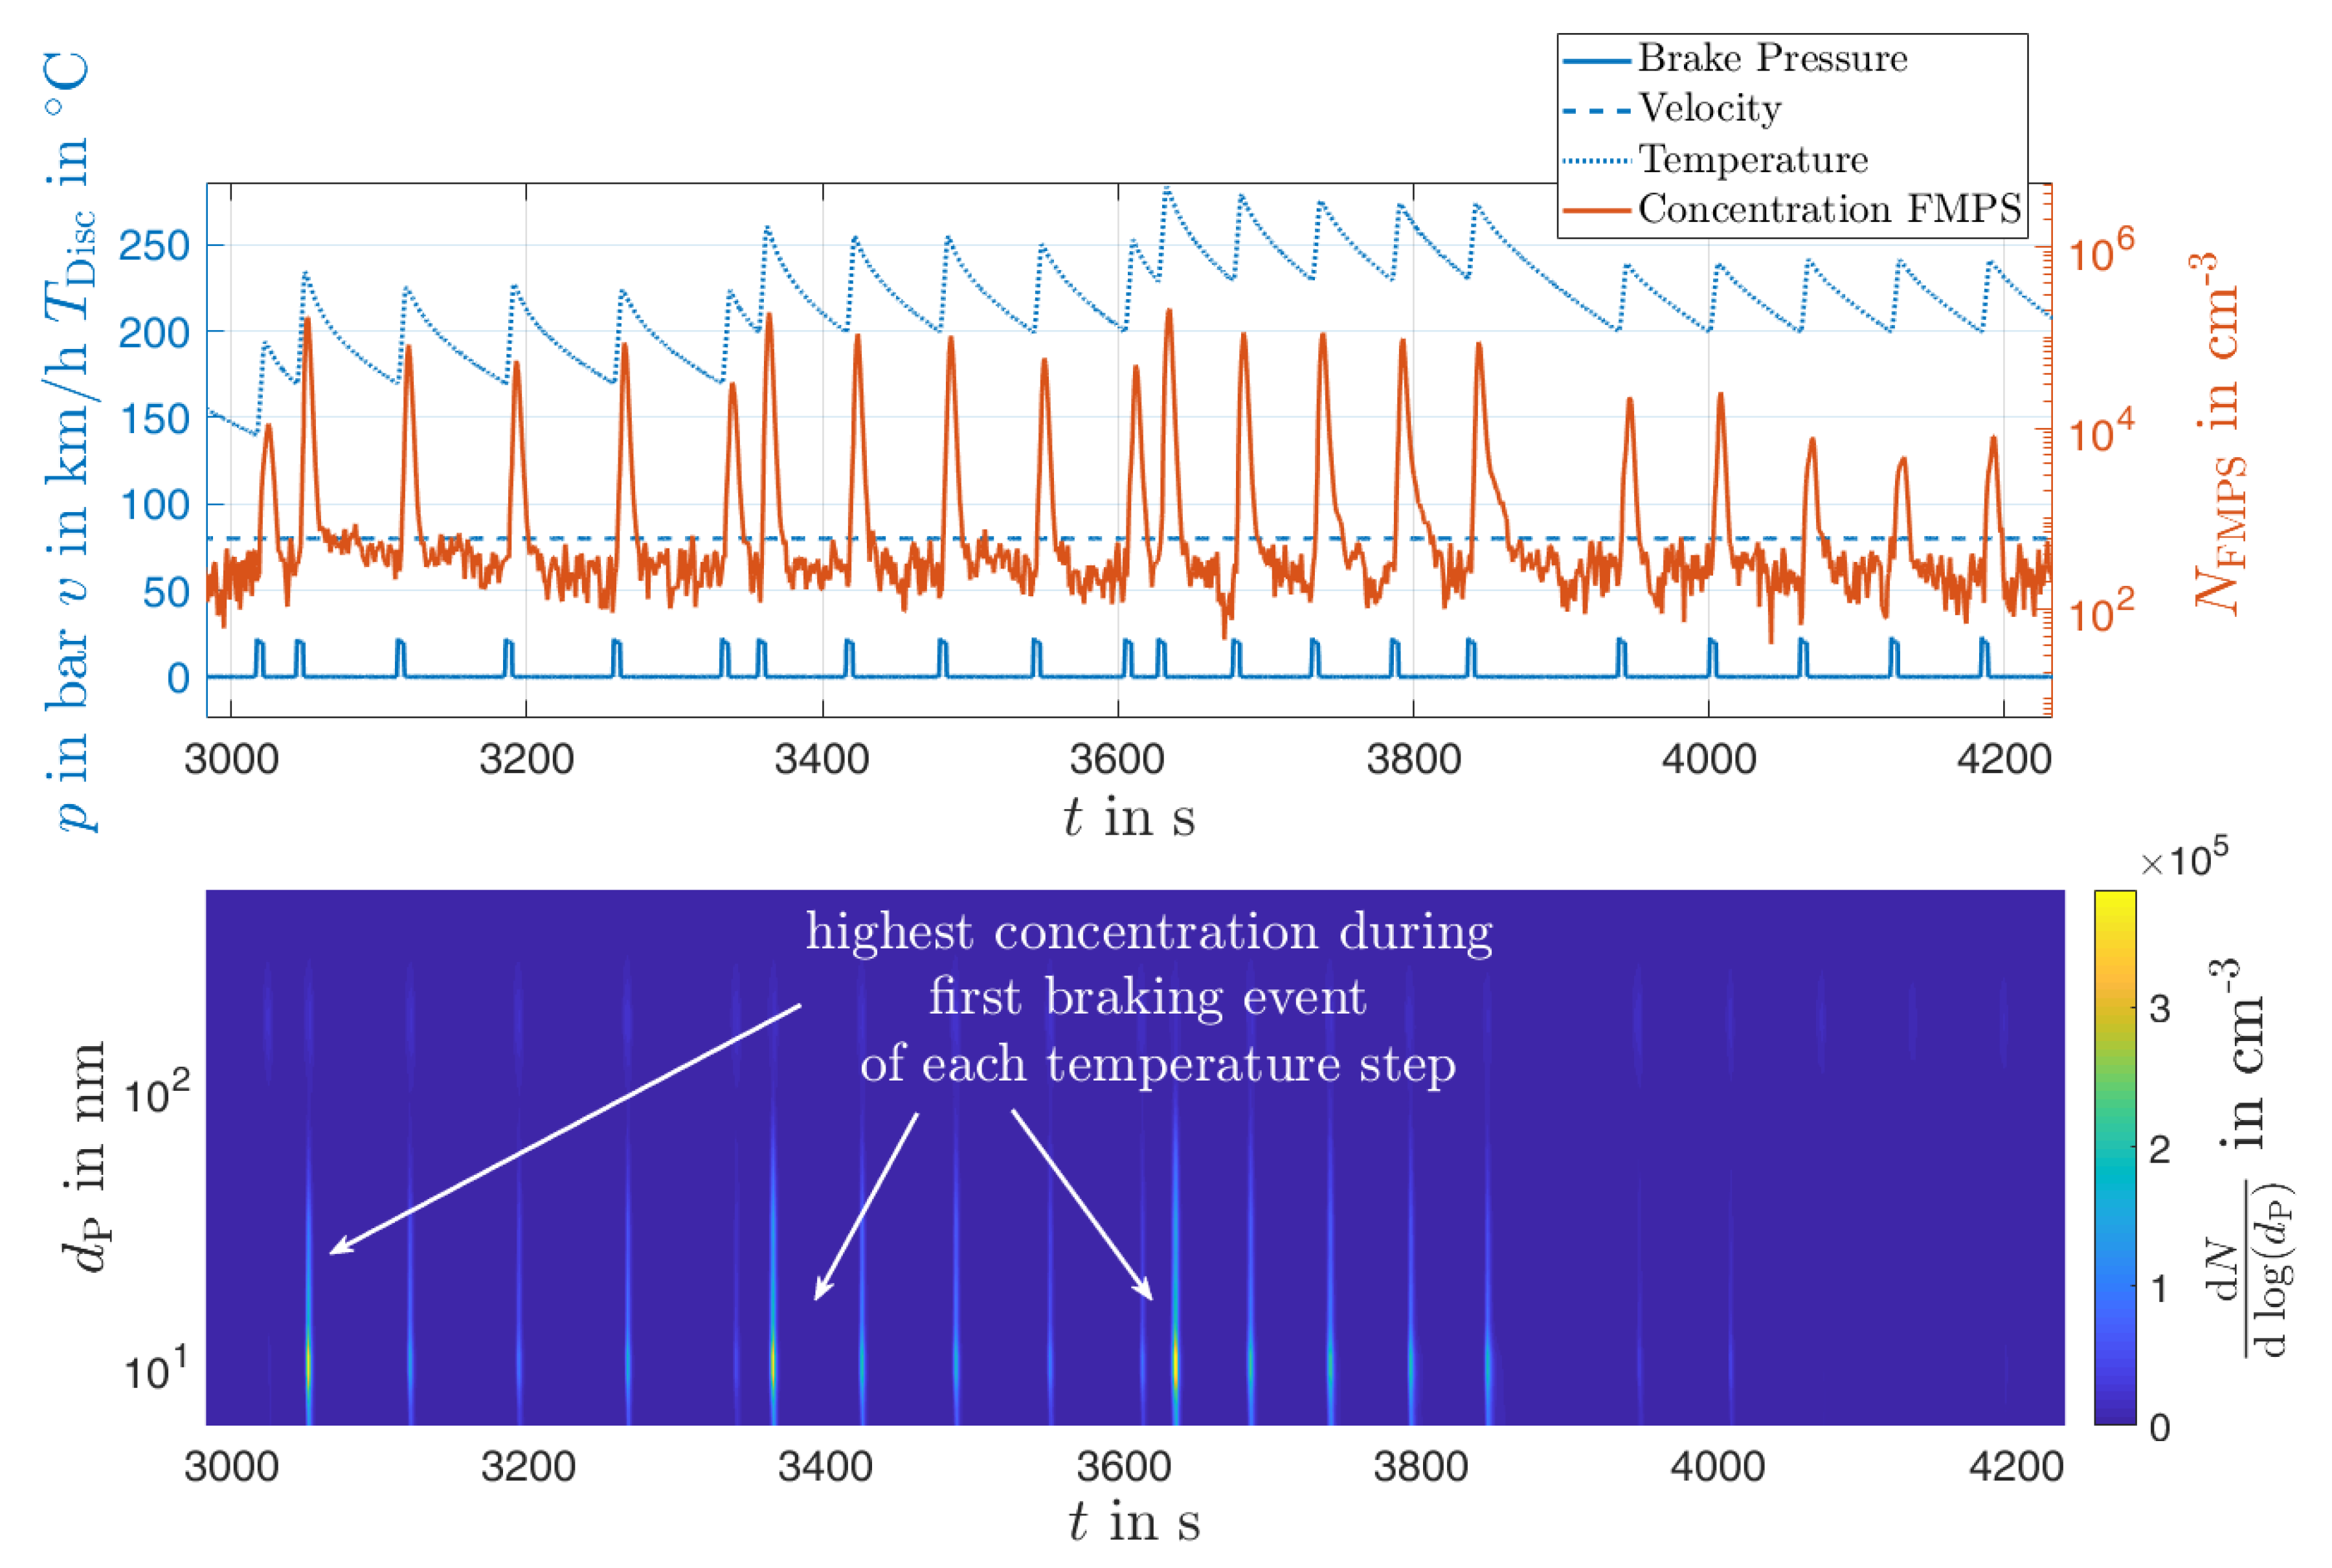
Below the critical temperature, a continuous increase (from 10 10 to 10 11 ) of mechanically generated particles with a peak at 200 nm can be seen (dark blue arrow). As expected from literature and previous studies a shift in size distribution’s maximum from 200 nm towards 10 nm particles as well as a stepwise increase in particle number emission occurs at 180 °C (light blue arrow). Above 180 °C, the total number per brake event does not show a significant change and keeps constant at approximately 10 12 particles per brake event. For each three temperature steps above the critical temperature the first brake event is associated with the highest number of particles (see Figure 4) and the highest concentrations (see Figure 5) compared to the following four events at that temperature level. The temperature levels above the critical temperature on the triangle’s descending sideshow a significantly lower number of particle emissions than the previous levels on the ascending side. Nucleation only occurs one more time during the first brake event of the descending side and in a smaller concentration and remarkably at 100 °C on the descending side of the triangle but in ten times lower concentration than on the ascending triangle side.
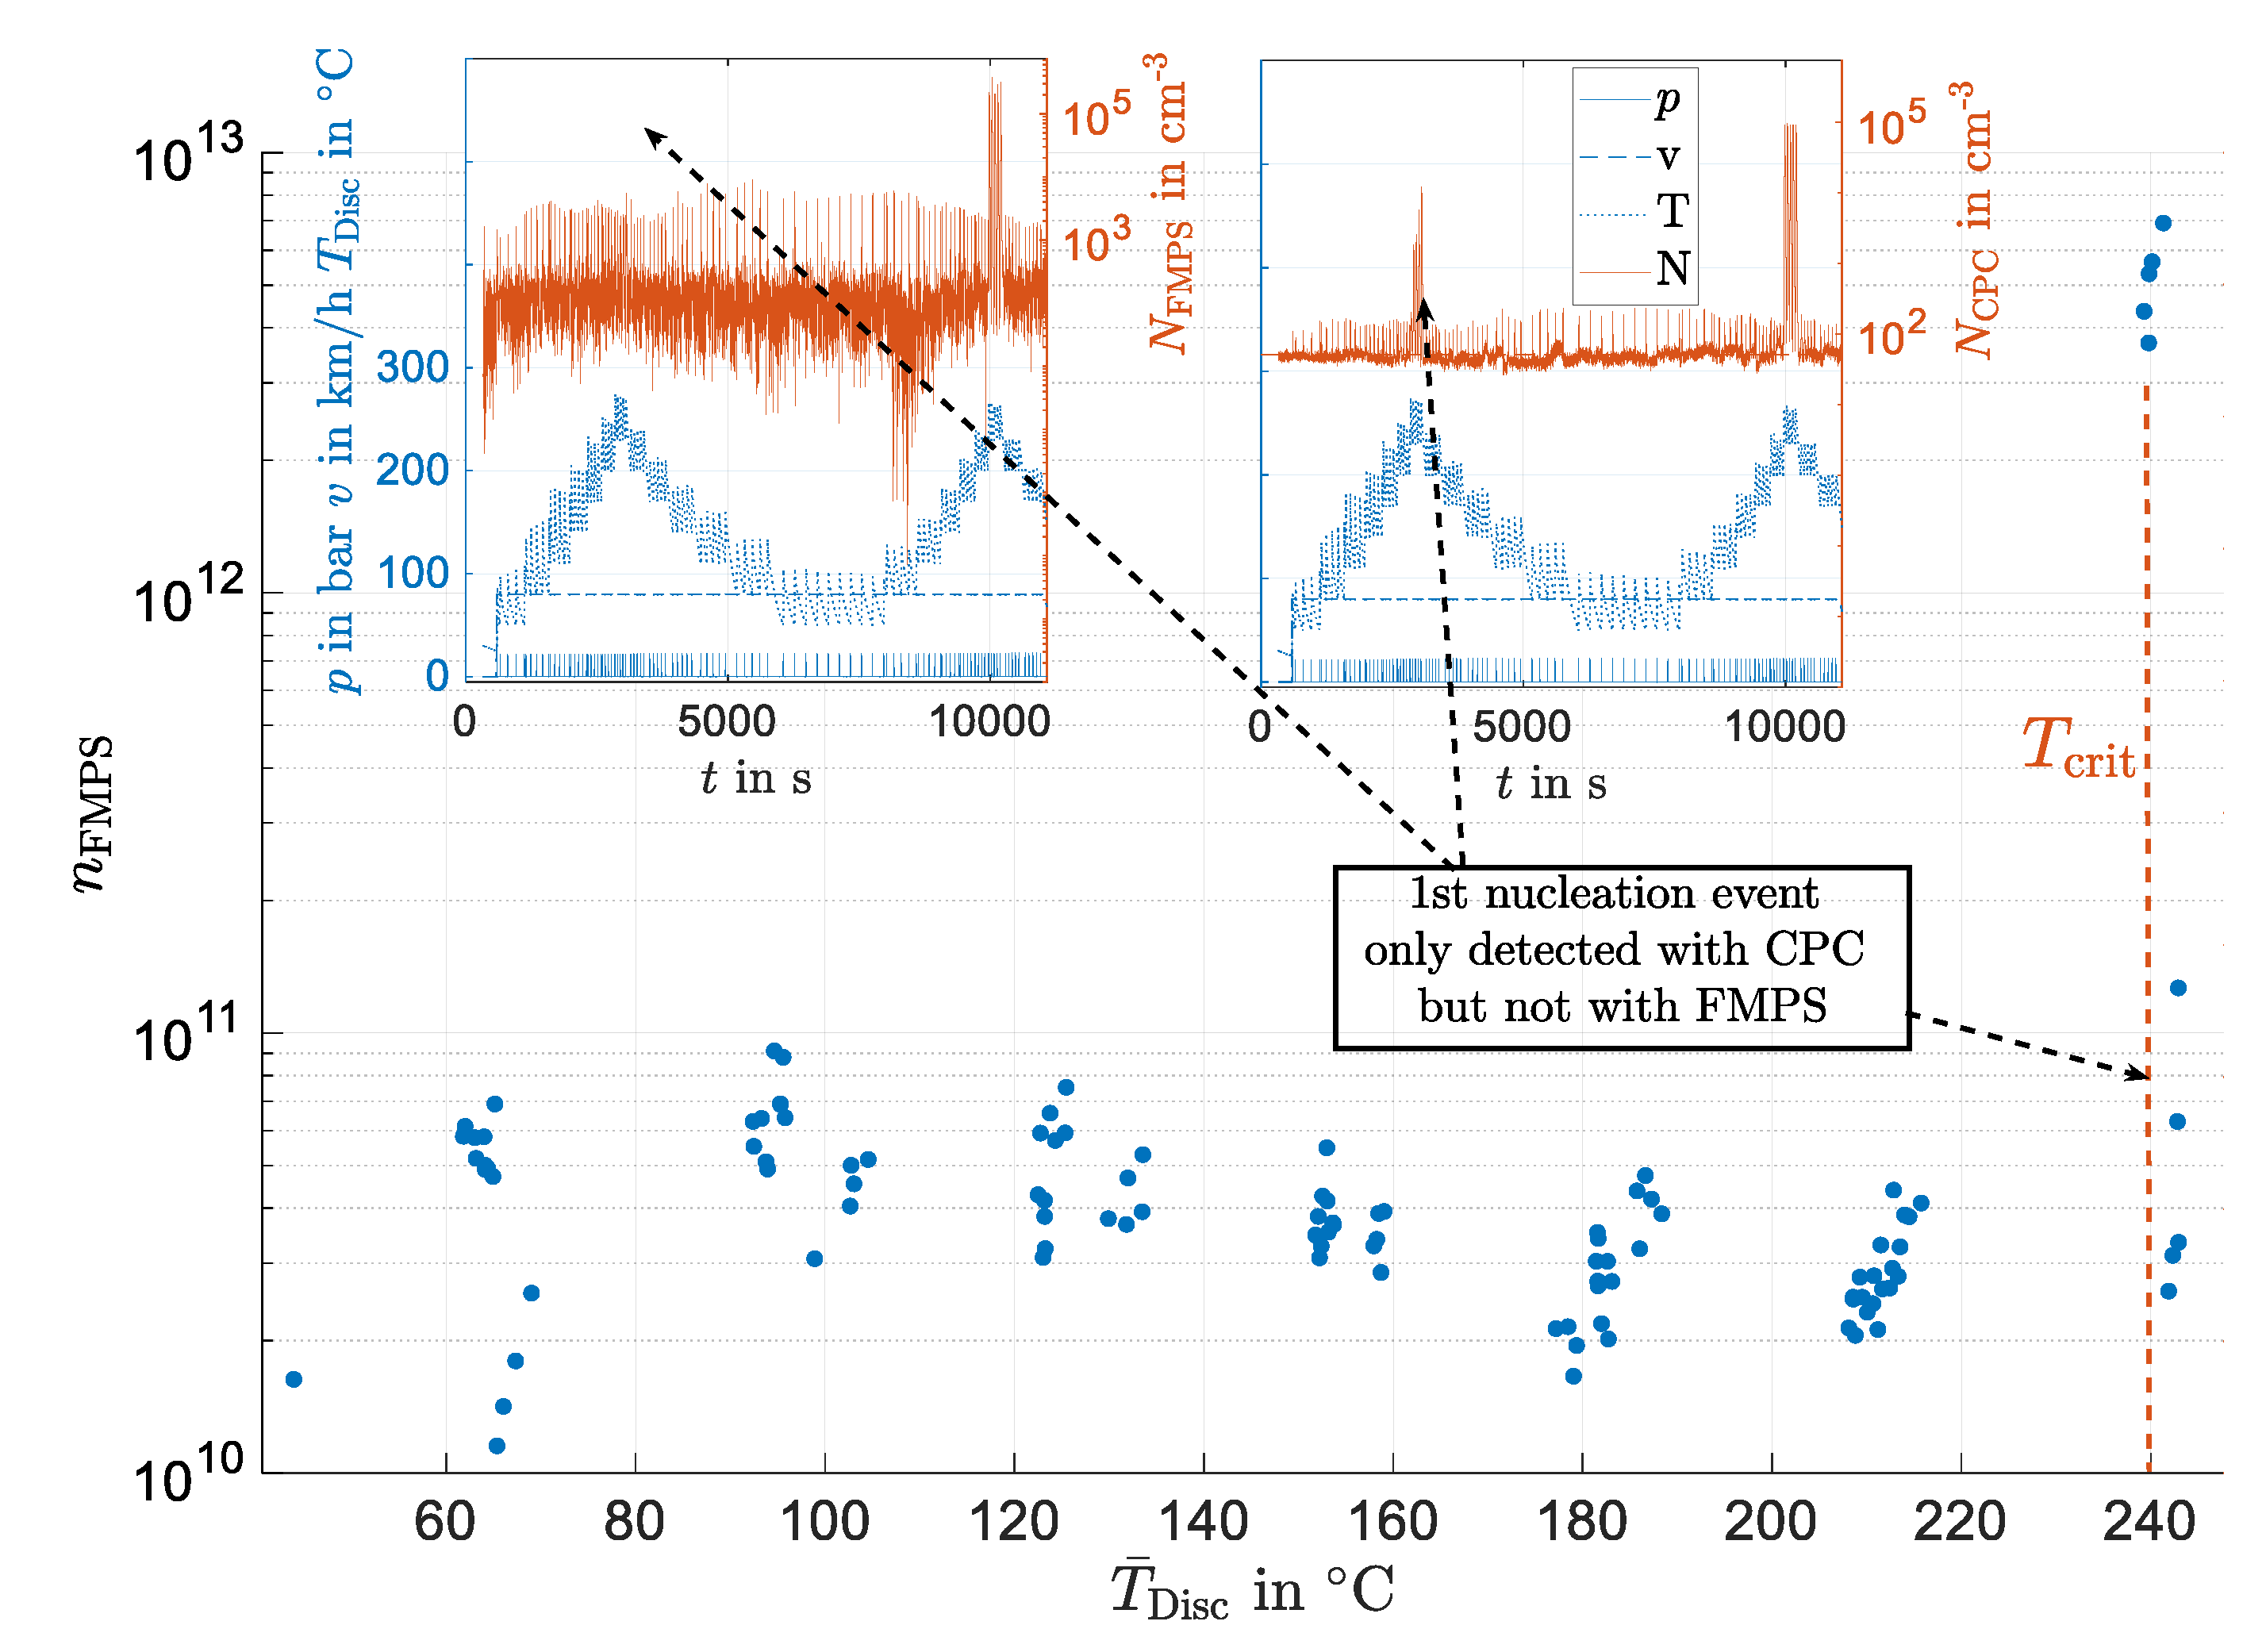
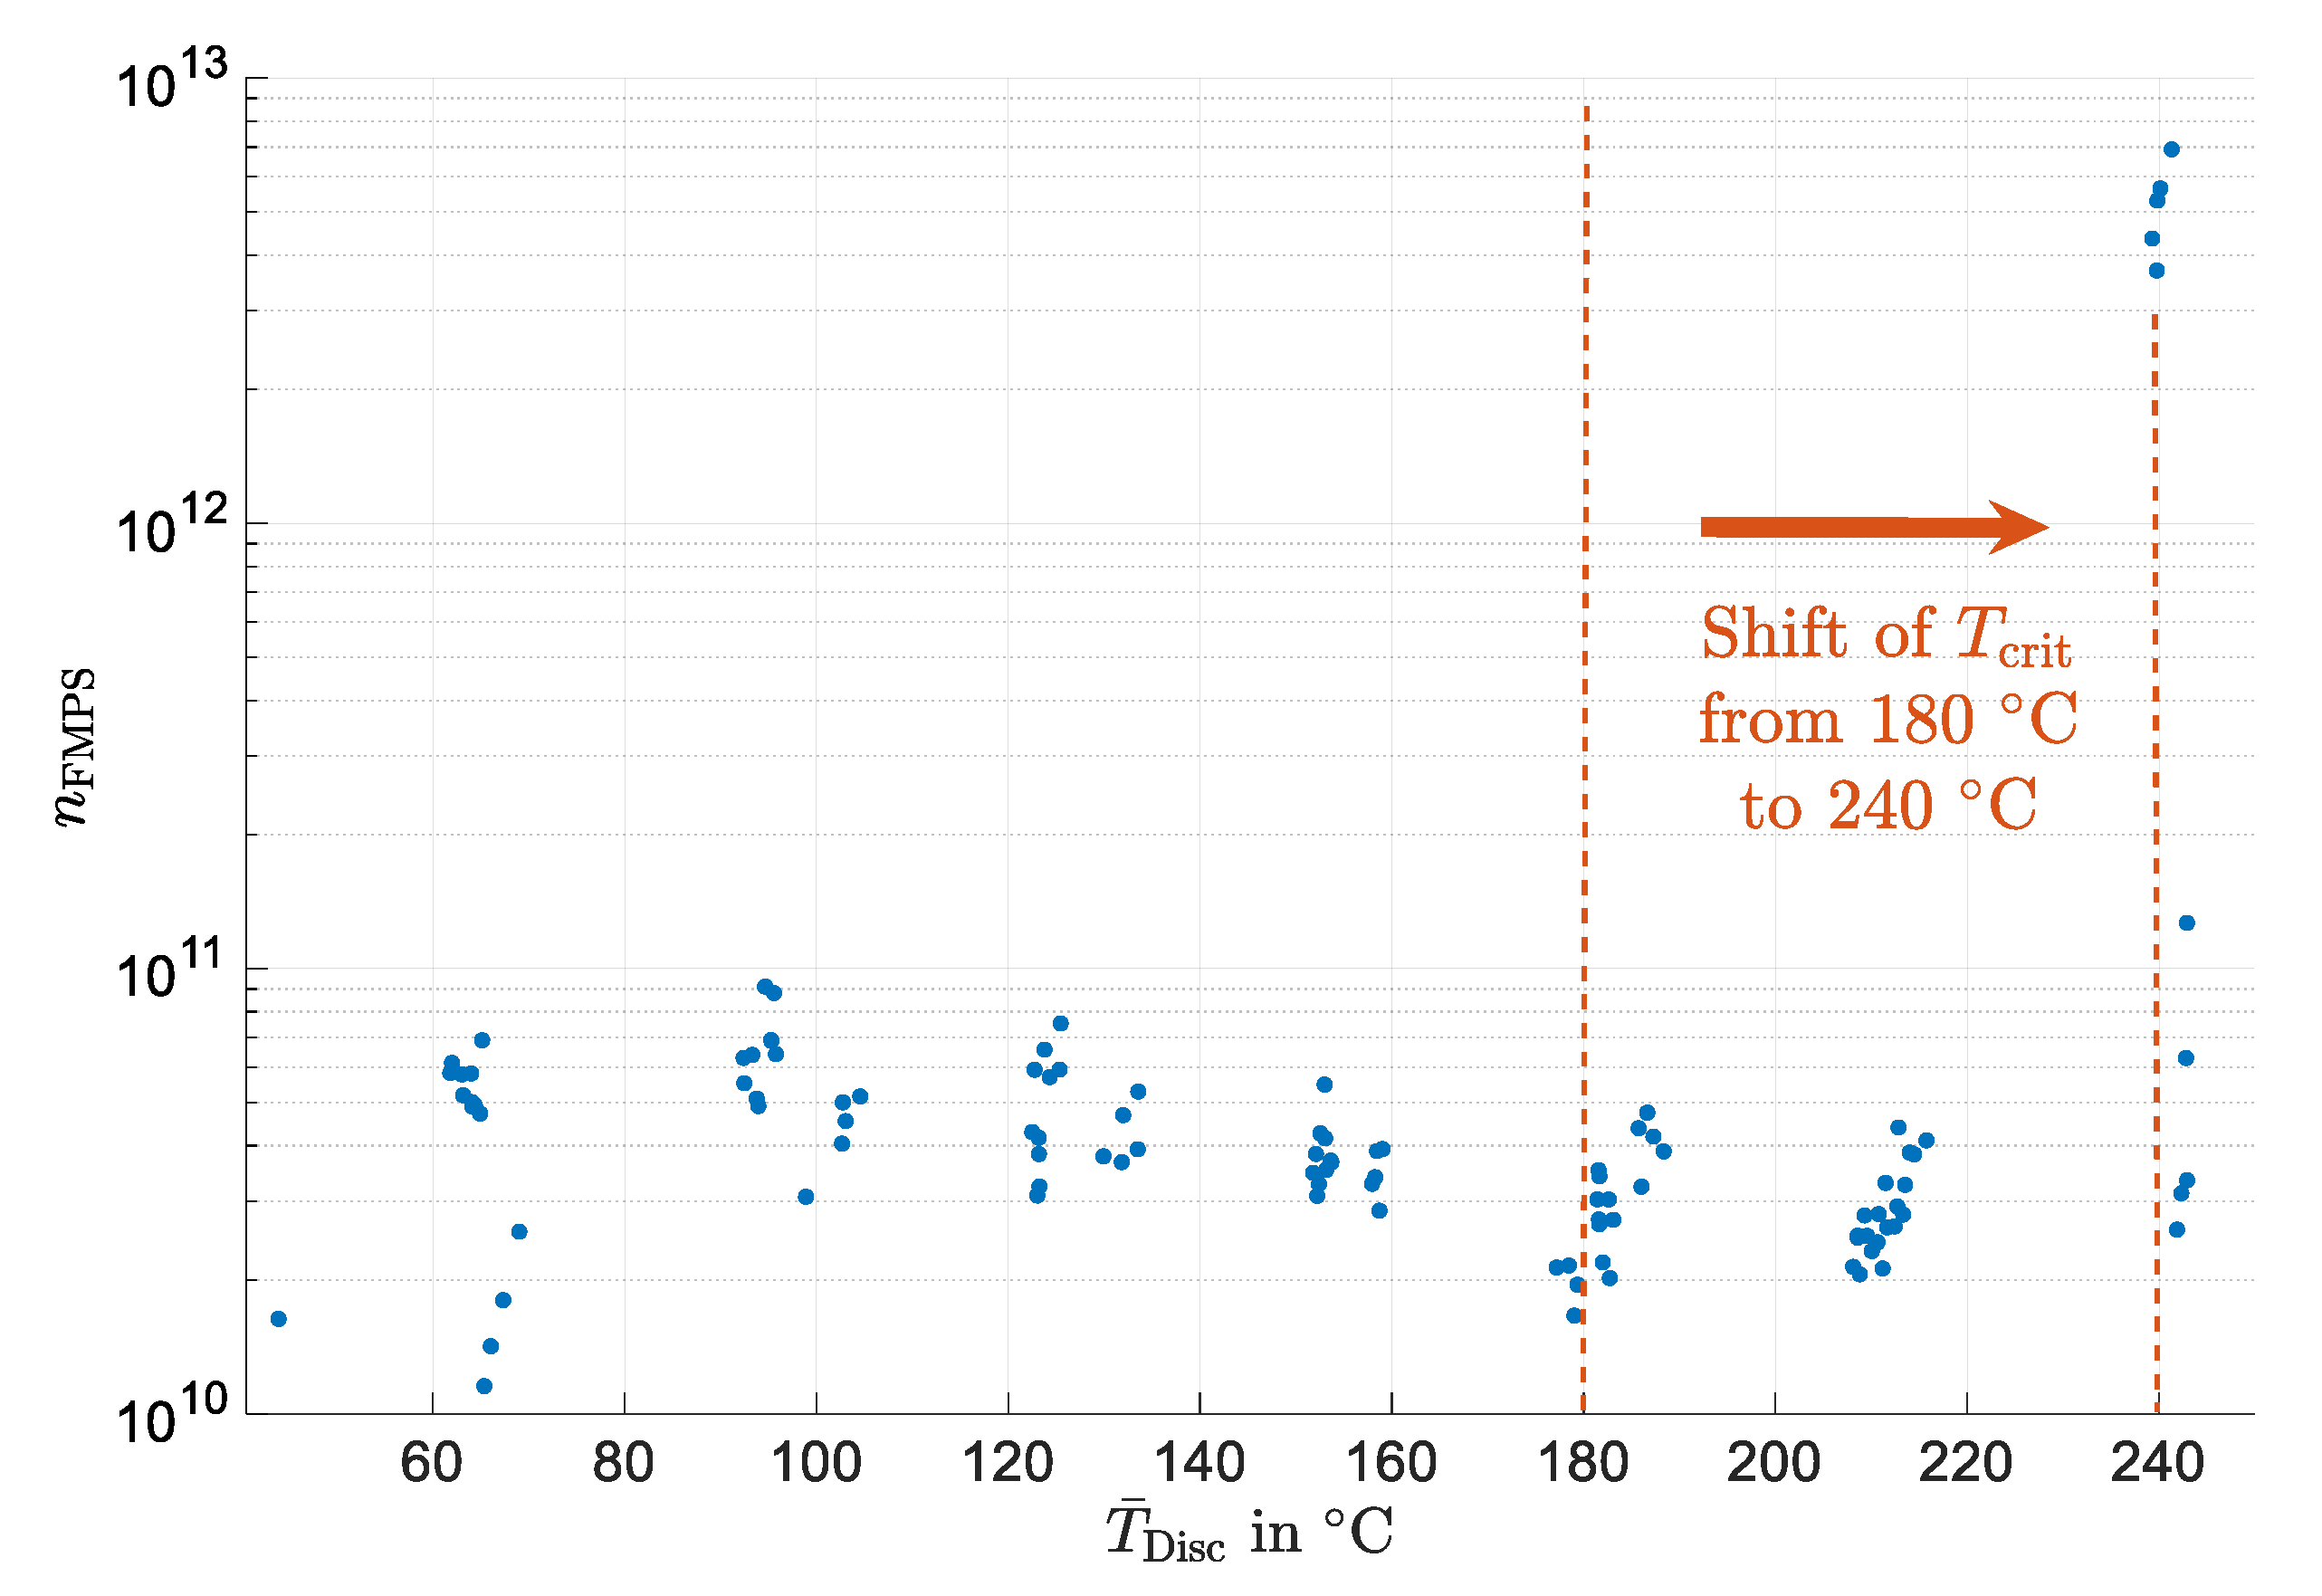
In the case of the inorganic binder materials, no stepwise increase of number emissions caused by nucleation can be observed up to 210 °C. Nucleation can only be seen at the highest temperature step of 240 °C (see Figure 6) and only during the second repetition of the test. During the first repetition, a nucleation event also occurred but was only detected by the CPC. The CPC has a lower minimum detectable particle diameter of 2.5 nm instead of 5.6 nm (FMPS). The time series of the first nucleation event can be found in Appendix B (Figure A2).
In the range of 70–230 °C, the total number of mechanically generated particles decreases with increasing temperature. This behavior is contrary to the pads with an organic binder. The total number of particles before nucleation is in the magnitude of 10 10 to 10 11 particles, which are similar to the pads with an organic binder material.

3.2. Fine and Coarse Particles (Part 1: Single Triangle Test Signal)

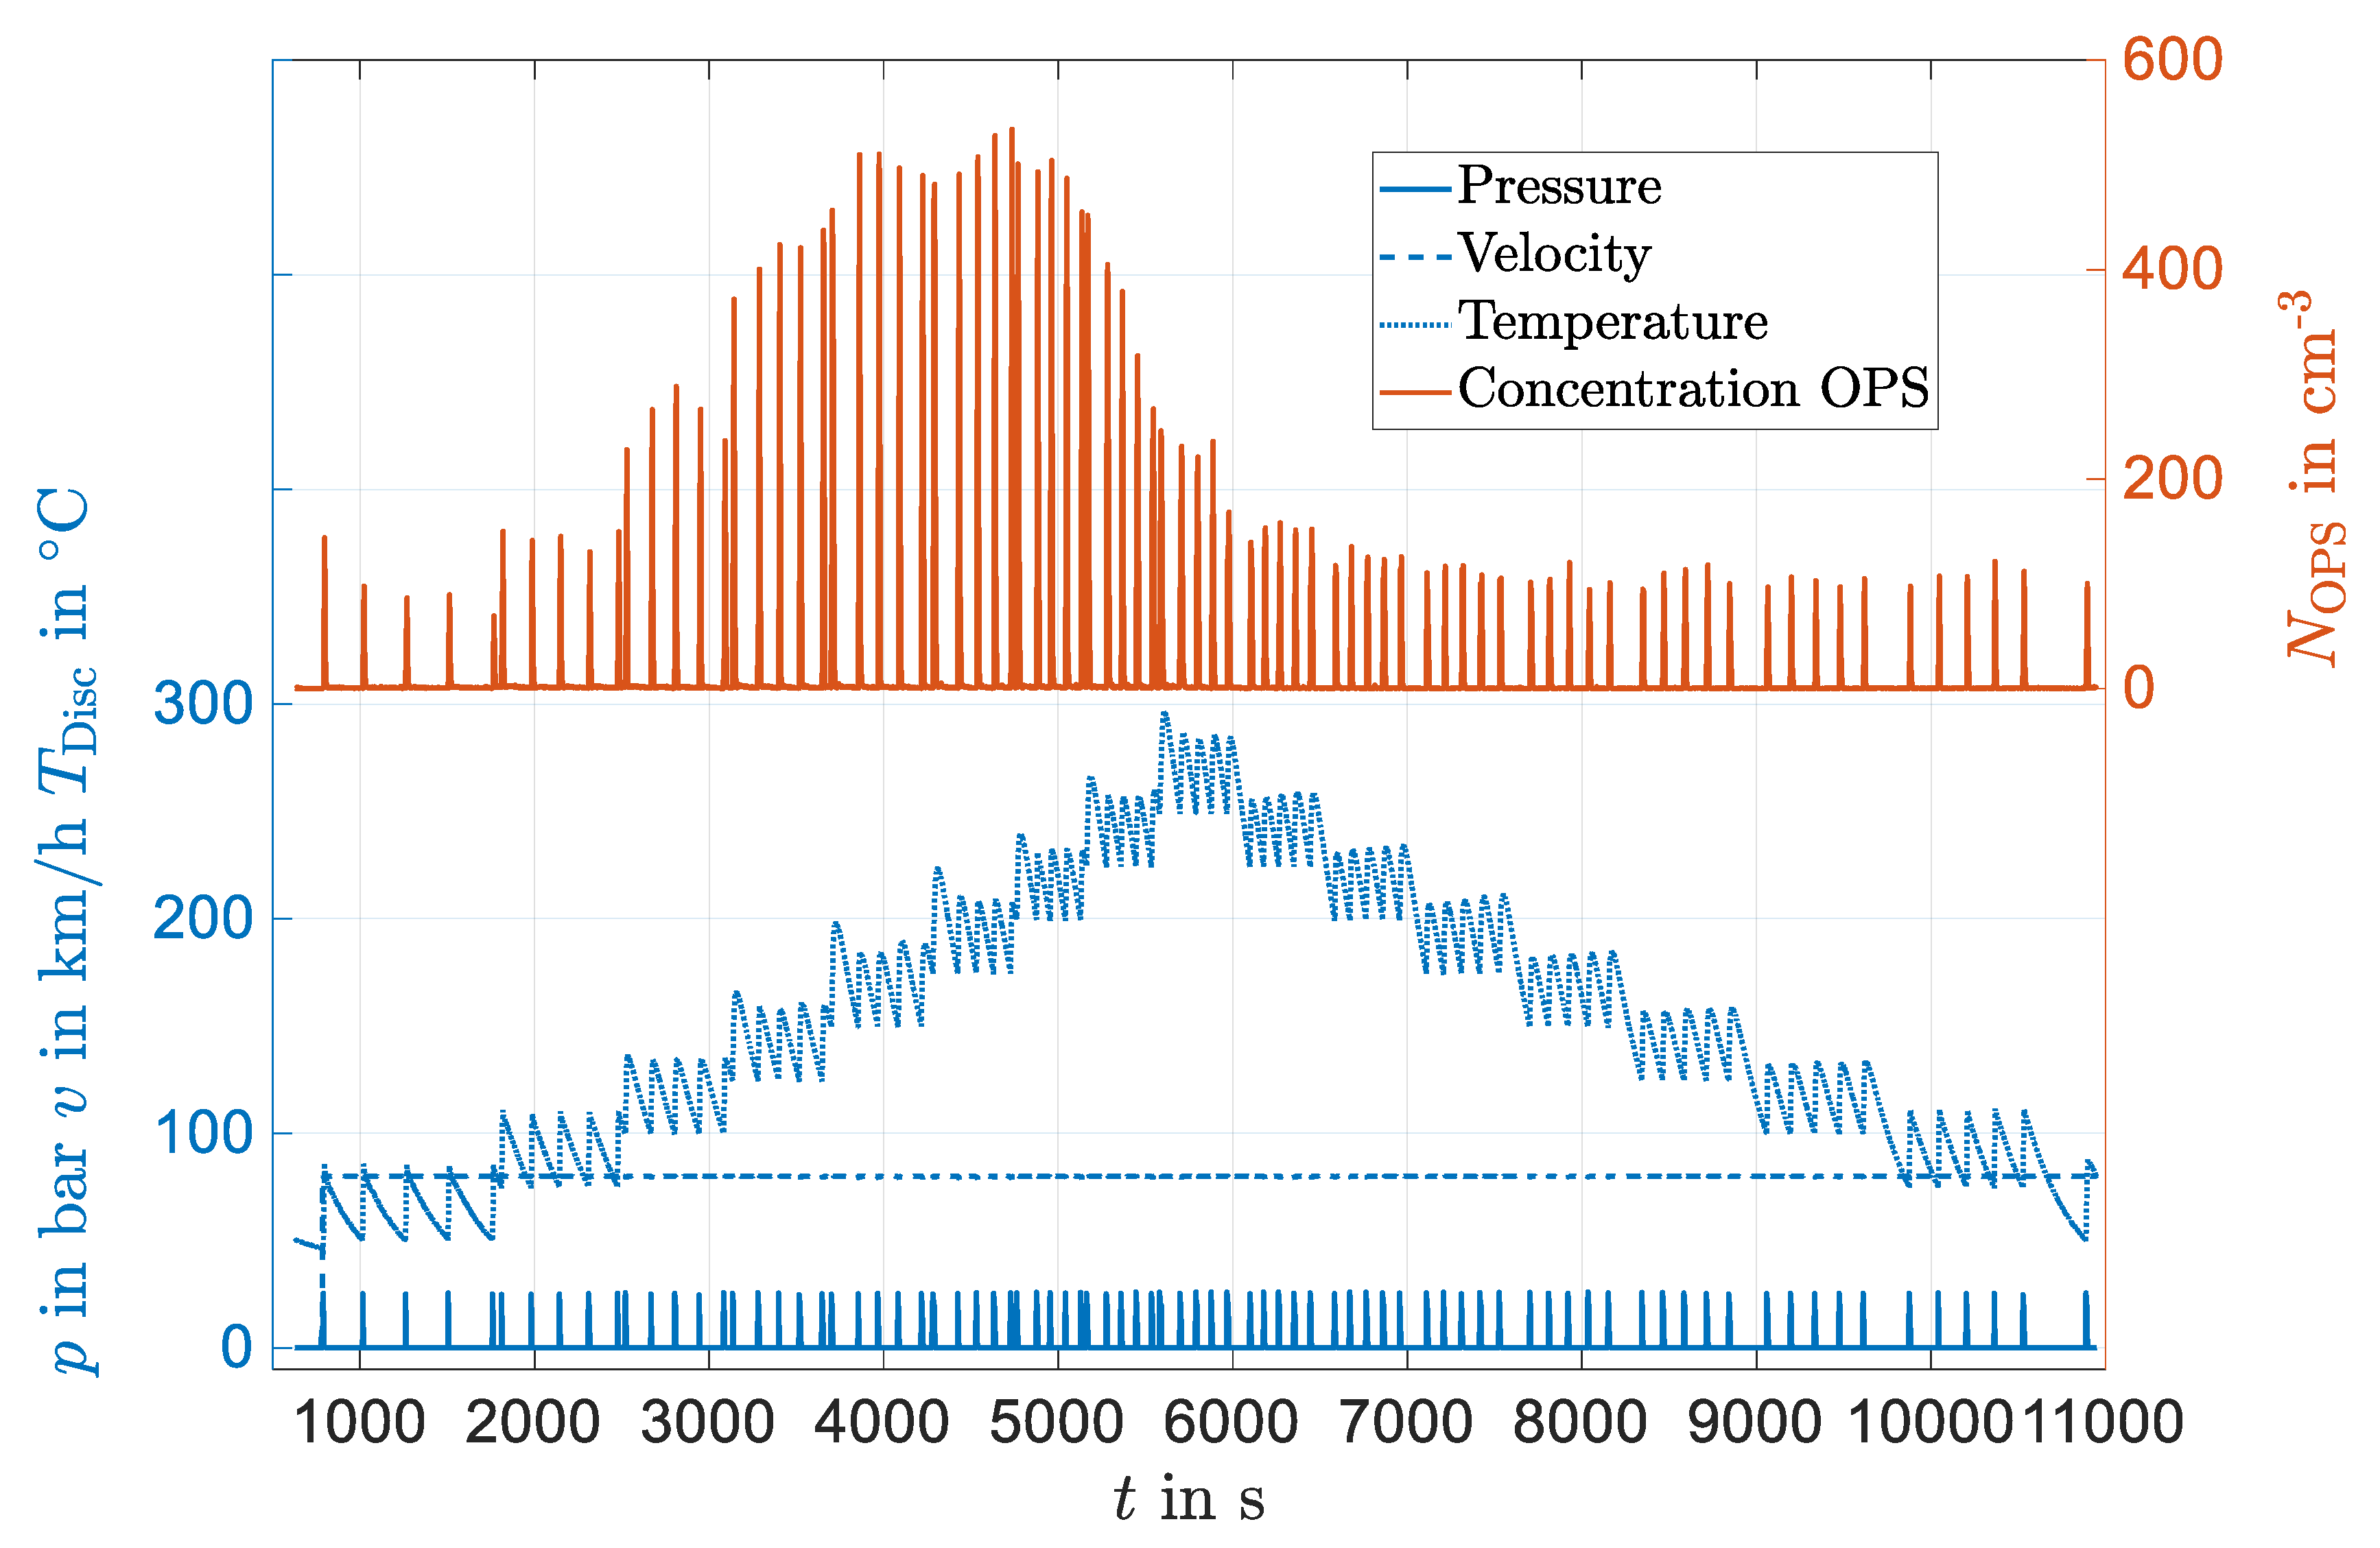
The investigation of the fine/coarse particle’s dependency on temperature is performed in two parts as described in the methodology Section 2.3. The following section describes the part of the investigation with the single temperature triangle that includes a temperature range below and above the critical temperature. The time series of brake pressure, velocity, temperature, and OPS-concentration of the PM10 relevant particles emitted by the pads with an organic binder are plotted in Figure 7. The blue dotted line describes disc temperature and its triangular stepwise shape, which is nearly symmetric on the ascending and descending side. Contrarily to the temperature input signal, the system’s answer in the shape of the concentration measured by the OPS is asymmetric with a shift to the left side. Its concentration maximum is reached at approximately 180–220 °C. Although the temperature is further increased, the concentration decreases and falls to a low level during the whole descending triangle.
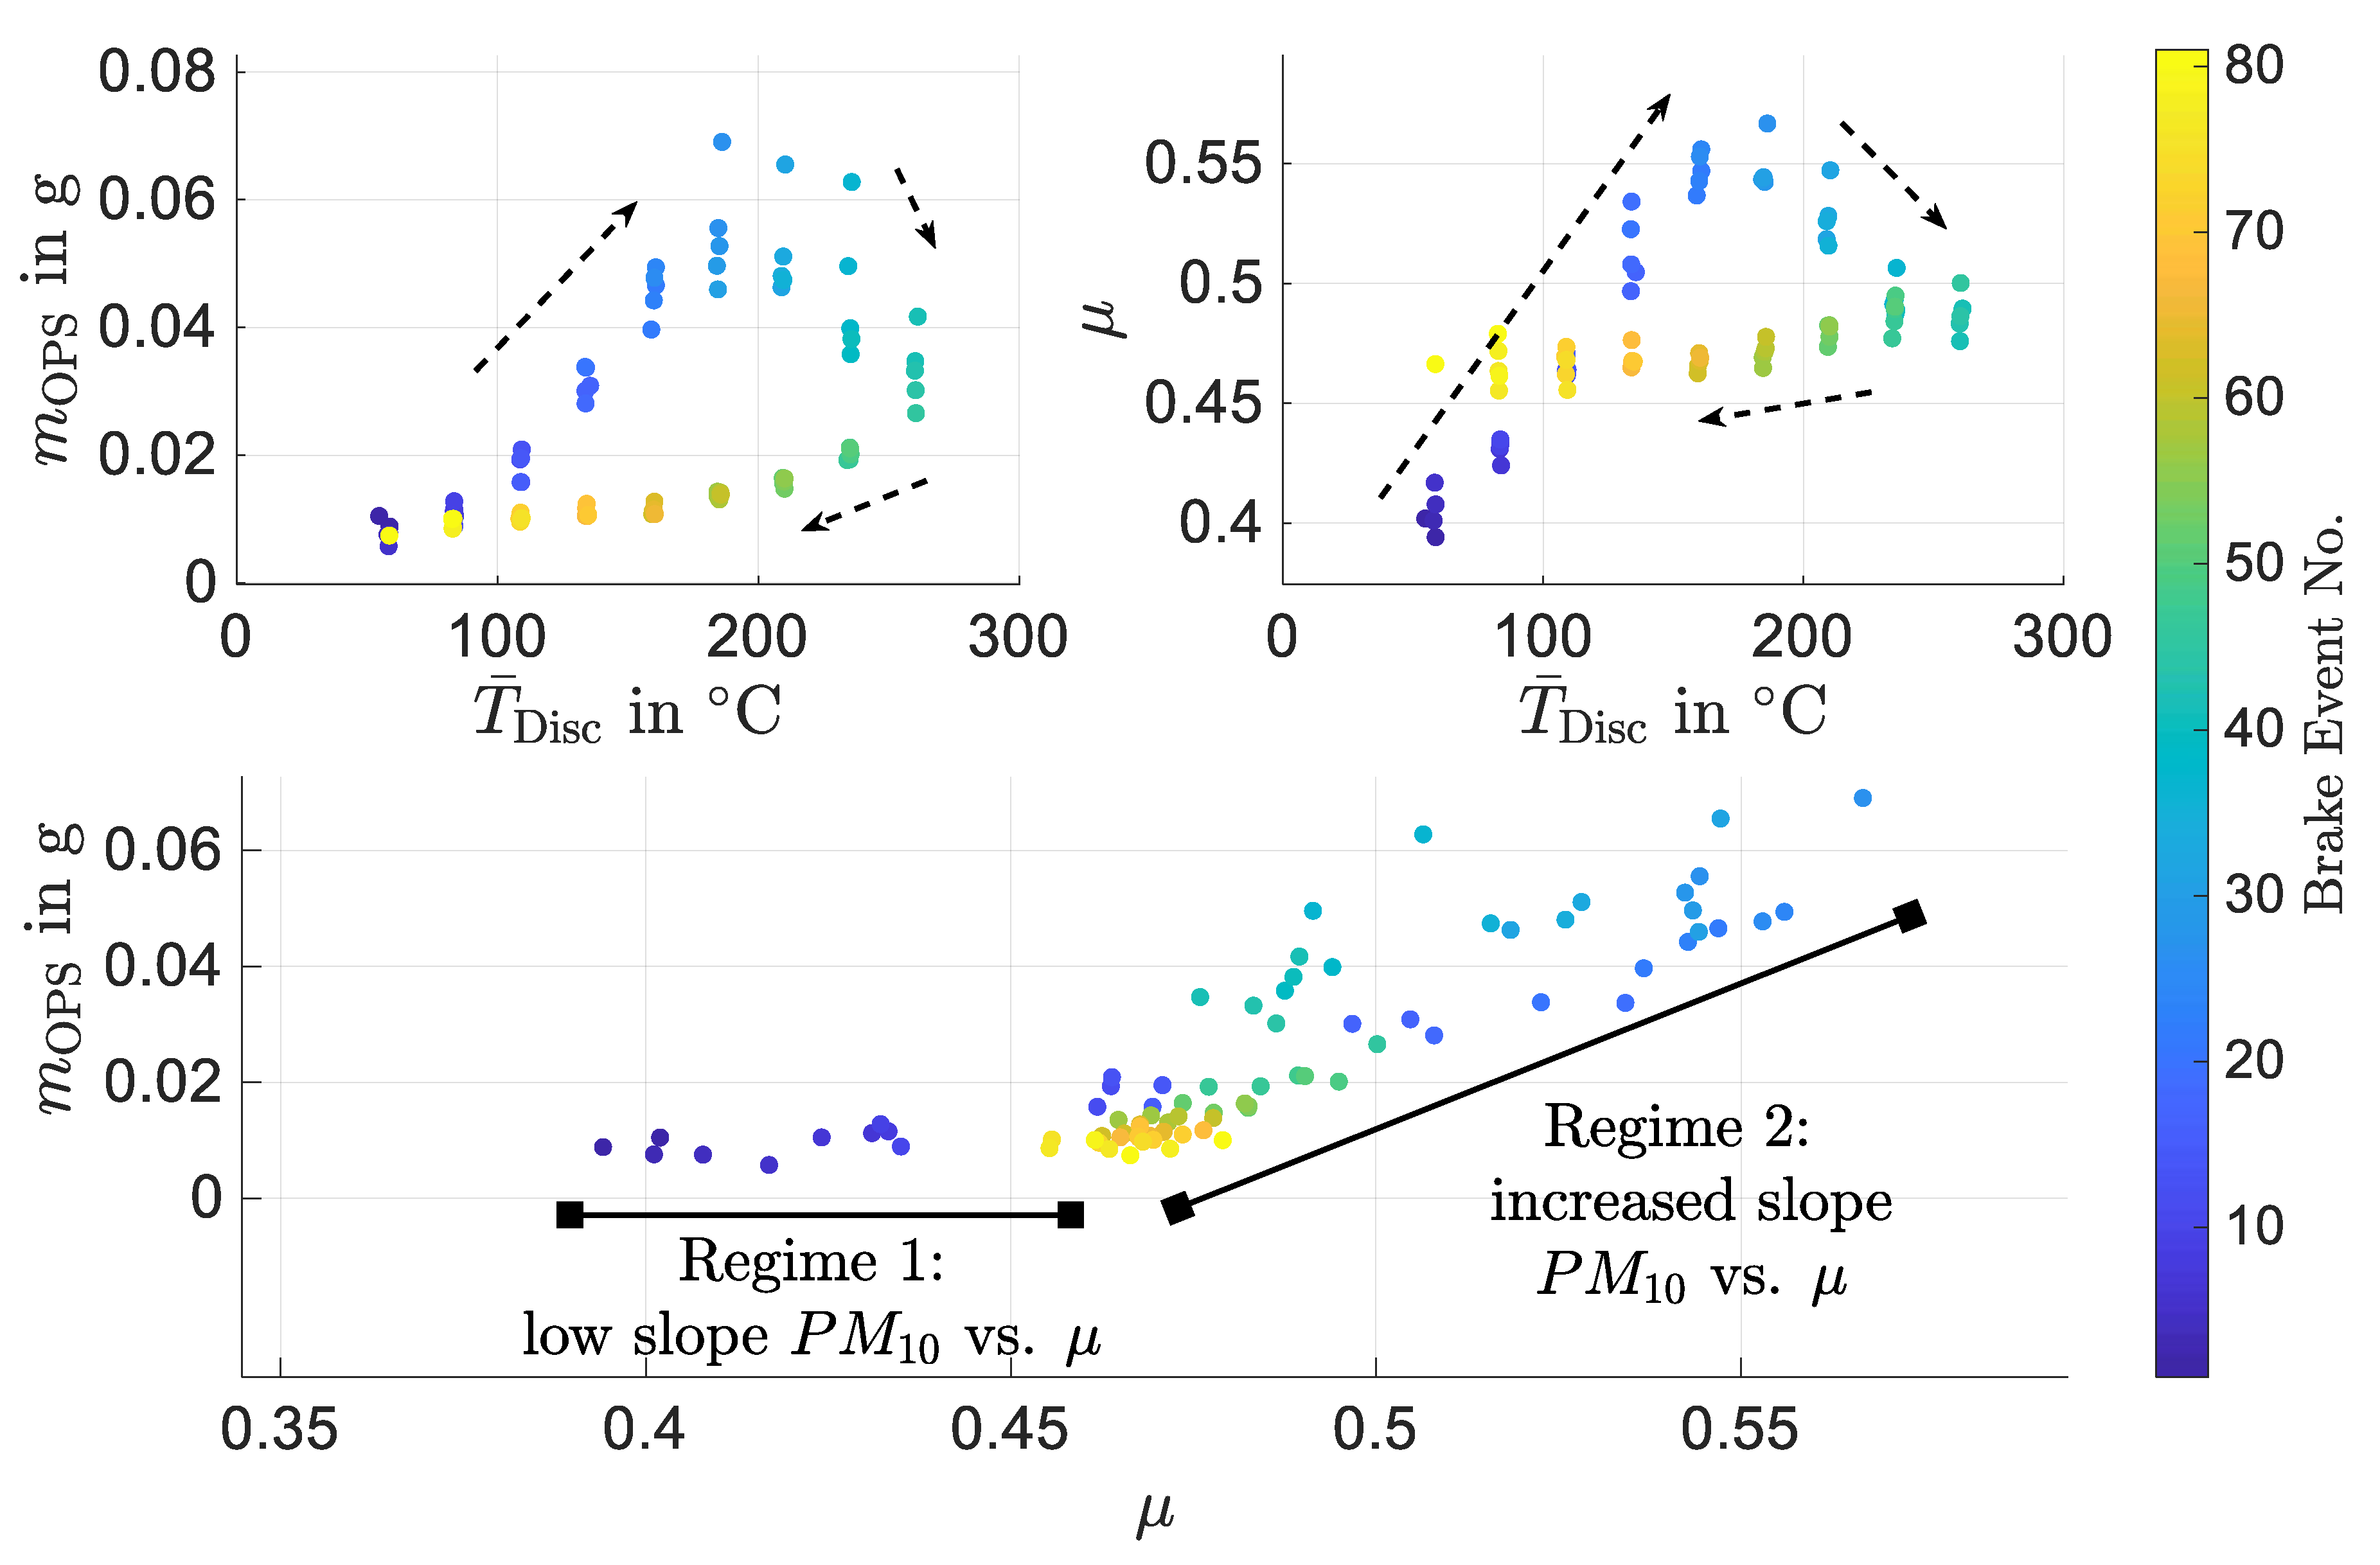
Figure 8 visualizes the influence of temperature regarding the PM10 emissions calculated by the OPS. For the calculation of PM10 based on the size distribution, a constant density of ρ = 3.5 g/cm3 is assumed, which was determined in previous studies of IUTA due to the iterative adaption of calculated mass concentration ( m = V OPS · ρ iter ) versus the gravimetric filter-based measurement of the mass concentration. A possible correlation of PM10, temperature, and the coefficient of friction µ is visualized with three related diagrams in Figure 8. In the left upper diagram, the calculated PM10 emission per brake event is plotted versus the average disc temperature per brake event. As expected from the asymmetric time series shape in Figure 7 the temperature dependency is characterized by a hysteresis. The coefficient of friction μ shows also a hysteresis with a maximum at the same temperature (180 °C) as PM10, which is the critical temperature known from the previous nucleation investigations. A possible correlation between PM10 and the coefficient of friction μ is visualized in the lower diagram of Figure 8, where two regimes with different slopes can be identified apparently. In the first regime, the scattered data points are almost horizontally distributed. This regime only consists of 10 brake events which are equivalent to the first two temperature levels below 100 °C. Starting from brake event 11 an increase of PM10 and μ can be observed, which reaches its maximum before the highest temperature is reached, according to the chronological color bar.
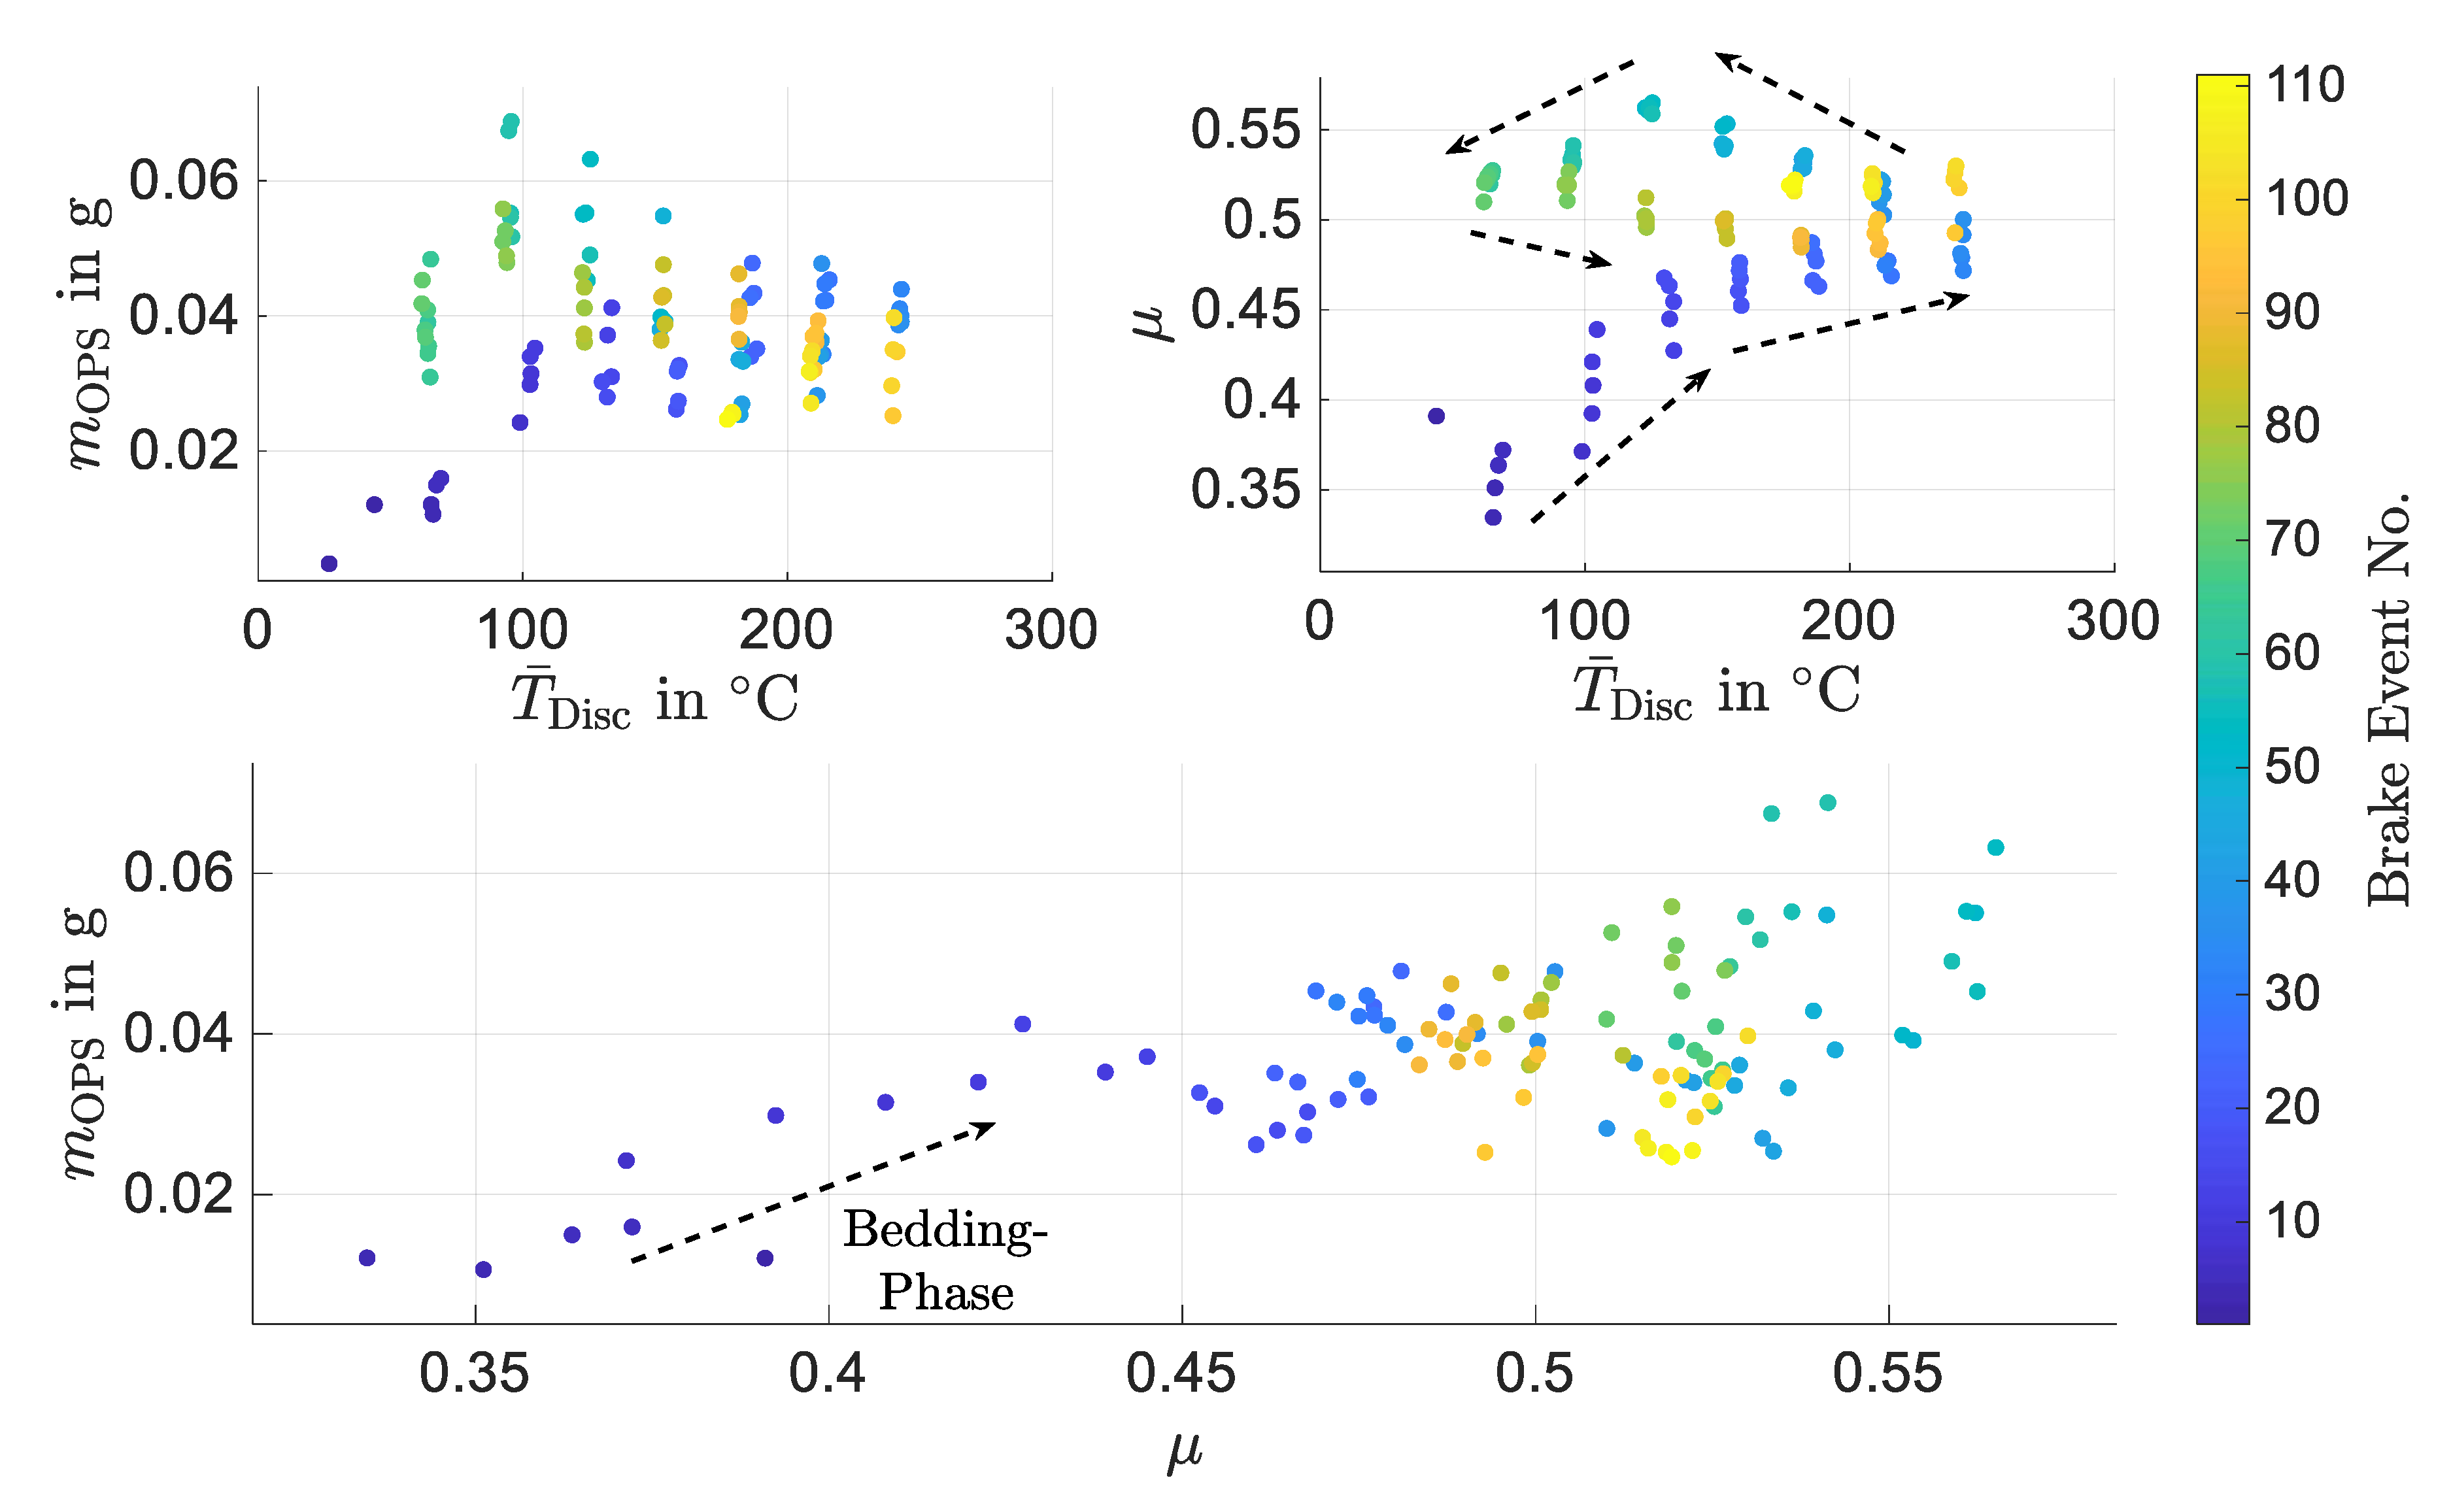
An analogous visualization for the pads with inorganic binder material is plotted in Figure 9. Contrarily to the previous test a second temperature triangle was attached directly after the first temperature triangle and was aborted during the second temperature level of the descending triangle side. After the first ascending triangle side (dark blue) no apparently temperature dependency of PM10 nor of μ can be observed as the PM10-data points are scattered nearly horizontal after the first ascending triangle side. Nevertheless, the μ-data points show a hysteresis during the first ascending triangle side. Again, two phases can be assumed apparently: The first one, which seems to be a bedding process, is below µ values of 0.4 and marked with dark blue points during the ascending side of the first triangle with an increasing slope. The second phase is above µ values of 0.4 and more randomly scattered with noticeable more data points. It can be guessed that a slightly increasing trend is also existent in the second regime. It is important to mention, that the PM10-values in Figure 8 and Figure 9 can only be compared qualitatively but not quantitatively as the tests with the organic binder material was performed with temperature-controlled brake events and the test with inorganic binder material was performed with time-controlled brake events.

3.3. Fine and Coarse Particles (Part 2: Multiple Triangle Test Signals)

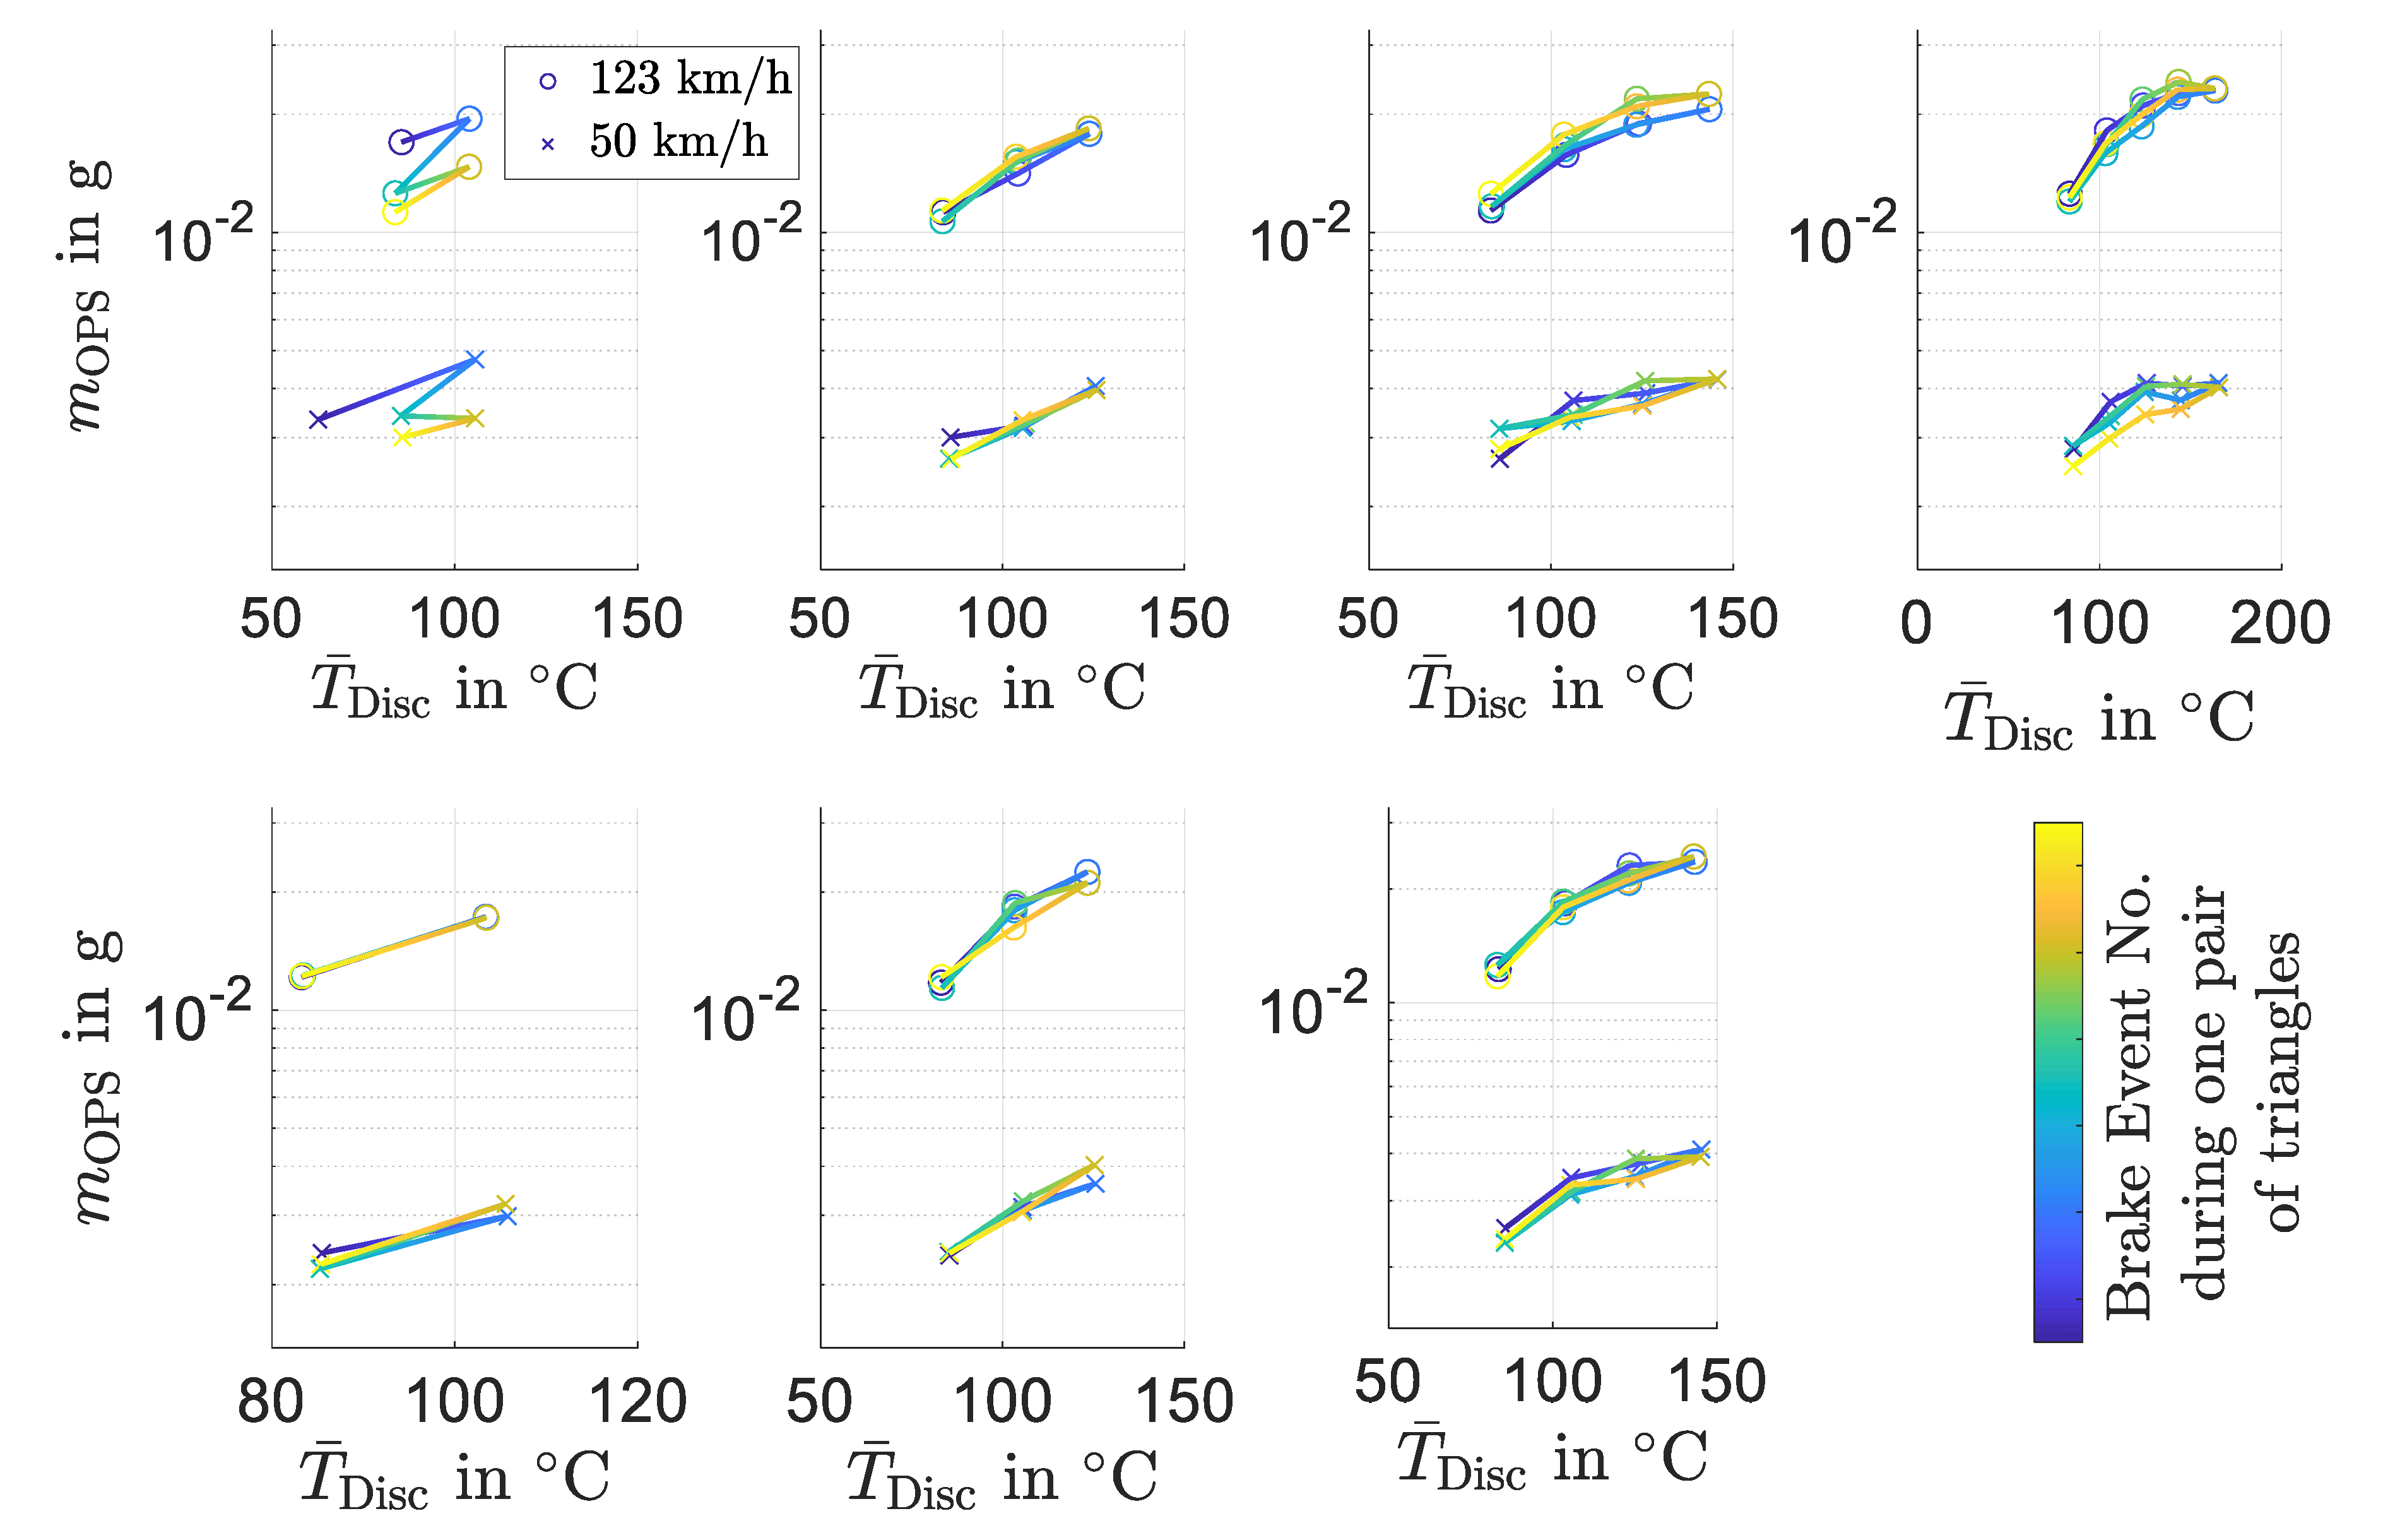
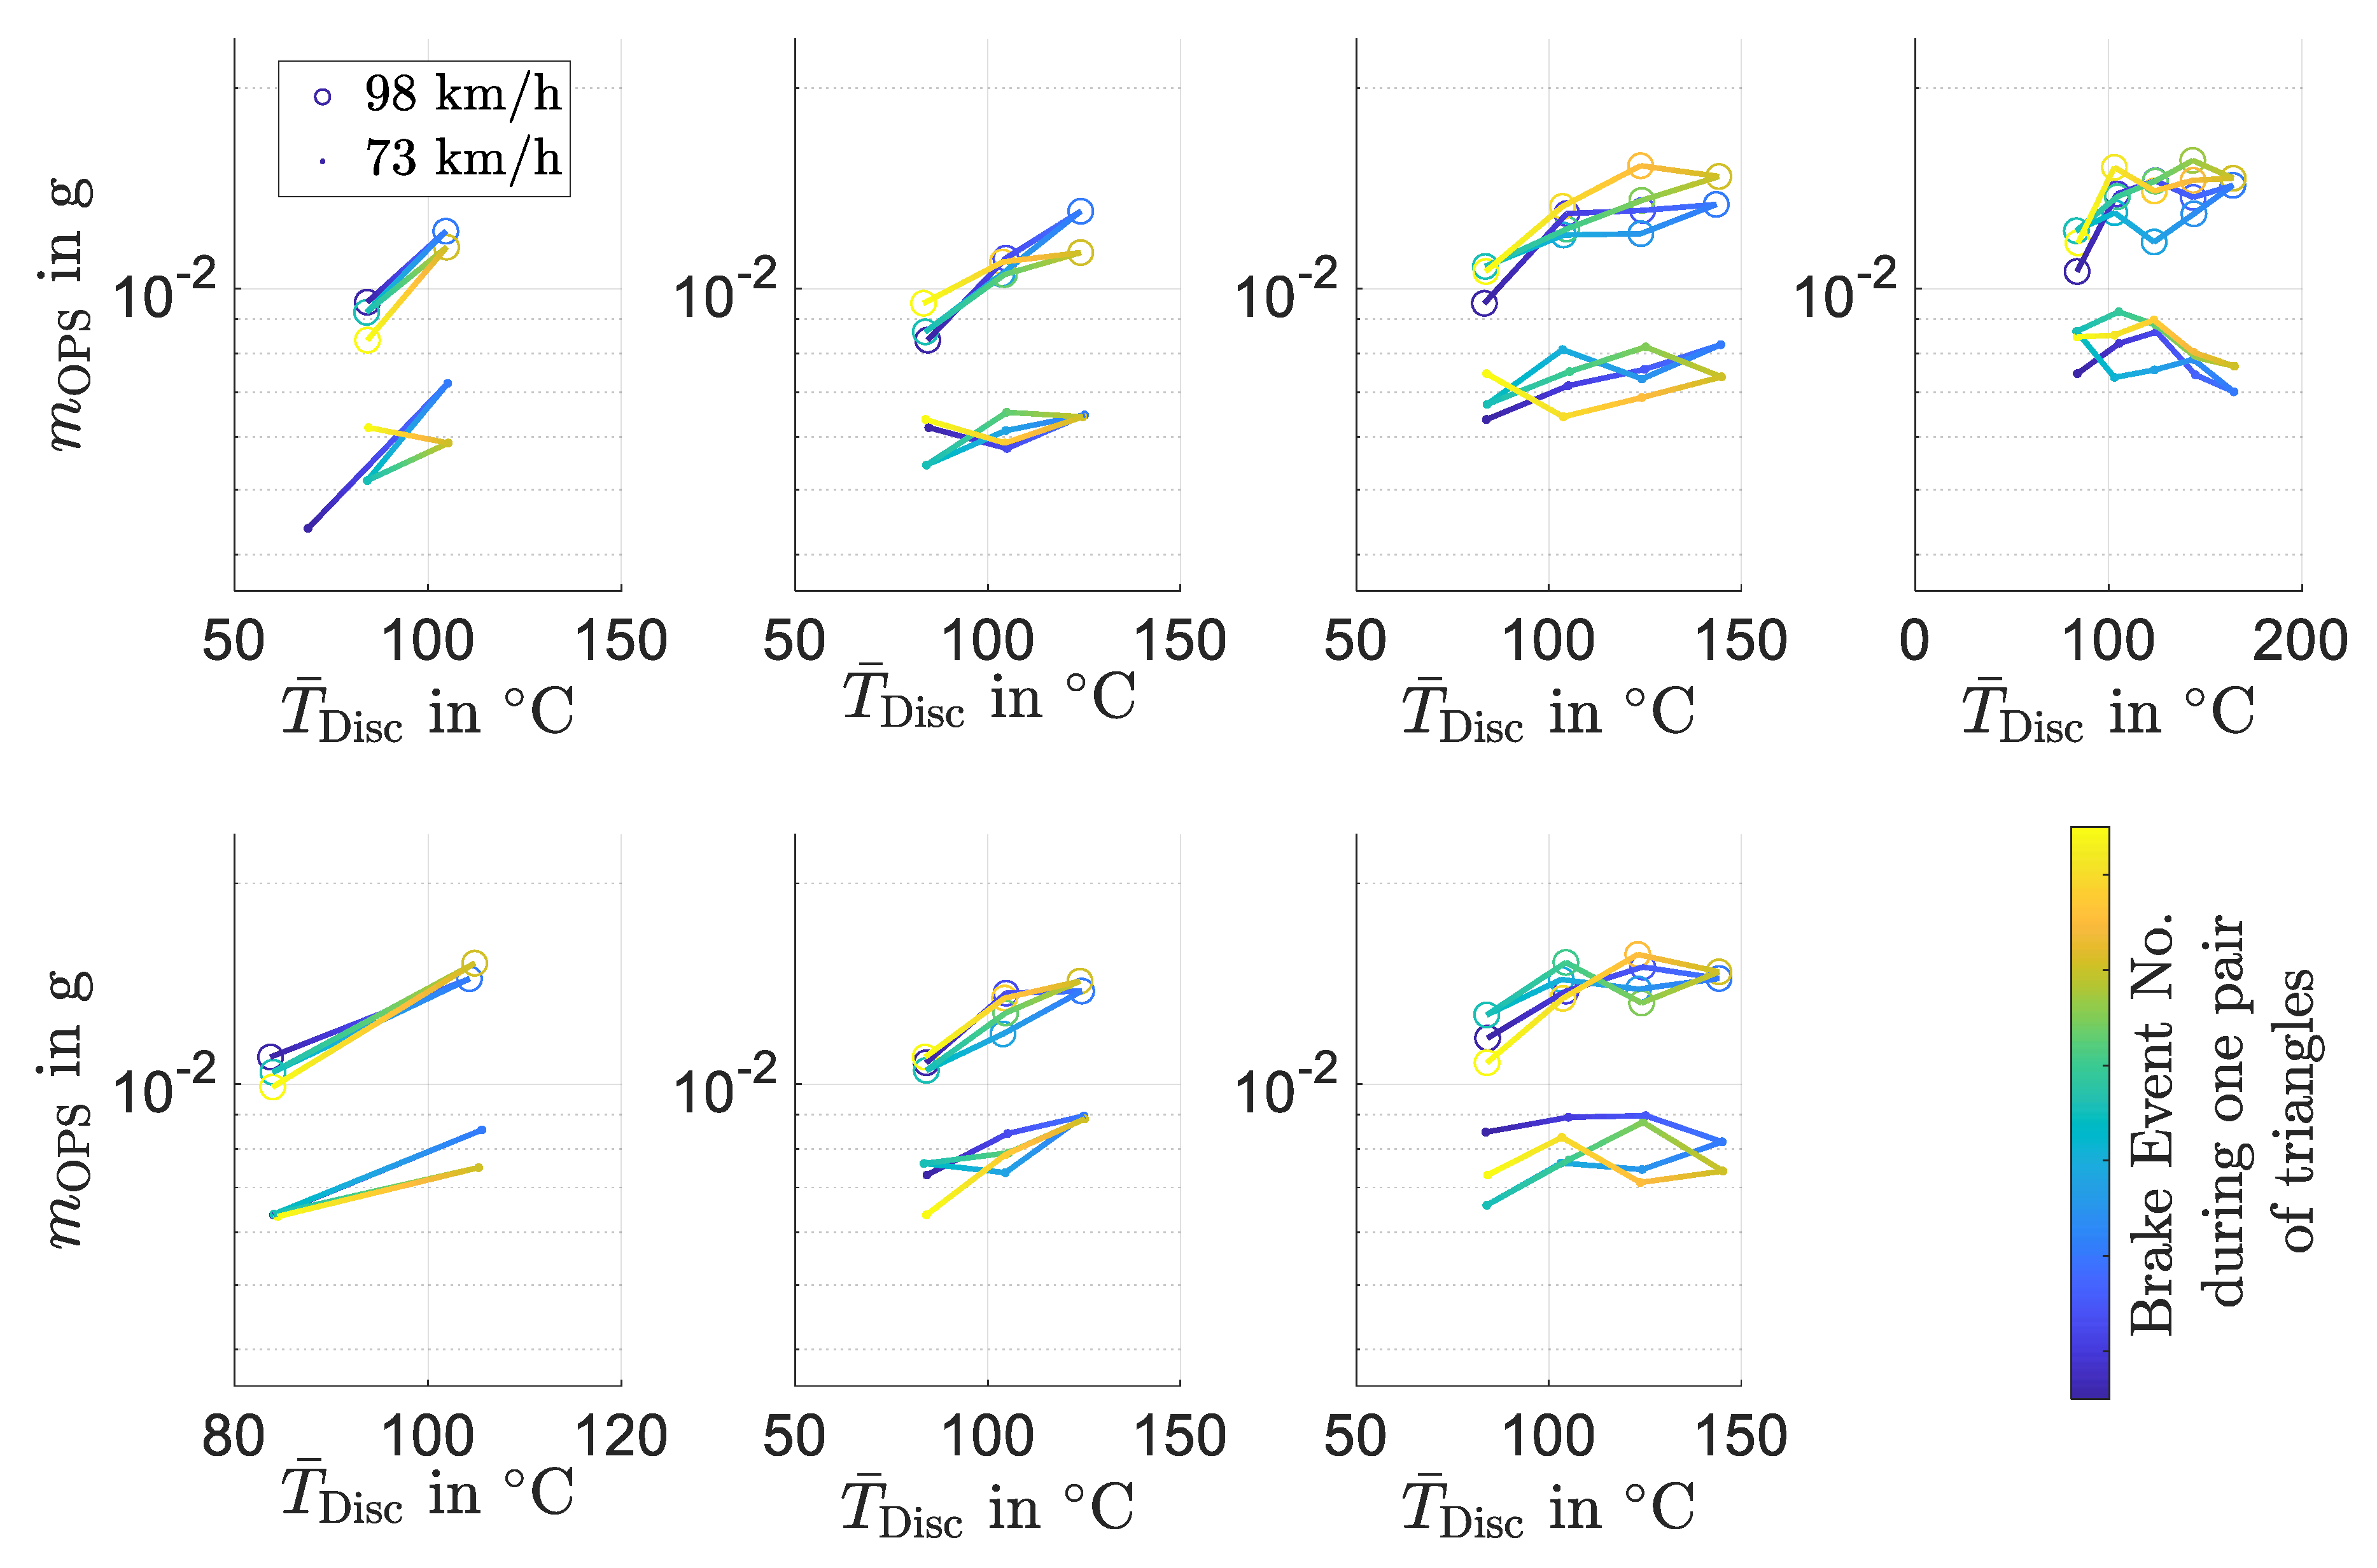
Due to the change in PM10 emission behavior above the critical temperature the second part of the investigations on fine and coarse particles takes place below the critical temperature as described in the methodology Section 2.3. The PM10 emissions per brake event averaged for each temperature step are plotted in Figure 10 (operating points 50 km/h and 123 km/h) and Figure 11 (operating points 73 km/h and 98 km/h). In the top row, the triangles are presented from left to right with ascending the number of temperature levels and in the bottom row with descending number of temperature levels from right to left.
Despite one exception in the 73 km/h triangle with the highest temperature, the trend of PM10 over temperature is increasing and qualitatively as well as quantitatively repeatable. This can be seen especially by comparing the analogous triangles on the ascending and descending side, which are vertically aligned. For example, the third triangle from left in the top row can be compared with the third triangle from left in the bottom row. The only case of a quantitative change was observed during the decreasing triangles in Figure 11 after the above-described exception at the highest temperature level of the 73 km/h step. During those decreasing triangles, the emissions showed a slight increase compared to the ascending triangle side but all PM10 emissions per brake event are in the magnitude of 10 2 g. The increase of PM10 over temperature is in the magnitude of factor 2 between the lowest and highest temperature levels and no interaction between temperature and velocity on the emission was observed.
Besides the subject of temperature influence, it is interesting to mention that although all drag brake events were performed with the same friction power and brake time (respectively with the same friction energy) the PM10 emission is not the same for all four operating points but increases with velocity.
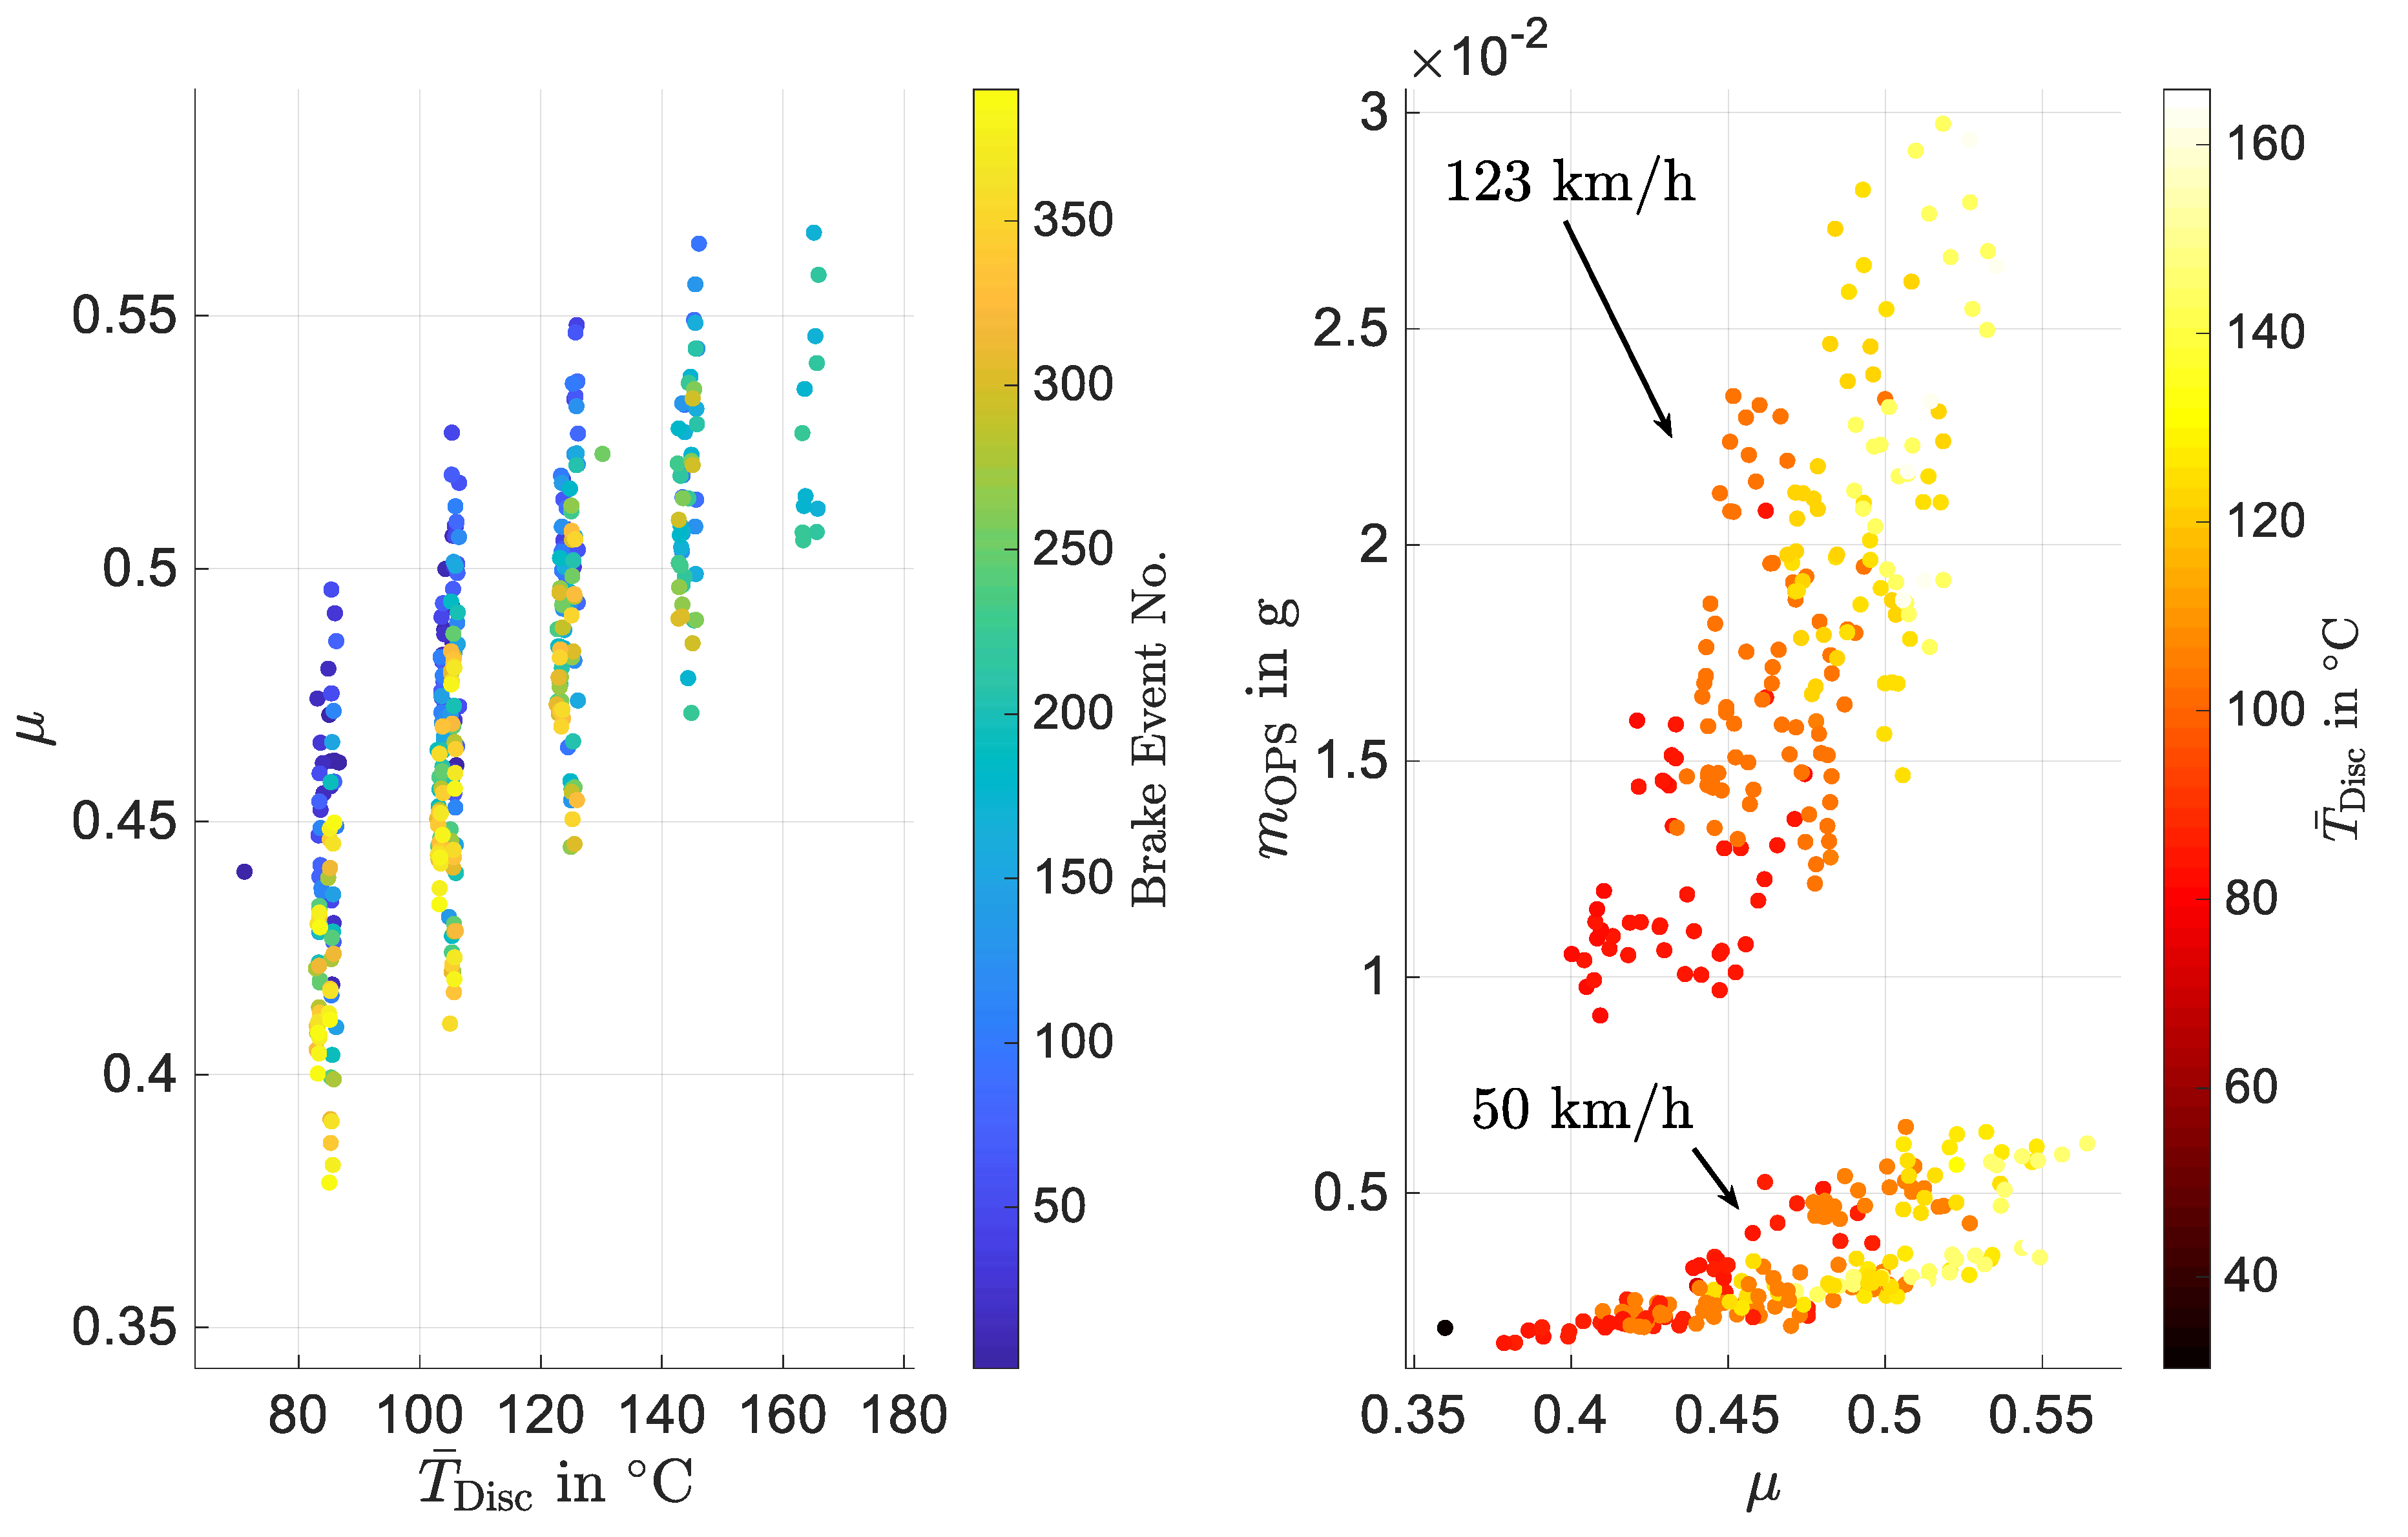
The dependence of PM10, temperature, and the coefficient of friction is plotted in Figure 12 analogous to the diagrams in the previous section but without the diagram PM10 versus temperature, which is plotted in Figure 10 and Figure 11. Neither PM10 nor the coefficient of friction shows a significant hysteresis compared to the hysteresis in the tests above the critical temperature. As in the previous single triangle test, which was performed above the critical temperature, PM10, and the coefficient of friction show an apparent correlation but with different slopes at 50 km/h and 123 km/h.

4. Discussion

In accordance with the current state of research nucleation events were generated above a temperature of 180 °C. This temperature is in accordance with the range of several authors in the literature, except for Kukutschová [13] (p. 1005) who found nucleation above 300 °C disc temperature. 180 °C is lower than the decomposition temperature of the raw binder material [5,13], which has the lowest decomposition temperature (250–300 °C) of organic pad compounds. Because the local temperature in the friction surface is expected to be higher than the integral disc temperature, this discrepancy between decomposition temperature and critical nucleation temperature was to be expected. Possibly decomposition in the friction zone already takes place at lower disc temperatures but the emitted concentration of nucleation particles is not sufficient to agglomerate to a detectable diameter as it happened during the first triangle of the test with the inorganic binder pad (Appendix B) when nucleation was only detected by CPC but not by the FMPS.
The generation of nucleation particles by decomposition of organic pad materials was not repeatable in that manner that the amount of nucleation particles decreased for identical sequential brake events, so the first nucleation event at one temperature level emits the biggest amount of nucleation particles. This phenomenon is in accordance with the explanation that nucleation is caused by decomposition because the material which is “available for decomposition” next to the friction surface is limited and is consumed with ongoing heat input. The observation from Farwick zum Hagen et al. [15] that pad materials with a mileage of 6000 km did not produce nucleation particles up to 215 °C could be also explained by the “consumption” of the organic binder by decomposition during previous hypothetical high-temperature brake events.
The tested pads with an inorganic binder material, which is thermally stable up to 800 °C, have a higher critical temperature than the tested pads with an organic binder material. The observed critical temperature shifts about 60 °C with the inorganic binder. As known from Ramousse [5] and Kukutschovà [13] besides phenolic binder also other organic materials, which are present in brake pads, are decomposed at high temperatures, e.g., coal at 300–400 °C. Analogous to the decomposition of the binder material the decomposition temperature of coal and disc temperature for the onset of nucleation are not equal due to the thermocouple’s position 0.5 mm below the friction surface.
According to Figure 8, the hysteresis behavior of PM10 and µ correlates with the critical decomposition temperature of the phenolic binder as PM10 and µ start to decrease at the same temperature as the nucleation occurs. This suggests that the decomposition is responsible for this decreasing behavior. This observation also suggests that PM10 and µ correlate with each other, as it can be seen during the second regime in Figure 8. A correlation between PM10 and µ is plausible as abrasive friction is based on the plastic deformation of friction partners causing wear particles, which are emitted into the ambient air as particulate matter, which consists partially of PM10, but also out of bigger particles.
The hypotheses that decomposition of phenolic binder leads to the observed hysteresis behavior is substantiated by the fact that the absence of an organic binder leads to an emission and friction behavior without temperature hysteresis, as it can be seen from the experiments with an inorganic binder (Figure 9).
For the pads with an organic binder, a behavior without hysteresis was only achieved below the critical temperature (Figure 10 and Figure 11). Below the critical temperature, a repeatable temperature influence of PM10 was observed. Nevertheless, it is not certain if this repeatability below the critical temperature is achieved by the presence of an intact, non-oxidized binder or by other unknown processes. However, the correlation of critical temperature for ultrafine particles and the change in PM10 emission behavior indicate a causal relation.
With both organic and inorganic binder material an adaption of µ can be observed during the first brake events of the test. Such adaption processes are well known from the literature, e.g., from tribometer investigations of Ostermeyer and Eriksson [18,19,20].

5. Conclusions

Based on the described results and the subsequent discussion, the five research questions mentioned in the introduction section are answered below to summarize the knowledge gained during this investigation:

5.1. Ultrafine Particles

Research question 1: Is it possible to prevent nucleation processes or to increase the critical temperature by replacing organic compounds in the brake pad e.g., organic binder materials?
In accordance with the current state of research, nucleation events were generated and the critical temperature for the conventional pad material with an organic binder is in the well-known range of 180 °C. By means of a systematic temperature variation (triangular temperature test signal), the investigation independently from other influencing factors as velocity, pressure, and friction history was enabled. For the purpose of a more detailed visualization of nucleation, a graphical presentation was chosen. This allows plotting temperature dependency of the size distribution as well as the increase of particle emission in one diagram.
The hypothesis, known from the literature, that phenolic binder material’s decomposition processes are responsible for nucleation events, stays valid as the critical temperature was increased by the usage of prototypical pad material without phenolic resin binder. The critical temperature shifts about 60 °C to a higher level.
Regarding a possible legislative regulation of particle number emissions, this shift of 60 °C is relevant, because the test procedure, planned PMP, allows brake temperatures of up to 170 °C at the front axle and 180 °C at the rear axle [21]. Both temperatures are in the range of known critical temperatures and nucleation cannot be precluded during such a test.
Research question 2: How does thermal decomposition processes of pad materials influence the reproducibility of nucleation events?
The amount of generated nucleation particles decreases with ongoing brake events at one temperature level. This indicates a thermal aging effect of the pad material caused by decomposition. It is unknown, up to which thermal load the pad material can recover nor the penetration depth of decomposition processes for a specific thermal load. This question could be the subject of further investigation as the question rises, if nucleation processes are a real-world phenomenon or only for new pads under laboratory conditions.

5.2. Fine and Coarse Particles/PM10 Emission

Research question 3: How can the influence of disc temperature on PM10 emissions be quantified on a full-scale dynamometer setup?
This investigation revealed that single and advanced temperature triangles are a suitable method to quantify the influence of disc temperature on PM10 emissions of a full-scale disc brake system on an enclosed dynamometer. According to Farwick zum Hagen and Mathissen [2] (p. 5148) a correlation between temperature and PM10 could not be found during real-world driving cycles like the LACT. This indicates that other influencing parameters are stronger than temperature, corresponding with other previous studies [22,23]. In general, PM10 increases approximately by factor 2 within the temperature range of 80 to 160 °C.
Research question 4: How does thermal decomposition processes of pad materials affect the temperature dependency of PM10 emissions?
If the critical temperature is exceeded the PM10(T) and µ(T) behavior changes simultaneously from increasing to decreasing trend with an additional hysteresis shape. Due to this correlation, it is assumed that the decomposition of organic binder leads to a decrease of PM10(T). This assumption is reinforced by the observation that the pads with an inorganic binder do not change their behavior in a similar way. All tests revealed a correlation between PM10 and µ.
Research question 5: How does thermal decomposition processes of pad materials influence the reproducibility of the measurement of emission maps for PM10 depending on temperature?
Below the critical temperature, a repeatable temperature influence could be measured due to the usage of an advanced temperature triangle experiment, which consists of multiple triangles with increasing and decreasing number of temperature levels.
In addition to previous studies on the topic of influencing parameters on brake wear particle emission [17,22,23,24], this work contributes to the quantification of the influencing parameters on the emission behavior of wear particles by passenger car disc brakes. Furthermore, a reduction approach for particle number emissions was presented and assessed by using inorganic binder materials for brake pads.

Author Contributions

Conceptualization, H.N. and H.W.; methodology, H.N. and H.W.; formal analysis, H.N.; investigation, H.N. and H.K.; resources, G.F. and R.M.; writing—original draft preparation, H.N.; writing—review and editing, H.W., C.A., H.K., G.F., and R.M.; supervision, H.W.; project administration, H.N. and G.F.; funding acquisition, H.W. and G.F. All authors have read and agreed to the published version of the manuscript.

Funding

This research was funded by Daimler AG.

Acknowledgments

The authors thank all the employees at Link Europe for their support during the measurement campaigns. We acknowledge support by the German Research Foundation and the Open Access Publishing Fund of the Technical University of Darmstadt.

Conflicts of Interest

The authors declare no conflict of interest. The funders had no role in the design of the study, in the collection, analyses, or interpretation of data or the writing of the manuscript but the funder’s permission was required to publish the results.

Appendix A

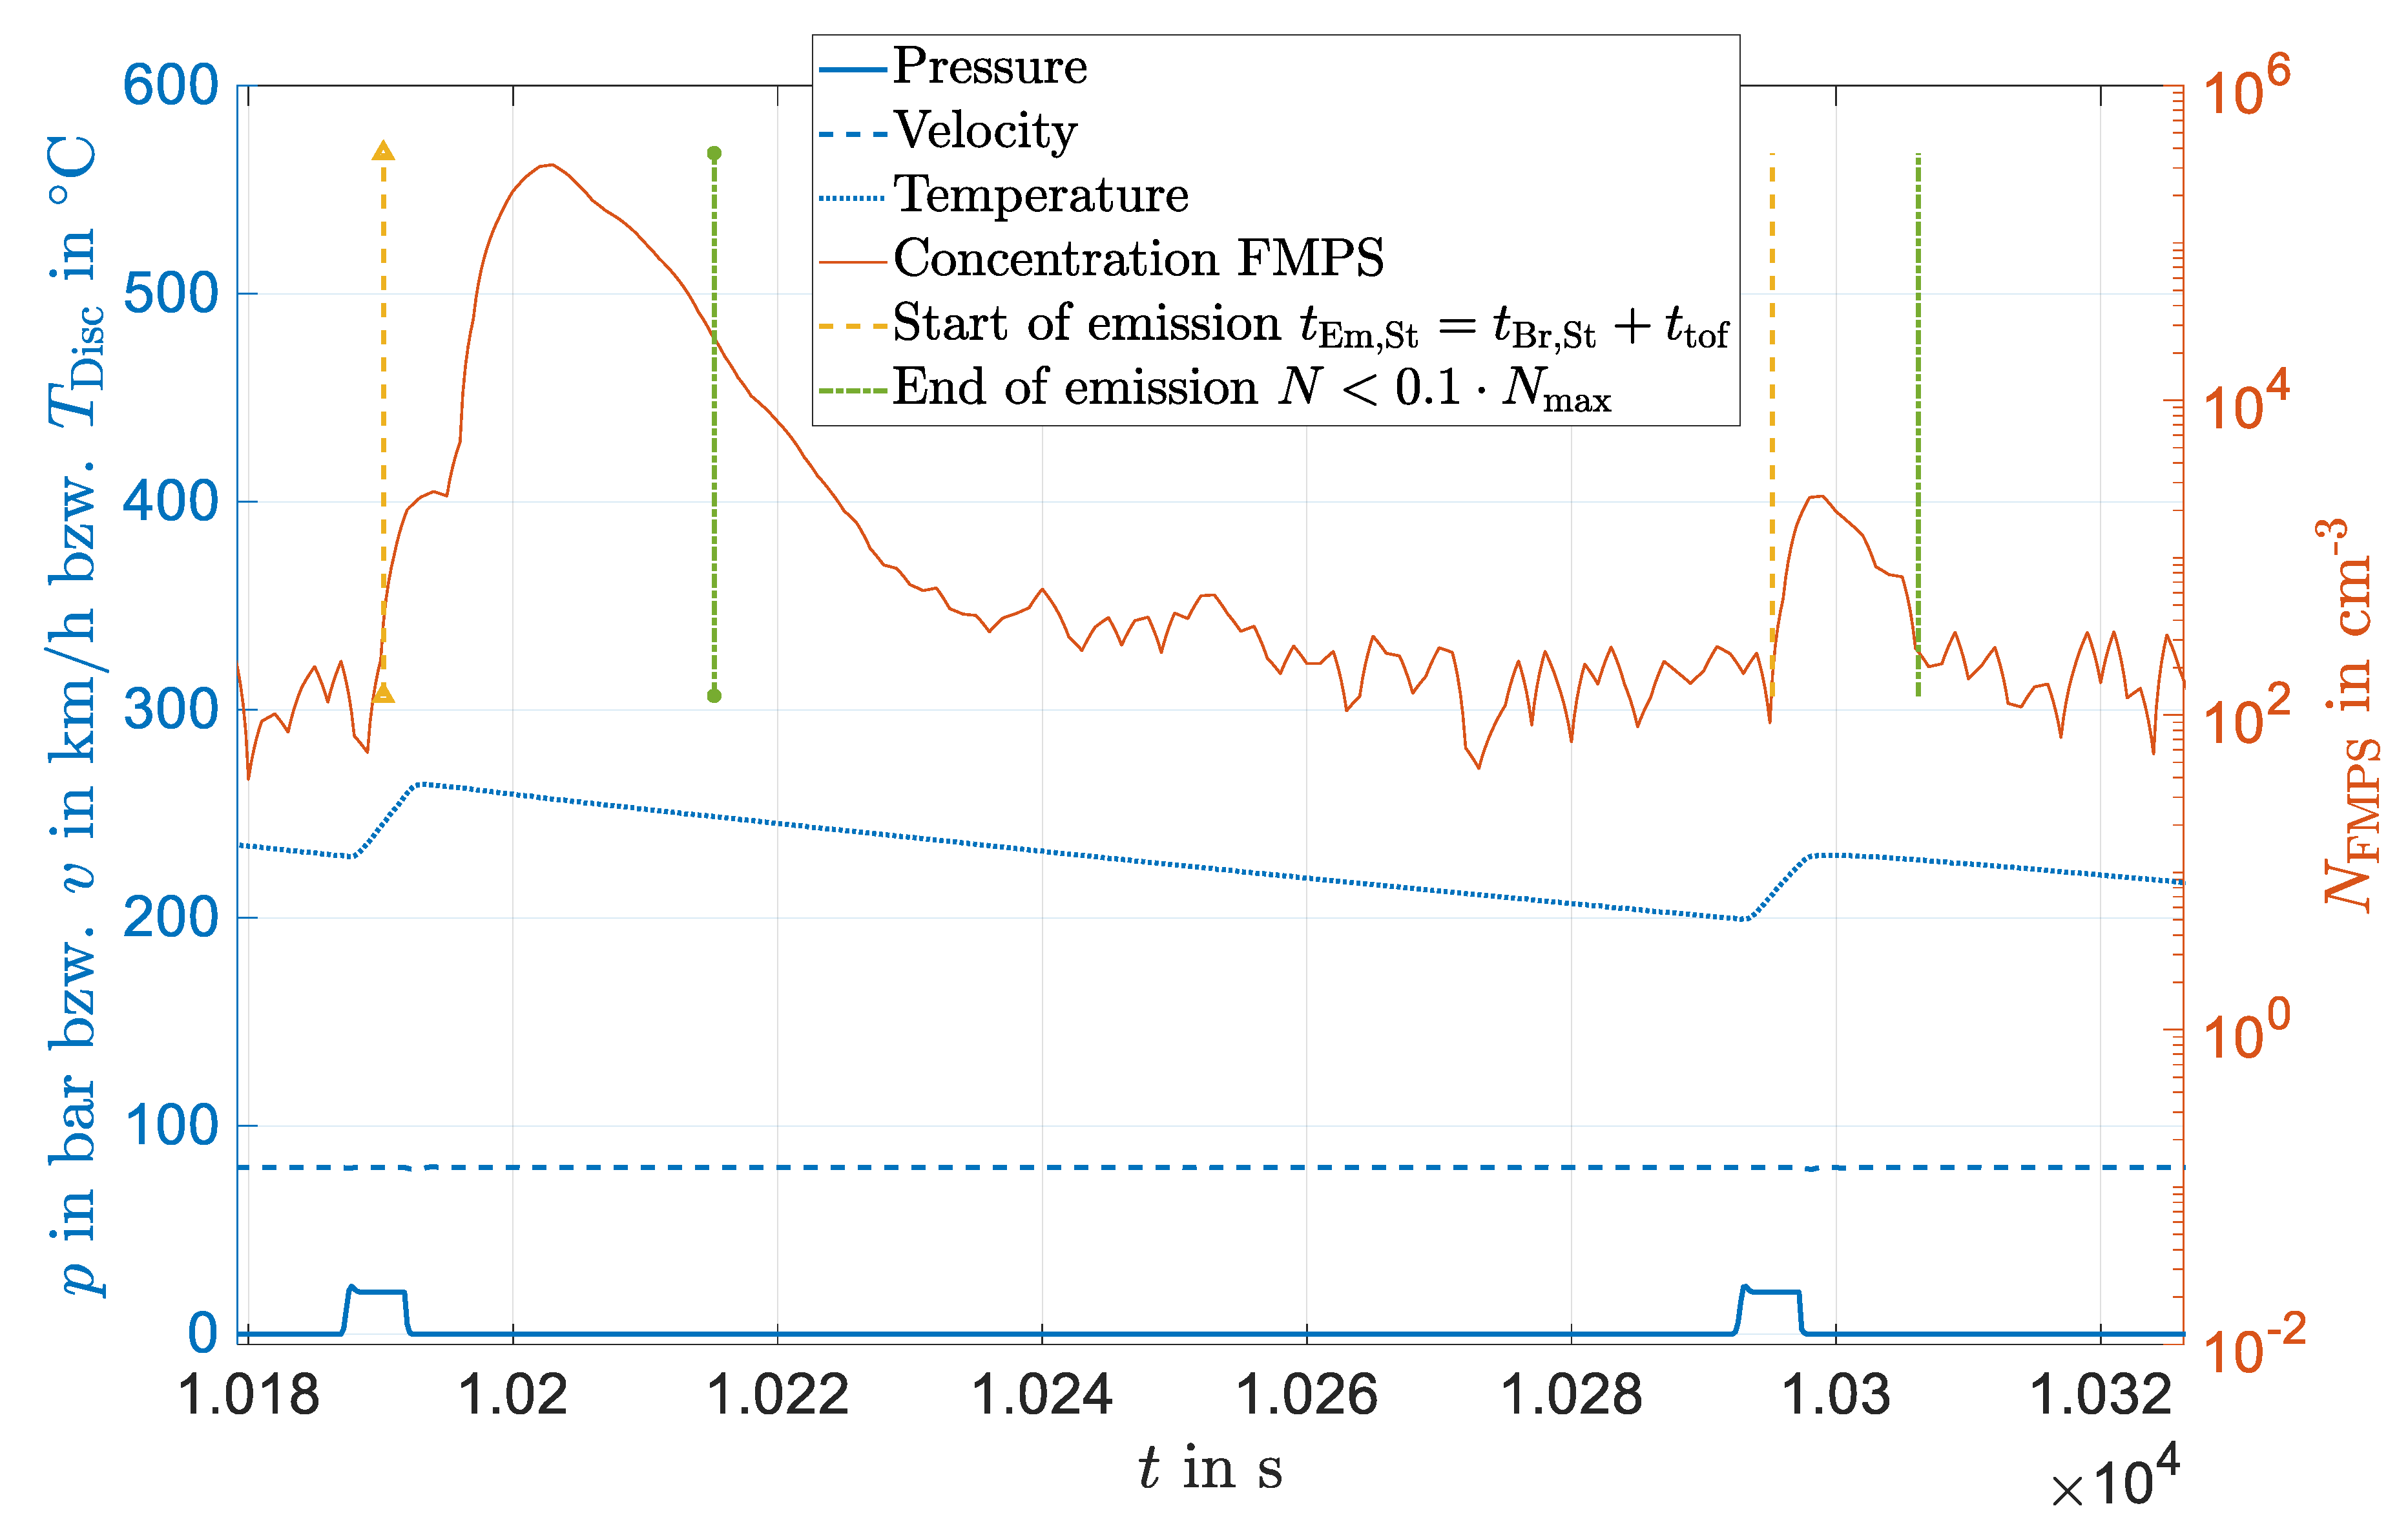
Figure A1. Calculation of emission start and emission end for the calculation of the total number of particles per brake event. Emission start is defined as the time of brake start plus the flight time of particles, which is approximately 3 s. The end of emission is defined as the time when the concentration falls below 10% of the maximal concentration during this brake event. Due to the logarithmic plot of the concentration the area below the concentration curve is not proportional to the number of particles.
Atmosphere 11 01060 g0a1

Appendix B

Figure A2. Total number of particles emitted per brake event plotted versus the average disc temperature during the brake event for pad material with inorganic binder analog to Figure 6. In addition to Figure 6, the time series of FMPS and CPC concentration is shown to visualize that the first nucleation event was only detected by the CPC but not by the FMPS, which has a higher detection limit than the CPC regarding the particle diameter. The second triangle was aborted due to the dynamometer’s availability.
Atmosphere 11 01060 g0a2

References

  1. Grigoratos, T.; Martini, G. Brake wear particle emissions: A review. Environ. Sci. Pollut. Res. Int. 2015, 22, 2491–2504. [Google Scholar] [CrossRef] [PubMed] [Green Version]
  2. Zum Hagen, F.H.F.; Mathissen, M.; Grabiec, T.; Hennicke, T.; Rettig, M.; Grochowicz, J.; Vogt, R.; Benter, T. Study of Brake Wear Particle Emissions: Impact of Braking and Cruising Conditions. Environ. Sci. Technol. 2019, 53, 5143–5150. [Google Scholar] [CrossRef] [PubMed]
  3. Asbach, C.; Todea, M.A.; Zessinger, M.; Kaminski, H.; Mayer, R. Entstehung und Möglichkeiten zur Messung von Feinund Ultrafeinstaub beim Bremsen. In XXXVII. Internationales μ-Symposium 2018 Bremsen-Fachtagung; Springer: Berlin/Heidelberg, Germany, 2019. [Google Scholar]
  4. Namgung, H.G.; Kim, J.B.; Woo, S.H.; Park, S.; Kim, M.; Kim, M.S.; Bae, G.N.; Park, D.; Kwon, S.B. Generation of Nanoparticles from Friction between Railway Brake Disks and Pads. Environ. Sci. Technol. 2016, 50, 3453–3461. [Google Scholar] [CrossRef] [PubMed]
  5. Ramousse, S.; Høj, J.W.; Sørensen, O.T. Thermal Characterisation of Brake Pads. J. Therm. Anal. Calorim. 2001, 64, 933–943. [Google Scholar] [CrossRef]
  6. Nosko, O.; Alemani, M.; Olofsson, U. Temperature effect on emission of airborne wear particles from car brakes. In Proceedings of the Europe’s Braking Conference and Exhibition, Dresden, Germany, 4–6 May 2015. [Google Scholar]
  7. Nosko, O.; Olofsson, U. Quantification of ultrafine airborne particulate matter generated by the wear of car brake materials. Wear 2017, 374, 92–96. [Google Scholar] [CrossRef]
  8. Nosko, O.; Vanhanen, J.; Olofsson, U. Emission of 1.3–10 nm airborne particles from brake materials. Aerosol Sci. Technol. 2017, 51, 91–96. [Google Scholar] [CrossRef] [Green Version]
  9. Alemani, M.; Wahlström, J.; Olofsson, U. On the influence of car brake system parameters on particulate matter emissions. Wear 2018, 396, 67–74. [Google Scholar] [CrossRef]
  10. Perricone, G.; Matějka, V.; Alemani, M.; Valota, G.; Bonfanti, A.; Ciotti, A.; Olofsson, U.; Söderberg, A.; Wahlström, J.; Nosko, O.; et al. A concept for reducing PM10 emissions for car brakes by 50%. Wear 2018, 396, 135–145. [Google Scholar] [CrossRef]
  11. Sachse, H. Untersuchungen zu geeigneten Messmethoden und Prüfverfahren für die Bewertung bremseninduzierter Emissionen. In Proceedings of the XXXVII Internationales µ-Symposium, Bad Neuenahr, Germany, 26 October 2018. [Google Scholar]
  12. Agudelo, C. Systematic assessment of the influence of test setup, test procedure and friction material on brake emissions during inertia dynamometer tests. In Proceedings of the Europe’s Braking Conference and Exhibition, Milan, Italy, 13–15 June 2016. [Google Scholar]
  13. Kukutschová, J.; Moravec, P.; Tomášek, V.; Matějka, V.; Smolík, J.; Schwarz, J.; Seidlerová, J.; Safářová, K.; Filip, P. On airborne nano/micro-sized wear particles released from low-metallic automotive brakes. Environ. Pollut. 2011, 159, 998–1006. [Google Scholar] [CrossRef] [PubMed]
  14. Zum Hagen, F.H.F. Investigation of Brake Wear Particle Emissions on the Dynamometer and the Vehicle under Real-Driving Simulation. Ph.D. Thesis, Bergische Universität, Wuppertal, Germany, 2019. Available online: https://doi.org/10.25926/f1j5-fp87 (accessed on 14 September 2020).
  15. Zum Hagen, F.H.F.; Mathissen, M.; Grabiec, T.; Hennicke, T.; Rettig, M.; Grochowicz, J.; Vogt, R.; Benter, T. On-road vehicle measurements of brake wear particle emissions. Atmos. Environ. 2019, 217, 116943. [Google Scholar] [CrossRef]
  16. Mathissen, M.; Grochowicz, J.; Schmidt, C.; Vogt, R.; zum Hagen, F.H.F.; Grabiec, T.; Steven, H.; Grigoratos, T. A novel real-world braking cycle for studying brake wear particle emissions. Wear 2018, 414, 219–226. [Google Scholar] [CrossRef]
  17. Niemann, H.; Winner, H.; Asbach, C.; Kaminski, H.; Zessinger, M. System Identification Method for Brake Particle Emission Measurements of Passenger Car Disc Brakes on a Dynamometer; SAE Technical Paper Series; SAE: Warrendale, PA, USA, 2018. [Google Scholar]
  18. Eriksson, M.; Bergman, F.; Jacobson, S. On the nature of tribological contact in automotive brakes. Wear 2002, 252, 26–36. [Google Scholar] [CrossRef]
  19. Ostermeyer, G.P.; Müller, M. Surface Topography and Wear Dynamics of Brake Pads. In SAE Technical Paper Series 2006-01-3202, 24th Annual Brake Colloquium & Exhibition; SAE: Warrendale, PA, USA, 2006. [Google Scholar]
  20. Ostermeyer, G.-P.; Wilkening, L. Experimental Investigations of the Topography Dynamics in Brake Pads. SAE Int. J. Passeng. Cars Mech. Syst. 2013, 6, 1398–1407. [Google Scholar] [CrossRef]
  21. UNECE. PMP Web Conference 20 May. Non-Exhaust Brake Emissions—Aboratory Testing—Part 1: Inertia Dynamometer Protocol to Measure and Characterise Brake Emissions Using the WLTP-Brake Cycle: INFORMAL DOCUMENT GRPE-81-XX. Available online: https://wiki.unece.org/display/trans/PMP+Web+Conference+20+May (accessed on 21 August 2020).
  22. Niemann, H.; Winner, H.; Asbach, C.; Kaminski, H.; Zessinger, M. Untersuchung des Partikelemissionsverhaltens von Scheibenbremsen unter Transienten Lasten; VDI-Bericht 2356. In Proceedings of the VDI-Fachtagung Reifen-Fahrwerk-Fahrbahn 2019, Hannover, Germany, 16–17 October 2019. [Google Scholar]
  23. Niemann, H.; Winner, H.; Asbach, C.; Kaminski, H.; Zessinger, M. Application of a sampling enclosure for the identification of the influencing parameters on brake wear particle emissions. In Proceedings of the European Aerosol Conference, Göteborg, Sweden, 25–30 August 2019. [Google Scholar]
  24. Niemann, H.; Winner, H.; Asbach, C.; Kaminski, H.; Zessinger, M.; Brandau, M. Map based simulation of brake wear particle emissions. In Proceedings of the EuroBrake, Barcelona, Spain, 2–4 June 2020. [Google Scholar] [CrossRef]
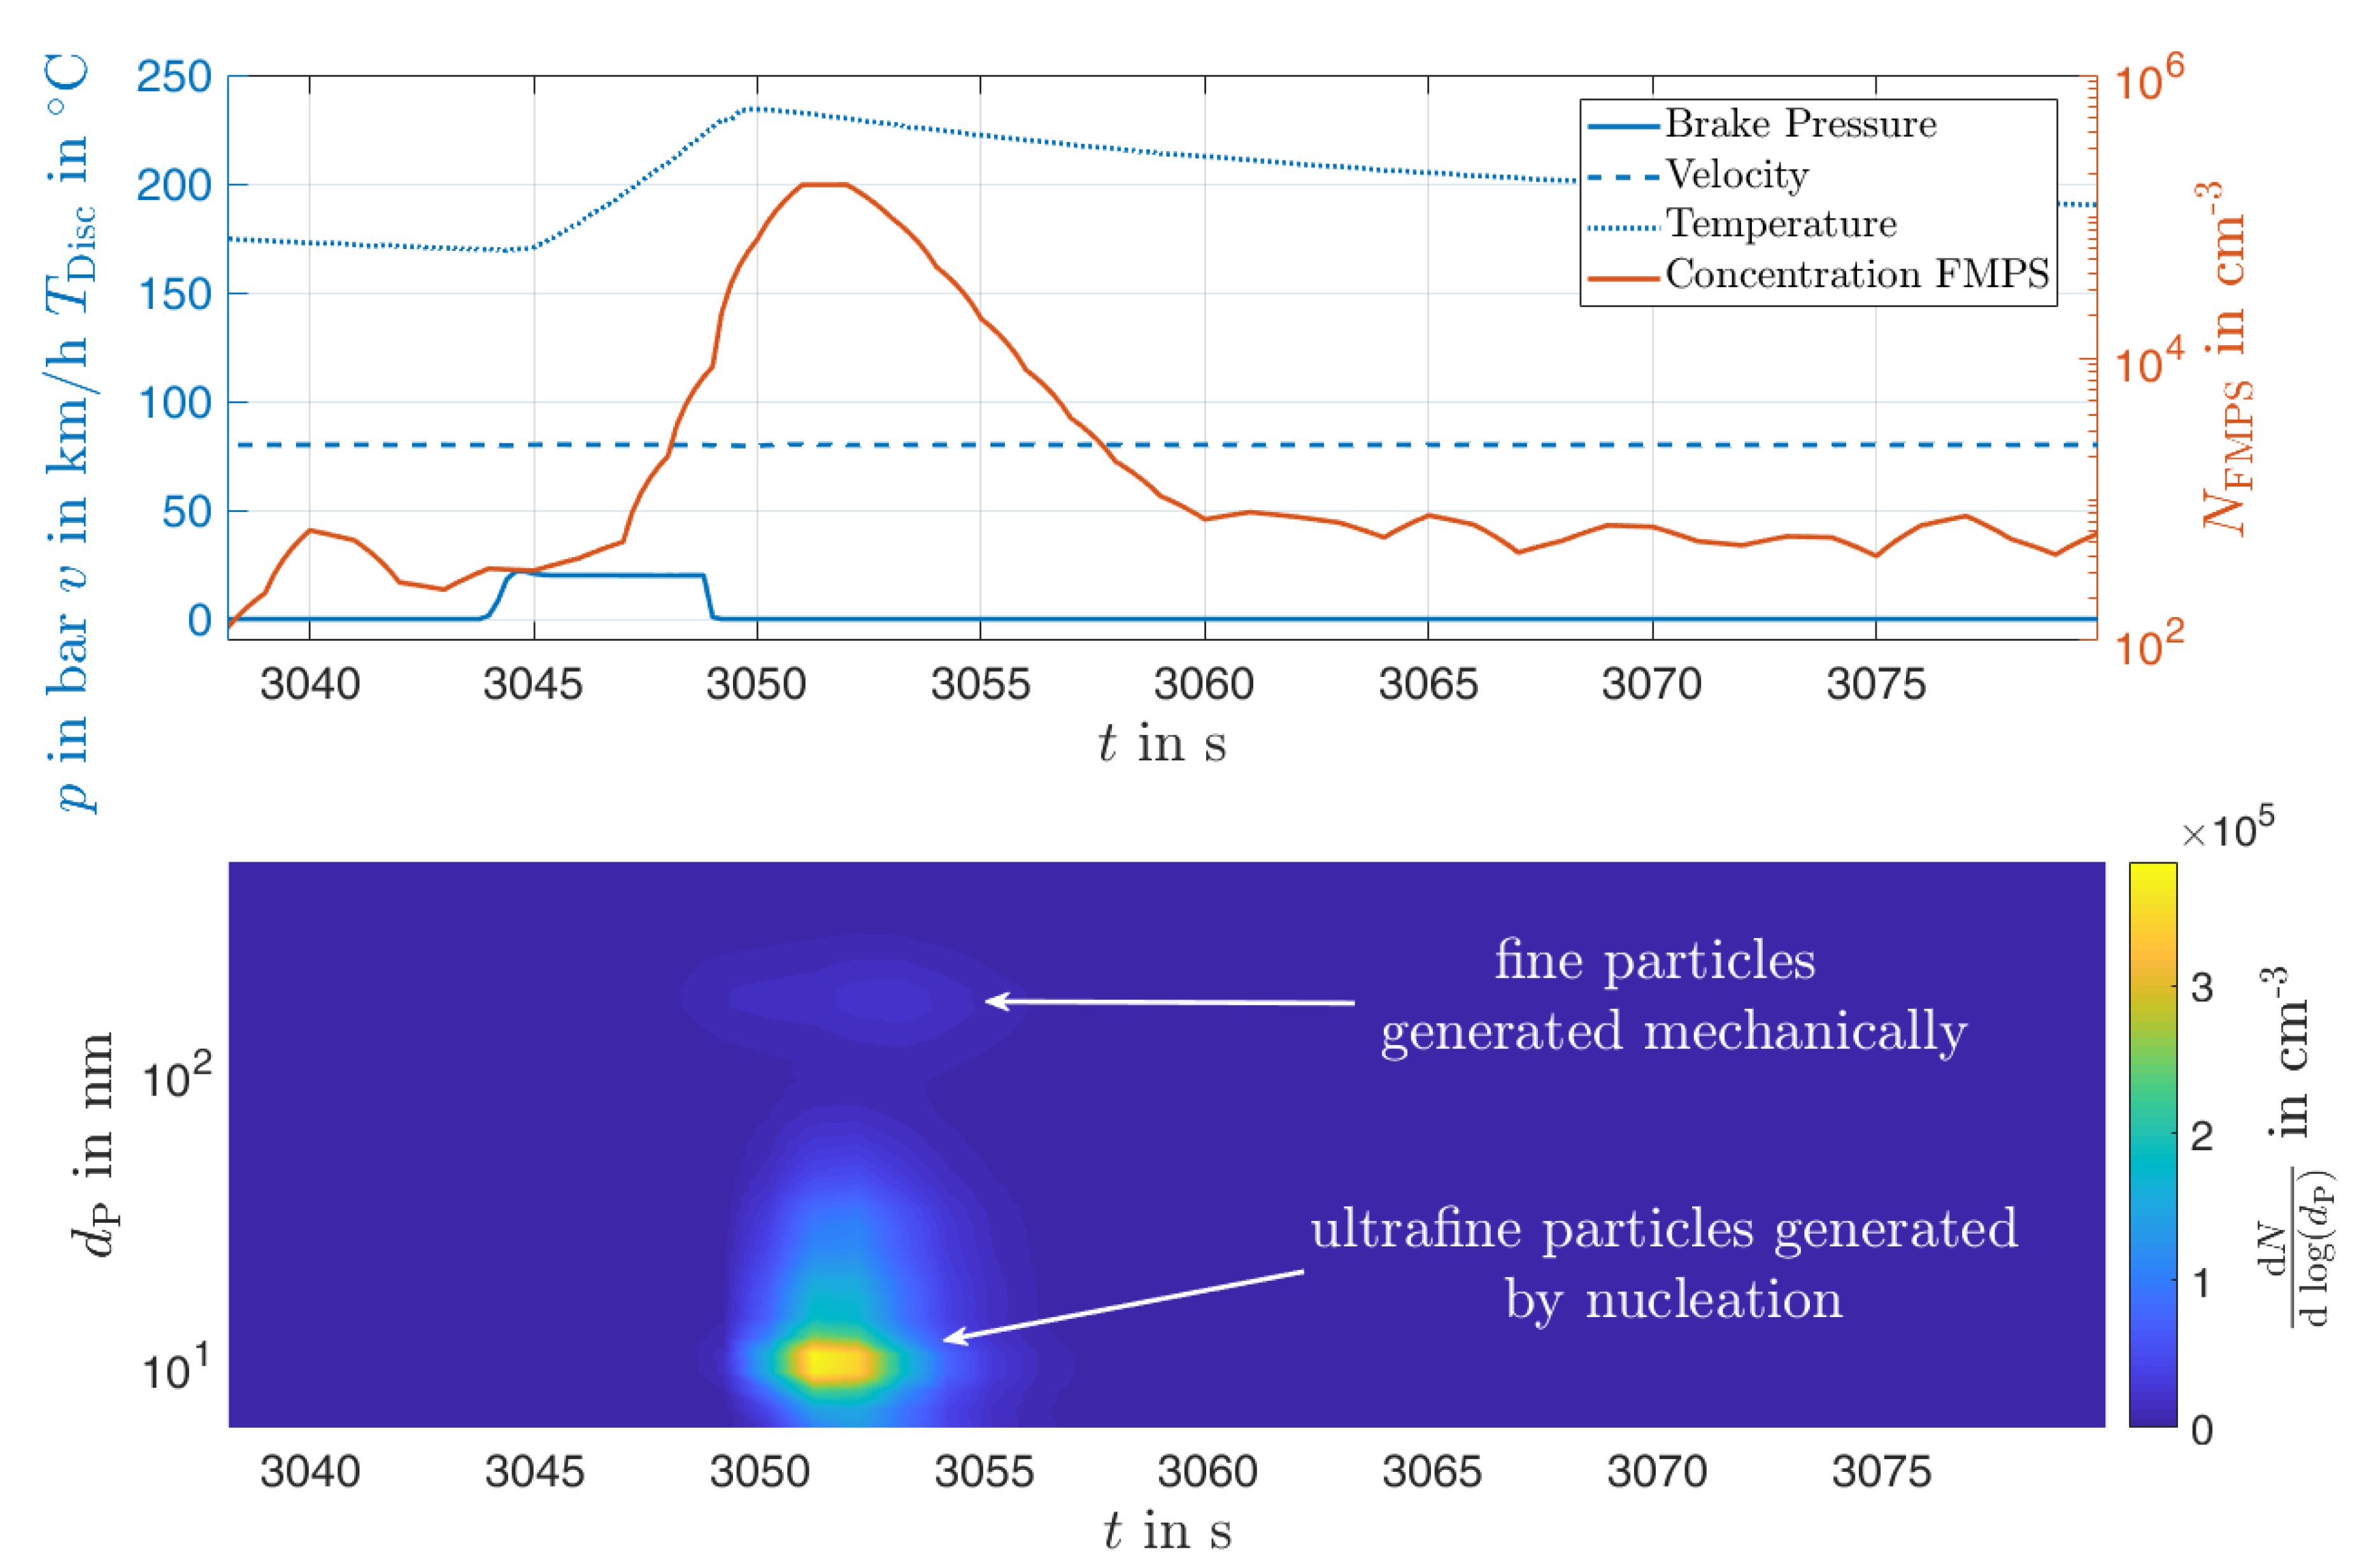
Figure 1. Time series of the concentration N measured by a Fast Mobility Particle Sizer (FMPS) during a nucleation event caused by a drag braking test (p: brake pressure, v: Vehicle speed, T: temperature) and time series of the size distribution measured by the FMPS (below). Although the FMPS also detects mechanically generated particles (peak at 200 nm) the major part of PM10 emissions is generated by particles with a diameter of 2 µm, as it was shown by Asbach et al. [3].
Atmosphere 11 01060 g001
Figure 2. Experimental setup for the measurement of brake wear particles on a dynamometer [3].
Atmosphere 11 01060 g002
Figure 3. Design of experiment for reproducibility investigation of PM10 temperature dependency.
Atmosphere 11 01060 g003
Figure 4. Total number of particles n emitted per brake event plotted versus the average disc temperature T during the brake event for conventional pad material with an organic binder.
Atmosphere 11 01060 g004
Figure 5. Time series of pressure p, velocity v, temperature T, concentration N, and size distribution during the three highest ascending temperature levels for pad material with an organic binder.
Atmosphere 11 01060 g005
Figure 6. Total number of particles n emitted per brake event plotted versus the average disc temperature during the brake event for pad material with an inorganic binder.
Atmosphere 11 01060 g006
Figure 7. Time series of brake pressure p, velocity v, temperature T, and OPS-concentration N of the PM10 relevant particles emitted by the pads with an organic binder. Although the shape of the temperature triangle is symmetric, the system’s answer in the shape of the OPS-concentration is asymmetric with a shift to the ascending side of the triangle, which indicates a change in the temperature dependency of the emission behavior. The aerosol was diluted by a factor of 18.8 before it was led to the OPS.
Atmosphere 11 01060 g007
Figure 8. Correlation of PM10 emission per brake event (calculated by the Optical Particle Sizer (OPS) size distribution and a density of 3.5 g/cm3), average disc temperature T per brake event, and the coefficient of friction µ for the pad material with an organic binder.
Atmosphere 11 01060 g008
Figure 9. Correlation of PM10 emission per brake event (calculated by the OPS size distribution and a density of 5.0 g/cm3) average disc temperature T per brake event and the coefficient of friction µ for the pad material with an inorganic binder.
Atmosphere 11 01060 g009
Figure 10. PM10 emissions per brake event averaged for each temperature step of the pad material with an organic binder and the operating point pair 1&4 (50 and 123 km/h).
Atmosphere 11 01060 g010
Figure 11. PM10 emissions per brake event averaged for each temperature step of the pad material with an organic binder and the operating point pair 2&3 (73 and 98 km/h).
Atmosphere 11 01060 g011
Figure 12. Correlation of PM10 emission per brake event calculated by the OPS size distribution and a density of 3.5 g/cm3, average disc temperature T per brake event, and the coefficient of friction µ for the pad material with an organic binder during the multiple triangle test below the critical temperature.
Atmosphere 11 01060 g012
Table 1. Pressure-velocity-operating points used for the advanced temperature triangle test.
Operating PointBrake Torque M in NmVelocity v in km/h
1112050
275374
356898
4455123