Article

Effect of Flow Rate and Filter Efficiency on Indoor PM2.5 in Ventilation and Filtration Control

1
Hanil Mechanical and Electrical Consultants Ltd., Seoul 07271, Korea
2
Department of Architecture, College of Engineering, Seoul National University, Seoul 07271, Korea
*
Author to whom correspondence should be addressed.
Atmosphere 2020, 11(10), 1061; https://doi.org/10.3390/atmos11101061
Submission received: 21 September 2020 / Accepted: 29 September 2020 / Published: 5 October 2020
(This article belongs to the Section Air Quality)

Abstract

:
Ventilation and filtration control play a critical role in determining indoor PM2.5 (particles less than 2.5 μm in aerodynamic diameter) concentrations of outdoor or indoor origin in residential environments. The objective of this study was to investigate the combined effects of flow rates and filter efficiency on indoor PM2.5 concentrations of residential buildings in Seoul, Korea. Using a particle model based on a mass–balance equation, parametric analysis was performed to examine indoor PM2.5 concentrations according to flow rates and filter efficiency under a wide range of outdoor concentrations and indoor generations. Results showed that ventilation control equipped with a medium–efficiency filter was as effective as that with a high-efficiency filter under normal outdoor concentration and high indoor generation rate conditions. It is not recommended to apply a low-efficiency filter because indoor concentration increases rapidly as outdoor PM2.5 increases when ventilation flow rate is high. For filtration control, it is important to increase both flow rate and filter efficiency in order to improve indoor PM2.5 concentration.

1. Introduction

Human exposure to high particle concentrations was identified as an important cause of various diseases, including asthma, lung cancer, cardiovascular disease, coronary heart disease, and premature death [1,2,3]. In particular, particles less than 2.5 μm in aerodynamic diameter (PM2.5) have a larger surface area than that of coarse particles, thus, they are more likely to adsorb harmful substances such as heavy–metal elements on the surface while staying in the atmosphere for a long time [4]. Moreover, smaller particles can penetrate deeper into the human body and therefore have a higher potential of hazardous health risk than that of larger particles [5,6].
Since people spend most of their time indoors, indoor particle concentrations need to be managed below acceptable levels to minimize exposure to particle pollutants. Several studies evaluated parameters that affect indoor PM level and potential control strategies. Fisk et al. [7] evaluated indoor-fine-particle concentration depending on filter efficiency. Howard–Reed et al. [8] analyzed the effect of ventilation and filtration on indoor particle concentration reduction under different indoor generation conditions and concluded that filtering with an air cleaner reduces indoor particle concentration more effectively than ventilation does. Jamriska et al. [9] analyzed the impact of the ventilation rate on indoor PM concentration according to four different indoor and outdoor conditions: (1) high outdoor and low indoor concentration, (2) high outdoor and high indoor concentration, (3) low outdoor and high indoor concentration, and (4) low outdoor and low indoor concentration. Ben-David and Waring [10] reported that an outdoor air economizer and filter efficiency could greatly impact indoor PM2.5 concentration.
To date, relatively few studies have investigated combined effects of air-flow rate and filter efficiency on indoor particle concentration when a ventilation system and filtration device are applied. Ruan and Rim [11] examined the combined effects of outdoor air-flow rate and filter efficiency in controlling outdoor–pollutant concentrations, and proposed proper filter efficiency and ventilation flow rate to control indoor PM2.5 during extreme outdoor conditions. Ren et al. [12] analyzed the performance of five control strategies, including higher-level filters, minimal outdoor air-flow rate, portable air cleaners, and combinations of these options to reduce PM2.5 exposure in offices. The results of two studies [11,12] showed that it is advantageous to reduce ventilation rates and increase filter efficiency because indoor PM2.5 concentration increases mainly due to outdoor origin particles rather than indoor origins in the office environments.
Unlike office environments, residential indoor PM2.5 increases not only by penetration from outdoors but also by generation from indoor combustion sources, including burning of candles [13,14,15], cooking [14,15,16,17], and smoking [13,18,19]. Since indoor-sourced particles contribute substantially to PM2.5 concentrations of the residential environment, indoor PM2.5 level is determined by both outdoor and indoor conditions, and the combined effects of parameters associated to control. Zhong et al. [20] analyzed the effect of the air-flow rate and filter efficiency of ventilation systems in residential buildings and showed the different effects of ventilation on indoor- and outdoor-sourced PM2.5. Results indicated that an increase in ventilation rates reduced the exposure concentration from indoor sources, while increasing exposure concentration from outdoor sources. However, Zhong’s study only considered ventilation control and proceeded under indoor and outdoor environmental conditions limited to three outdoor–particle concentration levels, and an identical indoor particle generation schedule. The objectives of this study are to (1) evaluate the combined effects of ventilation- and filtration-control parameters on indoor PM2.5 concentrations; and (2) to present recommendations for operation of ventilation and filtration system in accordance with outdoor and indoor PM2.5 conditions. For this purpose, indoor PM2.5 was analyzed according to the flow rates and filter efficiency of the ventilation and filtration system in a typical Korean residential building, in a wide range of indoor and outdoor PM2.5 conditions. The results of this study contribute to understanding the effect of control parameters on indoor PM2.5 and addressing the basic control strategies for ventilation and filtration system of residential building.

2. Method

Simulations were carried out using a particle model in order to analyze the combined effects of ventilation and filtration control parameters on indoor PM2.5 concentrations in residential buildings. The research process of Figure 1 is as follows:
(1)
Describe an indoor particle model on the basis of a mass–balance equation.
(2)
Estimate parameters by experiments.
(3)
Validate estimated parameters using indoor particle model and independently measured data.
(4)
Determine the valid range of outdoor and indoor PM2.5 conditions in residential buildings.
(5)
Analyze combined effect of ventilation and filtration system control parameters using a simulation model and recommend a ventilation and filtration system operation according to the indoor and outdoor PM2.5 conditions.

2.1. Mass–Balance Model

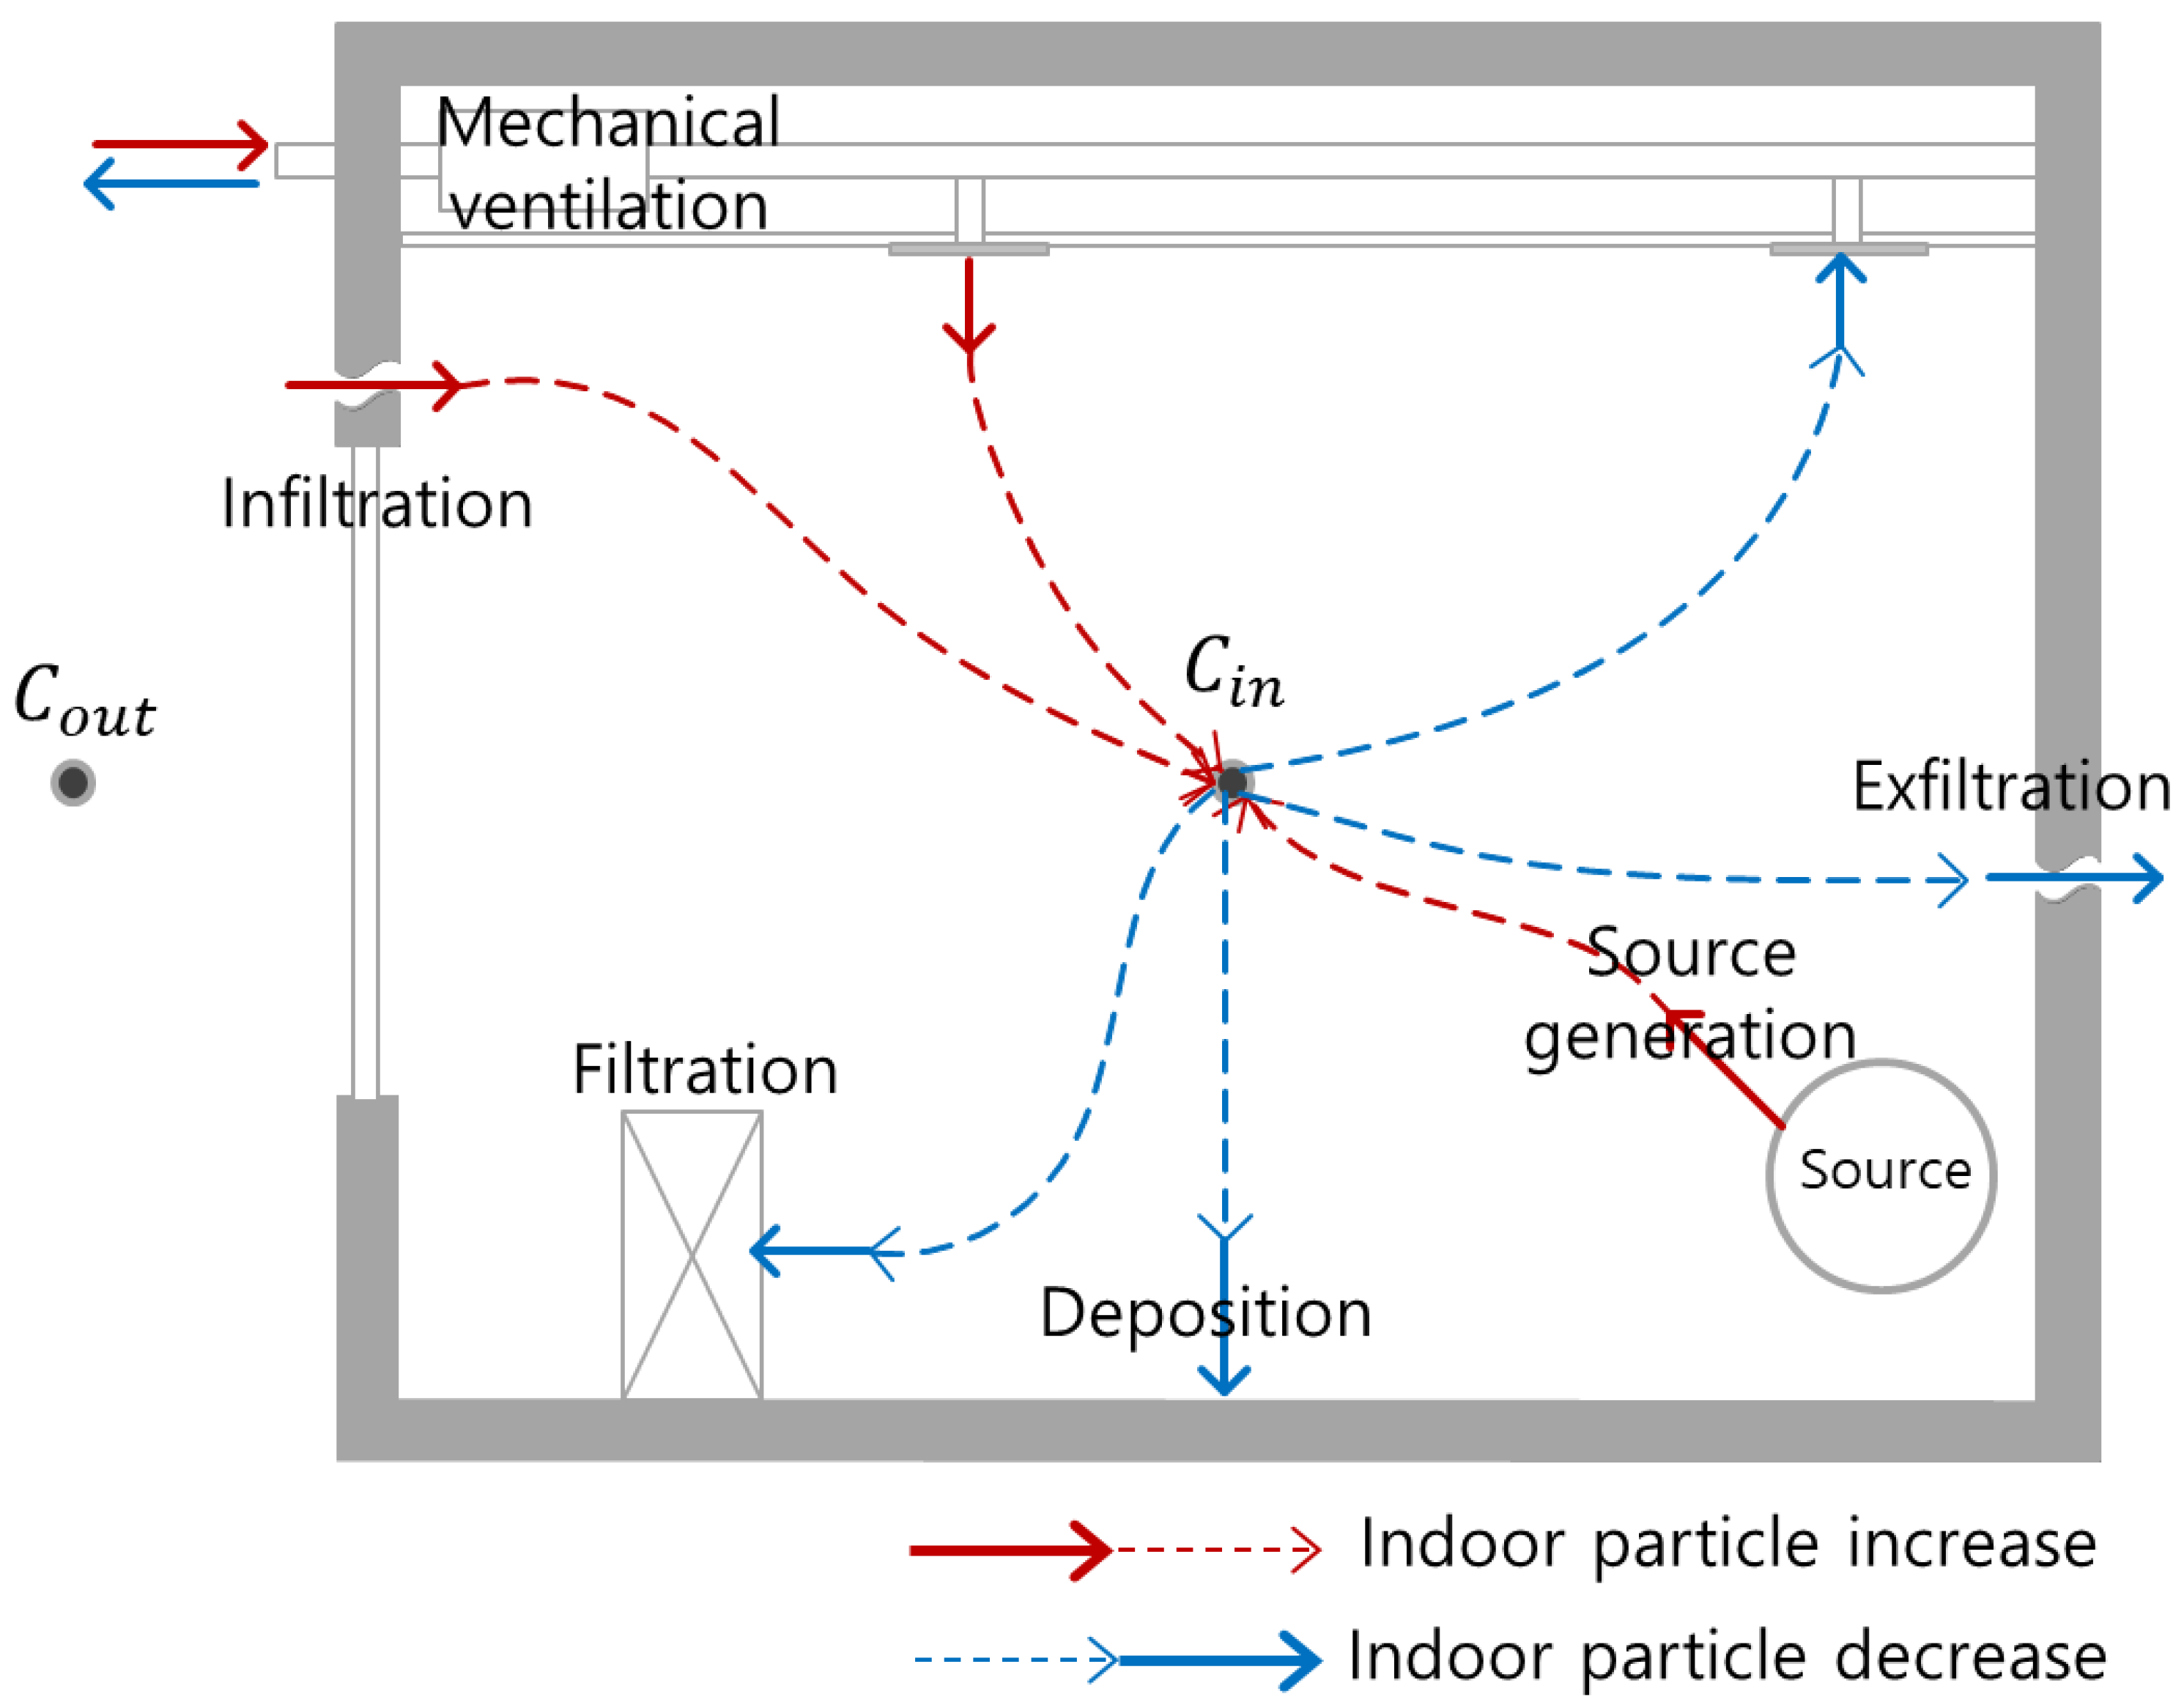
A mass–balance model was used to examine the influence of parameters on indoor PM2.5 concentrations and a MATLAB program was developed for generating indoor PM2.5 concentrations depending on Q V ,   Q f ,   η v ,   η f ,   C o u t   a n d   G . Figure 2 shows the mechanism of indoor particle concentration in a space equipped with a mechanical ventilation system and a filtration system, and indoor particle concentration can be calculated using Equation (1). The first and second terms of Equation (1) describe the outdoor source, which includes outdoor particles transported to the building via infiltration and ventilation. P is defined as the fraction of particles in the infiltration air that passes through the building shell, which acts as a filter. G represents indoor–generation rates. The rest of the terms in Equation (1) explain indoor particle removal due to exfiltration, ventilation, deposition onto indoor surfaces, and indoor air filtration system. k is defined as the fraction of particles settled onto indoor surfaces during an hour:
d C i n d t = P λ C o u t + ( 1 η v ) Q V V C o u t + G V λ C i n Q V V C i n k C i n η f Q f V C i n
  • C i n : indoor particle concentration ( μ g / m 3 );
  • C o u t : outdoor–particle concentration ( μ g / m 3 );
  • λ : infiltration/exfiltration rate ( h 1 );
  • P : penetration coefficient ( );
  • η v : particle removal efficiency of ventilation system ( );
  • η f : particle removal efficiency of filtration system ( );
  • Q v : ventilation air-flow rate (m3/h);
  • Q f : filtration air-flow rate (m3/h);
  • G : indoor generation rate ( μ g /h);
  • k : deposition rate ( h 1 );
  • V : room volume ( m 3 );
  • t : time ( h ).

2.2. P, k, ηv, and ηf Estimation

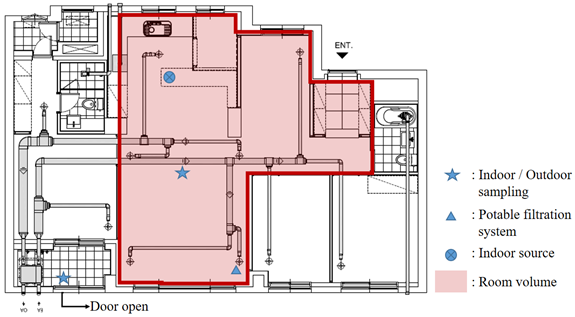
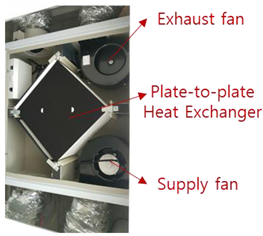
Equation (1) includes various parameters to be fitted. Among the parameters, P and k vary greatly depending on particle size, building characteristics, and environmental conditions. P and k of PM2.5 were presented by several researchers [21,22,23,24,25,26,27]; however, P and k are also affected by building characteristics. The structure and envelop types of Korean housing is different from those of residential buildings tested in previous documents, and few studies have suggested P and k values of PM2.5 for houses in Korean [24]. Apartments are the most common type of housing in Korea (more than 50 percent of the total housing type is occupied by apartments) [28]. Most apartments of Korea have a common size (59 or 84) and common structure type (reinforce concreate). Finishing materials also have a common type. Walls and ceilings are finished with wall paper and floors are finished with wood. Recent apartments have similar plan with three- or four-bay (bay means the number of rooms facing outdoors in line with the living room, including the living room) and a mechanical ventilation system is mandatory. New apartments have high-sealed windows to save cooling and heating energy, which could affect the penetration coefficient [29]. To obtain coefficients P and k as well as filter efficiency of system in a new apartment house in Korea, experiments were carried out for 20 days from 4 July 2017 to 23 July 2017. The apartment was equipped with a heat recovery ventilation system and portable air cleaning system, which are widely used in Korean dwellings. A ventilation system delivered outdoor air to each room by supply duct and extract indoor air from living room and dress room by exhaust duct. Two fans (supply fan and exhaust fan) were installed in the ventilation unit to deliver air and flow of supply air and exhaust air were independent in the duct system. A portable air filtration device was applied and located in the living room. Both the ventilation and filtration system provide flow rates in three stages. The experiment was conducted on a portion of the apartment (inside area of the red line of Figure 3a) that could be assumed as a single zone (the door gap was sealed by clear tape to prevent airflow between the rooms). Specifications for test building and systems are summarized in Table 1 and Table 2.
Coefficients P and k could be obtained by fitting the natural decay curve using coincidently measured outdoor concentration and air exchange rate (ACH) [30,31,32]. The location and pictures of measurements of indoor and outdoor concentrations and air–exchange rates are shown in Table 1 and Figure 3. For these tests, candles were burned to generate PM2.5 and all windows were opened to introduce outdoor PM2.5 at the beginning, and indoor air was stirred by fans for a well-mixed air condition. Data were collected during the period of indoor concentration, showing a natural decay curve after the source was turned off and all windows were closed. Fans were also turned off during data collection to obtain the deposition rate while forced airflow was excluded. Indoor and outdoor particle concentrations were collected simultaneously every 2 min by using two different instruments: (1) particle size distribution and number concentration in a size range of 0.3–10 μm were measured using optical particle counters (AeroTrak Handheld Particle Counter Model 9306, TSI, U.S.A.); (2) PM2.5 concentrations were collected by aerosol monitors (Sidepak personal aerosol monitor Model AM510, TSI, USA). Prior to the start of the experiment, units were set side by side and calibrated with zero filters, and cross–checked to ensure similar results were provided. Air exchange rates in the residence were also measured during the experiment using a tracer gas (SF6) monitor (Photoacoustic multi gas monitor Model INNOVA 1314/1412, INNOVA AirTech Instruments, Denmark) every 2 min.
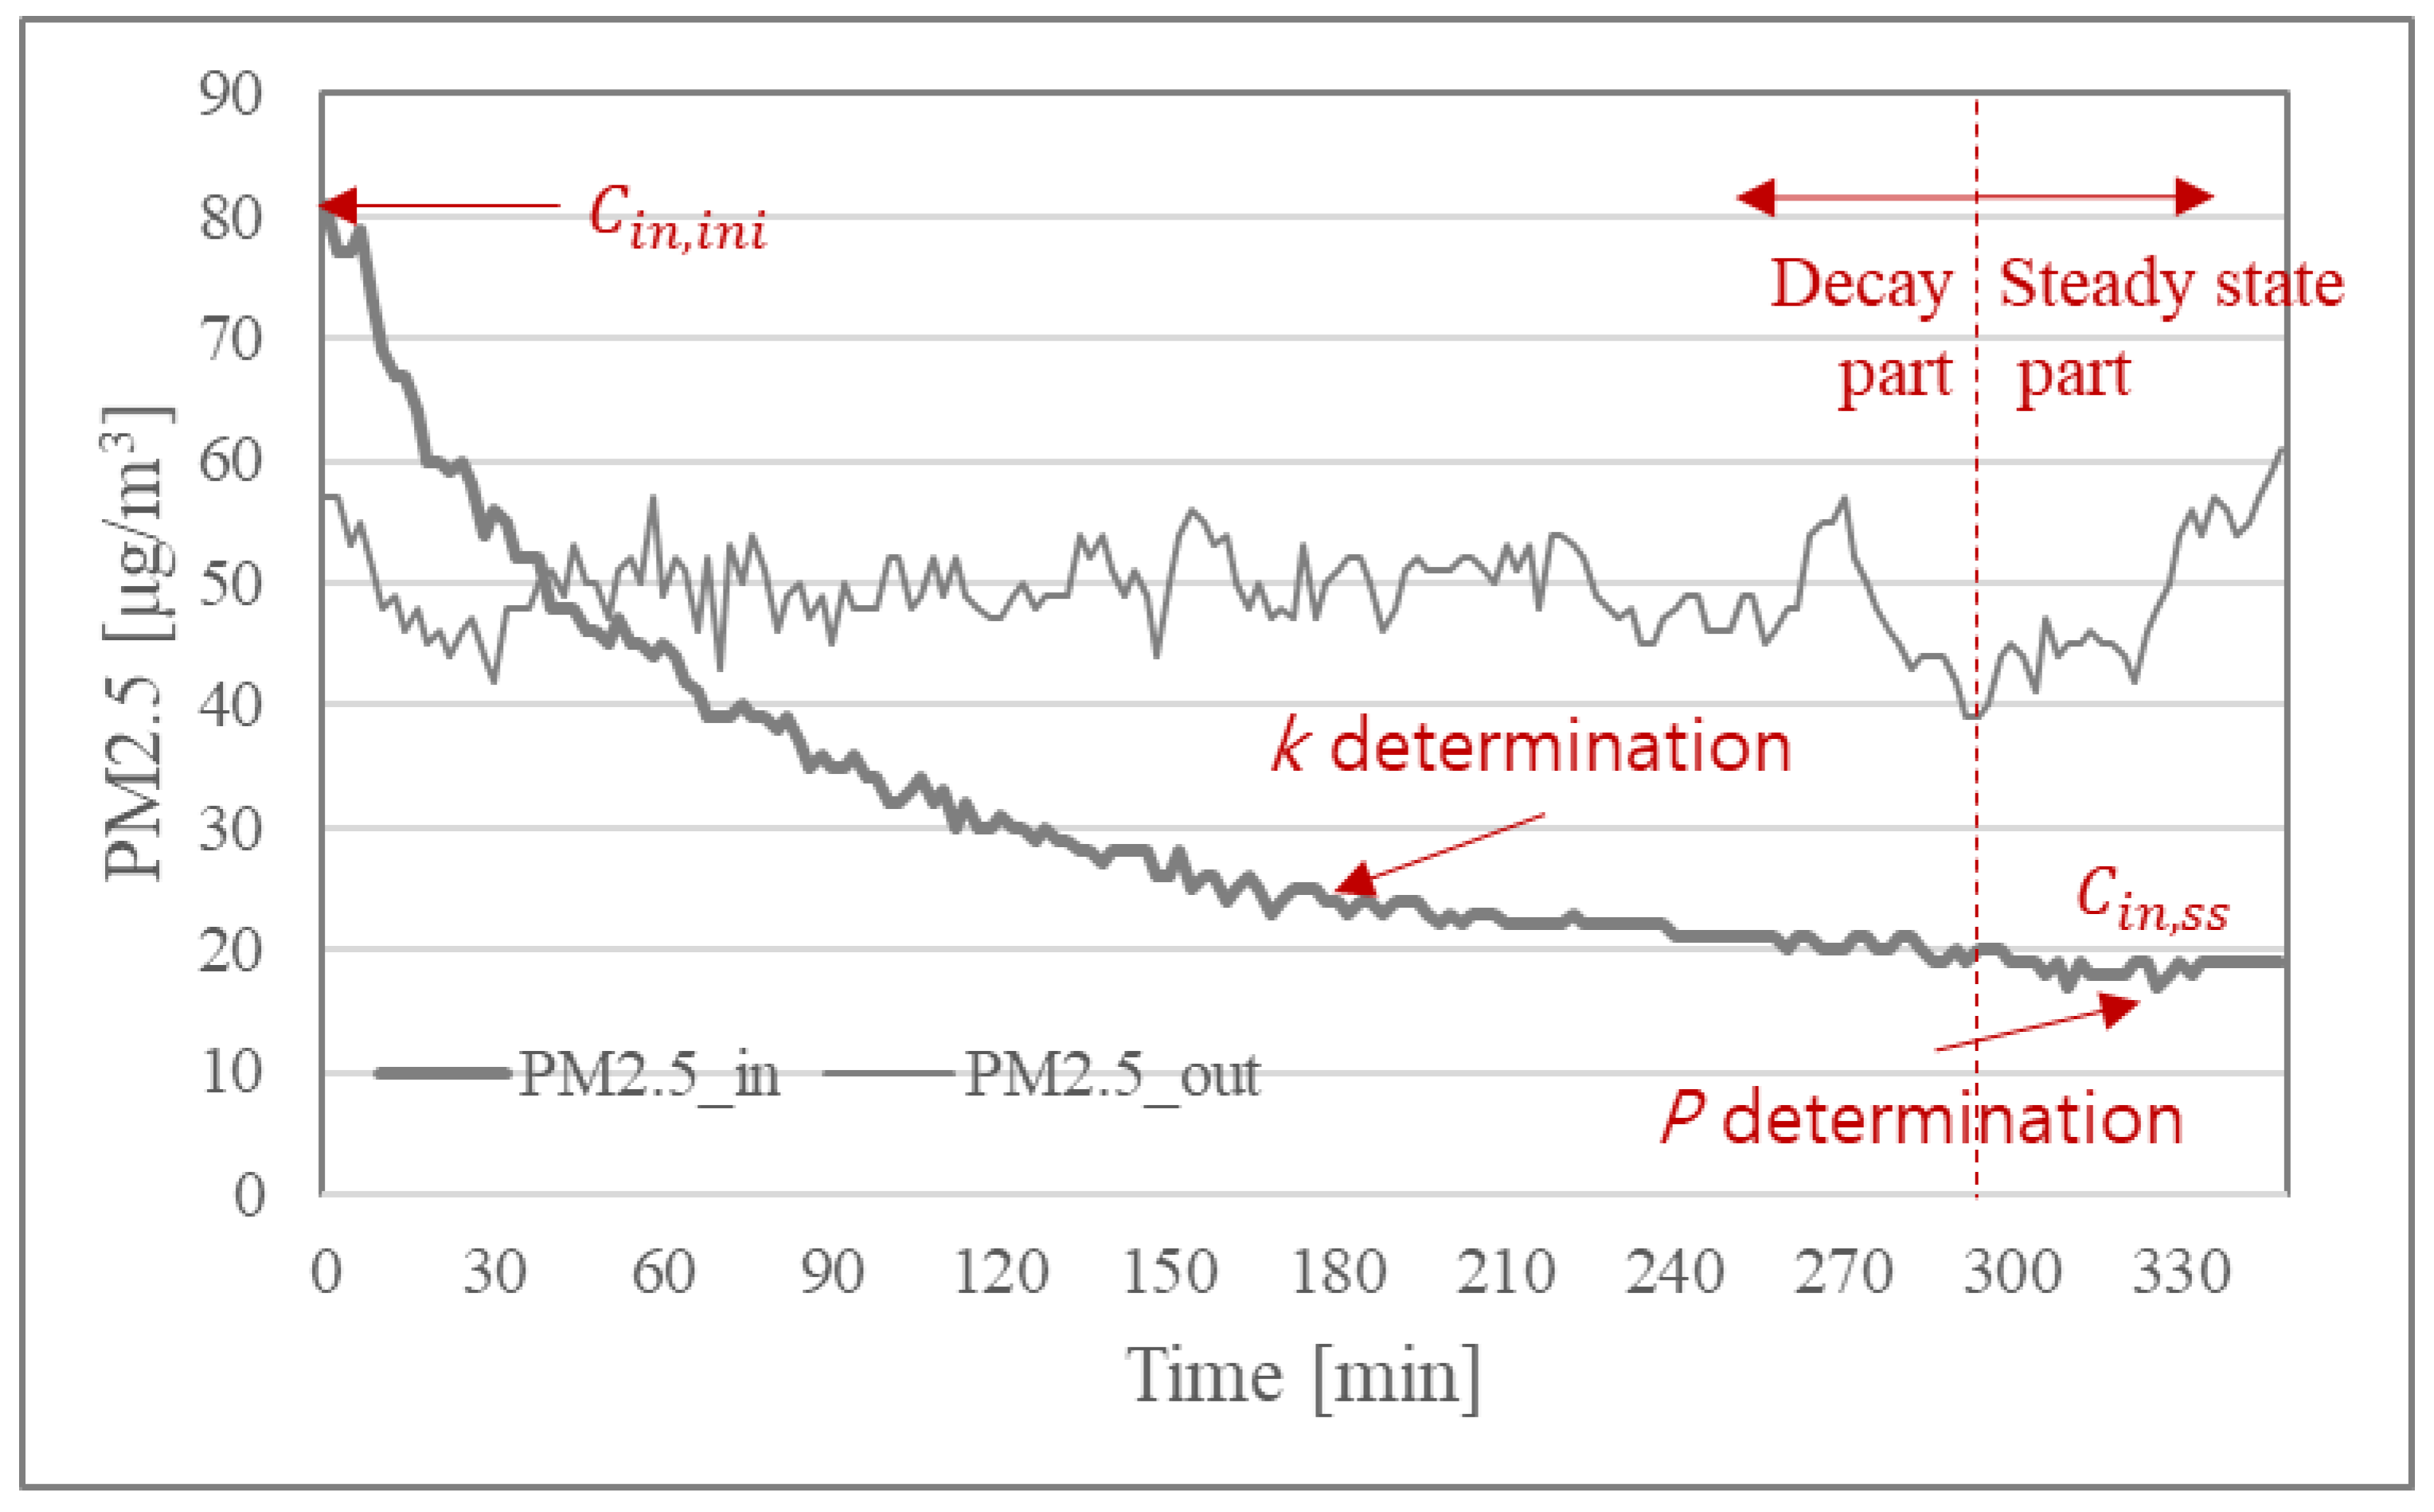
The deposition rate was determined using data showing the decay curve after the indoor PM2.5 concentration rose significantly above the normal concentration, and the penetration coefficient was determined using data when the indoor PM2.5 concentration reached equilibrium, as shown in Figure 4. Assuming that P and k are constant, that the ventilation system, filtration system, and indoor generation are turned off, and considering that λ and C o u t are stable, the differential equation of Equation (1) can be solved by Equation (2), and PM2.5 concentration at equilibrium can be presented by Equation (3). By taking natural logarithm on both sides of Equation (2), Equation (4) can be obtained.
C i n = C i n , s s + ( C i n , i n i C i n , s s ) e ( λ + k ) t
C i n , s s = P λ C o u t ( λ + k )
  • C i n , s s : indoor particle concentration at steady–state condition ( μ g / m 3 );
  • C i n , i n i : initial indoor particle concentration ( μ g / m 3 ).
ln ( C i n C i n , s s ) = ( λ + k ) t + l n ( C i n , i n i C i n , s s )
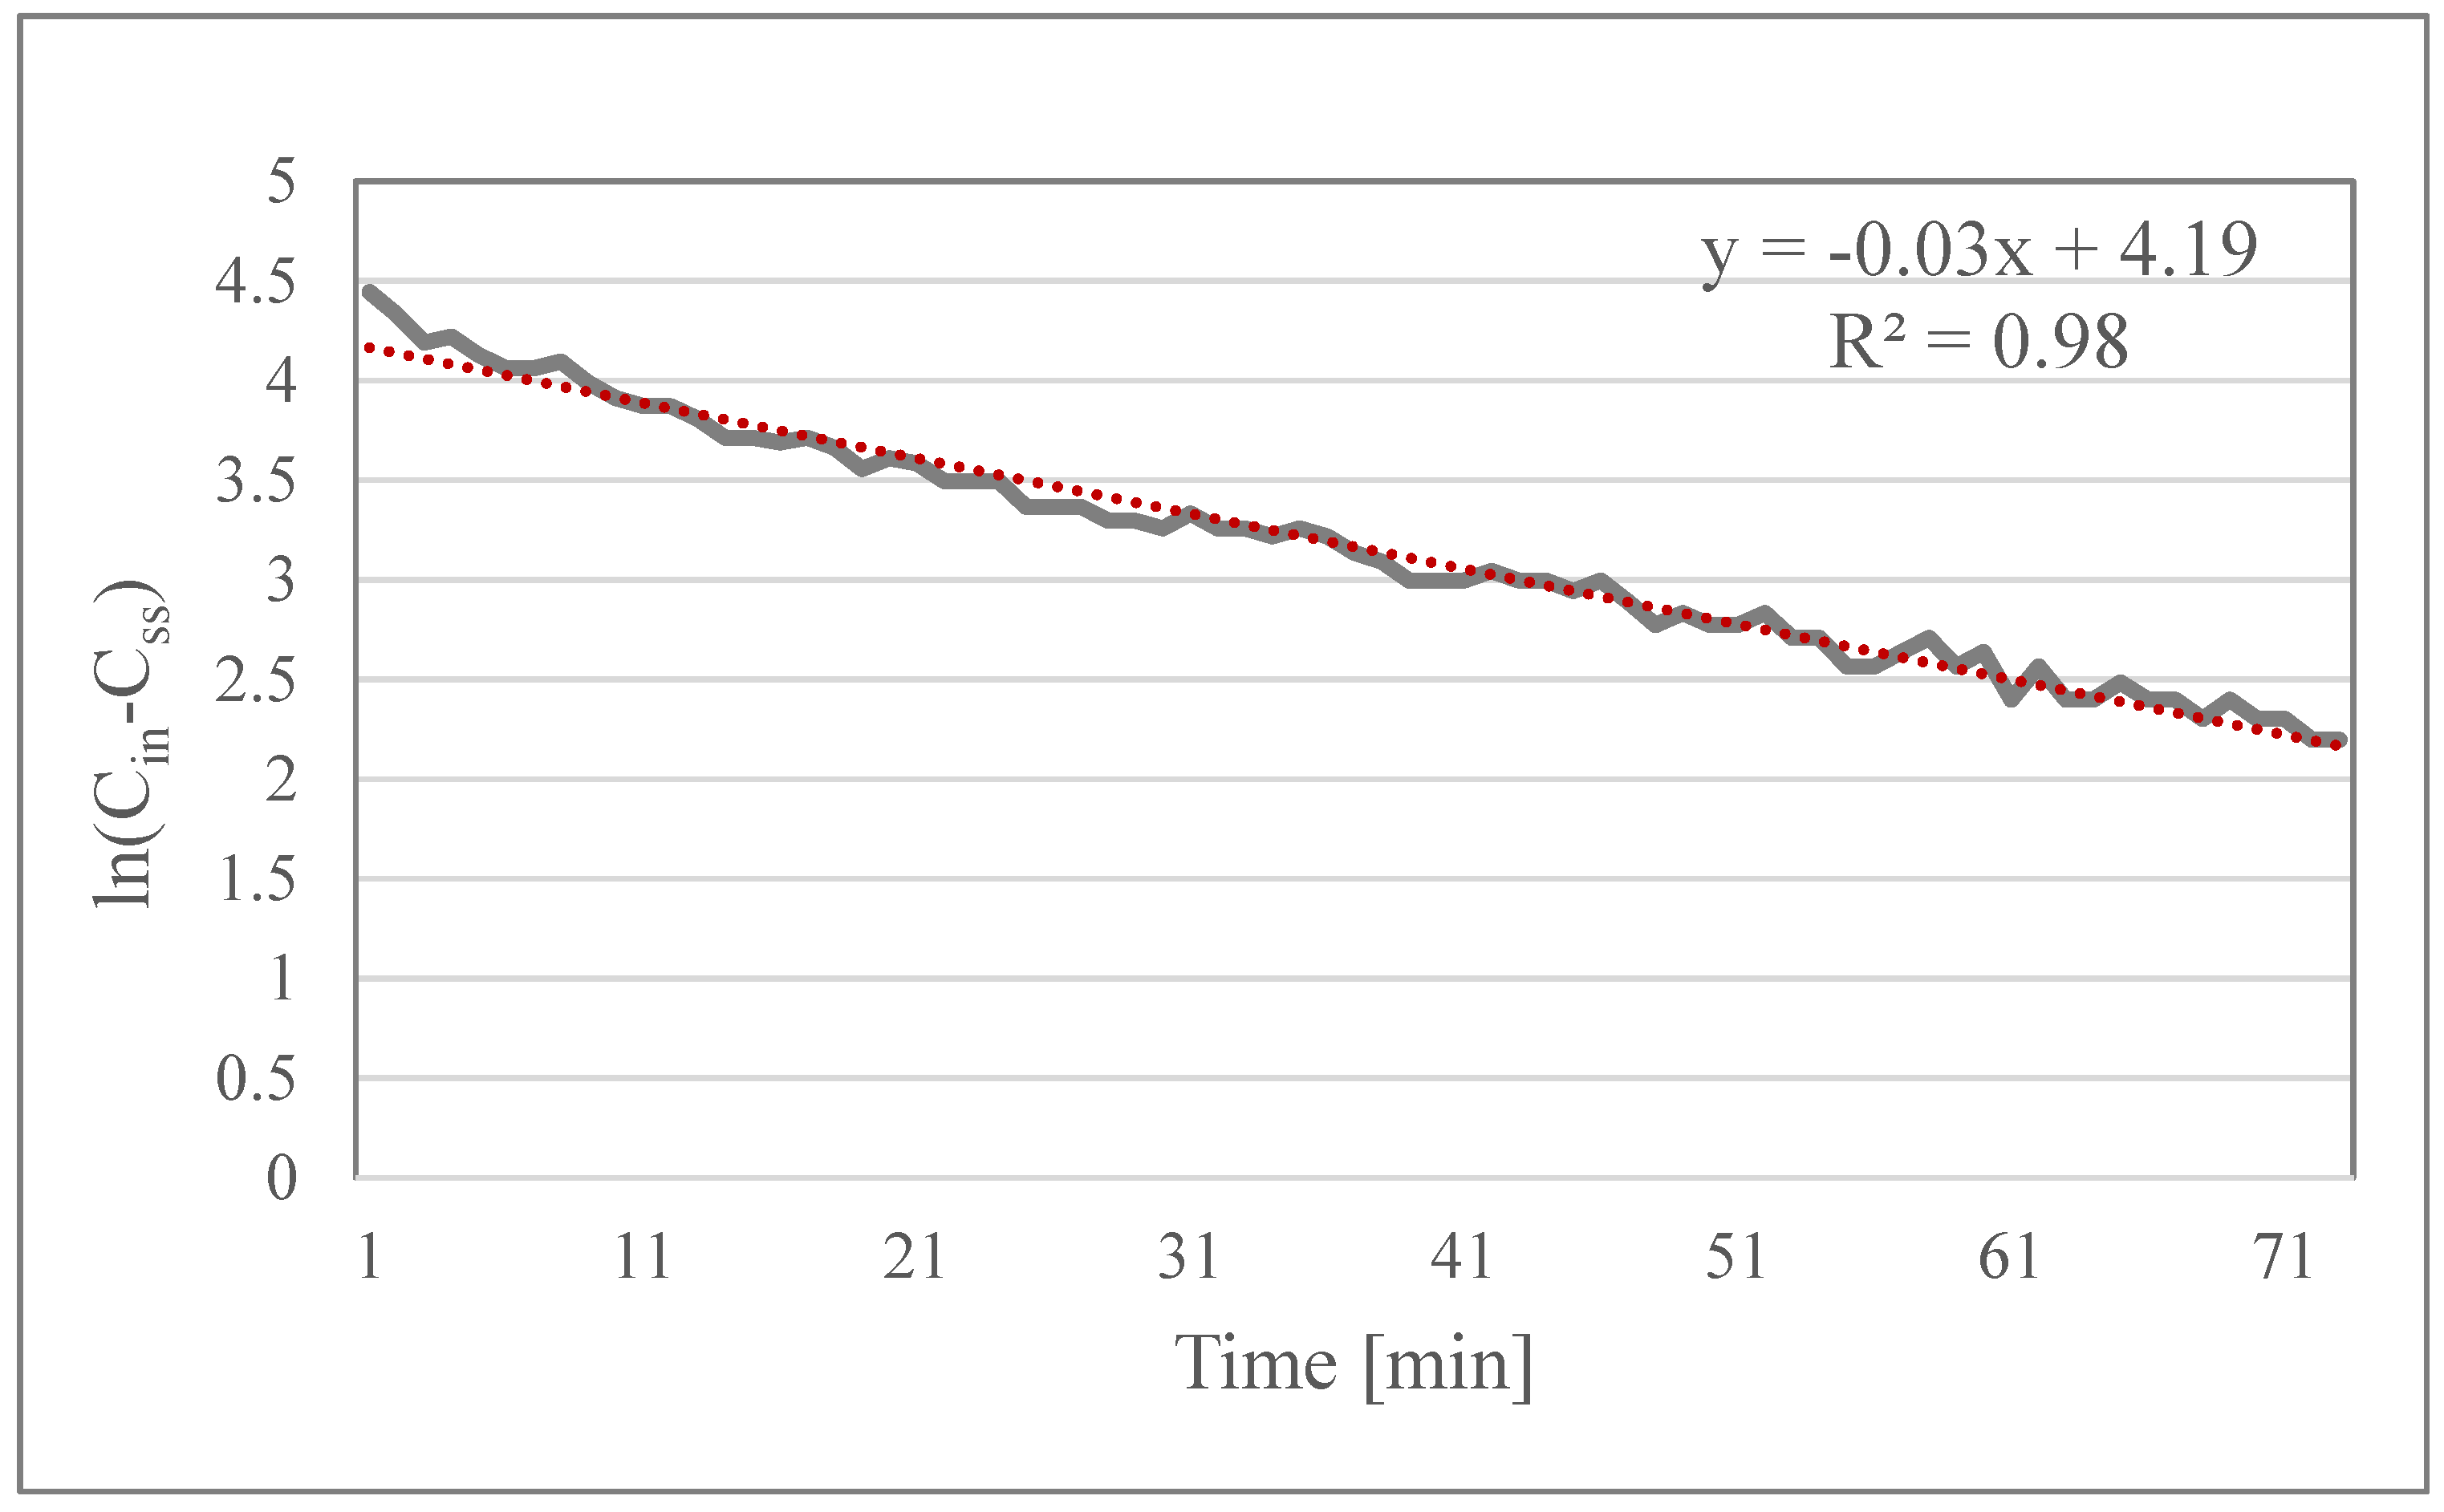
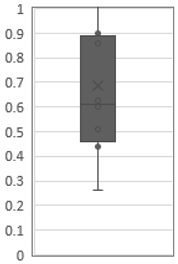
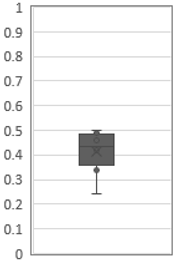
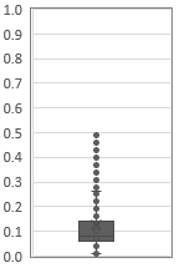
In the graph of Equation (4) shown in Figure 5, the slope of the fitting line represents decay rate, the sum of λ and k. The deposition rate was calculated by subtracting λ (simultaneous measurement) from the decay rate, and then, using λ   and   k, the penetration coefficient was obtained using Equation (3). It should be noticed that the slop of Figure 5 is expressed in min−1 and it should be converted into h−1. A total of eight identical sets of experiments were carried out to obtain coefficients P and k, and results are given in Table 3. The arithmetic mean values (p = 0.7 and k = 0.4) of data were applied to the simulation model. These values were within the valid range compared to other studies [21,22,23,24,25,26,27].
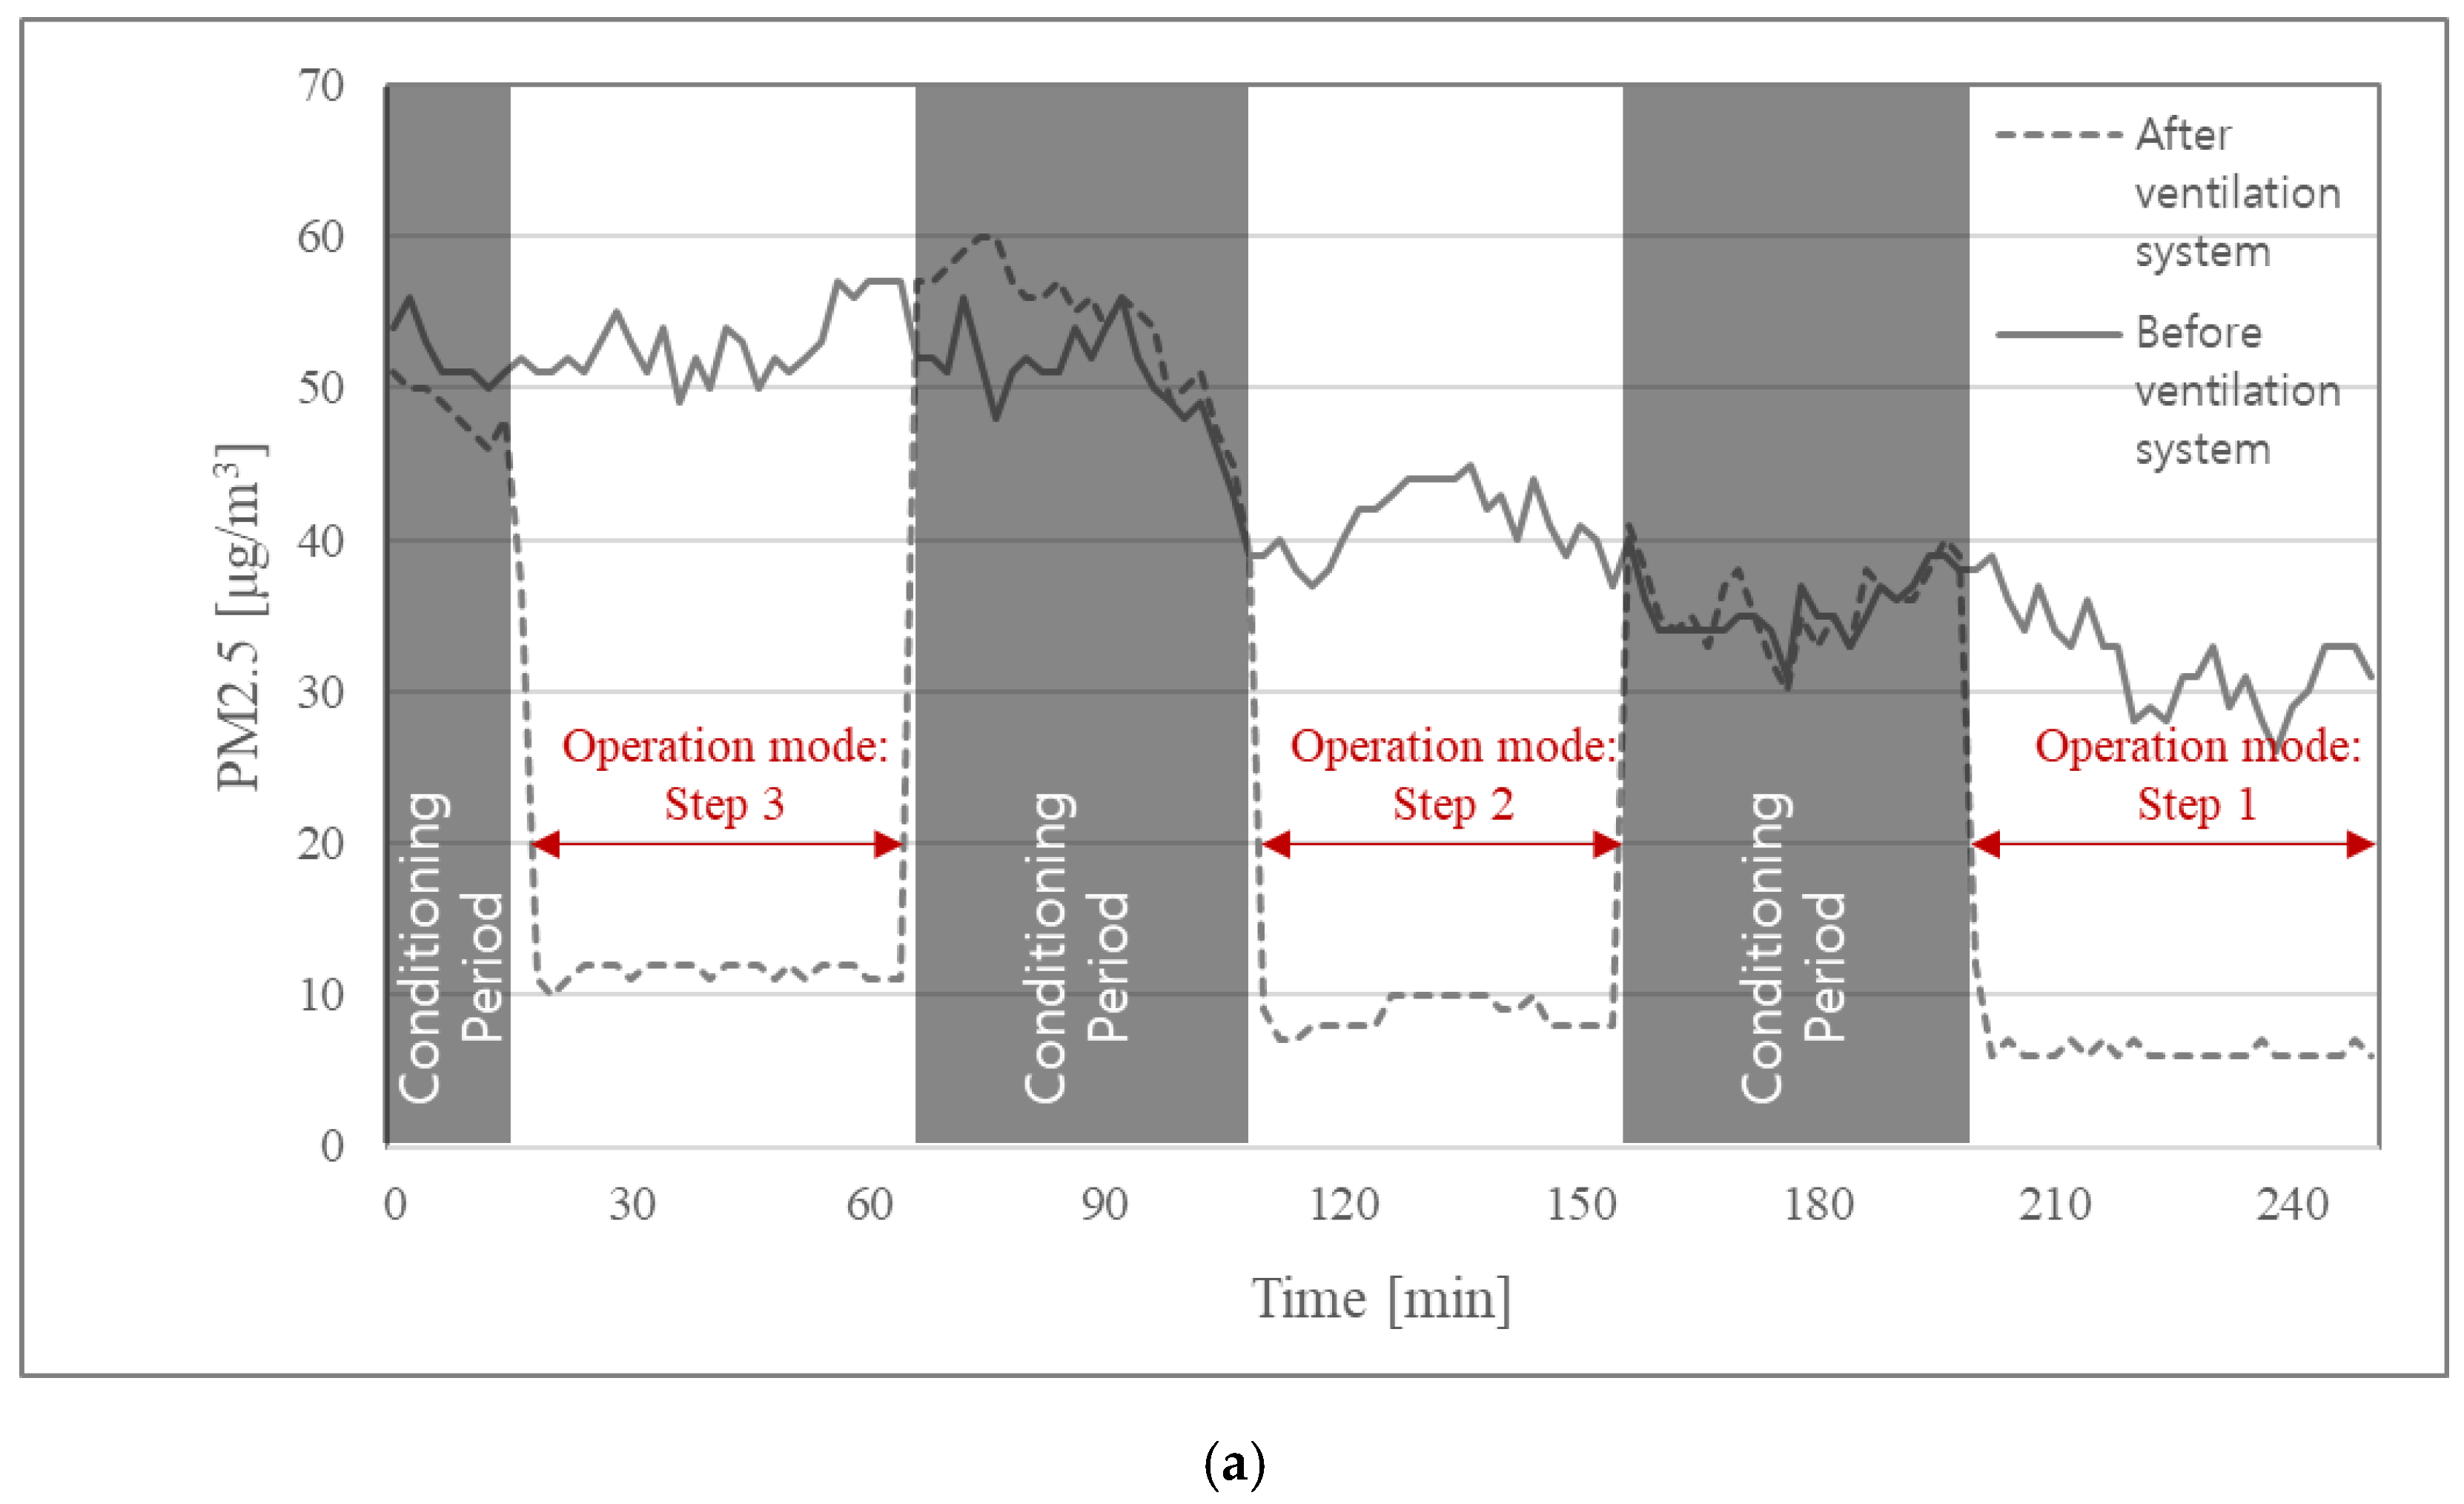
To obtain the filter removal efficiency of the ventilation system, η v , outdoor concentration and the concentration of discharged air from the diffuser (shown in Figure 3e) were measured, and the ratio of removed and incoming particle concentrations was calculated using Equation (5). The removal efficiency of air cleaning system η f was also estimated in the same manner as η v by using measured particle concentration of incoming and discharge air of the filtration system (shown in Figure 3f). Since filter efficiency is affected by air velocity passing through the filters, experiments were conducted under the condition of three different air-flow rates as shown in Figure 6, and results are shown in Table 4.
η = 1 C o u t l e t C i n l e t
  • η : filter efficiency of ventilation system or filtration system ( μ g / m 3 );
  • C o u t l e t : particle concentration of outlet of ventilation or filtration system ( μ g / m 3 );
  • C i n l e t : particle concentration of inlet of ventilation or filtration system ( μ g / m 3 ).

2.3. Validation

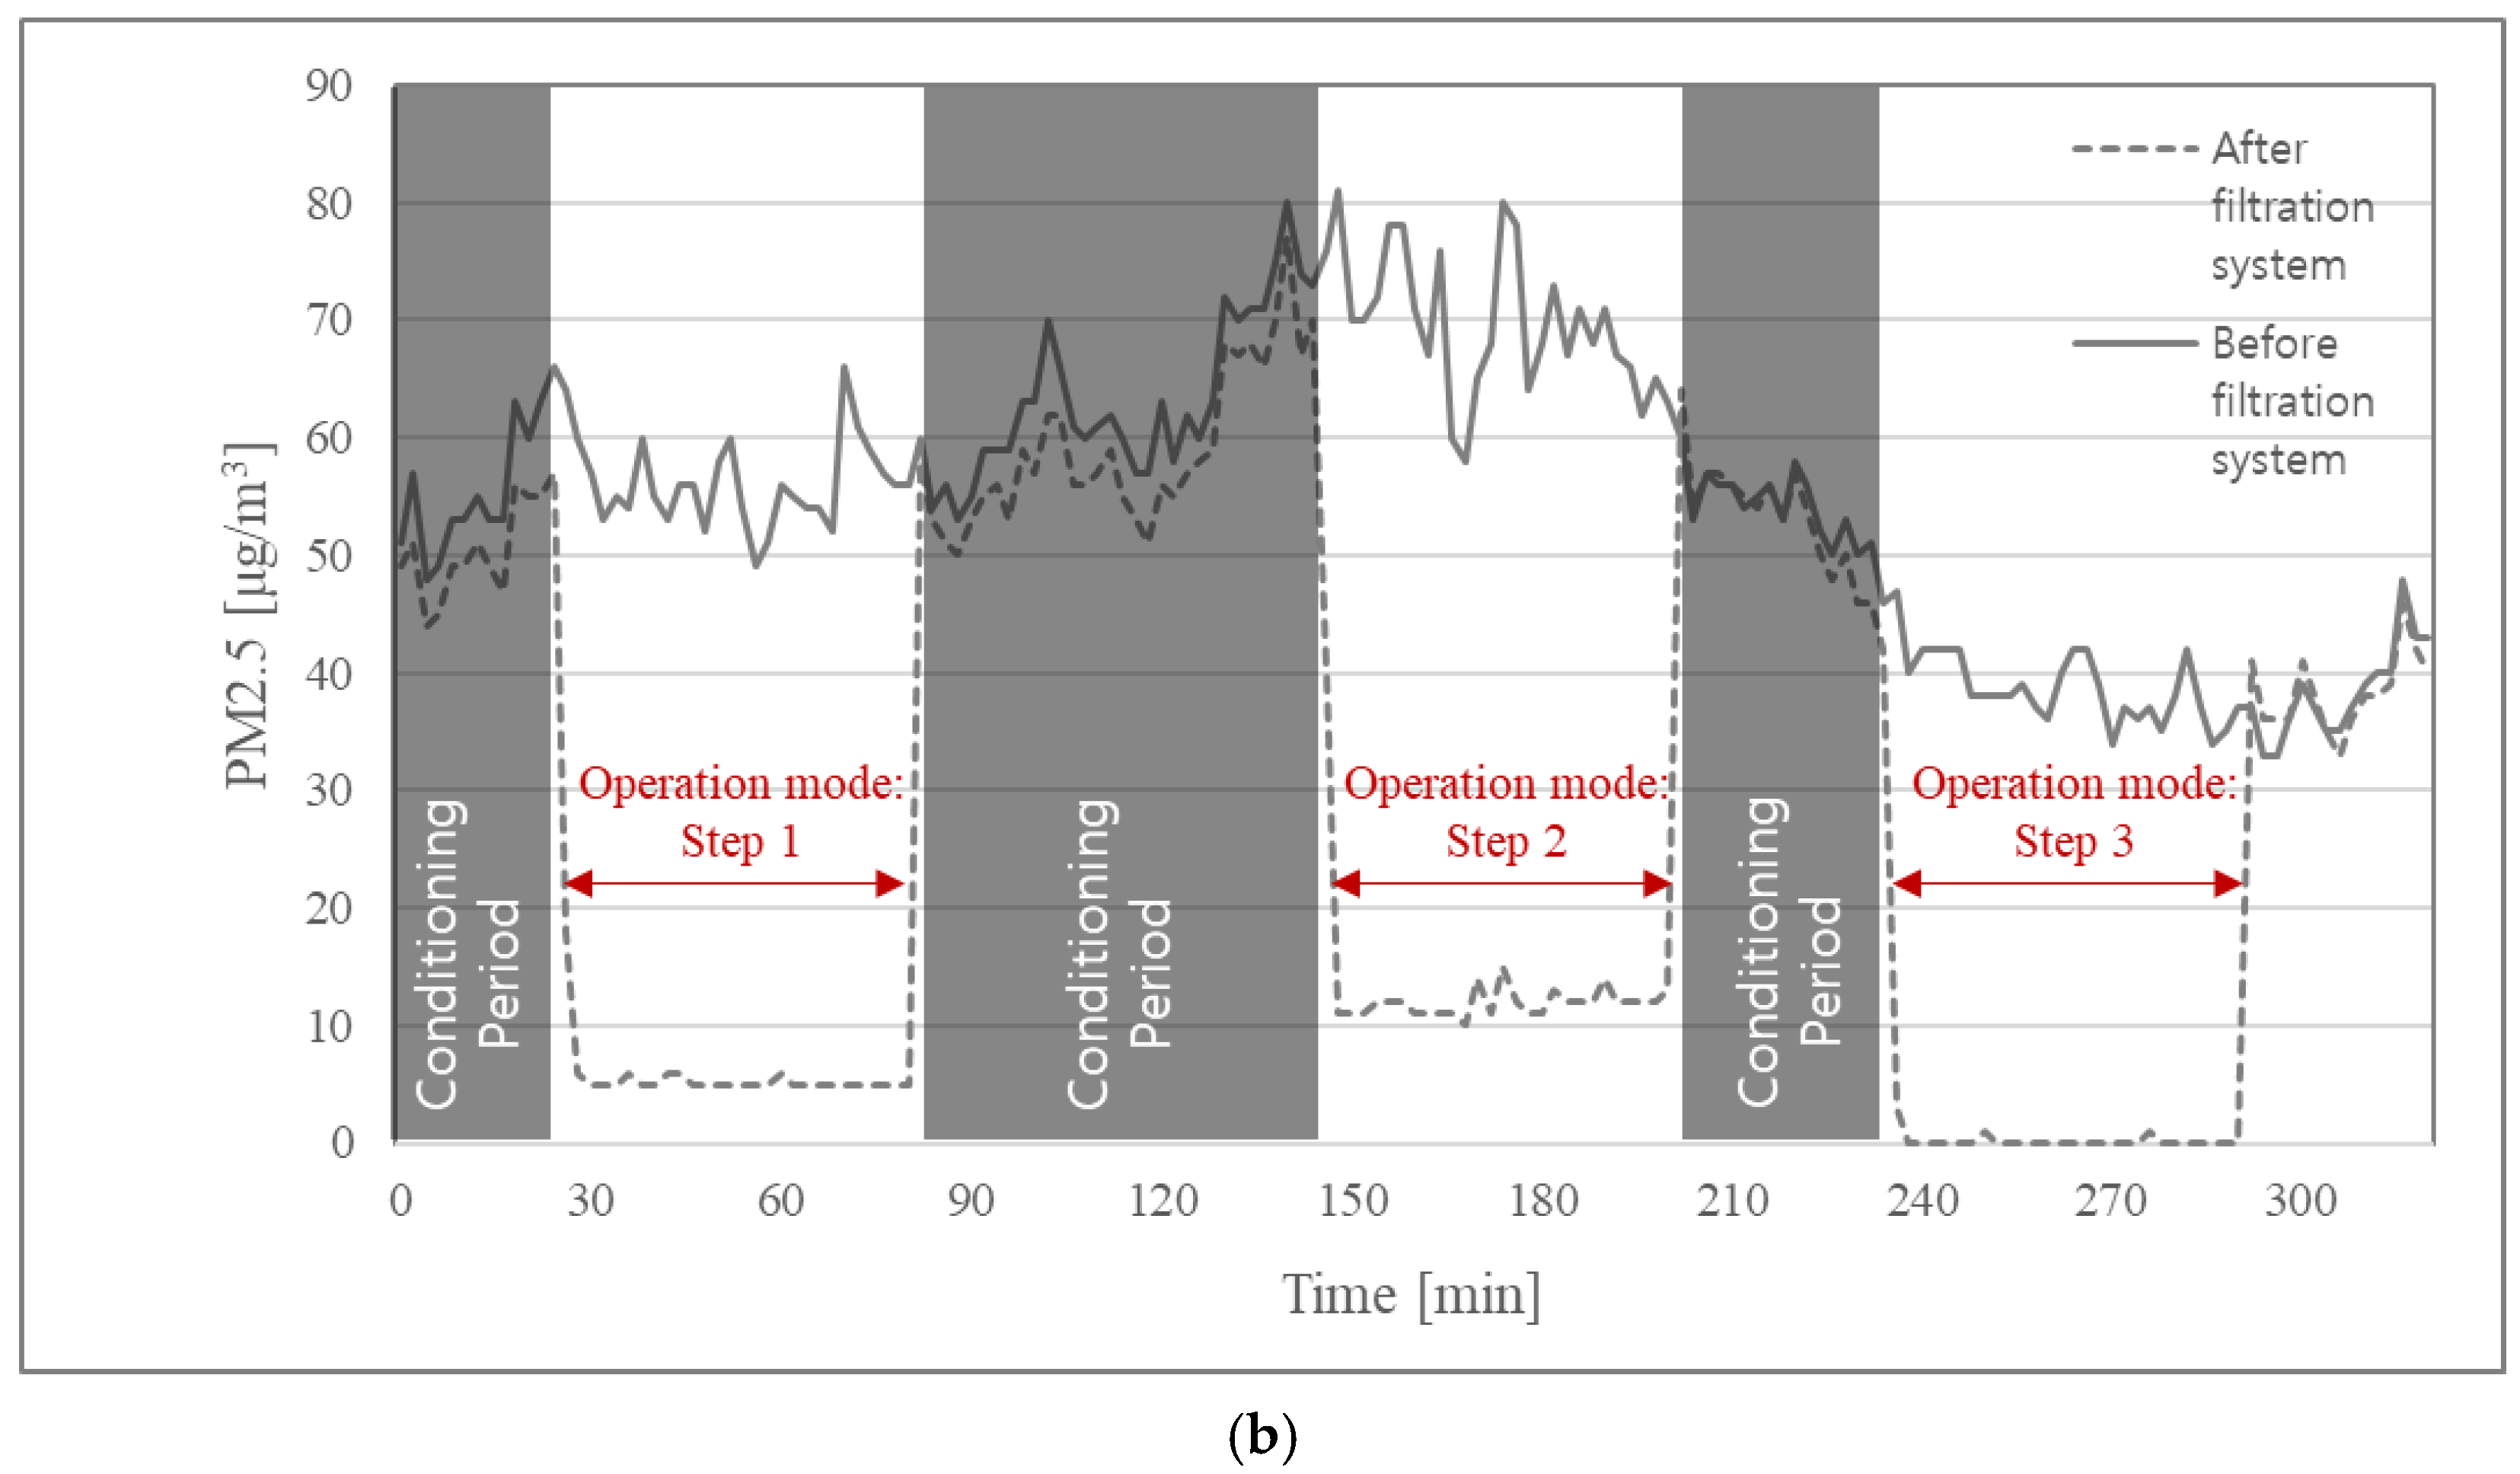
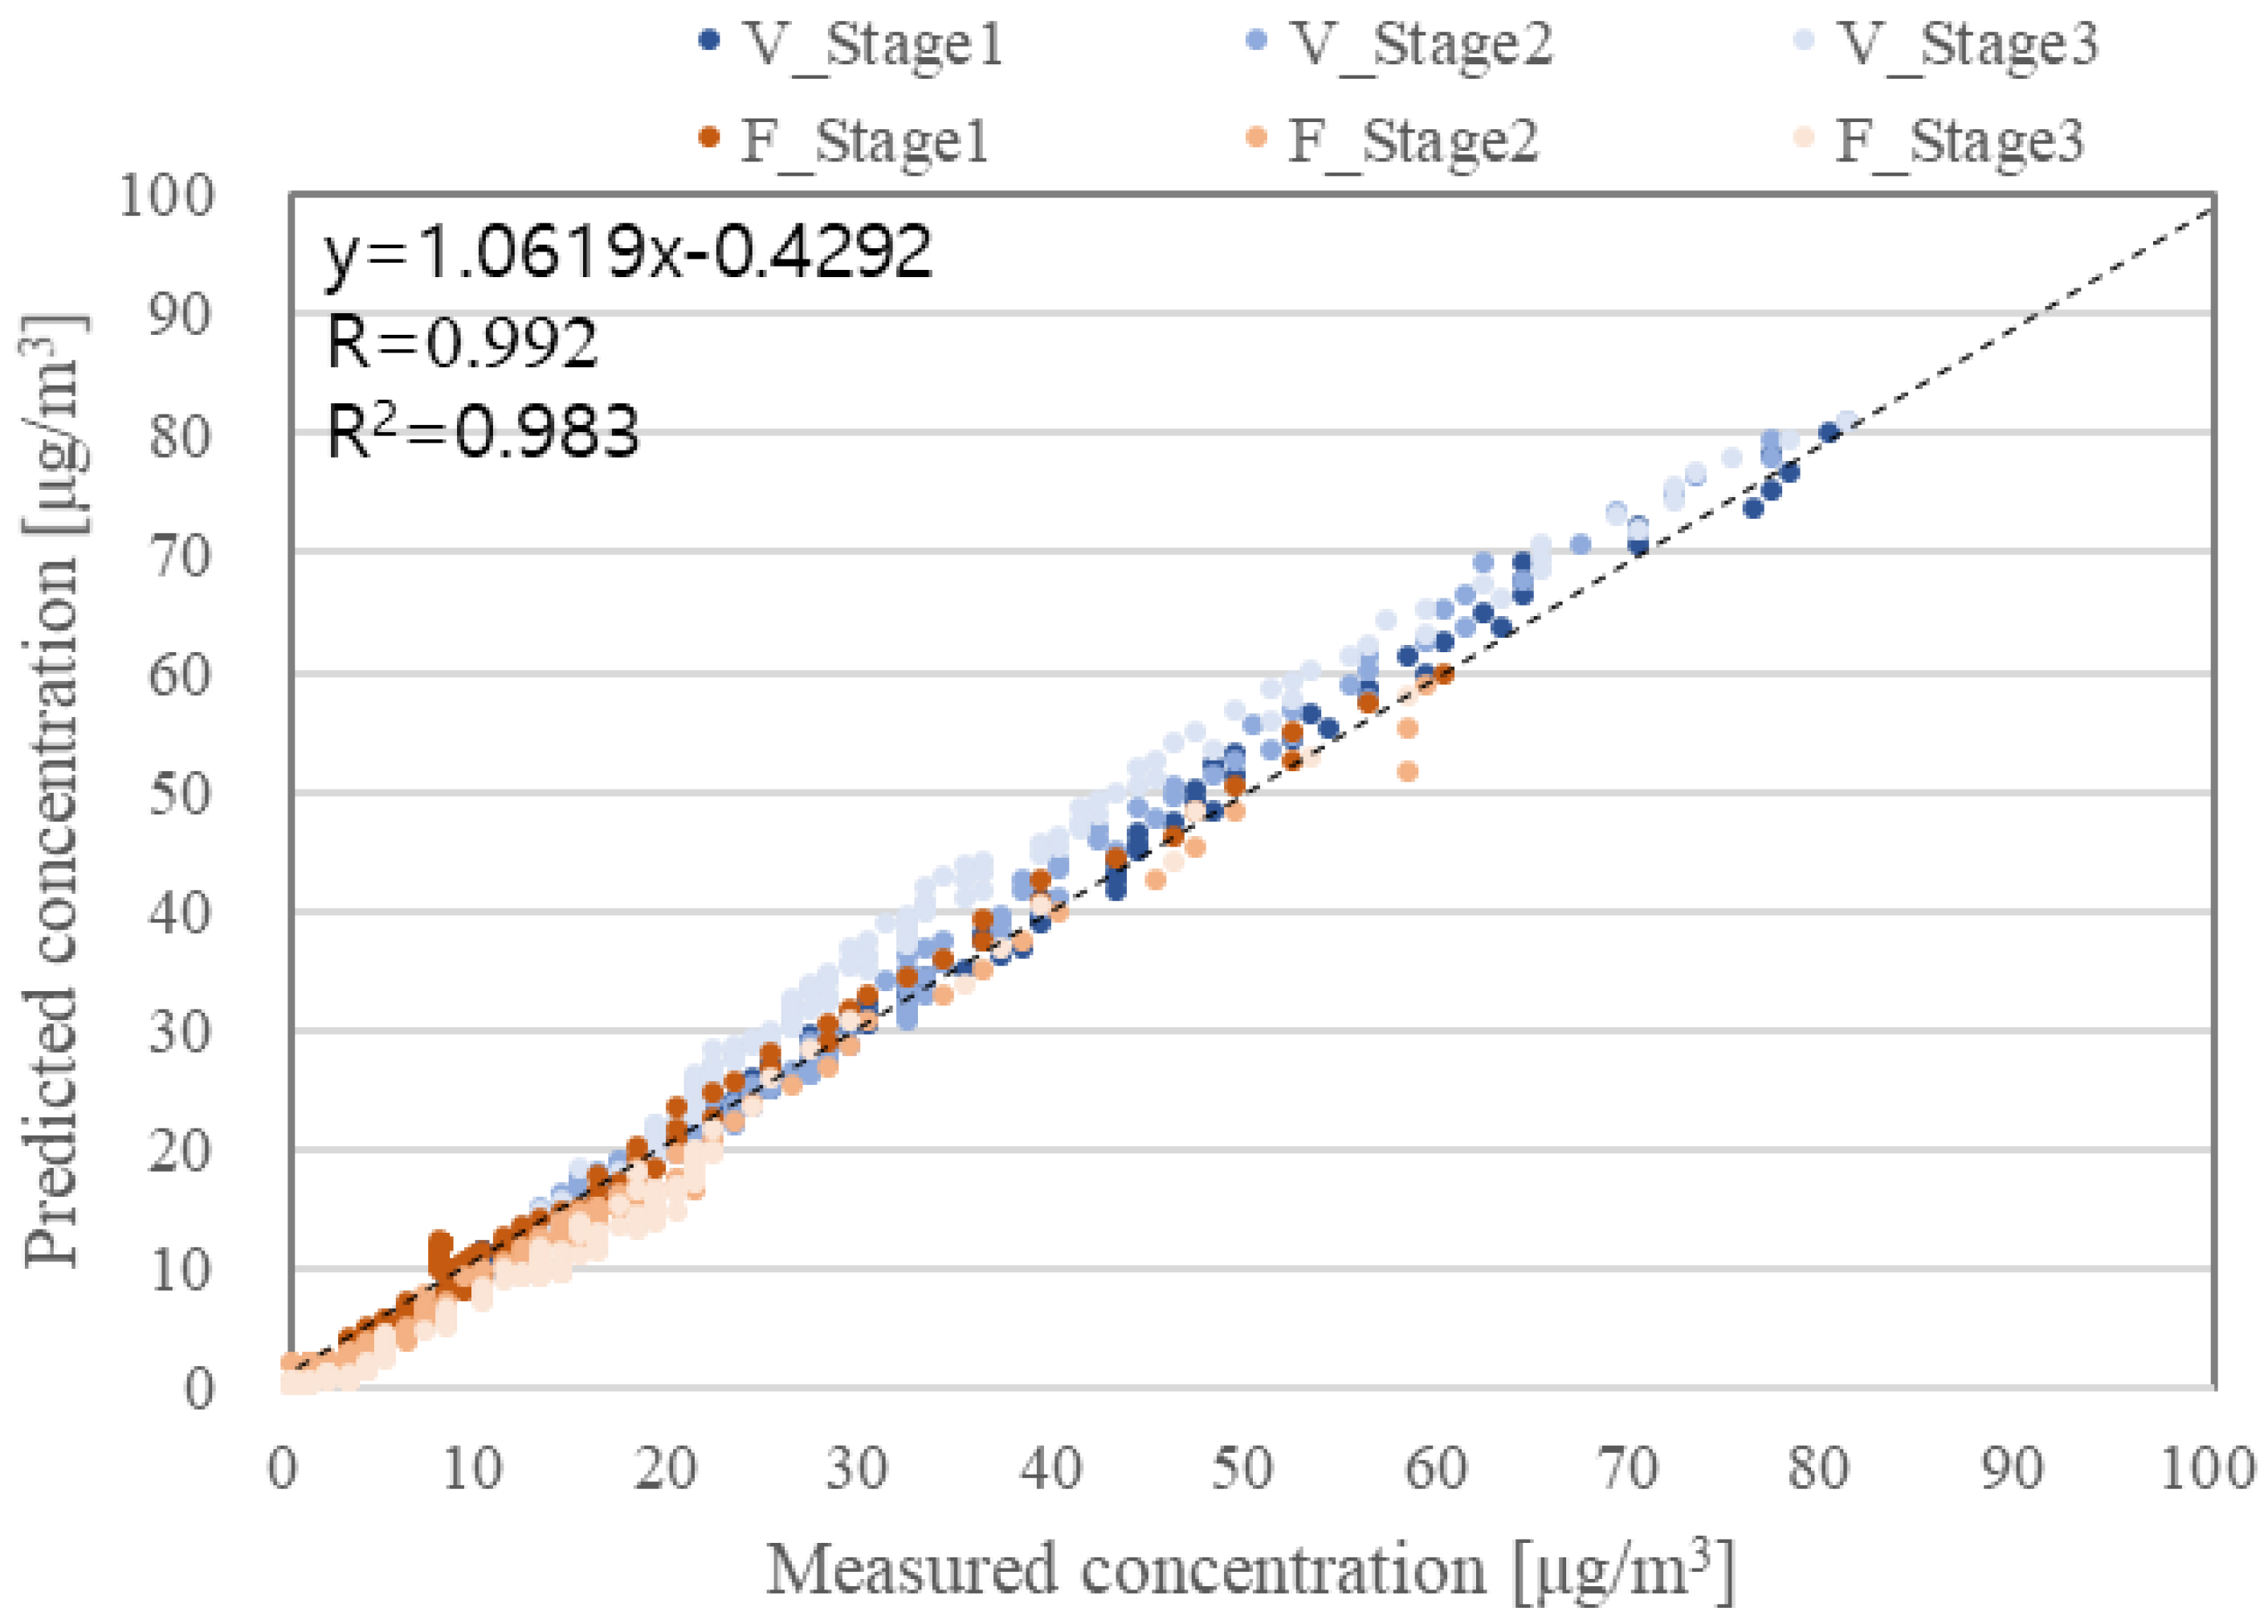
Validation tests were carried out for six days to ensure the conformity of the obtained coefficients. Experiments were carried out in the same way as the coefficient experiments except that the ventilation system or portable air cleaner was operated during the measurement. Previously obtained coefficients ( P , k , η v , η f ) and filtration air-flow rates ( Q f ) were used for the inputs of the model as listed in Table 5, and the air-flow rate of the ventilation system ( Q v ) was estimated by subtracting infiltration rate from the measured air exchange rate (ACH). Here, the infiltration rate was assumed to be 0.13 h−1. This was the average value during 14 days of parameter obtaining experiments (shown in Table 3). A recent study showed that ACH in 36 new apartments in Korea ranged from 0.12 h−1 to 0.24 h−1 [33], while another study found that the average ACH was 0.08 h−1 in summer and autumn and 0.12 h−1 in winter and spring [24]. Experiments were conducted with different flow rates of ventilation or filtration system, and the comparison of measured and predicted data is shown in Figure 7. Indoor PM model revealed high performance with R2 = 0.988.

2.4. Determination of Evaluation Ranges and Simulation Cases

Valid evaluation ranges of indoor and outdoor sources affecting indoor PM2.5 were determined on the basis of atmospheric observation data and the literature (shown in Table 6). To determine outdoor PM2.5 concentration ranges, hourly PM2.5 data provided from the Korea Environment Corporation were referenced [34]. According to the released data, hourly averaged PM2.5 concentration at the Seoul monitoring station for 12 months from January to December 2019 ranged from 1 to 149 μg/m3. On the basis of these data, the evaluation ranges of outdoor PM2.5 concentrations were determined from 0 to 200 μg/m3. The scope of indoor PM2.5 generation rate was set by referring to the literature data. In the literature on indoor particle generation, the PM2.5 generation rate of residential buildings indicated that it ranged from 18 to 200 μg/min during cleaning [18,35,36], 18 to 100 μg/min during walking [18,35], 990 to 1700 μg/min during smoking [18,36,37,38], and 110 to 2780 μg/min during cooking [18,35]. On the basis of these data, the evaluation range of indoor PM2.5 generation rate was determined to be from 0 to 3000 μg/min.
Simulations were carried out to investigate the combined effect of parameters according to ventilation or filtration system control on indoor PM2.5 concentration. In order to analyze the complex effects of control parameters, a total of 24 simulation cases were set up by combining four air-flow rate conditions (100, 200, 400, and 600 m3/h) and three filter efficiency conditions, 35% (= MERV 9), 65% (= MERV 11), and 95% (= MERV 16), as shown in Table 7. Other input conditions such as C o u t ,   G ,   P ,   k ,   λ ,   V were assumed to be the same in all cases. PM2.5 consists of various size of particles and particle distribution of PM2.5 depends on type of source. If sources change, the particle composition of PM2.5 also changes, which can affect P, k, η v , and η f values [39,40]. Using the same P, k, η v , and η f for PM2.5 is a limitation of this study.

3. Results and Discussion

3.1. Ventilation Control Parameters

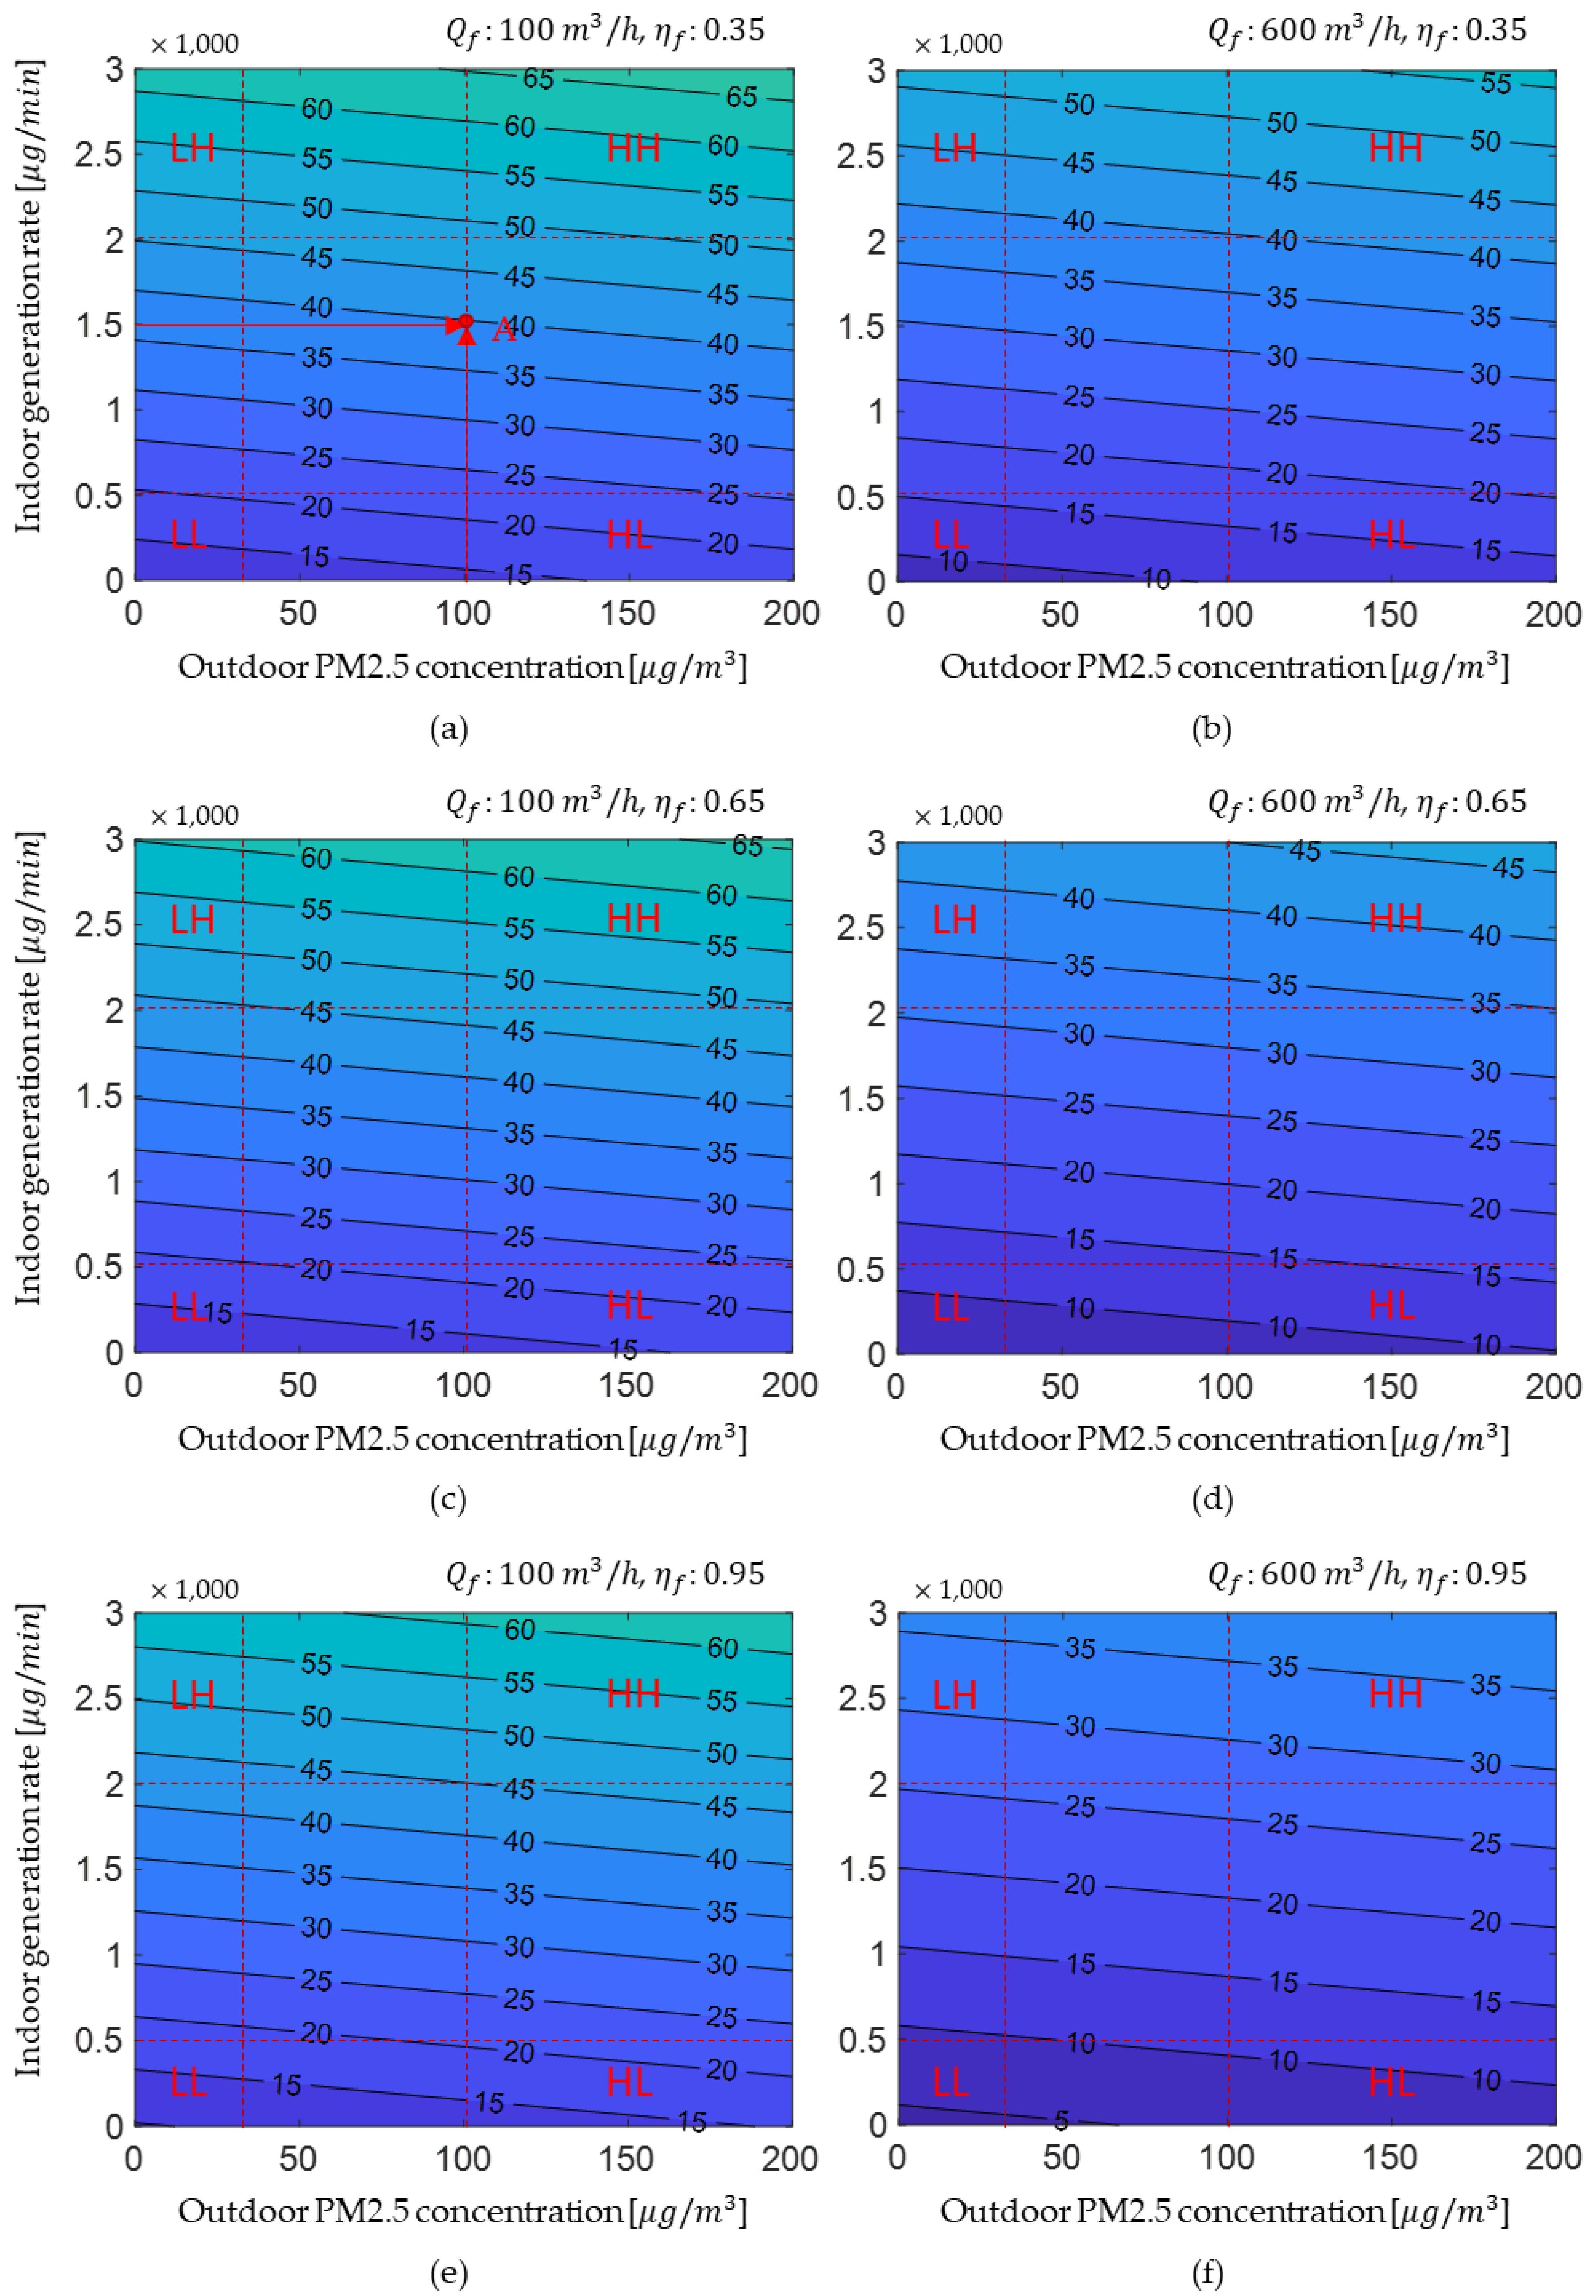
The combined effects of ventilation air-flow rate and filter efficiency on indoor PM2.5 concentration depending on outdoor PM2.5 concentration (X axis) and indoor PM2.5 generation rate (Y axis) are simulated using MATLAB program. Figure 8 shows the indoor PM2.5 characteristics when ventilation flow rate is 100 m3/h or 600 m3/h and ventilation filter efficiency is 0.35, 0.65, or 0.95. The LL condition on each graph indicates the low outdoor PM2.5 concentrations range (below 30 μ g / m 3 ) and low indoor PM2.5 generation rates range (below 500 μg/min), the HL condition indicates the high outdoor PM2.5 concentration range (above 100 μ g / m 3 ) and low indoor PM2.5 generation rate range (below 500 μg/min), the LH condition indicates the low outdoor PM2.5 concentration range (below 30 μ g / m 3 ) and high indoor PM2.5 generation rate range (above 2000 μg/min), and the HH condition indicates the high outdoor PM2.5 concentration range (above 100 μ g / m 3 ) and high indoor PM2.5 generation rate range (above 2000 μg/min). Point A in Figure 8a represents indoor PM2.5 concentration (47 μg/m3) after 30 min of ventilation control with an air-flow rate of 100 m3/h and filter efficiency of 0.35 when outdoor PM2.5 concentration was 100   μ g / m 3   (x value) and indoor PM2.5 generation rate was 1500   μ g / min (y value). It should be noticed that indoor PM2.5 concentrations shown in Figure 8 are not steady-state concentrations. To compare indoor concentration of the early control stage by control case, the indoor concentration was analyzed 30 min after the application of control. It can be observed that the indoor PM2.5 concentration graph had a different slope and spacing (intervals between concentration lines drawn every 5 μ g / m 3 ) for each case. If the contribution of outdoor concentration to indoor PM2.5 concentration was high, the slope increased; if the contribution of indoor generation was high, the slope decreased. The wide spacing in the graph indicates that indoor concentration was effectively reduced by the corresponding control method. When ventilation flow rate was low (Figure 8a,c,e), the slope and spacing of the graph according to filter efficiency did not change much; however, in high–flow conditions such as 600 m3/h (Figure 8b,d,f), the slope of the graph decreased and the gap widened as filter efficiency increased.
Figure 8a,c,e reveal that the indoor PM2.5 concentrations varied to approximately 0–21.6 μg/m3 (for LL), 22.9–44.2 μg/m3 (for HL), 41.8–61.9 μg/m3 (for LH), and 55.1–84.5 μg/m3 (for HH) when filter efficiency was 0.35, 0–20.2 μg/m3 (for LL), 18.0–34.5 μg/m3 (for HL), 41.8–60.4 μg/m3 (for LH), and 50.2–74.8 μg/m3 (for HH) when filter efficiency was 0.65, and 0–18.7 μg/m3 (for LL), 13.2–24.9 μg/m3 (for HL), 41.8–59.0 μg/m3 (for LH), and 45.4–65.1 μg/m3 (for HH) when filter efficiency was 0.95. With increased filter efficiency, the indoor PM2.5 concentrations showed a reduction rate of up to 5% for the LH condition, 13% for the LL condition, 23% for the HH condition, and 44% for the HL condition. Moreover, during the high ventilation flow rate, the indoor concentration was in the range of approximately 0–21.7 μg/m3 (for LL), 46.5–94.8 μg/m3 (for HL), 24.6–48.1 μg/m3 (for LH), and 67.7–121.2 μg/m3 (for HH) when filter efficiency was 0.35, 0–16.0 μg/m3 (for LL), 27.5–56.8 μg/m3 (for HL), 24.6–42.4 μg/m3 (for LH), and 48.7–83.2 μg/m3 (for HH) when filter efficiency was 0.65, and 0–10.3 μg/m3 (for LL), 8.5–18.8 μg/m3 (for HL), 24.6–36.7 μg/m3 (for LH), and 29.6–45.2 μg/m3 (for HH) when filter efficiency was 0.95. As filter efficiency increased, the indoor PM2.5 concentrations showed a reduction rate of up to 24% for the LH condition, 36% for the LL condition, 63% for the HH condition, and 80% for the HL condition. This indicates that changing the filter efficiency under low ventilation flow rate condition has a lesser impact on indoor PM2.5 than under high ventilation flow rate conditions. Because the ventilation system was operated with a low flow rate, the amount of outdoor air introduced via ventilation was small; thus, the effect of the change in filter efficiency on indoor PM2.5 was also small.
The combined control parameter case of ventilation system that can effectively reduce indoor concentration according to indoor and outdoor PM2.5 conditions was examined. For the HH condition, the improvement order for indoor PM2.5 concentrations was found to be Case V600_0.95 > Case V100_0.95 > Case V100_0.65 > Case V600_0.65 > Case V100_0.35 > Case V600_0.35. This indicates that the ventilation filter efficiency was a more effective control parameter than the flow rate to reduce indoor PM2.5 for the HH condition. For the LH condition, the improvement order for indoor PM2.5 concentrations was found to be Case V600_0.95 > Case V600_0.65 > Case V600_0.35 > Case V100_0.95 > Case V100_0.65 > Case V100_0.35. This shows that the ventilation flow rate was a more effective control parameter than filter efficiency to reduce indoor PM2.5 under LH condition. For HL condition.
The improvement order for indoor PM2.5 concentrations was found to be Case V600_0.95 > Case V100_0.95 > Case V100_0.65 > Case V100_0.35 > Case V600_0.65 > Case V600_0.35. This indicates that a high efficiency filter should be applied to increase the ventilation flow rate, and that ventilation flow rates should be minimized if the filter efficiency is lower than 0.65. For the LL condition, the improvement order for indoor PM2.5 concentrations was found to be Case V600_0.95 > Case V600_0.65 > Case V100_0.95 > Case V100_0.65 > Case V100_0.35 > Case V600_0.35. The result indicates that high ventilation flow rates, when applied with a filter efficiency higher than 0.65, have more effectively reduced indoor PM2.5 but should reduce the ventilation flow when applying a filter with a lower efficiency.
The ventilation control method that could reduce indoor PM2.5 the most under all conditions was the high flow rate using a high-efficiency filter. High flow ventilation control using low-efficiency filters was an applicable method only for the LH condition. Low flow ventilation control using high-efficiency filters was suitable for the HH and HL conditions.

3.2. Filtration Control Parameters

The characteristics of indoor PM2.5 concentration depending on the flow rate and filter efficiency of the filtration system are shown in Figure 9. Indoor PM2.5 graphs had the same slope and only gaps between graphs widening or narrowing depending on filter efficiency and flow rate. The slope was associated to the amount of incoming external particles. Since recirculated indoor air-flow rates varied, and infiltration rate was assumed to be the same for all cases of filtration control, the slope of the graphs was independent of the filtration-control parameters.
When the filtration system operated at a flow rate of 100 m3/h, as shown in Figure 9a,c,e, the spacing between the graphs did not change depending on the filter efficiency. This means that the effect of applying a high–efficiency filter was insignificant during low flow rate operation because the amount of air filtered by the system and recirculated into the room was small. When the filtration flow rate was low, the indoor concentration varied to approximately 0–20.3 μg/m3 (for LL), 13.9–25.4 μg/m3 (for HL), 45.1–63.1 μg/m3 (for LH), and 48.1–68.2 μg/m3 (for HH) when filter efficiency was 0.35, 0–19.5 μg/m3 (for LL), 13.2–24.4 μg/m3 (for HL), 43.5–61.0 μg/m3 (for LH), and 46.4–66.0 μg/m3 (for HH) when filter efficiency was 0.65, and 0–18.6 μg/m3 (for LL), 12.5–23.4 μg/m3 (for HL), 42.0–59.6 μg/m3 (for LH), and 44.9–63.9 μg/m3 (for HH) when filter efficiency was 0.95. With increased filter efficiency, the indoor PM2.5 concentrations showed a reduction rate of up to 8% for LL and HL conditions and 6% for LH and HH conditions. On the other hand, when the flow rate was 600 m3/h (Figure 9b,d,f), the spacing of the graph widened as the filter efficiency increased. This result indicated that a high flow rate was effective in removing indoor PM2.5 as the filter efficiency improved. When the filtration flow rate was high, the indoor concentration was in the range of approximately 0–15.7 μg/m3 (for LL), 10.2–20.1 μg/m3 (for HL), 36.8–52.2 μg/m3 (for LH), and 39.4–56.5 μg/m3 (for HH) when filter efficiency was 0.35, 0–12.3 μg/m3 (for LL), 7.5–16.0 μg/m3 (for HL), 30.3–43.5 μg/m3 (for LH), and 32.5–47.2 μg/m3 (for HH) when filter efficiency was 0.65, and 0–9.7 μg/m3 (for LL), 5.6–12.9 μg/m3 (for HL), 25.3–36.7 μg/m3 (for LH), and 27.2–39.9 μg/m3 (for HH) when filter efficiency was 0.95. As the filter efficiency increased, the indoor PM2.5 concentrations showed a reduction rate of up to 29% for the HH condition, 30% for the LH condition, 36% for the HL condition, and 38% for the LL condition.
When filtration control was applied to reduce indoor PM2.5, indoor concentration depends on the CADR (Clean Air Delivery Rate), which is approximately equal to the product of air-flow rate and filter removal efficiency [41]. This could also be confirmed in our results. The improvement order for indoor PM2.5 concentrations in the simulation cases was F600_0.95(CADR: 570) > F600_0.65(CADR: 390) > F400_0.95(CADR: 380) > F400_0.65(CADR: 260) > F600_0.35(CADR: 210) > F200_0.95(CADR: 190) > F400_0.35(CADR: 140) > F200_0.65(CADR: 130) > F100_0.95(CADR: 95) > F200_0.35(CADR: 70) > F100_0.65(CADR: 65) > F100_0.35(CADR: 35). Therefore, in order to reduce the indoor PM2.5 by applying filtration control, it is recommended to determine sufficient flow rate according to the space size and apply a high-efficiency filter.

3.3. Comparison between Ventilation Control and Filtration Control

Indoor PM2.5 concentrations according to flow rate and filter efficiency of ventilation and filtration control during four different indoor and outdoor PM2.5 conditions are listed in Table 8. The indoor PM2.5 was improved when filtration control was applied, rather than ventilation control, when flow rate and efficiency were equal. From the results, filtration control should be used to control indoor PM2.5; however, ventilation is often required to control other indoor pollutants emitted from building materials, furniture, occupants, etc. From Table 8, methods for applying ventilation control according to indoor and outdoor conditions are as follows. When both the outdoor concentration and indoor generation rate were low, the improvement effects of filtration and ventilation control were similar during the application of low flow rate or high efficiency filter. At a high flow rate, except when using high-efficiency filter application, filtration control could reduce indoor PM2.5 by 17–28% more than ventilation control. When the outdoor concentration was low and the indoor generation rate was high, the improvement seen with filtration control and ventilation control was similar regardless of the flow rate. Therefore, actively using the ventilation control under these conditions is recommended. Filtration control is a more effective method than ventilation control when the outdoor concentration is high and the indoor generation rate is low. This is the worst condition for applying ventilation control because the dilution effect of the ventilation is small due to the high outdoor concentration and low indoor generation. If ventilation filter efficiency was less than 0.65, indoor PM2.5 was worse than when it was not controlled (no-control). Nevertheless, if ventilation is required, a high efficiency ventilation filter of 0.95 must be applied. Filtration control is also better than ventilation control when both the outdoor concentration and the indoor generation rate are high. However, ventilation control using a high efficiency ventilation filter of 0.9 has also been shown to reduce the indoor concentration by 10–40% (filtration control using filter efficiency of 0.9 reduced indoor concentration by 11–40%). Under this condition, ventilation control with a filter efficiency of 0.95 had a similar effect on improving indoor PM2.5 compared to filtration control.

3.4. Combined Effect of Ventilation Control and Filtration Control

The indoor PM2.5 concentration according to the system flow rate change and indoor and outdoor PM2.5 conditions while the ventilation system and the filtration system are operated together is shown in Table 9. Since it is difficult to change the ventilation or filtration filter in actual system operation, the efficiency of the ventilation and filtration filter were fixed at 0.65 and 0.95, respectively. Under each condition, the lowest indoor PM2.5 concentration was colored in blue, and the concentrations lower than 30 μg/m3 (assumed as target indoor PM2.5 concentration) were colored light green.
When both outdoor concentration and indoor generation rate were low, it was shown that indoor PM2.5 concentration was reduced if increasing ventilation and filtration flow rate. When ventilation and filtration flow rate were 600 m3/h, indoor PM2.5 reduced by 46% compare to ventilation and filtration flow rate were 100 m3/h. However, as the filtration flow rate increased, the effect of ventilation flow rate on indoor concentration reduction tended to decrease. When the filtration flow rate was 600 m3/h, the indoor PM2.5 concentration was the same for a ventilation flow rate of 100 m3/h and 600 m3/h. The indoor PM2.5 concentration was the lowest when the filtration flow rate was 600 m3/h regardless of the ventilation flow rate, and the indoor concentration was 55% lower than no-control. In this condition, indoor PM2.5 control is not required to maintain the target indoor concentration; thus, it is recommended to operate with a minimum ventilation (100 m3/h) considering other indoor generated pollutants.
When the outdoor concentration was low and indoor generation rate was high, it was shown that indoor PM2.5 concentration was reduced if increasing ventilation and filtration flow rate. It was found that both ventilation and filtration control effectively reduced indoor PM2.5 under this condition. When ventilated to 600 m3/h and filtered to 600 m3/h, the indoor PM2.5 concentration was the lowest, and it was 58% lower than the uncontrolled concentration. If the ventilation flow rate was less than 200 m3/h, the filtration flow rate should be at least 400 m3/h, and if the filtration flow rate was less than 100 m3/h, the ventilation flow rate should be at least 400 m3/h to maintain the indoor target concentration.
When outdoor concentration was high and indoor generation rate was low, it was shown that indoor PM2.5 concentration was reduced when the ventilation flow rate was decreased and the filtration flow rate was increased. When ventilated to 100 m3/h and filtered to 600 m3/h, the indoor PM2.5 concentration was the lowest and reduced by 44% as compared to no-control. In order to maintain a similar indoor concentration as ventilation flow rate increases, filtration flow rate should be increased accordingly; thus, it is recommended to maintain the minimum ventilation flow rate for the management of other indoor pollutants and operate the filtration system at the flow rate that can maintain the indoor target PM2.5 concentration.
Filtration control was suitable when both outdoor concentration and indoor generation rate were high, but ventilation also showed some effect on improving the indoor PM2.5 concentration depending on the filtration flow rate. When filtration was not applied, the indoor concentration decreased slightly (up to 3%) as the ventilation increased, while when filtration flow rate was high, indoor PM2.5 increased slightly by 2 to 7% as the ventilation flow rate increased. Under this condition, reducing ventilation to a minimum flow rate and operating the filtration at a maximum flow rate were advantageous for improving indoor PM2.5. When ventilated to 100 m3/h and filtered to 600 m3/h, the indoor PM2.5 concentration was the lowest and reduced by 44% compared to no-control. However, indoor PM2.5 did not increase by more than 12% when ventilation flow rate increased, indicating that indoor PM2.5 did not deteriorate significantly even if ventilation was applied if necessary.

4. Conclusions

In this study, the combined effects of the control parameters of a ventilation or filtration system on indoor PM2.5 concentration were analyzed according to outdoor PM2.5 concentration and indoor PM2.5 generation rate. A mass–balance model was used to evaluate indoor PM2.5, and a field test was carried out to obtain the coefficient. Key findings of this study are as follows:
(1)
The effects of ventilation flow rate and filter efficiency on indoor PM2.5 concentration were analyzed. In the case of the HH (high outdoor PM2.5 and high indoor PM2.5 generation rate) condition, using higher efficiency of ventilation filter reduced indoor PM2.5 more effectively than increasing flow rate. Therefore, high flow rate + high efficiency filter or low flow rate + high efficiency filter was superior in reducing indoor PM2.5 concentration. On the other hand, ventilation flow rate was a more effective control parameter than ventilation filter efficiency of the LH (low outdoor PM2.5 and high indoor PM2.5 generation rate) condition. Therefore, regardless of filter efficiency, high flow rate was superior for reducing indoor PM2.5 concentration. High flow rate + high efficiency filter or low flow rate + high efficiency filter was superior for the HL (high outdoor PM2.5 and low indoor PM2.5 generation rate) condition. In this condition, ventilation flow rate should be minimized if filter efficiency was less than 0.65. In the case of LL (low outdoor PM2.5 and low indoor PM2.5 incidence) conditions, when filter efficiency of 0.65 or higher was applied, indoor PM2.5 was reduced as the ventilation volume increases.
(2)
The effects of the filtration flow rate and filter efficiency on indoor PM2.5 concentration were analyzed. When the filtration system was operated at a flow rate of 100 m3/h, the indoor PM2.5 concentration showed a reduction rate of up to 6 to 8% depending on the filtration efficiency. On the other hand, when the filter system operated at a flow rate of 600 m3/h, the indoor PM2.5 concentration showed a reduction rate of up to 29 to 38% depending on the filter efficiency. The simulation results also showed that the higher the CADR, the better the indoor PM2.5 concentration. Therefore, to improve indoor PM2.5 concentration by filtration control, a sufficient flow rate should be applied with a high-efficiency filter.
(3)
The indoor PM2.5 improved to a greater extent when filtration control was applied rather than ventilation control. Nevertheless, ventilation control is required for managing other indoor pollutants. Ventilation control should be applied carefully according to four different indoor and outdoor conditions. In the case of LL condition, if filtration system was operated at a high flow rate by using a filter with less than 0.65 efficiency, filtration control could reduce indoor PM2.5 by 17–28% more than ventilation control. However, the effects of filtration control and ventilation control were similar when the flow rate was low or the filter efficiency was high. In the case of LH conditions, ventilation control improved indoor PM2.5 as effectively as filtration control. Under HL conditions, which are the worst conditions for applying ventilation control, the indoor PM2.5 was found to be worse than uncontrolled condition if the ventilation filter efficiency was below 0.65. Finally, in the case of ventilation control under HH conditions using a filter with an efficiency of 0.95, indoor PM2.5 could be improved to a level similar to filtration control.
(4)
When operating the ventilation system and filtration system together, the control methods for managing indoor PM2.5 were presented in two aspects for each indoor and outdoor environmental conditions. One was the control method that can reduce indoor PM2.5 the most and the other was the recommended control method for maintaining indoor target concentration. In the case of LL conditions, the indoor PM2.5 was the lowest when the filtration flow rate was 600 m3/h, regardless of ventilation flow rate. However, since indoor PM2.5 control is not required in this condition, it is recommended to operate it with minimal ventilation considering pollutants generated from indoors. For LH conditions, the indoor PM2.5 concentration was the lowest when operated at a ventilation of 600 m3/h + filtration 600 m3/h, down 58% from no-control. If the ventilation flow rate was less than 200 m3/h, the filtration flow rate should be at least 400 m3/h, and if the filtration flow rate was less than 100 m3/h, the ventilation flow rate should be at least 400 m3/h to maintain the indoor target concentration. In the case of HL conditions, the indoor PM2.5 was the lowest when operated at ventilation 100 m3/h + filtration 600 m3/h, down 44% from no-control. The recommended control was to maintain the minimum ventilation flow rate for the management of other indoor pollutants and operate the filtration system at the flow rate that can maintain the indoor target PM2.5 concentration. Under HH conditions, operating ventilation 100 m3/h + filtration 600 m3/h was the best and the most recommended control method.

Author Contributions

Conceptualization, J.-H.K. and M.-S.Y.; Data curation, J.-H.K.; Formal analysis, J.-H.K.; Methodology, J.-H.K. and M.-S.Y.; Project administration, J.-H.K. and M.-S.Y.; Supervision, M.-S.Y.; Experiments, J.-H.K.; Simulations, J.-H.K.; Validation, J.-H.K.; Visualization, J.-H.K.; Writing—original draft, J.-H.K.; Writing—review and editing, J.-H.K. and M.-S.Y. All authors have read and agreed to the published version of the manuscript.

Funding

This research was funded by the Ministry of Trade, Industry, and Energy (MOTIE), grant number 20182010600010.

Conflicts of Interest

The authors declare no conflict of interest.

References

  1. Hoek, G.; Krishnan, R.M.; Beelen, R.; Peters, A.; Ostro, B.; Brunekreef, B. Long–term air pollution exposure and cardiorespiratory mortality: A review. Environ. Health 2013, 12, 43. [Google Scholar] [CrossRef] [PubMed] [Green Version]
  2. Shah, A.S.V.; Lee, K.K.; Mcallister, D.A.; Hunter, A.; Nair, H.; Whiteley, W.; Langlish, J.P.; Newby, D.E.; Mills, N.L. Short term exposure to air pollution and stroke: Systematic review and meta–analysis. Br. Med. J. 2015, 350, h1295. [Google Scholar] [CrossRef] [PubMed] [Green Version]
  3. Park, S.–K. Assessing the impact of ozone and particulate matter on mortality rate from respiratory disease in Seoul, Korea. Atmosphere 2019, 10, 685. [Google Scholar] [CrossRef] [Green Version]
  4. Wu, L.; Luo, X.–S.; Li, H.; Cang, L.; Yang, J.; Yang, J.; Zhao, Z.; Tang, M. Seasonal levels, sources, and health risks of heavy metals in atmospheric PM2.5 from four functional areas of Nanjing city, eastern China. Atmosphere 2019, 10, 419. [Google Scholar] [CrossRef] [Green Version]
  5. Franck, U.; Odeh, S.; Wiedensohler, A.; Wehner, B.; Herbarth, O. The effect of particle size on cardiovascular disorders—The smaller the worse. Sci. Total Environ. 2011, 409, 4217–4221. [Google Scholar] [CrossRef]
  6. Kim, K.; Kabir, E.; Kabir, S. A review on the human health impact of airborne particulate matter. Environ. Int. 2015, 74, 136–143. [Google Scholar] [CrossRef] [PubMed]
  7. Fisk, W.J.; Faulkner, D.; Palonen, J.; Sepanen, O. Performance and costs of particle air filtration technologies. Indoor Air 2002, 12, 223–234. [Google Scholar] [CrossRef] [Green Version]
  8. Howard–Reed, C.; Wallace, L.; Emmerich, S. Effect of ventilation systems and air filters on decay rates of particles produced by indoor sources in an occupied townhouse. Atmos. Environ. 2003, 37, 5295–5306. [Google Scholar] [CrossRef]
  9. Jamriska, M.; Morawska, L.; Ensor, D. Control strategies for sub–micrometer particles indoors: Model study of air filtration and ventilation. Indoor Air 2003, 96–105. [Google Scholar] [CrossRef] [Green Version]
  10. Ben–David, T.; Waring, M.S. Interplay of ventilation and filtration: Differential analysis of cost function combining energy use and indoor exposure to PM2.5 and ozone. Build. Environ. 2018, 128, 320–335. [Google Scholar]
  11. Ruan, T.; Rim, D. Indoor air pollution in office buildings in mega–cities: Effects of filtration efficiency and outdoor air ventilation rates. Sustain. Cities Soc. 2019, 49, 101609. [Google Scholar] [CrossRef]
  12. Ren, J.; Liu, J.; Cao, X.; Hou, Y. Influencing factors and energy–saving control strategies for indoor fine particles in commercial office buildings in six Chinese cities. Energy Build. 2017, 149, 171–179. [Google Scholar] [CrossRef]
  13. Afshari, A.; Matson, U.; Ekberg, L.E. Characterization of indoor sources of fine and ultrafine particles: A study conducted in a fullscale chamber. Indoor Air 2005, 15, 141–150. [Google Scholar] [CrossRef] [PubMed]
  14. Long, C.M.; Suh, H.H.; Koutrakis, P. Characterization of indoor particle sources using continuous mass and size monitors. J. Air Waste Manag. Assoc. 2000, 50, 1236–1250. [Google Scholar] [CrossRef] [PubMed]
  15. Wallace, L. Indoor sources of ultrafine and accumulation mode particles: Size distributions, size–resolved concentrations, and source strengths. Aerosol Sci. Technol. 2006, 40, 348–360. [Google Scholar] [CrossRef] [Green Version]
  16. Abt, E.; Suh, H.; Catalano, P.; Koutrakis, P. Relative contribution of outdoor and indoor particle sources to indoor concentrations. Environ. Sci. Technol. 2000, 34, 3579–3587. [Google Scholar] [CrossRef]
  17. MacNeill, M.; Kearney, J.; Wallace, L.; Gibson, M.; Heroux, M.E.; Kuchta, J.; Guernsey, J.R.; Wheeler, A.J. Quantifying the contribution of ambient and indoor–generated fine particles to indoor air in residential environments. Indoor Air 2014, 24, 362–375. [Google Scholar] [CrossRef]
  18. Ferro, A.R.; Kopperud, R.J.; Hildemann, L.M. Source strengths for indoor human activities that resuspend particulate matter. Environ. Sci. Technol. 2004, 38, 1759–1764. [Google Scholar] [CrossRef]
  19. Urso, P.; Cattaneo, A.; Garramone, G.; Peruzzo, C.; Cavallo, D.M.; Carrer, P. Identification of particulate matter determinants in residential homes. Build. Environ. 2015, 86, 61–69. [Google Scholar] [CrossRef]
  20. Zhong, X.; Wu, W.; Ridley, I.A. Assessing the energy and indoor PM2.5 exposure impacts of control strategies for residential energy recovery ventilators. J. Build. Eng. 2020, 29, 101137. [Google Scholar] [CrossRef]
  21. Allen, R.; Larson, T.; Sheppard, L.; Wallace, L.; Liu, L.J.S. Use of real–time light scattering data to estimate the contribution of infiltrated and indoor–generated particles to indoor air. Environ. Sci. Technol. 2003, 37, 3484–3492. [Google Scholar] [CrossRef] [PubMed]
  22. Long, C.M.; Suh, H.H.; Catalano, P.J.; Koutrakis, P. Using time–and size–resolved particulate data to quantify indoor penetration and deposition behavior. Environ. Sci. Technol. 2001, 35, 2089–2099. [Google Scholar] [CrossRef] [PubMed]
  23. Özkaynak, H.; Xue, J.; Spengler, J.; Wallace, L.; Pellizzari, E.; Jenkins, P. Personal exposure to airborne particles and metals: Results from the Particle TEAM study in Riverside, California. J. Expo. Sci. Environ. Epidemiol. 1996, 6, 57–78. [Google Scholar]
  24. Park, B.R.; Choi, D.H.; Kang, D.H. Seasonal Contribution of Indoor generated–and Outdoor Originating PM 2.5 to Indoor Concentration Depending on Airtightness of Apartment Units. J. Archit. Inst. Korea Struct. Constr. 2020, 36, 155–163. [Google Scholar]
  25. Thatcher, T.L.; Lunden, M.M.; Sextro, R.G.; Hering, S.; Brown, N.J. The effect of penetration factor, deposition, and environmental factors on the indoor concentration of PM2.5 sulfate, nitrate, and carbon. In Proceedings of the 9th International Conference on Indoor Air Quality and Climate, Monterey, CA, USA, 30 June–5 July 2002; Volume 1, pp. 846–851. [Google Scholar]
  26. Williams, R.; Suggs, J.; Rea, A.; Leovic, K.; Vette, A.; Croghan, C.; Sheldon, L.; Rodes, C.; Thornburg, J.; Ejire, A.; et al. The Research Triangle Park particulate matter panel study: PM mass concentration relationships. Atmos. Environ. 2003, 37, 5349–5363. [Google Scholar] [CrossRef]
  27. Zhao, H.; Stephens, B. Using portable particle sizing instrumentation to rapidly measure the penetration of fine and ultrafine particles in unoccupied residences. Indoor Air 2017, 27, 218–229. [Google Scholar] [CrossRef] [Green Version]
  28. Korean Statistical Information Service. Available online: http://kosis.kr/statisticsList/statisticsListIndex.do?menuId=M_01_01&vwcd=MT_ZTITLE&parmTabId=M_01_01#SelectStatsBoxDiv (accessed on 8 September 2020).
  29. Choi, D.H.; Kang, D.H. Infiltration of ambient PM2.5 through building envelope in apartment housing units in Korea. Aerosol Air Qual. Res. 2017, 17, 598–607. [Google Scholar] [CrossRef] [Green Version]
  30. Chao, C.Y.; Wan, M.P.; Cheng, E.C. Penetration coefficient and deposition rate as a function of particle size in non–smoking naturally ventilated residences. Atmos. Environ. 2003, 37, 4233–4241. [Google Scholar] [CrossRef]
  31. Tran, D.T.; Alleman, L.Y.; Coddeville, P.; Galloo, J.C. Indoor particle dynamics in schools: Determination of air exchange rate, size–resolved particle deposition rate and penetration factor in real–life conditions. Indoor Built Environ. 2017, 26, 1335–1350. [Google Scholar] [CrossRef]
  32. Vette, A.F.; Rea, A.W.; Lawless, P.A.; Rodes, C.E.; Evans, G.; Highsmith, V.R.; Sheldon, L. Characterization of indoor–outdoor aerosol concentration relationships during the Fresno PM exposure studies. Aerosol Sci. Technol. 2001, 34, 118–126. [Google Scholar] [CrossRef]
  33. Lee, J.; Lee, D.; Kim, J.; Yee, J. A field measuring study on airtight performance of apartment by building type. In Proceedings of the AIK 2019 Autumn Annual Conference, Daejeon, Korea, 24–25 October 2019; Volume 72, pp. 341–342. [Google Scholar]
  34. Korea Environment Corporation. Airkorea. Available online: www.airkorea.or.kr/web (accessed on 19 June 2020).
  35. Wallace, L.A. Indoor particles: A review. J. Air Waste Manag. Assoc. 1996, 46, 98–126. [Google Scholar] [CrossRef] [PubMed]
  36. He, C.; Morawska, L.; Hitchins, J.; Gilbert, D. Contribution from indoor sources to particle number and mass concentrations in residential houses. Atmos. Environ. 2004, 38, 3405–3415. [Google Scholar] [CrossRef]
  37. Kleipis, N.; Ott, W.; Switzer, P.A. Multiple smoker model for predicting indoor air quality in public lounges. Environ. Sci. Technol. 1996, 30, 2813–2820. [Google Scholar] [CrossRef]
  38. Brauer, M.; Hirtle, R.; Lang, B.; Ott, W. Assessment of indoor fine aerosol contributions from environmental tobacco smoke and cooking with a portable nephelometer. J. Expo. Anal. Environ. Epidemiol. 2000, 10, 136–144. [Google Scholar] [CrossRef] [PubMed] [Green Version]
  39. Fazli, T.; Zeng, Y.; Stephens, B. Fine and ultrafine particle removal efficiency of new residential HVAC filters. Indoor air 2019, 29, 656–669. [Google Scholar] [CrossRef]
  40. Azimi, P.; Zhao, D.; Stephens, B. Estimates of HVAC filtration efficiency for fine and ultrafine particles of outdoor origin. Atmos. Environ. 2014, 98, 337–346. [Google Scholar] [CrossRef]
  41. U.S. Environmental Protection Agency. Residential Air Cleaners: Portable Air Cleaners Furnace and HVAC Filters; EPA 402–F–09–002; U.S. Environmental Protection Agency: Washington, DC, USA, 2018.
Figure 1. Research process and method.
Atmosphere 11 01061 g001
Figure 2. PM2.5 concentration mechanism in a space with a mechanical ventilation system and portable filtration system.
Atmosphere 11 01061 g002
Figure 3. Measurement of (a) indoor particle concentration, (b) outdoor–particle concentration, (c) ventilation flow rate, (d) air exchange rate, (e) particle concentration on outlet side of ventilation system, and (f) particle concentration on outlet side of filtration system.
Atmosphere 11 01061 g003
Figure 4. An example of indoor and outdoor PM2.5 concentration for estimating parameter P and k.
Atmosphere 11 01061 g004
Figure 5. Typical particle natural decay curve for estimating deposition rate (k).
Atmosphere 11 01061 g005
Figure 6. Measured data to obtain filter efficiency of (a) ventilation system and (b) filtration system.
Atmosphere 11 01061 g006aAtmosphere 11 01061 g006b
Figure 7. Comparison of measured and predicted PM2.5 concentration.
Atmosphere 11 01061 g007
Figure 8. Indoor PM2.5 concentrations when (a) Q V is 100 m 3 / h and η v is 0.35, (b) Q V is 600 m 3 / h and η v is 0.35, (c) Q V is 100 m 3 / h and η v is 0.65, (d) Q V is 600 m 3 / h and η v is 0.65, (e) Q V is 100 m 3 / h and η v is 0.95, and (f) Q V is 600 m 3 / h and η v is 0.95.
Atmosphere 11 01061 g008
Figure 9. Indoor PM2.5 concentrations when (a) Q f is 100 m 3 / h and η f is 0.35, (b) Q f is 600 m 3 / h and η f is 0.35, (c) Q f is 100 m 3 / h and η f is 0.65, (d) Q f is 600 m 3 / h and η f is 0.65, (e) Q f is 100 m 3 / h and η f is 0.95, and (f) Q f is 600 m 3 / h and η f is 0.95.
Atmosphere 11 01061 g009
Table 1. Description of test house.
Description
layout Atmosphere 11 01061 i001
LocationSeoul, South Korea
Building typeApartment building
Construction year2017
Structure typeReinforced concrete, Flat slab
Window typeDouble window
Flow area84 m2
Ceiling height2.3 m
FurnitureBasic built–in furniture
Number of bay4–bays
VentilationHeat–recovery ventilation system
Table 2. Description of ventilation and filtration system.
Ventilation SystemFiltration System
Picture Atmosphere 11 01061 i002 Atmosphere 11 01061 i003
TypeHeat–recovery ventilation unitPotable filtration device
Flow control3 stages3 steps
Flow rate (m3/h)Rated: 100, Actual: 107 (stage 1)
Rated: 150, Actual: 121 (stage 2)
Rated: 200, Actual: 145 (stage 3)
Rated: 150, Actual: 125 (stage 1)
Rated: 250, Actual: 245 (stage 2)
Rated: 350, Actual: 305 (stage 3)
Pressure loss (Pa)100
Power consumption (W)8090
Table 3. Results of P, k, and λ obtained from tests.
Parameters P   ( ) k   ( h 1 ) λ   ( h 1 )
Distribution Atmosphere 11 01061 i004 Atmosphere 11 01061 i005 Atmosphere 11 01061 i006
Average ( μ )0.70.40.13
Variance ( σ 2 )0.09370.00650.0108
Standard deviation ( σ )0.30600.08060.1041
Table 4. Results of parameters η v and η f according to the flow rate.
Operation Mode
Step 1Step 2Step 3
η v (–)0.60
( Q v = 107 m3/h)
0.60
( Q v = 121 m3/h)
0.70
( Q v = 145 m3/h)
η f (–)0.89
( Q f = 125 m3/h)
0.80
( Q f = 245 m3/h)
0.97
( Q f = 305 m3/h)
Table 5. Input values used for parameter validation.
No. P k λ V A C H η v Q f η f
(–)(–)(h−1)(m3)(h−1)(–)(m3/h)(–)
V_Step 10.70.40.131320.300.60
V_Step 20.130.310.60
V_Step 30.130.380.70
F_Step 10.081250.89
F_Step 20.112450.80
F_Step 30.093050.97
Table 6. Evaluation ranges of outdoor PM2.5 concentration and indoor PM2.5 generation rate.
ParametersRange
Outdoor PM2.5 concentration ( μ g / m 3 ) Atmosphere 11 01061 i007
Indoor PM2.5 generation rate ( μ g / min ) Atmosphere 11 01061 i008
Table 7. Simulation case for assessing combined effect of parameters on indoor PM2.5.
Case Index Q v η v Q f η f C o u t GPk λ V
(m3/h)(–)(m3/h)(–) ( μ g / m 3 ) ( μ g / m i n )   (–)(–)(h−1) ( m 3 )
V100_0.351000.3500–2000–30000.70.40.1250
V100_0.651000.650
V100_0.951000.950
V200_0.352000.350
V200_0.652000.650
V200_0.952000.950
V400_0.354000.350
V400_0.654000.650
V400_0.954000.950
V600_0.356000.350
V600_0.656000.650
V600_0.956000.950
F100_0.3501000.35
F100_0.6501000.65
F100_0.9501000.95
F200_0.3502000.35
F200_0.6502000.65
F200_0.9502000.95
F400_0.3504000.35
F400_0.6504000.65
F400_0.9504000.95
F600_0.3506000.35
F600_0.6506000.65
F600_0.9506000.95
Table 8. Indoor PM2.5 concentration depending on outdoor concentration, indoor generation rate, ventilation flow rates and filter efficiency, and filtration flow rates and filter efficiency.
Control TypeFlow
Rate
(m3/h)
Filter
Eff.
(–)
Indoor PM2.5 Concentration (μg/m3) (Fraction to Indoor Concentration When No Control Is Applied)
C o u t : 30 μg/m3
(Low)
G: 500 μg/min
(Low)
C o u t : 30 μg/m3
(Low)
G: 2000 μg/min
(High)
C o u t : 100 μg/m3
(High)
G: 500 μg/min
(Low)
C o u t : 100 μg/m3
(High)
G: 2000 μg/min
(High)
No-control21.5(1.00)48.0(1.00)23.6(1.00)50.2(1.00)
Ventilation100 η v :   0.3521.6(1.00)45.8(0.95)30.9(1.31)55.1(1.10)
η v :   0.6520.2(0.94)44.3(0.92)26.1(1.11)50.2(1.00)
η v :   0.9518.7(0.87)42.9(0.89)21.2(0.90)45.4(0.90)
200 η v :   0.3521.7(1.01)43.8(0.91)36.9(1.56)58.9(1.17)
η v :   0.6519.0(0.88)41.1(0.86)28.1(1.19)50.1(1.00)
η v :   0.9516.4(0.76)38.5(0.80)19.2(0.81)41.3(0.82)
400 η v :   0.3521.7(1.01)40.3(0.84)45.8(1.94)64.4(1.28)
η v :   0.6517.3(0.80)35.9(0.75)30.9(1.31)49.5(0.99)
η v :   0.9512.8(0.60)31.4(0.65)16.1(0.68)34.7(0.69)
600 η v :   0.3521.7(1.01)37.5(0.78)51.8(2.19)67.7(1.35)
η v :   0.6516.0(0.74)31.8(0.66)32.8(1.39)48.7(0.97)
η v :   0.9510.3(0.48)26.1(0.54)13.8(0.58)29.6(0.59)
Filtration100 η f :   0.3520.3(0.94)46.0(0.96)22.4(0.95)48.1(0.96)
η f :   0.6519.5(0.91)44.4(0.93)21.5(0.91)46.4(0.92)
η f :   0.9518.6(0.87)42.9(0.89)20.6(0.87)44.9(0.89)
200 η f :   0.3519.3(0.90)44.1(0.92)21.3(0.90)46.2(0.92)
η f :   0.6517.7(0.82)41.2(0.86)19.6(0.83)43.1(0.86)
η f :   0.9516.2(0.75)38.4(0.80)18.0(0.76)40.3(0.80)
400 η f :   0.3517.4(0.81)40.7(0.85)19.3(0.82)42.6(0.85)
η f :   0.6514.7(0.68)35.6(0.74)16.4(0.69)37.3(0.74)
η f :   0.9512.4(0.58)31.3(0.65)14.0(0.59)32.8(0.65)
600 η f :   0.3515.7(0.73)37.6(0.78)17.5(0.74)39.4(0.78)
η f :   0.6512.3(0.57)31.0(0.65)13.8(0.58)32.5(0.65)
η f :   0.959.7(0.45)25.9(0.54)11.0(0.47)27.2(0.54)
Table 9. Combined operation of ventilation and filtration system effects on indoor PM2.5 concentration depending on outdoor concentration and indoor generation rate.
Control Type
(Flow Rate (m3/h), Filter Efficiency (–))
Indoor PM2.5 Concentration (μg/m3) (Percentage to Indoor Concentration When No Control Applied)
C o u t : 30 μg/m3
(Low)
G: 500 μg/min
(Low)
C o u t : 30 μg/m3
(Low)
G: 2000 μg/min
(High)
C o u t : 100 μg/m3
(High)
G: 500 μg/min
(Low)
C o u t : 100 μg/m3
(High)
G: 2000 μg/min
(High)
No-control21.5(1.00)48.0(1.00)23.6(1.00)50.2(1.00)
Ventilation
(100, η v :   0.65)
No filtration20.2(0.94)44.3(0.92)26.1(1.11)50.2(1.00)
Filtration (100, η f : 0.95)17.6(0.82)39.8(0.83)23.1(0.98)45.2(0.90)
Filtration (200, η f : 0.95)15.5(0.72)35.9(0.75)20.5(0.87)40.9(0.81)
Filtration (400, η f : 0.95)12.1(0.56)29.5(0.61)16.4(0.69)33.8(0.67)
Filtration (600, η f : 0.95)9.6(0.45)24.7(0.51)13.3(0.56)28.3(0.56)
Ventilation
(200, η v :   0.65)
No filtration19.0(0.88)41.1(0.86)28.1(1.19)50.1(1.00)
Filtration (100, η f : 0.95)16.8(0.78)37.1(0.77)25.1(1.06)45.4(0.90)
Filtration (200, η f : 0.95)14.9(0.69)33.6(0.70)22.5(0.95)41.3(0.82)
Filtration (400, η f : 0.95)11.8(0.55)27.9(0.58)18.4(0.78)34.5(0.69)
Filtration (600, η f : 0.95)9.6(0.45)23.6(0.49)15.3(0.65)29.3(0.58)
Ventilation
(400, η v :   0.65)
No filtration17.3(0.80)35.9(0.75)30.9(1.31)49.5(0.99)
Filtration (100, η f : 0.95)15.5(0.72)32.7(0.68)28.1(1.19)45.3(0.90)
Filtration (200, η f : 0.95)13.9(0.65)29.9(0.62)25.7(1.09)41.6(0.83)
Filtration (400, η f : 0.95)11.4(0.53)25.3(0.53)21.6(0.92)35.5(0.71)
Filtration (600, η f : 0.95)9.6(0.45)21.7(0.45)18.5(0.78)30.7(0.61)
Ventilation
(600, η v :   0.65)
No filtration16.0(0.74)31.8(0.66)32.8(1.39)48.7(0.97)
Filtration (100, η f : 0.95)14.5(0.67)29.3(0.61)30.2(1.28)44.9(0.89)
Filtration (200, η f : 0.95)13.3(0.62)27.0(0.56)27.9(1.18)41.6(0.83)
Filtration (400, η f : 0.95)11.2(0.52)23.3(0.49)24.0(1.02)36.1(0.72)
Filtration (600, η f : 0.95)9.6(0.45)20.3(0.42)20.9(0.89)31.7(0.63)