Development of a Method to Determine the Fractional Deposition Efficiency of Full-Scale HVAC and HEPA Filter Cassettes for Nanoparticles ≥3.5 nm


Abstract
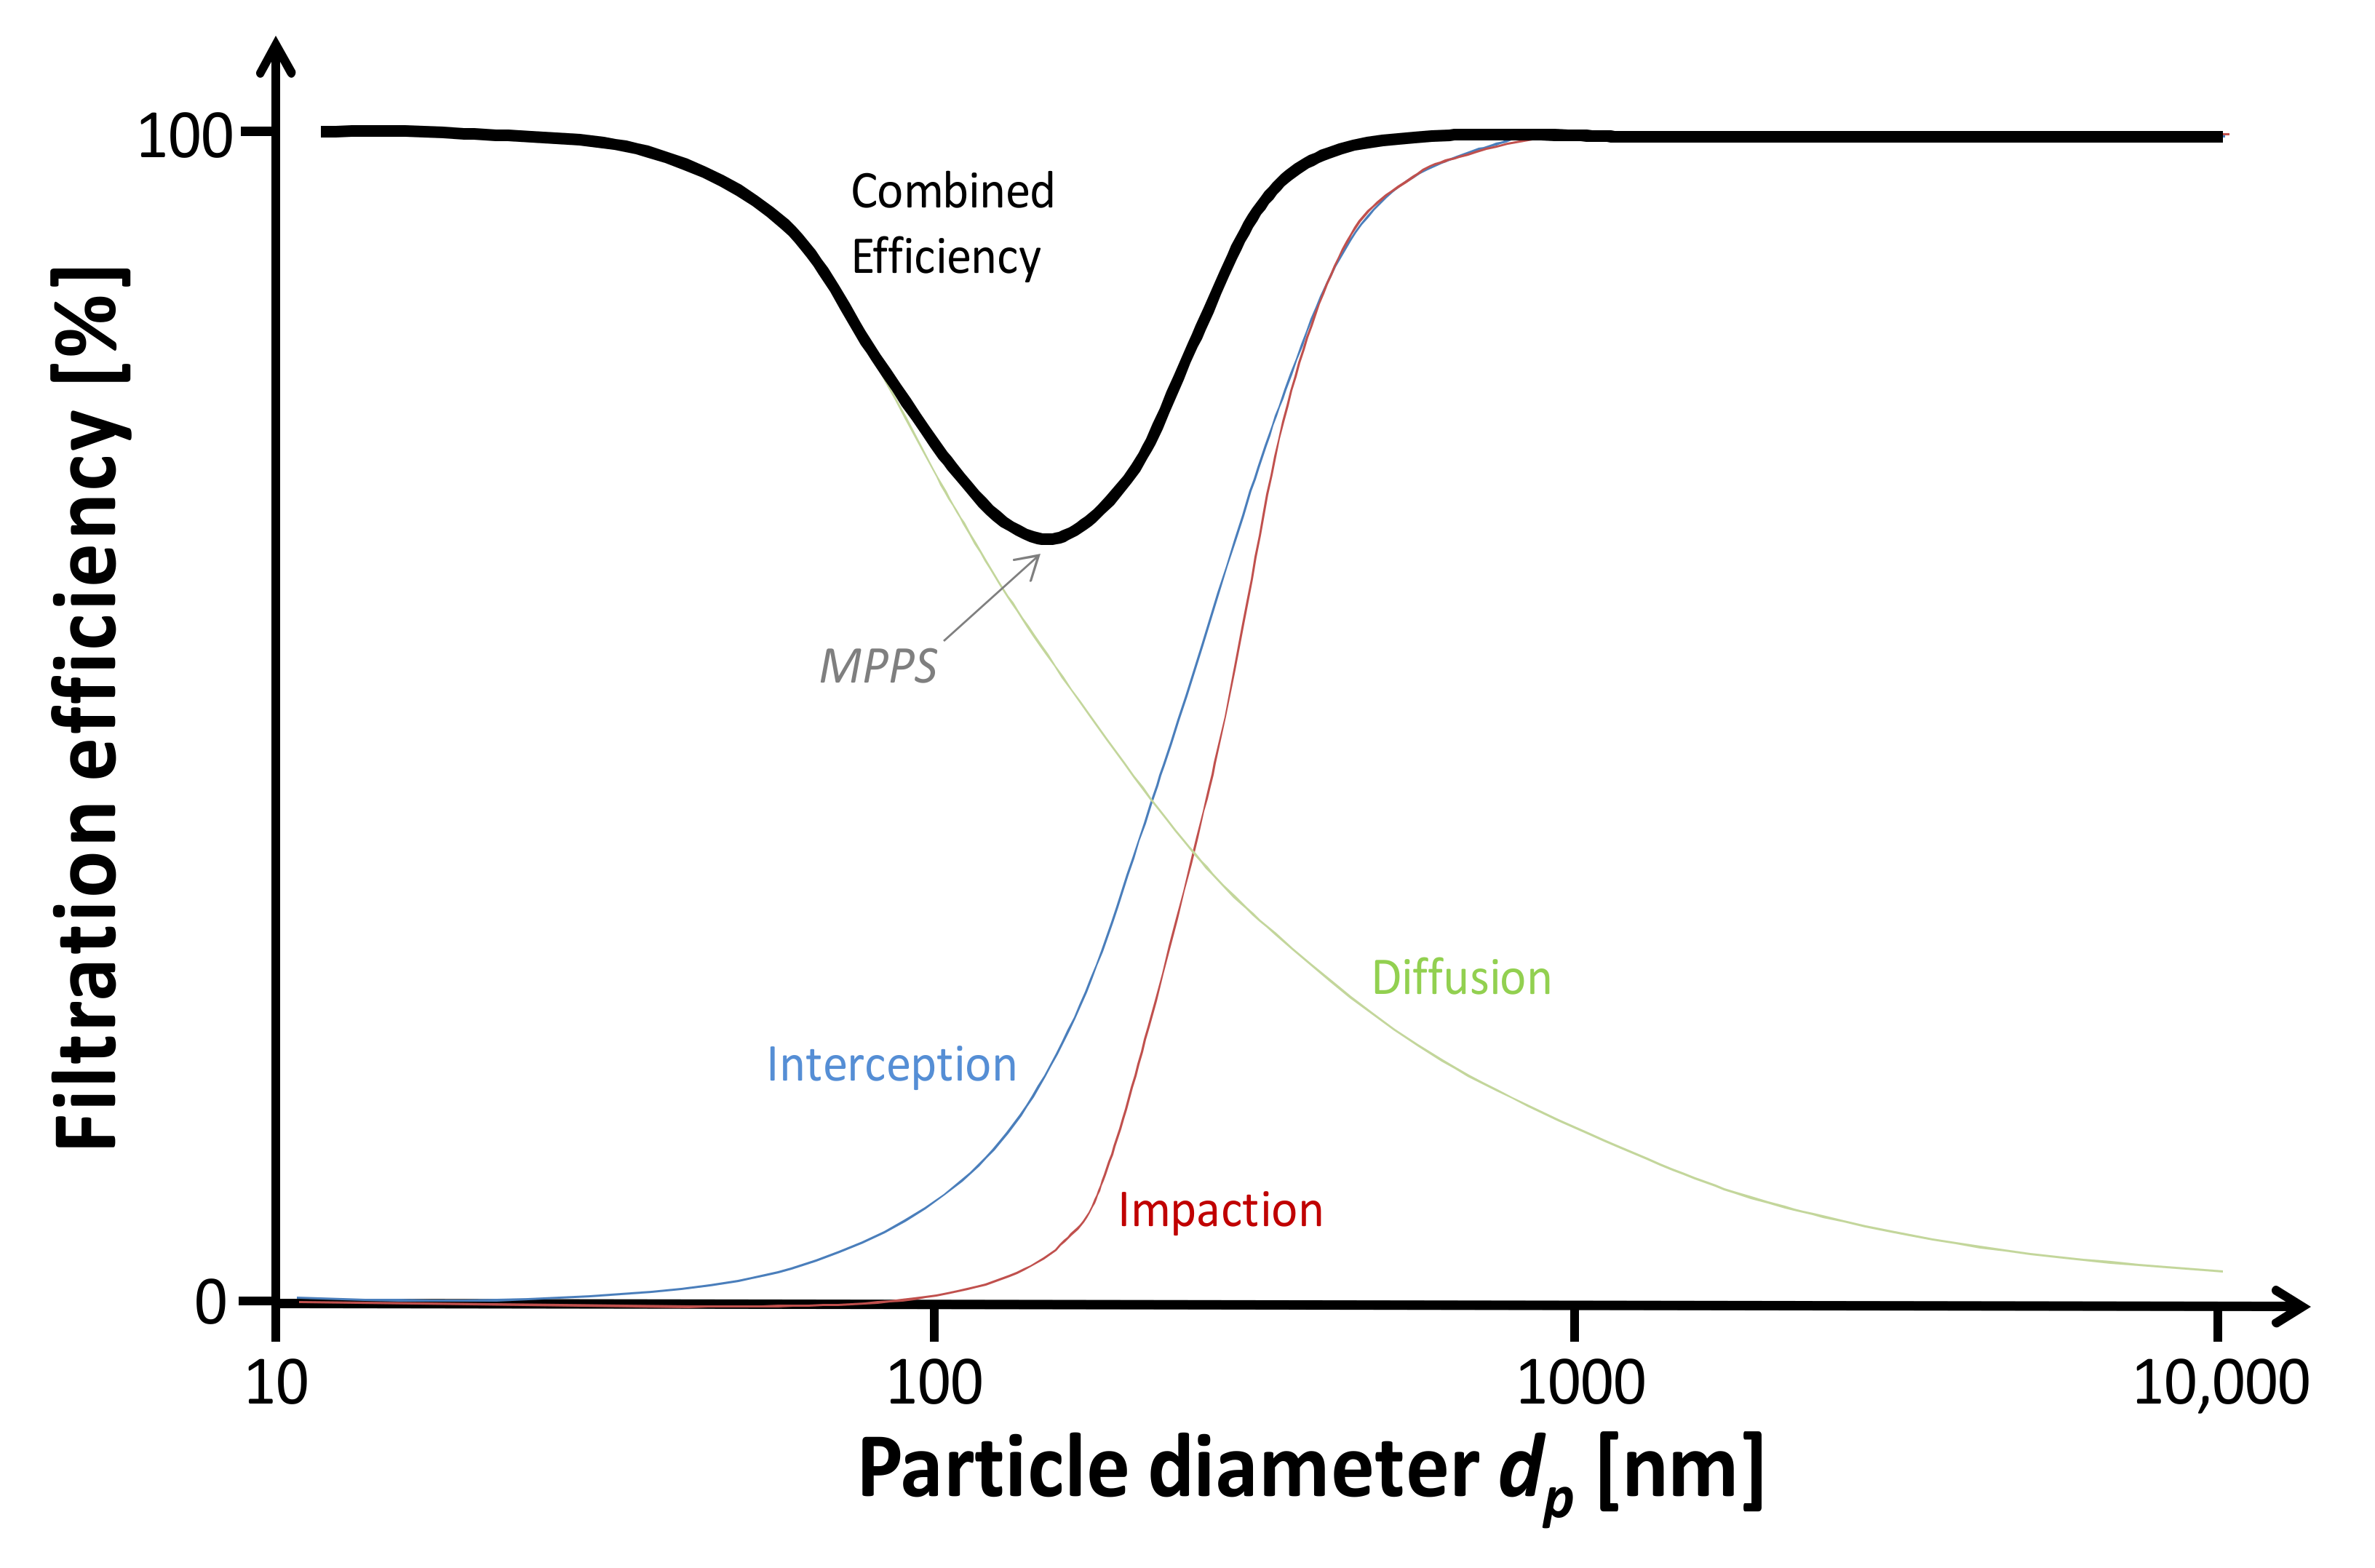
1. Introduction
2. Experiments
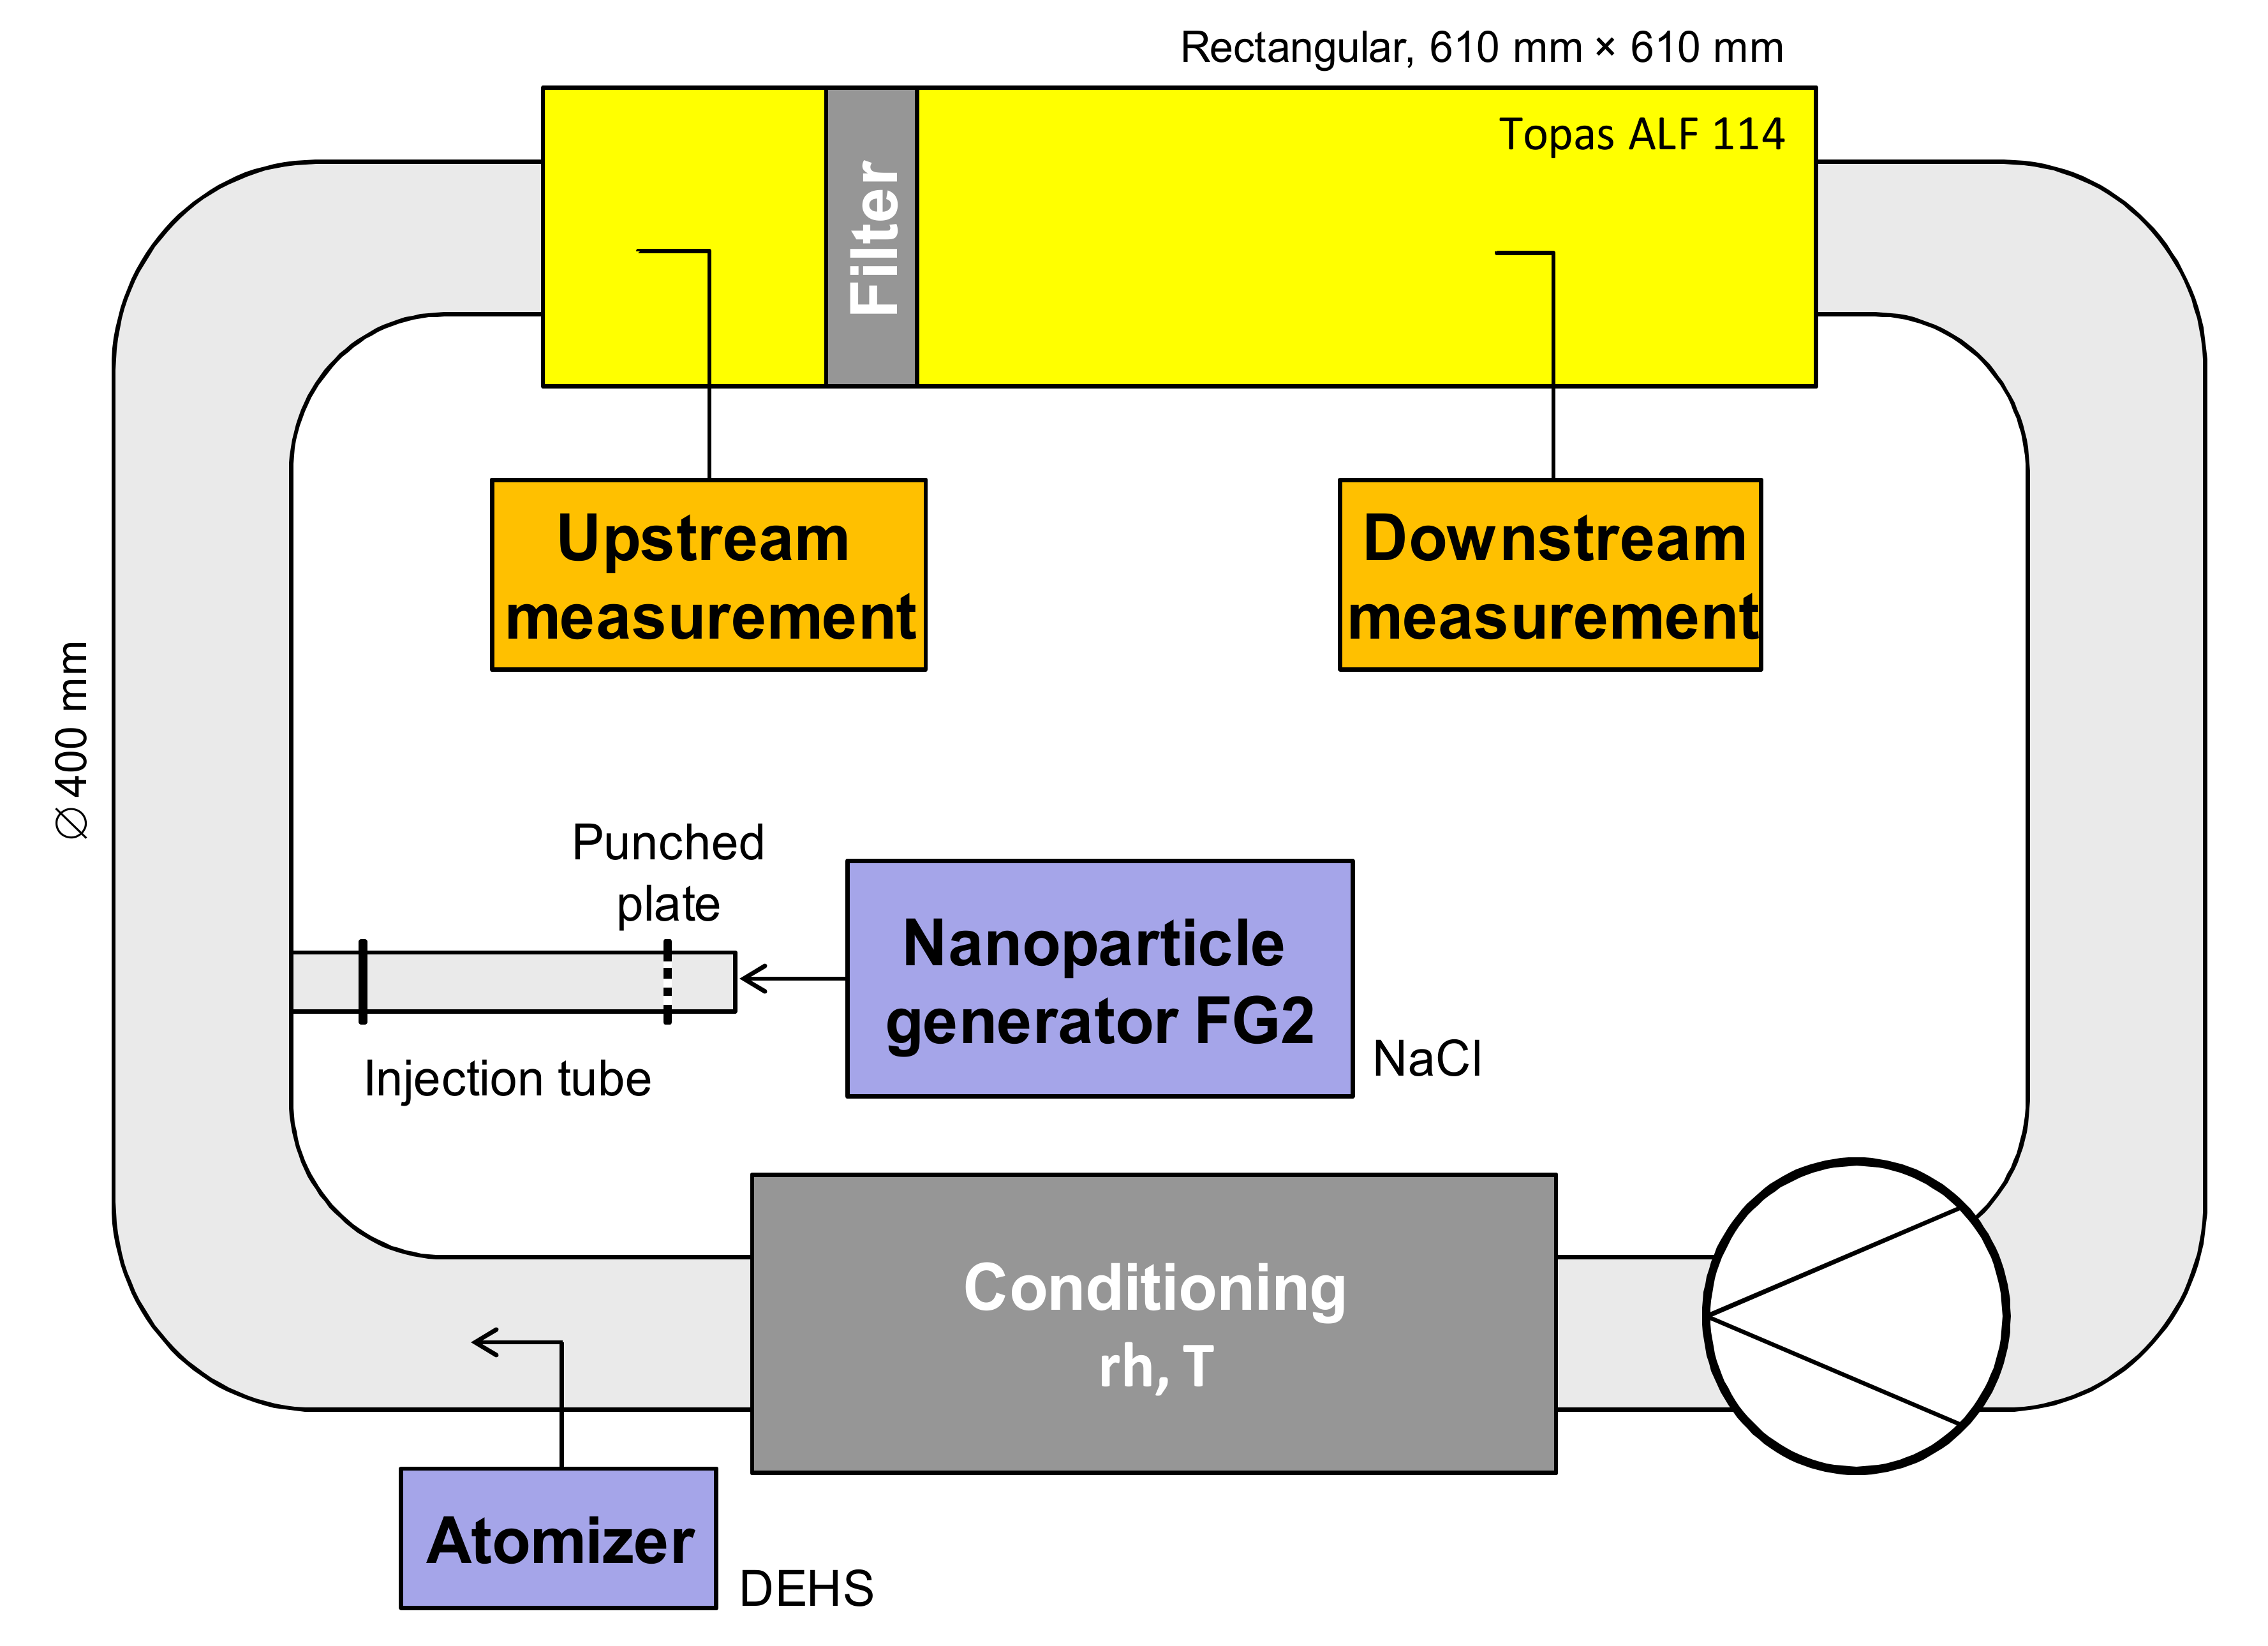
2.1. Experimental Setup
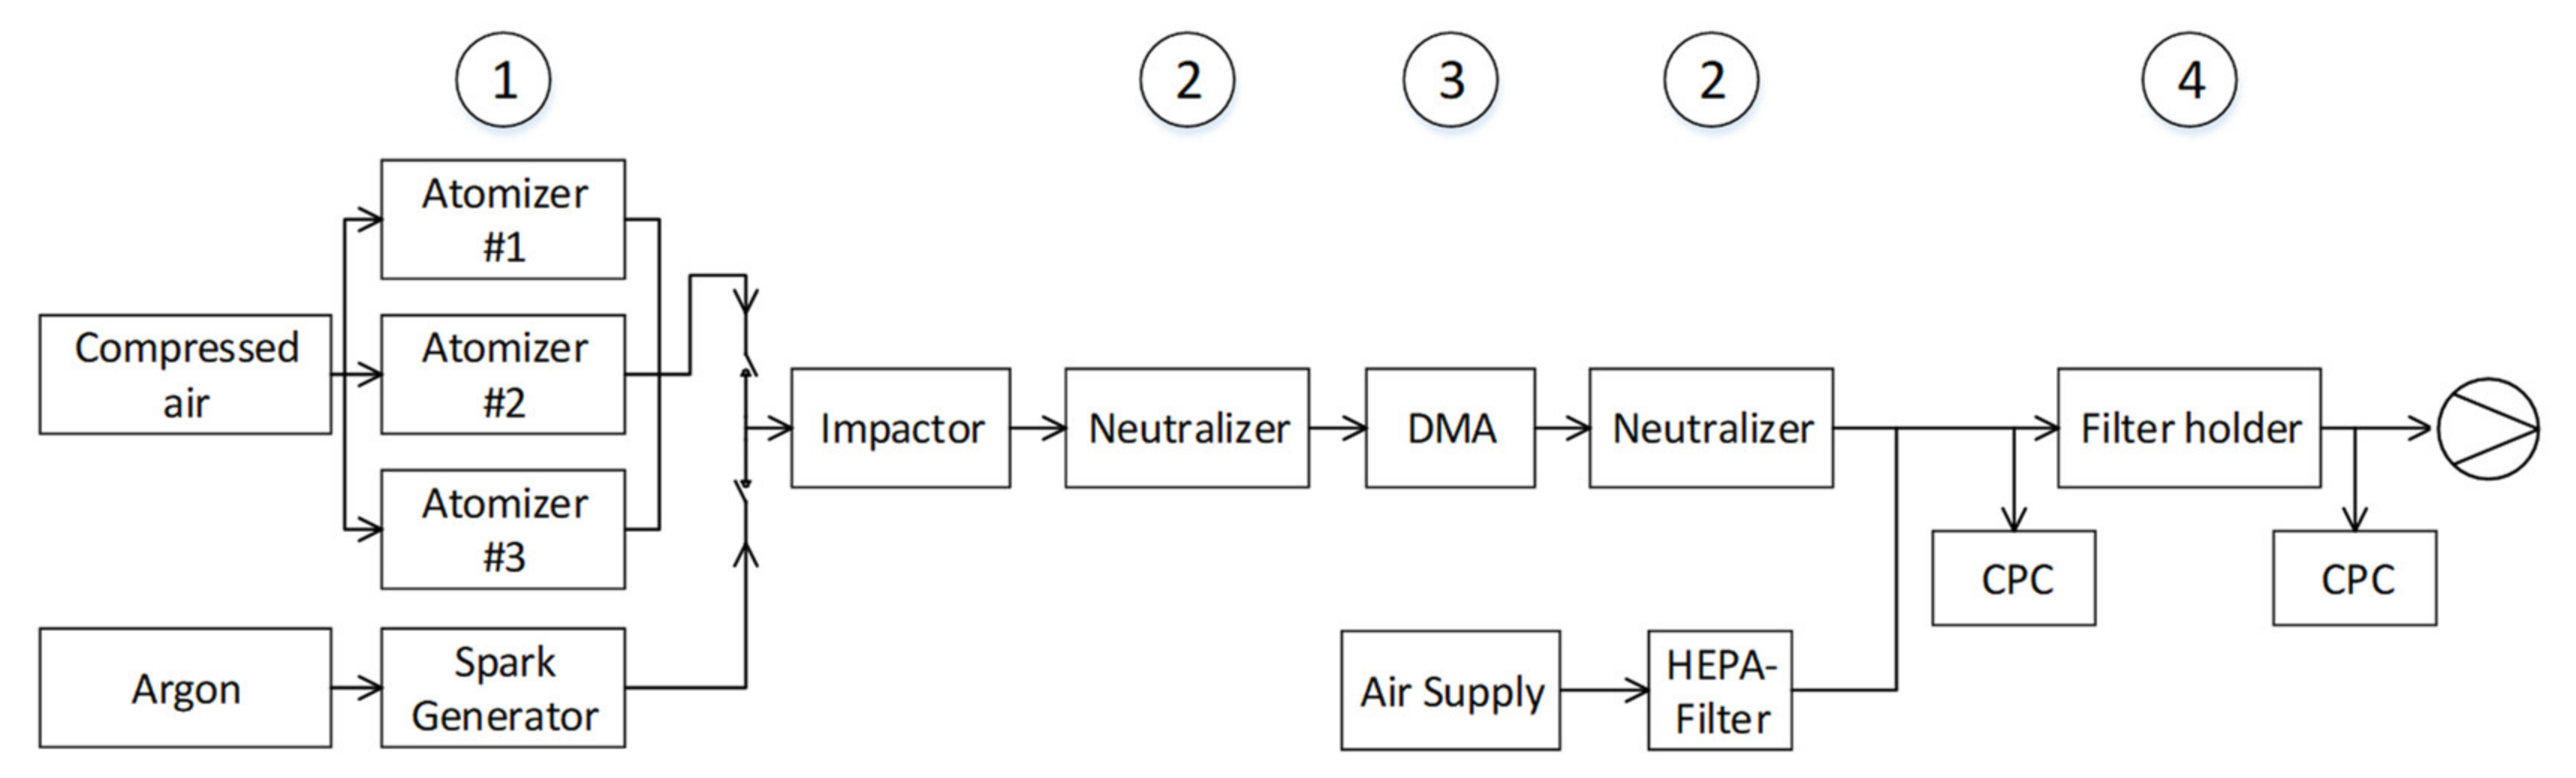
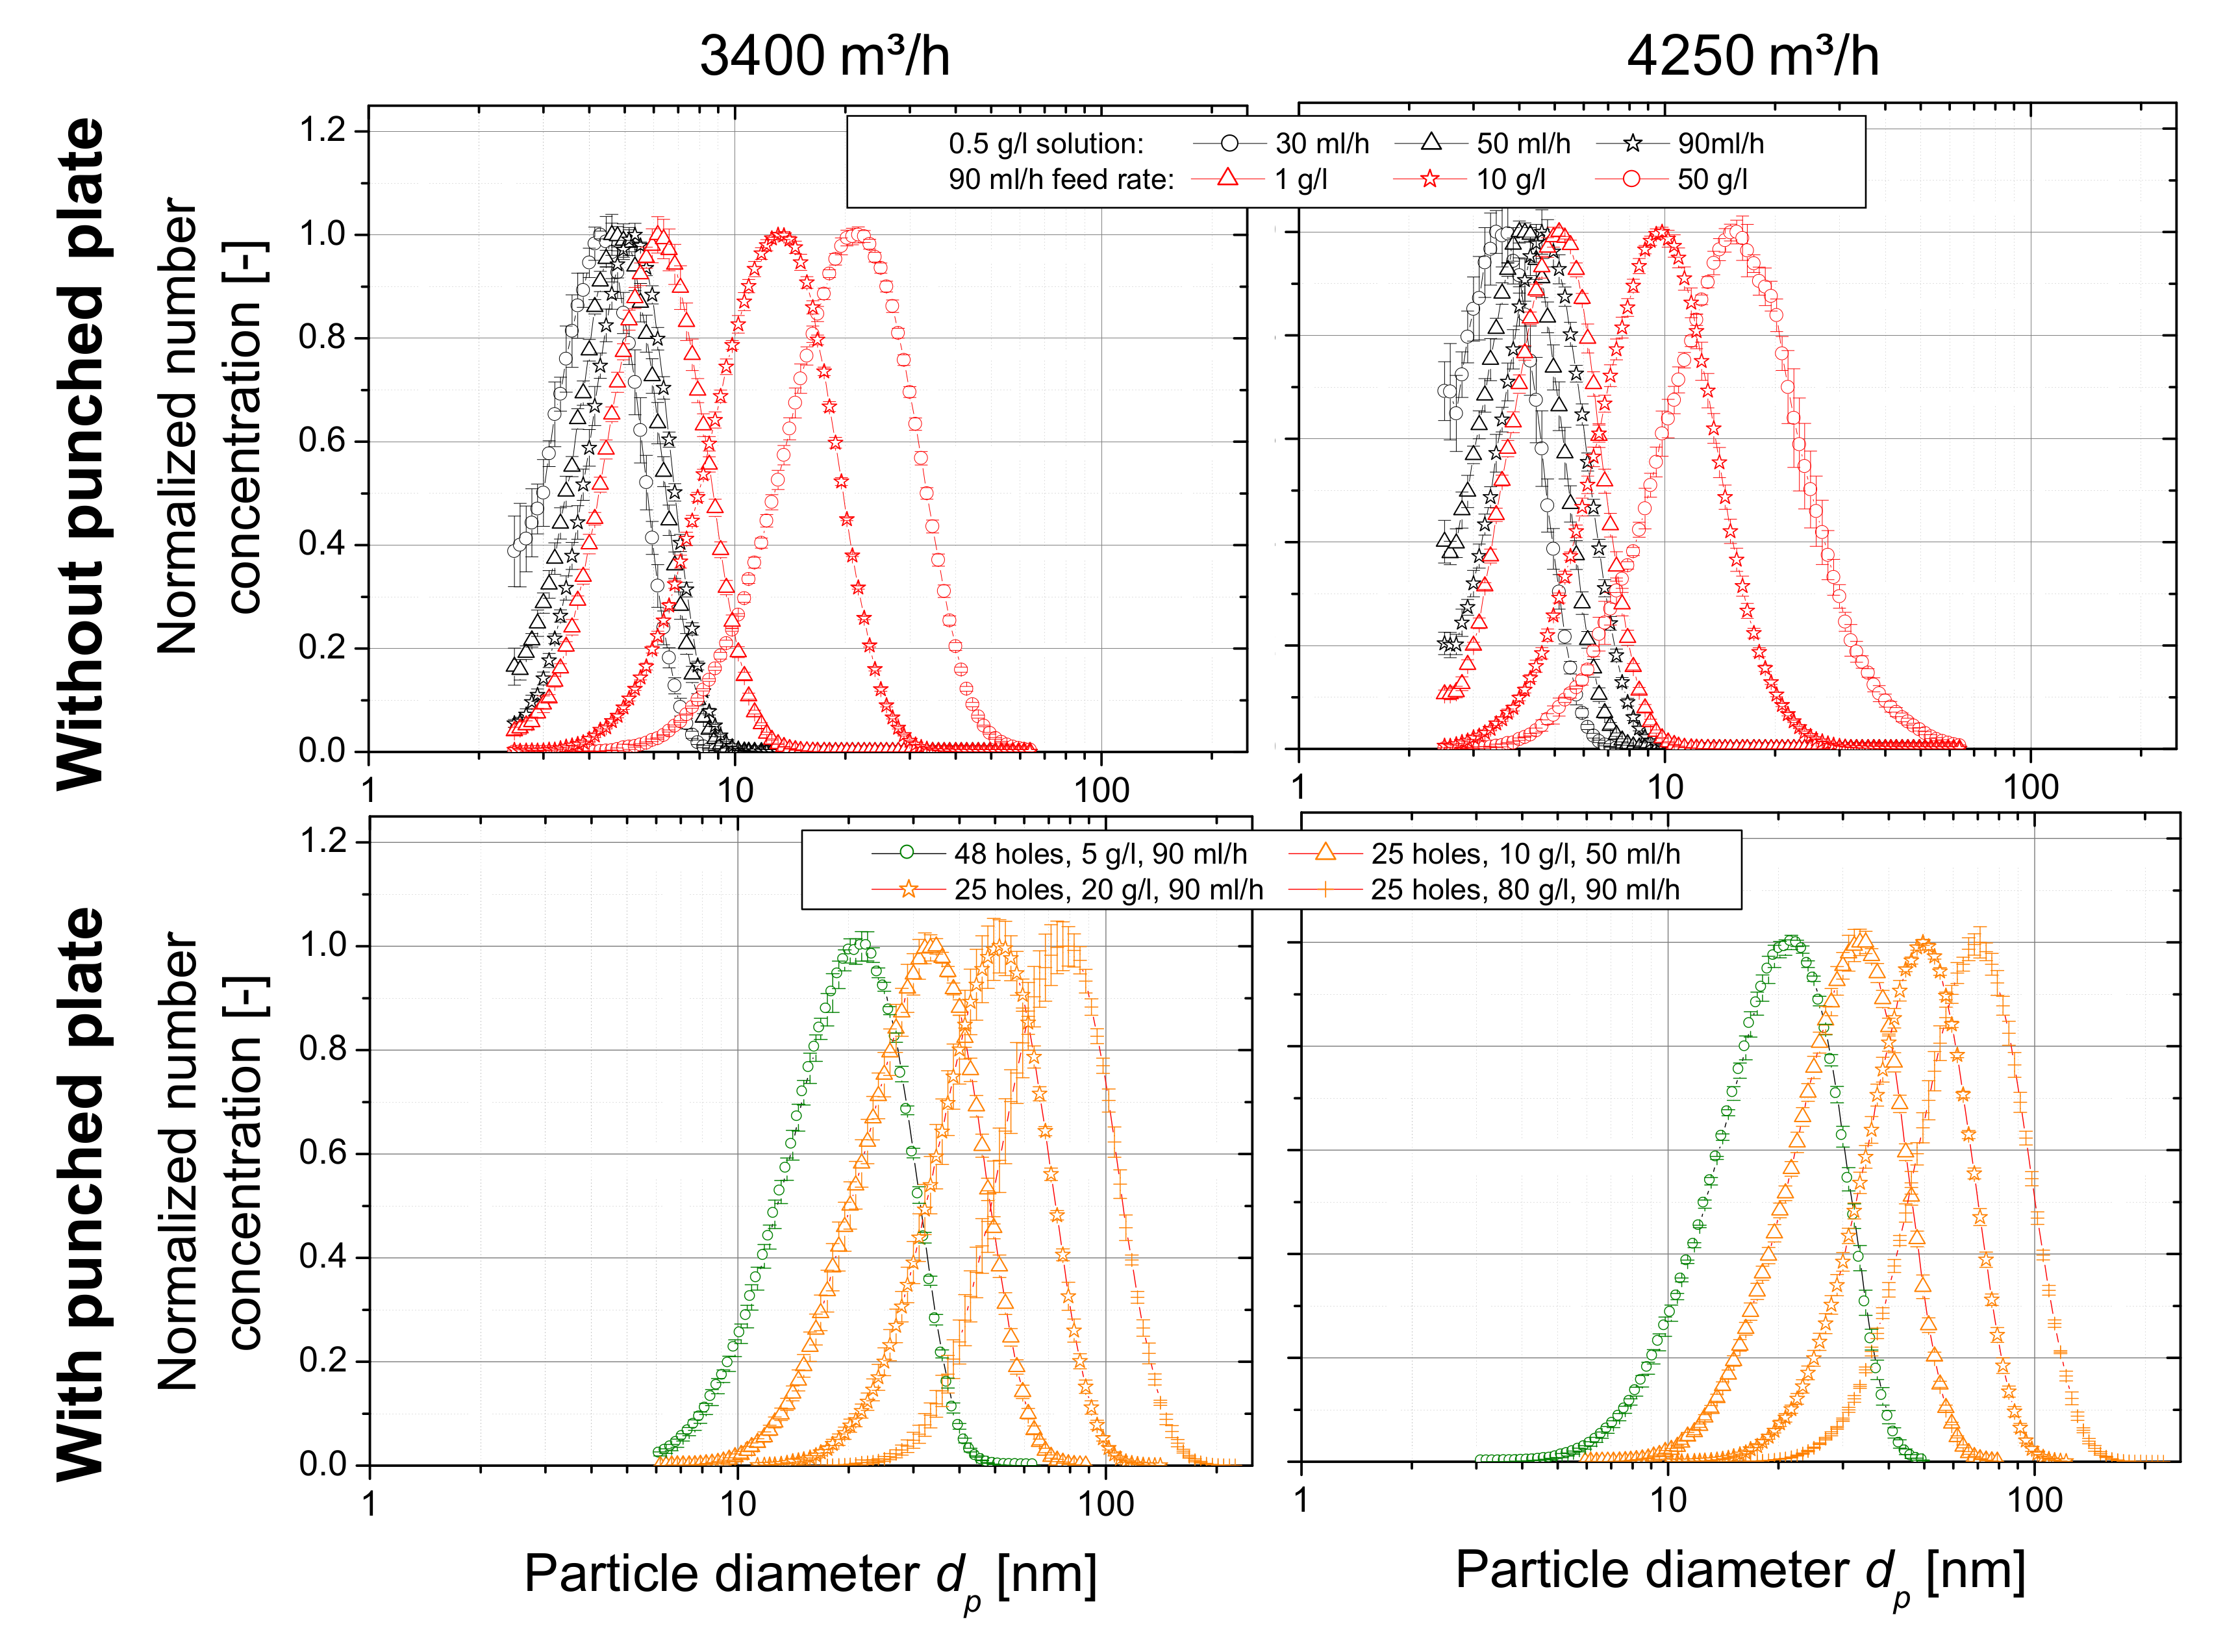
2.2. Size Distributions of the Test Aerosols
2.3. Test Procedures
3. Results and Discussion
3.1. F7 Filters
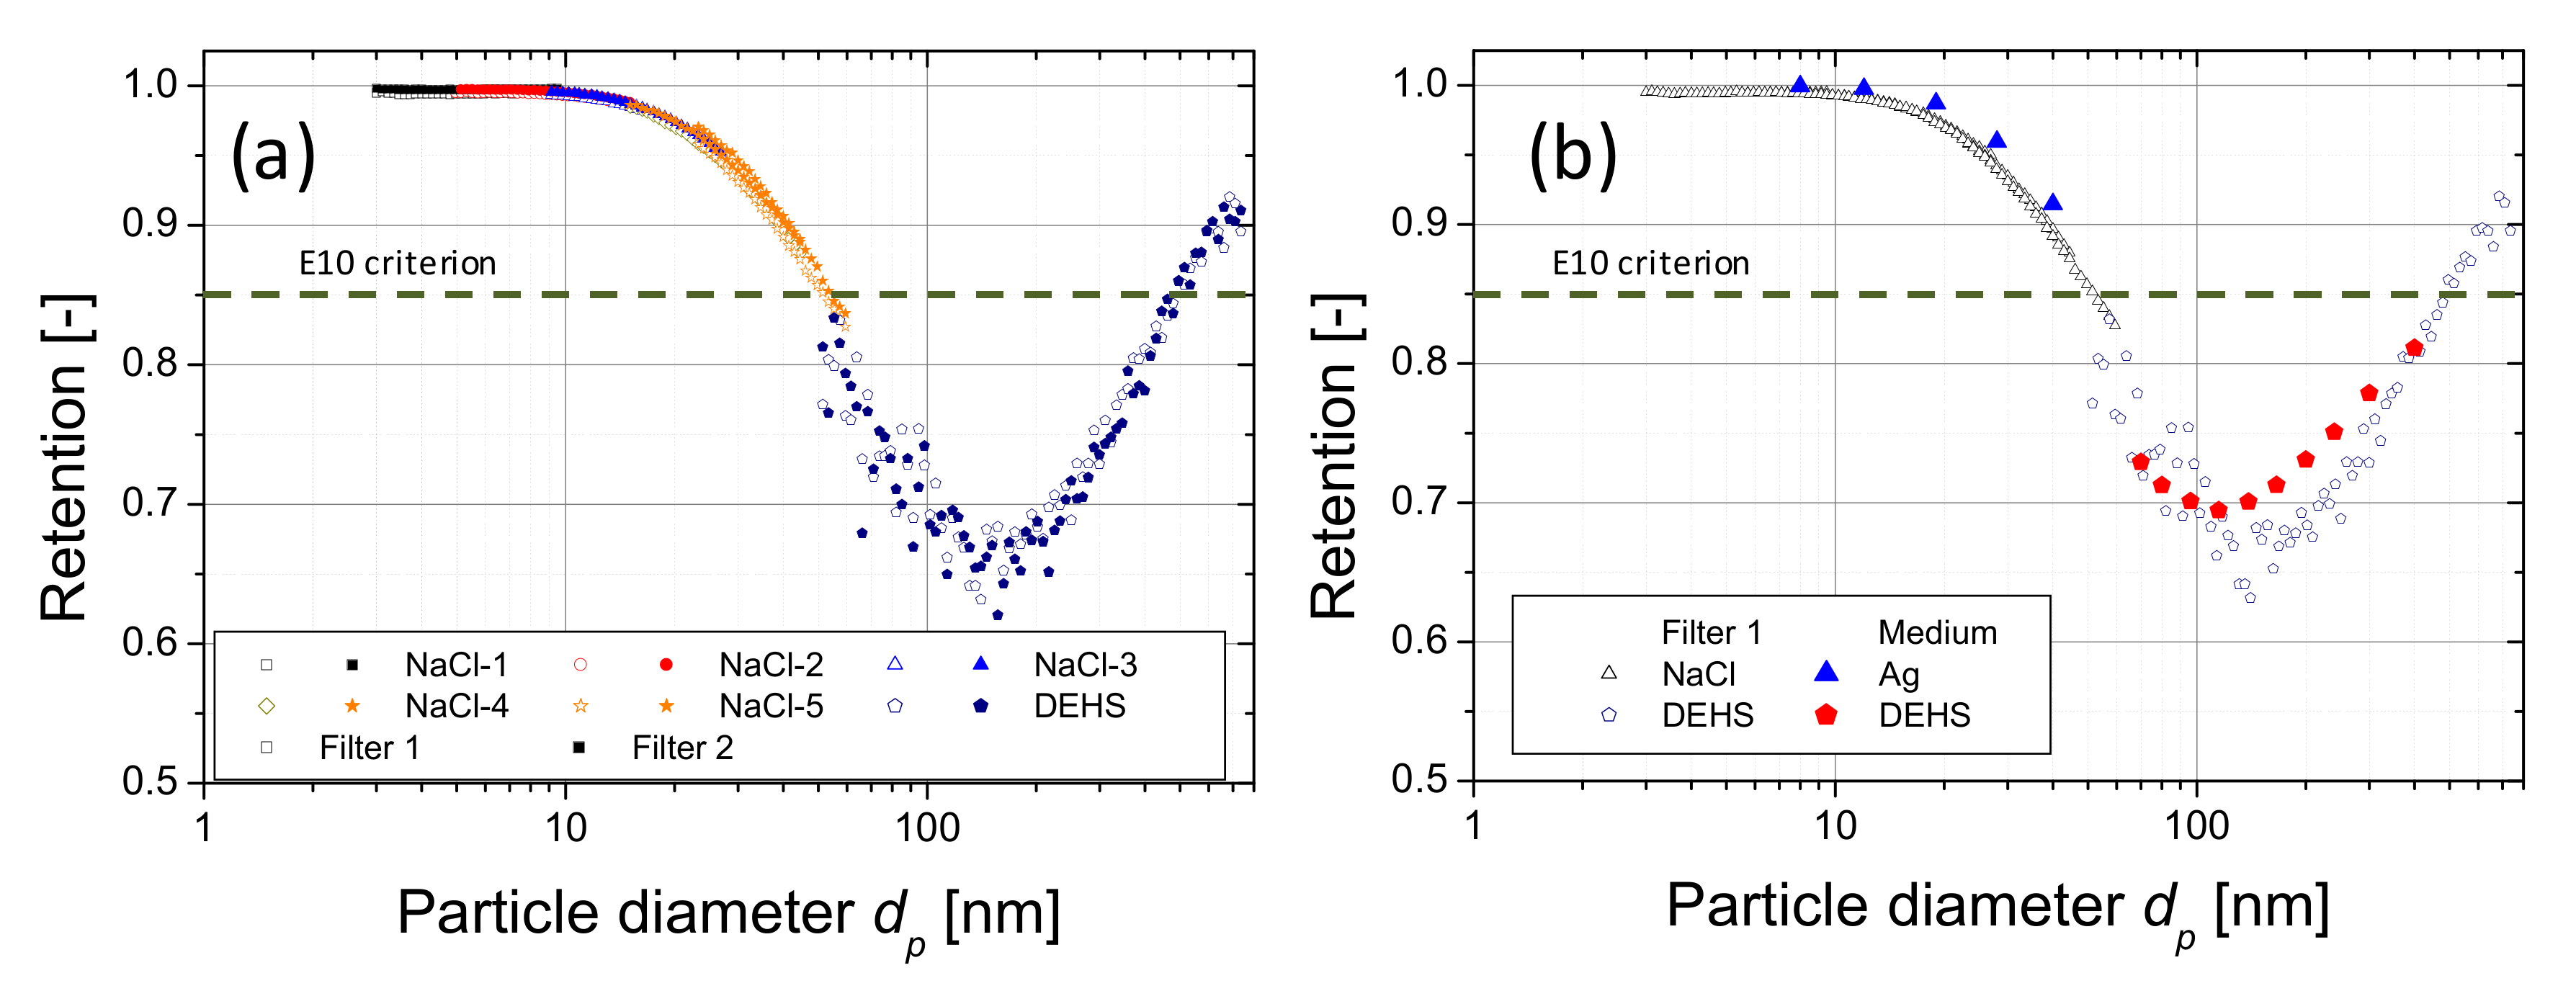
3.2. E10 Filters
3.3. H13 Filters
4. Conclusions
Supplementary Materials
Author Contributions
Funding
Acknowledgments
Conflicts of Interest
References
- Ibald-Mulli, A.; Wichmann, H.-E.; Kreyling, W.; Peters, A. Epidemiological Evidence on Health Effects of Ultrafine Particles. J. Aerosol Med. 2002, 15, 189–201. [Google Scholar] [CrossRef]
- Peters, A.; Wichmann, H.-E.; Tuch, T.; Heinrich, J.; Heyder, J. Respiratory effects are associated with the number of ultrafine particles. Am. J. Respir. Crit. Care Med. 1997, 155, 1376–1383. [Google Scholar] [CrossRef]
- Oberdörster, G. Pulmonary effects of inhaled ultrafine particles. Int. Arch. Occup. Environ. Health 2000, 74, 1–8. [Google Scholar] [CrossRef]
- Asbach, C.; Fissan, H.; Kim, J.H.; Yook, S.-J.; Pui, D.Y. Technical Note: Concepts for protection of EUVL masks from particle contamination. J. Nanoparticle Res. 2006, 8, 705–708. [Google Scholar] [CrossRef]
- ISO. ISO/TS 80004-2:2015 Nanotechnologies—Vocabulary—Part 2: Nano-Objects; Beuth Verlag: Berlin, Germany, 2015. [Google Scholar]
- Buseck, P.R.; Adachi, K. Nanoparticles in the Atmosphere. Elements 2008, 4, 389–394. [Google Scholar] [CrossRef]
- Sapkota, A.; Symons, J.M.; Kleissl, J.; Wang, L.; Parlange, M.B.; Ondov, J.; Breysse, P.N.; Diette, G.B.; Eggleston, P.A.; Buckley, T.J. Impact of the 2002 Canadian Forest Fires on Particulate Matter Air Quality in Baltimore City. Environ. Sci. Technol. 2005, 39, 24–32. [Google Scholar] [CrossRef]
- Clément, C. Gas-to-particle conversion in the atmosphere: I. Evidence from empirical atmospheric aerosols. Atmos. Environ. 1999, 33, 475–487. [Google Scholar] [CrossRef]
- Zhang, R.; Khalizov, A.; Wang, L.; Hu, M.; Xu, W. Nucleation and Growth of Nanoparticles in the Atmosphere. Chem. Rev. 2011, 112, 1957–2011. [Google Scholar] [CrossRef]
- Bauer, F.; Flyunt, R.; Czihal, K.; Buchmeiser, M.R.; Langguth, H.; Mehnert, R. Nano/Micro Particle Hybrid Composites for Scratch and Abrasion Resistant Polyacrylate Coatings. Macromol. Mater. Eng. 2006, 291, 493–498. [Google Scholar] [CrossRef]
- Liu, Y.; Tang, J.; Wang, R.; Lu, H.; Li, L.; Kong, Y.; Qi, K.; Xin, J.H. Artificial lotus leaf structures from assembling carbon nanotubes and their applications in hydrophobic textiles. J. Mater. Chem. 2007, 17, 1071–1078. [Google Scholar] [CrossRef]
- Aricò, A.S.; Bruce, P.; Scrosati, B.; Tarascon, J.-M.; Van Schalkwijk, W. Nanostructured materials for advanced energy conversion and storage devices. Nat. Mater. 2005, 4, 366–377. [Google Scholar] [CrossRef]
- Dahl, A.; Gharibi, A.; Swietlicki, E.; Gudmundsson, A.; Boghard, M.; Ljungman, A.; Blomqvist, G.; Gustafsson, M. Traffis-generated emissions of ultrafine particles from pavement-tire interface. Atmos. Environ. 2006, 40, 1314–1323. [Google Scholar] [CrossRef]
- Zhu, Y.; Hinds, W.C.; Kim, S.; Sioutas, C. Concentration and Size Distribution of Ultrafine Particles Near a Major Highway. J. Air Waste Manag. Assoc. 2002, 52, 1032–1042. [Google Scholar] [CrossRef]
- Maguhn, J.; Karg, E.; Kettrup, A.; Zimmermann, R. On-line Analysis of the Size Distribution of Fine and Ultrafine Aerosol Particles in Flue and Stack Gas of a Municipal Waste Incineration Plant: Effects of Dynamic Process Control Measures and Emission Reduction Devices. Environ. Sci. Technol. 2003, 37, 4761–4770. [Google Scholar] [CrossRef]
- Wang, Y.; Hopke, P.; Chalupa, D.; Utell, M. Effect of teh shutdown of a coal-fired power plant on urban ultrafine particles and other pollutants. Aerosol Sci. Technol. 2011, 45, 1245–1249. [Google Scholar] [CrossRef]
- Géhin, E.; Ramalho, O.; Kirchner, S. Size distribution and emission rate measurement of fine and ultrafine particle from indoor human activities. Atmos. Environ. 2008, 42, 8341–8352. [Google Scholar] [CrossRef]
- Jin, Y.-H.; Cai, L.; Cheng, Z.-S.; Cheng, H.; Deng, T.; Fan, Y.-P.; Fang, C.; Huang, D.; Huang, L.-Q.; Huang, Q.; et al. A rapid advice guideline for the diagnosis and treatment of 2019 novel coronavirus (2019-nCoV) infected pneumonia (standard version). Mil. Med Res. 2020, 7, 4. [Google Scholar] [CrossRef]
- EN. DIN EN779:2012 Particulate Air Filters for General Ventilation—Determination of the Filtration Performance; Beuth Verlag: Berlin, Germany, 2012. [Google Scholar]
- EN. DIN EN 1822-1:2019 High Efficiency Air Filters (EPA, HEPA and ULPA)—Classification, Performance Testing, Marking; Beuth Verlag: Berlin, Germany, 2019. [Google Scholar]
- ISO. DIN EN ISO 16890-1:2016 Air Filters for General Ventilation—Part 1: Technical Specifications, Requirements and Classification System Based Upon Particulate Matter Efficiency (ePM); Beuth Verlag: Berlin, Germany, 2016. [Google Scholar]
- ISO. DIN EN ISO 29463-2: High-Efficiency Filters and Filter Media for Removing Particles in Air—Part 2: Aerosol Production, Measuring Equipment and Particle Counting Statistics; Beuth Verlag: Berlin, Germany, 2018. [Google Scholar]
- Renz, M. Reinraumanlagen für Mikroelektronik und Pharma. In Reinraumtechnik; Springer Verlag: Berlin/Heidelberg, Germany, 2012; pp. 151–192. [Google Scholar]
- Brown, R. Air Filtration—An Integrated Approach to the Theory and Applications of Fibrous Filters; Pergamon Press: Exeter, UK, 1993. [Google Scholar]
- Lathrache, R.; Fissan, H. Enhancement of particle deposition in filters due to electrostatic effects. In Proceedings of the fourth World Filtration Congress, Ostend, Belgium, 22–25 April 1986; pp. 7.55–7.63. [Google Scholar]
- Lathrache, R.; Fissan, H. Enhancement of particle deposition in filters due to electrostatic effects. Filtr. Sep. 1987, 24, 418–422. [Google Scholar]
- Lathrache, R.; Fissan, H. Fractional Penetrations for Electrostatically Charged Fibrous Filters in the Submicron Particle Size Range. Part. Part. Syst. Charact. 1986, 3, 74–80. [Google Scholar] [CrossRef]
- Kerner, M.; Schmidt, K.; Hellmann, A.; Schumacher, S.; Pitz, M.; Asbach, C.; Ripperger, S.; Antonyuk, S. Numerical and experimental study of submicron aerosol deposition in electret microfiber nonwovens. J. Aerosol Sci. 2018, 122, 32–44. [Google Scholar] [CrossRef]
- Hinds, W. Aerosol Technology: Properties, Behavior, and Measurement of Airborne Particles; Wiley: New York, NY, USA, 1999. [Google Scholar]
- Kim, S.C.; Harrington, M.S.; Pui, D.Y. Experimental study of nanoparticles penetration through commercial filter media. Nanotechnol. Occup. Health 2007, 9, 117–125. [Google Scholar]
- Kim, C.S.; Bao, L.; Okuyama, K.; Shimada, M.; Niinuma, H. Filtration efficiency of a fibrous filter for nanoparticles. J. Nanoparticle Res. 2006, 8, 215–221. [Google Scholar] [CrossRef]
- Cyrs, W.; Boysen, D.; Casuccio, G.; Lersch, T.; Peters, T. Nanoparticle collection efficiency of capillary pore membrane filters. J. Aerosol Sci. 2010, 41, 655–664. [Google Scholar] [CrossRef]
- Huang, S.; Chen, C.; Chang, C.; Lai, C.; Chen, C. Penetration of 4.5 nm to 10 µm aerosol particles through fibrous filters. J. Aerosol Sci. 2007, 38, 719–727. [Google Scholar] [CrossRef]
- Japuntich, D.A.; Franklin, L.M.; Pui, D.Y.H.; Kuehn, T.H.; Kim, S.C.; Viner, A.S. A comparison of two nano-sized particle air filtration tests in the diameter range of 10 to 400 nanometers. Nanotechnol. Occup. Health 2007, 9, 93–107. [Google Scholar]
- Heim, M.; Mullins, B.; Wild, M.; Meyer, J.; Kasper, G. Filtration Efficiency of Aerosol Particles Below 20 Nanometers. Aerosol Sci. Technol. 2005, 39, 782–789. [Google Scholar] [CrossRef]
- Heim, M.; Attoui, M.; Kasper, G. The efficiency of diffusional particle collection onto wire grids in the mobility equivalent size range of 1.2–8nm. J. Aerosol Sci. 2010, 41, 207–222. [Google Scholar] [CrossRef]
- Ichitsubo, H.; Hashimoto, T.; Alonso, M.; Kousaka, Y. Penetration of Ultrafine Particles and Ion Clusters Through Wire Screens. Aerosol Sci. Technol. 1996, 24, 119–127. [Google Scholar] [CrossRef]
- Shin, W.G.; Mulholland, G.; Kim, S.; Pui, D. Experimental study of filtration efficiency of nanoparticles below 20 nm at elevated temperatures. J. Aerosol Sci. 2008, 39, 488–499. [Google Scholar] [CrossRef]
- Rengasamy, S.; King, W.P.; Eimer, B.C.; Shaffer, R.E. Filtration Performance of NIOSH-Approved N95 and P100 Filtering Facepiece Respirators Against 4 to 30 Nanometer-Size Nanoparticles. J. Occup. Environ. Hyg. 2008, 5, 556–564. [Google Scholar] [CrossRef]
- Bałazy, A.; Toivola, M.; Reponen, T.; Podgórski, A.; Zimmer, A.; Grinshpun, S.A. Manikin-Based Performance Evaluation of N95 Filtering-Facepiece Respirators Challenged with Nanoparticles. Ann. Occup. Hyg. 2005, 50, 259–269. [Google Scholar]
- Bałazy, A.; Toivola, M.; Adhikari, A.; Sivasubramani, S.K.; Reponen, T.; Grinshpun, S.A. Do N95 respirators provide 95% protection level against airborne viruses, and how adequate are surgical masks? Am. J. Infect. Control 2006, 34, 51–57. [Google Scholar] [CrossRef]
- Sachinidou, P.; Bahk, Y.K.; Tang, M.; Zhang, N.; Chen, S.S.; Pui, D.Y.; Lima, B.D.A.; Bosco, G.; Tronville, P.; Mosimann, T.; et al. Inter-Laboratory Validation of the Method to Determine the Filtration Efficiency for Airborne Particles in the 3–500 nm Range and Results Sensitivity Analysis. Aerosol Air Qual. Res. 2017, 17, 2669–2680. [Google Scholar] [CrossRef]
- Wang, J. Effects of Particle Size and Morphology on Filtration of Airborne Nanoparticles. KONA Powder Part. J. 2013, 30, 256–266. [Google Scholar] [CrossRef]
- Wang, J.; Chen, D.R.; Pui, D.Y.H. Modeling of filtration efficiency of nanoparticles in standard filter media. Nanotechnol. Occup. Health 2007, 9, 109–115. [Google Scholar]
- Thomas, D.; Mouret, G.; Cadavid-Rodriguez, M.; Chazelet, S.; Bémer, D. An improved model for the penetration of charged and neutral aerosols in the 4 to 80nm range through stainless steel and dielectric meshes. J. Aerosol Sci. 2013, 57, 32–44. [Google Scholar] [CrossRef]
- Wang, C.-S.; Otani, Y. Removal of Nanoparticles from Gas Streams by Fibrous Filters: A Review. Ind. Eng. Chem. Res. 2012, 52, 5–17. [Google Scholar] [CrossRef]
- Wang, J.; Tronville, P. Toward standardizable test methods to determine the effectiveness of filtration media against airborne nanoparticles. J. Nanoparticle Res. 2014, 16, 2417. [Google Scholar] [CrossRef]
- Hecker, R.; Hofacre, K. Development of Performance Data for Common Building Air Cleaning Devices (Final Report No.: EPA/600/R-08/013); U.S. Environmental Protection Agency, Office of Research and Development/Homeland Securoty Research Center: Research Triangle Park, NC, USA, 2008.
- Azimi, P.; Zhao, D.; Stephens, B. Estimates of HVAC filtration efficiency for fine and ultrafine particles of outdoor origin. Atmos. Environ. 2014, 98, 337–346. [Google Scholar] [CrossRef]
- Stephens, B.; Siegel, J.A. Ultrafine particle removal by residential heating, ventilating, and air-conditioning filters. Indoor Air 2013, 23, 488–497. [Google Scholar] [CrossRef]
- Wang, S.C.; Flagan, R.C. Scanning Electrical Mobility Spectrometer. Aerosol Sci. Technol. 1990, 13, 230–240. [Google Scholar] [CrossRef]
- EN. DIN EN 1822-3:2011 High Efficiency ais Filters (EPA, HEPA and ULPA)–Part 3: Testing Flat Sheet Filter Media; Beuth Verlag: Berlin, Germany, 2011. [Google Scholar]
- Monsé, C.; Monz, C.; Dahmann, D.; Asbach, C.; Stahlmecke, B.; Lichtenstein, N.; Buchwald, K.-E.; Merget, R.; Bünger, J.; Brüning, T. Development and Evaluation of a Nanoparticle Generator for Human Inhalation Studies with Airborne Zinc Oxide. Aerosol Sci. Technol. 2014, 48, 418–426. [Google Scholar] [CrossRef]
- Mäkelä, J.; Haapanen, J.; Harra, J.; Juuti, P.; Kujanpää, S. Liquid flame spary–A hydrogen-oxygen flame based method for nanoparticle synthesis and functional nanocoatings. KONA Powder Part. J. 2017, 34, 141–154. [Google Scholar] [CrossRef]
- Warren, D.R.; Seinfeld, J.H. Simulation of Aerosol Size Distribution Evolution in Systems with Simultaneous Nucleation, Condensation, and Coagulation. Aerosol Sci. Technol. 1985, 4, 31–43. [Google Scholar] [CrossRef]
- Kulmala, M. ATMOSPHERIC SCIENCE: How Particles Nucleate and Grow. Science 2003, 302, 1000–1001. [Google Scholar] [CrossRef]
- Sinclair, D.; La Mer, V.K. Light Scattering as a Measure of Particle Size in Aerosols. The Production of Monodisperse Aerosols. Chem. Rev. 1949, 44, 245–267. [Google Scholar] [CrossRef]
- Scheibel, H.; Porstendo, J. Generation of monodisperse Ag- and NaCl-aerosols with particle diameters between 2 and 300 nm. J. Aerosol Sci. 1983, 14, 113–126. [Google Scholar] [CrossRef]
- Asbach, C.; Schmitz, A.; Schmidt, F.; Monz, C.; Todea, A.M. Intercomparison of a Personal CPC and Different Conventional CPCs. Aerosol Air Qual. Res. 2017, 17, 1132–1141. [Google Scholar] [CrossRef]
- VDI. VDI 3491—Part 1: Measurement of Particles—Methods for Generating test Aerosols, Principles and Overview; Beuth Verlag: Berlin, Germany, 2016. [Google Scholar]
- Liu, B.Y.; Pui, D.Y. A submicron aerosol standard and the primary, absolute calibration of the condensation nuclei counter. J. Colloid Interface Sci. 1974, 47, 155–171. [Google Scholar] [CrossRef]
- Fuchs, N.A. On the stationary charge distribution on aerosol particles in a bipolar ionic atmosphere. Pure Appl. Geophys. 1963, 56, 185–193. [Google Scholar] [CrossRef]
- Wiedensohler, A. An approximation of the bipolar charge distribution for particles in the submicron size range. J. Aerosol Sci. 1988, 19, 387–389. [Google Scholar] [CrossRef]
- Tigges, L.; Wiedensohler, A.; Weinhold, K.; Gandhi, J.; Schmid, H.-J. Bipolar charge distribution of a soft X-ray diffusion charger. J. Aerosol Sci. 2015, 90, 77–86. [Google Scholar] [CrossRef]
- Reischl, G. The relationship of input and output aerosol characteristics for an ideal differential mobility analyser particle standard. J. Aerosol Sci. 1991, 22, 297–312. [Google Scholar] [CrossRef]
- He, M.; Dhaniyala, S.; Wagner, M. Aerosol Filtration with Mobility-classified Particles: Role of Multiply-charged Particles in Skewing Penetration Measurements. Aerosol Sci. Technol. 2015, 49, 705–716. [Google Scholar] [CrossRef]
- Yli-Ojanperä, J.; Mäkelä, J.M.; Marjamäki, M.; Rostedt, A.; Keskinen, J. Towards traceable particle number concentration standard: Single charged aerosol reference (SCAR). J. Aerosol Sci. 2010, 41, 719–728. [Google Scholar] [CrossRef]
- Hontañón, E.; Kruis, F.E. A Differential Mobility Analyzer (DMA) for Size Selection of Nanoparticles at High Flow Rates. Aerosol Sci. Technol. 2009, 43, 25–37. [Google Scholar] [CrossRef]
- Hontañón, E.; Rouenhoff, M.; Azabal, A.; Ramiro, E.; Kruis, F.E. Assessment of a Cylindrical and a Rectangular Plate Differential Mobility Analyzer for Size Fractionation of Nanoparticles at High-Aerosol Flow Rates. Aerosol Sci. Technol. 2014, 48, 333–339. [Google Scholar] [CrossRef]
- Hoppel, W. Determination of the aerosol size distribution from teh mobility distribution of the charged fraction of aerosols. J. Aerosol Sci. 1978, 9, 41–54. [Google Scholar] [CrossRef]
- Fissan, H.; Helsper, C.; Thielen, H. Determination of particle size distributions by means of an electrostatic classifier. J. Aerosol Sci. 1983, 14, 354–357. [Google Scholar] [CrossRef]


| Filter Class | F7 | F8 | F9 | E10 | E11 | E12 | H13 | H14 | U15 | U16 | U17 |
|---|---|---|---|---|---|---|---|---|---|---|---|
| Standard | EN779 | EN1822 | |||||||||
| min. Efficiency (%) | 35 1 | 55 1 | 70 1 | 85 3 | 95 3 | 99.5 3 | 99.95 3 | 99.995 3 | 99.9995 3 | 99.99995 3 | 99.999995 3 |
| avg. Efficiency (%) | 40–60 2 | 90–95 2 | ≥95 2 | n/a | n/a | n/a | n/a | n/a | n/a | n/a | n/a |
| Flow Rate Test Rig [m3/h] | Injection Tube Length [mm] | Punched Plate | Injection Flow Rate [m3/h] | Residence Time [s] |
|---|---|---|---|---|
| 3400 | 338 | none | 561.0 ± 7.04 | 0.021 ± 0.0003 |
| 840 | none | 632.6 ±4.46 | 0.047 ± 0.0003 | |
| 1400 | 25 holes | 24.7 ± 0.20 | 2.010 ± 0.0167 | |
| 1400 | 48 holes | 65.4 ± 0.20 | 0.759 ± 0.0024 | |
| 4250 | 338 | none | 631.6 ± 14.64 | 0.019 ± 0.0004 |
| 840 | none | 746.1 ± 0.74 | 0.040 ± 0.0000 | |
| 1400 | 25 holes | 29.9 ± 0.41 | 1.660 ± 0.0229 | |
| 1400 | 48 holes | 80.3 ± 0.54 | 0.619 ± 0.0042 |
| Aerosol Substance | NaCl-1 | NaCl-2 | NaCl-3 | NaCl-4 | NaCl-5 | NaCl-6 | NaCl-7 | DEHS | |
|---|---|---|---|---|---|---|---|---|---|
| 3000 m3/h | Solution [g/L] | 1 | 1 | 5 | 10 | 20 | 40 | 80 | n/a |
| Solution feed rate [mL/h] | 40 | 99 | 90 | 50 | 90 | 90 | 90 | n/a | |
| Punched plate | 48 holes | 48 holes | 48 holes | 25 holes | 25 holes | 25 holes | 25 holes | n/a | |
| Mode [nm] | 7.9 | 11.5 | 19.4 | 29.4 | 49.2 | 60.4 | 74.3 | n/a | |
| GSD | 1.37 | 1.42 | 1.45 | 1.47 | 1.42 | 1.39 | 1.4 | n/a | |
| Number Conc. [1/cm3] | 1.2 × 10⁷ | 8.7 × 10⁶ | 6.2 × 10⁶ | 1.7 × 10⁶ | 1.2 × 10⁶ | 1.4 × 10⁶ | 1.3 × 10⁶ | n/a | |
| 4250 m3/h | Solution [g/L] | 1 | 1 | 5 | 10 | 20 | n/a | n/a | pure |
| Solution feed rate [mL/h] | 50 | 90 | 90 | 50 | 90 | n/a | n/a | n/a | |
| Punched plate | none | 48 holes | 48 holes | 25 holes | 25 holes | n/a | n/a | n/a | |
| Mode [nm] | 5.9 | 11.8 | 20.9 | 34.6 | 51.4 | n/a | n/a | 233 | |
| GSD | 1.34 | 1.42 | 1.47 | 1.42 | 1.4 | n/a | n/a | 1.81 | |
| Number Conc. [1/cm3] | 3.4 × 10⁷ | 8.9 × 10⁶ | 6.6 × 10⁶ | 1.6 × 10⁶ | 1.6 × 10⁶ | n/a | n/a | 1.4 × 10⁴ | |
Publisher’s Note: MDPI stays neutral with regard to jurisdictional claims in published maps and institutional affiliations. |
© 2020 by the authors. Licensee MDPI, Basel, Switzerland. This article is an open access article distributed under the terms and conditions of the Creative Commons Attribution (CC BY) license (http://creativecommons.org/licenses/by/4.0/).
Share and Cite
Todea, A.M.; Schmidt, F.; Schuldt, T.; Asbach, C. Development of a Method to Determine the Fractional Deposition Efficiency of Full-Scale HVAC and HEPA Filter Cassettes for Nanoparticles ≥3.5 nm. Atmosphere 2020, 11, 1191. https://doi.org/10.3390/atmos11111191
Todea AM, Schmidt F, Schuldt T, Asbach C. Development of a Method to Determine the Fractional Deposition Efficiency of Full-Scale HVAC and HEPA Filter Cassettes for Nanoparticles ≥3.5 nm. Atmosphere. 2020; 11(11):1191. https://doi.org/10.3390/atmos11111191
Chicago/Turabian StyleTodea, Ana Maria, Frank Schmidt, Tobias Schuldt, and Christof Asbach. 2020. "Development of a Method to Determine the Fractional Deposition Efficiency of Full-Scale HVAC and HEPA Filter Cassettes for Nanoparticles ≥3.5 nm" Atmosphere 11, no. 11: 1191. https://doi.org/10.3390/atmos11111191
APA StyleTodea, A. M., Schmidt, F., Schuldt, T., & Asbach, C. (2020). Development of a Method to Determine the Fractional Deposition Efficiency of Full-Scale HVAC and HEPA Filter Cassettes for Nanoparticles ≥3.5 nm. Atmosphere, 11(11), 1191. https://doi.org/10.3390/atmos11111191