Abstract
The agricultural sector is considered one of the major sources of greenhouse gas (GHG) emissions globally. The livestock industry as a significant contributor, is accounting for about 18% of GHG emissions measured in carbon dioxide (CO2) equivalent from agricultural practices. Depending on farming practices and climatic conditions, GHGs such as methane (CH4) and nitrous oxide (N2O) emissions from livestock agriculture can vary significantly. Country-specific emission factors are, therefore, needed for a precise estimation of GHG emissions and to avoid uncertainties. This study was aimed at estimating the CH4 and N2O emission fluxes from Hanwoo (the most famous and popular Korean native cattle) manure management systems. CH4 and N2O emission fluxes from litter in the Hanwoo cattle barn and composting lot were monitored and calculated for 52 weeks using the dynamic chamber method. The calculated monthly average fluxes of CH4 and N2O from litter in the cattle barn ranged from 0.0 to 30.0 ± 13.7 and 0.896 ± 0.557 to 2.925 ± 2.853 μg/m2 s, respectively during the whole measurement period. While during the composting period, the monthly average of CH4 and N2O emission fluxes were varied from 1.449 ± 0.783 to 86.930 ± 19.092 and 0.511 ± 0.410 to 2.629 ± 1.105 μg/m2 s, respectively. The calculated emission fluxes of CH4 and N2O from manure management systems in this study were almost 5.4 and 2.1 times, respectively higher than the values reported for the Asian, South and North American countries in the 2006 Intergovernmental Panel on Climate Change (IPCC) Guidelines for National Greenhouse Gas Inventories. Overall, this study initiates the process along with signifies the importance of developing country-specific GHG inventories for the effective reduction of GHG emissions from the livestock sector in Korea.
1. Introduction
Climate change has been one of the most significant and widely discussed challenges during the last few decades worldwide, with extreme weather patterns, sea level rise, change in ocean currents, and melting icecaps and glaciers [1]. Global climate change caused by greenhouse gas (GHG) emissions has been constantly illustrated with balances of nutrients in the agricultural setting. The livestock industry as a major contributor, is responsible for about 18% of GHG emissions measured in carbon dioxide (CO2) equivalent from the agricultural sector [2]. The 2006 Intergovernmental Panel on Climate Change (IPCC) guideline (GL) recognizes both CH4 and N2O gases as significant GHGs in the livestock sector and their impact on global warming [3]. CH4 and N2O have a global warming potential of 28–36 and 265–298 times that of CO2 over 100 years, respectively [4]. According to Food and Agriculture Organization (FAO), the livestock industry emits 37% of anthropogenic CH4 mainly from ruminant enteric fermentation, and 65% of anthropogenic N2O from manure management [1].
Gaseous emissions from livestock agriculture are generally affected by environmental conditions, ventilation rate, dietary composition, animal activities, animal life stage, manure properties (e.g., moisture content and pH), and manure management practices [5,6]. To measure GHG emissions, chamber-based (manual or automated) and micrometeorological (eddy covariance or gradient techniques) methods are generally used [3], while a combination of both approaches can also be adopted [7]. Compared to micrometeorological techniques, chamber-based techniques are widely used due to their simplicity, low operational cost and convenience [8]. However, chamber-based methods typically only cover short time intervals and have the drawback of biasing the environmental conditions known to affect GHG exchange such as temperature and humidity [3]. Over nearly a century, chamber measurements of trace gas fluxes between the surface of the ground and the atmosphere were carried out. Various chamber methods, including static (closed chamber/non-flow-through chamber) and dynamic (open chamber/flow-through chamber), are used to estimate GHG (CO2, CH4, N2O) fluxes with varying degrees of success [9,10]. Between the chamber techniques, the majority of studies used static chambers to measure the GHG emissions [11]. In a static chamber, the concentration of gas within the chamber increases over time because there is very little or no substitution of air in the headspace. Jørgensen et al., therefore, used fans to blend the air in the headspace to reduce bias from gradients of the vertical gas concentration [12]. On the other hand, in a dynamic chamber, continuous flow of outside air is maintained and the difference in concentration between entering and leaving air is measured. The continuous external airflow in the dynamic chambers helps to maintain a steady-state gas concentration gradient at the surface–air interface, hence, the GHG emissions can be measured uninterruptedly [13,14].
In Korea (hereafter referred as Korea), emissions from agricultural activities accounted for 3% of Korea’s total GHG emissions in 2013, showing a marginally higher increase when compared with 2006 (2.5%) [15,16] and as main contributors, CH4 and N2O represented 20% and 13% of the total emission from the agriculture sector [17]. Ji and Park reported that enteric CH4 emissions, CH4 and N2O emissions from livestock manure management in Korea showed annual growth rates of 1.7%, 2.6% and 3.2%, respectively from 1990 to 2009 [18]. The Korean government recently announced a roadmap to decrease the GHG emissions by 2030 [19], which proposed a reduction in overall GHG emissions from the agriculture sector by 5.2%. Currently, Korea is applying Tier 1 methods in IPCC 1996 GL to calculate GHG emissions livestock industries and planning to use 2006 GL by 2023. However, for a precise estimation of GHG emissions and to avoid uncertainties, the IPCC 2006 GL recommends each country to develop country-specific emission factors (EFs).
Korea is one of the countries having limited grazing land for ruminants, due to a shortage in arable lands and increased pressure on agricultural production. Moreover, over the past few decades, the dietary pattern of Korean people has changed from rice to animal products including meat, milk and eggs. Additional livestock products are, therefore, needed to fulfil growing demand, which ultimately leads to a rise in GHG emission levels from livestock agriculture. Hanwoo (Bos primigenius), the most dominant Korean native cattle are raised to meet beef production needs. According to the Hanwoo traceability system, the number of cattle amounted to 3.07 million in 2019, representing more than 86% of the total cattle population in Korea [20]. Hanwoo cattle has been identified as the major contributor of the GHG emissions from the cattle production sector in Korea as well as showed higher enteric GHG emissions than other breeds [21,22]. However, none of the studies have estimated GHG emissions from Hanwoo cattle manure management systems, which acts as the main hindrance to developing national GHG emissions statistics for livestock sector in Korea. Considering the above, this study was, therefore, aimed at investigating the CH4 and N2O emission fluxes from the Hanwoo cattle manure management systems using the dynamic chamber method.
2. Experiments
2.1. Research Site and Description
This research was conducted from 2 November 2018 to 1 November 2019 (365 days; 52 weeks; 93 times sampling) at the Kangwon National University Annex Farm (37°56′24.1” N and 127°46′57.0” E) located in Chuncheon, Korea. During the study, 46 Hanwoo cattle between the ages of 0 and 108 months were reared in a steel-made winch-curtain barn (1071 m2). Sawdust was used as bedding with ±10 cm of thickness at the beginning. A total of 24 pens were used in this study. Each pen had one to four cattle filled in with ad libitum water supply except the pen located in the bottom left (Figure 1, cross marked), which was used for storing the silage. The housed cattle were fed with roughage, pellets, and concentrates twice a day (09:00 and 17:00).
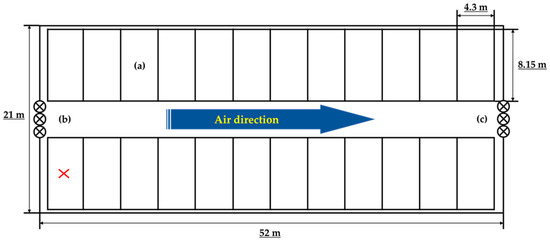
Figure 1.
Overview of the cattle barn: (a) cattle pen, (b) inlet fan, (c) outlet fan.
2.2. Chamber Installation, Composting Facility and Data Recording
The surface area of the cattle rearing barn was 736 m2 and as a dynamic chamber, the barn was sealed and the fans were placed in front and back of the barn for continuous airflow. Three fans were fixed at the center above the main entrance (Figure 1). Airflow rate from the fan was measured with an air flow capture hood or balometer.
In the present study, the CH4 and N2O emissions from the composting lot was measured using a mega-dynamic chamber. The entire composting lot was covered and equipped with fans for air inflow and outflow similar to the cattle barn GHG estimation system. Figure 2 represents the schematic of the composting facility. Most farms in Korea operate static pile for composting. Hence, the composting facility was designed to simulate composting as close as in practice.

Figure 2.
Side and front view of the composting facility.
Temperature data from both the cattle barn and composting facility were collected using temperature logger data (HOBO ® Pro v2 Temperature/Relative Humidity Data Logger, Onset, MA, USA), placed inside the chamber and from the Korean Meteorological Data Open Portal (www.data.kma.go.kr), respectively.
2.3. Sampling Procedure
The first and last samples from the dynamic chamber were taken on 2 November 2018, and 1 November 2019, accordingly. The samples were taken twice during the week, usually on Tuesday and Friday. On the sampling day, the gas samples were collected three times with triplicates between 9:00 to 15:00 (by 3 h interval). The first sample was taken one hour later of closing the chamber and turning on the fan. The air sample from the inlet and outlet chambers were taken using a 25 mL syringe (Jung Rim Syringe, Jung Rim Medical Industrial Co. Ltd., Seoul, Korea) through a plastic hose (outer diameter = 0.6 mm and inner diameter = 0.4 mm) connected to a pump (Oil-less Diaphragm Pump 35DNS, G&M Tech Inc., Yongin, Korea). The collected samples were stored in 8 mL vacuumed glass-vials (LK LAB KOREA 99429, LK Lab Korea, Namyangju, Korea) and sealed with butyl-rubber septa (Samwoo Kurex ® 15 mm, Samwoo Kurex, Seoul, Korea). The glass vials were vacuumed using a vacuum machine (VALUE ® TF-VE245N, Teddington-France, Villeneuve la Garenne, France) for 5 min [23]. After collection, the glass vials were properly sealed with parafilm and stored for further gas chromatography (GC) analysis (Figure 3).

Figure 3.
Gas sampling procedure: (a) vacuuming the glass vial, (b) taking gas sample using the syringe, (c) transferring gas sample to vacuumed glass vial.
2.4. Flow Rate Measurement
To calculate the air flow rate through the chamber, the wind speed profile of the fan drawing air into the chamber was determined using an airflow capture hood or balometer (Alnor ® Electronic Balancing Tool EBT721, TSI Incorporated, Shoreview, MN, USA and AIRFLOWTM Instrument ProHoodTM Capture Hood PH721, TSI Instruments Ltd., London, UK). The wind speed was recorded across the surface area of the fan giving a flow rate of 0.848 m3/s.
2.5. Gas Chromatography Analysis
To investigate the sources and emissions of major GHG (N2O, CH4), accurate concentration analysis was made after sample collection. Gas concentration analysis was performed using a gas chromatograph device to simultaneously analyze N2O and CH4. An electronic capture detector and a pulsed discharge detector (PDD) (VICI PDDs, Valco Instrument Co. Inc., Houston, TX, USA) were equipped in gas chromatography (iGC7200A, DS Science, Gwangju, Korea). For gas analysis, Carboxen 1000 (80/100 mesh, 1.2 m × 1/8 inch) column was used and helium gas with 99.999% purity was introduced as a carrier. Temperature set-up of injector, column, and oven were 50, 160, and 50 °C, respectively. The concentrations of N2O and CH4 standard gas used in this study were 1 ppm and 100 ppm, respectively. Before analysis of the samples, GC calibration was carried out to investigate the precision and reproducibility of the repetition during analysis and each standard gas was analyzed 20 times.
2.6. Calculation of Emission Fluxes
The samples (1 mL) were taken from the 8 mL glass-vials using a 1 mL SGE syringe (Trajan Scientific Australia Pty Ltd., Victoria, Australia) to calculate emission fluxes of CH4 and N2O. Each sample was injected three times to obtain N2O and CH4 average concentration. N2O and CH4 fluxes were calculated using the following equations,
where FR represents the air flow rate through the chamber (m3/s), A is the surface area of emitting materials in the chamber (m2), and ΔC indicates the difference in gas densities in the air inlet and outlet of the chamber (mg/m3).
where (Cout − Cin) TGA is the difference in concentration measured using gas chromatography (ppm), p represents the atmospheric pressure (Pa), M indicates the molecular weight of methane or nitrous oxide (CH4 = 16.04 (g/mol); N2O = 44.01 (g/mol)), T is the average temperature of the analyzed air (K), and R shows the universal gas constant (8.314 J/mol K).
Flux = FR × ΔC/A
ΔC = (Cout − Cin)TGA × P × M/T × R
To calculate the emission fluxes from litter in the barn, fluxes were measured after removing the litter from the cattle barn and later subtracted from the emission fluxes. In addition, while converting the annual GHG emissions from the Hanwoo cattle manure management systems to CO2 equivalent, global warming potential values for the 100-year time horizon mentioned in the IPCC Fourth Assessment Report were considered [24].
2.7. Statistical Analysis
The graphs were prepared using Sigma plot (version 10, 2007) and statistical analysis was conducted using GraphPad Prism (version 8.4.2, 2020). Data obtained from the cattle barn and composting facility were analyzed with one-way analysis of variance (ANOVA). Multiple comparisons were performed using Tukey’s honest significant difference (HSD) post hoc test. A p-value of <0.05 was designated to determine statistical significance.
3. Results and Discussion
3.1. Greenhouse Gas Emissions from Litter in the Hanwoo Cattle Barn
3.1.1. Estimation of Methane Flux
Figure 4 shows the variation in average CH4 flux from the litter on the sampling days. The monthly average of CH4 flux was varied from 0.0 to 30.0 ± 13.7 μg/m2 s during the whole measurement period (November 2018 to October 2019).
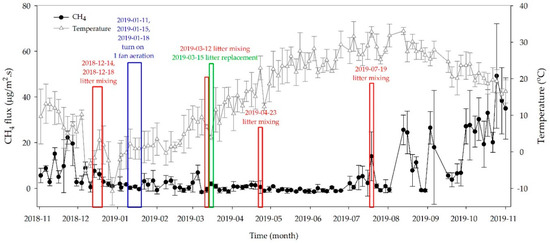
Figure 4.
Variation in average CH4 flux from litter on the day of sampling during the study (error bars represent the standard deviation of the average).
The CH4 flux in October (29.997 ± 13.692 μg/m2 s) were higher over the values in the other months, while very low flux was recorded in June (Figure 4). Generally, the CH4 flux is influenced by temperature which affects microbial activity; i.e., higher CH4 emission with high temperature [25,26]. Studies on litter reported that temperature ranges from of 35 to 50 °C was the best for microbial activity, which can be achieved with a litter height of 20 to 30 cm [27,28]. In this study, the shallow height of the litter (10 cm) and relatively low air temperature (below 35 °C) resulted in low CH4 flux during the summer (Figure 4). Moreover, low CH4 flux may also be caused by events such as litter mixing (red boxes) and change of bedding materials (green and blue boxes) since such events facilitate air-supply to the litter mixture. Another possible reason for low CH4 emission during the summer could be the low moisture content (approximately 12.9%) of the bedding material after replacing the litter and it requires some time to reach the optimal moisture level for CH4 production as moisture content can influence microbial activity [29]. Furthermore, compaction of the litter by cattle hoofs may prevent increasing the temperature of litter and ultimately results in low CH4 emission [30]. CH4 flux from the livestock manure also depends on the amount of manure produced and the part of amount anaerobically decomposes [31]. After replacing the litter (green box in March), CH4 flux was almost close to zero and then the flux was detected again in the middle of July. Furthermore, following litter mixing, the CH4 flux down temporarily for a few days and the emission was abruptly increased around 9.534 ± 11.823 μg/m2 s in August with some fluctuations. Such phenomena might be happened due to the microbial degradation of organic materials for the last three months, which affects the CH4 flux through the acidification of organic materials [32,33].
Time-specific CH4 flux in a day was tended to be higher at 09:00 (7.107 ± 13.526 μg/m2 s) and showed comparatively lower fluxes at 12:00 and 15:00 (5.408 ± 10.019 and 5.840 ± 10.801 μg/m2 s, respectively) (Figure 5a). However, daily variation of CH4 flux did not show significant difference with each other as the time changes (p > 0.05). On the other hand, the average CH4 flux during the fall (18.538 ± 14.841 μg/m2 s) found to be significantly higher than other seasonal fluxes (p < 0.05), while the spring season had the lowest average CH4 flux (Figure 5b).
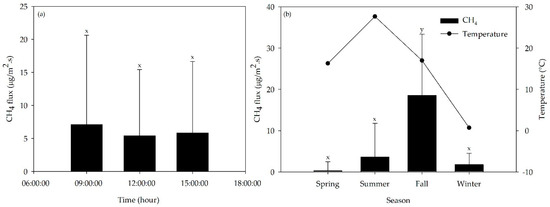
Figure 5.
Average CH4 flux from litter by (a) time and (b) season (error bars represent the standard deviation of the average). Flux means with the same letter are not significantly different (p > 0.05).
3.1.2. Estimation of Nitrous Oxide Flux
The variation in average N2O flux from litter in the barn on the sampling days are elucidated in Figure 6. The monthly average of N2O flux was ranged from 0.896 ± 0.557 to 2.925 ± 2.853 μg/m2 s during the whole measurement period (November 2018 to October 2019).
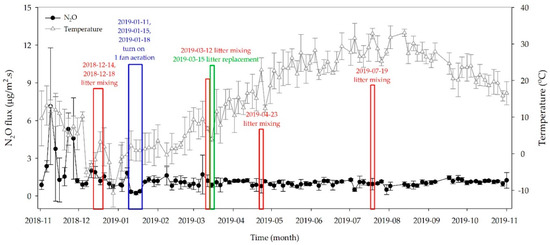
Figure 6.
Variation in average N2O flux from litter on the day of sampling during the study (error bars represent the standard deviation of the average).
N2O is well known as one of GHGs having high global warming potential with only a small amount. The highest average N2O flux was estimated in November as 2.925 ± 2.853 μg/m2 s, while the lowest was in January as 0.896 ± 0.557 μg/m2 s, respectively. However, the fluctuation of N2O flux was not very different as compared to CH4. The time-specific N2O flux showed the highest level of 1.263 ± 0.948 μg/m2 s at 12:00 but the fluxes in the morning at 09:00 and in the afternoon at 15:00 were slightly low with 1.249 ± 1.072 and 1.211 ± 1.353 μg/m2 s, respectively (Figure 7a). However, no significant difference in time-specific N2O flux was observed during the study period (p > 0.05).
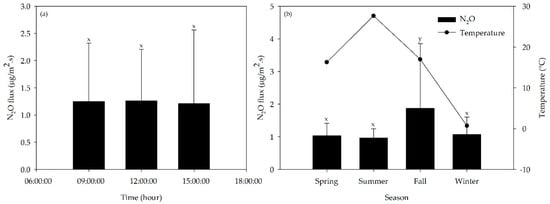
Figure 7.
Average N2O flux from litter by (a) time and (b) season (error bars represent the standard deviation of the average). Flux means with the same letter are not significantly different (p > 0.05).
The seasonal variation of N2O flux follows delineates similar trend as that of CH4 flux (Figure 7b). The average N2O flux (1.870 ± 1.990 μg/m2 s) during the fall season was significantly higher than the other seasonal fluxes (p < 0.05), which indicated that the litter management practices played an important role in N2O emission rather than the temperature. Both aerobic and anaerobic status favor N2O emission from livestock manure with bedding materials [31]. When organic nitrogen and ammonia nitrogen in urine is oxidized into hydroxylamine or nitrite under aerobic conditions, part of the N2O gas can be produced [34,35] or further N2O emission occurs when the oxidized form, nitrate, is reduced under anoxic condition by denitrifier [36]. According to the litter status, simultaneous nitrification and denitrification (SND) may occur under aerobic conditions, whereas events such as litter mixing and change of bedding materials shows influence on GHG emission rather than other environmental conditions.
3.2. Greenhouse Gas Emissions from Composting Lot
The livestock production and manure management systems in Korea are very different to those of other parts of the world due to regional climate and limited land resources. For example, a pasture-based livestock farm will possibly focus on land spreading for manure management, whereas in barn-based farming system manure cannot be spread in the soil directly, rather the entire manure and bedding is transferred to the composting facility. Composting is done as a manure management strategy to minimize the impact of land spread manure to the environment. The Korean government recommends that prior to land application, cattle manure should stay in the composting lot for over 6 months. Accordingly, the GHG emission from composting lot need to be estimated after measuring from the cattle barn.
Composting in general is an aerobic process. Gas emission under anaerobic condition would therefore be easily to be ignored. However, since manure contains 9–30% solids and 70–91% moisture, the inner space of solid fractions may form anaerobic conditions and favor CH4 and N2O production [37]. In addition, during composting if processes such as turning the composting pile and aeration not performed properly, the GHG emissions increase further [38,39].
Most cattle farms in Korea concentrate on livestock productivity without much consideration of the environmental issues related to manure management. Hence, to reflect the actual farm practices, in this study activities like turning the composting pile or aeration was not performed during composting. The measurement was carried out right after collecting the mixture of manure and bedding materials from the cattle barn to exchange the litter. The variation in average CH4 and N2O fluxes on the sampling days are shown in Figure 8.
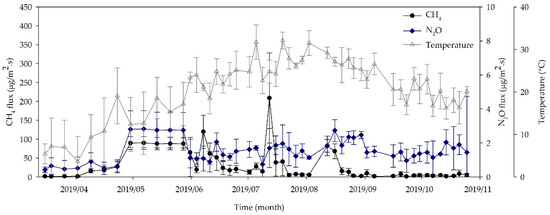
Figure 8.
Variation in average CH4 and N2O fluxes from manure composting lot on the day of sampling during the study (error bars represent the standard deviation of the average).
The monthly averages of CH4 and N2O fluxes ranged from 1.449 ± 0.783 to 86.930 ± 19.092 and 0.511 ± 0.410 to 2.629 ± 1.105 μg/m2 s during the composting period. A different trend in CH4 emission was observed when compared to the emission from litter in the cattle barn with respect to temperature (Figure 9a). During the spring season, CH4 emission was abruptly increased till May along with gradual increment of temperature, of which emission was caused by microbial activity and showed significant difference with other monthly average fluxes (p < 0.05). For N2O, significantly higher emission was also observed in May compared to the other months (p < 0.05) (Figure 9b). Gilroyed et al. explained the detail biological mechanisms of GHG production during the composting process [40]. They showed a typical GHG emission pattern over time with respect to microbial activity, temperature profile, and oxygen (O2) concentration. High CH4 emission was observed at the beginning of composting under thermophilic temperature, while N2O emission profile showed the opposite trend with CH4. This finding is in line with the results reported by Hao et al. [41]. Rapid consumption of O2 during composting due to microbial degradation of organic compounds results in a thermophilic condition, which produces CH4 via methanogenesis [42]. N2O can be emitted from the composting pile through both nitrification and denitrification processes [43,44]. In this study, the actual composting process performed in the Korean farms were considered, therefore, the majority of the N2O was emitted during composting through nitrification. As the time passes, the temperature of the composting pile reaches to mesophilic levels, and ultimately enables the growth of nitrifying bacteria which are responsible for N2O emission.
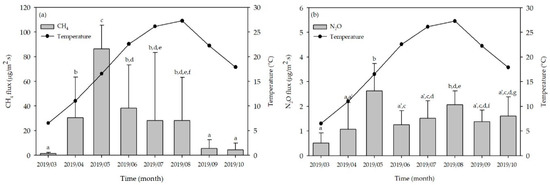
Figure 9.
Monthly average emissions of (a) CH4 and (b) N2O from composting lot. Flux means with the same letter are not significantly different (p > 0.05).
3.3. Greenhouse Gas Emissions from Manure Management Systems
By contrast with other countries, cattle in Korea are mostly raised in the barn due to lack of pasture. The annual emissions of CH4 and N2O fluxes from litter in the barn were 6.192 and 1.242 μg/m2 s, respectively, from 46 animals in 736 m2 of cattle barn (3.124 and 0.627 kg CH4 and N2O/animal year, respectively). Furthermore, CH4 and N2O fluxes from litter based on unit animal were 78.1 and 184.2 kg CO2eq/animal year, respectively when converted to CO2 equivalent. On the other hand, the average CH4 and N2O fluxes from the composting lot were 28.037 ± 39.848 and 1.514 ± 1.051 μg/m2 s, respectively (2.235 and 0.098 kg CH4 and N2O/animal year, respectively). After converting to CO2 equivalent, CH4 and N2O fluxes from composting lot based on unit animal were calculated as 55.9 and 28.9 kg CO2eq/animal year, respectively. Therefore, in total a GHG of 347.1 kg CO2eq/animal year was emitted from the Hanwoo cattle manure management systems.
3.4. Comparison of Greenhouse Gas Emissions with Intergovernmental Panel on Climate Change (IPCC) Guidelines
According to 2006 IPCC GL for National Greenhouse Gas Inventories [23], the Tier 1 values of manure management CH4 emission factor for beef cattle in Asia, North America, Western Europe, and South America are 1, 1, 8, and 1 kg CH4/animal year, respectively. While for N2O, the value is 0.342 kg N2O/animal year, with consideration of the manure treatment facilities including liquid treatment (2.5%), solid storage (90.7%), and miscellaneous (6.8%). In this study, annual emissions of CH4 and N2O emission from the Hanwoo cattle manure management systems were almost 5.4 and 2.1 times, respectively higher than the values provided by IPCC. Jo et al. reported that such variation might be attributed to the differences in feeding systems and cattle breeds as the values mentioned by IPCC values were estimated based on the studies conducted mainly in western countries [21]. Country-specific emission factors are, therefore, needed rather than using the values of the 2006 IPCC GL to develop effective and efficient GHG emission reduction strategies for the livestock industries.
4. Conclusions
This study was conducted to evaluate the GHG emission flux from Hanwoo cattle manure management systems using the dynamic chamber method. CH4 and N2O emission fluxes from litter in the cattle barn and composting lot were monitored and estimated. The monthly average CH4 and N2O emission fluxes from litter in the barn during the experimental period varied from 0.0 to 30.0 ± 13.7 μg/m2 s and 0.896 ± 0.557 to 2.925 ± 2.853 μg/m2 s, respectively. The annual emissions of CH4 and N2O fluxes from litter were estimated as 6.192 and 1.242 μg/m2 s, respectively (3.124 and 0.627 kg CH4 and N2O/animal year, respectively). The monthly averages of CH4 and N2O fluxes ranged from 1.449 ± 0.783 to 86.930 ± 19.092 and 0.511 ± 0.410 to 2.629 ± 1.105 μg/m2 s during the composting period and the calculated annual CH4 and N2O emissions from the composting lot were 2.235 and 0.098 kg CH4 and N2O/animal year, respectively. A comparison with the values for different continents in the world mentioned in 2006 IPCC GL for National Greenhouse Gas Inventories revealed that CH4 and N2O emissions from the Hanwoo cattle manure management systems were much higher than those reported. Hence, the results of this study highlight the significance and need to have country-specific emission factors as well as to encourage further studies to develop efficient and effective GHG reduction strategies for the livestock sector in Korea.
Author Contributions
Conceptualization, S.W., C.R. and K.-H.P; methodology, S.W. and K.-H.P; formal analysis, Y.Y., S.S., S.K. and E.N.; investigation, Y.Y., S.S., S.K. and E.N.; resources, K.-H.P.; data curation, S.W., Y.Y., A.R. and E.N.; writing—original draft preparation, M.M.A.H. and A.R.; writing—review and editing, A.R., S.W., C.R. and K.-H.P.; supervision, S.W. and K.-H.P.; project administration, K.-H.P.; funding acquisition, K.-H.P. All authors have read and agreed to the published version of the manuscript.
Funding
This research was funded by Rural Development Administration of Korea, grant number PJ01359002.
Conflicts of Interest
The authors declare no conflict of interest. The funders had no role in the design of the study; in the collection, analyses, or interpretation of data; in the writing of the manuscript; or in the decision to publish the results.
References
- Steinfeld, H.; Gerber, P.; Wassenaar, T.D.; Castel, V.; Rosales, M.; Rosales, M.; de Haan, C. Livestock’s Long Shadow: Environmental Issues and Options; Food & Agriculture Organization: Rome, Italy, 2006. [Google Scholar]
- O’Mara, F. The significance of livestock as a contributor to global greenhouse gas emissions today and in the near future. Anim. Feed. Sci. Technol. 2011, 166, 7–15. [Google Scholar] [CrossRef]
- Denmead, O.T. Approaches to measuring fluxes of methane and nitrous oxide between landscapes and the atmosphere. Plant Soil 2008, 309, 5–24. [Google Scholar] [CrossRef]
- US EPA. Understanding Global Warming Potentials. Available online: https://www.epa.gov/ghgemissions/understanding-global-warming-potentials (accessed on 28 May 2020).
- Liang, Y.; Xin, H.; Wheeler, E.F.; Gates, R.S.; Li, H.; Zajaczkowski, J.S.; Topper, P.A.; Casey, K.; Behrends, B.R.; Burnham, D.J.; et al. Ammonia emissions from U.S. Laying hen houses in Iowa and Pennsylvania. Trans. ASAE 2005, 48, 1927–1941. [Google Scholar] [CrossRef]
- Cortus, E.; Jacobson, L.D.; Hetchler, B.P.; Heber, A.J.; Bogan, B.W. Methane and nitrous oxide analyzer comparison and emissions from dairy freestall barns with manure flushing and scraping. Atmos. Environ. 2015, 100, 57–65. [Google Scholar] [CrossRef]
- Peters, E.B.; McFadden, J.P. Continuous measurements of net CO2 exchange by vegetation and soils in a suburban landscape. J. Geophys. Res. Space Phys. 2012, 117, 1–16. [Google Scholar] [CrossRef]
- Butterbach-Bahl, K.; Sander, B.O.; Pelster, D.; Díaz-Pinés, E. Quantifying greenhouse gas emissions from managed and natural soils. In Methods for Measuring Greenhouse Gas Balances and Evaluating Mitigation Options in Smallholder Agriculture; Springer: Cham, Switzerland, 2016; pp. 71–96. [Google Scholar]
- Rochette, P.; Eriksen-Hamel, N.S. Chamber Measurements of Soil Nitrous Oxide Flux: Are Absolute Values Reliable? Soil Sci. Soc. Am. J. 2008, 72, 331–342. [Google Scholar] [CrossRef]
- Pavelka, M.; Acosta, M.; Kiese, R.; Altimir, N.; Brümmer, C.; Crill, P.; Darenova, E.; Fuß, R.; Gielen, B.; Graf, A.; et al. Standardisation of chamber technique for CO2, N2O and CH4 fluxes measurements from terrestrial ecosystems. Int. Agrophys. 2018, 32, 569–587. [Google Scholar] [CrossRef]
- Bouwman, A.F.; Boumans, L.J.M.; Batjes, N. Modeling global annual N2O and NO emissions from fertilized fields. Glob. Biogeochem. Cycles 2002, 16, 28-1–28-9. [Google Scholar] [CrossRef]
- Jørgensen, C.J.; Struwe, S.; Elberling, B. Temporal trends in N2O flux dynamics in a Danish wetland—Effects of plant-mediated gas transport of N2O and O2 following changes in water level and soil mineral-N availability. Glob. Chang. Boil. 2011, 18, 210–222. [Google Scholar] [CrossRef]
- Lapitan, R.; Wanninkhof, R.; Mosier, A. Methods for stable gas flux determination in aquatic and terrestrial systems. In Developments in Atmospheric Science; Elsevier BV: Amsterdam, The Netherlands, 1999; pp. 29–66. [Google Scholar]
- Breuninger, C.; Oswald, R.; Kesselmeier, J.; Meixner, F.X. The dynamic chamber method: Trace gas exchange fluxes (NO, NO2, O3) between plants and the atmosphere in the laboratory and in the field. Atmos. Meas. Tech. 2012, 5, 955–989. [Google Scholar] [CrossRef]
- Ministry of Knowledge Economy. 3rd National Greenhouse Gas Inventory Meeting; Ministry of Knowledge Economy: Gyeonggi, Korea, 2009.
- Greenhouse Gas Inventory & Research Center of Korea. National Greenhouse Inventory Report of Korea, Annuls; Greenhouse Gas Inventory & Research Center of Korea: Seoul, Korea, 2015. [Google Scholar]
- Park, K.-H.; Jeon, J.; Jeon, K.; Kwag, J.; Choi, D. Low greenhouse gas emissions during composting of solid swine manure. Anim. Feed. Sci. Technol. 2011, 166, 550–556. [Google Scholar] [CrossRef]
- Ji, E.S.; Park, K.-H. Methane and Nitrous Oxide Emissions from Livestock Agriculture in 16 Local Administrative Districts of Korea. Asian-Australas. J. Anim. Sci. 2012, 25, 1768–1774. [Google Scholar] [CrossRef] [PubMed]
- Ha, S.; Tae, S.; Kim, R. A Study on the Limitations of Korea’s National Roadmap for Greenhouse Gas Reduction by 2030 and Suggestions for Improvement. Sustainability 2019, 11, 3969. [Google Scholar] [CrossRef]
- Korean Statistical Service Information (KOSIS). Livestock Trend Survey in the Fourth Quarter of 2020; KOSIS: Daejon, Korea, 2019.
- Jo, N.; Kim, J.; Seo, S.-W. Comparison of models for estimating methane emission factor for enteric fermentation of growing-finishing Hanwoo steers. SpringerPlus 2016, 5, 1212. [Google Scholar] [CrossRef] [PubMed]
- Febrisiantosa, A.; Lee, J.; Choi, H. Greenhouse gas emissions from cattle production sector in Korea. Indones. J. Anim. Vet. Sci. 2016, 21, 112. [Google Scholar] [CrossRef]
- Rochette, P.; Bertrand, N. Soil air sample storage and handling using polypropylene syringes and glass vials. Can. J. Soil Sci. 2003, 83, 631–637. [Google Scholar] [CrossRef]
- Forster, P.; Ramaswamy, V.; Artaxo, P.; Berntsen, T.; Betts, R.; Fahey, D.W.; Haywood, J.; Lean, J.; Lowe, D.C.; Myhre, G.; et al. Changes in Atmospheric Constituents and in Radiative Forcing. In Climate Change 2007: The Physical Science Basis, Contribution of Working Group I to the Fourth Assessment Report of the Intergovernmental Panel on Climate Change; Solomon, S., Qin, D., Manning, M., Chen, Z., Marquis, M., Averyt, K.B., Tignor, M., Miller, H.L., Eds.; Cambridge University Press: Cambridge, UK, 2007; pp. 129–234. [Google Scholar]
- Wang, J.; Duan, C.; Ji, Y.; Sun, Y. Methane emissions during storage of different treatments from cattle manure in Tianjin. J. Environ. Sci. 2010, 22, 1564–1569. [Google Scholar] [CrossRef]
- Grossi, G.; Goglio, P.; Vitali, A.; Williams, A. Livestock and climate change: Impact of livestock on climate and mitigation strategies. Anim. Front. 2018, 9, 69–76. [Google Scholar] [CrossRef]
- McKinley, V.L.; Vestal, J.R. Physical and Chemical Correlates of Microbial Activity and Biomass in Composting Municipal Sewage Sludge. Appl. Environ. Microbiol. 1985, 50, 1395–1403. [Google Scholar] [CrossRef]
- Kapuinen, P. SE—Structures and Environment. J. Agric. Eng. Res. 2001, 80, 87–97. [Google Scholar] [CrossRef]
- Miyatake, F.; Iwabuchi, K.; Abe, Y.; Honda, Y. Effect of High Moisture Content on Temperature and Microbial Activity of Composting Dairy Cattle Manure. J. Jpn. Soc. Agric. Mach. 2007, 69, 48–54. [Google Scholar]
- Sommer, S.G. Eco-friendly and efficient management of solid animal manure. In Livestock Housing: Modern Management to Ensure Optimal Health and Welfare of Farm Animals; Aland, A., Banhazi, T., Eds.; Wageningen Academic Publishers: Wageningen, The Netherlands, 2013; pp. 67–107. [Google Scholar]
- Eggleston, S.; Buendia, L.; Miwa, K.; Ngara, T.; Tanabe, K. 2006 IPCC Guidelines for National Greenhouse Gas Inventories; Institute for Global Environmental Strategies: Hayama, Japan, 2006. [Google Scholar]
- Habtewold, J.; Gordon, R.; Sokolov, V.; Vanderzaag, A.; Wagner-Riddle, C.; Dunfield, K. Reduction in Methane Emissions from Acidified Dairy Slurry Is Related to Inhibition of Methanosarcina Species. Front. Microbiol. 2018, 9, 2806. [Google Scholar] [CrossRef] [PubMed]
- Petersen, S.O.; Olsen, A.B.; Elsgaard, L.; Triolo, J.; Sommer, S.G. Estimation of Methane Emissions from Slurry Pits below Pig and Cattle Confinements. PLoS ONE 2016, 11, e0160968. [Google Scholar] [CrossRef] [PubMed]
- Ahn, Y.H. Sustainable nitrogen elimination biotechnologies: A review. Process. Biochem. 2006, 41, 1709–1721. [Google Scholar] [CrossRef]
- Di, H.-J.; Cameron, K.C.; Sherlock, R.R.; Shen, J.-P.; He, J.-Z.; Winefield, C. Nitrous oxide emissions from grazed grassland as affected by a nitrification inhibitor, dicyandiamide, and relationships with ammonia-oxidizing bacteria and archaea. J. Soils Sediments 2010, 10, 943–954. [Google Scholar] [CrossRef]
- Wunderlin, P.; Mohn, J.; Joss, A.; Emmenegger, L.; Siegrist, H. Mechanisms of N2O production in biological wastewater treatment under nitrifying and denitrifying conditions. Water Res. 2012, 46, 1027–1037. [Google Scholar] [CrossRef]
- National Research Council (NRC). Air Emissions from Animal Feeding Operations: Current Knowledge, Future Needs; National Academies Press: Washington, DC, USA, 2003. [Google Scholar]
- Mulbry, W.; Ahn, H. Greenhouse gas emissions during composting of dairy manure: Influence of the timing of pile mixing on total emissions. Biosyst. Eng. 2014, 126, 117–122. [Google Scholar] [CrossRef]
- Sharma, B.; Vaish, B.; Srivastava, V.; Singh, S.; Singh, P.; Singh, R.P.; Oves, M.; Khan, M.Z.; Ismail, I.M. An Insight to Atmospheric Pollution- Improper Waste Management and Climate Change Nexus. In Modern Age Environmental Problems and their Remediation; Springer Science and Business Media: Cham, Switzerland, 2017; pp. 23–47. [Google Scholar]
- Gilroyed, B.; Hao, X.; Larney, F.J.; McAllister, T.A. Greenhouse Gas Emissions from Cattle Feedlot Manure Composting and Anaerobic Digestion as a Potential Mitigation Strategy. In Understanding Greenhouse Gas Emissions from Agricultural Management; Guo, L., Gunasekara, A.S., McConnell, L.L., Eds.; American Chemical Society (ACS): Washington, DC, USA, 2011; pp. 419–441. [Google Scholar]
- Hao, X.; Chang, C.; Larney, F.J.; Travis, G.R. Greenhouse Gas Emissions during Cattle Feedlot Manure Composting. J. Environ. Qual. 2001, 30, 376–386. [Google Scholar] [CrossRef]
- Giuliana, D.; Fabrizio, A. The contribution of water soluble and water insoluble organic fractions to oxygen uptake rate during high rate composting. Biodegradation 2006, 18, 103–113. [Google Scholar] [CrossRef]
- Peigné, J.; Girardin, P. Environmental Impacts of Farm-Scale Composting Practices. Water Air Soil Pollut. 2004, 153, 45–68. [Google Scholar] [CrossRef]
- Joo, H.; Ndegwa, P.M.; Heber, A.; Ni, J.-Q.; Bogan, B.; Ramirez-Dorronsoro, J.; Cortus, E. Greenhouse gas emissions from naturally ventilated freestall dairy barns. Atmos. Environ. 2015, 102, 384–392. [Google Scholar] [CrossRef]
© 2020 by the authors. Licensee MDPI, Basel, Switzerland. This article is an open access article distributed under the terms and conditions of the Creative Commons Attribution (CC BY) license (http://creativecommons.org/licenses/by/4.0/).