Article

Differences in the Evolution of Pyrocumulonimbus and Volcanic Stratospheric Plumes as Observed by CATS and CALIOP Space-Based Lidars

1
NASA Postdoctoral Program, Administered by Universities Space Research Association, Columbia, MD 21046, USA
2
NASA Goddard Space Flight Center, Greenbelt, MD 20771, USA
*
Author to whom correspondence should be addressed.
Atmosphere 2020, 11(10), 1035; https://doi.org/10.3390/atmos11101035
Submission received: 12 August 2020 / Revised: 19 September 2020 / Accepted: 21 September 2020 / Published: 27 September 2020
(This article belongs to the Special Issue Lidar Remote Sensing Techniques for Atmospheric Aerosols)

Abstract

:
Recent fire seasons have featured volcanic-sized injections of smoke aerosols into the stratosphere where they persist for many months. Unfortunately, the aging and transport of these aerosols are not well understood. Using space-based lidar, the vertical and spatial propagation of these aerosols can be tracked and inferences can be made as to their size and shape. In this study, space-based CATS and CALIOP lidar were used to track the evolution of the stratospheric aerosol plumes resulting from the 2019–2020 Australian bushfire and 2017 Pacific Northwest pyrocumulonimbus events and were compared to two volcanic events: Calbuco (2015) and Puyehue (2011). The pyrocumulonimbus and volcanic aerosol plumes evolved distinctly, with pyrocumulonimbus plumes rising upwards of 10 km after injection to altitudes of 30 km or more, compared to small to modest altitude increases in the volcanic plumes. We also show that layer-integrated depolarization ratios in these large pyrocumulonimbus plumes have a strong altitude dependence with more irregularly shaped particles in the higher altitude plumes, unlike the volcanic events studied.

1. Introduction

Stratospheric aerosols can have large effects on both the radiative balance of the planet and atmospheric composition, despite existing in lower concentrations than their tropospheric counterparts [1,2]. In this region of the atmosphere, particulate aerosols are predominantly sulfate, much of them volcanic in origin [2]. Analogously explosive, pyrocumulonimbus (pyroCb) convection from extreme midlatitude and boreal forest fire events can directly inject black carbon and other carbonaceous aerosols into the stratosphere [3]. Recent fire seasons have featured large pyroCb events rivaling the size of medium-sized volcanic eruptions [4]. After injection into the stratosphere, volcanic sulfate and pyroCb carbonaceous aerosols can persist for many months in the stratosphere; however, the overall contribution of pyroCb events to the stratospheric aerosol budget and effects on the broader Earth system remain uncertain [3,4,5,6].
While volcanic and pyroCb events similarly inject aerosols directly into the stratosphere, the physical and optical properties of the particles injected are very different. Aerosol composition is notably different, with pyroCb events featuring carbonaceous aerosols from smoke such as black carbon, and volcanic events featuring predominantly sulfurous aerosols (with some ash particles present just after the event). These differences are significant in determining their effects on the energy balance of the planet, because black carbon is highly absorptive and sulfates are highly scattering of incoming solar radiation, resulting in opposing radiative effects at the top of the atmosphere. Previous studies show that pyroCb events have a slightly net positive shortwave radiative forcing and volcanic events a net negative radiative forcing at the top of the atmosphere [5,7]. In the stratosphere, both events can lead to stratospheric warming [5,6,8].
Two of the largest stratospheric pyroCb aerosol injections have occurred in the past three years at the time of writing: the 2019–2020 Australian bushfire pyroCbs and the Pacific Northwest (PNW) Event of August 2017 [4]. These two events produced large, persistent, and traceable plumes. The PNW pyroCb had a measurable effect on stratospheric loading into December 2017 and early 2018 [4,6], with a modeled and observed lifetime of around 5 months [5,6]. The 2019–2020 Australian event likely eclipsed the PNW pyroCb event in mass of trace gas and aerosol injection into the stratosphere and its plume has been a persistent feature of the Southern Hemisphere stratosphere through the 2020 boreal spring, as observed by CALIOP and other space and ground-based instruments [9,10].
In the overlapping record of CATS and CALIOP, there was a large volcanic eruption of the Calbuco Volcano (41.3 S, 72.6 W) in Chile in April 2015, providing a useful comparison to the pyroCb plumes. In addition, the Puyehue-Cordón volcanic (40.6 S, 72.1 W) eruption of June 2011, also in Chile, produced a well-defined stratospheric plume observed by CALIOP. As Prata et al. (2017) [11] note, the Puyehue plume was unique compared to typical volcanic plumes, in that it produced an ash-dominated plume, rather than a primarily sulfate plume like that observed in the Calbuco plume.
Understanding the evolution of stratospheric plume properties from pyroCb and volcanic events is an important factor in accurately estimating their role in the radiative balance of the planet and the stratosphere. In this paper, we compare and contrast the evolution of stratospheric aerosol plume physical and optical properties emanating from two large and recent pyroCb events: the 2017 PNW pyroCb and the 2019–2020 Australian bushfires, to two volcanic eruptions: 2015 Calbuco and 2011 Puyehue. With the large forest fires responsible for pyroCb events perhaps increasing in frequency due to climate change, better understanding the evolution of pyroCb plumes in the stratosphere and how they compare to better studied volcanic events will enable better quantification of pyroCb effects on stratospheric composition and radiative effects.

2. Materials and Methods

In observing volcanic and pyroCb events, lidar is unmatched in providing high resolution observations of the vertical aerosol distribution. Space-based instruments are especially well suited compared to surface-based instruments in upper troposphere/lower stratosphere (UTLS) atmospheric composition studies, as satellites observe the upper atmosphere without the obscuration of tropospheric clouds. In addition to lidar, various other space-based instruments have been used to track the transport and evolution of stratospheric plumes. Limb sounders, such as the microwave limb sounder (MLS), have been used to track trace gases injected into the stratosphere by pyroCb and volcanic events [10,12]. The multi-angle imaging spectroradiometer (MISR), using multiple angle views of stratospheric plumes, can also provide information about the vertical extent of stratospheric aerosol plumes [13,14], but is bound by its orbit to observe in the morning hours only. Compared to lidar, these instruments benefit from greater spatial coverage with each orbit compared to that of lidar, and are valuable tools in tracking the transport of UTLS gas and aerosol plumes. However, these instruments cannot match lidar’s high vertical resolution and do not provide vertical profiles to investigate the evolution of aerosol particles and their optical properties.
During the Calbuco eruption and the PNW pyroCb event, there were two space-based lidars operating: Cloud-Aerosol Lidar with Orthogonal Polarization (CALIOP) on the Cloud-Aerosol Lidar and Infrared Pathfinder Satellite Observations (CALIPSO) satellite [15] and Cloud-Aerosol Transport System (CATS) on the International Space Station (ISS) [16]. Because of the orbit of the ISS, the CATS lidar observed the atmosphere at a variety of local solar times, but was limited between ∼51 N/S, unlike the polar orbiting CALIOP which observes the atmosphere at the same local solar time each pass (∼1AM and 1PM) between ∼80 N/S. CATS and CALIOP both feature lasers that operate at 532 and 1064 nm wavelengths, although CATS primarily operated in a mode that provided reliable data at only 1064 nm [17]. Due in part to these differences, the two lidars feature slightly different algorithms to distinguish aerosol types [18,19]. For the Puyehue volcanic eruption and the 2019–2020 Australian bushfires, only CALIOP observations are available, as the Puyehue volcanic eruption predated the installation of CATS and the Australian bushfires occurred after the CATS instrument stopped making observations in October 2017.
Aerosol particle size and shape are critical in determining the radiative effects of upper UTLS aerosols [20]. With few in situ observations of smoke composition and particle shapes from large mid-latitude and boreal fires, and even fewer of pyroCb events, estimates of these parameters remain similarly uncertain. To bridge this gap, space-based lidar products can be used to infer size and shape information and their evolution in time. Depolarization ratio, the ratio of the perpendicular component of the backscatter signal to the parallel, provides a measure of the sphericity of the aerosol particles, with values near 0 corresponding to spherical particles, such as sulfates, and higher values corresponding to more irregularity in particle shapes, such as ice crystals, volcanic ash, and dust. Depolarization measurements are available for both CATS and CALIOP, but at different wavelengths (CATS at 1064 nm and CALIOP at 532 nm). Another useful measurement is the backscatter color ratio ( X ), which for CALIOP, is the ratio of the particulate backscatter coefficient at 1064 nm to 532 nm. This measure can be used as a proxy for aerosol particle size, as larger particles are observed similarly in the two wavelengths (values closer to 1), and smaller particles (values closer to 0) have weaker 1064 nm backscatter coefficients than the 532 nm. Color ratio is only available for these events using CALIOP because it requires data at both 532 nm and 1064 nm wavelengths.
To track the evolution of the stratospheric aerosol plumes, we disposed of the Level 2 CATS (V3.0) and CALIOP (V4.20) layer files by week after the respective injections. For CATS, we only considered layers identified as UTLS aerosols [19] (previously called “volcanic” in older data versions), and for CALIOP, only those layers identified as containing stratospheric aerosols [18]. To limit the study to high-confidence CATS-identified aerosol layers, only layers with aerosol detection scores greater than 5 (corresponding to >50% confidence) were included. Only nighttime overpasses were considered to limit data that may have reduced quality due to solar background noise [17], and any layers with integrated depolarization ratios less than 0.01 and higher than 0.40 were discarded, to filter out extraneous layers not associated with the studied events. Daytime observations were included for the CATS observations of the PNW pyroCb, since the orbit of the ISS prevented sufficient nighttime observations of the plume. Latitude limitations were imposed to focus on the aerosols from these events, as their transport was predominantly zonal and not inter-hemispheric during the subsequent weeks analyzed here: between 70 S and 10 S for Puyehue, 60 S (50 S for CATS) and 0 for Calbuco, 80 N (50 N for CATS) and 20 N for PNW, 60 S and −10 S for the Australian bushfires. Overpasses within the box bounded by 40 S and 10 S and 80 W and 5 W were omitted for the Australian bushfires due to increased noise in the CALIOP data from the South Atlantic Anomaly. Layer values were mapped vertically between the layer base and layer top. The zonal averages in Appendix B (Figure A2, Figure A3, Figure A4 and Figure A5) show average values of layers meeting these criteria in a 250 m vertical resolution and a 1 latitude resolution. The other figures and analysis consider all stratospheric aerosol layers that meet the aforementioned criteria.

3. Results

Within this section, the evolution of the stratospheric aerosol plumes arising from these two large pyroCb events and two volcanic eruptions are described: the PNW and 2019–2020 Australian bushfire pyroCbs and the Calbuco and Puyehue volcanic eruptions.

3.1. Plume Altitude Evolution

3.1.1. Pyrocb Events

In the week, following the PNW pyroCb event, the aerosol layer top altitude as observed by CALIOP was ∼13 km (lower stratosphere) and increased to over 20 km after 9 weeks (Figure 1). On average, the plume rose about 1 km per week during this time period. This "self-lifting" is a feature observed in pyroCb plumes, because the black carbon component of the smoke is a strong absorber of solar radiation leading to weak buoyant lifting for the parcels containing these aerosols [6,21]. Plume altitudes were also observed to increase in the CATS record from 15 km after injection to over 20 km after 6 weeks (Figure 1). Differences between the CATS and CALIOP aerosol layer altitude seen in Figure 1 are expected, considering that the latitudinal sampling and orbits of CALIPSO and the ISS are different: CALIOP observations of the plume ranged from 20 to 80 N latitude, while CATS did not observe the poleward regions (52 to 80 N latitude) where the tropopause is lower in altitude. Additionally, the CATS aerosol typing algorithm requires UTLS aerosols to be higher than 10 km [19], while CALIOP uses meteorological fields to denote the tropopause [18], allowing for some of the lower stratosphere aerosols below 10 km to be included in the CALIOP analysis.
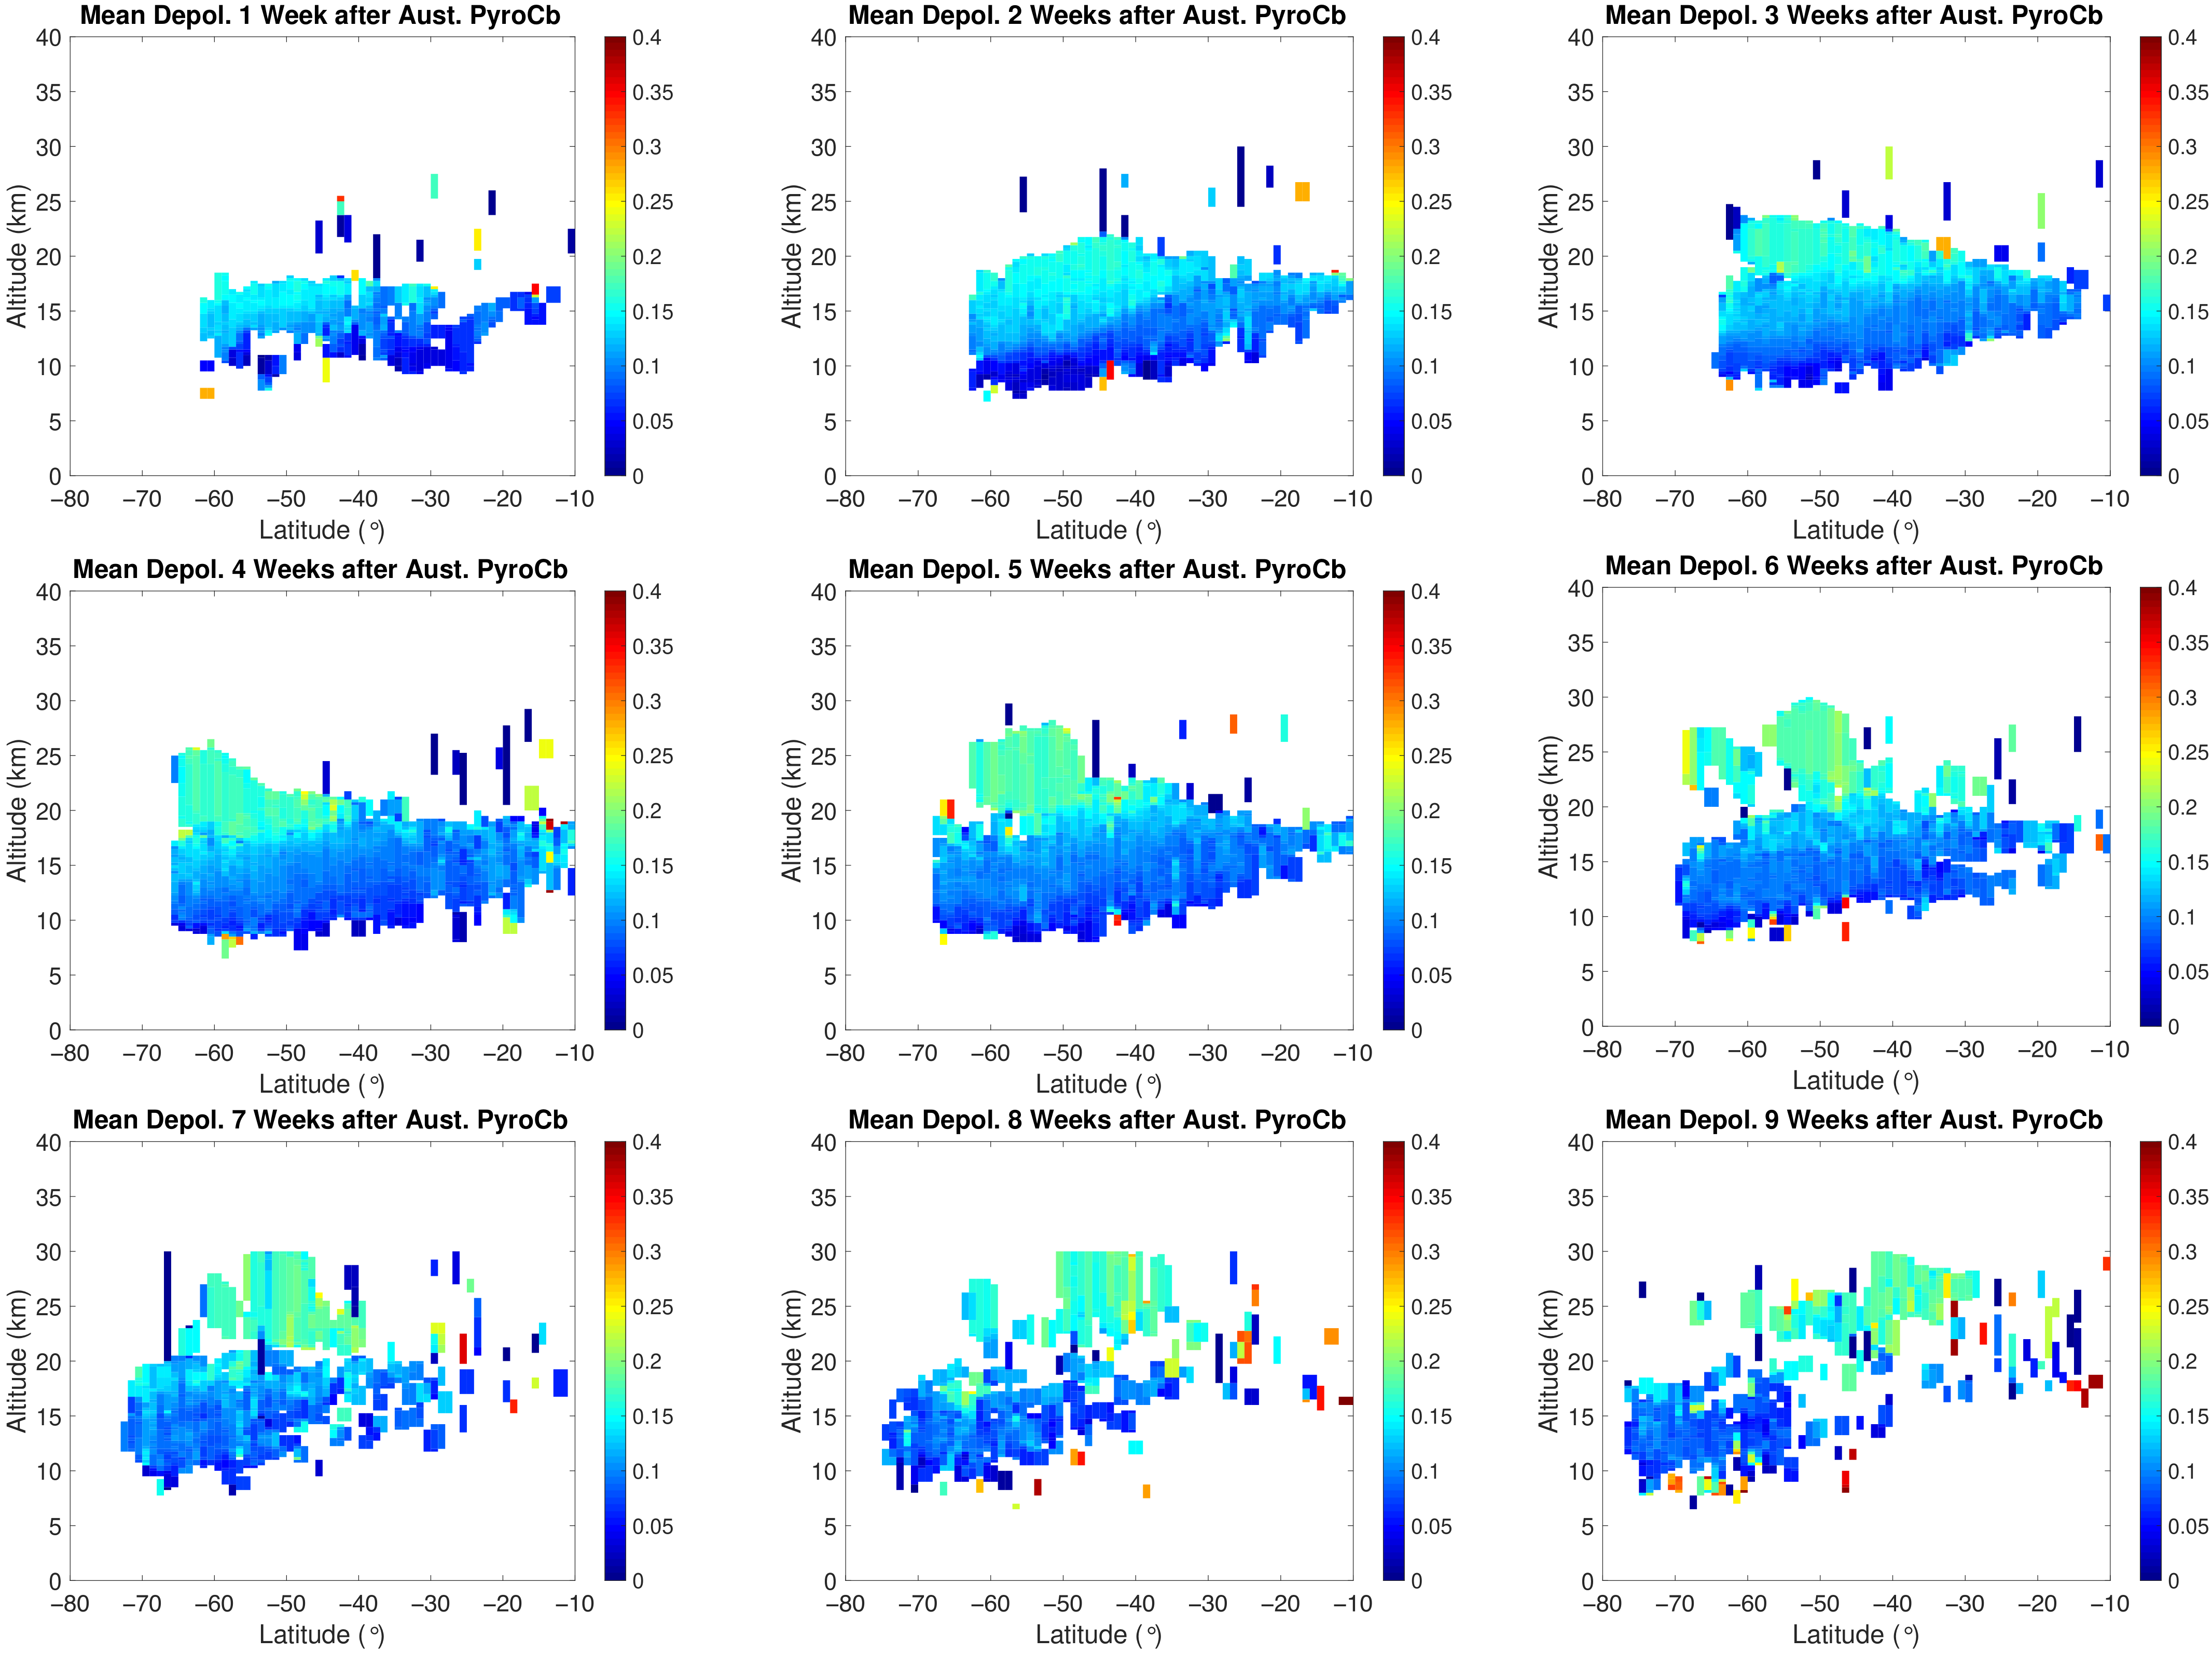
After injection, the Australian bushfire stratospheric plume behaved in a similar manner as the PNW pyroCb, with a few exceptions. Both plumes rose dramatically in altitude after their initial injections, with the Australian plume reaching altitudes upwards of 30 km in February of 2020, with a median aerosol layer of 25 km after 11 weeks (Figure 1). This is somewhat higher in altitude than observed with the PNW pyroCb plume. However, the Australian pyroCb plume median aerosol layer altitude did not increase in the first 6 weeks (Figure 1). One explanation for this is that the Australian bushfire plumes split over time into features that experienced different transport. Here, the bushfire plumes split into a higher altitude plume (>20 km) that moved northwards after five weeks and a lower altitude plume (<20 km) that slowly moved southwards (Figure A3). This lower altitude plume was persistent, leading to the average altitude of the aerosol layers remaining rather static, even though some of the pyroCb aerosol layers rose to considerable heights. MLS observations also found that the Australian bushfire plume to split into different features, with differing transport [10]. Secondly, there were additional pyroCb events associated with the record fire season in Australia, resulting in additions to the stratospheric aerosol load after the record-setting initial injection [10]. This could delay the onset of the observed plume rise, since additional pyroCb-injected aerosols would start at the bottom of the so-called “solar-escalator”. These caveats notwithstanding, both the PNW pyroCb and the 2019–2020 Australian bushfire pyroCb events produced persistent and rising plumes in the two months after their injections.

3.1.2. Volcanic Events

In contrast to the pyroCb plumes, the volcanic plumes were rather static in their vertical evolution. In the first week after the Calbuco eruption, the median altitude of the layer top was about 16 km, as observed by CALIOP, and 17 km for CATS. Over the following weeks, the plume altitude gradually increased to around 19 and 20 km, before descending after nine weeks (Figure 1). These altitudes are close to 17 km on average, found with the Infrared Atmospheric Sounding Interferometer (IASI) in the month following the eruption [22]. In their observations, Bègue et al. [22] found a similar temporal evolution in the plume altitudes using ground-based lidar in Réunion (21.0 S, 55.5 E) and Ozone Mapping and Profiler Suite (OMPS) satellite observations. The Puyehue plume was even more vertically static and descended less than 1 km vertically over thirteen weeks, from 11.7 km in the second week, to 10.9 km after the thirteenth week (Figure 1), as observed by CALIOP.

3.2. Aerosol Optical Evolution

3.2.1. Pyrocb Events

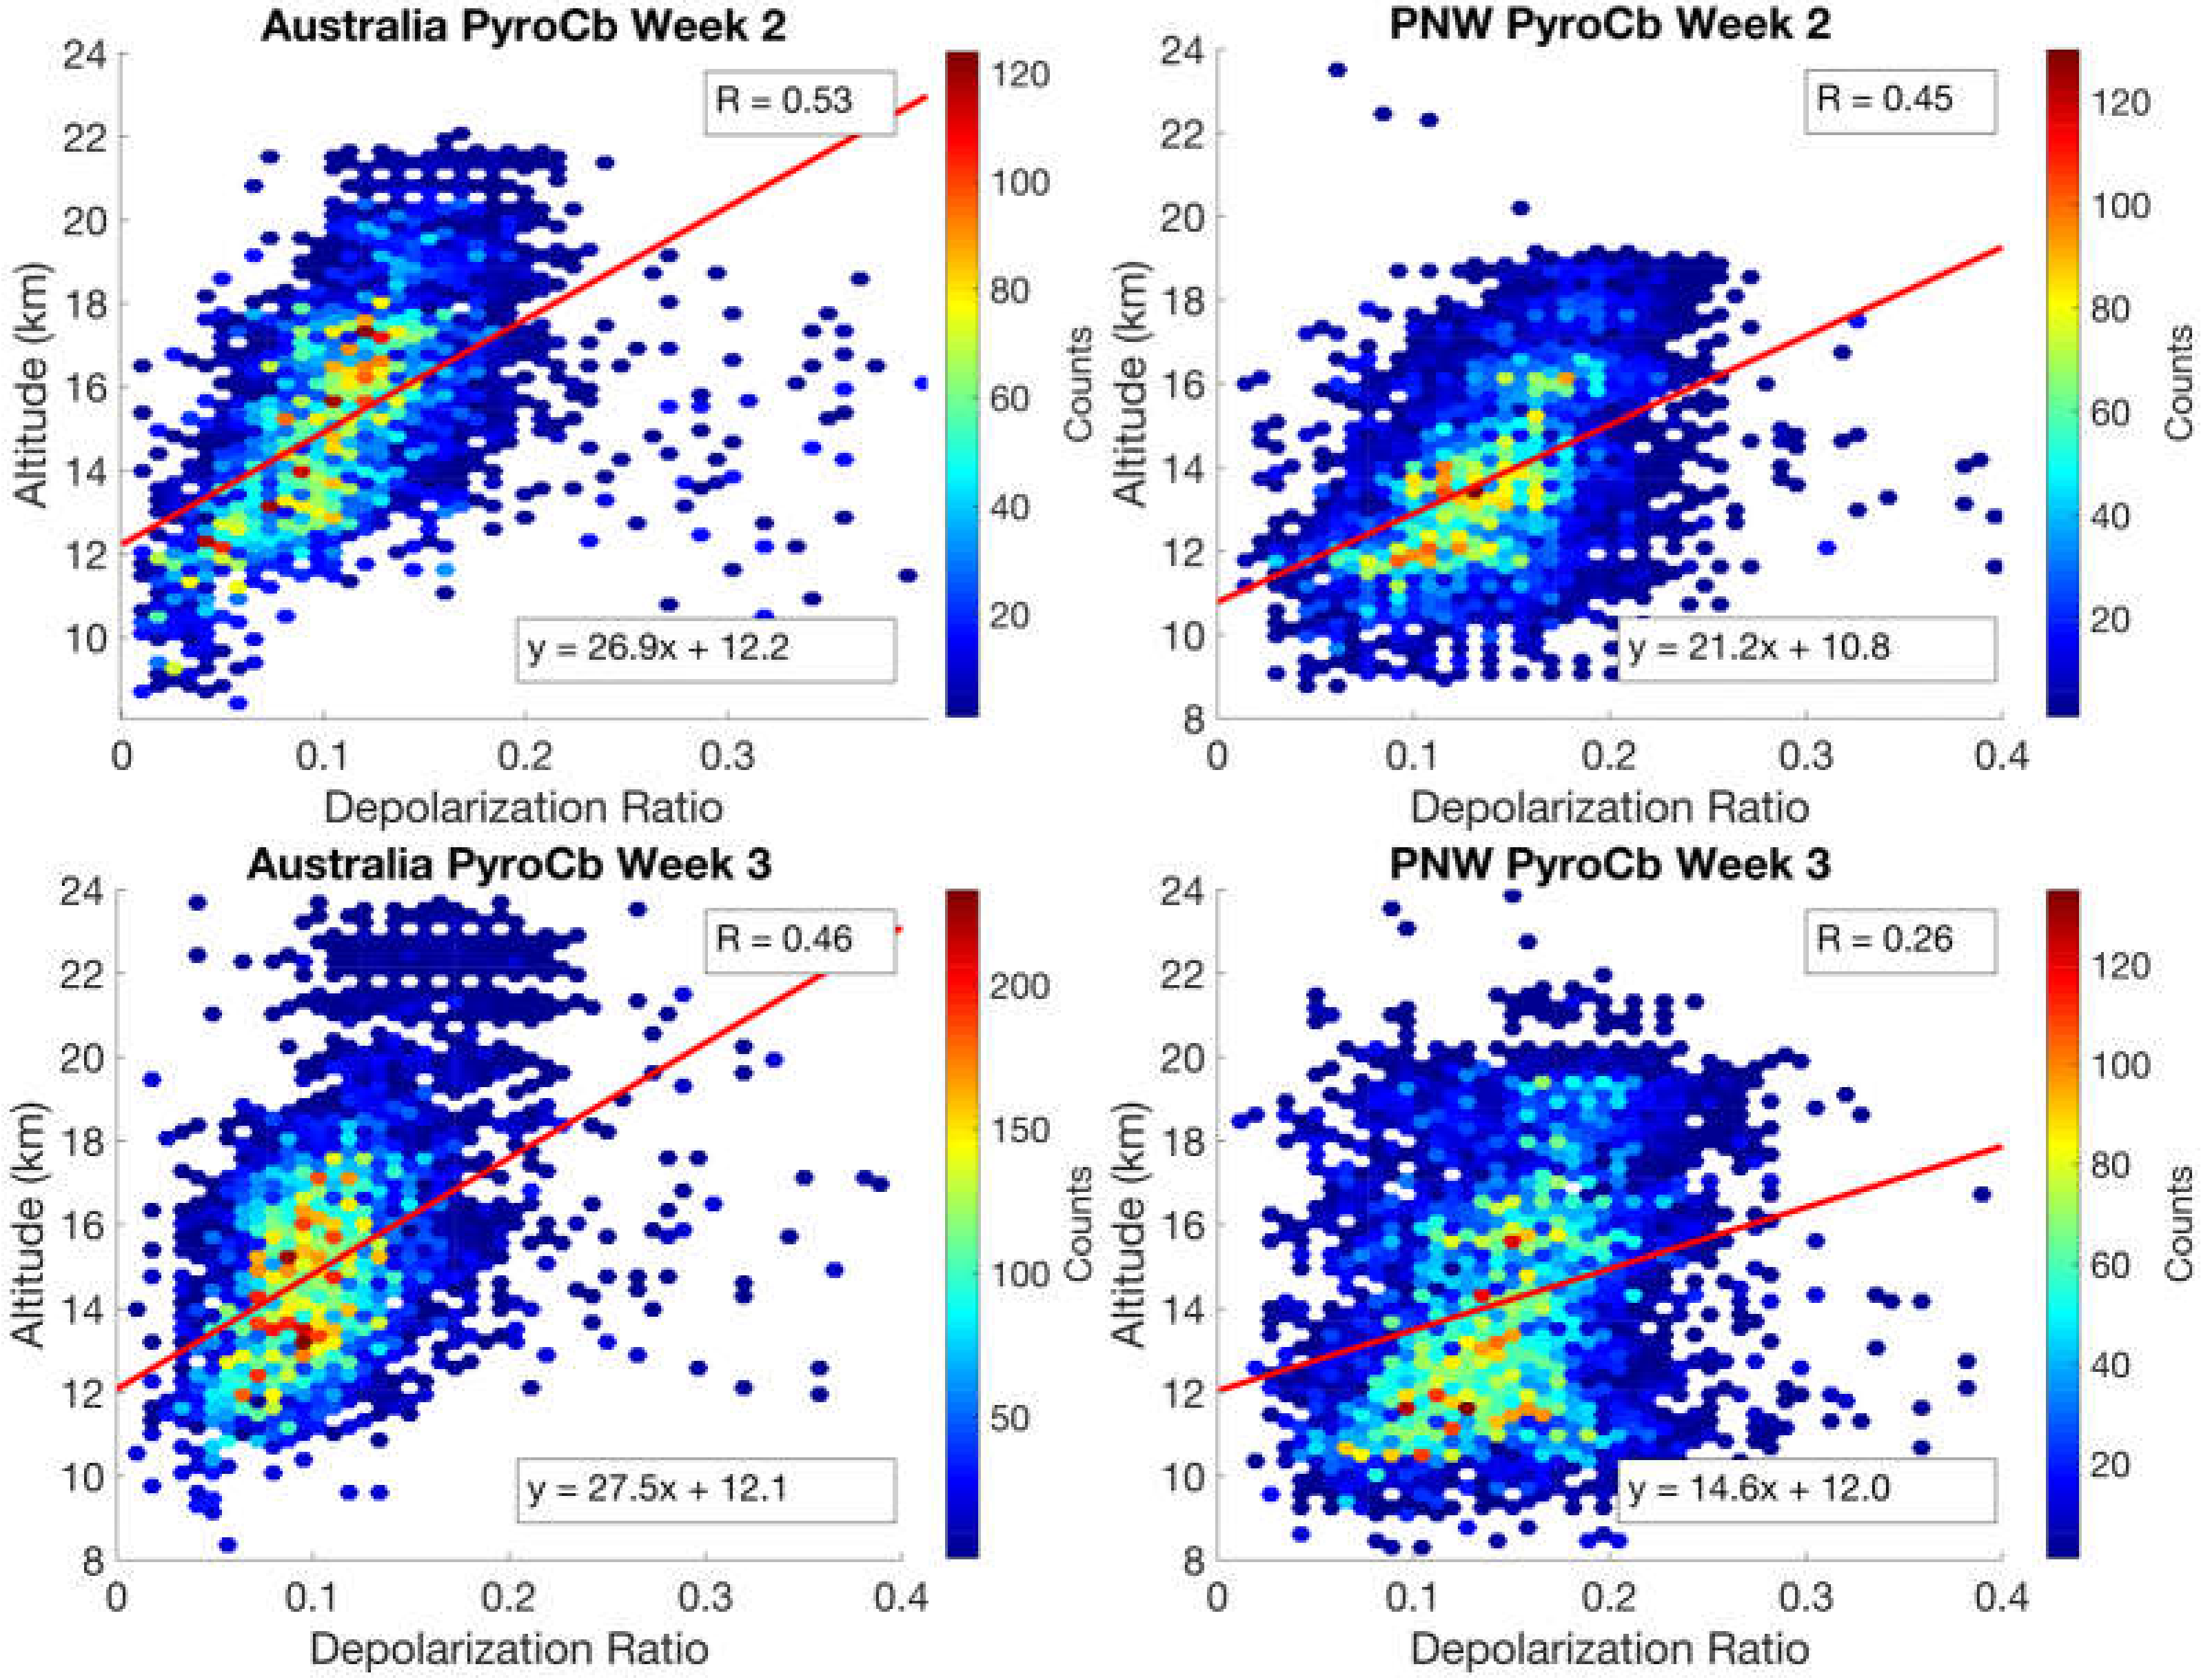
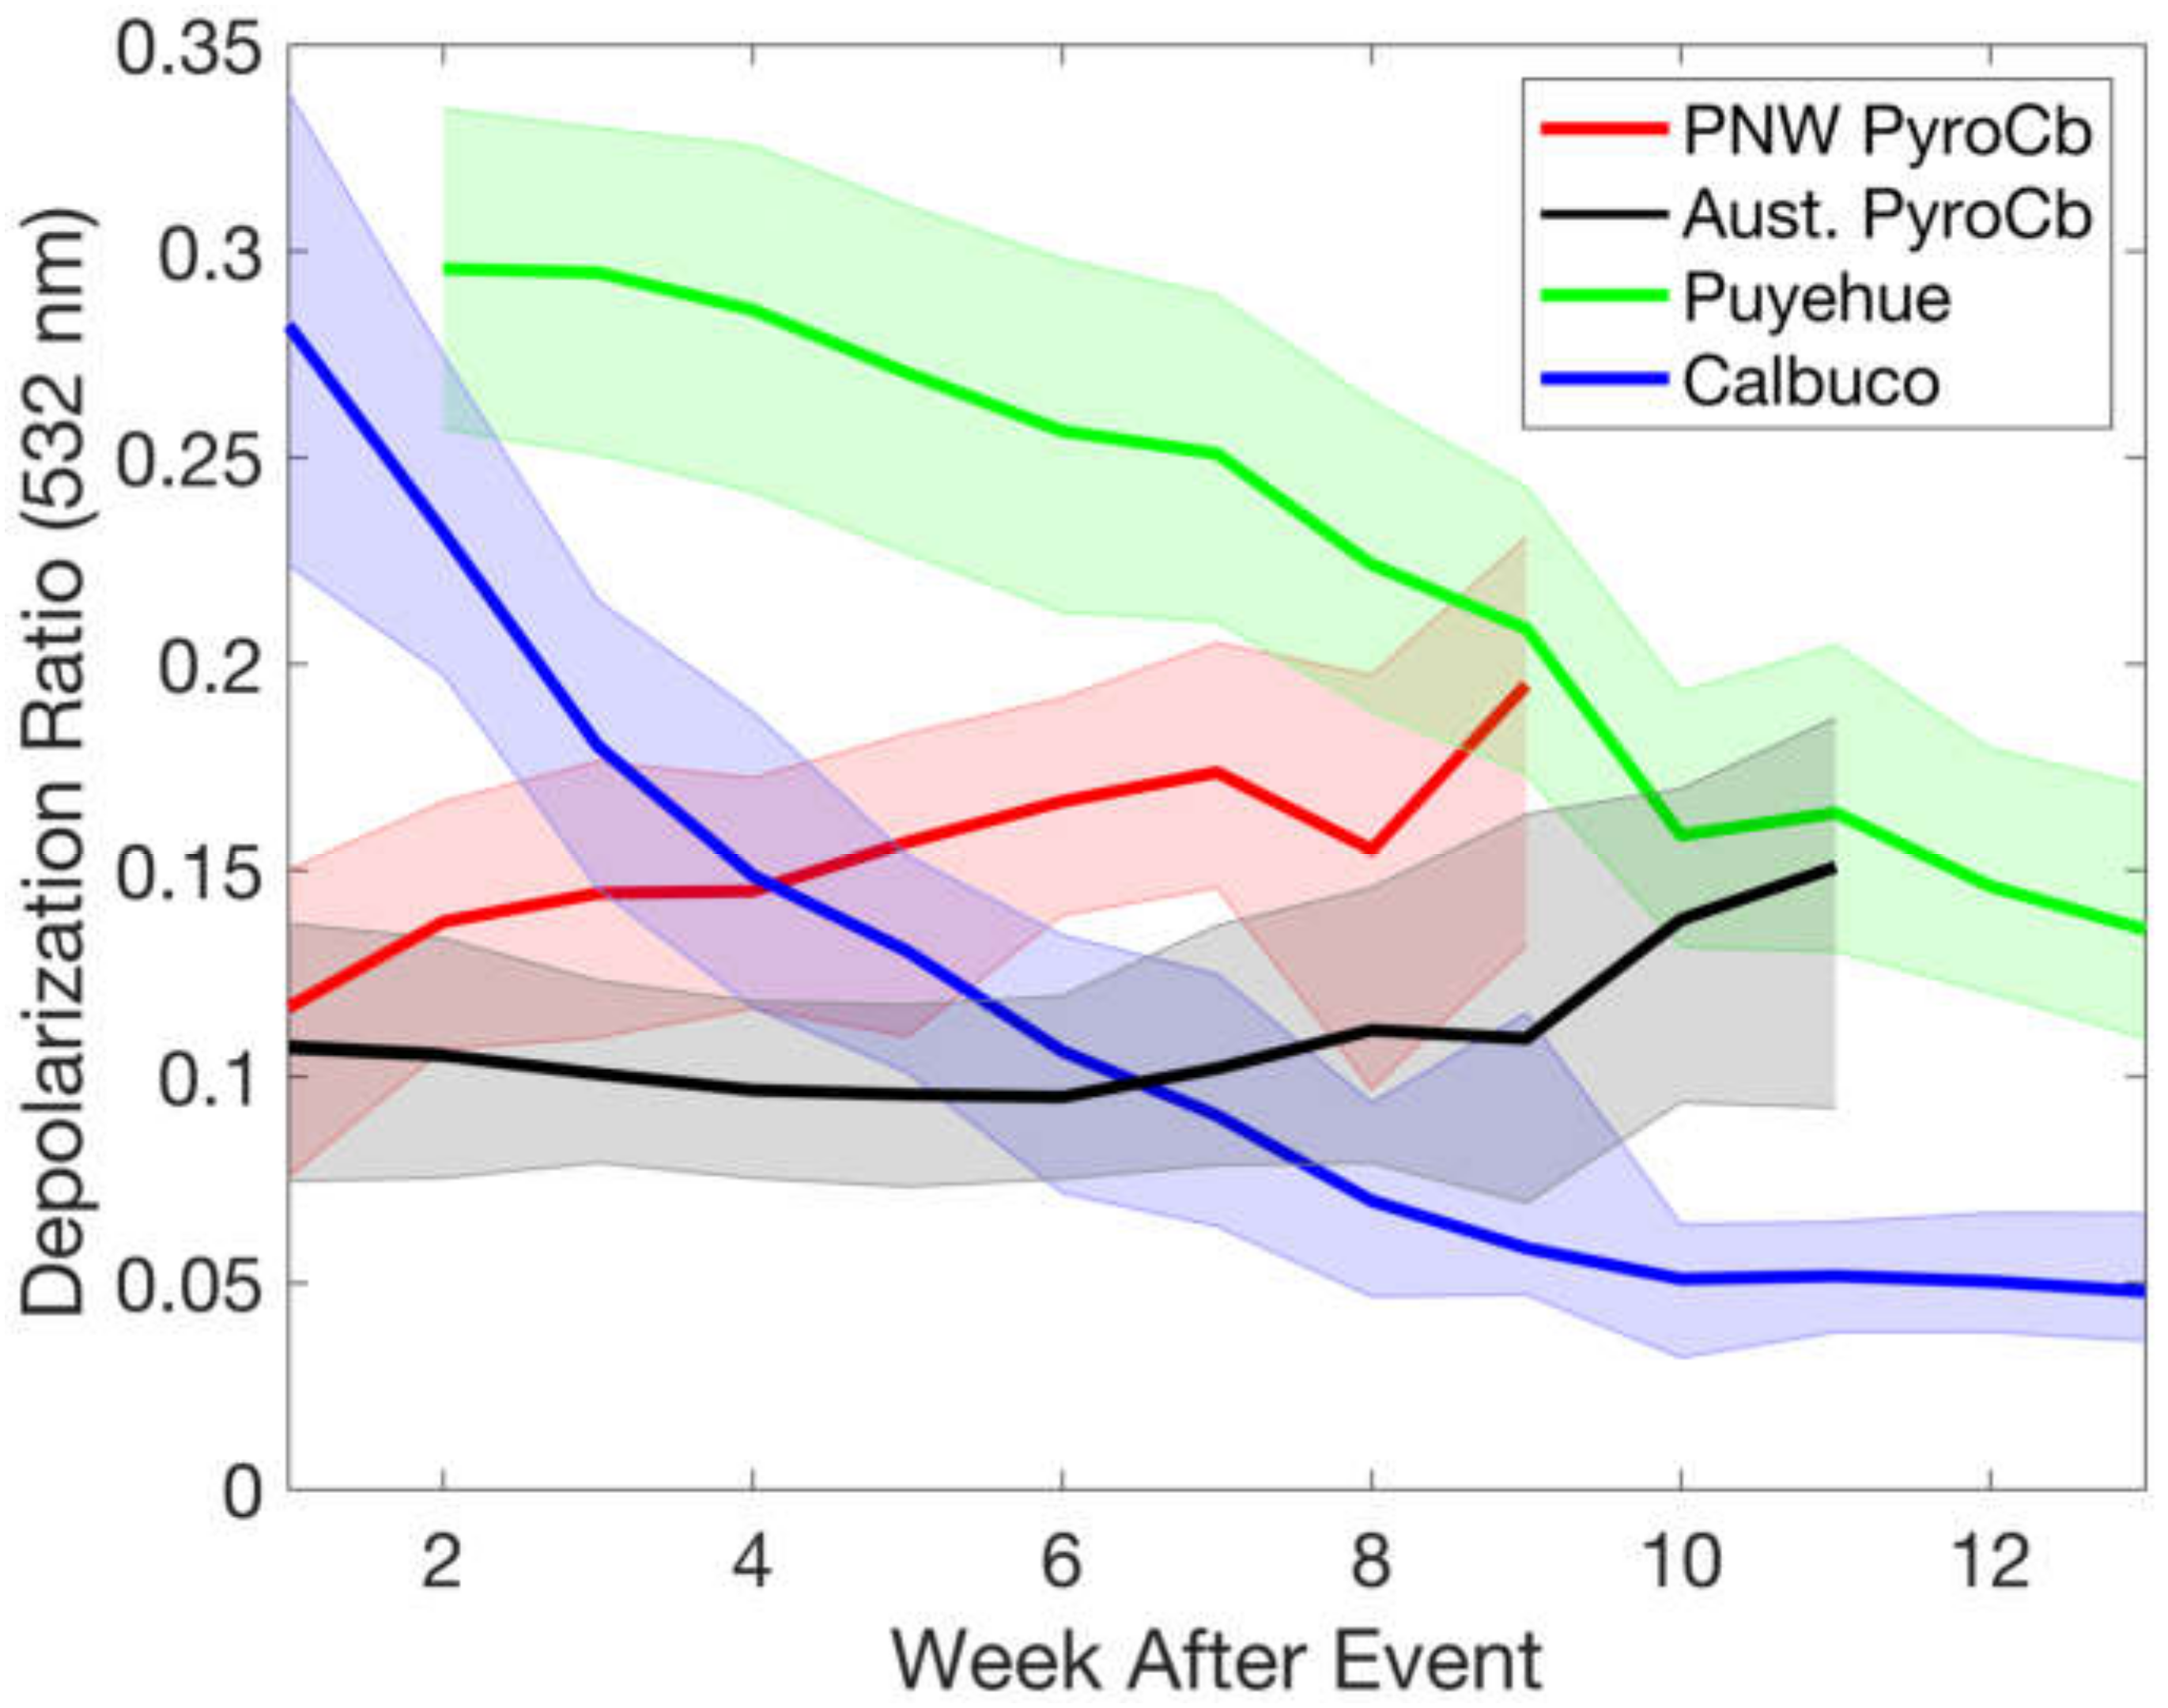
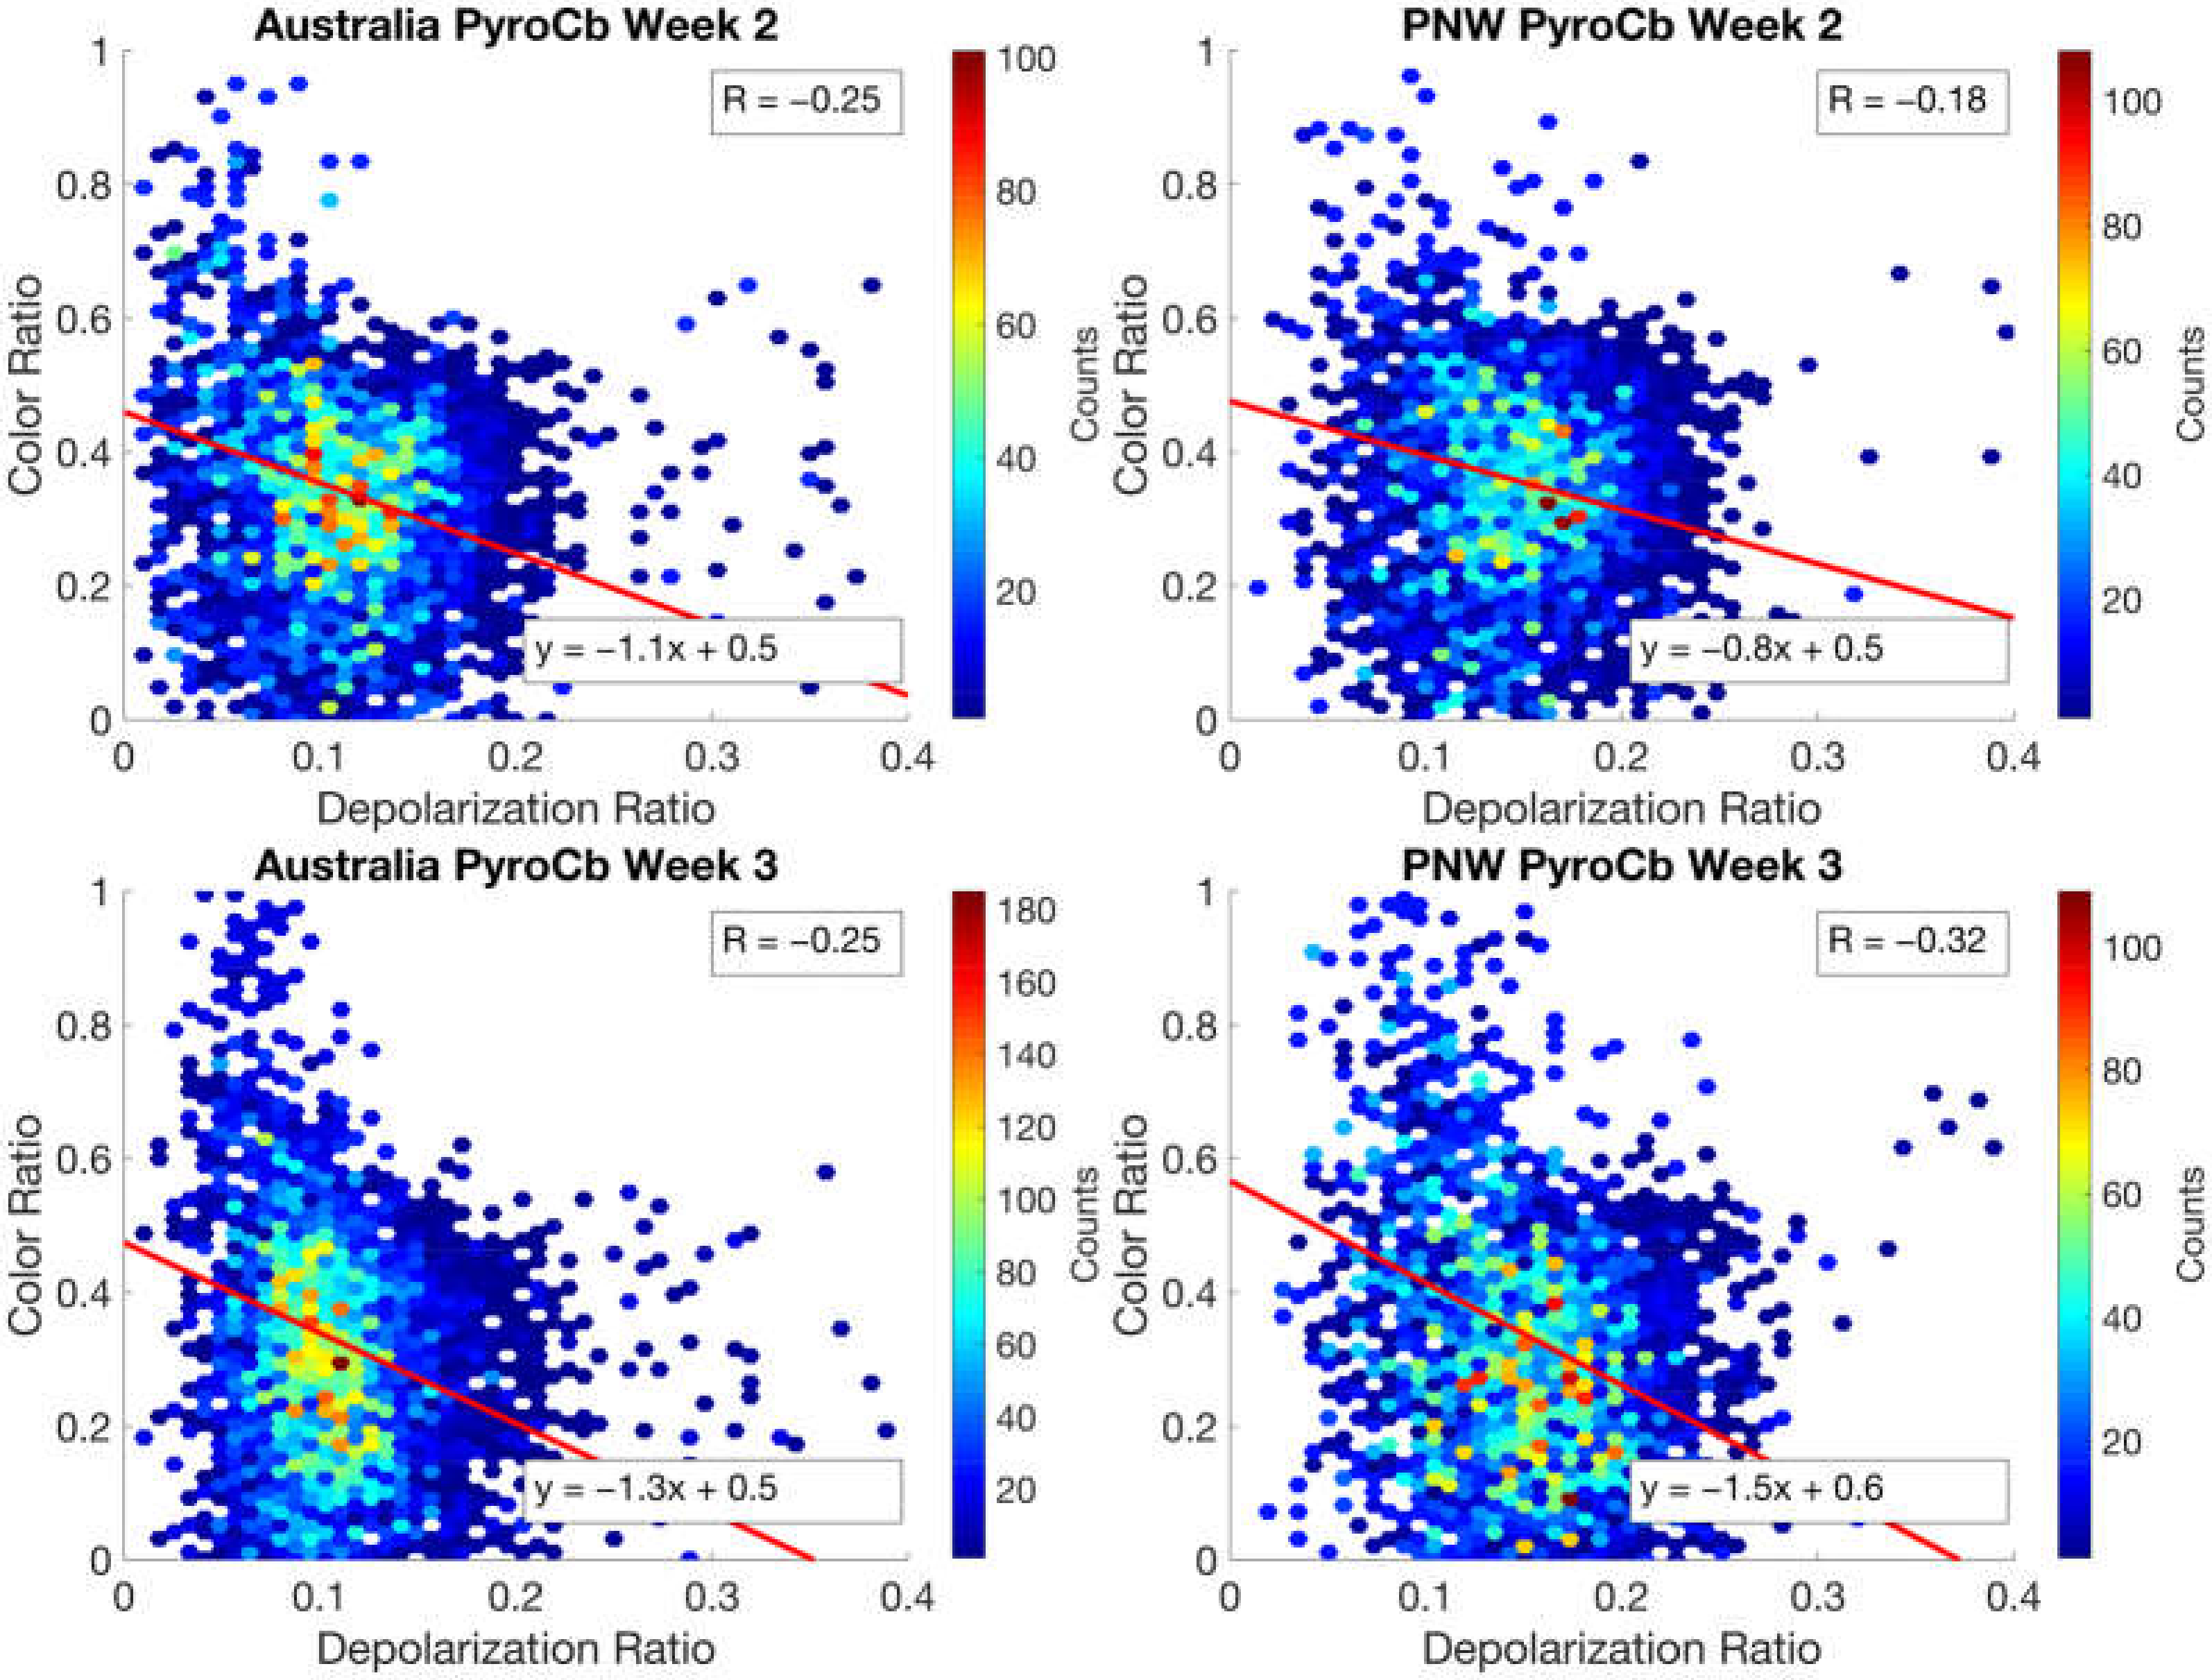
In the pyroCb aerosol layers from the PNW and Australian bushfire events, there is a strong positive relationship between depolarization ratios and altitude (and potential temperature), with higher depolarization ratios (more irregular shaped aerosols) found in the higher altitudes than those closer to the tropopause (Figure 2). Aerosol layers detected at these higher altitudes (>15 km) featured depolarization ratios around 0.2, with the lower stratospheric smoke (<10 km) below 0.1 (Figure A2). Over the course of the plume’s transport and aging, median depolarization for the PNW pyroCb plume increased from ∼0.12 in week 1 to ∼0.20 in week 9 (Figure 3). In contrast, the Australian bushfire pyroCb plume median layer depolarization did not significantly change from ∼0.10 in 9 weeks, before increasing to 0.15 in week 11 (Figure 3); however, this is due to the reasons outlined in Section 3.1.1. A ground lidar station in Punta Arenas, Chile also measured Australian bushfire plume aerosol depolarization ratios to increase over time [9]. The Australian bushfire plume and the PNW pyroCb both exhibited very similar relationships between layer-integrated depolarization ratios and altitude (Figure 2, Figures S1 and S2). Color ratios decreased initially from ∼0.4 to ∼0.2 with the aging of the PNW pyroCb plume in the first six weeks, before increasing back to ∼0.4 by the end of the ninth week (Figure S1). In both the PNW and Australian pyroCb plumes, the color ratios are inversely related to the depolarization ratios, meaning that the less spherical aerosol particles tended to be smaller in size than the more spherical aerosols (Figure 4).
For the PNW pyroCb, CATS lidar generally measured lower depolarization ratios compared to CALIOP, likely due to differences in latitudinal sampling and depolarization wavelengths, with median depolarization ratios around 0.12. Smoke depolarization ratios, like other aerosol types, are dependent on the lidar wavelength, with higher depolarizations typically found for shorter wavelengths [23]. In the second week, when CATS observed the most aerosol layers, there appears to be a similar relationship between depolarization and altitude as that observed by CALIOP (Figure S2). However, with a lack of sufficient nighttime overpasses of the PNW pyroCb plume, we do not have sufficient data to draw conclusions as to the relationships between altitude and depolarization in the CATS data.
There are some differences in the stratospheric smoke depolarization ratios, among other pyroCb events observed by CALIOP. In the stratospheric pyroCb plume from the August 2013 Rim Fire in California, the depolarization values in the first week were lower (∼0.10) and did not increase with altitude (Figure S3). However, the maximum altitude of the plume only reached ∼12 km in this time period. The highest depolarization values seen in the PNW and Australian bushfire pyroCb aerosol plumes were observed at altitudes greater than 12 km. Likewise, the noteworthy 2009 Black Saturday pyroCb event in Australia also produced plumes featuring lower depolarization ratios (∼0.12) in the weeks following the event than the PNW pyroCb and the higher altitude portions of the 2019–2020 Australian bushfire pyroCb aerosol plumes, even at altitudes upwards of 20 km (Figure S4). Similar to the plume produced by the Rim Fire, there was no discernable relationship between layer-integrated depolarization and altitude.

3.2.2. Volcanic Events

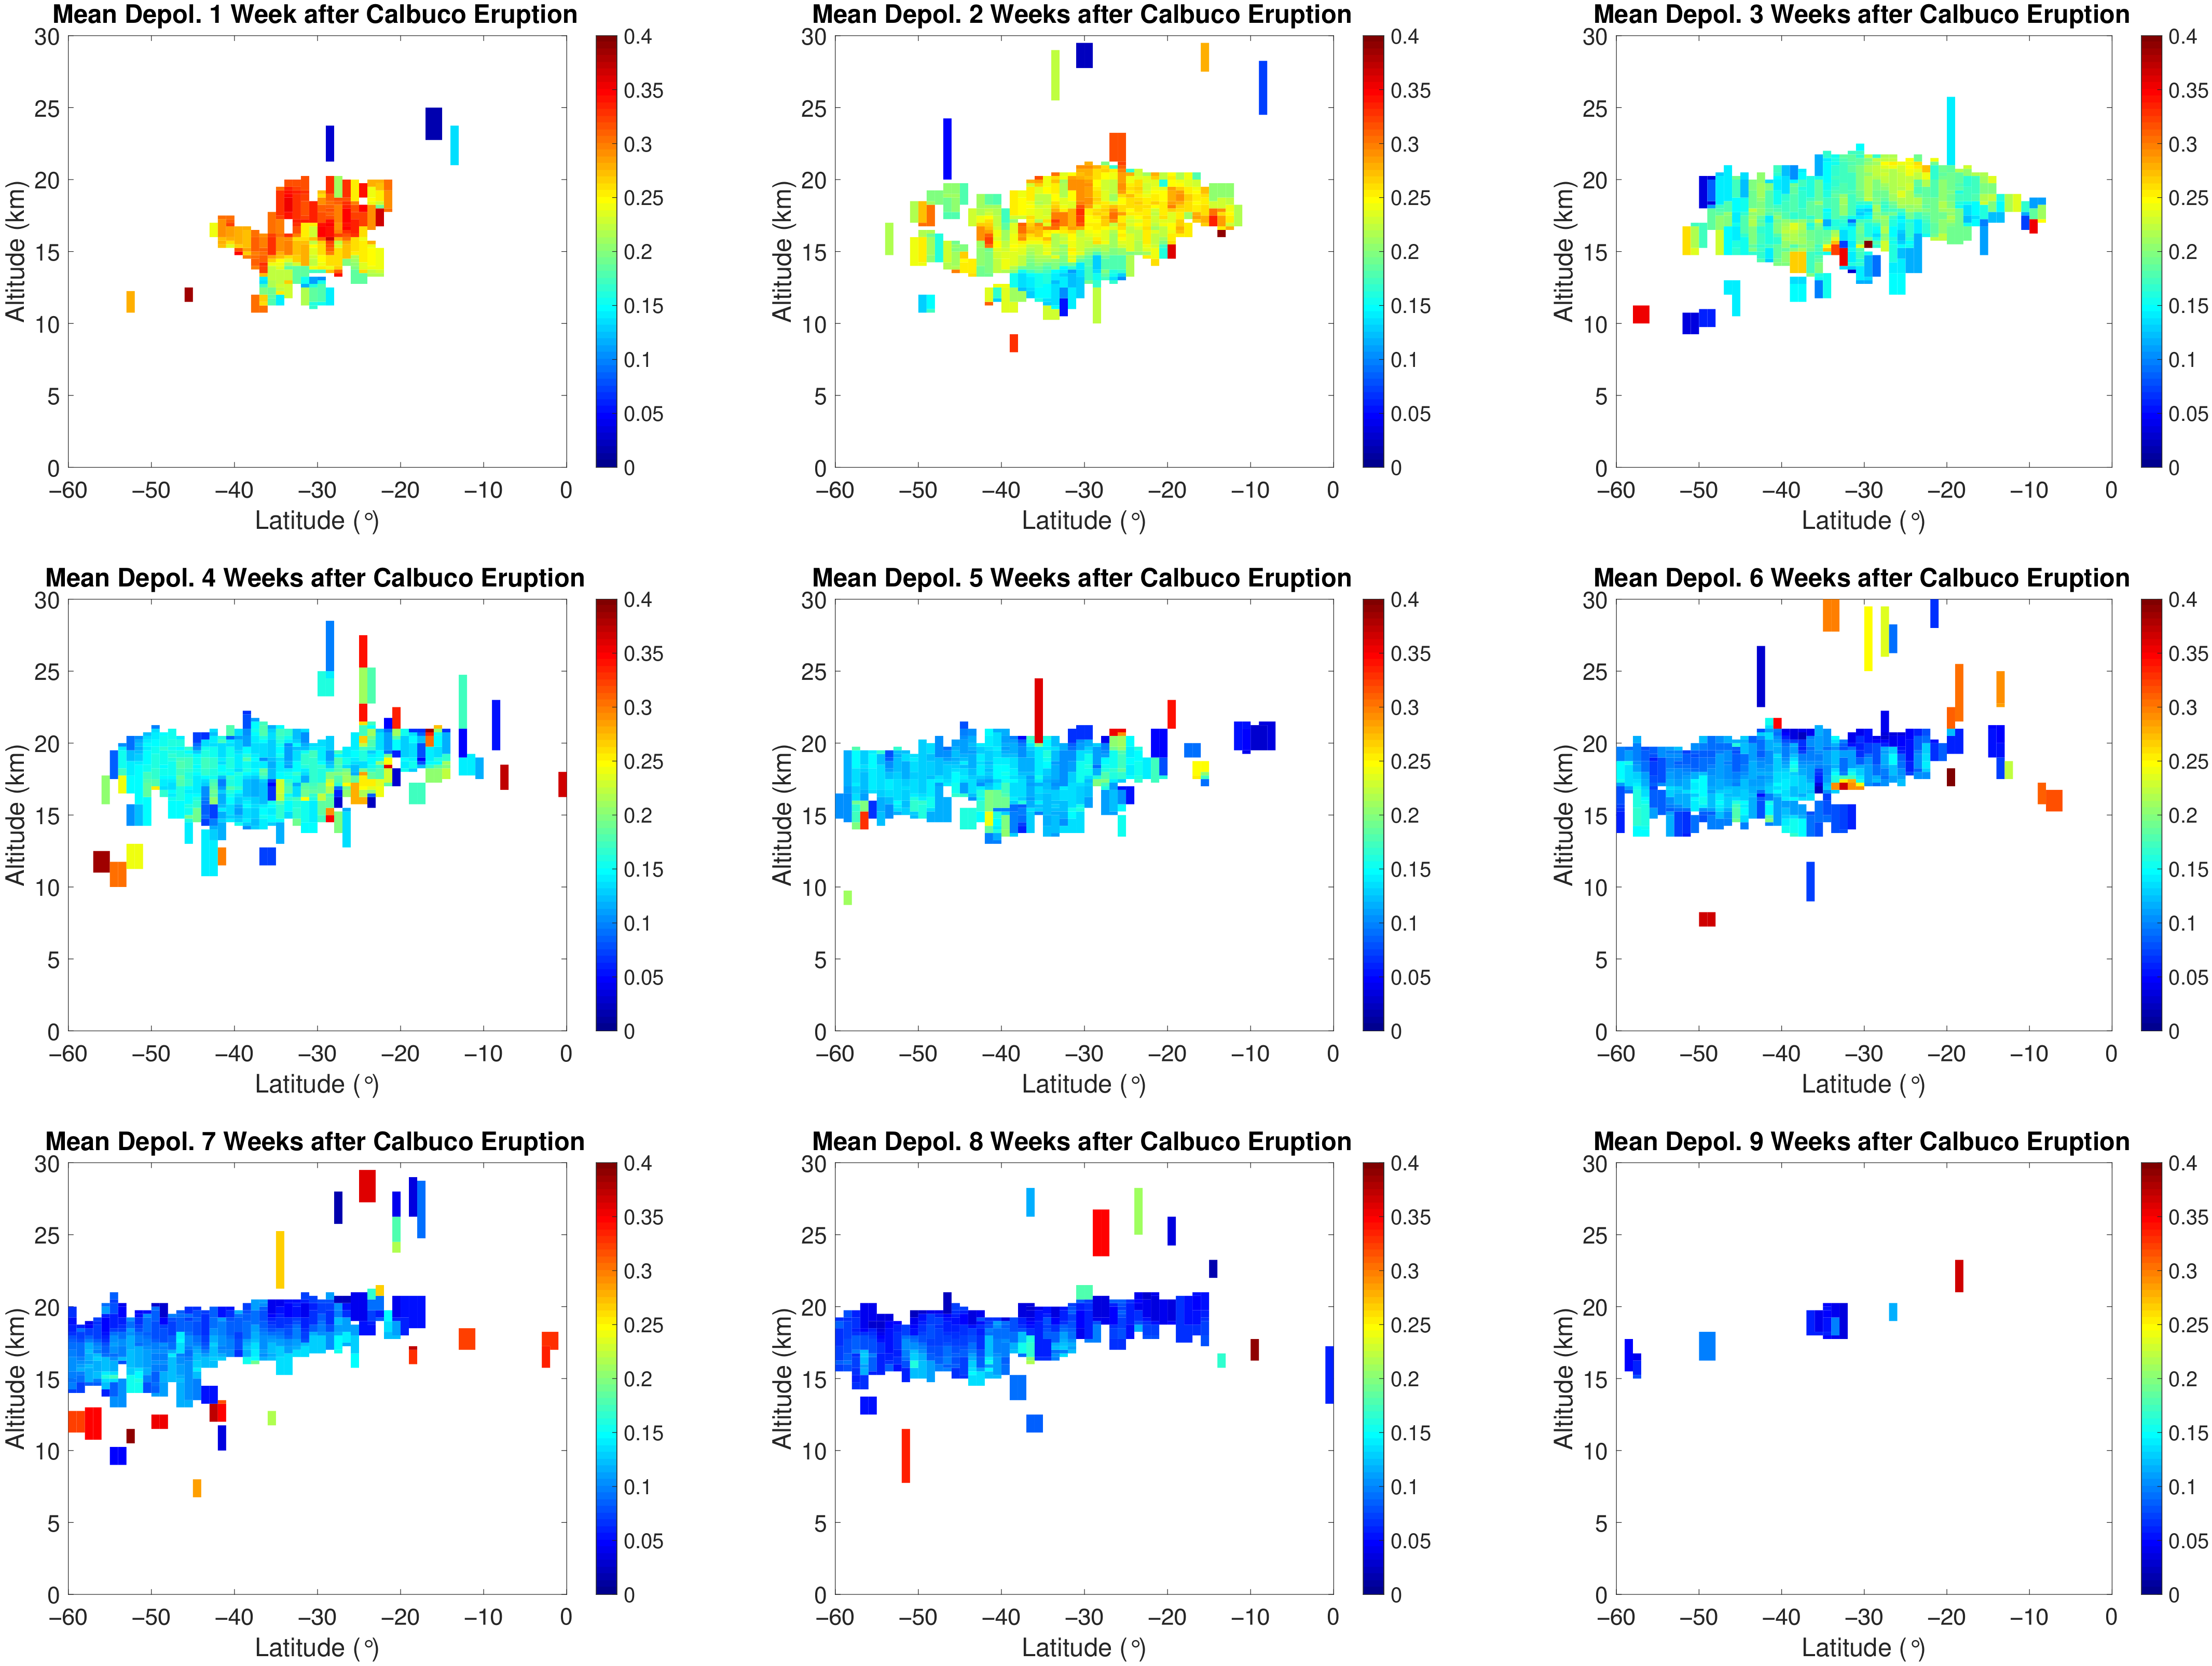
Unlike the PNW pyroCb plume, depolarization ratios for both the Calbuco and Puyehue plumes decreased over time for both CATS and CALIOP. Specifically, median depolarization ratios (1064 nm) for the CATS-observed Calbuco volcanic plume decreased from 0.20 to 0.08 between the eruption and the tenth week (Figure S5). The decrease was similar in the CALIOP observations, with median layer-integrated depolarization values decreasing from 0.30 to 0.08 in the same 10-week period. Similar to the pyroCb event, depolarization values were higher in the CALIOP observations with its shorter wavelengths (532 nm) than the CATS (1064 nm) for the Calbuco plume. Color ratios for the aged Calbuco volcanic plume were less than 0.2 after three weeks, indicating small particles. The color ratio increased after the seventh week to around 0.4 at the end of week 13, indicating an increase in particle size during this period (Figure S1).
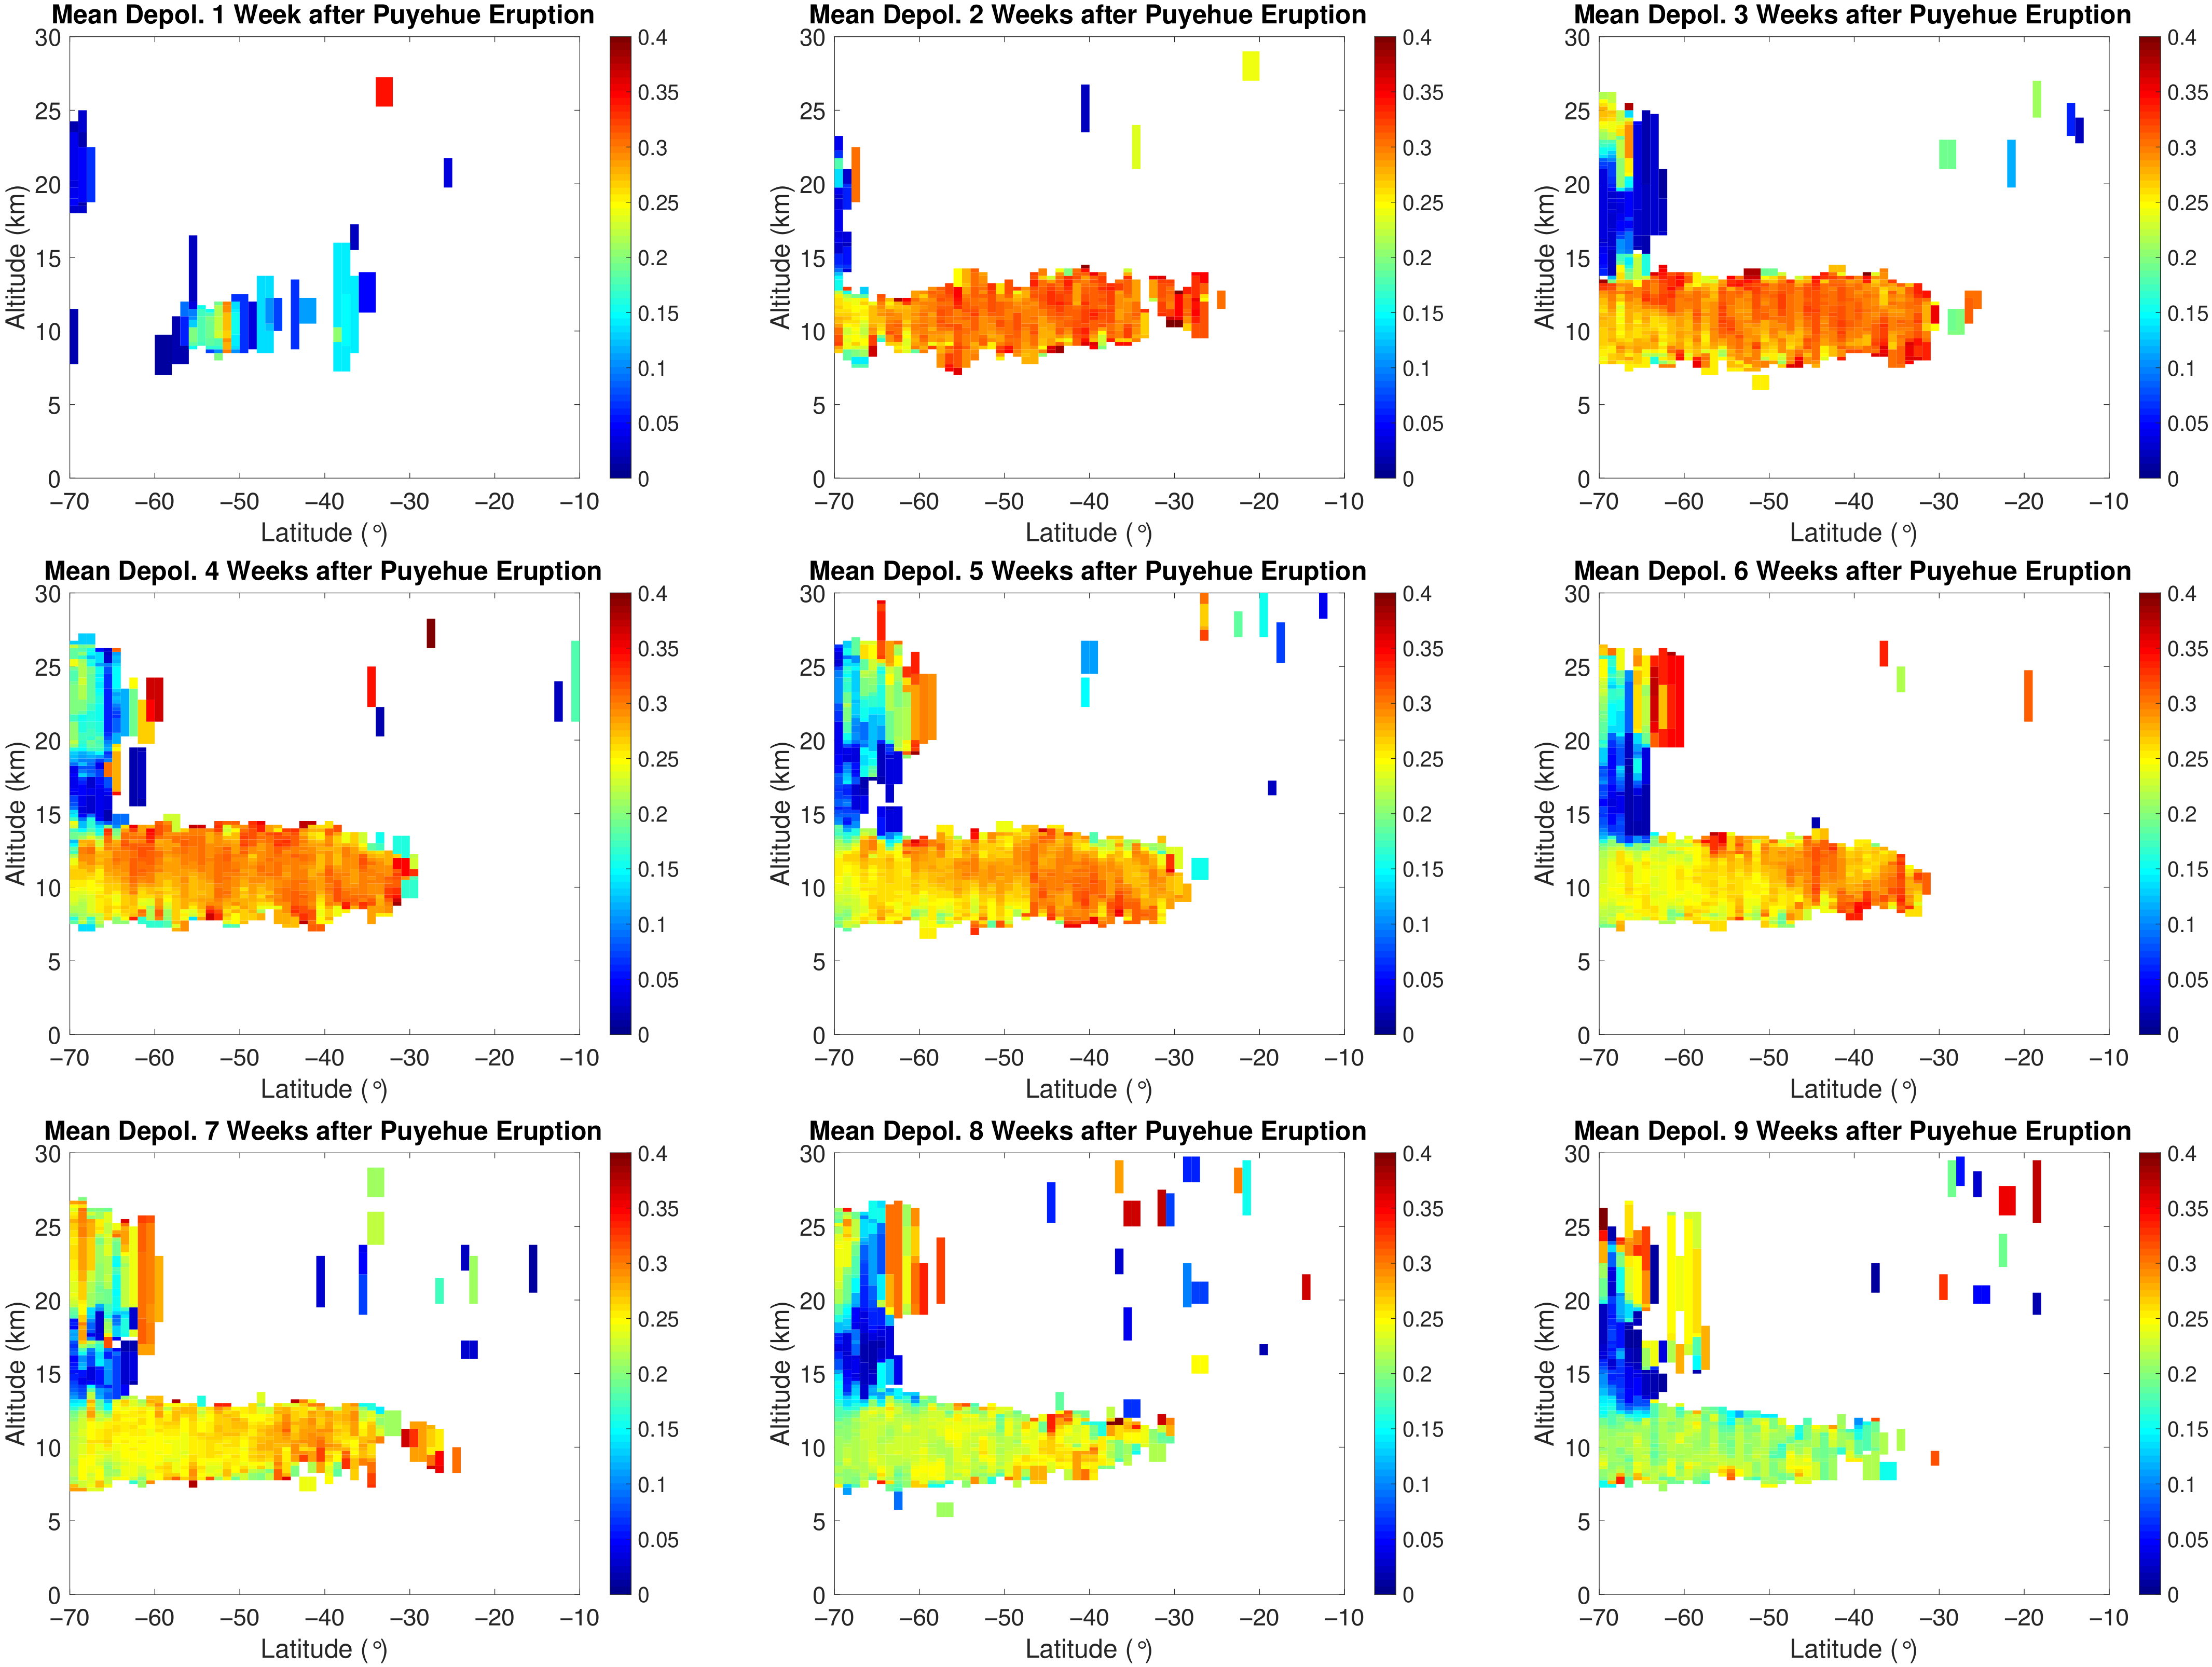
The ash-heavy Puyehue plume’s layer-integrated depolarization ratios also decreased in time. Median depolarization decreased by around a factor of 2 from 0.29 in the second week to 0.14 after 13 weeks (Figure 3), which is a high depolarization ratio for volcanic plumes [11]. Puyehue plume aerosol layer color ratios decreased from the second week to the thirteenth week from 0.48 to 0.40, indicating that the plume aerosols decreased in size slightly over the time period (Figure S1).

4. Discussion

Where both pyroCb and volcanic events can similarly produce large stratospheric plumes of particles, there are important differences in the evolution of their plumes that must be considered when estimating the broader impact of these plumes. For one, as seen in Figure 1, large pyroCb plumes can increase by many kilometers after injection compared to the static to modest increases seen in most volcanic plumes, like the Calbuco and Puyehue eruptions detailed here, with some of these differences arising due to differences in zonal and meridional transport. Differences between volcanic and pyroCb plumes are more distinct with the correlation between altitude and depolarization ratios seen in the pyroCb plume. As the pyroCb plumes rise in altitude, the median aerosol layer-integrated depolarization ratio likewise increases. The PNW pyroCb plume’s depolarization ratio increased by over 60% in the two months following the event, from ∼0.12 to 0.19. While the median depolarization of the Australian bushfire pyroCb did not increase initially, the higher altitude aerosol layers did exhibit higher layer-integrated depolarization ratios (Figure 2, Figure 3 and Figure A3). In contrast, the Calbuco eruption featured a decrease of over 70% in a similar time period from 0.30 to 0.08, and the Puyehue eruption featured a 50% decrease in median aerosol layer depolarization ratio, from 0.29 to 0.14. The decrease in depolarization over the time period for both of the volcanic events can be explained partially due to the sedimentation of the large, irregularly shaped volcanic ash particles [22]. After eruption, ash particles settle out of the stratosphere more rapidly than the smaller, more spherical sulfate aerosols, leading to a decrease in particle depolarization. Coupled with the decrease in color ratio, indicating the plume aerosol particles decreased in size, the evolution of the Calbuco and Puyehue volcanic plumes is consistent with this sedimentation process.
These higher depolarization ratios seen in the PNW and Australian pyroCb plumes are significant, as they are greater than typically seen in tropospheric smoke plumes. In the CALIOP stratospheric aerosol typing algorithm, smoke layers are defined as having depolarization ratios less than 0.15, among other factors [18]. For previous stratospheric pyroCb and tropospheric smoke plumes in the CALIOP record, this assumption is generally accurate. In the 2009 Black Saturday event in Australia, the stratospheric plume had a depolarization of around 0.12 in the first two weeks and the 2013 Rim Fire in California less than 0.10 (Figures S3 and S4). While these pyroCb plumes had depolarization ratios higher than seen in typical tropospheric smoke, they were not as depolarizing as those observed in the PNW and Australian pyroCb plumes. The differing depolarization ratios among other pyroCb events suggest that, like volcanic plumes [11], different pyroCb plumes, especially the largest ones, may exhibit differing smoke and plume composition.

Explaining the Depolarization Patterns in the Pyrocb Plumes

The increase over time in median aerosol layer depolarization ratios arises in part due to the altitude dependence of the depolarization ratios in this plume (Figure 2). Within the first few weeks, when both the Australian and PNW pyroCb plumes are most coherent, very similar relationships were found, relating depolarization to altitude (and potential temperature). With the plume gradually increasing in altitude over this timeframe, we subsequently found an increase in depolarization. It is not clear though whether the atmospheric conditions in these higher altitudes are leading to the particles becoming more irregularly shaped, whether the more irregularly shaped particles within the plume are predisposed to the “self-lifting” vertical transport mechanism, or if the more spherical particles are settled. In this section, we discuss these possibilities.
Differences in smoke aerosol particle depolarization with altitude in the troposphere have been noted before, and even for the PNW pyroCb event, however the explanations previously posited for this relation may not explain the relations outlined here. For the PNW pyroCb, surface lidar stations in Europe observed much higher depolarization ratios for the UTLS smoke than for smoke in the lower troposphere (0.18 for the stratospheric plume, >0.03 for the tropospheric smoke observed by the same 532 nm wavelength) [24,25]. Haarig et al. [24] hypothesized that mixing with sulfates in the more polluted boundary layer resulted in more spherical aerosols in the lower troposphere than those aerosols injected quickly and directly into the cleaner UTLS. This reasoning, though, does not specifically explain the differences shown here within the stratosphere, as sulfates are much less abundant in the stratosphere than the troposphere. Yu et al. [6] likewise noted high depolarization ratios in analyzing the same CALIOP overpasses, and hypothesized that these depolarizing ratios were indicative of black carbon aggregates internally mixed with organic carbon; however, relations between altitude and depolarization ratios were not addressed.
The unique depolarization ratios in the PNW pyroCb plume could be indicative of different things. As Mischenko et al. [26] show, higher depolarization in smoke is associated with morphologically complex particles. Yu et al. [6] similarly found, in their modeling study, that fractal black carbon aggregates internally mixed with organic carbon produced the most accurate recreation of plume rise observed in the PNW pyroCb plume.
The higher depolarization ratios observed in the PNW and other pyroCb events could be from dust and soil particles suspended within the smoke in the convective updraft and resultant plume. Such particles are more highly depolarizing than smoke [23], and have been previously observed in smoke samples [27]. In a modeling sensitivity study (Appendix A), we could not replicate the high depolarizations through a mixture of dust and smoke, even with unrealistically high fractions of dust (Figure A1).
Like dust, ice crystals are highly depolarizing, and it is well documented that considerable masses of water vapor are also injected into the stratosphere during pyroCb events. However, ice crystals from pyroCb plumes tend to be short-lived in the dry stratosphere. MLS observations have shown that ice from a different Canadian pyroCb event only persisted for about a week before sublimation in the stratosphere [28], so ice is an unlikely culprit for the prolonged high depolarizations documented here.
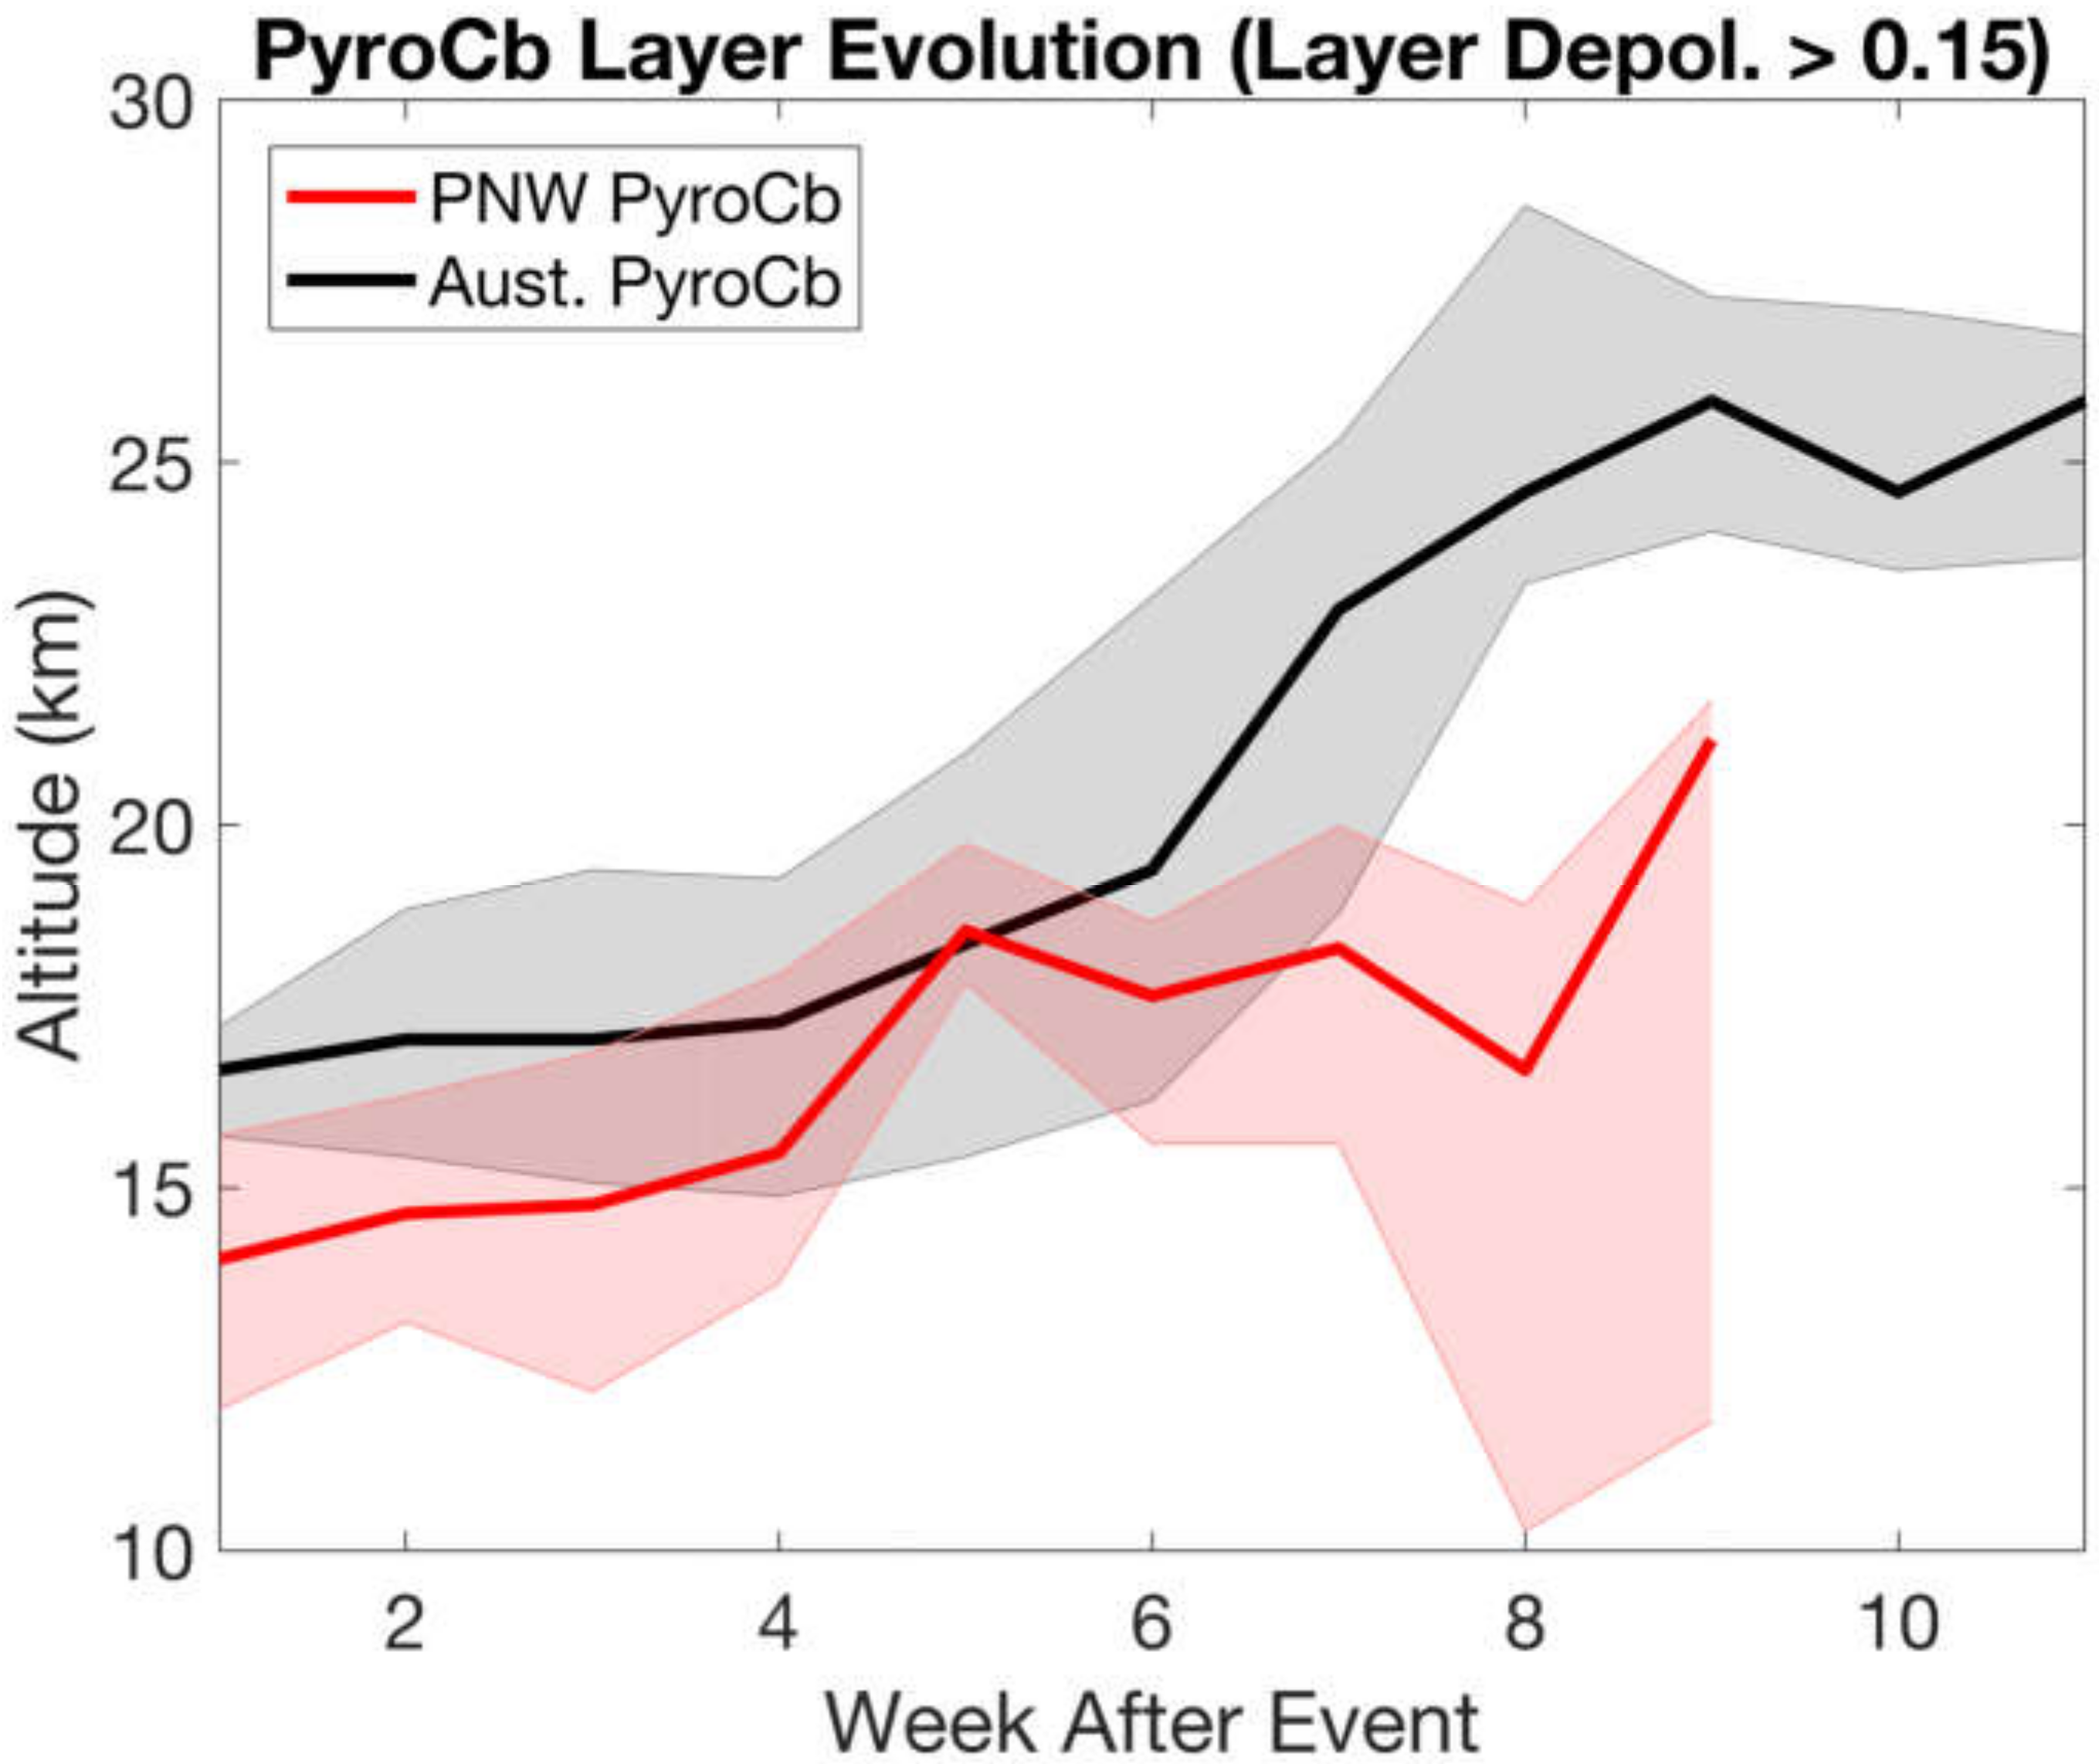
From the space-based lidar observations presented here, and the work by Yu et al. [6], we find two plausible pathways that could lead to the relationship between layer-integrated depolarization ratios and layer altitude: chemical modification of the plume by stratospheric ozone or the preferential lifting of more highly depolarizing aerosol layers. The first of these possibilities is that the organic carbon coating of the pyroCb smoke aerosols could be modified by ozone in the stratosphere. Unlike tropospheric aging, this stratospheric aging process would both gradually decrease the size of the pyroCb aerosols with time, and could also result in more irregularly shaped aerosol particles. Negative ozone anomalies have been noted to occur with large pyroCb plumes; however, these anomalies are predominantly from the entrainment of tropospheric air rather than in situ chemistry [6,10]. A second possibility is that the layers could stratify in the stratosphere depending on aerosol properties, with layers containing higher concentrations of black carbon rising due to the self-lifting of these layers, while larger, higher albedo particles remain at the same altitude, or slowly settle. Yu et al.’s [6] modeled results show that higher black carbon fractions led to higher plume rise for the PNW event. In a previous study of Brazilian biomass burning aerosols, these higher black carbon fractions were associated with more irregularly shaped aerosol particles [29]. Indeed, when considering only layers with depolarization ratios greater than 0.15, we find considerably quicker plume aerosol layer ascents in both pyroCb cases, but especially for the Australian Bushfire pyroCb. After 8 weeks, the more highly depolarizing aerosol layers had risen 8 kilometers compared to the more modest 2.3 km increase observed when considering all stratospheric aerosol layers (Figure 1, Figure 2, Figure 3, Figure 4 and Figure 5). Until there is in situ sampling of fresh or aged pyroCb plumes and coincident lidar and aerosol microphysical measurements, these processes remain theoretical, but plausible.

5. Conclusions

We have shown here that stratospheric pyroCb and volcanic plumes from four events (2019–2020 Australian bushfire pyroCb event, 2017 PNW pyroCb event, 2011 Puyehue volcanic eruption, and 2015 Calbuco volcanic eruption) propagate and age distinctively depending on their source. Pyrocumulonimbus plumes can dramatically rise over time, due to diabatic heating and the buoyant lifting of aerosol layers with absorbing black carbon, where the volcanic events shown here either modestly rise or remain vertically static, since they lack sufficiently absorptive aerosol particles. Notably, pyroCb plumes from the two record setting events featured a positive relationship between the layer-integrated depolarization ratio and plume altitude, leading to an increase in layer-integrated depolarization ratio with time and in the higher altitude portions of the plume over time, as the plume climbed in altitude, showing that the plume particles may not be homogeneous with altitude. These distinctive characteristics, especially the relationship between altitude and particle sphericity, warrant further study.
The opposing aging effects seen in pyroCb plumes in the stratosphere and the troposphere could be significant in estimating the broader effects from this event. Modelers are forced to make assumptions about particle properties in estimating the mass injections and broader effects of pyroCb plumes. Because of the non-sphericity of the aerosol particles in the layer, assuming properties associated with “aged smoke” may not be accurate for stratospheric pyroCb plumes of any age. This aging of stratospheric pyroCb aerosols, as documented here, is quite different compared to tropospheric smoke and stratospheric volcanic aerosols, further demonstrating the need for lidar products to accurately differentiate these types in their typing algorithms. There is a need for a better understanding of the composition and aging process of pyroCb plumes considering the apparent increase in the frequency of the large fire events. Coincident lidar and polarimeter measurements, allowing for the retrieval of aerosol microphysical parameters, from both airborne field campaigns and future space-based platforms, could hopefully answer some of these remaining questions about the aging process of large stratospheric pyroCb aerosol plumes.

Supplementary Materials

The following are available online at https://www.mdpi.com/2073-4433/11/10/1035/s1, Figure S1: Median CALIOP color ratio evolution for the stratospheric plumes, Figure S2: Zonal averages of CATS layer-integrated depolarization ratios of the 2017 PNW pyroCb event, Figure S3: Zonal averages of CALIOP layer-integrated depolarization ratios of the 2013 Rim Fire pyroCb event, Figure S4: Zonal averages of CALIOP layer-integrated depolarization ratios of the Black Saturday pyroCb event, Figure S5: Median CATS depolarization ratio evolution for the Calbuco Volcanic eruption

Author Contributions

K.C. designed the experiments, performed the analysis, drafted the manuscript, and responded to reviewers. J.Y. aided in experimental design, analysis, and manuscript drafting. S.D. designed and performed the analysis for the GEOS Model Sensitivity Test and wrote Appendix A. All authors have read and agreed to the published version of the manuscript.

Funding

This research was funded by the NASA Postdoctoral Program, administerd by the Universities Space Research Association.

Conflicts of Interest

The authors declare no conflict of interest.

Appendix A. GEOS Model and Sensitivity to Including Dust within Smoke on Depolarization Ratios
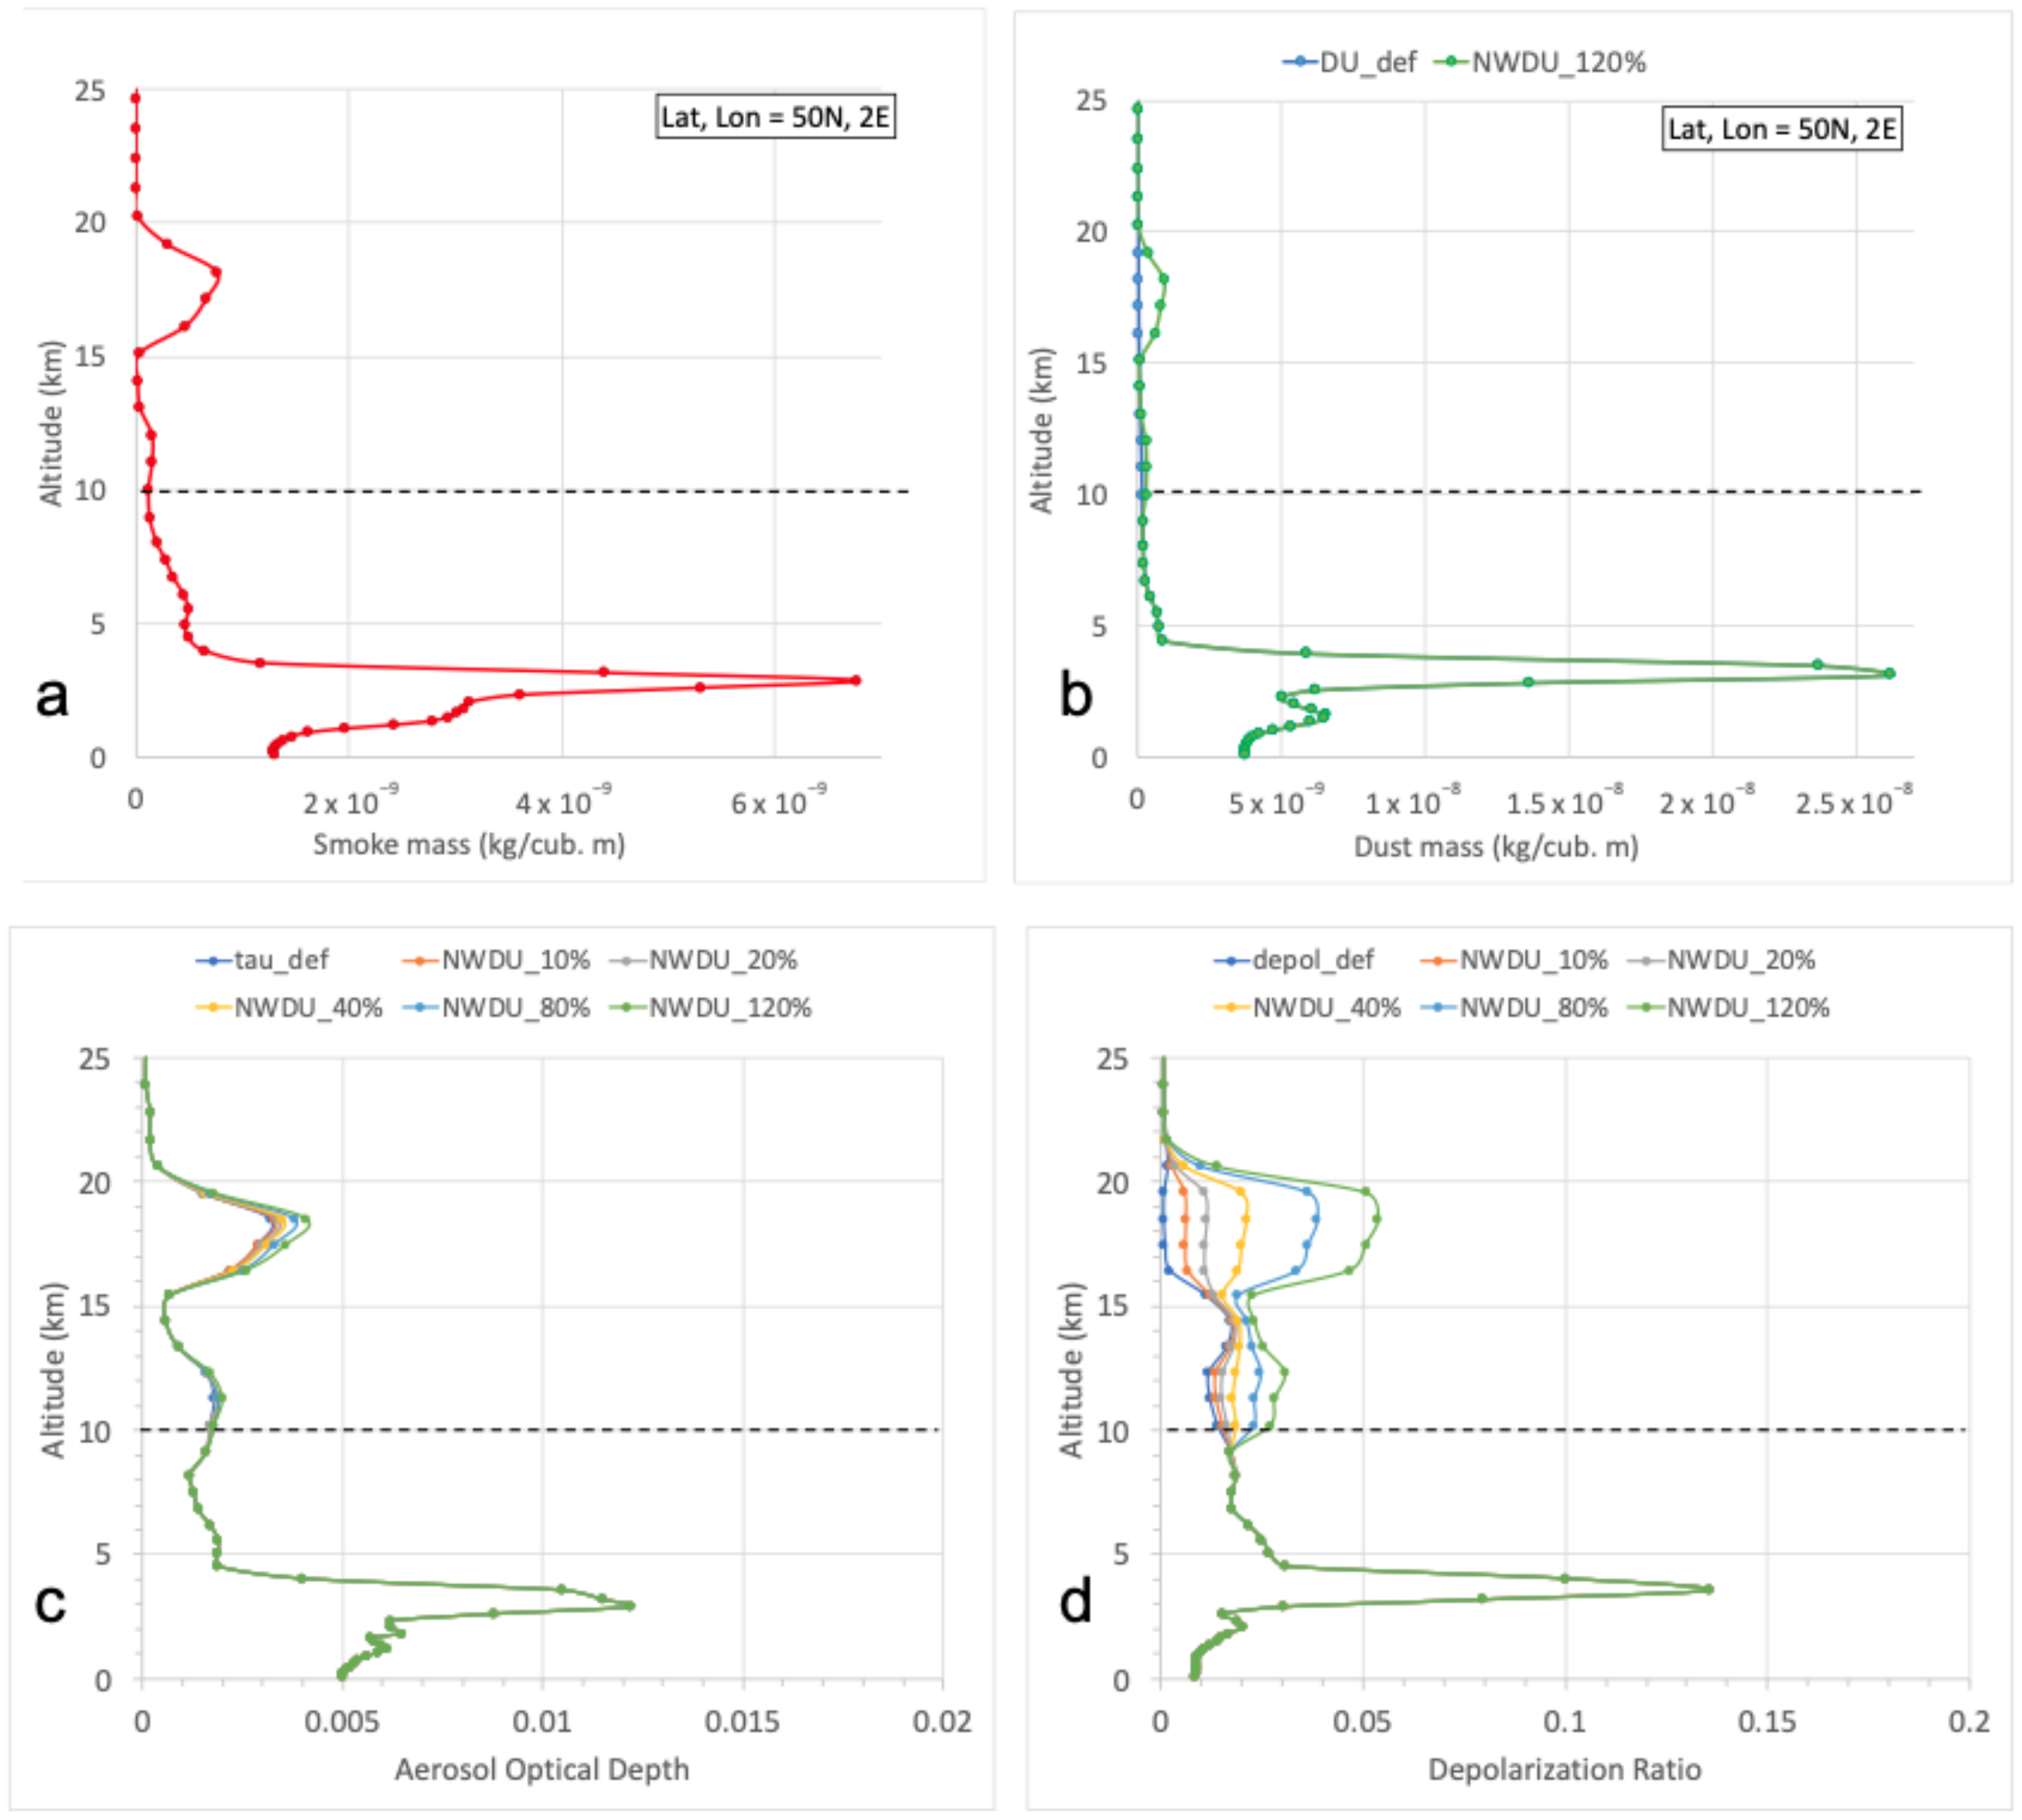
We used the atmospheric component of the Goddard Earth Observing System (GEOS) Earth system model [30,31] to test the influence of including dust particles within the pyroCb-emitted smoke on simulated depolarization ratios. The prognostic aerosol module within GEOS is based on the Goddard Chemistry, Aerosol, Radiation, and Transport (GOCART) module [32,33,34], that accounts for the emissions, removal processes and chemistry for seven aerosol species, including black carbon (BC), brown carbon (BrC) [35], and dust (DU). For all species except dust, aerosol optical properties are computed assuming Mie theory, with refractive indices and hygroscopic growth factors primarily obtained from the Optical Properties of Aerosols and Clouds (OPAC) database [36]. For dust, an observation-derived set of refractive indices are used and a spheroidal particle shape distribution is assumed, following the methodology described in Colarco et al. (2014) [37]. Aerosol optical properties, whether from Mie theory or the non-spherical dust optical properties database, are presented in look-up tables, that provide quantities such as the mass extinction, scattering, and backscattering efficiencies, particulate depolarization ratio, and phase function, as a function of wavelength, relative humidity and dry particle size. In a straightforward manner, we convert our simulated mass mixing ratios to aerosol optical properties using these tables. Aerosol particulate depolarization ratios are determined from the Legendre polynomial moments of the polarized phase function (for dust only; other species are assumed to have zero depolarization ratio). The total particulate depolarization ratio at each model vertical level is determined by weighting with each aerosol species contribution to scattering at the model level of interest [38]. We utilized the aerosol vertical mass distribution output from our previous simulations of the PNW pyroCb injections of August 2017 to identify the locations of the smoke-influenced stratospheric layers at various intervals, following the injections. The details of the model configuration and injection parameters for the PNW PyroCb simulations are provided in Das et al. (2020) [39], in preparation. Here, we demonstrate with one such example how the inclusion of dust mass within PyroCb-emitted smoke influenced the simulated depolarization ratios. We obtained a smoke (Figure A1a) and dust mass profile (Figure A1b, blue line) for a stratospheric smoke -nfluenced location (at 50 N, 2 E) on August 27, i.e., about two weeks after the pyroCb injections. The enhanced smoke mass (Figure A1a) and total aerosol optical depths (Figure A1c) between 15–20 km represent the pyroCb smoke influence, and this is consistent with the latitudinal and vertical location of smoke depicted in Figure A2 for the same time interval. Since we did not inject dust particles in our original PNW pyroCb simulations, dust mass is negligible at the high-altitude levels (15–20 km) for the default case (Figure A1b). Now, as a set of sensitivity experiments, we assumed increments in dust mass for model levels greater than 10 km, such that the increments are an increasing fraction of total smoke (BC +BrC) mass at each level. For example, new dust mass (NWDU_120%, Figure A1b) is the sum of original or default dust mass and 120% of the total smoke mass at each level, while keeping the same dust mass size distribution. We then computed the new optical depth and depolarization ratio profiles as a result of the dust mass increments, using the look-up tables for aerosol optical properties (Figure A1c,d). It is clear from the sensitivity experiments that, even with a large increment in dust mass (e.g., default dust mass + 120% of total smoke mass), at pyroCb smoke levels, the depolarization ratios increased only up to 0.05. Therefore, high depolarization ratios observed for pyroCb smoke layers (Figure A2) cannot be explained solely by the presence of soil or dust particles within smoke plumes.
Figure A1. GEOS model simulated (a) smoke aerosol mass profile, (b) default (DU_def, blue line) and assumed dust mass profiles (NWDU, green line), and changes in (c) aerosol optical depth and (d) depolarization ratio profiles resulting from the different assumptions of dust mass profiles. The profiles depict the values at a pyroCb-emitted smoke influenced location (50 N, 2 E) on 27 August 2017, i.e., about two weeks from the PNW pyroCb injections. The dust mass profiles are only varied for model levels above 10 km (black dotted lines), to evaluate the stratospheric impacts.
Atmosphere 11 01035 g0a1

Appendix B. Zonal Averages of CALIOP Layer-Integrated Depolarization Ratios
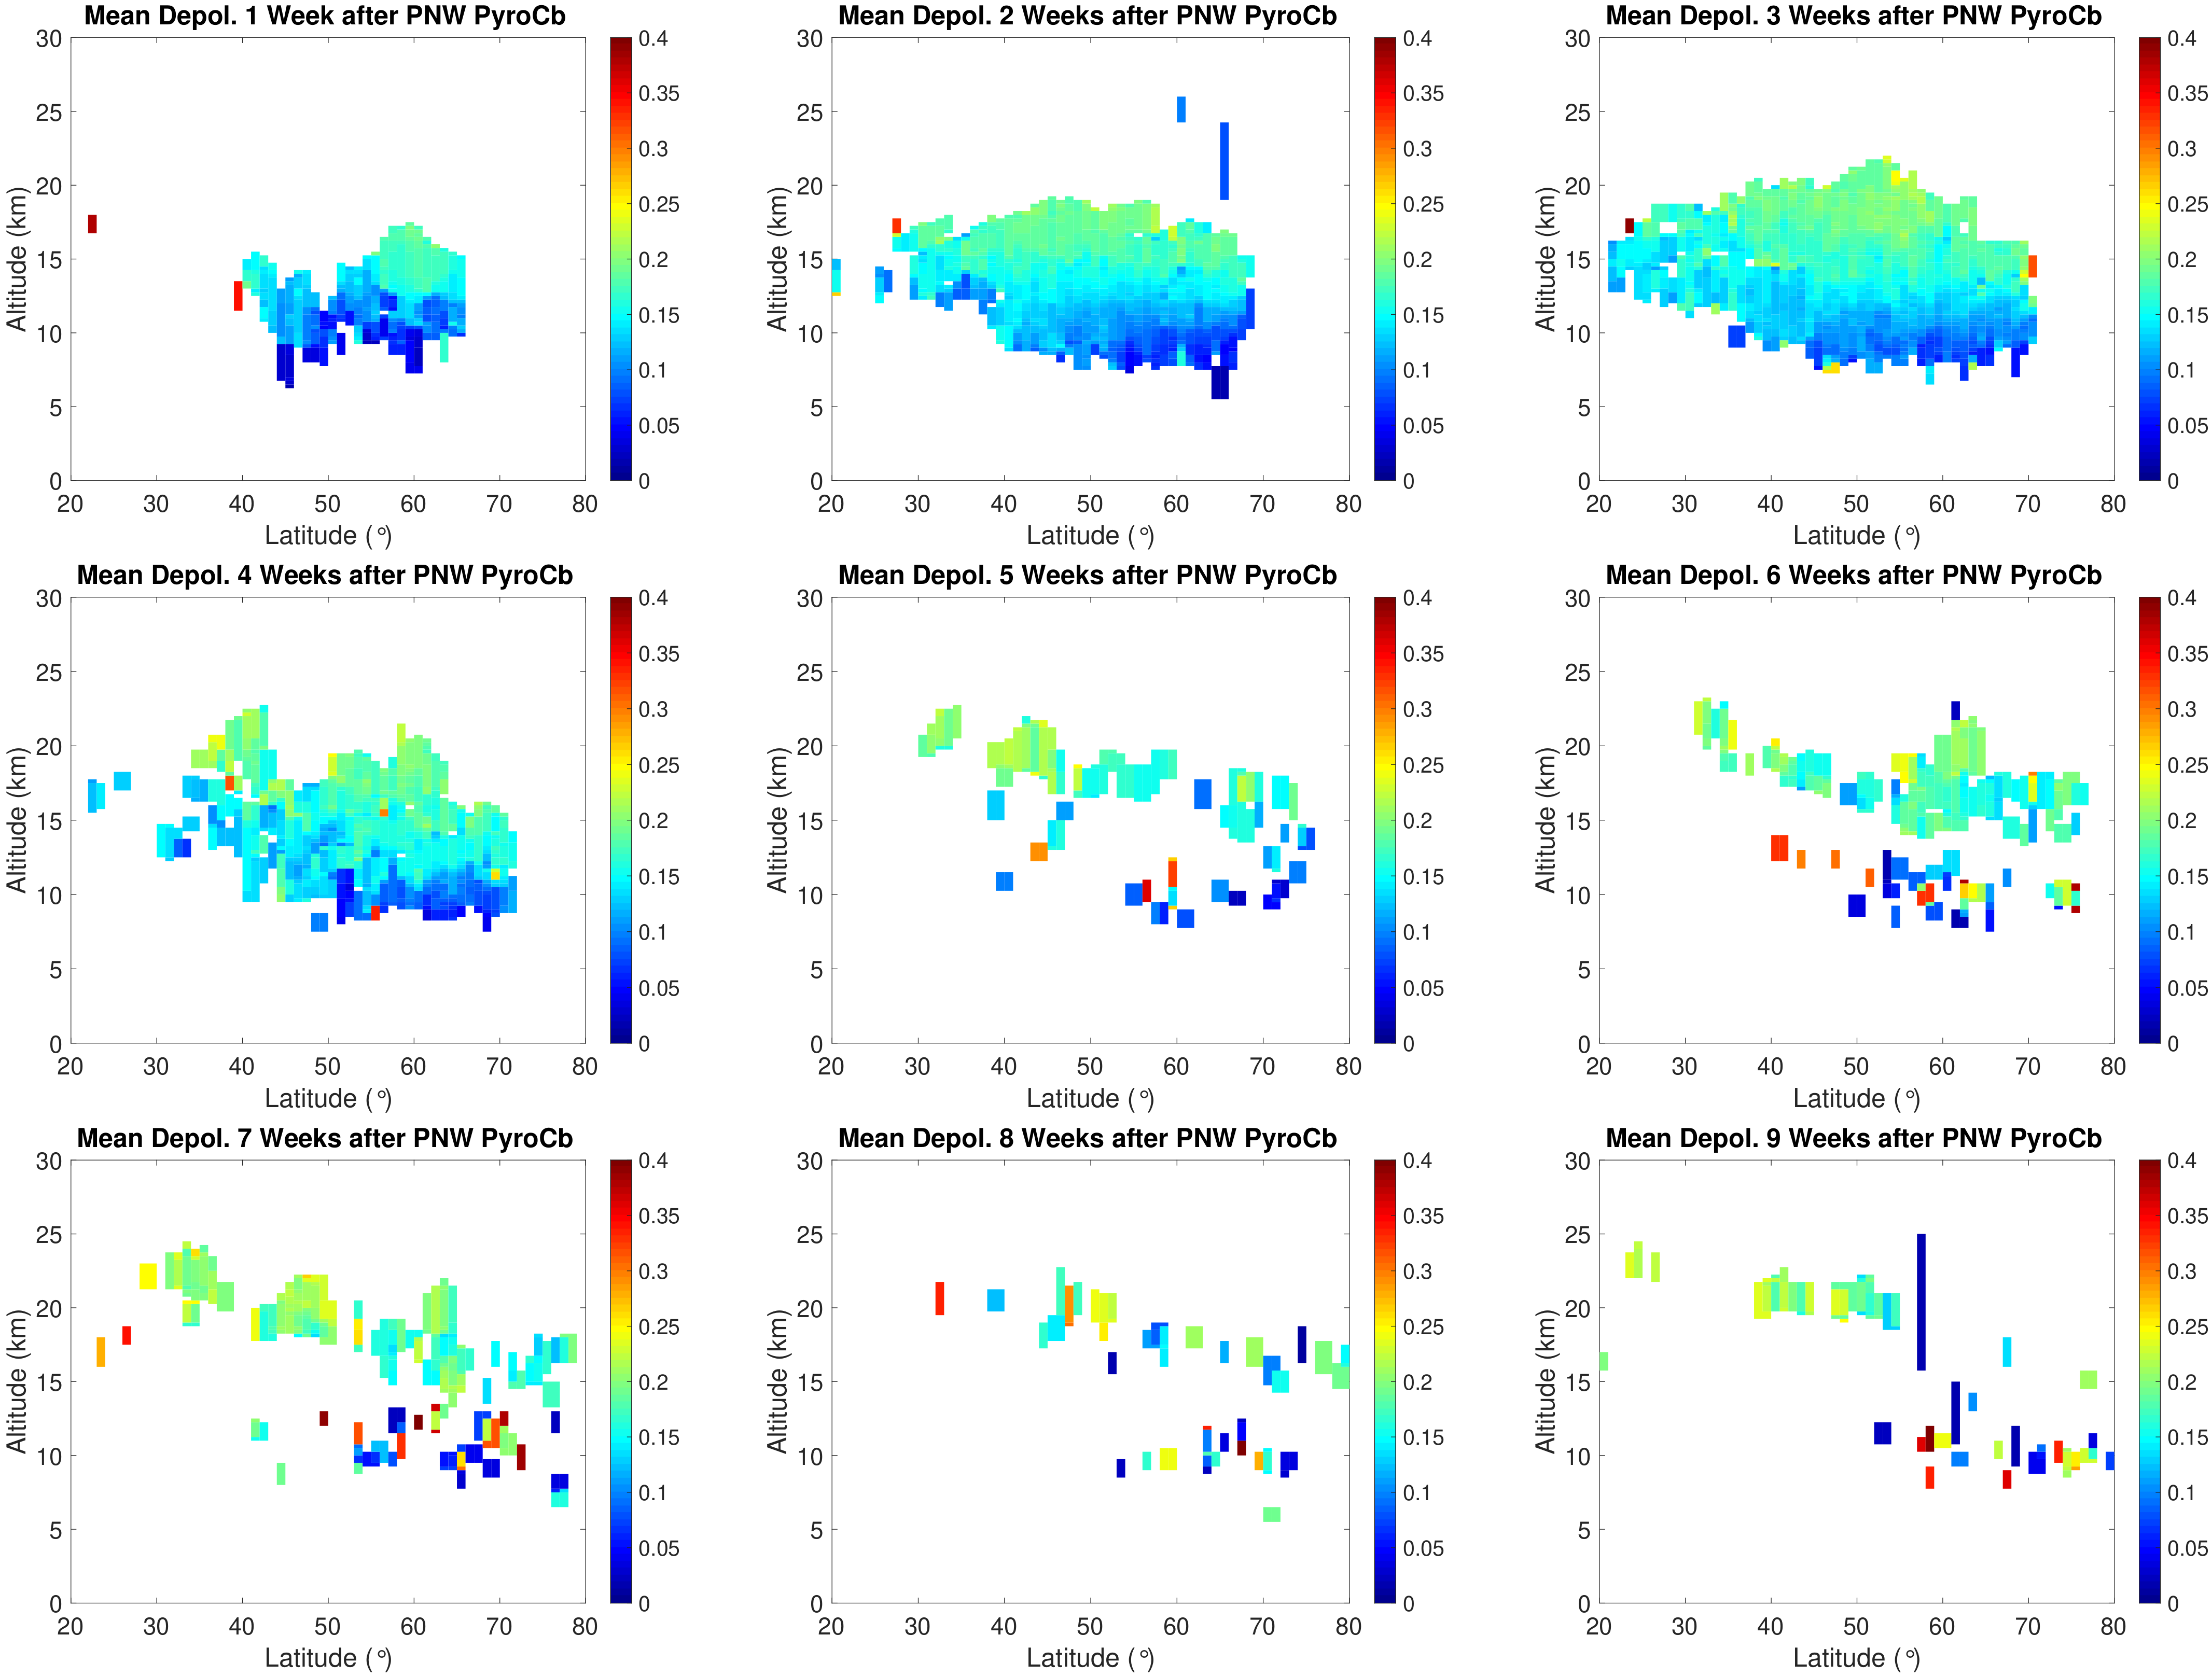
Figure A2. Zonal averages of CALIOP layer-integrated depolarization ratios for the PNW pyroCb plume.
Atmosphere 11 01035 g0a2
Figure A3. Zonal averages of CALIOP layer-integrated depolarization ratios for the Australian bushfire pyroCb plume.
Atmosphere 11 01035 g0a3
Figure A4. Zonal averages of CALIOP layer-integrated depolarization ratios for the Calbuco eruption.
Atmosphere 11 01035 g0a4
Figure A5. Zonal averages of CALIOP layer-integrated depolarization ratios for the Puyehue eruption.
Atmosphere 11 01035 g0a5

References

  1. Deshler, T. A review of global stratospheric aerosol: Measurements, importance, life cycle, and local stratospheric aerosol. Atmos. Res. 2008, 90, 223–232. [Google Scholar] [CrossRef]
  2. Kremser, S.; Thomason, L.W.; Hobe, M.V.; Hermann, M.; Deshler, T.; Timmreck, C.; Toohey, M.; Stenke, A.; Schwarz, J.P.; Weigel, R.; et al. Stratospheric aerosol—Observations, processes, and impact on climate. Rev. Geophys. 2016, 54, 278–335. [Google Scholar] [CrossRef]
  3. Fromm, M.; Lindsey, D.T.; Servranckx, R.; Yue, G.; Trickl, T.; Sica, R.; Doucet, P.; Godin-Beekmann, S. The Untold Story of Pyrocumulonimbus. Bull. Am. Meteorol. Soc. 2010, 91, 1193–1210. [Google Scholar] [CrossRef] [Green Version]
  4. Peterson, D.A.; Campbell, J.R.; Hyer, E.J.; Fromm, M.D.; Kablick, G.P.; Cossuth, J.H.; DeLand, M.T. Wildfire-driven thunderstorms cause a volcano-like stratospheric injection of smoke. NPJ Clim. Atmos. Sci. 2018, 1, 30. [Google Scholar] [CrossRef] [PubMed] [Green Version]
  5. Christian, K.; Wang, J.; Ge, C.; Peterson, D.; Hyer, E.; Yorks, J.; McGill, M. Radiative Forcing and Stratospheric Warming of Pyrocumulonimbus Smoke Aerosols: First Modeling Results With Multisensor (EPIC, CALIPSO, and CATS) Views from Space. Geophys. Res. Lett. 2019, 46, 10061–10071. [Google Scholar] [CrossRef] [Green Version]
  6. Yu, P.; Toon, O.B.; Bardeen, C.G.; Zhu, Y.; Rosenlof, K.H.; Portmann, R.W.; Thornberry, T.D.; Gao, R.S.; Davis, S.M.; Wolf, E.T.; et al. Black carbon lofts wildfire smoke high into the stratosphere to form a persistent plume. Science 2019, 365, 587–590. [Google Scholar] [CrossRef] [PubMed]
  7. Ge, C.; Wang, J.; Carn, S.; Yang, K.; Ginoux, P.; Krotkov, N. Satellite-based global volcanic SO2 emissions and sulfate direct radiative forcing during 2005–2012. J. Geophys. Res. Atmos. 2016, 121, 3446–3464. [Google Scholar] [CrossRef] [Green Version]
  8. Labitzke, K.; McCormick, M.P. Stratospheric temperature increases due to Pinatubo aerosols. Geophys. Res. Lett. 1992, 19, 207–210. [Google Scholar] [CrossRef]
  9. Ohneiser, K.; Ansmann, A.; Baars, H.; Seifert, P.; Barja, B.; Jimenez, C.; Radenz, M.; Teisseire, A.; Floutsi, A.; Haarig, M.; et al. Smoke of extreme Australian bushfires observed in the stratosphere over Punta Arenas, Chile, in January 2020: Optical thickness, lidar ratios, and depolarization ratios at 355 and 532 nm. Atmos. Chem. Phys. 2020, 20, 8003–8015. [Google Scholar] [CrossRef]
  10. Kablick III, G.P.; Allen, D.R.; Fromm, M.D.; Nedoluha, G.E. Australian PyroCb Smoke Generates Synoptic-Scale Stratospheric Anticyclones. Geophys. Res. Lett. 2020, 47, e2020GL088101. [Google Scholar] [CrossRef]
  11. Prata, A.T.; Young, S.A.; Siems, S.T.; Manton, M.J. Lidar ratios of stratospheric volcanic ash and sulfate aerosols retrieved from CALIOP measurements. Atmos. Chem. Phys. 2017, 17, 8599–8618. [Google Scholar] [CrossRef] [Green Version]
  12. Pumphrey, H.C.; Santee, M.L.; Livesey, N.J.; Schwartz, M.J.; Read, W.G. Microwave Limb Sounder observations of biomass-burning products from the Australian bush fires of February 2009. Atmos. Chem. Phys. 2011, 11, 6285–6296. [Google Scholar] [CrossRef] [Green Version]
  13. Flower, V.J.B.; Kahn, R.A. Assessing the altitude and dispersion of volcanic plumes using MISR multi-angle imaging from space: Sixteen years of volcanic activity in the Kamchatka Peninsula, Russia. J. Volcanol. Geotherm. Res. 2017, 337, 1–15. [Google Scholar] [CrossRef]
  14. Flower, V.J.B.; Kahn, R.A. Karymsky volcano eruptive plume properties based on MISR multi-angle imagery and the volcanological implications. Atmos. Chem. Phys. 2018, 18, 3903–3918. [Google Scholar] [CrossRef] [PubMed] [Green Version]
  15. Winker, D.M.; Vaughan, M.A.; Omar, A.; Hu, Y.; Powell, K.A.; Liu, Z.; Hunt, W.H.; Young, S.A. Overview of the CALIPSO Mission and CALIOP Data Processing Algorithms. J. Atmos. Ocean. Technol. 2009, 26, 2310–2323. [Google Scholar] [CrossRef]
  16. McGill, M.J.; Yorks, J.E.; Scott, V.S.; Kupchock, A.W.; Selmer, P.A. The Cloud-Aerosol Transport System (CATS): A technology demonstration on the International Space Station. In Proceedings of the Lidar Remote Sensing for Environmental Monitoring XV International Society for Optics and Photonics, San Diego, CA, USA, 12–13 August 2015; p. 96120A. [Google Scholar]
  17. Yorks, J.E.; McGill, M.J.; Palm, S.P.; Hlavka, D.L.; Selmer, P.A.; Nowottnick, E.P.; Vaughan, M.A.; Rodier, S.D.; Hart, W.D. An overview of the CATS level 1 processing algorithms and data products. Geophys. Res. Lett. 2016, 43, 4632–4639. [Google Scholar] [CrossRef] [Green Version]
  18. Kim, M.H.; Omar, A.H.; Tackett, J.L.; Vaughan, M.A.; Winker, D.M.; Trepte, C.R.; Hu, Y.; Liu, Z.; Poole, L.R.; Pitts, M.C.; et al. The CALIPSO version 4 automated aerosol classification and lidar ratio selection algorithm. Atmos. Meas. Tech. 2018, 11, 6107–6135. [Google Scholar] [CrossRef] [Green Version]
  19. Yorks, J.E.; Palm, S.P.; McGill, M.J.; Hlavka, D.L.; Hart, W.D.; Selmer, P.A.; Nowottnick, E.P. CATS Algorithm Theoretical Basis Document: Level 1 and Level 2 Data Products; Technical Report; NASA Goddard Space Flight Center: Greenbelt, MD, USA, 2016. [Google Scholar]
  20. Ginoux, P. Effects of nonsphericity on mineral dust modeling. J. Geophys. Res. Atmos. 2003, 108. [Google Scholar] [CrossRef] [Green Version]
  21. Laat, A.T.J.d.; Zweers, D.C.S.; Boers, R.; Tuinder, O.N.E. A solar escalator: Observational evidence of the self-lifting of smoke and aerosols by absorption of solar radiation in the February 2009 Australian Black Saturday plume. J. Geophys. Res. Atmos. 2012, 117. [Google Scholar] [CrossRef] [Green Version]
  22. Bègue, N.; Vignelles, D.; Berthet, G.; Portafaix, T.; Payen, G.; Jégou, F.; Benchérif, H.; Jumelet, J.; Vernier, J.P.; Lurton, T.; et al. Long-range transport of stratospheric aerosols in the Southern Hemisphere following the 2015 Calbuco eruption. Atmos. Chem. Phys. 2017, 17, 15019–15036. [Google Scholar] [CrossRef] [Green Version]
  23. Burton, S.P.; Hair, J.W.; Kahnert, M.; Ferrare, R.A.; Hostetler, C.A.; Cook, A.L.; Harper, D.B.; Berkoff, T.A.; Seaman, S.T.; Collins, J.E.; et al. Observations of the spectral dependence of linear particle depolarization ratio of aerosols using NASA Langley airborne High Spectral Resolution Lidar. Atmos. Chem. Phys. 2015, 15, 13453–13473. [Google Scholar] [CrossRef] [Green Version]
  24. Haarig, M.; Ansmann, A.; Baars, H.; Jimenez, C.; Veselovskii, I.; Engelmann, R.; Althausen, D. Depolarization and lidar ratios at 355, 532, and 1064&thinsp;nm and microphysical properties of aged tropospheric and stratospheric Canadian wildfire smoke. Atmos. Chem. Phys. 2018, 18, 11847–11861. [Google Scholar] [CrossRef] [Green Version]
  25. Khaykin, S.M.; Godin-Beekmann, S.; Hauchecorne, A.; Pelon, J.; Ravetta, F.; Keckhut, P. Stratospheric Smoke With Unprecedentedly High Backscatter Observed by Lidars Above Southern France. Geophys. Res. Lett. 2018, 45, 1639–1646. [Google Scholar] [CrossRef]
  26. Mishchenko, M.I.; Dlugach, J.M.; Liu, L. Linear depolarization of lidar returns by aged smoke particles. Appl. Opt. 2016, 55, 9968–9973. [Google Scholar] [CrossRef] [PubMed] [Green Version]
  27. Reid, J.S.; Hobbs, P.V. Physical and optical properties of young smoke from individual biomass fires in Brazil. J. Geophys. Res. Atmos. 1998, 103, 32013–32030. [Google Scholar] [CrossRef]
  28. Kablick, G.; Fromm, M.; Miller, S.; Partain, P.; Peterson, D.; Lee, S.; Zhang, Y.; Lambert, A.; Li, Z. The Great Slave Lake PyroCb of 5 August 2014: Observations, Simulations, Comparisons With Regular Convection, and Impact on UTLS Water Vapor. J. Geophys. Res. Atmos. 2018, 123, 12332–12352. [Google Scholar] [CrossRef]
  29. Martins, J.V.; Hobbs, P.V.; Weiss, R.E.; Artaxo, P. Sphericity and morphology of smoke particles from biomass burning in Brazil. J. Geophys. Res. Atmos. 1998, 103, 32051–32057. [Google Scholar] [CrossRef]
  30. Molod, A.; Takacs, L.; Suarez, M.; Bacmeister, J. Development of the GEOS-5 atmospheric general circulation model: Evolution from MERRA to MERRA2. Geosci. Model Dev. 2015, 8, 1339–1356. [Google Scholar] [CrossRef] [Green Version]
  31. Rienecker, M.M.; Suarez, M.J.; Todling, J.; Bacmeister, J.; Takacs, L.; Liu, H.C.; Gu, W.; Sienkiewicz, M.; Koster, R.D.; Gelaro, R.; et al. The GEOS-5 Data Assimilation System—Documentation of Versions 5.0.1, 5.1.0, and 5.2.0; Goddard Space Flight Center: Greenbelt, MD, USA, 2008. [Google Scholar]
  32. Chin, M.; Ginoux, P.; Kinne, S.; Torres, O.; Holben, B.N.; Duncan, B.N.; Martin, R.V.; Logan, J.A.; Higurashi, A.; Nakajima, T. Tropospheric Aerosol Optical Thickness from the GOCART Model and Comparisons with Satellite and Sun Photometer Measurements. J. Atmos. Sci. 2002, 59, 461–483. [Google Scholar] [CrossRef]
  33. Chin, M.; Diehl, T.; Dubovik, O.; Eck, T.F.; Holben, B.N.; Sinyuk, A.; Streets, D.G. Light absorption by pollution, dust, and biomass burning aerosols: A global model study and evaluation with AERONET measurements. Ann. Geophys. 2009, 27, 3439–3464. [Google Scholar] [CrossRef] [Green Version]
  34. Colarco, P.; Silva, A.D.; Chin, M.; Diehl, T. Online simulations of global aerosol distributions in the NASA GEOS-4 model and comparisons to satellite and ground-based aerosol optical depth. J. Geophys. Res. Atmos. 2010, 115. [Google Scholar] [CrossRef] [Green Version]
  35. Colarco, P.R.; Gassó, S.; Ahn, C.; Buchard, V.; Silva, A.M.d.; Torres, O. Simulation of the Ozone Monitoring Instrument aerosol index using the NASA Goddard Earth Observing System aerosol reanalysis products. Atmos. Meas. Tech. 2017, 10, 4121–4134. [Google Scholar] [CrossRef] [Green Version]
  36. Hess, M.; Koepke, P.; Schult, I. Optical Properties of Aerosols and Clouds: The Software Package OPAC. Bull. Am. Meteorol. Soc. 1998, 79, 831–844. [Google Scholar] [CrossRef]
  37. Colarco, P.R.; Nowottnick, E.P.; Randles, C.A.; Yi, B.; Yang, P.; Kim, K.M.; Smith, J.A.; Bardeen, C.G. Impact of radiatively interactive dust aerosols in the NASA GEOS-5 climate model: Sensitivity to dust particle shape and refractive index. J. Geophys. Res. Atmos. 2014, 119, 753–786. [Google Scholar] [CrossRef]
  38. Nowottnick, E.P.; Colarco, P.R.; Welton, E.J.; da Silva, A. Use of the CALIOP vertical feature mask for evaluating global aerosol models. Atmos. Meas. Tech. 2015, 8, 3647–3669. [Google Scholar] [CrossRef] [Green Version]
  39. Das, S.; Colarco, P.R.; Oman, L.; Taha, G.; Torres, O. Pyrocumulonimbus Events over British Columbia, 2017: The Long-term Transport and Radiative Impacts of Smoke Aerosols in the Stratosphere. In Proceedings of the EGU General Assembly Conference Abstracts, 4–8 May 2020. (online). [Google Scholar]
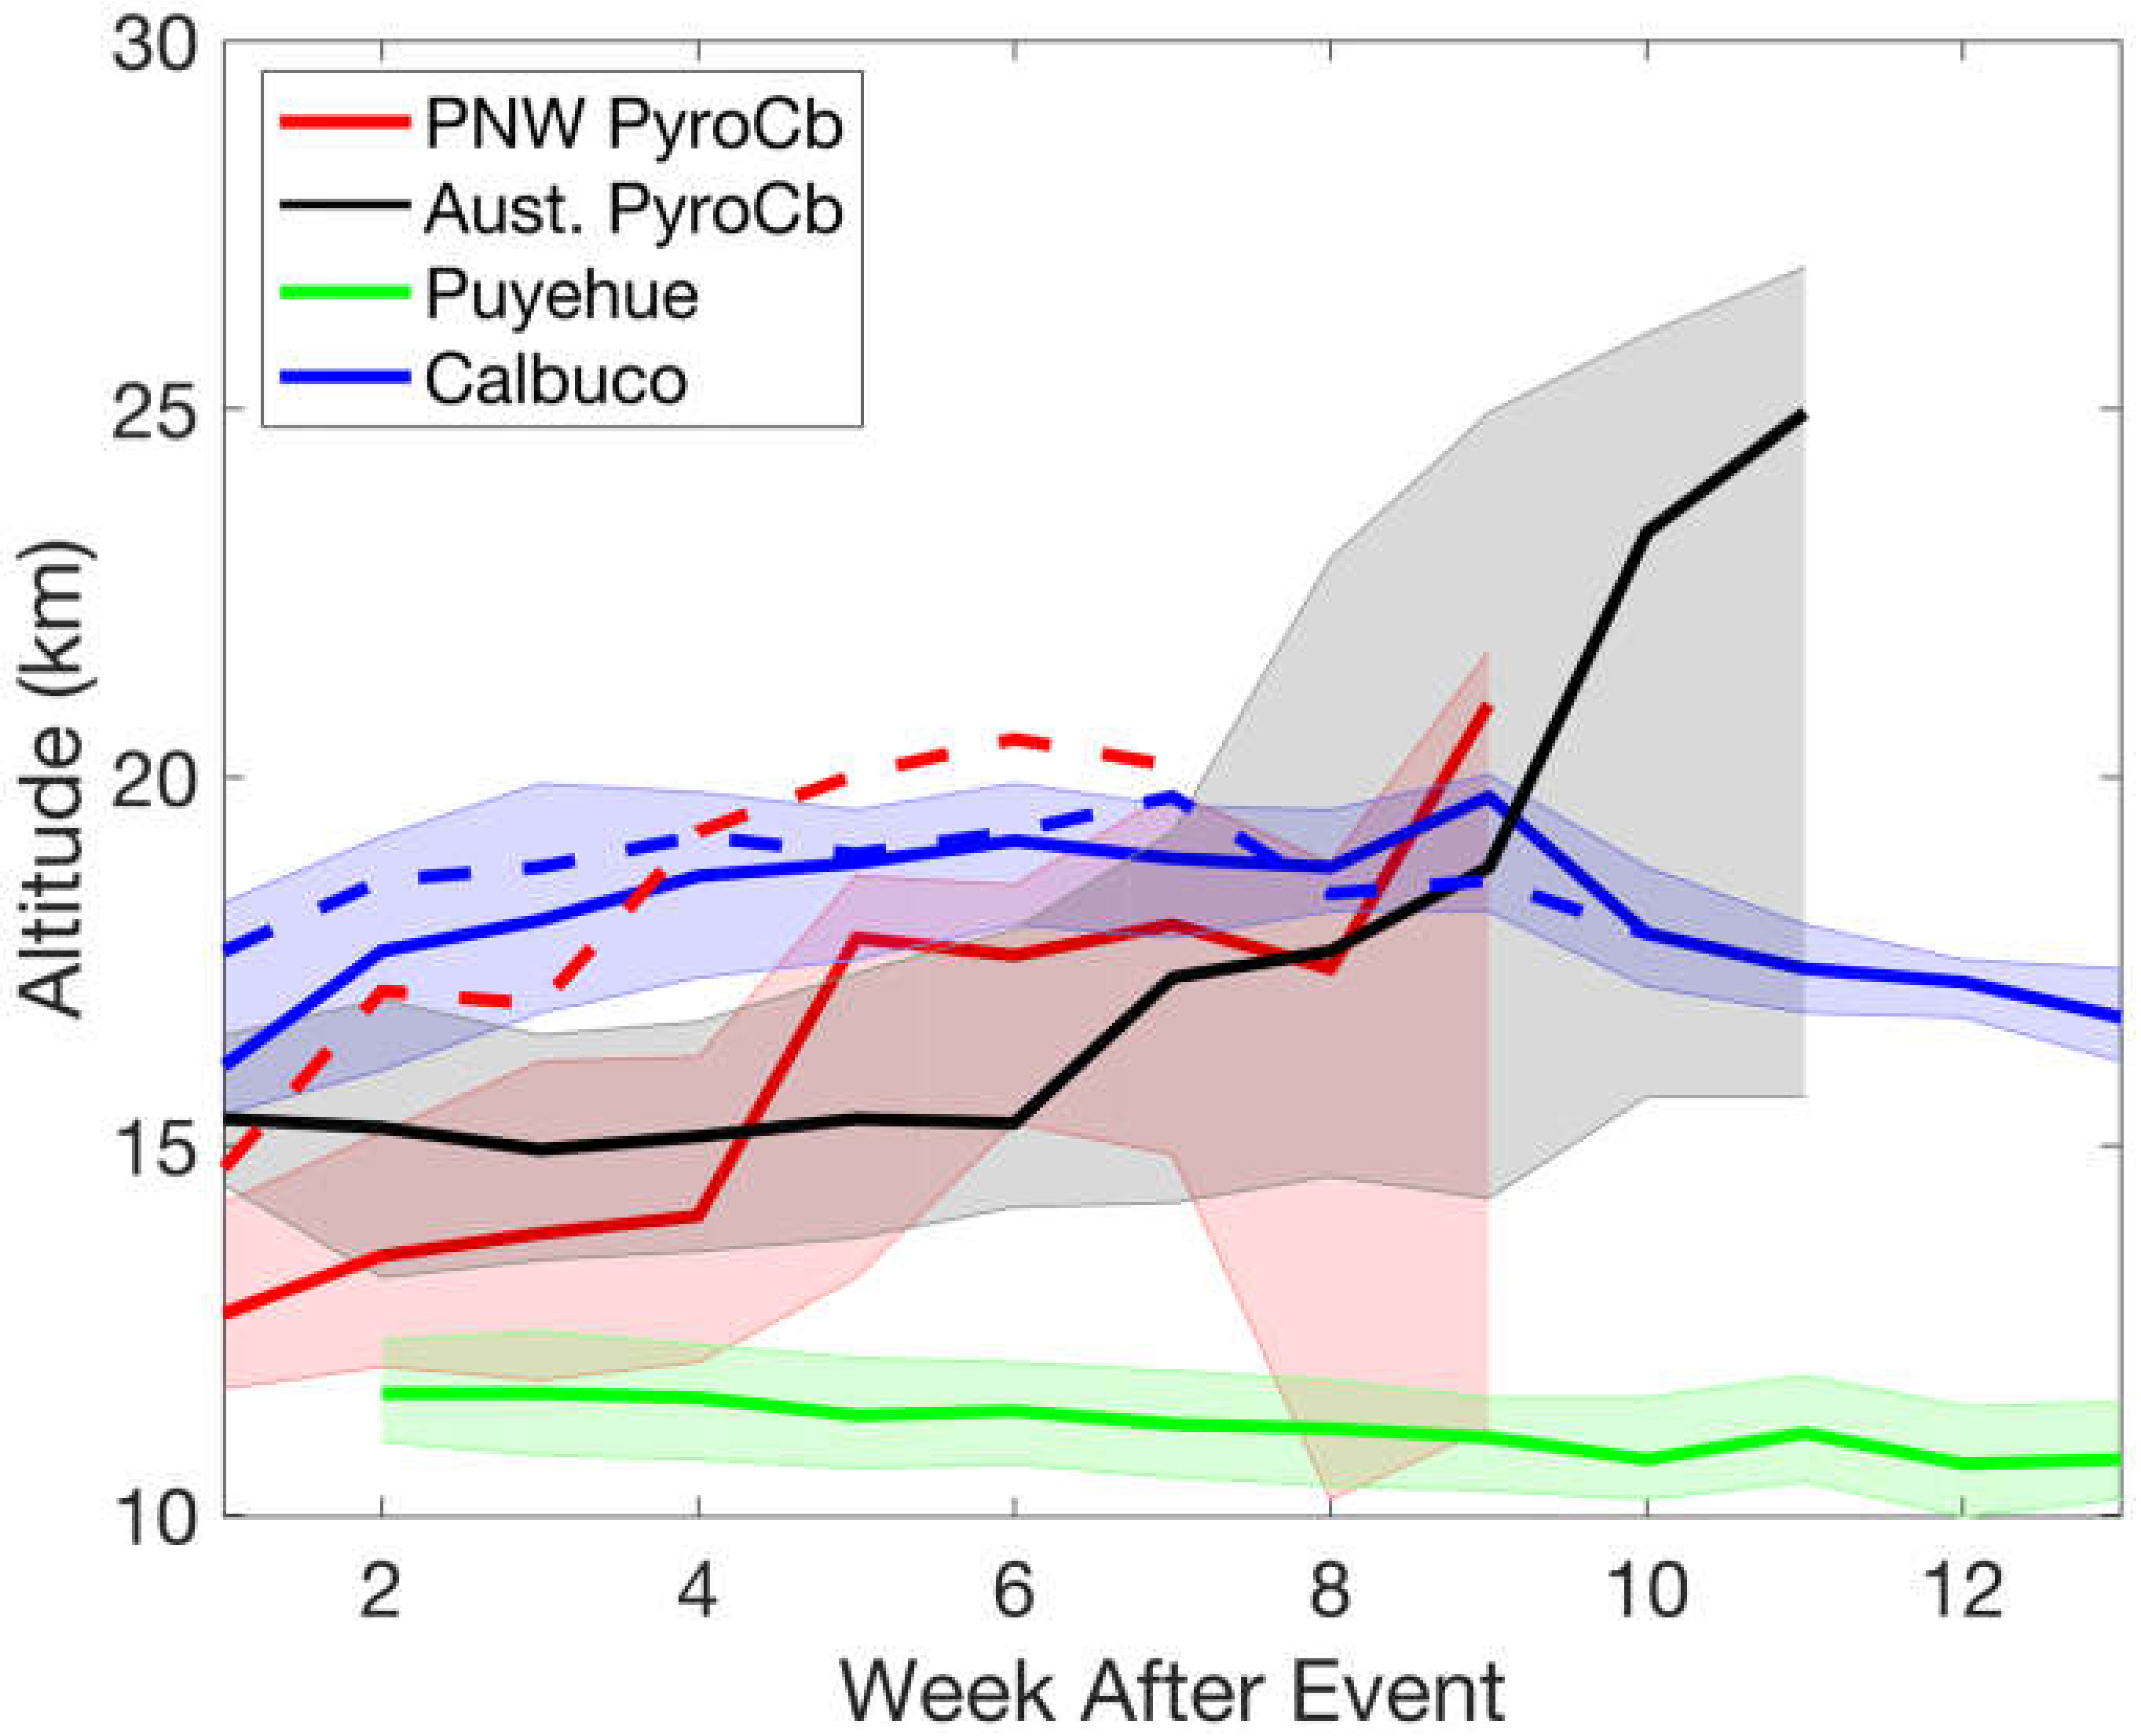
Figure 1. Median CALIOP (solid) and CATS (dashed) layer top altitude evolution for the stratospheric plumes from the PNW PyroCb (red), Australian Bushfire PyroCb (black), Puyehue Volcano (green), and the Calbuco Volcano (blue), binned by week after the respective injections. Shaded region represents data within the 25–75 percentile range of CALIOP data.
Atmosphere 11 01035 g001
Figure 2. Scatterplots showing the relation between aerosol layer top altitude and layer-integrated depolarization ratios for CALIOP identified stratospheric aerosol layers after the 2019–2020 Australian bushfire events (left) and the 2017 PNW event (right).
Atmosphere 11 01035 g002
Figure 3. Median CALIOP depolarization ratio evolution for the stratospheric plumes from the PNW PyroCb (red), Australian bushfire PyroCb (black), Puyehue Volcano (green), and the Calbuco Volcano (blue), binned by week after the respective injections. Shaded region represents data within the 25–75 percentile range.
Atmosphere 11 01035 g003
Figure 4. Scatterplots showing the relation between layer-integrated color ratios and layer-integrated depolarization ratios for CALIOP identified stratospheric aerosol layers after the 2019–2020 Australian bushfire events (left) and the 2017 PNW event (right).
Atmosphere 11 01035 g004
Figure 5. Median pyroCb aerosol layer altitude for all layers with layer-integrated depolarization ratios greater than 0.15. PNW pyroCb plume is in red, Australian bushfire is in black and the shaded region represents data between the 25th and 75th percentiles.
Atmosphere 11 01035 g005