Article

A Closer Look at the Role of the Cyprus Low on Dust Events in the Negev Desert

1
Department of Earth and Planetary Sciences, Weizmann Institute of Science, Rehovot 76100, Israel
2
Department of Geography and Environmental Development, Ben-Gurion University of the Negev, Be’er Sheva 84105, Israel
3
Soroka Clinical Research Center, Soroka University Medical Center, Be’er Sheva 84105, Israel
*
Author to whom correspondence should be addressed.
Atmosphere 2020, 11(10), 1020; https://doi.org/10.3390/atmos11101020
Submission received: 1 September 2020 / Revised: 18 September 2020 / Accepted: 21 September 2020 / Published: 23 September 2020
(This article belongs to the Special Issue Desert-Dust Aerosols in the Earth System)

Abstract

:
The Negev Desert in Israel is susceptible to frequent atmospheric events of high dust loading which have been linked with negative human health outcomes, including cardiovascular and respiratory distress. Previous research suggests that the highest levels of dust over the region occur during an atmospheric pattern with a cyclone situated over the eastern Mediterranean. This Cyprus Low can bring unsettled weather and strong westerly winds over the Negev. However, while the overall pattern associated with dust events in the Negev Desert is generally well-understood, it remains unclear why days with seemingly similar weather patterns result in different levels of atmospheric dust. Thus, the goal of this study is to better differentiate the atmospheric patterns during dust events over the Negev. Using PM10 data collected in Be’er Sheva, Israel, from 2000 to 2015 in concert with 72-h HYSPLIT back trajectories at three different height levels (surface, 200 m, 500 m), we examine the source region, trajectory groups using a K-Means clustering procedure, and overall synoptic pattern during dust events. Further, we use sea-level pressure data across the region to determine how cyclone strength and location impact dust events in Be’er Sheva. We find that the highest levels of atmospheric dust in the Negev are associated with the Cyprus Low pattern, and air traversing Libya seems to play an especially important role, likely due to the country’s arid surface cover. Cyclone strength is also a critical factor, as lower sea-level pressure results in more severe dust events. A better understanding of the atmospheric features associated with dust events over the Negev Desert will hopefully aid in forecasting these occurrences across the region.

1. Introduction

High levels of atmospheric dust in Israel are associated with a variety of impacts on the environment, including decreased visibility [1,2], large radiative changes [3], and multiple negative human health outcomes. Dust and particulate matter in Israel have been linked with increases in cardiovascular-related hospital admissions [4], chronic obstructive pulmonary disease [5], pneumonia [6], and respiratory distress [7], along with possible increases in asthma [8] and more [9]. In addition, dust events are associated with decreases in indoor air quality [10], and dust storms in the region can also serve as an effective means to transport microorganisms, with specific microbes dependent on dust origin [11,12,13]. Further, there is some evidence that PM10 concentrations within dust storms in Israel have been increasing in recent years [14,15], although others have found no such trend [2].
Research examining the origins of specific dust storms over the Negev Desert in Israel has been conducted for many years, with previous work identifying the importance of “Cyprus and Sahara type depressions” over the region acting in tandem with the unique surface cover found over the northern Sahara Desert [16]. More recently, attempts to determine the specific synoptic patterns necessary to create major dust events over the Negev have focused on sea-level pressure across the region [2]. This research suggests that the Cyprus Low is closely associated with dust events across the region, and in fact, the overall impact of this low-pressure system on dust events in the Negev dwarfs that of any other pattern [2]. The Cyprus Low consists of a cyclone loosely centered over the eastern Mediterranean or Turkey, often bringing unsettled conditions across the Negev, including dust, occasional precipitation, and strong westerly winds [2,17,18,19].
Previous research has also highlighted a variety of other factors that contribute to dust events over the Negev Desert, including prior rainfall [20], vertical motion [21], and even local sea breezes [22], but it is clear that the availability of African dust is especially important. Without this unique surface cover to the west of the Negev, a cyclonic flow over the region would have only a limited impact on PM10 across the eastern Mediterranean [23,24]. However, it is important to highlight that more localized sources of dust from within the Negev itself can also act as major contributors to atmospheric dust over the region [22,25].
Historically, many studies examining atmospheric conditions conducive for dust outbreaks have focused on individual meteorological and/or climatological variables [20,21,26], while some have used back trajectories to trace the path of dust [27,28]. As early as 1961, back trajectories were identified as an effective means to determine the origin and movement of dust events [29], with Yaalon and Ganor [16] first using this tool to identify source regions for dust storms across Israel. Back trajectories have the unique ability to both visualize the overall atmospheric pattern and to trace the movement of air to see what area it has traversed, making them an ideal tool to examine dust storms across the Negev Desert.
Although the overall mechanisms responsible for high levels of suspended dust over the Negev Desert are generally well-understood, it remains unclear why some days result in severe dust events while other days with similar atmospheric patterns have only modest impacts. Thus, the goal of this study is to use long-term dust measurements to effectively differentiate dust events over the Negev through an examination of source region, trajectory, and location/strength of the Cyprus Low, three areas underemphasized in previous research. A closer look at these features can hopefully lead to more accurate forecasting and a more comprehensive understanding of dust events over the Negev Desert, especially since previous dust events in the region have sometimes been missed by forecast models [30]. We begin with an overview of data and methods followed by a description of our results, then a discussion section to highlight the relevance of this work, and finally a summary and conclusion.

2. Data and Methods

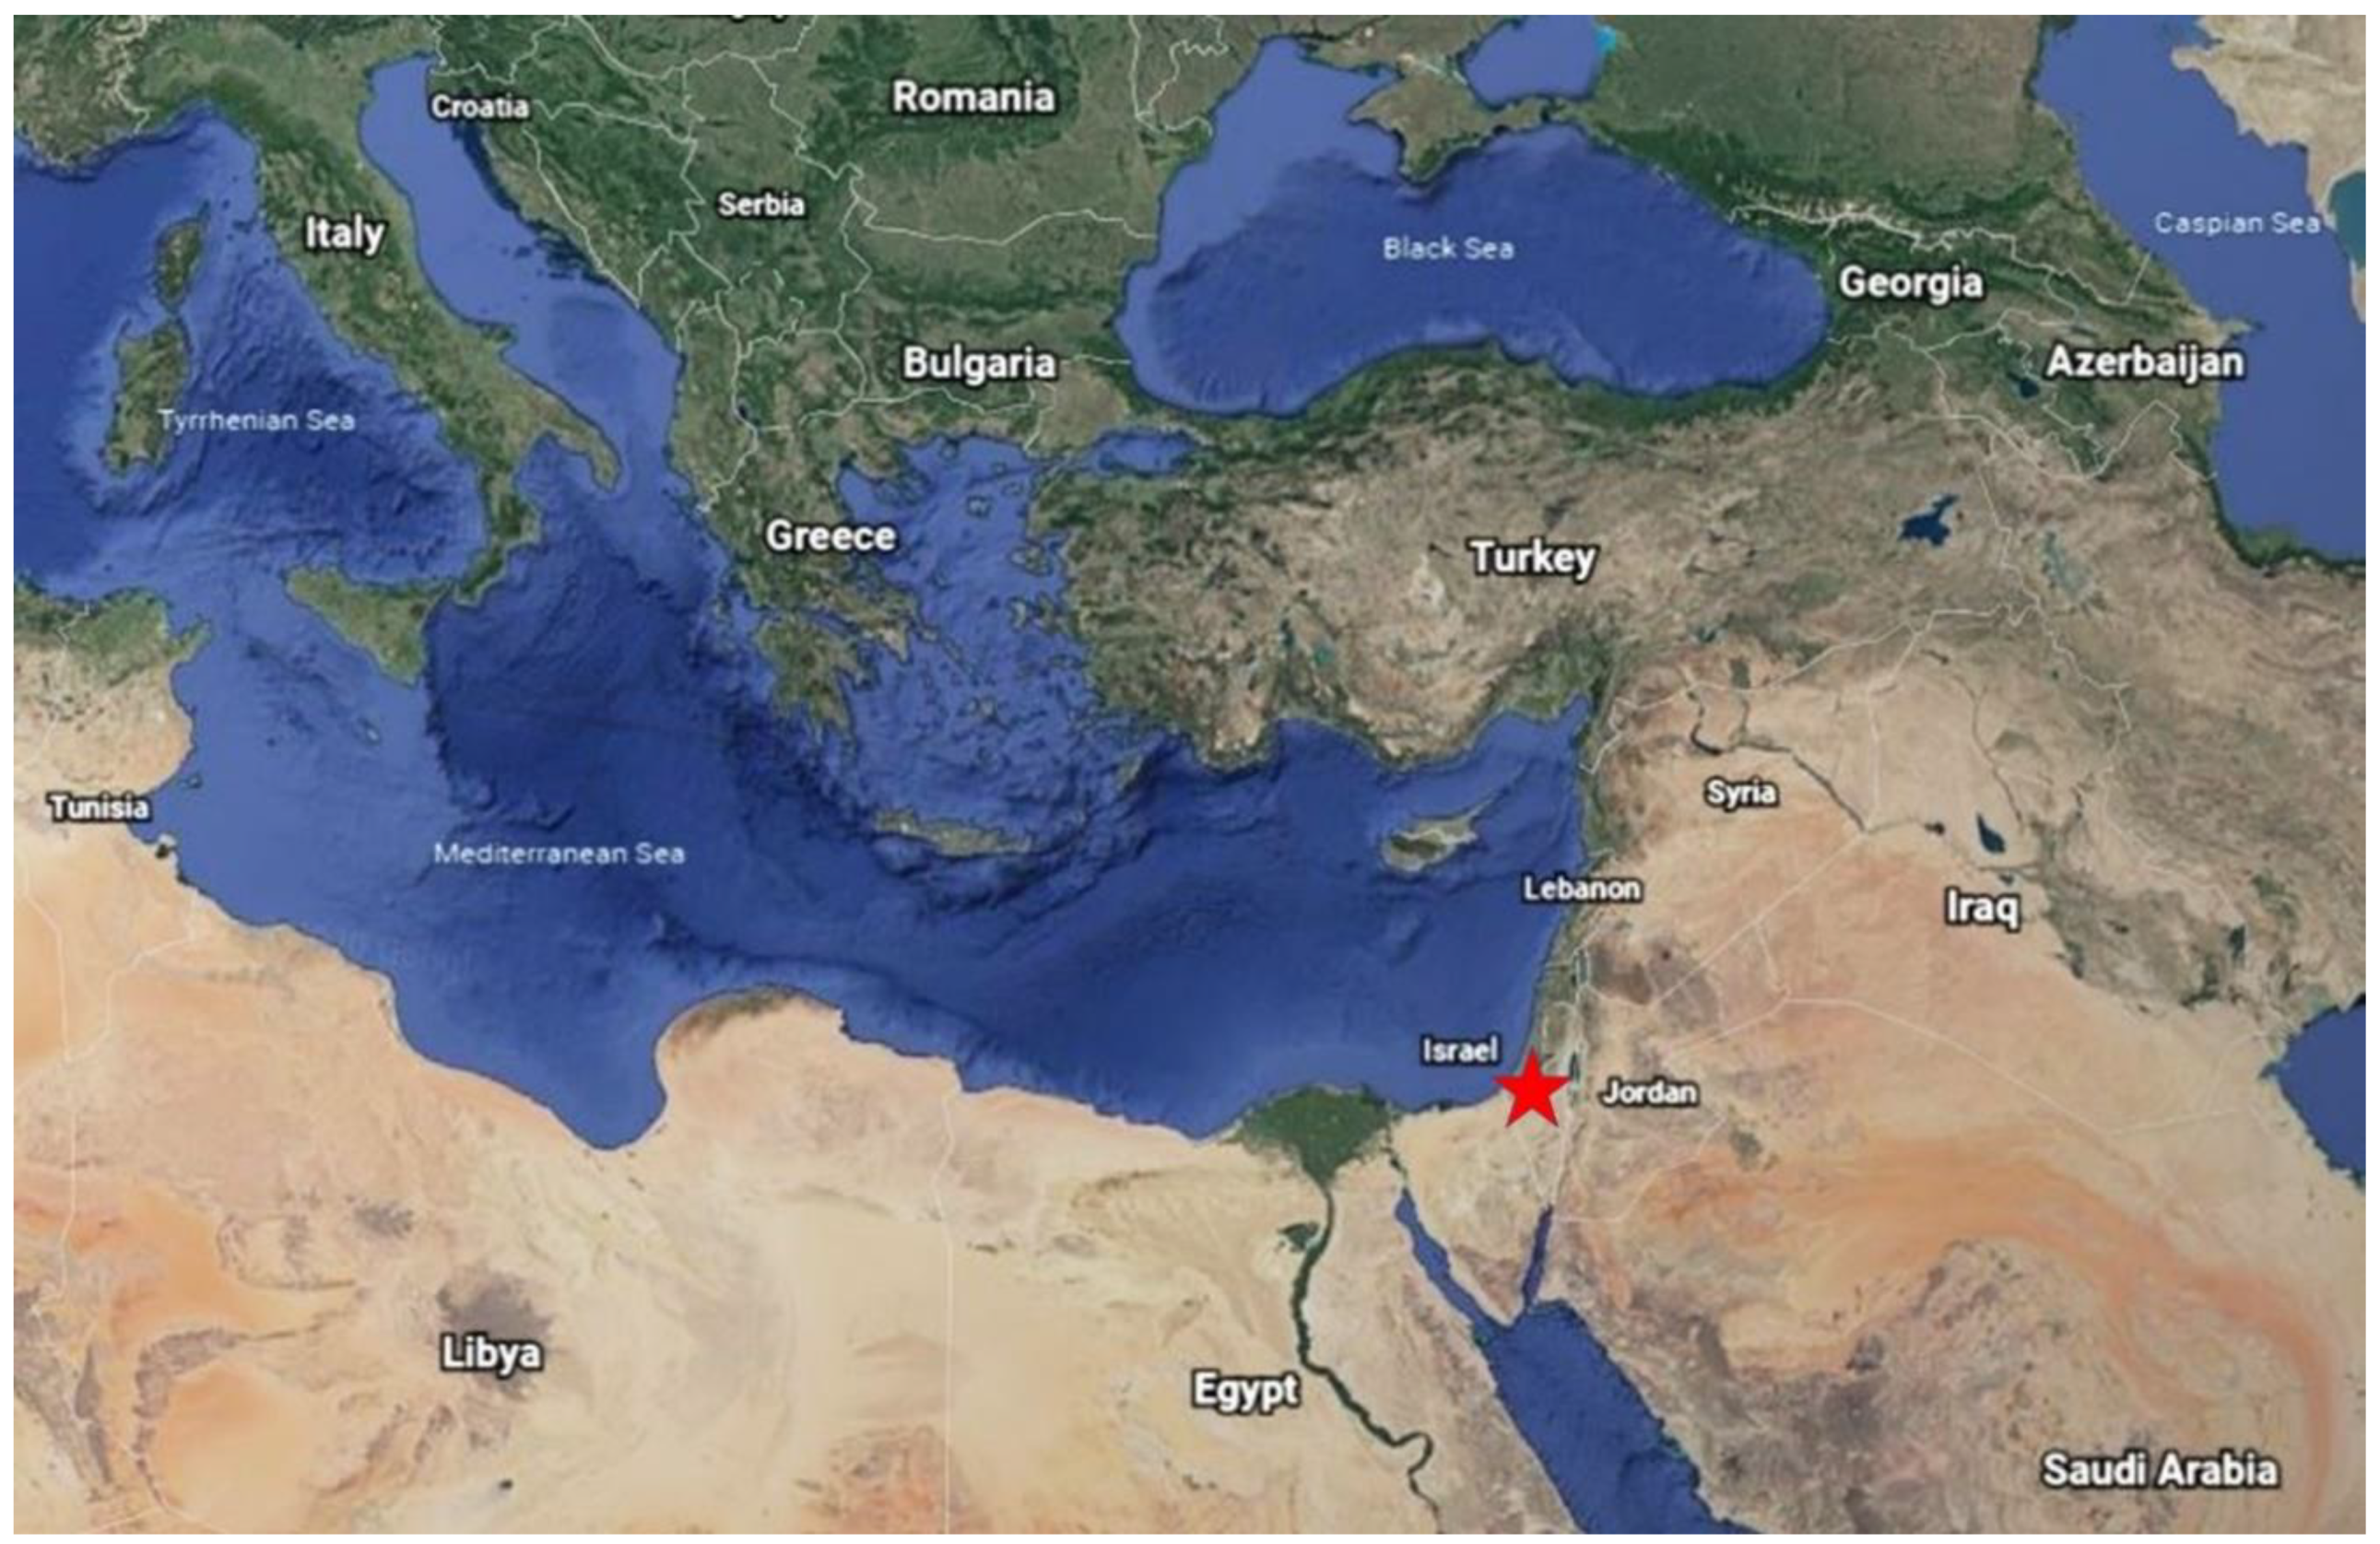
2.1. Study Area, Pollution Data, and Dust Event Definition

The Negev region, located in southern Israel, is frequently subjected to transcontinental dust storms, and the area is defined by abundant solar radiation and low relative humidity. Be’er Sheva, the urban center of the Negev, has over 250,000 residents and is home to a wide range of industrial activities (Figure 1). The area is characterized by impervious soil (loess), resulting in high salinity and minimum penetration of water with greater soil erosion and water runoff. This surface cover can also serve as an important source for airborne dust, given sufficient surface wind speeds [25].
Using half-hourly PM10 data collected in Be’er Sheva, Israel (31.263° N, 34.801° E), daily averages from 00:00 through 23:30 local time were calculated. The one site used for this work represents one of 64 PM10 monitors across Israel, with 14 situated in the Negev Desert. The data span from 15 June 2000 through 31 December 2015 and represent the most recent data available when the study commenced. Any day with fewer than 24 observations was removed from the analysis and marked as missing. Pollution monitoring in Israel is conducted by different local Municipalities Associations for the Environment (MAE) and is regulated by the Ministry of Environmental Protection (MoEP). The measurements are performed using tapered element oscillating microbalance (TEOMTM) continuous monitoring instruments that are operated and maintained according to the United States Environmental Protection Agency guidelines, with a typical accuracy of ±5% [31]. To ensure accuracy, the pollution data have been both validated and quality controlled by Ben Gurion University and the Technion Center of Excellence in Exposure Science and Environmental Health (TCEEH) for its air pollution monitoring database.
Remaining consistent with previous research, we define a dust event as a day with average daily PM10 values more than two standard deviations above the background PM10 concentration [5]. Background PM10 concentration (46.65 µg/m3) was calculated by averaging daytime (06:00–18:00) PM10 concentration throughout the summer (low dust) season [18], defined here as 31 May–22 September based on the seasonal definitions provided by Alpert et al. [32]. Only 06:00–18:00 PM10 data were used for the calculation of background concentration to remain consistent with previous work and “since the majority of natural dust storms take place mainly during the daytime” [18]. The standard deviation of background concentration (13.37 µg/m3) used in the dust event definition was calculated from annual averages of background PM10 across the period of record [5].

2.2. Trajectory Data and Clustering

2.2.1. HYSPLIT

The Hybrid Single-Particle Lagrangian Integrated Trajectory model (HYSPLIT) was developed by the National Ocean and Atmospheric Administration (NOAA), and is a commonly-used transport model capable of calculating back trajectories for atmospheric air parcels [33,34]. HYSPLIT has been used extensively to track both the origins and pathways of dust outbreaks across the Mediterranean region [13,23,35]. Here, we used the Air Resources Laboratory’s (ARL) Real-time Environmental Applications and Display System (READY) internet-based HYSPLIT interface with NCEP/NCAR global reanalysis data as the input. For each dust event as defined above, 72-h back trajectories were calculated, beginning at 12:00 local time the day of the dust event in Be’er Sheva, Israel. Although 72 h is a common timeframe based on pollutant longevity in the atmosphere [36,37], no clear scientific consensus exists regarding the initial starting atmospheric height when examining PM10. As a result, we commenced the back trajectories using three distinct heights (surface, 200 m, 500 m), which allowed for a more comprehensive examination of the overall pattern impacting near-surface conditions. To further gauge the approximate path and potential source region of dust events, specific coordinates at 24-h intervals along the back trajectories were grouped by country over which the air was located. One-way analysis of variance (ANOVA) was used to determine if air passing over specific countries 24 h, 48 h, or 72 h in advance was associated with elevated PM10 levels in Be’er Sheva.

2.2.2. K-Means

Similar to previous research utilizing HYSPLIT trajectories to examine the transport of aerosols [37], we employed a K-Means clustering procedure in the SPSS Statistics software package to group each dust event into a distinct cluster representing unique climatological patterns across the region. This procedure was conducted individually at each of the three height levels, and 6-hourly latitude and longitude values from the back trajectories serve as inputs, matching the temporal resolution of the reanalysis data used in HYSPLIT. Again, remaining consistent with previous research [38,39], cluster totals were determined through an examination of the percentage change in root mean square deviation (RMSD). Further, while some previous research has utilized a two-stage cluster analysis as a result of slow-moving air masses being clustered together regardless of their direction, we deemed this unnecessary, since the slowest moving trajectories were not among the clusters with the highest concentrations of PM10 [40,41]. A one-way ANOVA was used to determine whether specific clusters were associated with statistically significant differences in PM10 values.

2.3. Atmospheric Analysis

We identified the Cyprus Low associated with each event using reanalyzed sea-level pressure (SLP) from the ERA Interim reanalysis of the European Centre for Medium-range Weather Forecasts (ECMWF), interpolated into 1° by 1° horizontal resolution with a 6-h temporal resolution [42]. Considering that small differences in cyclonic atmospheric flow can have a large impact on PM10 concentration at the surface, we examined both the strength and position of the cyclone associated with heightened levels of PM10. More specifically, for all dust events that occur during the cluster (at either 0 m, 200 m, or 500 m) with the highest average PM10 concentration in Be’er Sheva, we considered the cyclone center position and intensity. To this end, we identified the location and value of the cyclone minimum central SLP within 20–40° N, 20–40° E during the 24-h interval from 00 UTC of the day of the measurement until 00 UTC the next day (note that PM10 data were averaged from 02 UTC to 02 UTC, but reanalysis data are available at 00, 06, 12, and 18 UTC). Next, we compared the minimum SLP within the cyclone center at each 24-h interval to PM10 concentrations to examine how cyclone strength impacts dust events. Finally, to more specifically differentiate the synoptic pattern for days within the highest PM10 cluster, we plotted the geographic location and strength of the cyclone center.
We further provided a brief case study of a dust event using satellite imagery and surface meteorological data to provide a more holistic view of both regional and local conditions associated with the Cyprus Low. Satellite imagery is provided by NASA’s Earth Observing System Data and Information System (EOSDIS) acquired from the Terra Moderate Resolution Imaging Spectroradiometer (MODIS). Six-hourly surface meteorological data for Be’er Sheva were obtained from the Israeli Ministry of Environmental Protection. Both satellite and surface data covered only the singular dust event of 12 December 2010.

3. Results

3.1. Climatology of Dust Events

The average surface PM10 levels across the period of record are 56.1 µg/m3, with a large standard deviation of 95.6 µg/m3, which is mostly the result of a handful of extreme dust events. A distinct seasonal trend is evident, and PM10 peaks in the winter and early spring in Be’er Sheva, while reaching a minimum during the summer months (Table 1). Although there are year-to-year fluctuations in average annual PM10 concentrations, no statistically significant trend (p = 0.42) is evident across the period of record.
Using summer daytime PM10 concentration as a baseline as discussed in Section 2.1, our methodology produced a dust event threshold of 73.4 µg/m3, which is similar to previous research [5,18]. Using this threshold, 12.9% of days across the period of record were classified as dust events (629 total days). The average ground level PM10 across the 629 dust events was 181.23 µg/m3 with a large standard deviation of 227.05 µg/m3, again attributable to a handful of exceptional dust events. For example, when only 11 dust events with average PM10 levels over three standard deviations above the mean were excluded, the overall standard deviation for the remaining 618 dust events dropped from 227.05 µg/m3 to 130.00 µg/m3. Mirroring average PM10 concentrations, dust event frequency varies across the year, with the highest frequency occurring in February (23.0% of days) and lowest occurring in July and August (2.5% of days) (Table 1). No statistically significant trend (p = 0.39) in dust event frequency exists across the period of record.

3.2. Source Region and Path

The systematic mapping of the back trajectory pathways by country during high PM10 days (Section 2.2) reveals particular hotspots. At all three height levels, air centered over Libya 24 h prior to arrival in Be’er Sheva was associated with higher levels of PM10 by a wide margin (Figure 2). At 48 h and 72 h prior to dust events, the spread in countries increased considerably, with locations well to the west and northwest of Be’er Sheva generally associated with the highest concentrations of PM10 (Figure S1). Again, results were mostly consistent across all three height levels and indicated that the highest PM10 concentrations resulted from a brisk flow from the west or northwest. One-way ANOVA results revealed that the differences in PM10 means in Be’er Sheva varied significantly based upon the country over which the air was present 24 h, 48 h, and 72 h in advance at all three height levels (p < 0.001 for all hours/heights, with the lone exception of p = 0.002 for 48 h at 200 m).

3.3. Clustering

The 72-h back trajectories during dust events were clustered at each of the three height levels to provide a more detailed analysis of the atmospheric patterns associated with dust events. An examination of the percentage change in RMSD was used to determine the number of clusters and results in 11 distinct clusters for 0 m and 200 m, and 12 clusters at 500 m (Figure S2). At all three heights, we found that several clusters were associated with markedly higher levels of PM10 (Table 2; Table S1), and the differences in PM10 levels between clusters were highly statistically significant (p < 0.001).
Clusters associated with elevated levels of PM10 were consistently linked with strong cyclonic flow from the west or northwest, passing over or very near the eastern North African coast (Figure 3; Figure S3). For example, at 200 m, Cluster 4 was associated with the highest levels of PM10 (582.7 µg/m3) and was situated in Eastern Europe at 72 h prior to the dust event and moved rapidly south. At 48 h, the Cluster 4 center was situated over Greece, moving to the Egypt/Libya border along the Mediterranean Sea at 24 h before moving rapidly east toward Be’er Sheva. Cluster 1 was reasonably similar to Cluster 4 but had more of a northerly component and was not associated with especially severe dust events. This is presumably because the air within Cluster 1 did not pass over the eastern North African coast, nor did it spend much time over land closer to Be’er Sheva, limiting its ability to acquire dust from either foreign or local sources. This highlights how relatively minor differences in overall airflow can have major impacts on surface dust in Be’er Sheva.
Among the remaining clusters at 200 m, Cluster 8, which was also associated with very high levels of PM10 (332.6 µg/m3), had a similar pattern to Cluster 4 but was situated further west. Here, the Cluster 8 center sat over the western Mediterranean at 72 h before heading southeast toward the Libyan coast at 48 h and nearly due east thereafter. The third-highest levels of PM10 were found in Cluster 3 (224.1 µg/m3), which is similar to Cluster 8, but slower, more zonal, and a little further south. Clusters 2, 5, 6, 7, 10, and 11 were all relatively slow-moving and were associated with PM10 concentrations below the dust event average across the period of record. Similar patterns and PM10 relationships were found at 0 m and 500 m as well (Figure S3, Table S1).

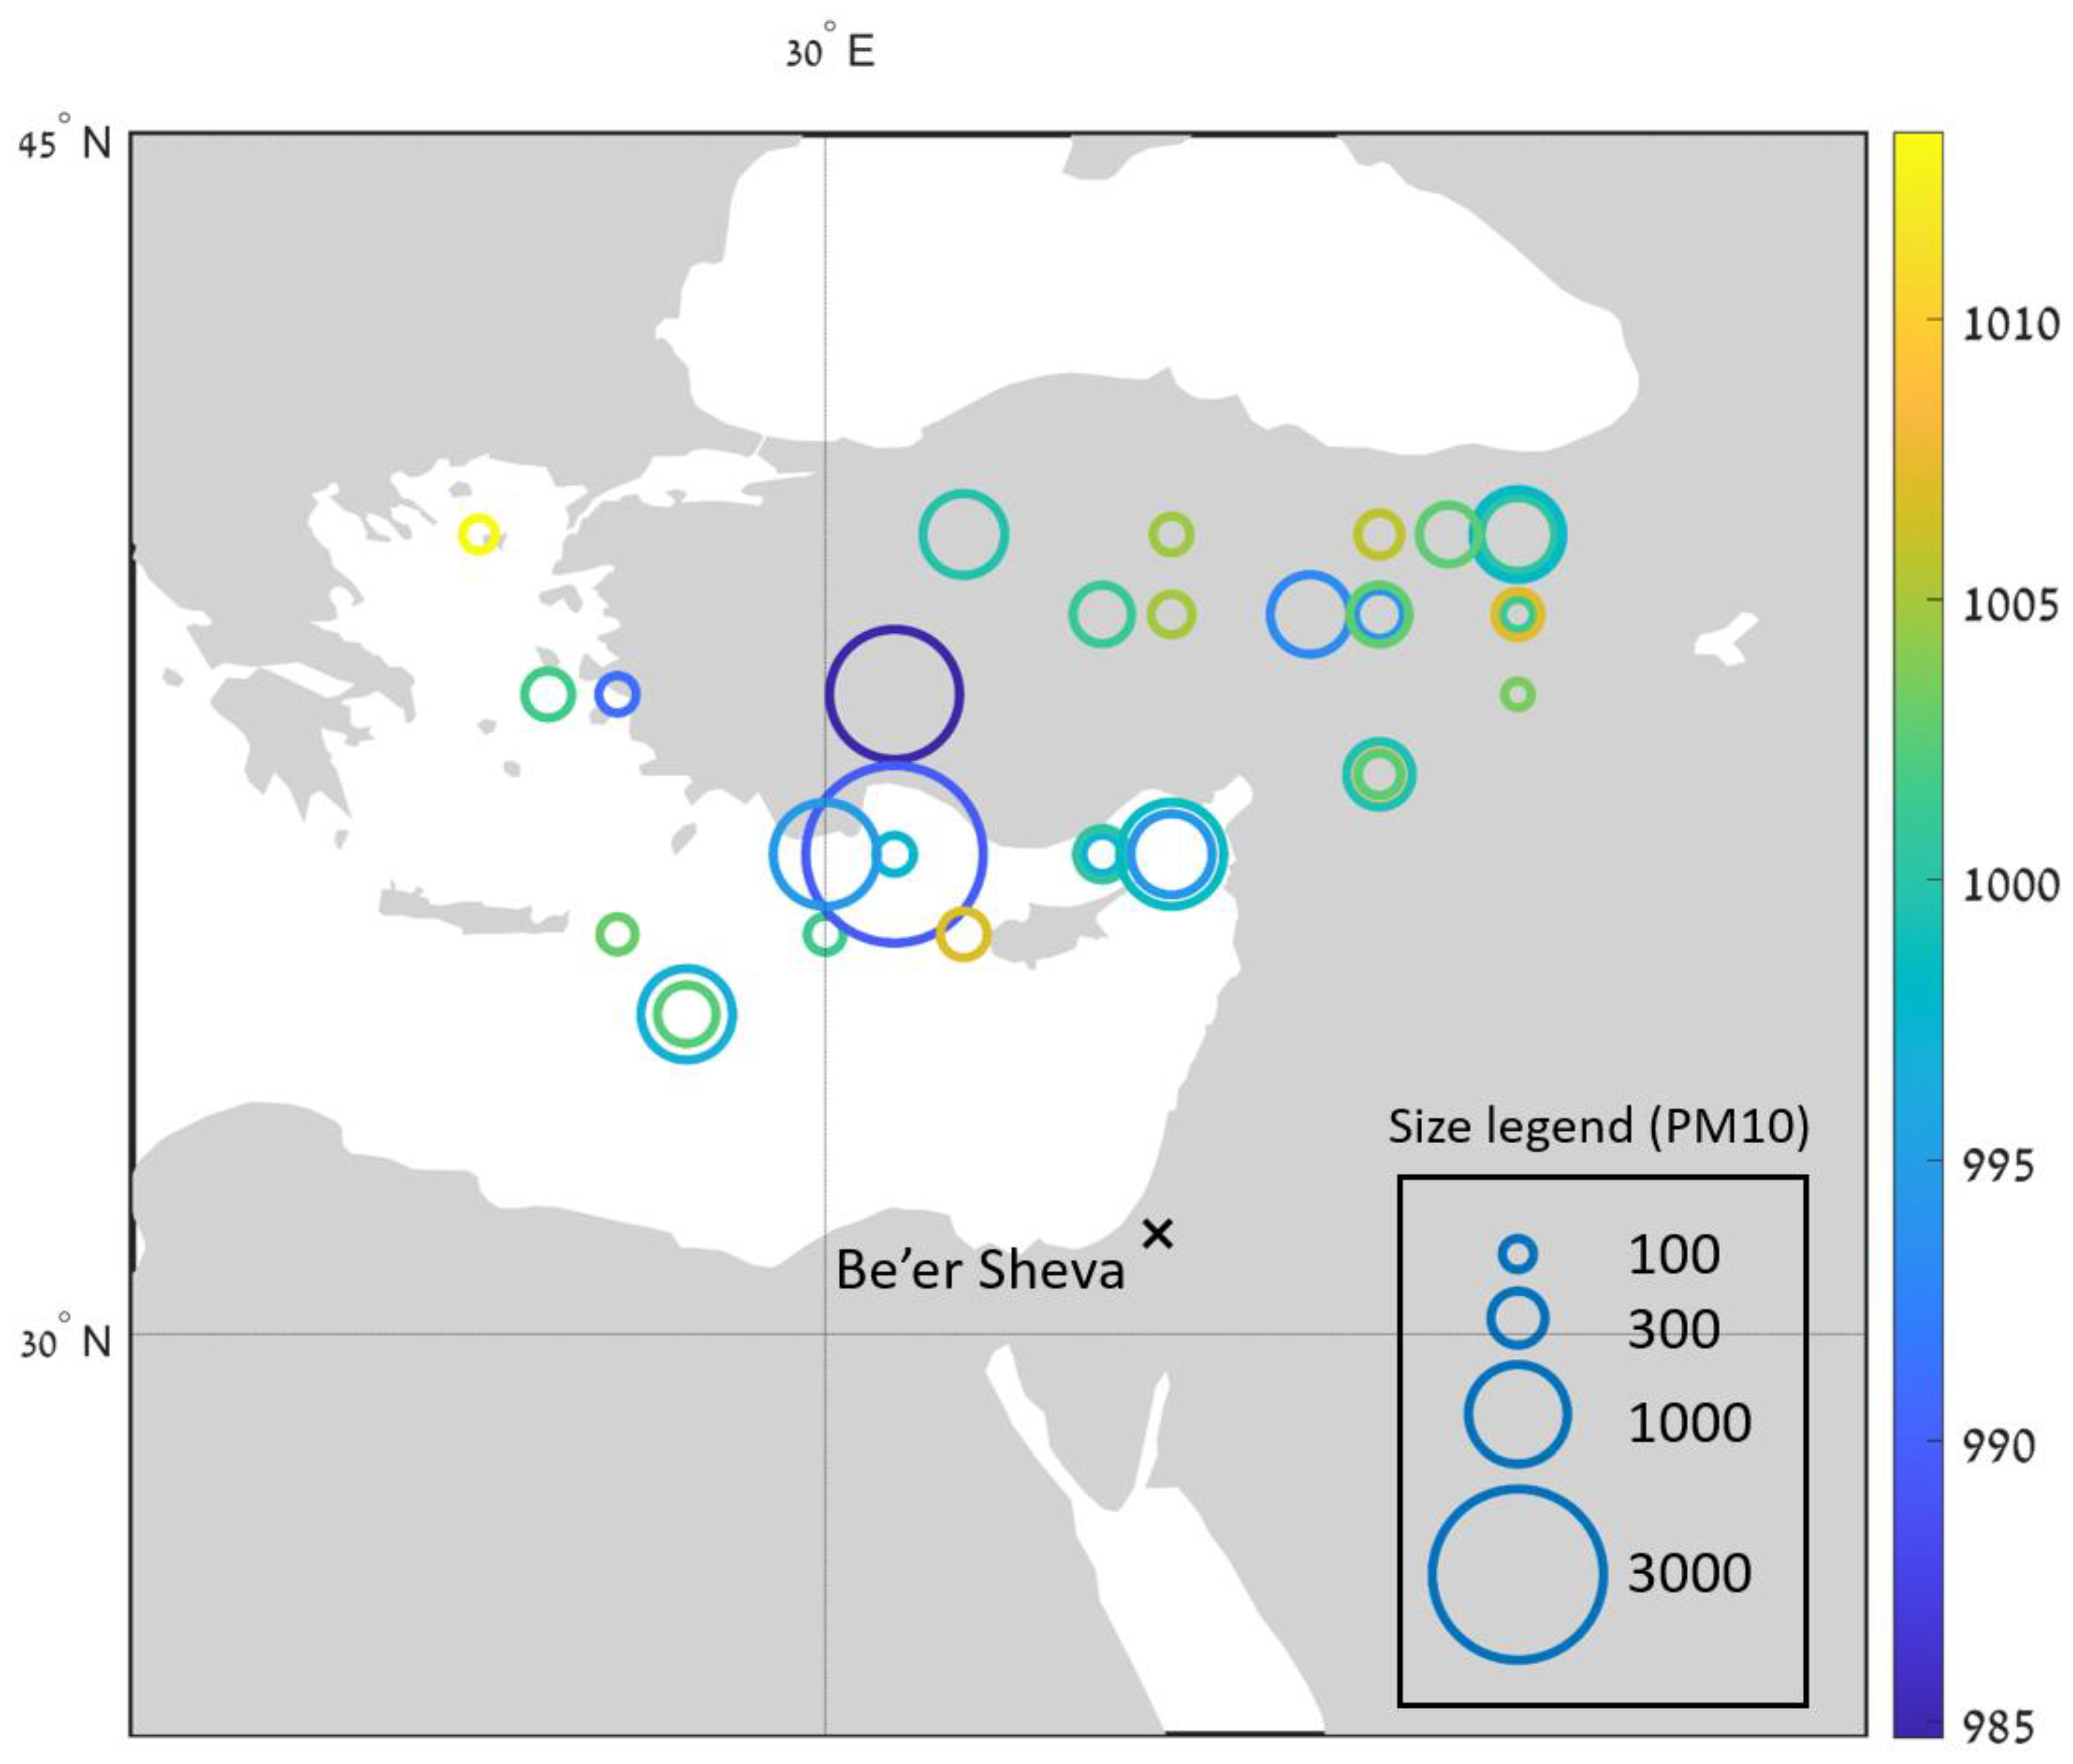
3.4. Cyclone Strength and Position

We next examined both the location and strength of cyclones in the region during days with the back trajectory cluster associated with the highest levels of PM10 in Be’er Sheva at any of the three height levels (all days within Cluster 7 at 0 m, Cluster 4 at 200 m, or Cluster 3 at 500 m; 36 total days). This allowed for a more detailed examination of the regional synoptic pattern to better differentiate why some days within the most severe clusters have higher levels of PM10 than others. Using minimum SLP of cyclones within 20–40° E, 20–40° N, a statistically significant negative correlation (p < 0.001) between cyclone strength (in terms of minimum SLP) and PM10 concentrations is clearly evident (Figure 4; note the semi-logarithmic scale). Figure 5 shows the locations of the cyclone centers at the timing of minimum central pressure (color), while the size of the marker corresponds to daily PM10. Although the highest PM10 in Be’er Sheva is generally associated with strong cyclones centered over southern Turkey or the northeast Mediterranean, there are a few days with very similar cyclone strength and location that are not associated with extreme levels of PM10.

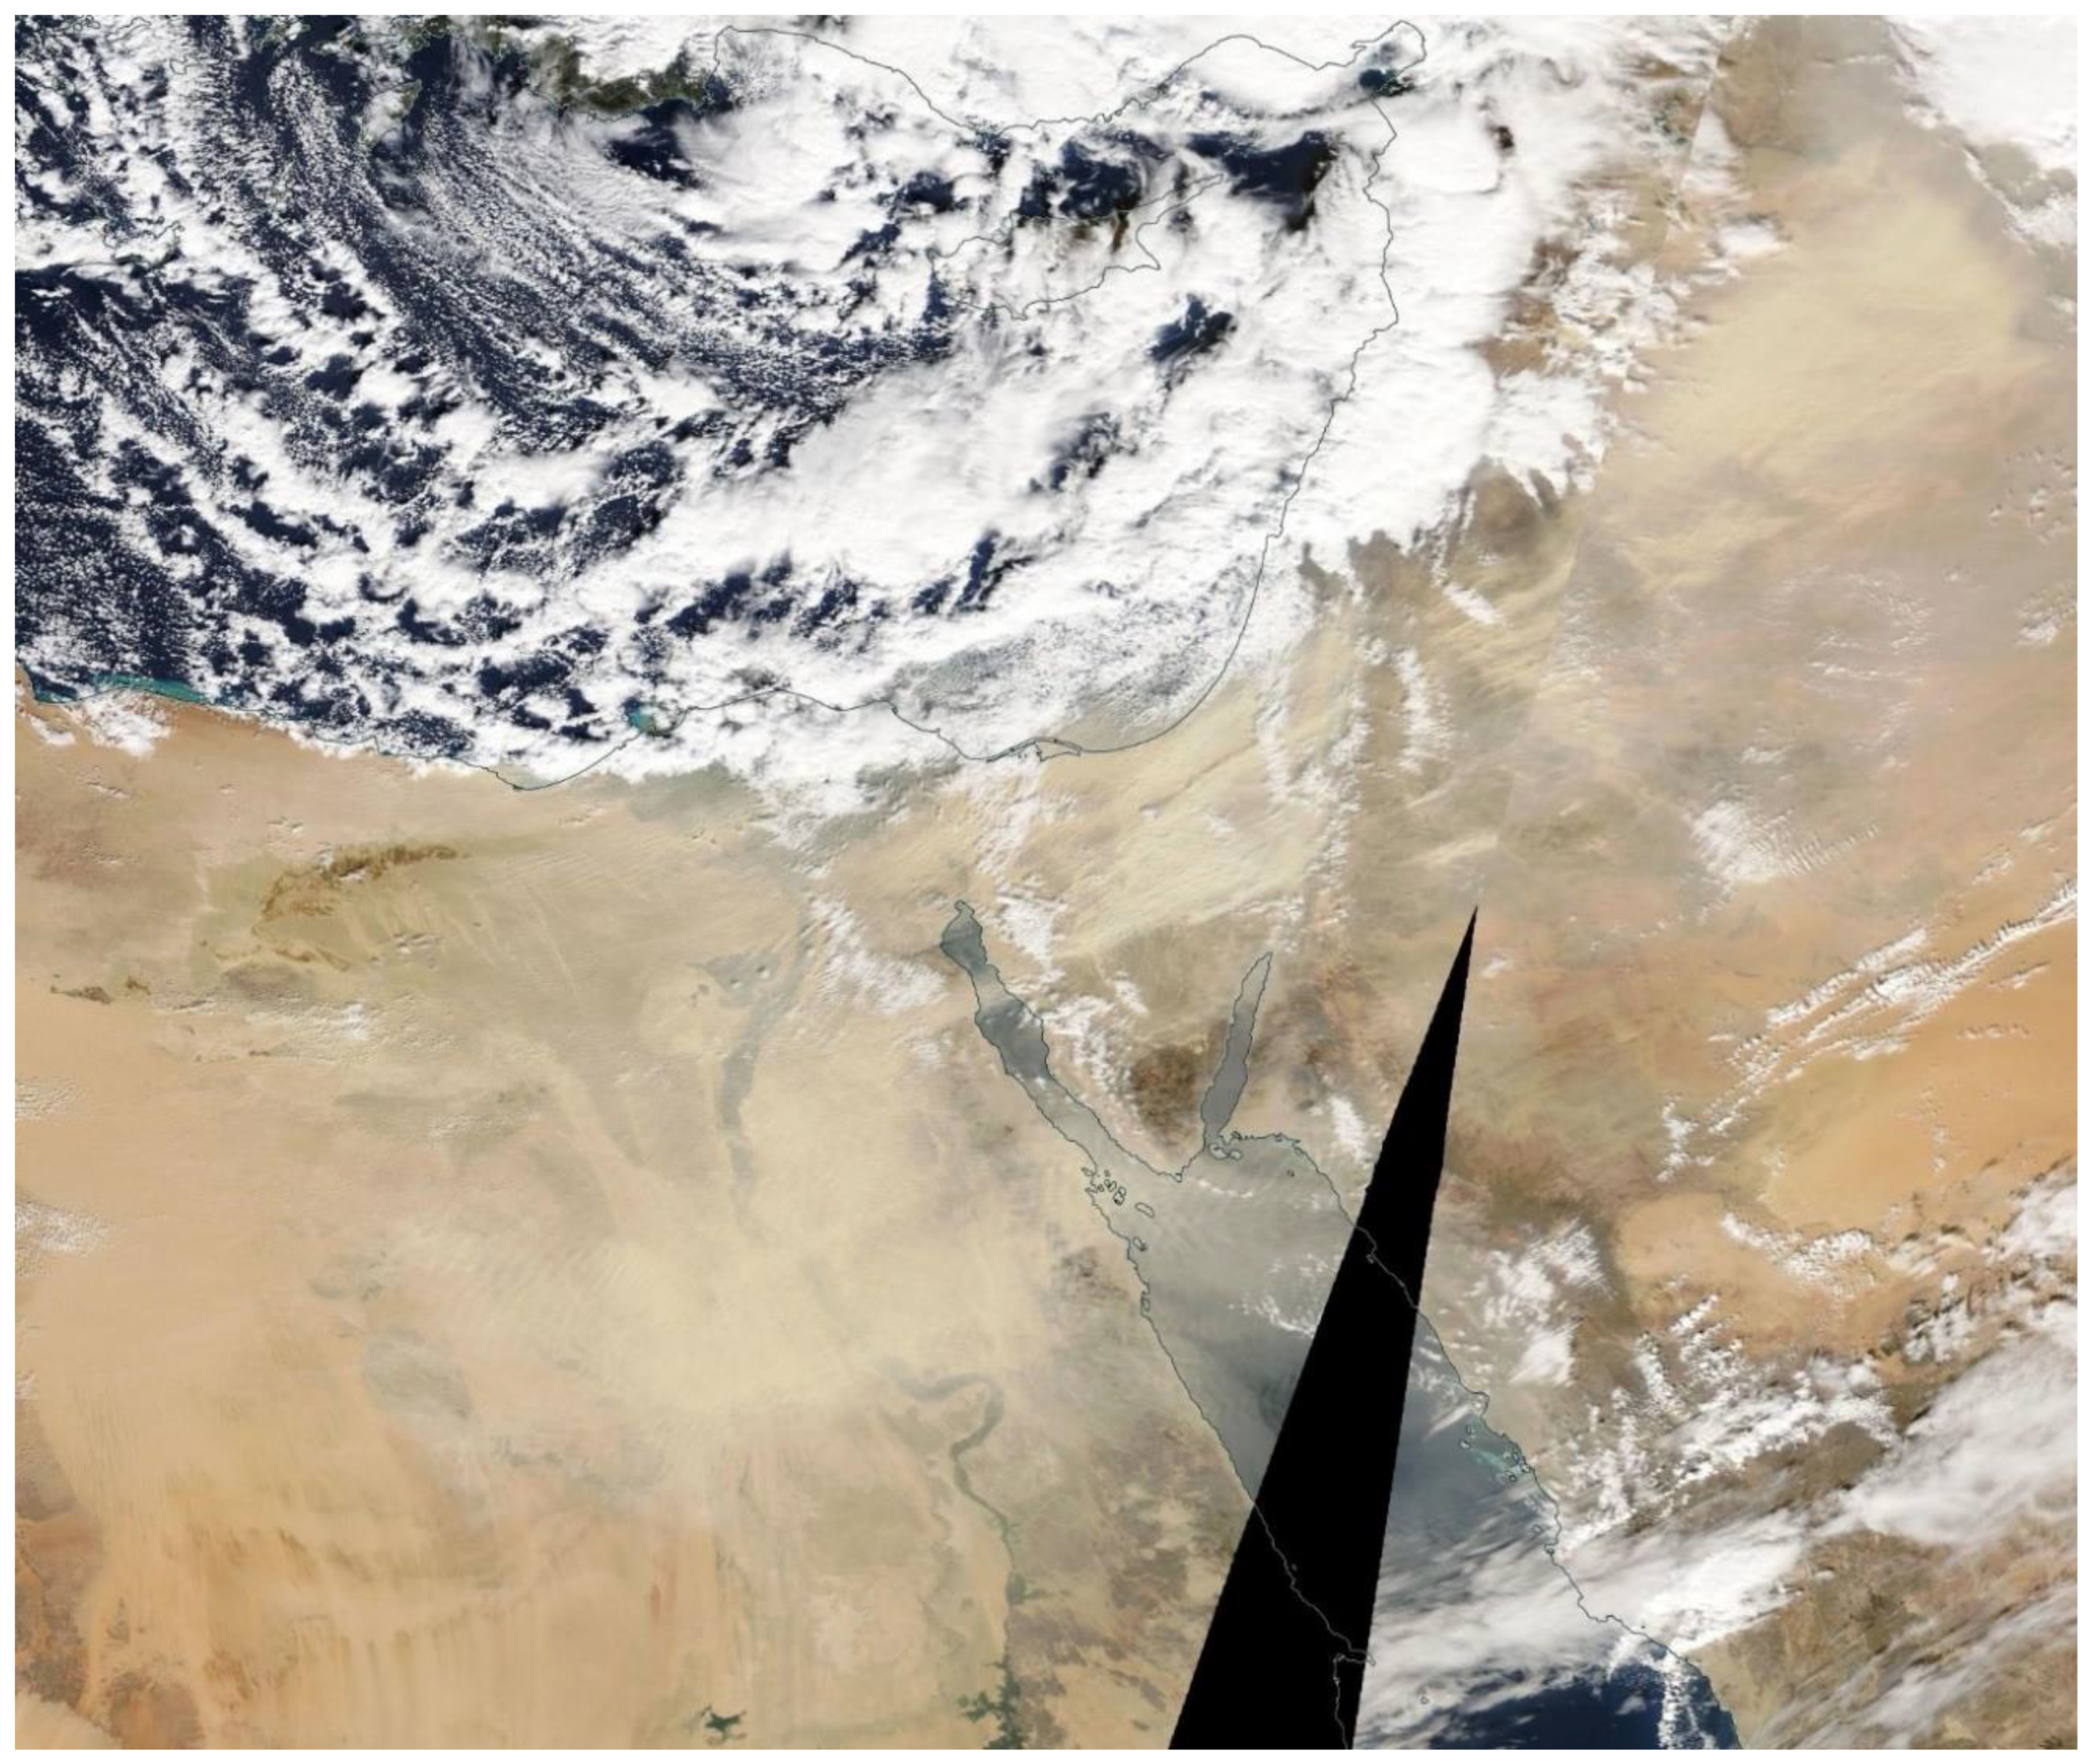
3.5. 12 December 2010 Case Study

The 12 December 2010 event represents the most severe dust event of the study period, with an average daily PM10 concentration of 3222.7 µg/m3. The back trajectory for this day fell within Cluster 4 (200 m), indicating cyclonic flow around the eastern Mediterranean. Satellite imagery confirmed a Cyprus Low centered near or over Cyprus (Figure 6), and surface conditions indicated a brisk wind out of the southwest (Table 3). Dust was clearly evident streaming out of North Africa, across the Sinai Peninsula, and into southern Israel.

4. Discussion

The primary goal of this study was to provide insight into the synoptic conditions necessary to produce dust events in Be’er Sheva, Israel. Although previous research has clearly highlighted the importance of the Cyprus Low, it was generally unclear why some days resulted in elevated levels of PM10 while other days with similar atmospheric patterns did not. In this regard, we uncovered a series of unique yet related conditions that seem to play vital roles in increasing the severity of dust events in the Negev Desert. These include: (1) The essential role of air traversing Libya, (2) an overall pattern with a brisk northerly flow across the Eastern Mediterranean and westerly flow across north Africa, and (3) a deep Cyprus Low.
An important finding here is the strong relationship between air traversing Libya and especially high PM10 levels in Be’er Sheva. Yaalon and Ganor [16] previously discussed the unique role of the Libyan desert (and other arid locations) on dust events over the Negev, but the back trajectories and overall atmospheric patterns discussed in that research differ somewhat compared with the results here. Whereas Yaalon and Ganor [16] associated broader troughs in the region similar to Clusters 3 and 8 (200 m) with dust events in the Negev, here we found that deeper systems with more pronounced cyclonic curvature (Cluster 4; 200 m) had higher average levels of PM10 in Be’er Sheva by a considerable margin. This is an important finding. Whereas a more zonal westerly flow often results in elevated concentrations of dust, the highest levels of PM10 were associated with an airflow moving cyclonically around a deep Cyprus Low. Rather than moving almost due east, this air first heads south over the eastern Mediterranean before rapidly pivoting eastward over the deserts of north Africa. These relatively minor differences in atmospheric pattern have important impacts on the levels of PM10 experienced during dust events in Be’er Sheva. Further, this result suggests that the Cyprus Low provides especially favorable conditions for the uplift and long-range transport of dust particles, in agreement with the general association of extreme dust events with Mediterranean cyclones [43].
Further highlighting the importance of minor differences in airflow is the varying impact of Clusters 1 and 4. Whereas Cluster 4 was associated with the highest levels of PM10, Cluster 1 had the second lowest. Cluster 1 approached Be’er Sheva from a more northerly position and was never situated over the deserts of north Africa, limiting its ability to transport dust. In addition to the role of north African dust, these small differences also likely allowed Cluster 4 to transport more local dust, which can also play an important role in dust events [22,25]. Air within Cluster 1 often arrived into Be’er Sheva from the northwest and was over land for less than 50 km. On the other hand, within Cluster 4, air approached Be’er Sheva from over land to the west and southwest, and local dust transport became more feasible. A consistent surface wind direction from approximately 240 degrees during the 12 December 2010 dust event provides additional evidence supporting the important role of wind direction on dust events.
Another interesting finding is the relationship between Cyprus Low intensity and PM10. Here, a statistically significant correlation existed between these two variables, with deeper systems being associated with more severe dust events during days with similar back trajectories. These stronger systems likely result in more pronounced cyclonic curvature, allowing for the unique airflow discussed above. Further, the stronger pressure gradient associated with these systems likely allows more dust to become airborne [44].
Interestingly, the strength of the Cyprus Low seems to play a more important role on dust events than the location of these systems. Given that our examination of both cyclone location and strength focused only on days within the back trajectories associated with the highest levels of PM10, we expected the low-pressure centers to be more geographically clustered. In other words, even though we examined days with similar back trajectories, the location of the low-pressure centers themselves varied considerably. Despite this, the most severe dust events did tend to result from lows centered over southern Turkey and the northeast Mediterranean, the traditional area most commonly associated with the Cyprus Low. The variability among cyclone position spans some of the range found in Saaroni et al. [45] for high PM10 days in the northern part of Israel. Namely, their Cyprus Low categories of “cold low to west” and “deep low to north” are consistent with our findings for Be’er Sheva, but their “deep low to south” was absent here (see [46] for category definitions). Overall, however, the use of back trajectories proved more effective at identifying patterns associated with high levels of dust than looking at specific cyclone location.
The findings here build upon the work conducted by Dayan et al. [2], who also examined dust events in Be’er Sheva. However, there are several important differences. First, while Dayan et al. [2] used visibility data as a proxy for PM10, here we used specific PM10 measurements, providing a more accurate assessment of airborne dust. Next, Dayan et al. [2] examined reanalysis data to subjectively estimate synoptic patterns that impact dust. Using the automated HYSPLIT model, we created distinct back trajectories which have a more accurate representation of actual airflow and dust movement, as they consider the nonstationary flow environment. The automation in this work was extended into our clustering procedure, which proved highly effective at grouping distinct atmospheric patterns, allowing us to clearly identify specific trajectories most associated with elevated dust levels in Be’er Sheva. Finally, Dayan et al. [2] created general pressure maps looking at dust–pressure correlations over long periods of time to examine long-term accumulated dust. This methodology is likely to miss short-term dust events, and as a result, here we used more focused timeframes, only examining days with specific dust events.
A potential limitation of the methodology is that a few extremely anomalous dust events have the potential to exert a large impact on the results. However, it is important to note that the results remain consistent even when the largest events are removed. As one example, Cluster 4 (200 m) continues to have the highest average PM10 levels, by far, even when the largest dust event across the period of record is removed. As previously noted, this event on 12 December 2010 had PM10 levels of 3222.7 µg/m3, nearly double the next highest event. A closer examination of Cluster 4 demonstrates the robustness of the results. Of 18 Cluster 4 days across the period of record, 16 had higher PM10 values than the average dust event (181.23 µg/m3), 12 had over 300 µg/m3, and 6 events exceeded 600 µg/m3. In other words, the most severe cluster remained the most severe even with the few highly anomalous days removed, and this consistency was found across all three height levels. The consistency was also found in the examination of countries. Again, removing the most anomalous days from the analysis, air traversing Libya 24 h in advance (at all three height levels) continued to be associated with the worst dust events by a wide margin. Simply put, the findings here are not a result of only a few highly unusual dust events but rather a consistent pattern of extreme dust during certain synoptic patterns.
Another limitation is that we did not emphasize individual or highly localized dust events [47,48] but rather focused on larger-scale synoptic features that had greater impacts on PM10 averages. Individually examining the surface conditions of hundreds of unique events was beyond the scope of this study. As a result, Clusters 2 and 10 (200 m) with air originating from the north or east were underemphasized here since they had lower average PM10 values, even though they were also associated with a few unusual, high-impact dust events such as the dust outbreak of September 2015 [48]. Likewise, since we were concerned more with atmospheric pattern, we did not examine surface conditions in Be’er Sheva such as temperature, precipitation, wind speed, pressure, or atmospheric stability, with the exception being the individual case study covering the 12 December 2010 event. We also did not examine surface cover, and to provide an even more comprehensive overview of dust events across the region, we suggest future research examine both conditions on the ground (i.e., drought) and in the atmospheric column.

5. Summary and Conclusions

Considering the Negev Desert in Israel is susceptible to frequent dust events which can be detrimental to human health, the goal of this study was to provide a more detailed examination of the synoptic conditions most closely associated with elevated levels of atmospheric dust in Be’er Sheva, Israel. Previous research has noted the important role of the Cyprus Low, but questions remain as to why some days with seemingly similar weather patterns resulted in higher levels of atmospheric dust than others. Here, through an examination of over 15 years of daily PM10 concentrations in Be’er Sheva, along with 72-h HYSPLIT back trajectories at three different heights and sea-level pressure data across the region, we provided a detailed overview examining the synoptic conditions most closely associated with dust events. Similar to previous research, we confirmed the importance of the Cyprus Low on dust in Be’er Sheva, and we further found a series of unique yet related conditions that play critical roles in increasing the severity of dust events in the Negev Desert. We found that: (1) Air traversing Libya has a major impact on increasing dust across the Negev, likely due to the country’s arid surface cover. (2) An overall pattern with a brisk northerly flow across the Eastern Mediterranean and westerly flow across north Africa is associated with elevated dust in Be’er Sheva, likely because this pattern provides increased availability of both local and foreign dust sources. (3) Cyclone strength is a critical factor as lower sea-level pressure results in more severe dust events. These deeper low-pressure systems likely result in a more pronounced cyclonic curvature, not only allowing for the unique airflow necessary for increased atmospheric dust, but the stronger pressure gradient likely also allows more dust to become airborne. It is our hope that a more detailed understanding of the specific atmospheric features associated with dust events across the Negev Desert can improve forecasting, since historically, models have sometimes struggled to accurately predict the onset and severity of these hazardous conditions.

Supplementary Materials

The following are available online at https://www.mdpi.com/2073-4433/11/10/1020/s1, Table S1: Average PM10 concentration (µg/m3) within each cluster (0 m and 500 m). Standard deviations are in parentheses. Figure S1: Average dust event PM10 values in Be’er Sheva based on locations of air 48 and 72 h prior to arrival in Be’er Sheva. Based on 48 and 72-h back trajectories at 0 m, 200 m, and 500 m. Minimum of 5 days. Figure S2: Percent change in root mean square deviation (RMSD) at 0 m, 200 m, and 500 m. Figure S3: 72-h back trajectory clusters at 0 m and 500 m. Colored lines represent individual back trajectories for each dust day, and black lines depict the average coordinates for each cluster.

Author Contributions

Conceptualization, A.J.K., Y.R. and S.R.-R.; methodology, A.K., Y.R., S.R.-R., I.K., V.N.; software, A.J.K., Y.R., S.R.-R., I.K.; validation, A.J.K., Y.R., S.R.-R., I.K., V.N.; formal analysis, A.J.K., Y.R., S.R.-R., I.K., V.N.; investigation, A.J.K., S.R.-R.; resources, A.J.K., Y.R., S.R.-R., I.K., V.N.; data curation, A.J.K., Y.R., S.R.-R., I.K., V.N.; writing—original draft preparation, A.J.K.; writing—review and editing, A.J.K., Y.R., S.R.-R., I.K., V.N.; visualization, A.J.K., Y.R., S.R.-R., I.K.; supervision, A.J.K., Y.R.; project administration, A.J.K., Y.R. All authors have read and agreed to the published version of the manuscript.

Funding

This research was partially funded by a grant from the Israel Science Foundation, Grant #212602.

Conflicts of Interest

The authors declare no conflict of interest.

References

  1. Dayan, U.; Levy, I. The influence of meteorological conditions and atmospheric circulation types on PM10 and visibility in Tel Aviv. J. App. Meteorol. 2005, 44, 606–619. [Google Scholar] [CrossRef]
  2. Dayan, U.; Ziv, B.; Shoob, T.; Enzel, Y. Suspended dust over southeastern Mediterranean and its relation to atmospheric circulations. Int. J. Climatol. J. R. Meteorol. Soc. 2008, 28, 915–924. [Google Scholar] [CrossRef]
  3. Derimian, Y.; Karnieli, A.; Kaufman, Y.J.; Andreae, M.O.; Andreae, T.W.; Dubovik, O.; Maenhaut, W.; Koren, I.; Holben, B.N. Dust and pollution aerosols over the Negev desert, Israel: Properties, transport, and radiative effect. J. Geophys. Res. Atmos. 2006, 111. [Google Scholar] [CrossRef]
  4. Vodonos, A.; Friger, M.; Katra, I.; Krasnov, H.; Zahger, D.; Schwartz, J.; Novack, V. Individual effect modifiers of dust exposure effect on cardiovascular morbidity. PLoS ONE 2015, 10, e0137714. [Google Scholar] [CrossRef]
  5. Vodonos, A.; Friger, M.; Katra, I.; Avnon, L.; Krasnov, H.; Koutrakis, P.; Schwartz, J.; Lior, O.; Novack, V. The impact of desert dust exposures on hospitalizations due to exacerbation of chronic obstructive pulmonary disease. Air Qual. Atmos. Health 2014, 7, 433–439. [Google Scholar] [CrossRef]
  6. Vodonos, A.; Kloog, I.; Boehm, L.; Novack, V. The impact of exposure to particulate air pollution from non-anthropogenic sources on hospital admissions due to pneumonia. Eur. Respir. J. 2016, 48, 1791–1794. [Google Scholar] [CrossRef] [PubMed] [Green Version]
  7. Ebenstein, A.; Frank, E.; Reingewertz, Y. Particulate Matter Concentrations, Sandstorms and Respiratory Hospital Admissions in Israel. Isr. Med. Assoc. J. 2015, 17, 628–632. [Google Scholar]
  8. Yitshak-Sade, M.; Novack, V.; Katra, I.; Gorodischer, R.; Tal, A.; Novack, L. Non-anthropogenic dust exposure and asthma medication purchase in children. Eur. Respir. J. 2015, 45, 652–660. [Google Scholar] [CrossRef]
  9. Ginsberg, G.M.; Kaliner, E.; Grotto, I. Mortality, hospital days and expenditures attributable to ambient air pollution from particulate matter in Israel. Isr. J. Health Policy Res. 2016, 5, 51. [Google Scholar] [CrossRef] [Green Version]
  10. Katra, I.; Krasnov, H. Exposure Assessment of Indoor PM Levels during Extreme Dust Episodes. Int. J. Environ. Res. Public Health 2020, 17, 1625. [Google Scholar] [CrossRef] [Green Version]
  11. Schlesinger, P.; Mamane, Y.; Grishkan, I. Transport of microorganisms to Israel during Saharan dust events. Aerobiologia 2006, 22, 259. [Google Scholar] [CrossRef]
  12. Mazar, Y.; Cytryn, E.; Erel, Y.; Rudich, Y. Effect of dust storms on the atmospheric microbiome in the Eastern Mediterranean. Environ. Sci. Technol. 2016, 50, 4194–4202. [Google Scholar] [CrossRef] [PubMed]
  13. Gat, D.; Mazar, Y.; Cytryn, E.; Rudich, Y. Origin-dependent variations in the atmospheric microbiome community in eastern Mediterranean dust storms. Environ. Sci. Technol. 2017, 51, 6709–6718. [Google Scholar] [CrossRef] [PubMed]
  14. Ganor, E.; Osetinsky, I.; Stupp, A.; Alpert, P. Increasing trend of African dust, over 49 years, in the eastern Mediterranean. J. Geophys. Res. Atmos. 2010, 115. [Google Scholar] [CrossRef] [Green Version]
  15. Krasnov, H.; Katra, I.; Friger, M. Increase in dust storm related PM10 concentrations: A time series analysis of 2001–2015. Environ. Pollut. 2016, 213, 36–42. [Google Scholar] [CrossRef]
  16. Yaalon, D.H.; Ganor, E. East Mediterranean trajectories of dust-carrying storms from the Sahara and Sinai. Sahar. Dust 1979, 9, 187–193. [Google Scholar]
  17. Shay-El, Y.; Alpert, P. A diagnostic study of winter diabatic heating in the Mediterranean in relation to cyclones. Q. J. R. Meteorol. Soc. 1991, 117, 715–747. [Google Scholar] [CrossRef]
  18. Krasnov, H.; Katra, I.; Koutrakis, P.; Friger, M.D. Contribution of dust storms to PM10 levels in an urban arid environment. J. Air Waste Manag. Assoc. 2014, 64, 89–94. [Google Scholar] [CrossRef] [Green Version]
  19. De Meij, A.; Vinuesa, J.F.; Maupas, V.; Waddle, J.; Price, I.; Yaseen, B.; Ismail, A. Wind energy resource mapping of Palestine. Renew. Sustain. Energy Rev. 2016, 56, 551–562. [Google Scholar] [CrossRef]
  20. Offer, Z.Y.; Goossens, D. Ten years of aeolian dust dynamics in a desert region (Negev desert, Israel): Analysis of airborne dust concentration, dust accumulation and the high-magnitude dust events. J. Arid Environ. 2001, 47, 211–249. [Google Scholar] [CrossRef]
  21. Offer, Z.Y.; Goossens, D. Thirteen years of aeolian dust dynamics in a desert region (Negev desert, Israel): Analysis of horizontal and vertical dust flux, vertical dust distribution and dust grain size. J. Arid Environ. 2004, 57, 117–140. [Google Scholar] [CrossRef]
  22. Crouvi, O.; Dayan, U.; Amit, R.; Enzel, Y. An Israeli haboob: Sea breeze activating local anthropogenic dust sources in the Negev loess. Aeolian Res. 2017, 24, 39–52. [Google Scholar] [CrossRef]
  23. Pey, J.; Querol, X.; Alastuey, A.; Forastiere, F.; Stafoggia, M. African dust outbreaks over the Mediterranean Basin during 2001–2011: PM10 concentrations, phenomenology and trends, and its relation with synoptic and mesoscale meteorology. Atmos. Chem. Phys. 2013, 13, 1395–1410. [Google Scholar] [CrossRef] [Green Version]
  24. Calidonna, C.R.; Avolio, E.; Gullì, D.; Ammoscato, I.; Pino, M.D.; Donateo, A.; Feudo, T.L. Five Years of Dust Episodes at the Southern Italy GAW Regional Coastal Mediterranean Observatory: Multisensors and Modeling Analysis. Atmosphere 2020, 11, 456. [Google Scholar] [CrossRef]
  25. Yaalon, D.H.; Ginzbourg, D. Sedimentary characteristics and climatic analysis of easterly dust storms in the Negev (Israel). Sedimentology 1966, 6, 315–332. [Google Scholar] [CrossRef]
  26. Offer, Z.I.; Goossens, D. Airborne dust in the Northern Negev Desert (January–December 1987): General occurrence and dust concentration measurements. J. Arid Environ. 1990, 18, 1–19. [Google Scholar] [CrossRef]
  27. Kalderon-Asael, B.; Erel, Y.; Sandler, A.; Dayan, U. Mineralogical and chemical characterization of suspended atmospheric particles over the east Mediterranean based on synoptic-scale circulation patterns. Atmos. Environ. 2009, 43, 3963–3970. [Google Scholar] [CrossRef]
  28. Shalom, O.; Crouvi, O.; Enzel, Y.; Rosenfeld, D. Locally recycled late Pleistocene loess feeds modern dust storms at the desert margins of the eastern Mediterranean, Israel. Aeolian Res. 2020, 46, 100612. [Google Scholar] [CrossRef]
  29. Djurić, D. On the accuracy of air trajectory computations. J. Meteorol. 1961, 18, 597–605. [Google Scholar] [CrossRef]
  30. Mamouri, R.E.; Ansmann, A.; Nisantzi, A.; Solomos, S.; Kallos, G.; Hadjimitsis, D.G. Extreme dust storm over the eastern Mediterranean in September 2015: Satellite, lidar, and surface observations in the Cyprus region. Atmos. Chem. Phys. 2016, 16, 13711–13724. [Google Scholar] [CrossRef] [Green Version]
  31. Chung, A.; Chang, D.P.; Kleeman, M.J.; Perry, K.D.; Cahill, T.A.; Dutcher, D.; Stroud, K. Comparison of real-time instruments used to monitor airborne particulate matter. J. Air Waste Manag. Assoc. 2001, 51, 109–120. [Google Scholar] [CrossRef]
  32. Alpert, P.; Osetinsky, I.; Ziv, B.; Shafir, H. A new seasons definition based on classified daily synoptic systems: An example for the eastern Mediterranean. Int. J. Climatol. J. R. Meteorol. Soc. 2004, 24, 1013–1021. [Google Scholar] [CrossRef]
  33. Stein, A.F.; Draxler, R.R.; Rolph, G.D.; Stunder, B.J.; Cohen, M.D.; Ngan, F. NOAA’s HYSPLIT atmospheric transport and dispersion modeling system. Bull. Am. Meteorol. Soc. 2015, 96, 2059–2077. [Google Scholar] [CrossRef]
  34. Rolph, G.; Stein, A.; Stunder, B. Real-time environmental applications and display system: READY. Environ. Model. Softw. 2017, 95, 210–228. [Google Scholar] [CrossRef]
  35. Stein, A.F.; Wang, Y.; De La Rosa, J.D.; Sanchez de La Campa, A.M.; Castell, N.; Draxler, R.R. Modeling PM10 originating from dust intrusions in the Southern Iberian Peninsula using HYSPLIT. Weather Forecast. 2011, 26, 236–242. [Google Scholar] [CrossRef] [Green Version]
  36. Wojcik, G.S.; Chang, J.S. A re-evaluation of sulfur budgets, lifetimes, and scavenging ratios for eastern North America. J. Atmos. Chem. 1997, 26, 109–145. [Google Scholar] [CrossRef]
  37. Abdalmogith, S.S.; Harrison, R.M. The use of trajectory cluster analysis to examine the long-range transport of secondary inorganic aerosol in the UK. Atmos. Environ. 2005, 39, 6686–6695. [Google Scholar] [CrossRef] [Green Version]
  38. Fleming, Z.L.; Monks, P.S.; Manning, A.J. Untangling the influence of air-mass history in interpreting observed atmospheric composition. Atmos. Res. 2012, 104, 1–39. [Google Scholar] [CrossRef] [Green Version]
  39. Reizer, M.; Orza, J.A. Identification of PM10 air pollution origins at a rural background site. In Proceedings of the E3S Web of Conferences, Polanica-Zdrój, Poland, 16–18 April 2018. [Google Scholar]
  40. Borge, R.; Lumbreras, J.; Vardoulakis, S.; Kassomenos, P.; Rodríguez, E. Analysis of long-range transport influences on urban PM10 using two-stage atmospheric trajectory clusters. Atmos. Environ. 2007, 41, 4434–4450. [Google Scholar] [CrossRef]
  41. Makra, L.; Matyasovszky, I.; Tusnády, G.; Wang, Y.; Csépe, Z.; Bozóki, Z.; Nyul, L.G.; Erostyak, J.; Bodnar, K.; Sumeghy, Z.; et al. Biogeographical estimates of allergenic pollen transport over regional scales: Common ragweed and Szeged, Hungary as a test case. Agric. Forest Meteorol. 2016, 221, 94–110. [Google Scholar] [CrossRef]
  42. Dee, D.P.; Uppala, S.M.; Simmons, A.J.; Berrisford, P.; Poli, P.; Kobayashi, S.; Andrea, M.A.; Balsamo, B.G.; Bauer, P.; Bechtold, P.; et al. The ERA-Interim reanalysis: Configuration and performance of the data assimilation system. Q. J. R. Meteorol. Soc. 2011, 137, 553–597. [Google Scholar] [CrossRef]
  43. Flaounas, E.; Kotroni, V.; Lagouvardos, K.; Kazadzis, S.; Gkikas, A.; Hatzianastassiou, N. Cyclone contribution to dust transport over the Mediterranean region. Atmos. Sci. Lett. 2015, 16, 473–478. [Google Scholar] [CrossRef] [Green Version]
  44. Wilkerson, W.D. Dust and Sand Forecasting in Iraq and Adjoining Countries; Scott AFB (No. AWS/TN-91/001); Air Weather Service: Kansas City, MI, USA, 1991; p. 72.
  45. Saaroni, H.; Levi, E.; Ziv, B. Particulate matter in the summer season and its relation to synoptic conditions and regional climatic stress—The case of Haifa, Israel. Water Air Soil Pollut. 2018, 229, 313. [Google Scholar] [CrossRef]
  46. Alpert, P.; Osetinsky, I.; Ziv, B.; Shafir, H. Semi-objective classification for daily synoptic systems: Application to the eastern Mediterranean climate change. Int. J. Climatol. J. R. Meteorol. Soc. 2004, 24, 1001–1011. [Google Scholar] [CrossRef]
  47. Yair, Y.; Katz, S.; Yaniv, R.; Ziv, B.; Price, C. An electrified dust storm over the Negev desert, Israel. Atmos. Res. 2016, 181, 63–71. [Google Scholar] [CrossRef]
  48. Gasch, P.; Rieger, D.; Walter, C.; Khain, P.; Levi, Y.; Knippertz, P.; Vogel, B. Revealing the meteorological drivers of the September 2015 severe dust event in the Eastern Mediterranean. Atmos. Chem. Phys. 2017, 17, 13573. [Google Scholar] [CrossRef] [Green Version]
Figure 1. Map of the region showing Be’er Sheva (red star). From Google Earth.
Atmosphere 11 01020 g001
Figure 2. Average dust event PM10 values in Be’er Sheva based on location of air 24 h prior to arrival in Be’er Sheva. Based on 24-h back trajectories at 0 m, 200 m, and 500 m. Minimum of 5 days.
Atmosphere 11 01020 g002
Figure 3. The 72-h back trajectory clusters at 200 m. Colored lines represent individual back trajectories for each dust day, and black lines depict the average coordinates for each cluster.
Atmosphere 11 01020 g003
Figure 4. Minimum sea-level pressure (SLP) within 20–40° E, 20–40° N and PM10 concentrations (µg/m3) in Be’er Sheva during days that fall within the back trajectory cluster associated with the highest PM10 values.
Atmosphere 11 01020 g004
Figure 5. Locations of the cyclone centers between 20–40° E, 20–40° N at the timing of minimum central pressure (color) and daily PM10 in Be’er Sheva (circle size). Only includes days that fall within the back trajectory cluster associated with the highest PM10 values.
Atmosphere 11 01020 g005
Figure 6. Regional satellite image from the Terra Moderate Resolution Imaging Spectroradiometer (MODIS) taken at approximately 1030 local on 12 December 2010.
Atmosphere 11 01020 g006
Table 1. Average monthly dust day frequency (%) and average daily PM10 concentration (µg/m3). Standard deviations are in parentheses.
MonthAverage Dust Day Frequency (%)Average Daily PM10 (µg/m3)
Jan15.1 (17.1)60.2 (116.1)
Feb23.0 (27.0)77.0 (121.6)
Mar19.6 (12.9)66.2 (98.2)
Apr21.9 (23.4)63.7 (80.4)
May15.5 (21.8)63.8 (122.5)
Jun6.1 (8.6)43.0 (23.0)
Jul2.5 (5.2)42.4 (12.9)
Aug2.5 (6.9)41.9 (11.8)
Sep5.4 (9.8)47.3 (80.1)
Oct13.4 (14.2)47.0 (33.6)
Nov14.6 (24.5)53.2 (64.4)
Dec18.5 (19.1)72.6 (193.1)
Table 2. Average PM10 concentration (µg/m3) within each cluster (200 m). Standard deviations are in parentheses.
ClusterDust Days (n)Average PM10 (µg/m3)
111113.8 (27.3)
295169.8 (212.6)
346224.1 (279.7)
418582.7 (708.0)
583121.8 (55.9)
66897.9 (35.2)
783180.7 (125.7)
836332.6 (352.5)
937210.4 (210.8)
1083147.2 (177.9)
1169175.0 (129.0)
Total629181.2 (227.1)
Table 3. Surface meteorological conditions in Be’er Sheva on 12 December 2010.
Time (Local)Temp (°C)Relative Humidity (%)Wind Speed (m/s)Wind Direction (Degrees)PM10 (µg/m3)
60011.4476.32404216
120010.1437.32372153
180012.0418.1238n/a
240010.9496.02382982

