Abstract
Field observations made with unmanned aerial vehicles of the particulate matter (PM) concentration from the ground to a height of 500 m were conducted at Xiaotang and Tazhong in the Taklimakan Desert (TD), China, from 7 to 15 November 2019. The vertical structures of the PM concentrations were studied. Pulsed lidar observations showed that dust aerosols in the TD can reach heights of 4 km. Within 500 m above the ground, the PM1.0, PM2.5, and PM10 concentrations were <100, <201, and <764 µg∙m−3, respectively, in the TD. On days containing sand-blowing periods (e.g., at 18:00 on 11 November), the PM1.0, PM2.5, and PM10 concentrations were 10–17.7 times higher than on clear days. The northern margin of the TD (Xiaotang) was dominated by fine particles, while the hinterland (Tazhong) was dominated by coarse particles, because there was sparse vegetation around Xiaotang and the surface was sand and clay, while there was no vegetation around Tazhong and the surface was sand. During floating dust periods, the boundary layer was dominated by fine particles. The average PM1.0/PM2.5 ratios were 0.25–0.65 and 0.40–0.80 at Tazhong and Xiaotang, respectively, while, during sand blowing periods, these ratios were 0.40–0.55 and 0.40–0.45, respectively. The critical condition in the atmospheric boundary layer for PM concentration was revealed with the enhanced momentum flux and sensible heat flux up to 0.52 kg∙m−1∙s−2, 0.69 m∙s−1, and 6.7 W∙m2, respectively, and the low mixed layer was high in the lower atmosphere.
1. Introduction
Solid and liquid particles suspended in the atmosphere have particle sizes ranging from 10−3 to 102 µm, defined as atmospheric aerosol particles [1]. Dust particles are the main component of atmospheric aerosols, and it has been estimated that the annual total dust aerosol emission into the Earth’s atmosphere is as high as 1000–3000 Tg·yr−1, which accounts for half of the tropospheric aerosol total load [2,3,4]. The spatial and temporal variations of dust aerosols is large and can span four orders of magnitude [5].
Dust aerosols can affect the amount of energy reaching the Earth’s surface and atmosphere, on the one hand by absorbing and scattering short-wave radiation from the sun and long-wave radiation from the ground, thus heating and cooling the atmosphere, and on the other hand by changing the extent of snow cover, affecting surface albedo. In addition, dust aerosols can transport nutrients into the biosphere. Dust aerosols can also provide contact surfaces for heterogeneous chemical reactions between trace gases, act as condensation nuclei in clouds, change the nature and lifespan of clouds, affect global and regional precipitation, and thus play an important role in global climate change [6,7,8,9].
Aerosol particles suspended in the atmosphere are not only harmful to human health, but they also have a significant impact on global and regional climate and environmental systems. Aerosols are a key factor of uncertainty in the study of atmospheric radiation balance and climate change. As an important aerosol in East Asia, the average optical thickness of dust is up to 5.27 and the vertical profile of aerosols is bimodal [10]. Dust in East Asia is seasonal [11]. There is a seasonal cycle of strong emissions in spring and summer (March to August) and weak emissions in autumn and winter (September to February of the following year). The largest sand and dust emissions in East Asia occur during May (28.67 Mt) [11]. Dust emission and dust storms generally require strong and durable wind forces and land surfaces with loose and dry dust [12], which have an important impact on dust emission, along with the change of seasons, especially in spring in northern China [13,14]. During spring, dust storms in Mongolia and western China affect East Asian countries under the action of westerly winds that are carried to the eastern Pacific Ocean [15,16]. Thus, dust, which can modify the amount of radiation reaching the atmosphere and surface and transport environmental pollutants, can be very harmful for human health [17,18].
During the past 40 years, China has generated increasing levels of air pollution due to improvements in people’s living conditions and economic standards [19], especially in the north China plain (NCP), the Yangtze River Delta (YRD), and the Pearl River Delta (PRD). For this reason, a large number of studies have been conducted on air pollution in this country [20,21,22,23,24,25,26,27]. In some cities, local governments have implemented a large number of regulatory measures based on these findings, such as adjusting their industrial structures, sulfur limitation, and emission reduction. Therefore, air quality has improved significantly [28].
In China, atmospheric aerosol pollution is very serious, especially the air quality in the Taklimakan Desert (TD), which is a large cause of concern for the residents of China’s big cities [1,29,30]. As fine particles of dust are carried high into the air and may travel long distances via upper air currents, they can affect air quality over a wide range. The TD is a major source of dust in northwest China, which can affect weather conditions across the whole northwest region, producing serious pollution. At present, there have been many investigations regarding the concentration, composition, and influence of atmospheric aerosol PM10 (i.e., particulate matter particles with diameters less than 10 µm) in inland and coastal cities [31,32,33,34,35,36,37,38,39,40]. Studies on the dust weather in the TD and its surrounding areas have mainly focused on the conditions and changing characteristics of dust weather, as well as the basic spatial and temporal distribution characteristics of dust aerosol PM10 and its influencing factors [1,12,17,29,30,41,42,43,44]. In addition to these studies of particulate matter (PM), some other air pollutants, mainly ozone (O3), have also been considered, and the results of these investigations have undoubtedly improved our understanding of the vertical characteristics of air pollution in the TD [13,14].
By analyzing the observation results of the frequency and intensity of sandstorm weather, the highest PM10 concentration in Xinjiang is in the hinterland of TD [1,29,30]. The highest PM10 concentrations occur from March to August, with an average concentration in the range 500–1000 μg·m−3 [29]. The PM10 concentrations were found to reduce from spring > summer > autumn > winter, with average values of 1000 μg·m−3 in spring, 400–900 μg·m−3 in summer, and 200–400 μg·m−3 in autumn and winter [29]. The average concentrations of PM10 during the sandstorm season were much higher than during non-sandstorm seasons. The average concentration of PM10 in the sandstorm season was 6.2 times and 3.6 times of that in the non-sandstorm season. Under different weather conditions, the distribution of PM10 concentration in the air presents the rule of clear days <floating dust days <windy days <sand dust days <dust storm days [29]. The concentration of PM10 increased with the wind speed in the TD, and the higher the wind speed was, the higher the concentration of PM10 would be. The air temperature, relative humidity, and air pressure are also important factors affecting the intensity of dust storms, which indirectly affect the PM10 concentration in the atmosphere [1,29,30].
However, due to a lack of observational means, there are relatively few reports on the vertical structure of pollutants in the TD area. Whether it is tethered balloons, manned aircraft, radar, satellite, or automatic ground stations, there are always some shortcomings in obtaining suitable observations. The application of unmanned aerial vehicles (UAVs) can effectively make up for the lack of precision of satellite observation and further test the results of satellite observations. In addition to observing the path of typhoons, drones are also useful for observing specific weather conditions, such as fog, hail, and dust. A variety of detection means, including unmanned ships, drifting buoys, FY (Fengyun) meteorological satellites, and round-trip intelligent sounding, can be used in conjunction with UAVs to provide convenience for meteorological early warning workers to carry out three-dimensional observations. Previous studies were mainly based on data obtained on the ground and via meteorological tower observation platforms, which were used to analyze the vertical distribution characteristics of PM in the TD [1,29,30]. Due to the limited observation height of meteorological towers, it is impossible to fully understand the vertical distribution characteristics and physical mechanism of boundary layer aerosols. Therefore, in this study, we provide first-hand observations of PM, as well as a set of meteorological parameters, including temperature, relative humidity, wind speed, and direction, observed from 7 to 15 November 2019 using unmanned aerial vehicles (UAVs). The dust season is from March to September in the TD, but PM concentration observations during the non-dust season are also important. In this study, PM concentration observations were conducted in November to make a comparison with PM concentrations in dust seasons in a future study.
The vertical distribution of PM up to 500 m was observed, and source information of aerosols at different heights, including their diurnal variation trend and their relationship with each other at different heights, were ascertained. The analysis of the TD is helpful for further understanding the distribution characteristics of dust aerosols in dust source areas and its influence on ambient air quality. In Section 2, we describe the observational data and methods. In Section 3, we present the observational analysis of the TD. Finally, we give our conclusions based on this analysis in Section 4.
2. Data and Method
In this study, observational data obtained with UAVs (Table 1) in the hinterland of the TD (Tazhong: 38°58′ N, 83°39′ E, 1099.3 m a.s.l.) and in the northern margins of the TD (Xiaotang: 40°48′ N, 84°18′ E, 921 m a.s.l.) were analyzed (Figure 1). Tazhong and Xiaotang are located 200 km apart, which are connected by a road running through the TD from north to south. Xiaotang is located in an oasis–desert transition zone on the northern margin of the TD. Tazhong is located in a desert area of the TD. The sands are “fine sand” and “very fine sand”, with an average grain size of 147 μm, of which 0.3% of the sand is smaller than 50 μm at Tazhong [45]. Tazhong is an important observation station in the China aerosol observation network. Blowing dust events occur frequently in the Xiaotang–Tazhong area, spanning more than 80 days per year [46]. There is sparse vegetation around XiaoTang.

Table 1.
General parameters of the unmanned aerial vehicles (UAVs) used in this study.
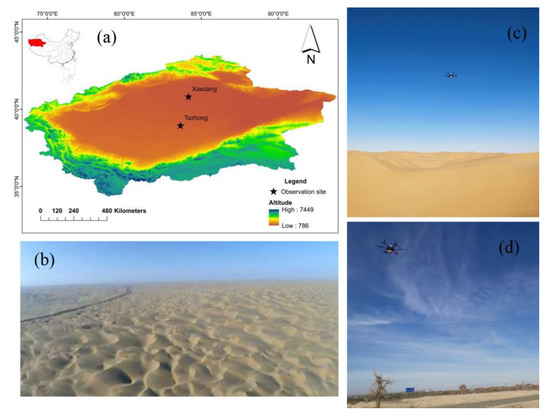
Figure 1.
(a) Sites of the UAV observations; (b) a typical image obtained with the UAV. Pictures of the UAV flying over (c) Tazhong and (d) Xiaotang.
Considering that floating dust and sand blowing periods can be captured in the northern margins and the hinterland of the TD, we observed PM concentrations and meteorological parameters for 2 days at Xiaotang and for 6 days at Tazhong. The observational data include the temperature, relative humidity, wind speed, wind direction, and PM1.0, PM2.5, and PM10 (i.e., PM with aerodynamic diameters less than 1, 2.5, and 10 µm, respectively) concentrations, which were recorded at Tazhong and Xiaotang, from 7 to 12 and 13 to 15 November 2019, respectively; see Figure 2. Among these, we chose the sand blowing periods at 18:00 on 11 November and clear periods at 12:00 on 8 November at Tazhong, and the floating dust periods were at 15:00 on 13 November and the clear periods were at 18:00 on 14 November at Xiaotang. In this study, according to the local weather stations, a sky totally free of oktas clouds was defined as clear. When the horizon visibility was less than 10 km and the wind speed was ≤ 5.4 m·s−1, it was defined as floating dust, and when the horizon visibility was from 1 km to 10 km, it was defined as sand blowing.
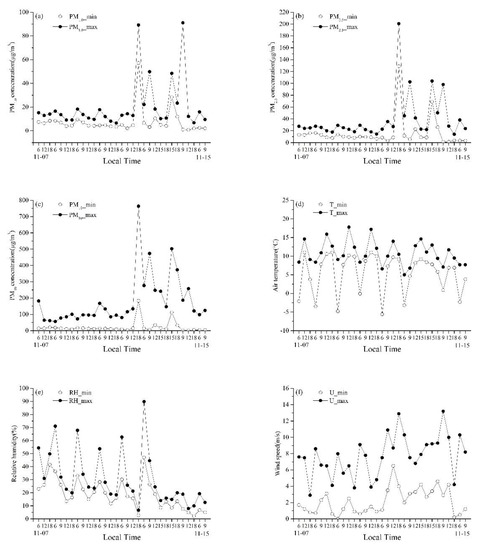
Figure 2.
Minimum and maximum particulate matter (PM) concentrations and the various meteorological parameters observed in the Taklimakan Desert (TD) during the study period: (a) PM1.0 concentrations; (b) PM2.5 concentrations; (c) PM10 concentrations; (d) air temperature; (e) relative humidity; and (f) wind speed.
We followed the method of Nozaki (1973) [47] to determine the mixing layer height (Equations (1)–(4)):
where H is the mixing layer height (in units of m), L is the level of atmospheric stability (including levels A = 1 (strong unstable), B = 2 (unstable), C = 3 (weak unstable), D = 4 (neutral), E = 5 (relatively stable), and F = 6 (stable)), which was determined by the Ri value named after Lewis Fry Richardson, T − Td is the dew point deficit (°C), U is the average wind velocity at a 10 m height above the ground (m·s−1), z is the observed height (m), which is 2 m in this study, z0m is the aerodynamic roughness length (m), which is 5.858 × 10⁻³ m and 3.265 × 10⁻³ m at Xiaotang and Tazhong [48,49], respectively, and f is the Coriolis parameter, which was calculated using Equation (2):
where Ω is the rotation rate of the Earth (7.29 × 10⁻⁵ s−1) and φ is the geographic latitude.
The dew point temperature (Td in °C) was calculated using the formula:
where e is the vapor pressure (hPa), E0 is the saturated vapor pressure at 0 °C (6.1078 hPa), and a and b are coefficients equal to 7.69 and 243.92, respectively. Ri was calculated as:
where g is gravitational acceleration, 9.8 m·s−2, is the mean absolute temperature of z1 and z2 (K), and are the difference in temperature and wind speed between z1 and z2.
In this paper, Raman polarization Lidar data were obtained from continuous observations obtained at Tazhong from 7 to 15 November 2019. The Fernald method was used to calculate the extinction coefficient of the aerosols at a height of h, which was recursively calculated from the calibrated height. The calculation method was as follows (Equations (5)–(9)):
where is the Lidar resolution, is the extinction coefficient of the atmospheric molecules at height h, and is the radar signal at 532 nm (that is 532abc).
where Sa/Sm is the radar ratio between the aerosols and atmospheric molecules.
The Fernald method assumes that the extinction coefficient of atmospheric molecules and aerosols are the same at the calibration height, and a calibration height h of 7000 m was selected here.
In this study, we measured the wind speed fluctuations in the near-surface layers using CSAT3/Li-cor7500. The momentum flux (τ) and the friction velocity (u*) were obtained from the wind speed fluctuations using the Eddy Covariance Processing software.
The backward trajectory model was created by NOAA and the Bureau of Meteorology, Australia. The model is a hybrid of Euler and Lagrange computing. In the model, it is assumed that a particle’s trajectory moves with the wind field, and the trajectory is the integral of the particle in space and time, which can be used to calculate and analyze the processes of airflow movement, subsidence, transport, and diffusion of atmospheric pollutants, etc. [50]. In this study, the starting heights of the trajectories were 100, 300, and 500 m above ground level (AGL) and the time interval of the backward trajectory in the study area was 6 h (00:00, 06:00, 12:00, and 18:00 UTC (Coordinated Universal Time)).
The average PM concentrations and average meteorological properties (i.e., for each observation) were calculated from 06:00 on the 7 November to 09:00 on 15 November. Figure 2 shows the maximum and minimum values of the PM concentration and the meteorological properties below a height of 500 m during the observation periods in the TD. The variation ranges of the minimum and maximum PM1.0, PM2.5, and PM10 were 0.8–91.1, 1.0–200.7, and 1.0–763.7 µg∙m−3, respectively, with average minimum values of 7.5, 15.4, and 20.9 µg∙m−3, respectively, and average maximum values of 20.5, 39.4, and 180.9 µg∙m−3, respectively. The minimum and maximum air temperature, relatively humidity, and wind speeds ranged between –5.6 and 17.8 °C, 2.1 and 89.8 %, and 0 and 13.2 m∙s−1, respectively, during the observation period, with average minimum values of 5.4 °C, 18.7 %, and 2.1 m∙s−1, respectively, and average maximum values of 10.8 °C, 30.9 %, and 7.7 m∙s−1, respectively.
Blowing sand and floating dust were observed from 18:00 on 11 November to 12:00 on 14 November, while the other periods were clear. The PM1.0, PM2.5, and PM10 values during the sand blowing periods were 7.2, 8.4, and 6.2 times, respectively, which were greater than those during the clear periods at Tazhong (Table 2). The PM1.0, PM2.5, and PM10 values during the floating dust periods were 2.7, 4.0, and 3.8 times, respectively, which were greater than those during clear periods at Xiaotang. These suggest that the increased PM1.0 and PM2.5 values during the sand blowing periods were the greatest at Tazhong, while the increased PM2.5 and PM10 values during the floating dust periods were greatest at Xiaotang.

Table 2.
Mean values and the percentage of difference for each place and the TD recorded during the sand blowing, floating dust, and clear periods.
The air temperatures during the sand blowing and floating dust periods were 15.2–42.3%, which were greater than those during clear periods at Tazhong and Xiaotang. The wind speeds during the sand blowing and floating dust periods were 12.7–47.1%, which were greater than those during clear periods at Tazhong and Xiaotang. The relative humidity during the sand blowing period was 1/6 of that during the clear period at Tazhong, while the relative humidity during the floating dust was 18.8%, which was greater than that during clear periods at Xiaotang (Table 2). These suggest that increased air temperature and wind speeds during floating dust and sand blowing weather periods in TD decreased relative humidity during sand blowing periods at Tazhong and increased relative humidity during floating dust periods at Xiaotang.
During the sand blowing and floating dust periods, the PM1.0, PM2.5, and PM10 values increased, the humidity decreased, and the air temperature and wind speeds increased. From our data, we found that the PM1.0, PM2.5, and PM10 percentages of difference during the sand blowing periods were 422.9%, 501.5%, and 369.3%, respectively, compared to the average values of the observation period in the TD. The PM1.0, PM2.5, and PM10 percentages of difference during the floating dust periods were 175.0%, 215.3%, and 204.8%, respectively, compared to the average values of the observation period in the TD. Meanwhile, during clear periods, the PM1.0, PM2.5, and PM10 percentages of difference were −27.9%, −28.1%, and −24.8%, respectively, at Tazhong and 2.9%, −21.9%, and −20.6%, respectively, at Xiaotang, compared to the average values of the observation period in the TD. The air temperature during the sand blowing and floating dust periods were 22.2% and 28.4%, respectively, while the air temperature during the clear periods were 3.7% and −25.9%, respectively, at Tazhong and Xiaotang, compared to the average values of the observation periods in the TD. The relative humidity during the sand blowing and floating dust periods were −81.0% and −52.8%, respectively, while the relative humidity during the clear periods were 20.6% and −61.7%, respectively, at Tazhong and Xiaotang, compared to the average values of the observation period in the TD. The wind speeds during the sand blowing and floating dust periods were 73.5% and 28.6%, respectively, while the wind speeds during the clear periods were −8.2% and 12.2%, respectively, at Tazhong and Xiaotang, compared to the average values of the observation period in the TD (Table 2).
3. Results and Discussion
3.1. Atmospheric Boundary Layer Conditions
As shown in Figure 3, the mixing layer height, from 7–13 November 2019, had a height range of 1400–1700 m. The mixing layer height was larger from 11:00–17:00 during the day. In dusty weather, the stability, L, increased, the temperature decreased, the mixing layer height was lower, especially in the daytime.
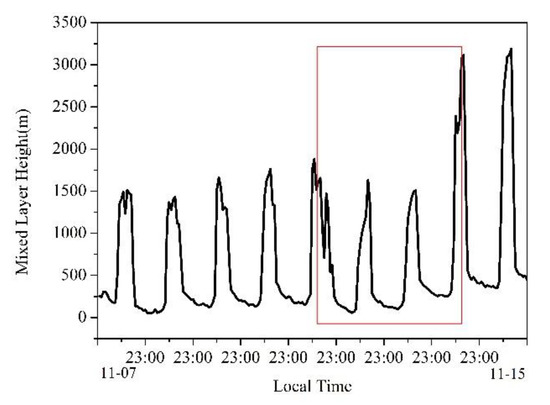
Figure 3.
Mixed layer height observed at Tazhong in the TD (Red box is dusty weather period).
Figure 4 shows the vertical spatiotemporal evolution of the extinction coefficient of the aerosols from 7–15 November 2019 at Tazhong. The aerosols were mainly concentrated below 4 km. In particular, they were concentrated below 1 km from the afternoons of 11–13 November (Figure 4).
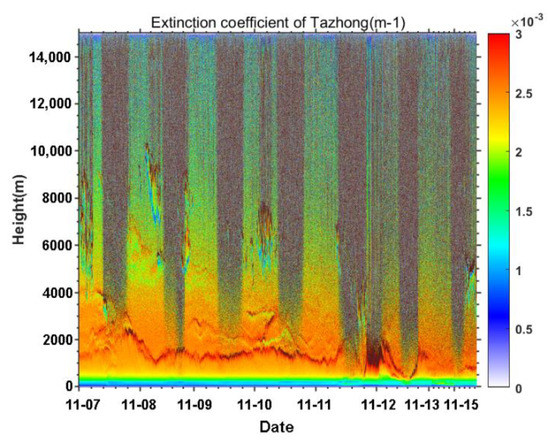
Figure 4.
Time series of the extinction coefficients during the observation periods at Tazhong in the TD.
The results of our study are consistent with the distributions of dust aerosols at heights of 3–5 km in April in the Tarim Basin, obtained by CALIPSO satellite data [51]. Meng et al. (2019) showed that the influence of an extremely thick boundary layer on the vertical structure of dust aerosols was identified at a height of 3–5 km above the ground [51]. This 3–5 km height dust aerosol layer is likely mainly caused by convergence of the near-surface over the Tarim Basin, with obstruction due to the Tibetan Plateau, and the mountains surrounding the Tarim Basin [51].
However, according the surface meteorological observation data, the weather was clear from 7 to 10 November at Tazhong and it was dusty from 11 to 13 November. During clear days, the wind speeds were low (<9 m∙s−1), which allowed the PM to remain suspended in the air. During sand dust weather, the wind speeds were high (>9 m∙s−1), which caused the PM to accumulate in the lower atmospheric layer, thereby increasing its concentration (>20, 40, and 200 µg∙m−3, respectively, for PM1.0, PM2.5, and PM10).
Figure 5 exhibits the hourly values of the momentum flux (τ) and the friction velocity (u*) during the observation periods. The momentum flux is of interest because sufficiently large fluxes can carry dust from the surface into the atmosphere. The momentum flux and the friction velocity were found to be 1.6–5200 × 10−4 kg∙m−1∙s−2 and 1.2–68.7 × 10⁻² m∙s−1 at Tazhong, respectively. The momentum flux and friction velocity were at the weakest levels before 17:00 on 11 November, which had values of <0.1 kg∙m−1∙s−2 and <0.3 m∙s−1, respectively, then reached maximum values of 0.52 kg∙m−1∙s−2 and 0.69 m∙s−1 at 21:00 on 11 November (Figure 5). At the same time, the sensible heat flux (H) increased to 102.0 W·m2, which had a daily average of 6.7 W·m2 (Figure 5), indicating that heat losses from the ground heated the lower-lying air layers.
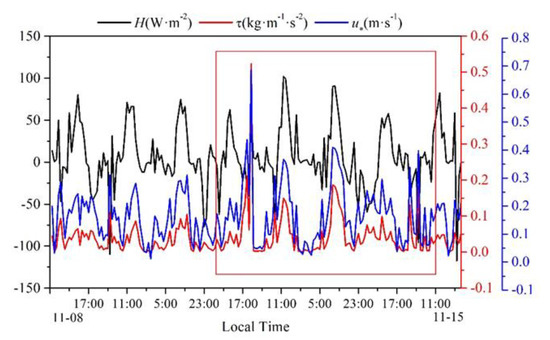
Figure 5.
Sensible heat flux (H), momentum flux (τ), and friction velocity (u*) measured during the observation periods at Tazhong in the TD (Red box is dusty weather period).
3.2. Correlations between the Vertical Profiles in the Hinterland of the TD
During the daytime, the mixed layer height was the lowest at 06:00 (Figure 2), but the PM concentration was not the highest at this time (Figure 6a–c), because PM diffusion was found to be related to the high wind speed at 06:00, in which the wind speeds ranged from 1 to 8 m∙s−1 (Figure 6f). At 09:00, the mixed layer height increased (Figure 2), and the PM concentrations above 230 m were lower than that at 06:00. PM concentrations seems to depend on the height and size. Interestingly, the PM concentrations below 150 m heights at 09:00 were higher than those at the same height at 06:00 (Figure 6a–c). Within 0–150 m, the PM concentrations decreased in height at 09:00; in particular, PM1.0 and PM2.5 decreased from 20 µg∙m−3 to 12 µg∙m−3, respectively, and from 46 µg∙m−3 to 24 µg∙m−3, respectively. The humidity and wind speed increased below 150 m heights at 09:00 (Figure 6a–c,e,f). At larger boundary layer heights (Figure 2), the PM concentrations were lower at 12:00 and 15:00 (Figure 6a–c). At 12:00 and 15:00, the air temperature decreased with height (Figure 6d). The wind speed was the largest below a height of 100 m at 15:00, which increased with the height from 4 m∙s−1 to 7.5 m∙s−1 (Figure 6f). The PM concentration was the highest at 18:00, with PM1.0, PM2.5, and PM10 concentrations between 15 and 30 µg∙m−3, 33–66 µg∙m−3, and 24–205 µg∙m−3, respectively (Figure 6a–c). At 18:00, there was also a temperature inversion, in which the air temperature fluctuated from 9–11 °C, although the inversion intensity was not as strong as at 06:00 (Figure 6d). It was found that the lower mixed layer was favorable for the accumulation of dust aerosols, where the wind speeds therein at 18:00 were low and the PM concentrations at 18:00 were the highest.
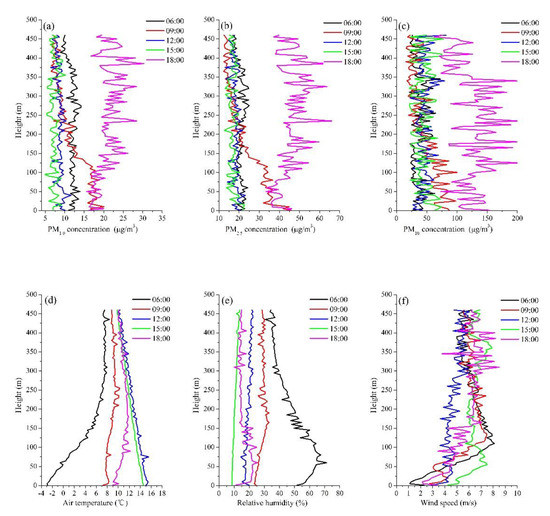
Figure 6.
Vertical profiles of the pollutants (a: PM1.0; b: PM2.5; c: PM10) and related meteorological parameters (d: Air temperature; e: Relative humidity; f: Wind speed) in the boundary layer above Tazhong during the observation periods.
Table 3 shows that the PM1.0, PM2.5, and PM10 concentrations were all positively correlated with the wind speed at Tazhong, especially above a height of 150 m, which was statistically significant at the 95% significance level. The correlation coefficients exceeded 0.5, which might suggest that the source of PM in the boundary layer was mainly floating dust. Secondly, the relationship between the PM concentration and the relative humidity was also statistically significant: PM1.0, PM2.5, and PM10 all showed a positive correlation between the relative humidity (correlation coefficients > 0.3) above a height of 300 m. However, the PM1.0, PM2.5, and PM10 concentrations showed no correlation with the air temperature.

Table 3.
Correlation coefficients between the PM1.0, PM2.5, and PM10 concentrations and the various meteorological elements at different heights above Tazhong (bold values represent those that passed the 95% significance level).
3.3. Correlations between the Vertical Profiles in the Northern Marginal Zone of the TD
During the observation periods, the PM1.0, PM2.5, and PM10 concentrations were between 3.7 and 48.5 µg∙m−3, 5.7 and 104 µg∙m−3, and 2.3 and 430.4 µg∙m−3, respectively, at Xiaotang. The daily variations of PM1.0, PM2.5, and PM10 at Xiaotang were different from those at Tazhong because sand and dust weather appeared at Xiaotang but did not appeare at Tazhong during the observation periods. The maximum values of PM1.0, PM2.5, and PM10 appeared at 15:00 at Xiaotang, and the differences between their values at other times were very small. At a height of 90–150 m at 09:00, the PM1.0 and PM2.5 concentrations suddenly increased by 23 times and 15 times, respectively (Figure 7a–c). At 09:00, a temperature inversion occurred at a height of 90 m, and the inversion strength was 1.42 °C∙100 m−1 (Figure 7d). At 09:00, the relative humidity decreased significantly with an increase of height above 130 m, decreasing by about 60% above a height of 100 m, while the relative humidity increased with an increase of height below 130 m (Figure 7e). Below a height of 150 m, the wind speed was the highest, increasing from 2.1 m∙s−1 near the ground to 10.5 m∙s−1 at 9:00. Additionally, the wind speed increased from 0.5 m∙s−1 to 10.3 m∙s−1 and increased from 3.4 m∙s−1 to 9.1 m∙s−1 at 6:00 and 15:00, respectively. The wind speed changed little with height during the other times (Figure 7f). We noticed that, at 9:00, the wind direction shifted over 150 m, from north to west, then from west to east, and then west (Figure 8). At 09:00, the high wind speed above 150 m decreased the concentrations of PM1.0 and PM2.5, but the wind speed near the surface was very small. Due to the presence of the temperature inversion above 90 m, the atmospheric was stable, while below 90 m, the atmospheric was neutral, so that the PM1 and PM2.5 concentrations were not at a maximum near the ground, but instead peaked at 90–150 m.
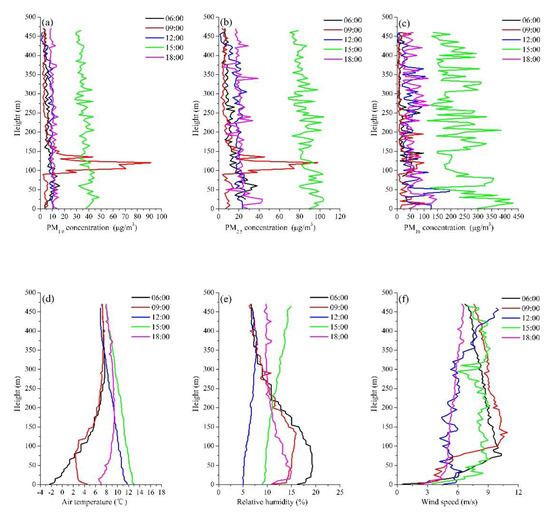
Figure 7.
Vertical profiles of the PM1.0, PM2.5, and PM10 concentrations (a: PM1.0; b: PM2.5; c: PM10) and the related meteorological parameters (d: Air temperature; e: Relative humidity; f: Wind speed) in the boundary layer above Xiaotang during the observation periods (13 November was a floating dust day).
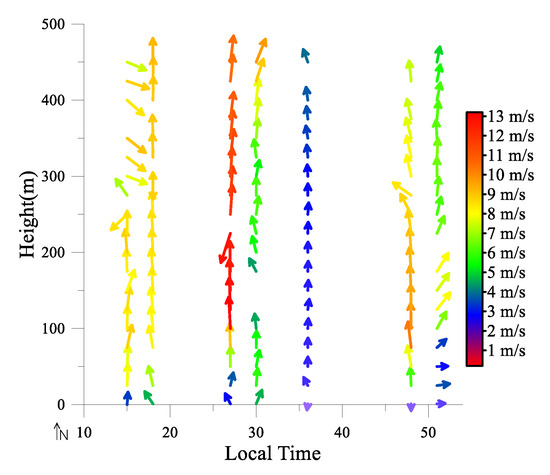
Figure 8.
Wind vector in the boundary layer above Xiaotang during the observation periods (from 15:00 on 13 November to 03:00 on 15 November 2019).
In Table 4, the PM1.0, PM2.5, and PM10 concentrations show a statistically significant positive correlation with the air temperature (correlation coefficients all >0.3), the wind speed, below a height of 150 m (correlation coefficients of 0.583, 0.468, and 0.295, respectively), and with the relative humidity above a height of 300 m (correlation coefficients of 0.809, 0.784, and 0.657, respectively). Through the correlation analysis, we found that the PM concentrations at Tazhong were closely related to the wind speed and relative humidity (Table 3), while the PM in concentrations Xiaotang were mainly affected by thermal effects (Table 4).

Table 4.
Correlation coefficients between the PM1.0, PM2.5, and PM10 concentrations and the various meteorological parameters at different heights above Xiaotang (bold values represent those that passed the 95% significance level).
As shown in Figure 9, PM2.5 concentrations less than 20 µg∙m−3 at Tazhong tended to appear when the air temperature was between 8 and 16 °C, the relative humidity was <30%, and the wind speed was between 3 and 8 m∙s−1. At 12:00 and 15:00, when the mixing layer height was the greatest, PM2.5 ≤ 20 µg∙m−3 (relative frequency above 0.8). PM2.5 concentrations in the range 20–35 µg∙m−3 tended to appear when the air temperature was <8 °C, the relative humidity was >30%, and the wind speed ranged from 1–8 m∙s−1. At 06:00, when the mixing layer height was at a minimum, the PM2.5 concentrations ranged from 20–35 µg∙m−3 (relative frequency above 0.6). PM2.5 concentrations below 35 µg∙m−3 tended to appear when the air temperature was between 12 and 16 °C, the relative humidity ranged from 10–30%, and the wind speed was between 1 and 3 m∙s−1. At 18:00, when the mixing layer height was high, PM2.5 > 35 µg∙m−3 (relative frequency was 1.0).
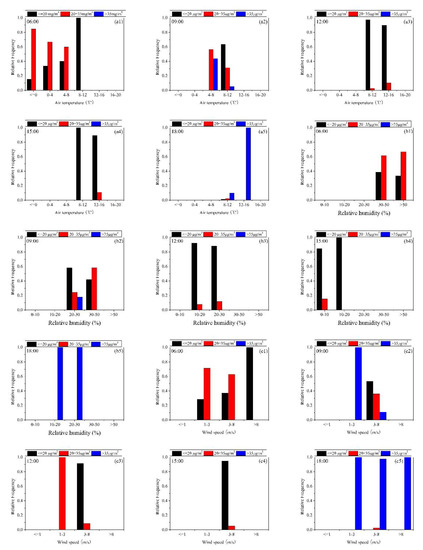
Figure 9.
Histograms of the air temperature (a1: 06:00, a2: 09:00, a3: 12:00, a4: 15:00, and a5: 18:00), relative humidity (b1: 06:00, b2: 09:00, b3: 12:00, b4: 15:00, and b5: 18:00), and wind speed (c1: 06:00, c2: 09:00, c3: 12:00, c4: 15:00, and c5: 18:00) for different PM concentrations (black columns are ≤20 µg∙m−3, red columns are 20–35 µg∙m−3, blue columns are >35 µg∙m−3) during the observation periods at Tazhong.
As shown in Figure 10, PM2.5 concentrations less than or equal to 20 µg∙m−3 at Xiaotang tended to appear when the air temperature was between 8 and16 °C and the relative humidity was <30%. At 12:00 and 15:00, when the mixing layer height was high, PM2.5 ≤ 20 µg∙m−3 (relative frequency above 0.8). PM2.5 concentrations from 20–35 µg∙m−3 tended to appear when the air temperature was <12 °C, the relative humidity was >30%, and the wind speed was <8 m∙s−1. At 06:00, when the mixing layer height was low, PM2.5 was 20–35 µg∙m−3 (relative frequency above 0.5). PM2.5 levels greater than 35 µg∙m−3 tended to appear when the air temperature was between 12 and 16 °C, the relative humidity ranged from 10–30%, and the wind speed was >3 m∙s−1. At 18:00, when the mixing layer height was high, PM2.5 > 35 µg∙m−3 (relative frequency was 1.0).
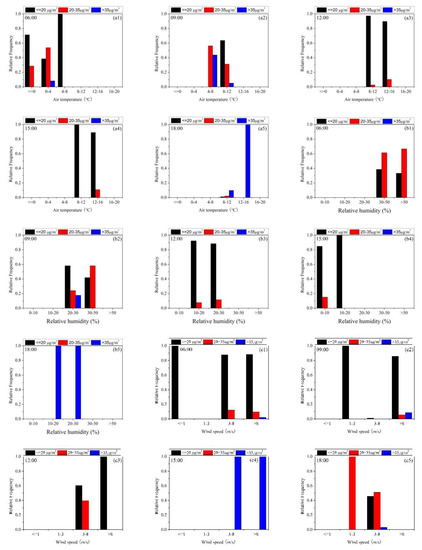
Figure 10.
Histograms of the air temperature (a1: 06:00, a2: 09:00, a3: 12:00, a4: 15:00, and a5: 18:00), relative humidity (b1: 06:00, b2: 09:00, b3: 12:00, b4: 15:00, and b5: 18:00), and wind speed (c1: 06:00, c2: 09:00, c3: 12:00, c4: 15:00, and c5: 18:00) for different PM concentrations (black columns are ≤20 µg∙m−3, red columns are 20–35 µg∙m−3, blue columns are >35 µg∙m−3) during the observation periods at Xiaotang.
3.4. Ratios of PM1.0/PM2.5 and PM2.5/PM10
Figure 11 shows that within 500 m of the boundary layer at Tazhong, the PM1.0/PM2.5 ratios were between 0.25 and 0.65 (Figure 11a) and the PM2.5/PM10 ratios were between 0.10 and 0.85 (Figure 11b). Meanwhile, the PM1.0/PM2.5 ratios at Xiaotang were between 0.40 and 0.80 (Figure 11c) and the PM2.5/PM10 ratios were between 0.10 and 1.0 (Figure 11c). In other words, there were more fine particles in the boundary layer at Xiaotang. Due to the distribution of vegetation around Xiaotang, the vegetation reduces the wind speed, so larger particles of dust cannot be blown into the air. Among them, the values of PM1.0/PM2.5 and PM2.5/PM10 were mainly larger at 06:00 and 09:00 at Tazhong and Xiaotang.
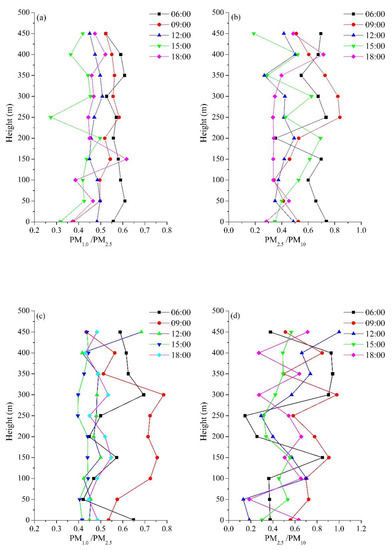
Figure 11.
Ratios of PM1.0/PM2.5 and PM2.5/PM10 in (a,b) Tazhong and (c,d) Xiaotang during the study periods.
3.5. Analysis of the Floating Dust Days
During clear periods at Tazhong, the mean concentrations of PM1.0, PM2.5, and PM10 were 6.5, 13.2, and 26.8 µg∙m−3, respectively, while during sand blowing periods, they were 74.7, 165.0, and 475.2 µg∙m−3, respectively, i.e., 11.5, 12.5, and 17.7 times larger than during the clear periods. A temperature inversion and strong westerly winds (12 m∙s−1) appeared during sand blowing periods, leading to high PM concentrations at Tazhong (Figure 12). According to the air mass data, dust came from the Tarim Basin (Figure 1) and the PM particles could not easy diffuse due to the temperature inversion.
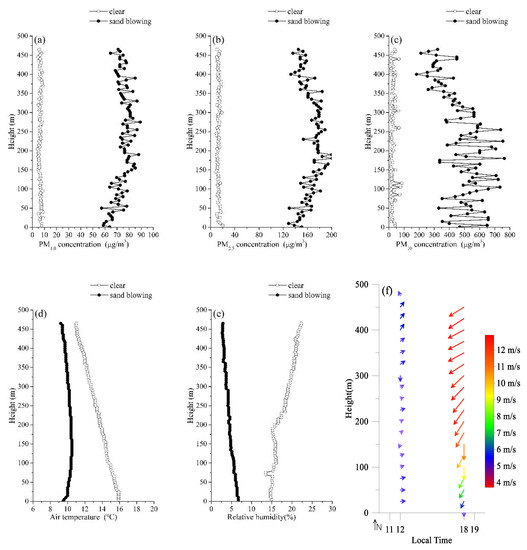
Figure 12.
Vertical profiles of the PM concentrations (a: PM1.0, b: PM2.5, and c: PM10) and the related meteorological parameters (d: air temperature, e: relative humidity, and f: vector wind) in the boundary layer on a clear period (12:00 local time, 8 November) and sand blowing period (18:00 local time, 11 November) at Tazhong.
During clear periods at Xiaotang, the mean concentrations of PM1.0, PM2.5, and PM10 were 3.6, 6.9, and 18.9 µg∙m−3, respectively, and they were 36.1, 84.8, and 235.8 µg∙m−3 during floating dust periods, respectively, which were 10.0, 12.5, and 12.5 times larger than during the clear periods. Different from Tazhong, floating dust occurred at 15:00 at Xiaotang, where a weak northern wind appeared, leading to high PM concentrations (Figure 13). At 15:00 on 13 November, the wind speed was low (<3 m∙s−1), which was conducive to the accumulation of pollutants, while at 18:00 on 14 November, the wind speed was high (>8 m∙s−1), which dispersed the pollutants (Figure 8).
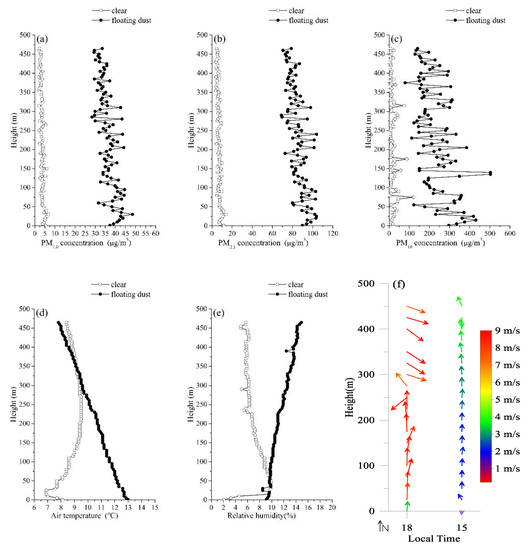
Figure 13.
Vertical profiles of the PM concentrations (a: PM1.0, b: PM2.5, and c: PM10) and the related meteorological parameters (d: air temperature, e: relative humidity, and f: vector wind) in the boundary layer during a clear period (18:00 local time, 14 November) and a floating dust period (15:00 local time, 13 November) at Xiaotang.
In Table 5, at Tazhong during clear periods, the PM1.0 concentrations showed a statistically significant positive correlation with the wind speed (the correlation coefficient was 0.404) and the air temperature (the correlation coefficient was 0.521). During sand blowing periods, the PM1.0 concentrations showed a statistically significant positive correlation with the wind speed (the correlation coefficient was 0.607), air temperature (the correlation coefficient was 0.462), and relative humidity (the correlation coefficient was 0.410). During sand blowing periods, the PM10 concentrations showed a statistically significant positive correlation with the air temperature (the correlation coefficient was 0.474) and the relative humidity (the correlation coefficient was 0.506).

Table 5.
Correlation coefficients between the PM concentrations and the various meteorological parameters during clear and dusty periods at Tazhong and Xiaotang (bold values represent those that passed the 95% significance level).
At Xiaotang, during clear periods, the PM1.0 and PM2.5 concentrations showed statistically significant positive correlations with the wind speed (the correlation coefficients were 0.623 and 0.591, respectively), air temperature (the correlation coefficients were 0.664 and 0.613, respectively), and relative humidity (the correlation coefficients were 0.442 and 0.402, respectively). During floating dust periods, the PM1.0 and PM2.5 concentrations showed statistically significant positive correlations with the wind speed (the correlation coefficients were 0.587 and 0.560, respectively) and the air temperature (the correlation coefficients were 0.562 and 0.652, respectively).
The ratios of PM1.0/PM2.5 and PM2.5/PM10 during the clear periods were larger than those during the dusty periods in the TD. At Tazhong, the ratios of PM1.0/PM2.5 during clear periods were close to those during the sand blowing periods, between 0.40 and −0.55, although the ratios of PM2.5/PM10 differed greatly, among which the ratios during the clear periods were between 0.25 and 0.85 and those during the sand blowing periods were between 0.25 and 0.70 (Figure 14a,b). At Xiaotang, the ratios of PM1.0/PM2.5 during clear periods and floating dust periods were 0.40–0.65 and 0.40–0.45, respectively. Meanwhile, the ratios of PM2.5/PM10 during clear periods and floating dust periods were 0.40–0.90 and 0.30–0.55, respectively (Figure 14c,d).
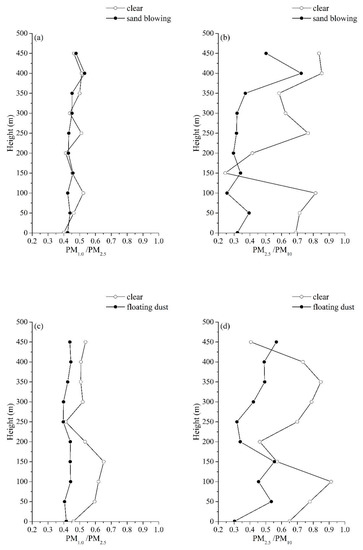
Figure 14.
Ratios of PM1.0/PM2.5 and PM2.5/PM10 during the clear period (12:00 local time, 8 November) and a sand blowing period (18:00 local time, 11 November) at Tazhong (a,b) and during a clear period (18:00 local time, 14 November) and a floating dust period (15:00 local time, 13 November) at Xiaotang (c,d).
3.6. Characteristics of Air Mass Backward Trajectory
Figure 15a shows that during the sand blowing period, from 20:00 on 9 November to 20:00 on 11 November, the air mass above 4500 m at Tazhong was from Russia and Kazakhstan. The air mass showed a sinking movement, bringing dust. The air mass below 1500 m was from a local area of the TD. Figure 15b shows the air mass coming from Xinjiang and the TD during the clear period at Tazhong. Figure 15c shows that during the floating dust period, from 18:00 on 10 November to 06:00 on 11 November, there was an upward movement of an air mass, which moved southward from the northern margin of the basin to the southern margin of the basin at Xiaotang. At 12:00 on 11 November and 0:00 on 12 November, the airflow appeared to undergo a second lift, reaching a height of 1500 m. From 0:00 on 12 November to 9:00 on 13 November, the air mass showed a sinking movement and was blocked by the mountainous terrain along the northern margin of the basin. The airflow then turned toward the northwest and a 100 m air mass came from the east of the Tarim Basin and passed through the hinterland of the TD, which carried in more sand and dust. Additionally, 300 m and 500 m gas masses came from the northern Tarim Basin. Figure 15d shows lower and upper air masses coming from northwest Xinjiang and the TD during the clear period at Xiaotang.
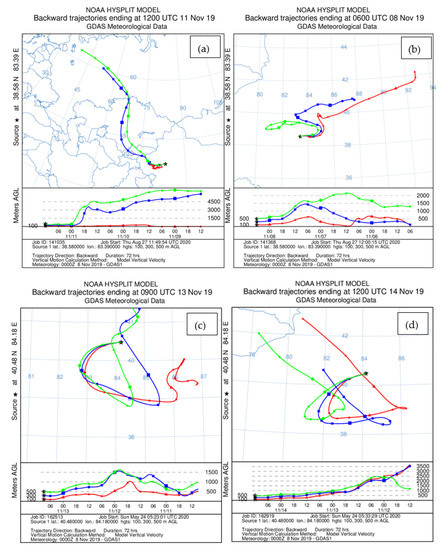
Figure 15.
Backward trajectory of the air mass calculated at (a) 12:00 UTC (Coordinated Universal Time) on 11 November (floating dust period), 2019, at Tazhong; (b) 06:00 UTC on 8 November (clear period), 2019, at Tazhong; (c) 09:00 UTC on 13 November (sand blowing period), 2019, at Xiaotang; (d) 12:00 UTC on 14 November (clear period), 2019, at Xiaotang.
That is, during the dusty period, the air mass was mainly from the north and east and the local air mass at Xiaotang and Tazhong. Around the TD and in northern Xinjiang, there are important agricultural oasis belts, power plants, cement industrial zones, and coal and petroleum processing plants. In particular, along the north of Tianshan Mountain is an important economic active zone in Xinjiang, and petroleum processing bases are distributed to the south of Tianshan Mountain, north of the desert, and the surrounding areas in the west. Dust aerosols and other pollutants emitted by these industrial and agricultural activities will inevitably affect desert areas as the air mass moves. In addition, the headwaters of the Xinjiang climate in northern Kazakhstan and Russia’s southern region has a large number of fire points. As the air mass moves southward, dust aerosols from biomass combustion are bound to be transferred downstream to areas such as the TD. According to the backward trajectory tracking analysis above, dust aerosols generated by human activities in the above areas, along with the movement of the westerly belt, make a major contribution to the dust aerosols in this desert area [52].
4. Conclusions
The vertical structure characteristics of the concentrations of PM1.0, PM2.5, and PM10 were analyzed in conjunction with meteorological data collected during November 2019 from UAV observations in the TD. The conclusions of this study are summarized as follows:
- (1)
- The variation ranges of PM1.0, PM2.5, and PM10 were 0.8–91.1, 1.0–200.7, and 1.0–763.7 µg∙m−3, respectively, during the observation period in the TD. The concentrations of PM in the hinterland of the TD (Tazhong) were higher than those along the northern margin of the TD (Xiaotang). The PM1.0, PM2.5, and PM10 concentrations during sand blowing periods were 11.5, 12.5, and 17.7 times larger than in the clear period at Tazhong, and they were 10.0, 12.5, and 12.5 times greater, respectively, at Xiaotang.
- (2)
- Fine particles dominated the boundary layer’s PM composition along the northern margin of the TD, and coarse particles dominated in the hinterland of the TD. The PM1.0/PM2.5 ratios (0.40–0.80) and PM2.5/PM10 ratios (0.10–1.0) at Xiaotang were higher than those at Tazhong (0.25–0.65 for PM1.0/PM2.5 and 0.10–0.85 for PM2.5/PM10). Fine particles dominated the boundary layer’s PM composition during clear periods, and coarse particles dominated during floating dust and sand blowing periods. During the clear period, the ratios of PM1.0/PM2.5 (0.4–0.55 at Tazhong and 0.4–0.65 at Xiaotang) and PM2.5/PM10 (0.25–0.85 at Tazhong and 0.4–0.9 at Xiaotang) were larger than the ratios during the sand blowing and floating dust periods (0.4–0.55 for PM1.0/PM2.5 and 0.25–0.7 for PM2.5/PM10 at Tazhong; 0.4–0.45 for PM1.0/PM2.5 and 0.3–0.55 for PM2.5/PM10 at Xiaotang).
- (3)
- The PM vertical profile concentrations were significantly affected by the boundary layer height and the considered meteorological factors. When the boundary layer height was higher at 12:00 LST (Local Standard Time) and 15:00, the PM concentration was the lowest in the TD. Moreover, at 12:00 and 15:00, the PM was dominated by low concentrations (≤20 µg∙m−3), while at 18:00, it was dominated by high concentrations (>35 µg∙m−3). When the boundary layer height was lower at 06:00 and 09:00, the values of PM1.0/PM2.5 and PM2.5/PM10 were larger.
- (4)
- Lower concentrations of PM (≤20 µg∙m−3) required air temperature of 8–16 °C and relative humidity < 30%. Higher concentrations of PM (>35 µg∙m−3) required air temperature of 12–16 °C and relative humidity of 10–30%. However, when the PM levels were between 20 and 35 µg∙m−3, higher air temperatures were recorded at Xiaotang (<12 °C) than at Tazhong (<8 °C). Under these conditions, the relative humidity (>30%) and wind speeds (<8 m∙s−1) were similar at both locations.
- (5)
- The concentration of PM at Tazhong was closely related to the wind speed (the highest coefficient correlation was 0.622) and the relative humidity (the highest coefficient correlation was 0.385), while the concentration of PM at Xiaotang was closely related to the air temperature (the highest coefficient correlation was 0.733), indicating that the influence of dust in the boundary layer above Xiaotang was related to thermal action, while the influence of dust in the boundary layer above Tazhong was related to dynamic action. On floating dust days, the PM concentrations were mainly affected by the wind speed, air temperature, and humidity at Tazhong, whereas they were affected by the wind speed and air temperature at Xiaotang.
Author Contributions
L.J. conceived and designed the analysis. L.J. and Q.H. analyzed the data. L.J. processed the data. L.J., H.J., J.X., Q.Z., S.Z., Z.L., and J.Z. observed and collected the data in the Taklimakan Desert. L.J. wrote the paper. All authors have read and agreed to the published version of the manuscript.
Funding
This study was supported by the National Natural Science Foundation of China (Grant Nos. 41830968, 41605008) and Xinjiang High-level Personnel funding (2016, 2017).
Conflicts of Interest
The authors declare no conflict of interest.
References
- Liu, X.C.; Zhong, Y.T.; He, Q.; Yang, X.H.; Ali, M.M.T.M. Vertical distribution of dust aerosol mass concentration in Hinterland of the Taklimakan Desert. J. Desert Res. 2012, 32, 1045–1052. (In Chinese) [Google Scholar]
- Charlson, R.J.; Heintzenberg, J. Aerosol Forcing of Climate; John Wiley & Sons: Hoboken, NJ, USA, 1995. [Google Scholar]
- Houghton, J.T.; Ding, Y.; Griggs, D.J.; Noguer, M.; van der Linden, P.J.; Dai, X.; Maskell, K.; Johnson, C.A. Climate Change 2001: The Scientific Basis; Cambridge University Press: Cambridge, UK, 2001. [Google Scholar]
- Zender, C.S.; Miller, R.L.; Tegen, I. Quantifying mineral dust mass budgets: Terminology, constraints, and current estimates. Eos 2004, 85, 509–512. [Google Scholar] [CrossRef]
- Mahowald, N.M.; Engelstaedter, S.; Luo, C.; Sealy, A.M.; Artaxo, P.; Benitez-Nelson, C.R.; Bonnet, S.; Chen, Y.; Chuang, P.Y.; Cohen, D.D.; et al. Atmospheric Iron Deposition: Global Distribution, Variability, and Human Perturbations. Annu. Rev. Mar. Sci. 2009, 1, 245–278. [Google Scholar] [CrossRef] [PubMed]
- Cheng, T.T.; Shen, Z.B. A Numerical Simulation of Optical Characteristics for Atmospheric Dust Aerosols in Northwest China. Plateau Meteorol. 2001, 20, 291–297. [Google Scholar]
- Tegen, I.; Lacis, A.A.; Fung, I. The influence on climate forcing of mineral aerosols from disturbed soils. Nature 1996, 380, 419–422. [Google Scholar] [CrossRef]
- Creamean, J.; Suski, K.J.; Rosenfeld, D.; Cazorla, A.; DeMott, P.; Sullivan, R.; White, A.B.; Ralph, F.M.; Minnis, P.; Comstock, J.; et al. Dust and Biological Aerosols from the Sahara and Asia Influence Precipitation in the Western U.S. Science 2013, 339, 1572–1578. [Google Scholar] [CrossRef]
- Carslaw, K.; Boucher, O.; Spracklen, D.V.; Mann, G.; Rae, J.G.L.; Woodward, S.; Kulmala, M. A review of natural aerosol interactions and feedbacks within the Earth system. Atmos. Chem. Phys. Discuss. 2010, 10, 1701–1737. [Google Scholar] [CrossRef]
- Qiu, J.H.; Sun, J.H. Optically remote sensing of the dust storm and result analysis. Sci. Atmos. Sin. 1994, 18, 1–9. (In Chinese) [Google Scholar]
- Liu, C.; Zhao, T.L.; Xiong, J.; Liu, Y.; Han, Y.X.; Liu, F. A simulated climatology of dust aerosol emissions over 1991–2010 and the influencing factors of atmospheric circulation over the major deserts in the world. J. Desert Res. 2015, 35, 959–970. (In Chinese) [Google Scholar]
- Yue, P.; Niu, S.J.; Shen, J.G.; Ge, Z.P. Observation and analysis of micro meteorology parameters and PM10 for an ultra strong dust-storm. J. Nat. Disasters 2009, 18, 118–123. (In Chinese) [Google Scholar]
- He, Q.; Jin, L.L.; Yang, X.H.; Liu, X.C.; Li, Z.J.; Liu, Q. Analysis on O3 Concentration and Affecting Factors for Boundary-Layer in Hinterland of Taklimakan Desert in Autumn. Plateau Meteorol. 2010, 29, 214–221. (In Chinese) [Google Scholar]
- He, Q.; Liu, Q.; Yang, X.H.; Ali, M.; Huo, W.; Liang, Y. Profiles of atmosphere boundary layer ozone in winter over Hinterland of Taklimakan Desert. J. Desert Res. 2010, 30, 909–916. (In Chinese) [Google Scholar]
- Zhang, X.Y.; Arimoto, R.; An, Z.S. Dust emission from Chinese desert sources linked to variations in atmospheric circulation. J. Geophys. Res. 1997, 102, 28041–28047. [Google Scholar] [CrossRef]
- Perry, K.D.; Cliff, S.; Jimenez-Cruz, M.P. Evidence for hygroscopic mineral dust particles from the Intercontinental Transport and Chemical Transformation Experiment. J. Geophys. Res. Space Phys. 2004, 109. [Google Scholar] [CrossRef]
- Yan, H.; Jiao, M.Y.; Bi, B.G.; Zhang, C.C. Observation on sand-dust aerosol in center of Taklimakan Desert. J. Desert Res. 2006, 26, 389–393. (In Chinese) [Google Scholar]
- Li, X. Effects of meteorological factors on optical properties of aerosol in Urumqi. Arid Zone Res. 2006, 23, 484–488. (In Chinese) [Google Scholar]
- Chan, C.K.; Yao, X. Air pollution in mega cities in China. Atmos. Environ. 2008, 42, 1–42. [Google Scholar] [CrossRef]
- Xin, J.; Zhang, Q.; Wang, L.; Gong, C.; Wang, Y.; Liu, Z.; Gao, W. The empirical relationship between the PM2.5 concentration and aerosol optical depth over the background of North China from 2009 to 2011. Atmos. Res. 2014, 138, 179–188. [Google Scholar] [CrossRef]
- Quan, J.; Tie, X.; Zhang, Q.; Liu, Q.; Li, X.; Gao, Y.; Zhao, D. Characteristics of heavy aerosol pollution during the 2012–2013 winter in Beijing, China. Atmos. Environ. Times 2014, 88, 83–89. [Google Scholar] [CrossRef]
- Wu, D.; Tie, X.X.; Deng, X. Chemical characterizations of soluble aerosols in southern China. Chemosphere 2006, 64, 749–757. [Google Scholar] [CrossRef]
- Fan, S.; Wang, B.; Tesche, M.; Engelmann, R.; Althausen, A.; Liu, J.; Zhu, W.; Fan, Q.; Li, M.; Ta, N.; et al. Meteorological conditions and structures of atmospheric boundary layer in October 2004 over Pearl River Delta area. Atmos. Environ. 2008, 42, 6174–6186. [Google Scholar] [CrossRef]
- Fan, S.J.; Fan, Q.; Yu, W.; Luo, X.Y.; Wang, B.M.; Song, L.L.; Leong, K.L. Atmospheric boundary layer characteristics over the Pearl River Delta, China, during the summer of 2006: Measurement and model results. Atmos. Chem. Phys. Discuss. 2011, 11, 6297–6310. [Google Scholar] [CrossRef]
- Deng, X.J.; Wu, D.; Yu, J.; Lau, A.K.H.; Li, F.; Tan, H.; Yuan, Z.; Ng, W.M.; Deng, T.; Wu, C.; et al. Characterization of secondary aerosol and its extinction effects on visibility over the Pearl River Delta Region, China. J. Air Waste Manag. Assoc. 2013, 63, 1012–1021. [Google Scholar] [CrossRef] [PubMed]
- Lan, Z.; Zhang, B.; Huang, X.; Zhu, Q.; Yuan, J.; Zeng, L.; Hu, M.; He, L. Source apportionment of PM 2.5 light extinction in an urban atmosphere in China. J. Environ. Sci. 2018, 63, 277–284. [Google Scholar] [CrossRef] [PubMed]
- Zhang, T.; Zhu, Z.; Gong, W.; Xiang, H.; Li, Y.; Cui, Z. Characteristics of Ultrafine Particles and Their Relationships with Meteorological Factors and Trace Gases in Wuhan, Central China. Atmosphere 2016, 7, 96. [Google Scholar] [CrossRef]
- Li, Z.; Lei, L.; Chan, P.; Biling, L.; Lijie, Z. Why the number of haze days in Shenzhen, China has reduced since 2005: From a perspective of industrial structure. Mausam 2018, 1, 45–54. [Google Scholar]
- Liu, X.C.; Zhong, Y.T.; He, Q.; Yang, X.H. Spatio-temporal pattern of PM10 concentration and impact factors in the Hinterland and surrounding area of Taklimakan Desert. J. Desert Res. 2011, 31, 323–330. (In Chinese) [Google Scholar]
- Liu, X.C.; Zhong, Y.T.; He, Q. Analysis on mass concentration of atmospheric particulate matter and its influencing factors in sandstorm process in the Taklimakan Desert Hinterland. J. Desert Res. 2011, 31, 1548–1553. (In Chinese) [Google Scholar]
- Cao, J.; Shen, Z.; Chow, J.C.; Qi, G.; Watson, J.G. Seasonal variations and sources of mass and chemical composition for PM10 aerosol in Hangzhou, China. Particuology 2009, 7, 161–168. [Google Scholar] [CrossRef]
- Kang, X.F.; Zhang, J.H.; Liu, H.H. Influences of sandy weather on city’s air quality in China: Scope and scale. Res. Sci. 2002, 24, 1–4. (In Chinese) [Google Scholar]
- Xi, X.X.; Li, J.; Quan, J.N. Study on the mass concentration of the atmospheric dust and aerosol over Lanzhou city in spring. Arid Zone Res. 2004, 21, 112–116. (In Chinese) [Google Scholar]
- Huo, W.; Li, X.; Ali, M. Analysis on the features of sandstorms in the Tarim Basin in spring 2004. Arid Zone Res. 2006, 23, 210–215. (In Chinese) [Google Scholar]
- Liu, Z.D.; Liu, J.G.; Wang, B.; Lu, F.; Huang, S.; Wu, D.; Han, D. Observation Aerosol observation in Fengtai area, Beijing. Particuology 2008, 6, 214–217. [Google Scholar] [CrossRef]
- Zhang, R.J.; Xu, Y.F.; Han, Z.W. Inorganic chemical composition and source signature of PM2.5 in Beijing during ACE—Asia period. Chin. Sci. Bull. 2003, 48, 1002–1005. [Google Scholar] [CrossRef]
- Zhang, R.J.; Han, Z.W.; Cheng, T.T. Chemical properties and origin of dust aerosols in Beijing during springtime. Particuology 2009, 7, 61–67. [Google Scholar] [CrossRef]
- Guo, J.H.; Rahn, K.A.; Zhuang, G.S. A mechanism for the increase of pollution elements in dust storms in Beijing. Atmos. Environ. 2004, 38, 855–862. [Google Scholar] [CrossRef]
- Tao, J.; Ho, K.F.; Chen, L.; Zhu, L.; Han, J.; Xu, Z. Effect of chemical composition of PM2.5 on visibility in Guangzhou, China, 2007 spring. Particuology 2009, 7, 68–75. [Google Scholar] [CrossRef]
- Li, X.X.; Shen, Z.X.; Cao, J.J.; Liu, S.; Zhu, C.; Zhang, T. Distribution of carbonaceous aerosol during spring 2005 over the Horqin Sand land in northeastern China. Particuology 2006, 4, 316–322. [Google Scholar] [CrossRef]
- Li, J.C.; Dong, Z.B.; Wang, X.M.; He, S. Seasonal distribution and causes of dust events in Tarim Basin, China. J. Desert Res. 2008, 28, 142–148. (In Chinese) [Google Scholar]
- Wang, M.Z.; Wei, W.S.; Yang, L.M.; Li, Y.H.; Xiao, S.J.; Ali, M. Analysis on circulating dynamical structure of a strong sand-dust storm case from east in Tarim Basin. J. Desert Res. 2008, 28, 370–376. (In Chinese) [Google Scholar]
- Shen, J.G.; Liu, F.; Niu, S.J. Successive observation and analysis of TSP concentration in a sand-dust storm case. J. Desert Res. 2006, 26, 786–791. (In Chinese) [Google Scholar]
- Gao, W.D.; Yuan, Y.J.; Liu, H.Z.; Wei, W. Status of dust sources and aerosol formatting condition analysis in Xinjiang. J. Desert Res. 2008, 28, 969–973. (In Chinese) [Google Scholar]
- Yang, X.; Mamtimin, A.; He, Q.; Liu, X.; Huo, W. Observation of saltation activity at Tazhong area in Taklimakan Desert, China. J. Arid. Land 2012, 5, 32–41. [Google Scholar] [CrossRef]
- Yang, X.; Shen, S.H.; Yang, F.; He, Q.; Ali, M.; Huo, W.; Liu, X. Spatial and temporal variations of blowing dust events in the Taklimakan Desert. Theor. Appl. Clim. 2015, 125, 669–677. [Google Scholar] [CrossRef]
- Nozaki, K.Y. Mixing Depth Model Using Hourly Surface Observations; Report 7053; USAF Environmental Technical Application Center: Scott Air Force Base, IL, USA, 1973. [Google Scholar]
- Jin, L.; Li, Z.; He, Q.; Liu, Y.; Mamtimin, A.; Liu, X.; Huo, W.; Xin, Y.; Zhang, J.; Zhou, C. Observed Key Surface Parameters for Characterizing Land–Atmospheric Interactions in the Northern Marginal Zone of the Taklimakan Desert, China. Atmosphere 2018, 9, 458. [Google Scholar] [CrossRef]
- Liu, Y.Q.; Ali, M.; He, Q. Modification of Key Parameters in CoLM. Arid Zone Res. 2014, 31, 611–618. (In Chinese) [Google Scholar]
- Stein, A.; Draxler, R.R.; Rolph, G.D.; Stunder, B.J.B.; Cohen, M.D.; Ngan, F. NOAA’s HYSPLIT Atmospheric Transport and Dispersion Modeling System. Bull. Am. Meteorol. Soc. 2015, 96, 2059–2077. [Google Scholar] [CrossRef]
- Meng, L.; Yang, X.; Zhao, T.; He, Q.; Lu, H.; Mamtimin, A.; Huo, W.; Yang, F.; Liu, C. Modeling study on three-dimensional distribution of dust aerosols during a dust storm over the Tarim Basin, Northwest China. Atmos. Res. 2019, 218, 285–295. [Google Scholar] [CrossRef]
- Huang, K.; Lin, Y.; Wang, Q.; Huang, J.; Li, J.; Xue, F.; Zhuang, G. Characteristics and source of black carbon over Taklimakan Desert. Sci. Sin. Chim. 2010, 40, 556–566. [Google Scholar] [CrossRef]
© 2020 by the authors. Licensee MDPI, Basel, Switzerland. This article is an open access article distributed under the terms and conditions of the Creative Commons Attribution (CC BY) license (http://creativecommons.org/licenses/by/4.0/).