Article

Car Wake Flows and Ultrafine Particle Dispersion: From Experiments to Modelling

1
Department of Mechanical Engineering, ESTACA West Campus, Rue Georges Charpak, 53000 Laval, France
2
Department of Mechanical Engineering, ESTACA Paris Saclay Campus, 12 Avenue Paul Delouvrier, 78066 Saint Quentin en Yvelines, France
3
Department of Geotechnics, Environment, Natural Risks and Earth Sciences, University Gustave Eiffel, IFSTTAR, Boulevard Newton, 77447 Marne La Vallée, France
*
Author to whom correspondence should be addressed.
Atmosphere 2020, 11(1), 39; https://doi.org/10.3390/atmos11010039
Submission received: 3 December 2019 / Revised: 17 December 2019 / Accepted: 26 December 2019 / Published: 28 December 2019
(This article belongs to the Special Issue Wake Flows and Air Quality in the Atmosphere)

Abstract

:
Improving air quality in urban environments and transportation systems is crucial. Concerns are related to health and environmental issues associated with huge costs. Car cabin is a microenvironment where pollutants can accumulate with possible risks for occupants. In automotive engineering, it has then become mandatory to study the path and dispersion of such pollutants emitted from the tailpipe of a car. In the present paper, the relation between the flow topology and the dispersion of ultrafine particles (UFP) in the wake of a vehicle is discussed. Experiments were undertaken at a reduced scale using simplified car models. Experimental conditions were defined to be representative of a vehicle in an urban environment. Based on experimental data, a simplified analytical model is developed, which aims at describing the concentration fields of UFP in the wake of a single vehicle for different rear slant angles. The strengths and limits of the present model are discussed and ways of improvements are suggested. Additional experiments are presented to assess the influence of the inter-vehicle distance on this recirculation region. Critical inter-vehicle distances were determined based on defined criteria for different rear slant angles of the leading vehicle and compared to safety clearances.

1. Introduction

All around the world, people are sensitized to air quality. Its severe deterioration is particularly harsh in ground transportation systems. In the past ten years, many reports and papers were published on that topic by scientific institutes and researchers. Some of them were interested in describing the emissions of pollutants depending on the fleet and the traffic load [1], the exposure of people including commuters, cyclists, pedestrians and drivers [2,3,4,5,6], the pollutant levels in cars cabins [7,8,9,10] and the effects of ventilation settings on them [11,12], in buses or near roads. Others discussed the toxicity of pollutants as well as their harmful health effects [13,14,15,16,17,18,19]. This issue has become crucial. Indeed, in 2012, tailpipe emissions from Diesel engines were classified as carcinogenic [20]. In her recent study, Valentino [21] suggested that diesel engine exhaust alters placental function and induces intergenerational effects in rabbits. From a general point of view, pollutants are emitted in the atmosphere by different sources such as industries and manufactories, agriculture, heating systems, green waste burning and transports (ground, sea, air). Focusing on ground transportation systems such as cars, buses and trains, pollutants can be either particles including fine (FP, PM2.5), ultrafine (UFP, PM0.1) and nanoparticles (PM0.05) or gases such as carbon dioxid (CO2), ozone (O3), nitrogen oxide (NO) and nitrogen dioxid (NO2). Note that PMX refers to Particulate Matter with an aerodynamic diameter less than x µm regardless of their chemical composition or physical aspect. Among particles, UFP and nanoparticles are particularly dangerous since they can penetrate more deeply in the respiratory and circulatory systems (lung, pulmonary alveoli) and in the brain leading (but not limited) to cancers, heart and neurological diseases [5,13,15,22,23]. According to the French Environment and Energy Management Agency [24], 15% of PM10 come from Diesel engines and dust produced by roads, brakes and tyres. Depending on weather conditions, pollution peaks can be reached above the alert levels. For instance, in the Ile de France region (Paris and suburbs, France), regulations are defined by an inter-prefectoral order (n°2016-01383, 19 December 2016) and set as 80 µg/m3 daily for PM10. In France, people are aware of that since traffic restrictions are taken when thresholds are exceeded and recommendations are provided to young and older people. As an example, limitation of outdoor activities is suggested. Being exposed to high pollution levels for a long period of time is hazardous. Recent studies pointed out the increase of cardiovascular diseases, asthma or cancer [5,15,25]. In urban environments, outside concentrations of pollutants can be enhanced by street architecture (canyon streets for instance) as well as by the increasing number of vehicles and traffic jam [2]. On the one way, not only pedestrians, cyclists, drivers and car passengers are exposed but also workers in building and kids at school. It was clearly shown that UFP can penetrate into building through cracks [26,27], windows and leakages [28]. On the other way, car cabins can be considered as microenvironments where pollutants can accumulate. As a matter of fact, it was shown that commuters can be exposed to high levels of pollutants inside their vehicle depending on different factors such as the age of the vehicle, the ventilation settings and the outdoor levels [2,3,4,9,10,11,29,30,31]. These results were underlined by Mehel et al. [11]. Based on a large set of on board measurements in and around Paris (France), they quantified the concentration of particles in mass and number in the car cabin for a wide range of conditions. They pointed out the key role of the ventilation settings, the topology of the roads (highways, ring road…) and the road infrastructures. For example, tunnels were always associated with an important increase of inside levels for particles when the air intakes are open. It means that the outside concentration strongly influences the levels at which drivers and passengers are exposed. A key point is then to assess how these particles disperse in the wake of the emitting vehicle and how they disseminate in the surrounding environment. In other words, understanding the interaction between the flow topology and particles is essential as it is obviously connected to their capability to infiltrate the following vehicle. Campagnolo et al. [32] demonstrated the major role of the leading vehicle emissions on the in-vehicle airborne fine and ultrafine particulate matter exposure. They concluded that reducing the emissions of vehicles was mandatory to decrease human in-cabin exposures during urban and suburban driving conditions and to improve the air quality in traffic environments. This is crucial since reduction in PM10 concentrations has an impact on human mortality [23]. Depending on the ventilation settings, Mehel et al. [11] indicated that the traffic load plays an important role. In other words, the inter-vehicle distance should be a parameter, which role should be evaluated more accurately. The present paper deals on that issue. The main goal is to study the interaction between wake flows and ultrafine particle dispersion. An experimental campaign in a wind tunnel was undertaken at a reduced scale using simplified car models known as Ahmed bodies. These models were first proposed by [33]. From a fluid mechanics point of view, [34] indicated that the governing parameter of the flow developing in the wake of such models is the rear slant angle (φ). Having a unique shape for the front face, these models are easily machinable and cheap. Over the last two decades, they have been intensively studied numerically [35,36,37] and experimentally [38,39,40,41,42,43,44,45,46,47,48,49]. Numerical studies were mostly interested in discussing the influence of turbulence models, aspect ratio and stilts on the flow features. Wind tunnel measurements provided information regarding the sensitivity to experimental conditions (sharp versus rounded edges for instance), the recirculation region and the vortices developing in the wake (positions, centres). Altogether, they showed that different flow topologies can be reproduced depending on the rear slant angles representing real situations. This point will be developed in the second section. Working with such car models is then relevant. Based on experimental data, the dispersion of UFP in the wake of different car models is studied and a simplified analytical model capable of depicting this dispersion is presented. Note that coagulation and condensation are out of the scope and not considered.
In the second section, the experimental facilities, the selection of three car models and measurement techniques are detailed. In the third section, the relations between the flow topology and the concentration fields of UFP in the wake of a single simplified car model are discussed for conditions representing an urban environment. The proposed model is developed and assessed. Its accuracy is discussed and possible improvement suggested. Then, the role of the inter-vehicle distance on the main properties of the wake flow is discussed depending on the rear slant angle of the leading vehicle. Potential consequences on particle dispersion are exposed when two vehicles interact. In the last section, conclusions and perspectives are presented.

2. Experimental Facilities and Measurement Techniques

2.1. Experimental Facilities

The experiments were carried out in the open wind tunnel located at ESTACA West Campus (Laval, France). The test section has a length Lwt = 1 m, a width lwt = 0.3 m and a height Hwt = 0.3 m. The flow is generated by a 3 kW engine situated at the downstream end of the facility. The maximum velocity for the air flow is Umax = 40 m/s. Before entering the test section, the air flow passes through a convergent with a 1:16 ratio. It constraints and ensures a 1D incoming flow. In the empty test section, the ratio between the horizontal component of the velocity (U) and the vertical one (V) is larger than 20. Out of the boundary layers, the turbulent intensity is about 1% and the horizontal gradient is less than 3.5%. The boundary layer thickness does not exceed 12 mm at the end of the test section. Walls are made of transparent PMMA. It allows the use of optical devices such as LASER Doppler Velocimetry (LDV) for velocity measurements.
For the car models, the simplified geometry called the Ahmed body was selected from the literature review. As mentioned above, the key parameter is the rear slant angle. Three main classes exist, which correspond to different flow topologies in the wake of these vehicles [34]:
  • For φ < ~10°: the wake flow is defined as “squareback” and it is considered as 2D away from the walls. Experimental studies were provided by [38,39,40,41];
  • For ~10° < φ < ~30°: the wake flow is defined as “fastback”. Due to the interactions between vertical structures, the flow is highly 3D. For φ = 25°, interesting results come from [42,43,44,45,46,47,48];
  • For φ > ~30°: the wake flow is closed to that observed for φ < ~10°. It is then almost 2D away from the walls. For φ = 35°, the contributions of Tunay et al. [42], Wang et al. [47] are among the most cited references.
Whatever the rear slant angle, a recirculation region develops in the close wake. This region is larger for φ = 0° and smaller for φ = 25°. In this latter case, it is mainly explained by the flow attachment on the rear slant. Nevertheless, manufacturing conditions can influence this behaviour [49]. For φ = 35°, the situation is intermediate.
Considering the dimensions of the experimental facility, working with car model at scale 1 is not possible. Reduced scaled models were then designed. In order to avoid wall effects, the main criterion was focused on the aspect ratio (AR). It is given by Equation (1):
AR = h   ×   l l w t   ×   H w t   ,
where h and l are the height and the width of the car models, respectively.
If AR is below 6% [50], then no correction of the velocity measurements are expected due to the wall effects. According to the original shape proposed by Ahmed et al. [33], the dimensions of the models were defined as h = 0.054 m (height) and l = 0.073 m (width). The length of the vehicle was L = 0.196 m. With respect to the original model, the scale of the present models is 1:5.3 for an AR of 4.8%. Three car models were built with rear slant angles of 0° (squareback model), 25° and 35°. For each vehicle, four stilts were manufactured to fix the car on the bottom of the wind tunnel. Their height was hs = 15 mm, which is larger than the boundary layer thickness. Then, the dimensionless ground clearance was hg = hs/h = 0.28. Figure 1 presents three sketches (rear, side and bottom views) of the car models with all relevant notations.
Measurements were conducted either with a single vehicle (SV) or with two vehicles. In this latter case, three conditions were studied depending on the rear slant angle of the leading vehicle (LV): φ = 0°, 25° or 35°. The following vehicle (FV) was always a squareback model. For measurements with particles, a tube with an inner diameter (dt) of 4 mm was glued on the bottom face of the vehicle, 17 mm on the right side of the origin (Figure 1, rear view) corresponding to a dimensionless position z/h = −0.31. It represented the tailpipe. All vehicles were fixed at the centreline of the channel (z* = 0) and aligned with the main flow direction (x). In the present paper, x, y and z is the horizontal (positive in the streamwise direction), vertical (positive upward) and transversal (positive from right to left, rear view) directions, respectively. The origin O was taken at the rear face of the leading vehicle, on the centreline of the channel at the lowest level of the rear face. x*, y* and z* are the dimensionless corresponding distances (x* = x/h, y* = y/h and z* = z/h).
In order to reproduce the dynamics of a vehicle in an urban environment, the ratio between the inflow velocity (U0 for the model, U for the prototype) and the particle velocity at the exit of the tailpipe (VUFP,tailpipe) was kept constant for model and prototype (Equation (2)). This was defined as the similitude law for the present experiments.
( U 0 V U F P , t a i l p i p e ) m o d e l = ( U V U F P , t a i l p i p e ) p r o t o t y p e ,
where U is the velocity of the prototype (vehicle in an urban environment). Here, U = 13.9 m/s. Based on an “average” engine as defined by [51], VUFP,tailpipe for the prototype was assessed as 10.3 m/s. For more details, one can refer to Rodriguez [49].

2.2. Measurement Techniques

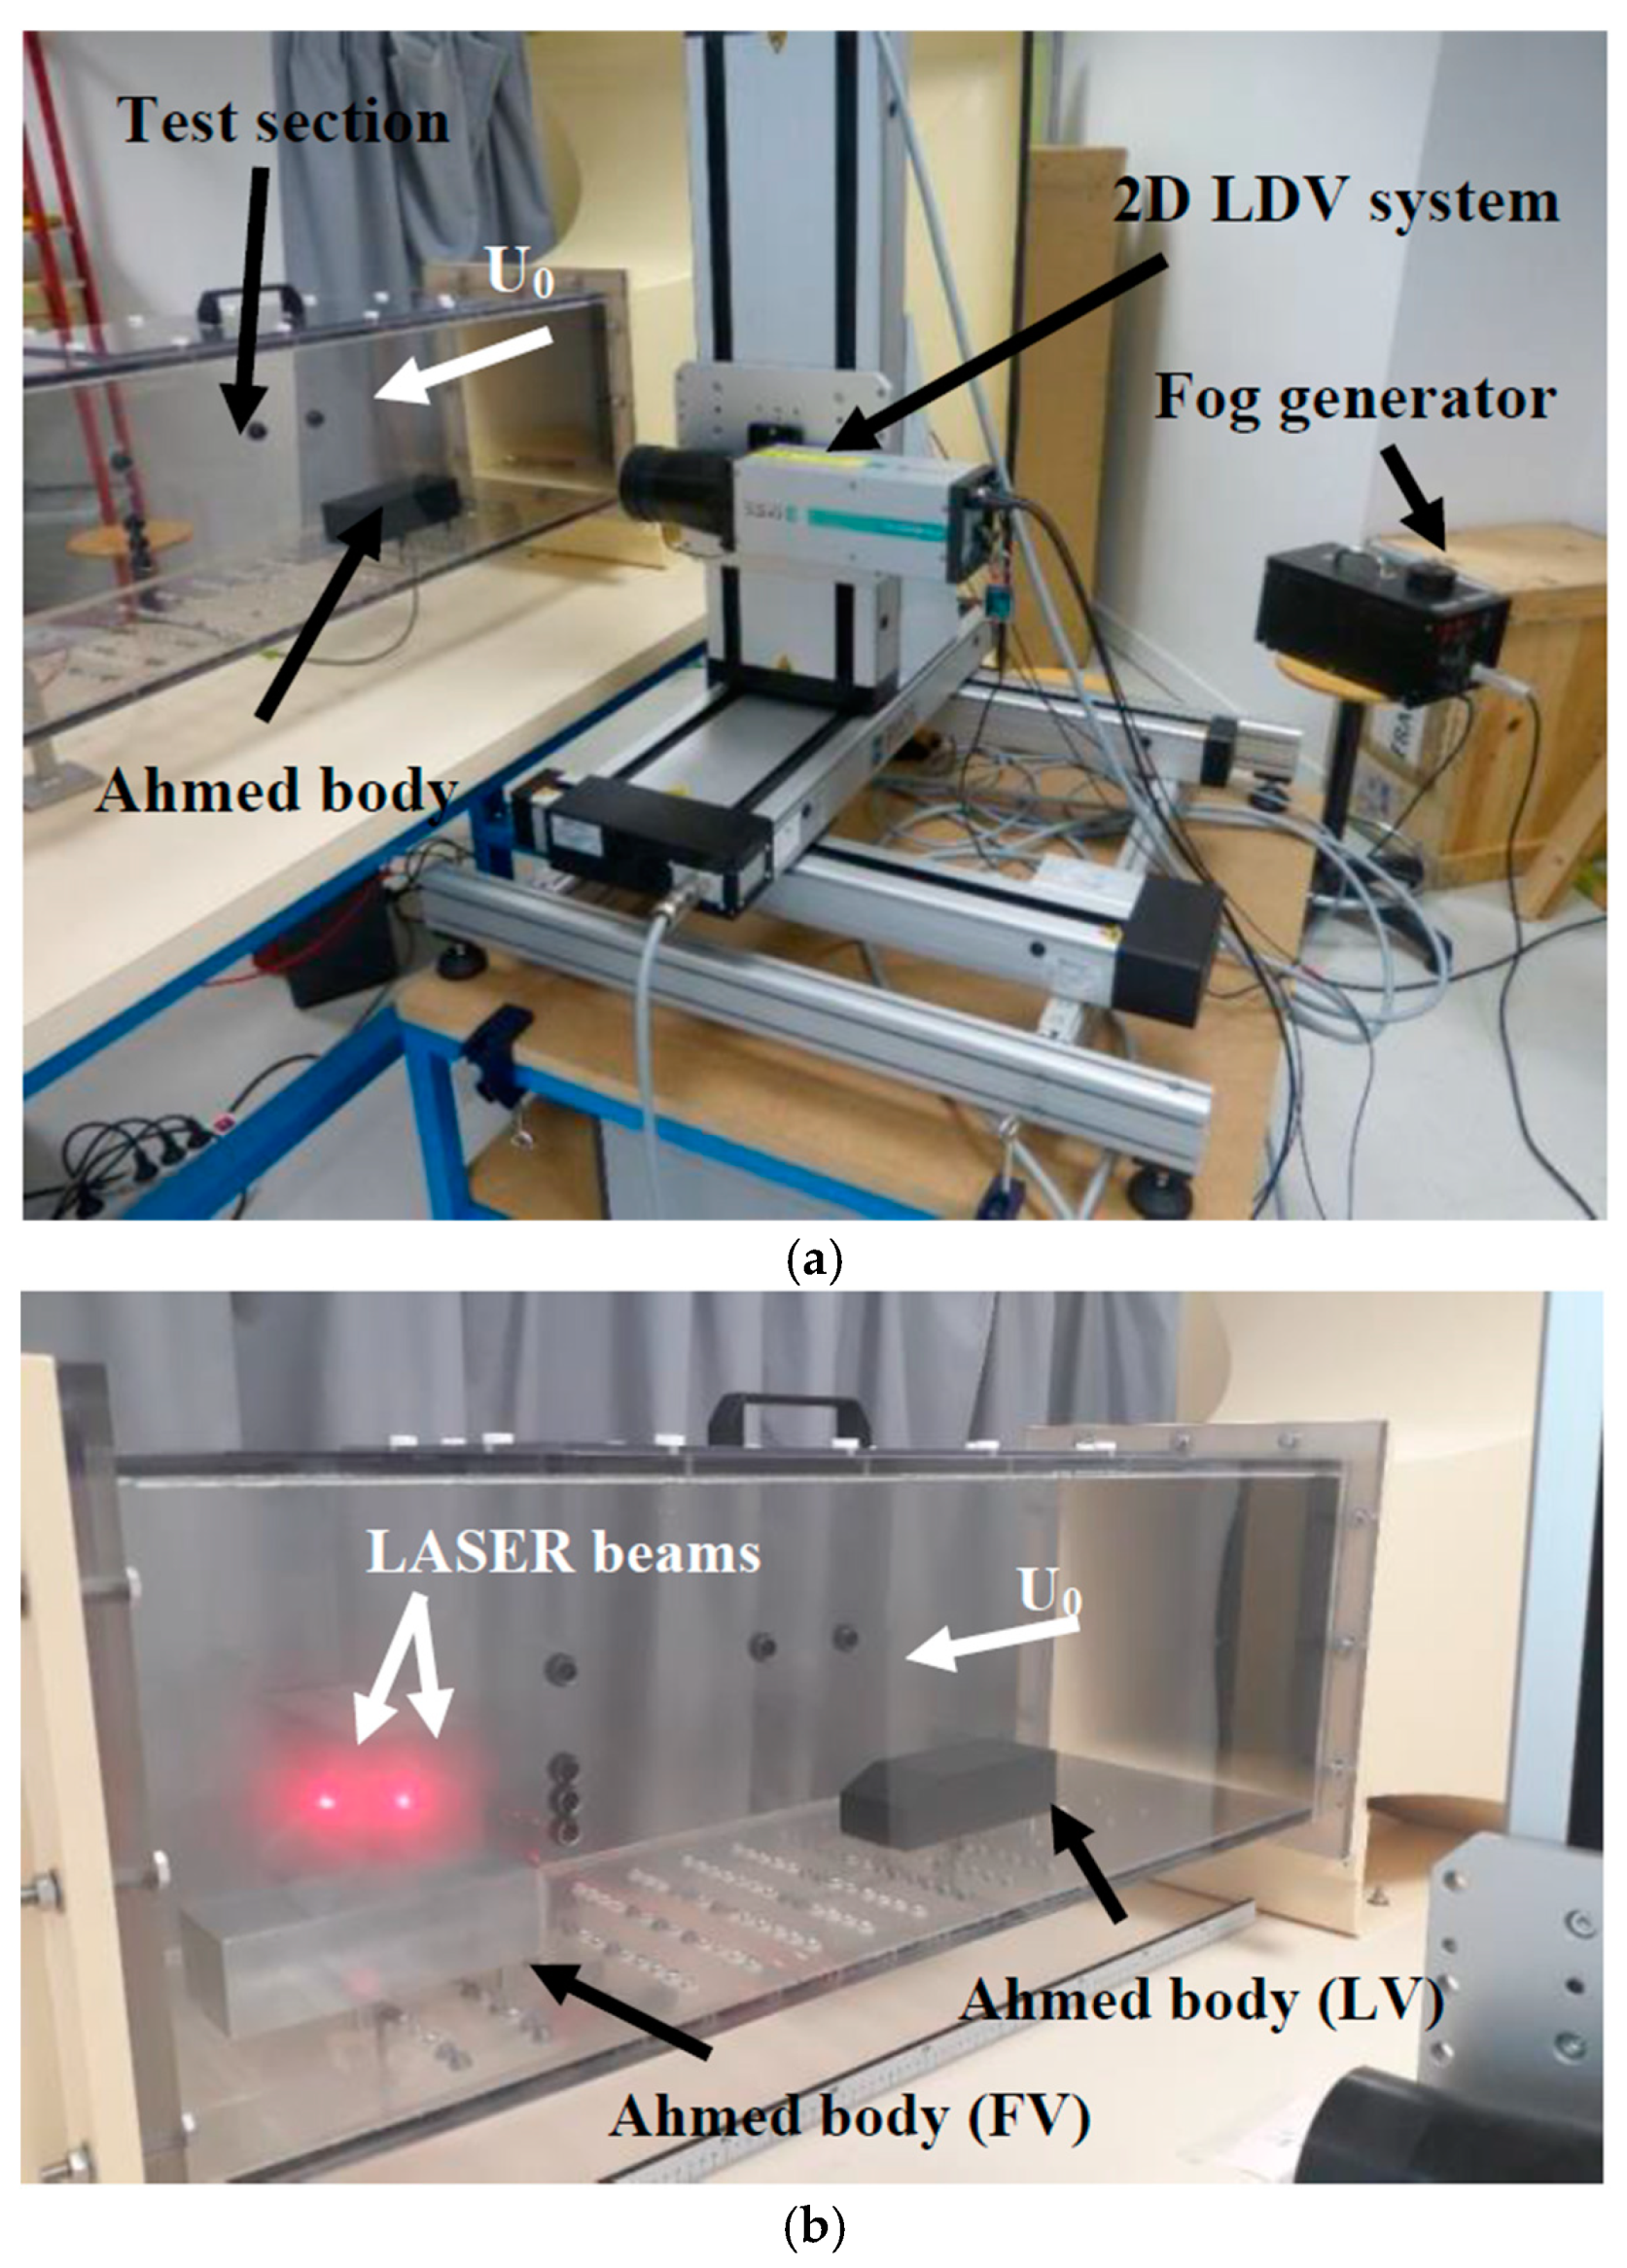
Velocity measurements were recorded with a 2D LDV system (DANTECMD Dynamics 2D Flow Explorer). Two pairs of LASER beams were emitted, one per velocity component (U is the horizontal component of the velocity and V the vertical one). Their wavelengths were 660 nm and 785 nm. The sizes of the measuring volume were 0.1684 × 0.1681 × 2.806 mm3 and 0.2003 × 0.1999 × 3.338 mm3, respectively. The numbers of fringes were 30 per pair of LASER beam. The interfringes were 5.448 mm and 6.396 µm. The focal length was lfl = 500 mm and the frequency shift for the Bragg cell was 80 MHz. The uncertainty for the measurement of the velocity was 0.07% [52,53]. This system was mounted on a 3D displacement table. The displacement spans over 410 mm in each direction with an accuracy of 0.01 mm. Figure 2a shows this experimental arrangement with the LDV system while Figure 2b is a zoom on the test section with the two car models (LV and FV).
The BSAFlow software (v5.03.00) was used for data acquisition. The Individual realization (IR) mode was selected for the acquisition. It means that all particles crossing the measuring volume and validated by the processor are recorded. Nevertheless, some bias may occur in the analysis justifying the development of the new method to assess mean and turbulent components of the velocity [54]. To ensure a good data rate, a fog generator was used. For the present study, the seeding was SAFEXMD Inside Nebelfluid Extra Clean [55,56] provided by DANTEC. This fluid was heated by the SAFEXMD S 195 G, which generated particles with an average radius of 1.068 µm in agreement with the recommendation of Tropea et al. [57].
UFP were generated by a PALASMD DNP 2000 [58]. They were made of carbon with a mean diameter between 20 nm and 100 nm. The operating principle is detailed by Rodriguez [49]. In these working conditions, the mass flow rate of these UFP was qm = 6.5 mg/h. UFP were carried by nitrogen, which flow rate was qtailpipe = 8 L/min. Taking into account the diameter of the tailpipe dt in the wind tunnel, the velocity of UFP at the tailpipe exist was given by Equation (3):
( V U F P ,   t a i l p i p e ) m o d e l = 4   ×   q t a i l p i p e π   ×   d t 2 = 10.6   m / s ,
( U V U F P , t a i l p i p e ) p r o t o t y p e = U 4   ×   Q t a i l p i p e π   ×   D t a i l p i p e 2     ,
where Qtailpipe and Dtailpipe are the flow rate and the diameter of the tailpipe for the prototype, respectively.
Then, after few rearrangements, the relation for the determination of U0 becomes (Equation (5)):
U 0 = ( U V U F P , t a i l p i p e ) p r o t o t y p e × ( V U F P ,   t a i l p i p e ) m o d e l = U × D t a i l p i p e 2 Q t a i l p i p e × q t a i l p i p e d t 2 ,
Finally,
U 0 = 13.9   × 0.055 2   2.45 × 10 2   ×   1.33 × 10 4 0.004 2 ~ 14.3   m / s ,
Assuming that Dtailpipe = 0.055 m and Qtailpipe = 0.0245 m3/s for an average vehicle in an urban environment [49].
The upstream air velocity was then chosen (U0 = 14.3 m/s) and kept constant. Based on the height of the car model, the Reynolds number was Re = 49,500.
At the tailpipe exit in the present experiments, the size distribution of the UFP generated by the PALAS indicated that more than 93% of them had an aerodynamic diameter between 30 nm and 109 nm with an average concentration of 6.96 × 10⁷ part/cm3 (Ce,c).
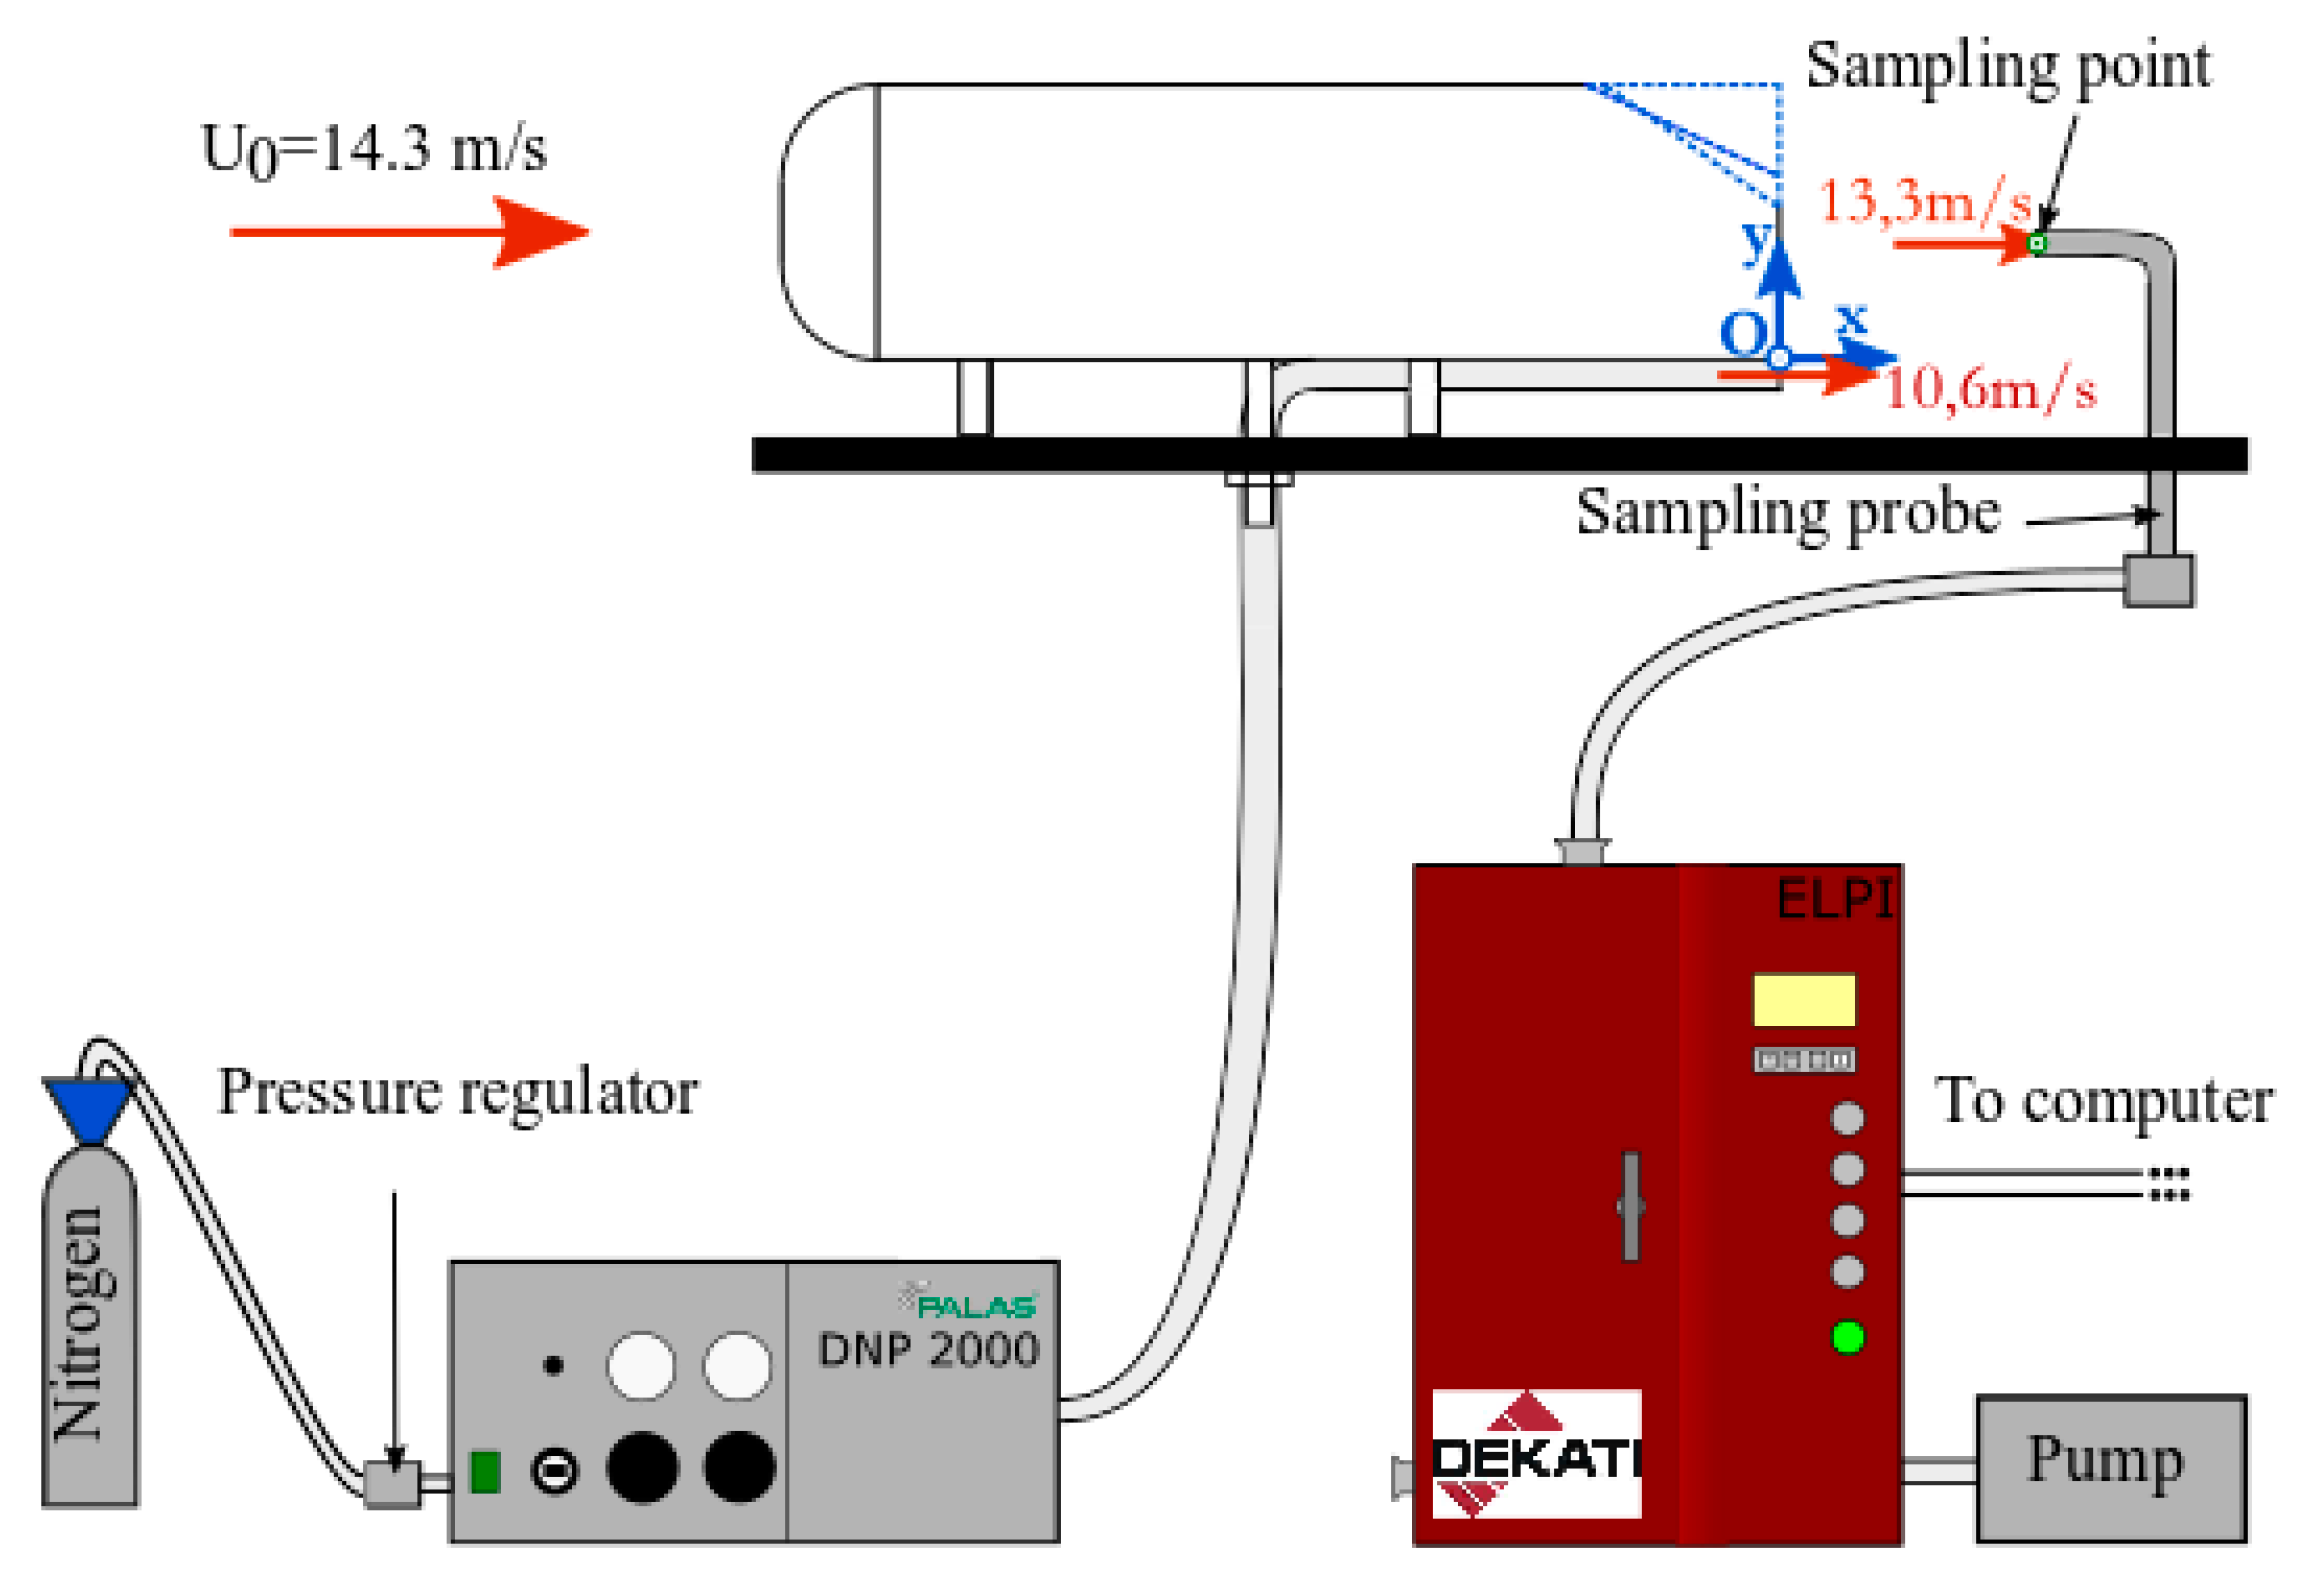
For the measurements of the Particle Number Concentration (PNC) in the wake of the car model, an ELPI (Electrical Low Pressure Impactor) was used. It allows concentration measurements for particles having a diameter between 30 nm and 10000 nm. For the detailed description of this device, one can refer to DEKATI [59] and Rodriguez [49]. Note that it was successfully used in previous work on the same topic [60]. A bended sampling probe was introduced into the test section. It sucked the air in the wake of the car model at a certain flow rate, which must correspond to an average velocity as close as possible to the inflow velocity. In the present case, considering the characteristics of the ELPI, this velocity was 13.3 m/s (difference was less than 7% compared to the inflow velocity U0). It was manually moved from one sampling point to another.
The experimental setup is presented on Figure 3 with the instrumentation.

2.3. Experimental Conditions, Data Acquisition and Analysis

For all devices, calibrations were performed before measurements to define the best data collection duration [49]:
  • For LDV, measurements lasted 90 s with a maximum of 5000 collected samples. A new method for data filtering was developed avoiding burst effect [54,61]. Depending on the position of the measuring point, the data rate was between few Hertz and hundreds of Hertz;
  • For PNC measurements, data acquisition lasted at least 80 s. It is divided in three different phases: (1) determination of the ambient levels (duration ~5 s, no particle generated), (2) particle generation (duration ~10 s until a stabilized level is reached) and (3) measurements (~60 s, PNC levels are recorded). The data rate was 1 Hertz;
Regarding the spatial mesh for the velocity measurements, it was defined according to two cases:
  • Measurements with a single vehicle: the horizontal step between two points was 10 mm in the close wake (0.09 < x* < 1.94) and 50 mm for 1.94 < x* < 5.65. The vertical step was 5 mm for 0.09 < y* < 1.11, which covers the entire height of the car model. Boundary layer profiles were also determined in the wake of the vehicle for −0.28 < y* < 0.09. Furthermore, additional measurements were made above the rear slant for φ = 25° and 35° to characterize the flow attachment or detachment. Lastly, 4 vertical planes were investigated to cover half width of the vehicle (z* = −0.68, −0.46, −0.23 and 0). Altogether, more than 5700 points were considered;
  • Measurements with two vehicles: six inter-vehicle distances (d) were studied. Using dimensionless distances, they were given by D = d/h = 0.93; 1.85; 2.78; 3.70; 4.62 and 5.56. The horizontal step was always 10 mm for D = 0.93, 1.85, 2.78, 3.70 and 4.62. For D = 5.56, it was either 10 mm (0.19 < x* < 2.22) or 20 mm (2.59 < x* < 5.56). In the vertical direction, it was 5 mm for 0 < y* < 1.11. For this configuration with two vehicles, measurements were made at the centreline of the channel (z* = 0) at more than 3700 positions.
These choices ensured an accurate spatial resolution, especially for the determination of the recirculation length (Lr). This length is defined as the longest distance measured from the rear part of the vehicle for which U is negative, U being the horizontal component of the velocity. At this stage, it is acknowledged that the influence of the tailpipe on the wake flow was assessed. No significant effect was noticed [49].
Regarding the measuring points for the PNC measurements (SV), they started from x* = 0.57 to 2.89 with a horizontal step of 25 mm and a vertical step of 5 mm. From x* = 3.35 to 7.06, the horizontal (respectively vertical) step was 50 mm (respectively 10 mm). In the z direction, measurements were made from z* = −0.62 to + 0.62 with a step of 16.7 mm (full width of the vehicle) for x* = 0.57 to 2.89. For x* = 3.35 to 7.06, additional measurements were made with a dimensionless step x* = −0.93 at z = −1.85; −1.24; −0.62; −0.31; 0, 0.31; 0.62; 1.24 and 1.85. Altogether, these positions ensured a 3D description of the PNC fields in the wake of the vehicle.

3. Results

In this part, the results concerning the flow dynamics in the wake of a single vehicle are reported first. Mean and turbulent properties are presented and compared to the existing literature. Then, the mechanisms of UFP dispersion are detailed for each configuration. The roles of the recirculation region and the longitudinal vortices are underlined. Based on these experimental data, an analytical model is proposed and assessed showing promising capabilities for different conditions. Some shortfalls are pointed out. A first way of improvement is suggested and tested showing promising capabilities. Finally, preliminary results of the flow dynamics between two vehicles are exposed depending on the inter-vehicle distances and possible implications regarding UFP dispersion are introduced.

3.1. Single Vehicle

3.1.1. Wake Flow Dynamics

In a first step, the mean properties of the flow developing downstream of the Ahmed body were described depending on the rear slant angle. This aims at validating the experimental setup. First, the length of the recirculation region was identified in each case. Table 1 summarizes the results for the three rear slant angles [49].
The difference between the three configurations is due to the flow attachment or detachment on the rear slant. For φ = 25°, the flow is attached. It induces a strong downwash effect limiting the volume of the recirculation region. For φ = 0°, the flow is fully detached and characterized by the longest recirculation length. For φ = 35°, an intermediate situation takes place. However, a flow detachment is observed leading to longer recirculation length compared to = 25°. These results were compared to the literature showing strong agreements. Indeed, Barros [62] found 1.45 < Lr/h < 1.52 while Grandemange et al. [40] gave Lr/h ~ 1.50 in agreement with Lahaye [63]. They worked with Reynolds numbers between 90,000 and 700,000. These coherent findings tend to validate the experimental setup. Furthermore, according to the literature [34,38,41,42,45,47,63,64], two counter rotating vortices develop in the close wake for the three configurations (the upper one being A and the lower one B). The corresponding positions of their centres (xA*; yA*) and (xB*; yB*) depend on and can be identified from streamlines. Table 2 present the comparison between the present results and those provided from the above-mentioned literature.
Overall, a good correlation is highlighted with the literature. Note that for φ = 25 and 35°, the measurement of the position of the lower vortex was not possible because the vertical component of the velocity was not accessible closed to the ground level.
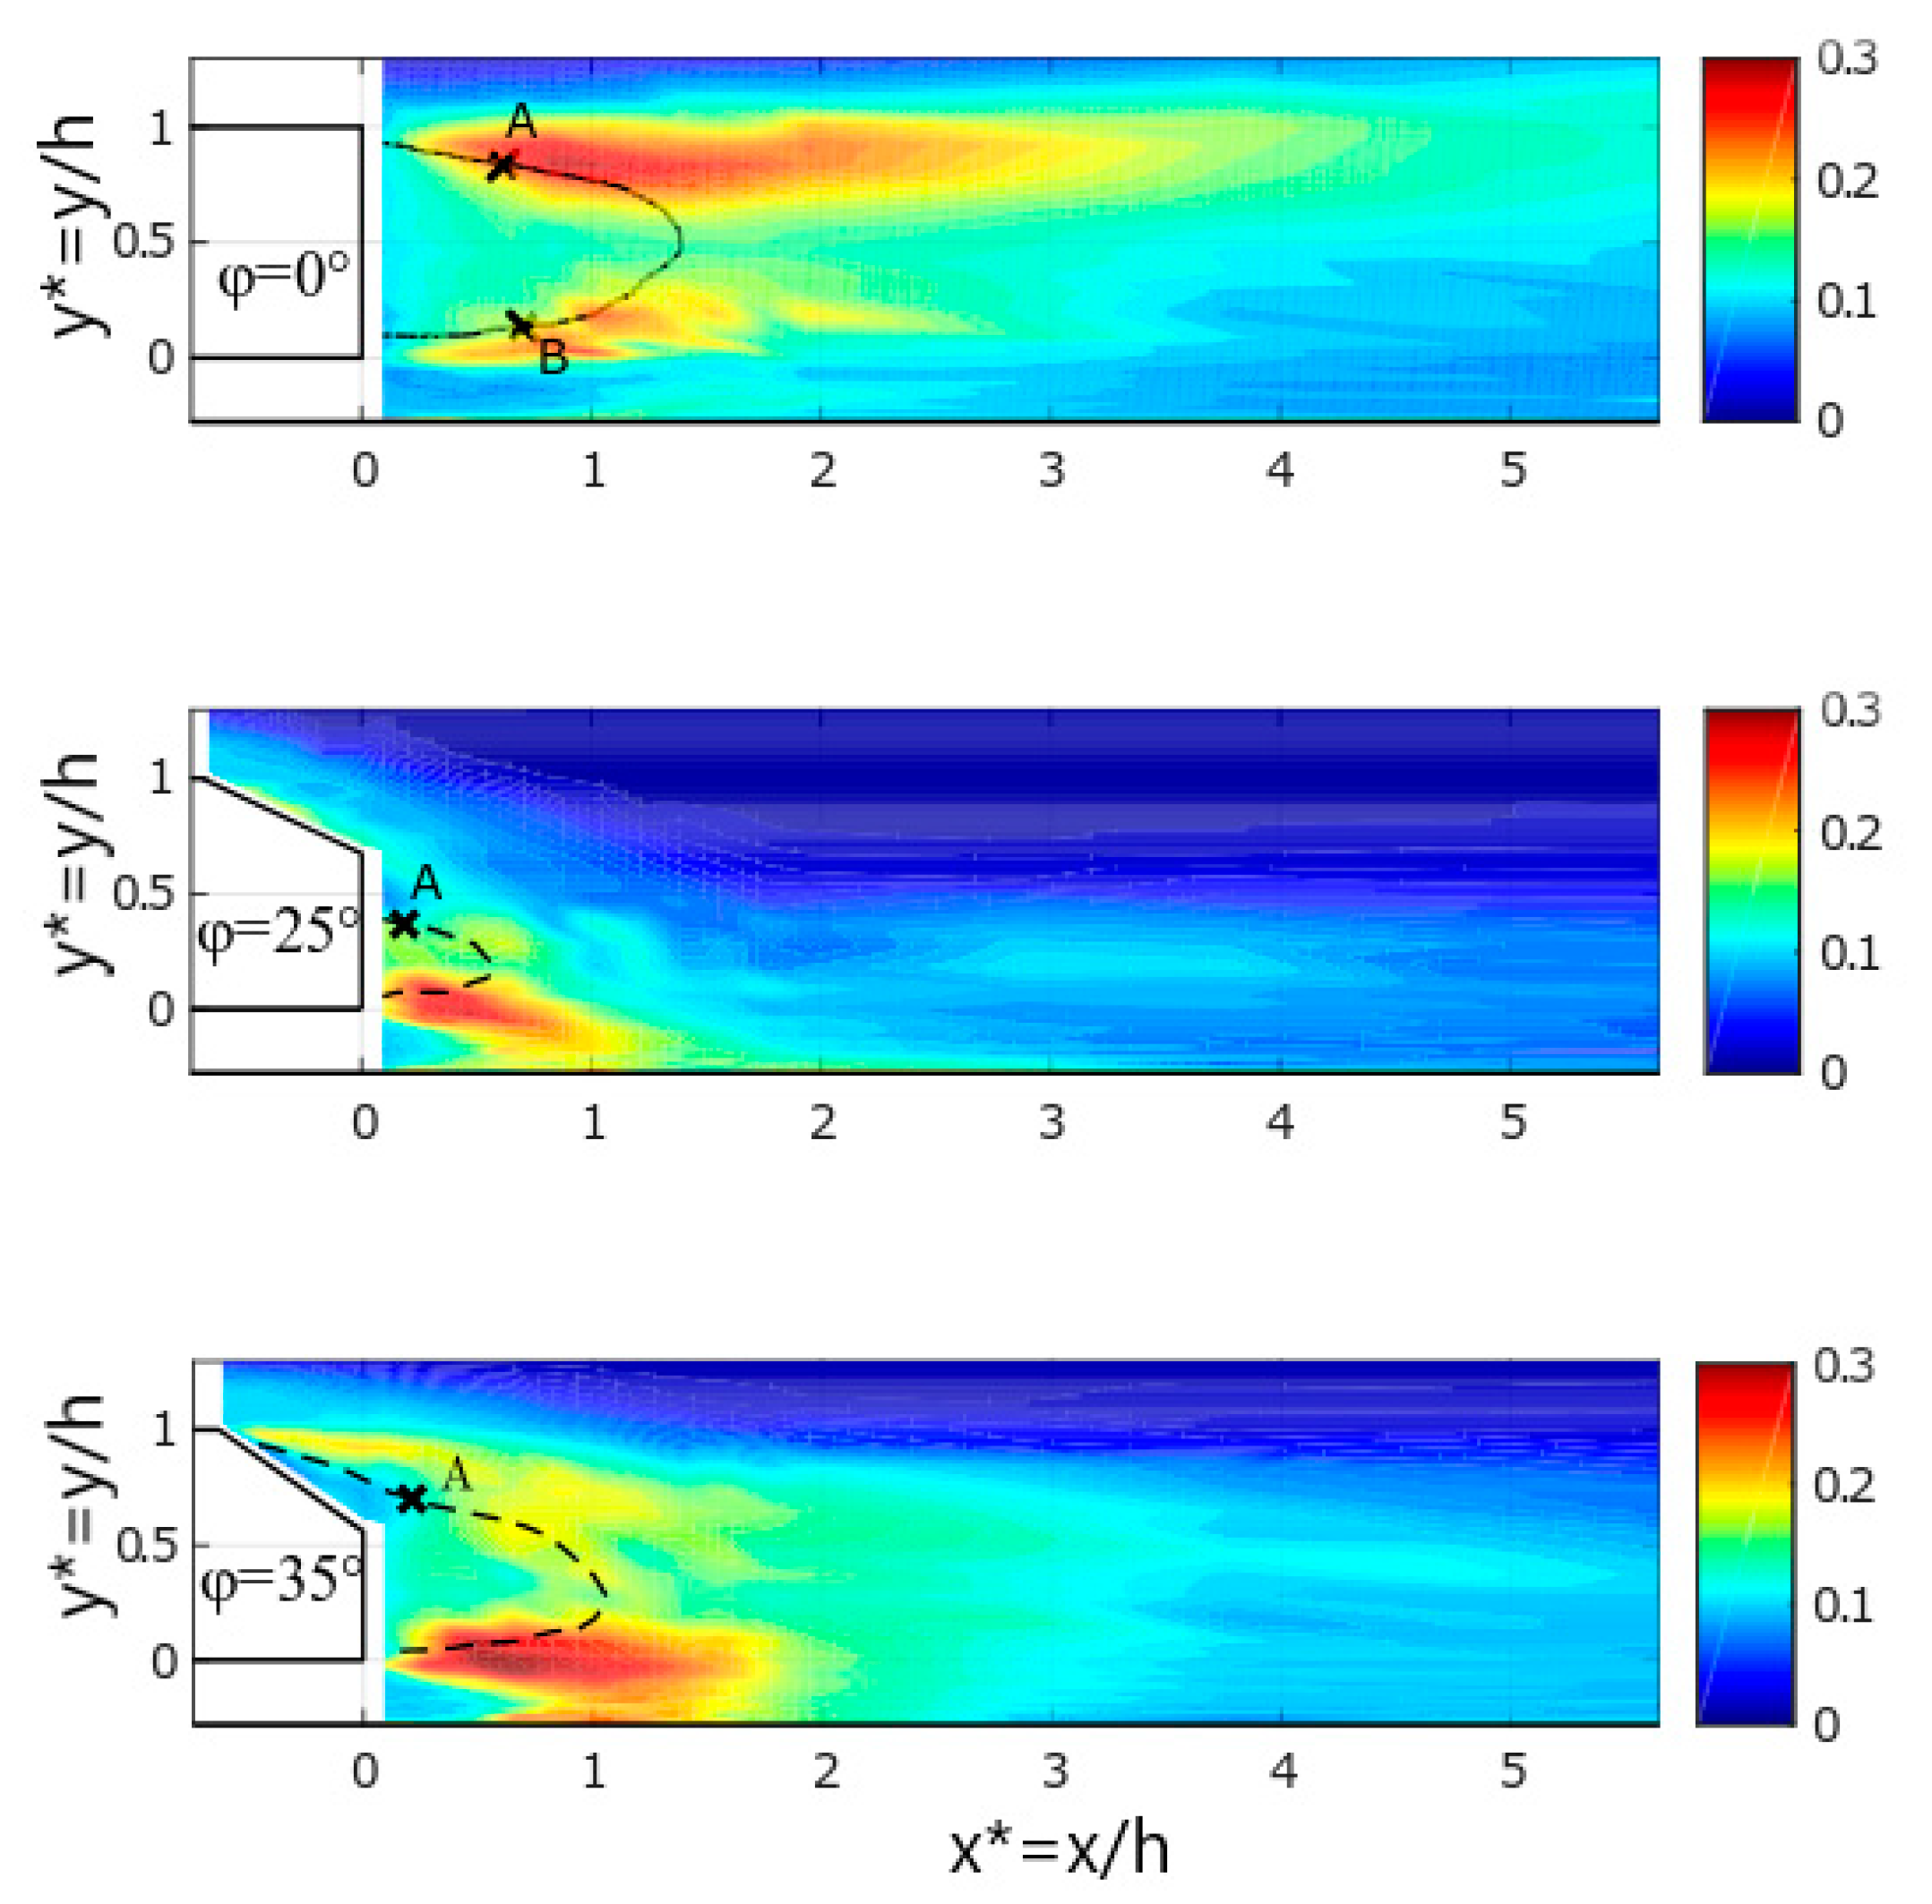
In a second step, the turbulent fluctuations were characterized in the symmetry plane (z* = 0). Both longitudinal (Ix = u’/U0, u’ being the Root Mean Square (RMS) value of the horizontal component U of the velocity) and vertical (Iy = v’/U0, v’ being the RMS value of the vertical component V of the velocity) turbulent intensities were assessed as well as the turbulent kinetic energy (TKE) and Reynolds shear stresses (RSS). As an example, Figure 4 show the turbulent intensity in the streamwise direction (Ix) for the three car models. On these plots, the positions of the centres of the upper (A) and lower (B) vortices are indicated as well as the boundaries of the recirculation region (black lines).
For φ = 0°, the results for both Ix and Iy tend to indicate that two shear layers appear in the upper and lower parts of the wake flow, the upper one being more intense (Ix,max = 29%) than the other one (Ix,max = 26%). This upper shear layer also spreads over a larger area [49]. At x* = 5.65, Ix = 13%. For φ = 25°, the lower shear layer is more intense (Ix,max = 29%) compared to the upper one (Ix,max = 18%). From x* = 1.72, Ix is below 13%. This is explained by the downwash effect due to the flow attachment on the rear slant. For φ = 35°, the peak for Ix (31%) is located in the lower shear layer. From x* > 3.01, Ix decreases below 13%. Similar trends are observed for the dimensionless TKE (TKE*). [49] indicated that the boundaries of the recirculation regions for each configuration match with the regions where TKE* reach its highest values. For φ = 0°, TKE* decrease to 0.03 at x* = 3.18 while the same level is reached at x* = 1.05 (φ = 25°) and 2.11 (φ = 35°). Regarding the dimensionless Reynolds Shear Stresses (RSS*), for the three configurations, positive values are measured in the lower shear layer while negative ones are observed in the upper one [49]. On the one hand, a symmetry is observed for φ = 0° up to x* = 3 (in magnitude) even if it appears to be slightly larger in the upper shear layer (RSSmax* = 0.043 versus 0.026). On the other hand, no symmetry is depicted neither for φ = 25° nor for φ = 35°. Additional characteristics will be given in the last part of the present paper and comparisons will be discussed with the experiments involving two vehicles. Overall, these preliminary results are in agreement with the literature [47,62] and confirm the reliability of the experimental setup.

3.1.2. Particle Dispersion in the Wake of a Single Vehicle

In this part, the results obtained from the experimental measurements detailed in [65,66] are briefly presented. The proposed approach is new and original. Indeed, solid particles were used whereas most of the previous experimental works available in the literature used gas tracers [67,68,69]. Different 2D maps of the PNC fields in both horizontal and vertical plans were obtained [49]. Overall, the experimental data point out different UFP dynamics depending on the rear slant angle:
  • For φ = 0°, highest levels of PNC are obviously aligned with the tailpipe. High levels of PNC are also revealed in both streamwise and vertical directions. In the vertical direction, particles spread almost over the total height and width of the vehicle but with different magnitudes. Indeed, when they are ejected from the tailpipe, they are entrapped by the recirculation region, which is the largest one in this case. The two counter-rotating vortices appearing in the close wake catch UFP enhancing their dispersion. Similarly, the horizontal turbulent structures disperse the UFP in the transversal direction. The average levels of PNC tend to decrease when the distances in x, y and z directions from the tailpipe increase. In the recirculation region, the horizontal 2D maps of PNC fields show a strong mixing characterized by homogeneous concentrations. Top views of the PNC fields in the wake of the car model reveal their symmetry with respect to z* = 0. This is a first evidence of the strong correlation between the flow topology and the PNC fields;
  • For φ = 25°, the PNC fields confirm the strong downwash effect due to the attachment of the flow on the rear slant. The vertical spreading is weaker than for φ = 0° as the recirculation region is less volumic. The horizontal 2D maps of the PNC for different vertical dimensionless positions y* above the bottom indicate a clear dissymmetry depicting the key role of the longitudinal vortices developing from the edges of the car model in this case. One more time, the flow topology is a key parameter influencing the particle dispersion;
  • For φ = 35°, the results ascertain the influence of the recirculation region on the particle dispersion. Overall, they are quite close to those observed for φ = 0° as the flow is detached on the rear slant (no downwash effect). From the 2D vertical maps at different z*, the PNC distributions exhibit a homogeneous trend over the height of the vehicle in the close wake with decreasing levels as the distance to the tailpipe increases.

3.1.3. Modelling of the Particle Dispersion in the Wake of a Single Vehicle

From these results, a preliminary analytical model is developed. It aims at describing the dispersion of UFP in the wake of a single car model for the three rear slants. For such conditions, it is acknowledged that the diffusion by turbulence is the most important parameter, which governs the dynamics of the UFP. So, the diffusion/convection equation is considered to model the concentration C of the UFP in the wake of the car model. It is given by Equation (7):
C t = D i Δ C C u ,
where C is the concentration of UFP (particles/m3), t is the time (s), Di (I = y or z) the diffusion coefficient (i.e., Dy is the diffusion coefficient in the vertical direction and Dz the diffusion coefficient in the transversal direction, m2/s), is the laplacian, is the gradient and u the velocity (m/s).
Assuming a steady flow with a constant advection velocity ( u = U 0 ), then Equation (7) can be written as:
D i Δ C = U 0 C ,
Considering a 2D flow in the vertical plan (x,y), assuming that C x C y and that the diffusion coefficient in the vertical direction (Dy) is constant, then Equation (8) can be rewritten as:
2 C y 2 = U 0 D y C x   ,
According to [70], a solution of Equation (9) is given by:
C ( y ) = C m a x ( x ) × e x p ( 1 4 U 0 D y ( y y C m a x ) 2 x ) ,
where Cmax is the maximum concentration and yCmax (m) the position of this maximum above the bottom of the wind tunnel.
Using dimensionless numbers, Equation (10) becomes:
C ¯ f , t * ( y * ) = m a x y * ( x * ) ( C ¯ f , t * ) × e x p ( 1 4 U 0 h D y ( y * y m a x ( C ¯ f , t * ) * ) 2 x * ) ,
where C ¯ f , t * = C ¯ f , t C ¯ e , c , C ¯ f , t being the final total concentration measured by ELPI.
Similarly, in the transversal direction, Dz can be given by:
C ¯ f , t * ( z * ) = m a x z * ( x * ) ( C ¯ f , t * ) × e x p ( 1 4 U 0 h D z ( z * z m a x ( C ¯ f , t * ) * ) 2 x * ) ,
Based on this theoretical approach, Dy and Dz were determined based on the measurements made in the wake of a single vehicle for the three configurations.
First, Dy was assessed from Equation (11). Since Dy is the sole unknown of the equation, it can be achieved from the data by identifying y m a x ( C ¯ f , t * ) * (the dimensionless position at which the peak of PNC is measured) and m a x y * ( x * ) ( C ¯ f , t * ) (the corresponding peak of PNC), for a given couple (x*, z*). Attention was focused on three vertical plans given by z* = −0.31; 0 and 0.31. Knowing y m a x ( C ¯ f , t * ) * and the corresponding PNC, Dy can be determined (Equation (13)):
D y 4 x * U 0 h l n ( m a x y * ( x * ) C ¯ f , t * C ¯ f , t * ( y * ) ) X = ( y * y m a x ( C ¯ f , t * ) * ) 2 Y   ,
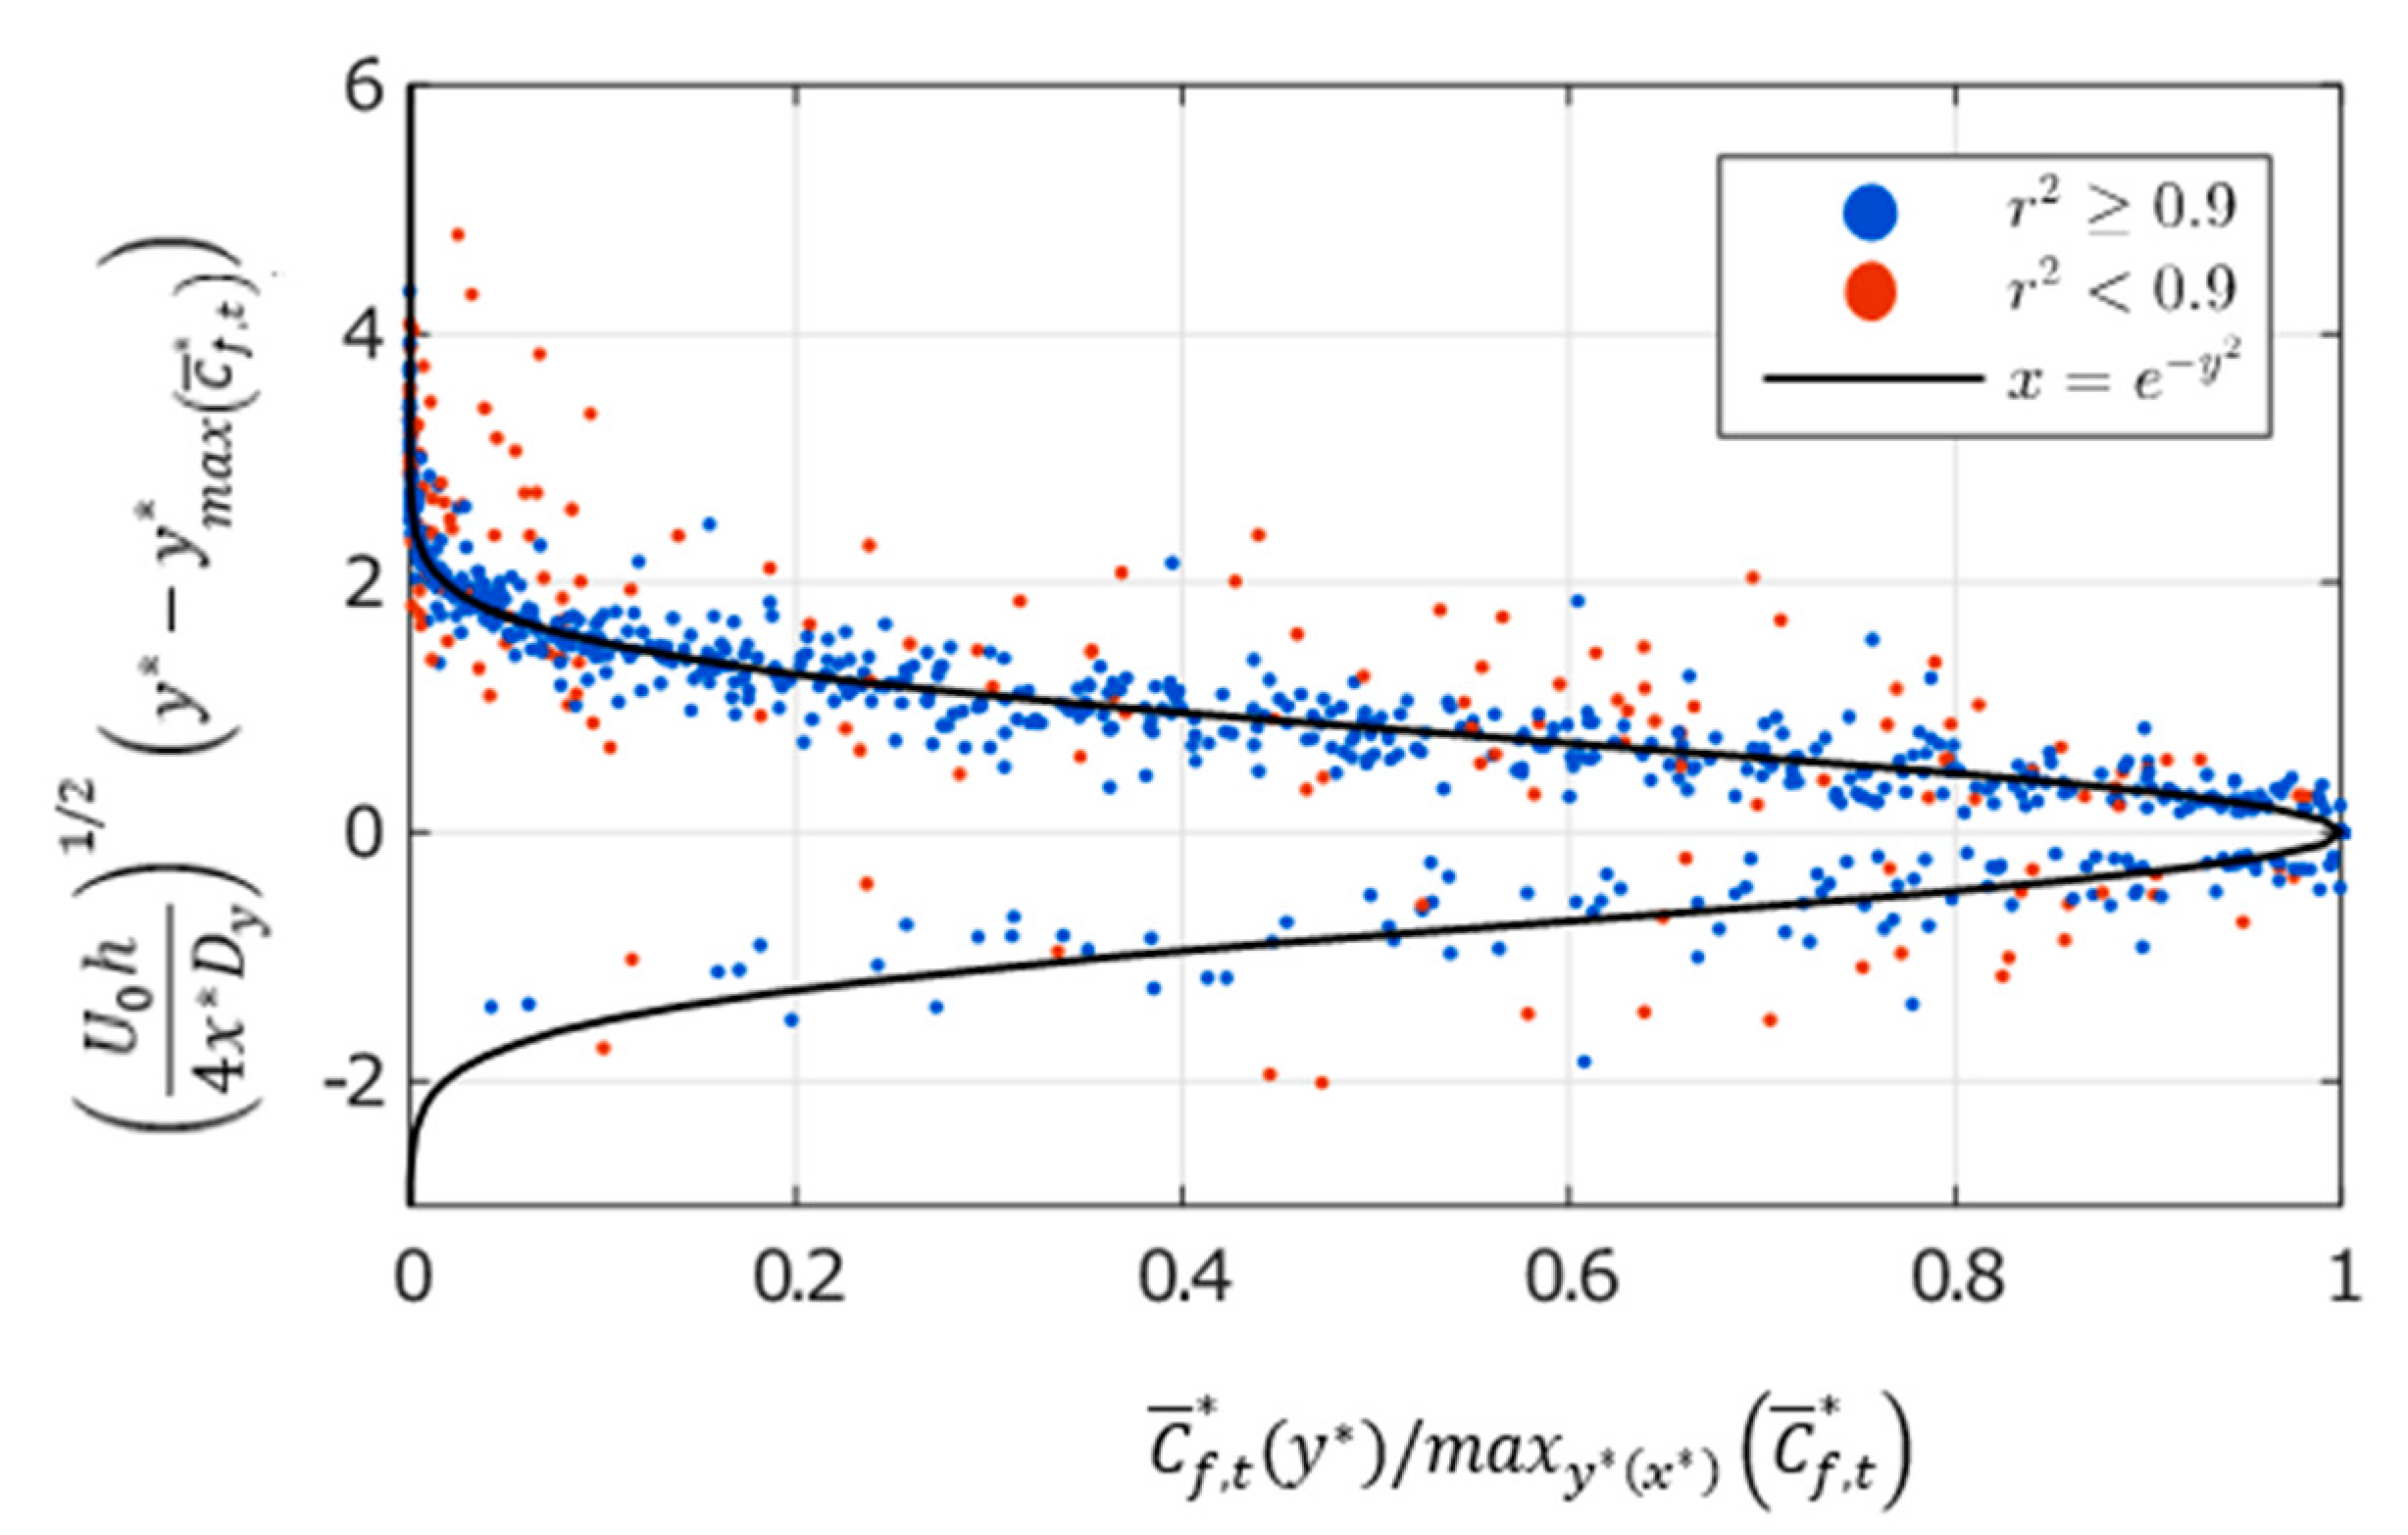
Dy is deduced from a linear regression assuming that D y × X = Y . In order to discuss the accuracy of this linear regression, the corresponding correlation coefficient r2 was estimated in each case. For φ = 0°, it was mostly between 0.92 and 0.99 (with an average value of 0.95 and a standard deviation of 0.04). Nevertheless, in the closest part of the wake (x* = 0.57), weaker values were found between 0.74 and 0.88. This region is part of the recirculation region and the assumptions on which the model is based were probably less realistic. For φ = 25°, the flow has a 3D behaviour. Then, r2 was lower compared to φ = 0° and 35°: the average value is 0.91 and the standard deviation is 0.10. For φ = 35°, the model tends to be satisfying, the average value and standard deviation for r2 being 0.98 and 0.02, respectively. Table 3 indicates the full results. Figure 5 presents the corresponding results for the whole set of data. Blue dots account for r2 > 0.9 while red dots are for r2 < 0.9. At the final stage, Dy was assessed as a function of x* for each vertical plan z* and for each car model. The corresponding mean values and standard deviations were determined for each vehicle. Table 4 summarizes the results.
For φ = 0°, the highest average value is found with a very good accuracy. Dy is almost constant with x* for each z*. For φ = 25°, Dy is two times smaller compared to φ = 0°. The vertical diffusion is then less important. A less intense mixing operates in the wake of this Ahmed body, the recirculation region being smaller for this configuration characterized by a strong downwash effect. For φ = 35°, the results tend to indicate that Dy is larger in the close wake (x* < 1). Dy can reach 0.063 m2/s for z* = 0.31. This is associated with the size of the recirculation region in this part of the flow. Far downstream, Dy becomes more stable.
Overall, the proposed analytical model tends to be accurate for Dy and well-adapted for this kind of wake flow. The vertical diffusion of UFP is well-described. It is stronger for φ = 0° compared to φ = 35° and 25°. It seems to be related to the size of the recirculation region (Lr).
Then, the same analyis was conducted to assess the transversal diffusion coefficient (Dz). Table 5 gives mean and standard devation for r2 as well as the percentage of profiles for which r2 > 0.9. Overall, these results are lower compared to those obtained for Dy (Table 3).
Despite this lower accuracy, the percentages in the last line (Table 5) being below those given in Table 3, the transversal diffusion coefficient (Dz) was assessed for the three car models. Results are given in Table 6. As above, profiles for which r2 > 0.9 are considered.
This table shows that Dz (φ = 35°) > Dz (φ = 25°) > Dz (φ =0°). The convergence of the streamlines for φ = 0° may explain the limited dispersion in the transversal direction. For φ = 25°, the development of the longitudinal vortices contribute to increase this transversal diffusion. For φ = 35°, the flow detachment on the rear slant may contribute to these findings.
In order to discuss the accuracy of the present model to depict the transversal diffusion, a detailed analysis was conducted. Two different situations were identified:
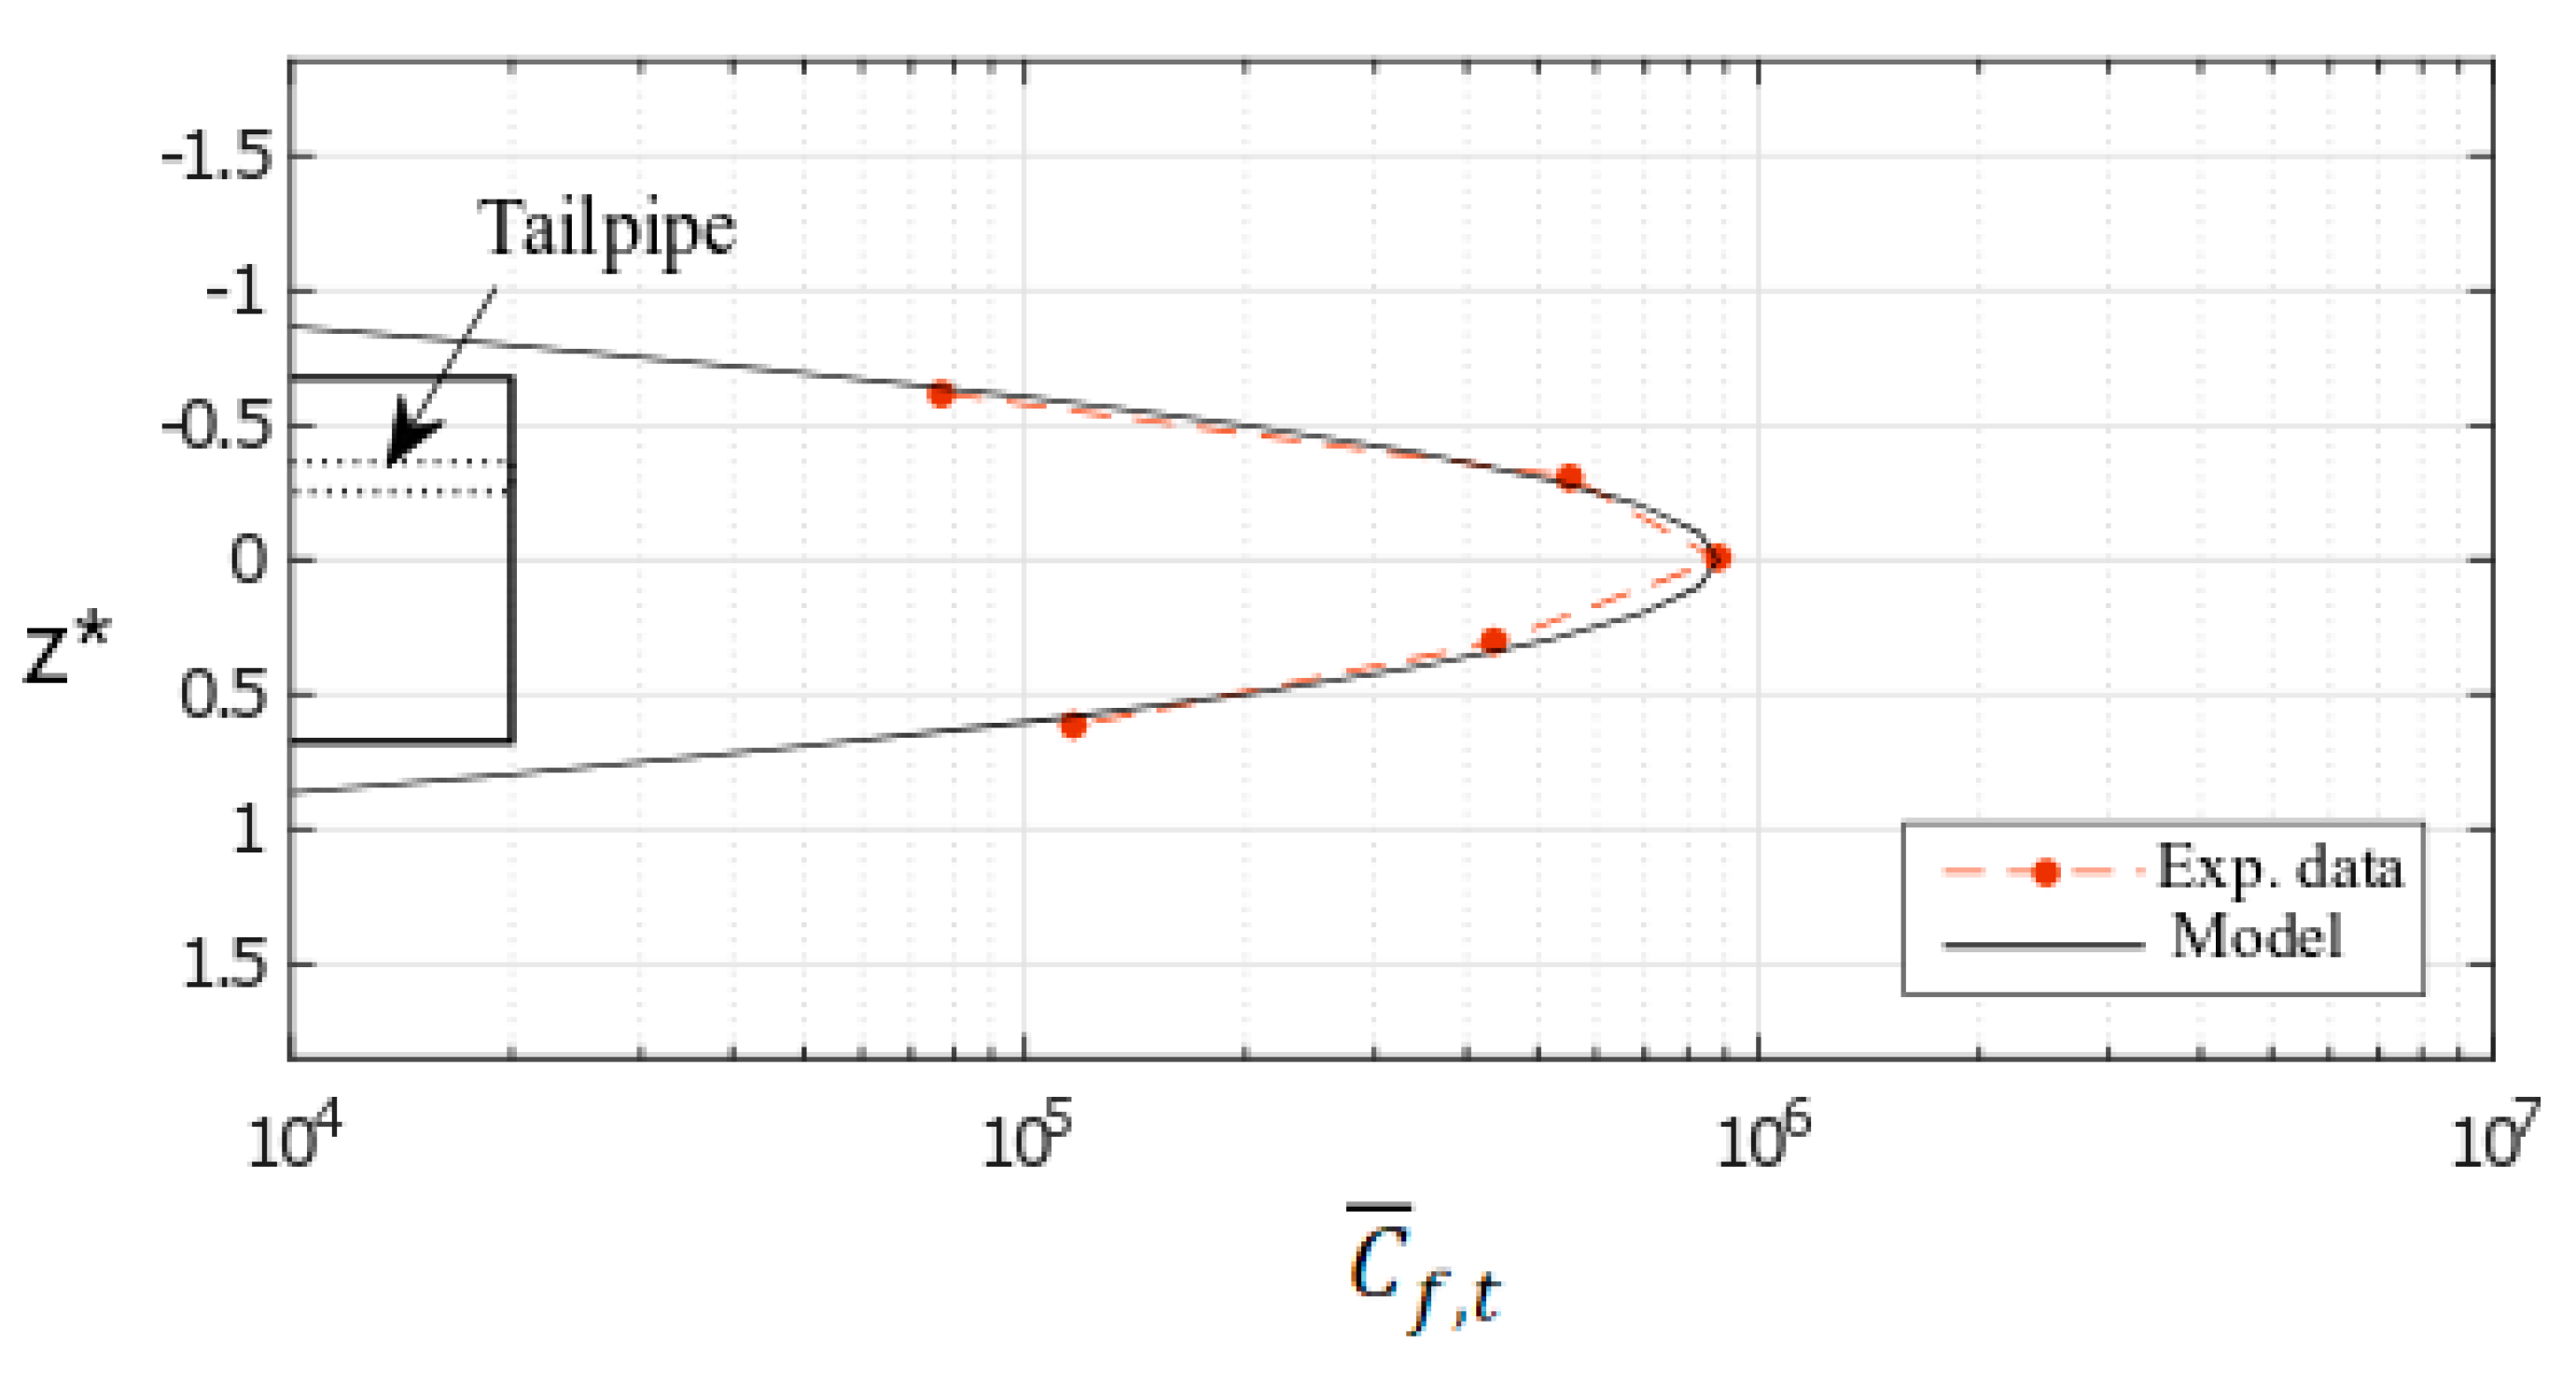
  • The first one for which the proposed analytical model is accurate and the distribution of the UFP concentration is almost Gaussian. This is observed for φ = 0° (Figure 6);
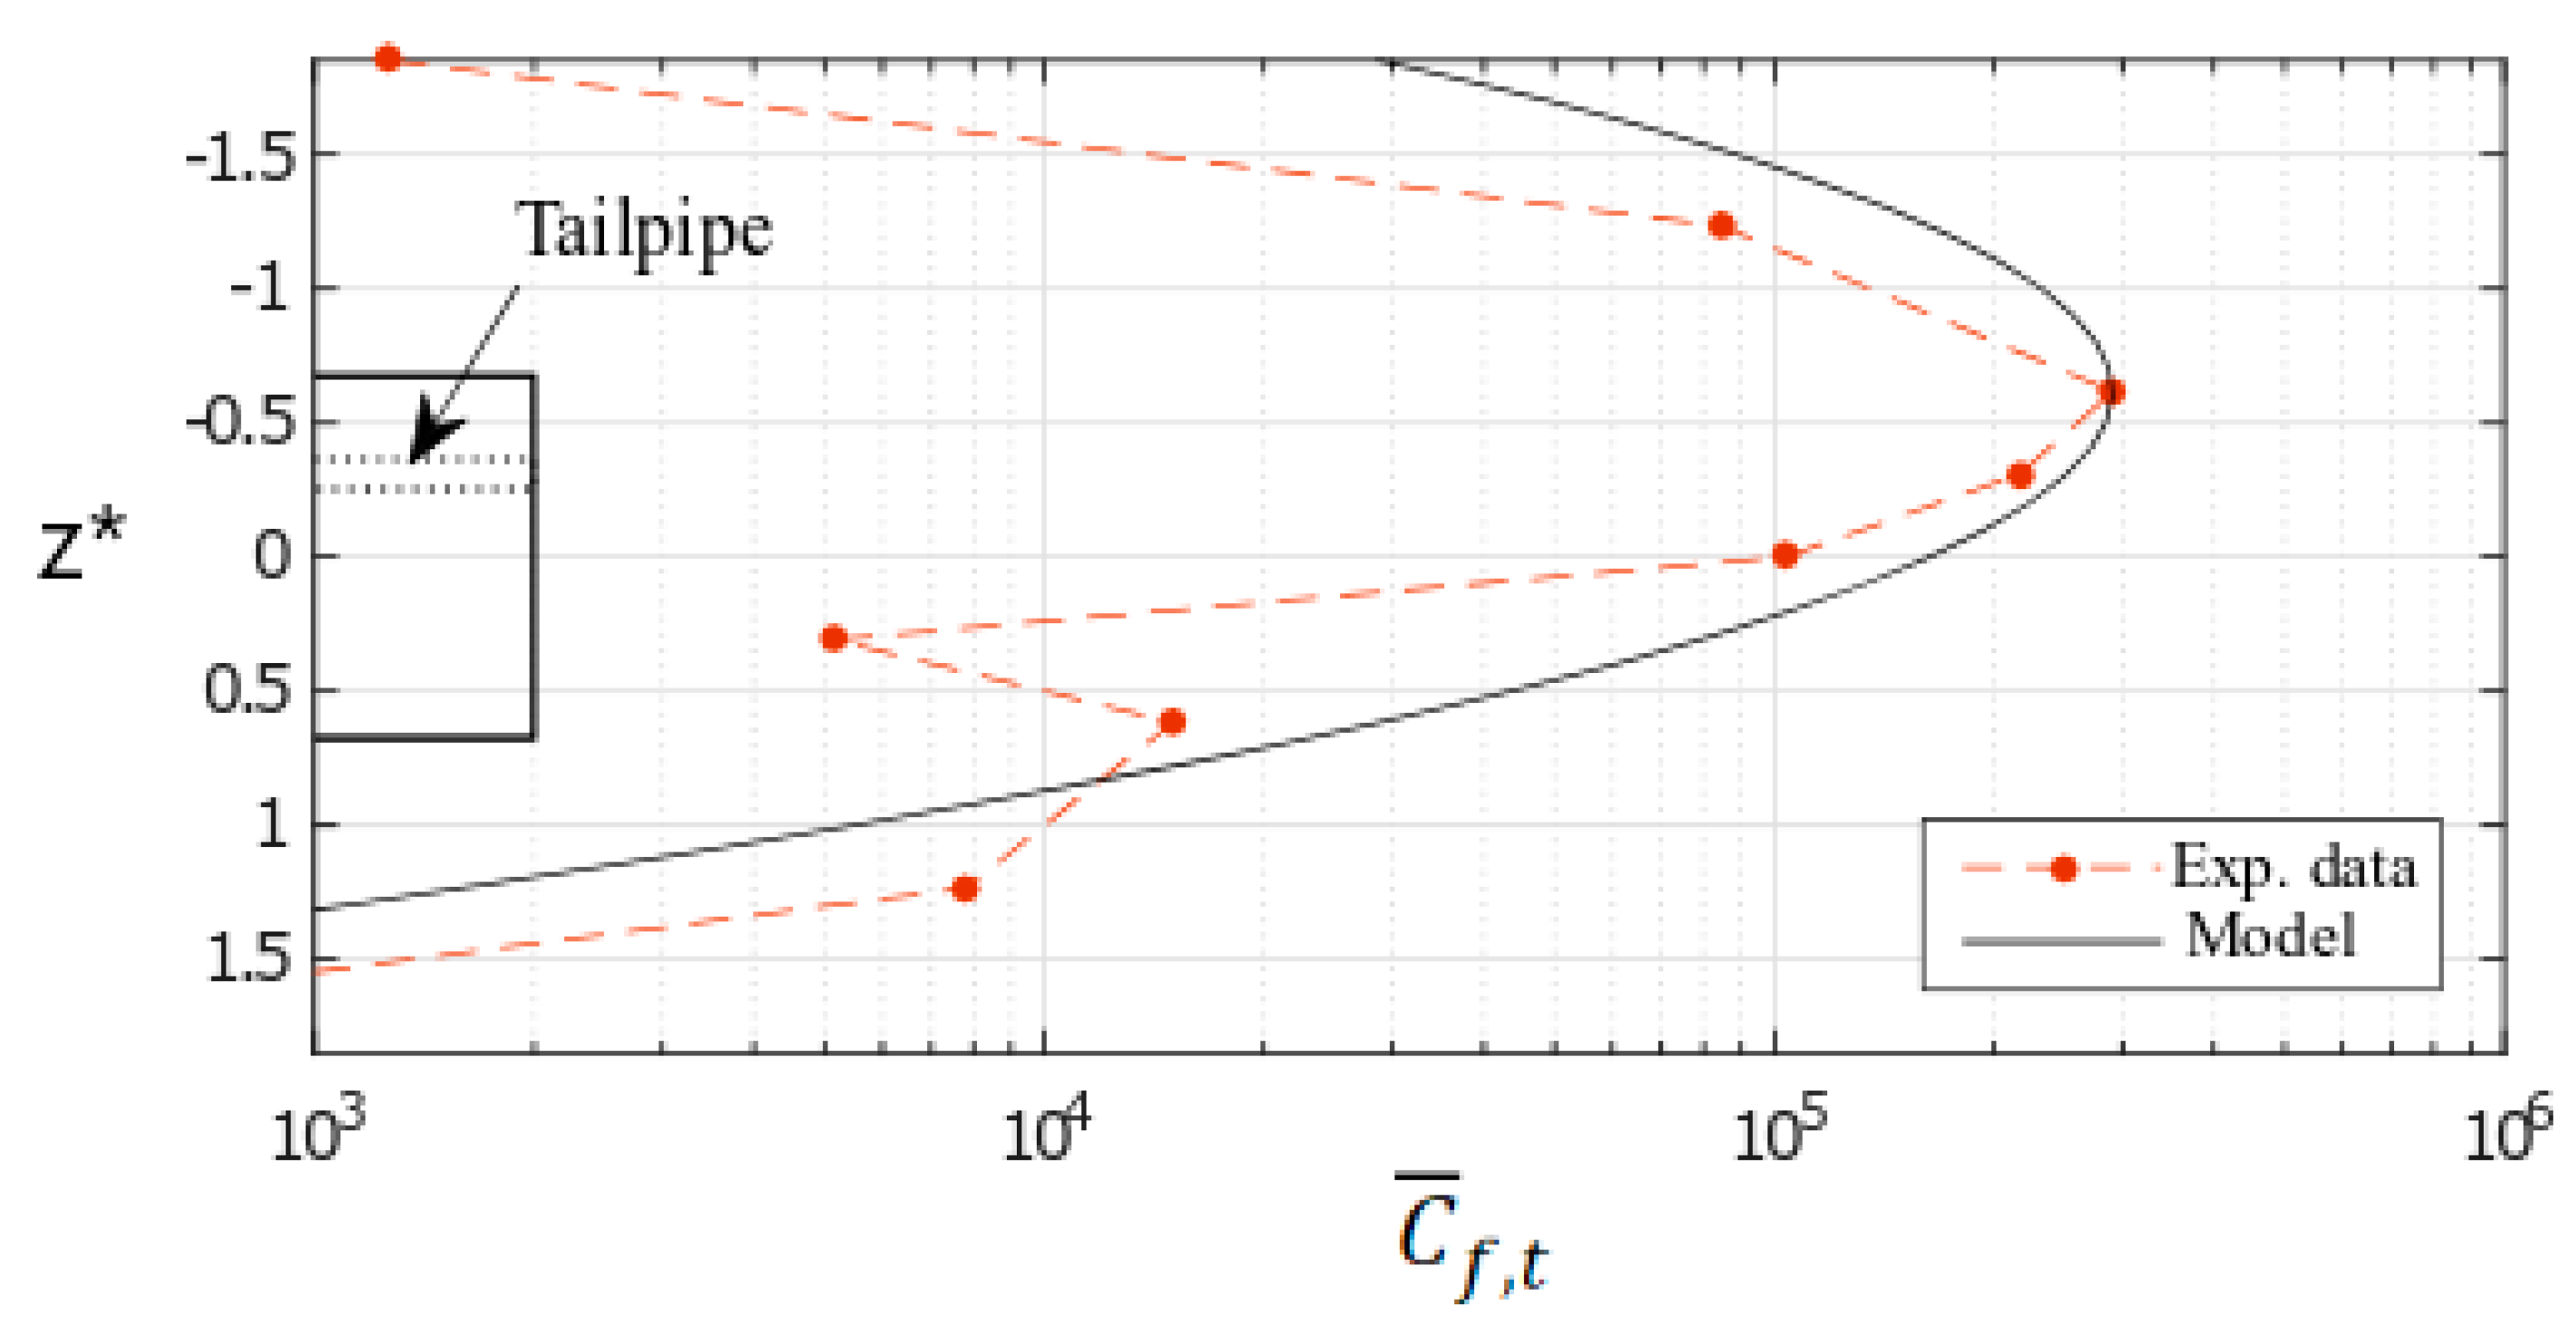
  • The second one for which the model is less accurate as the distribution of the UFP concentration is bimodal (Figure 7): two peaks are highlighted at z* ~ −0.50 and z* ~ 0.50. In this case, it is mostly related to the presence of the two longitudinal vortices (φ = 25°). On the tailpipe side (z* < 0), concentrations are the most important while a second and lower peak is noticed on the opposite half width (z* ~ 0.50). As a consequence, this model tends to overestimate Dz for this configuration.
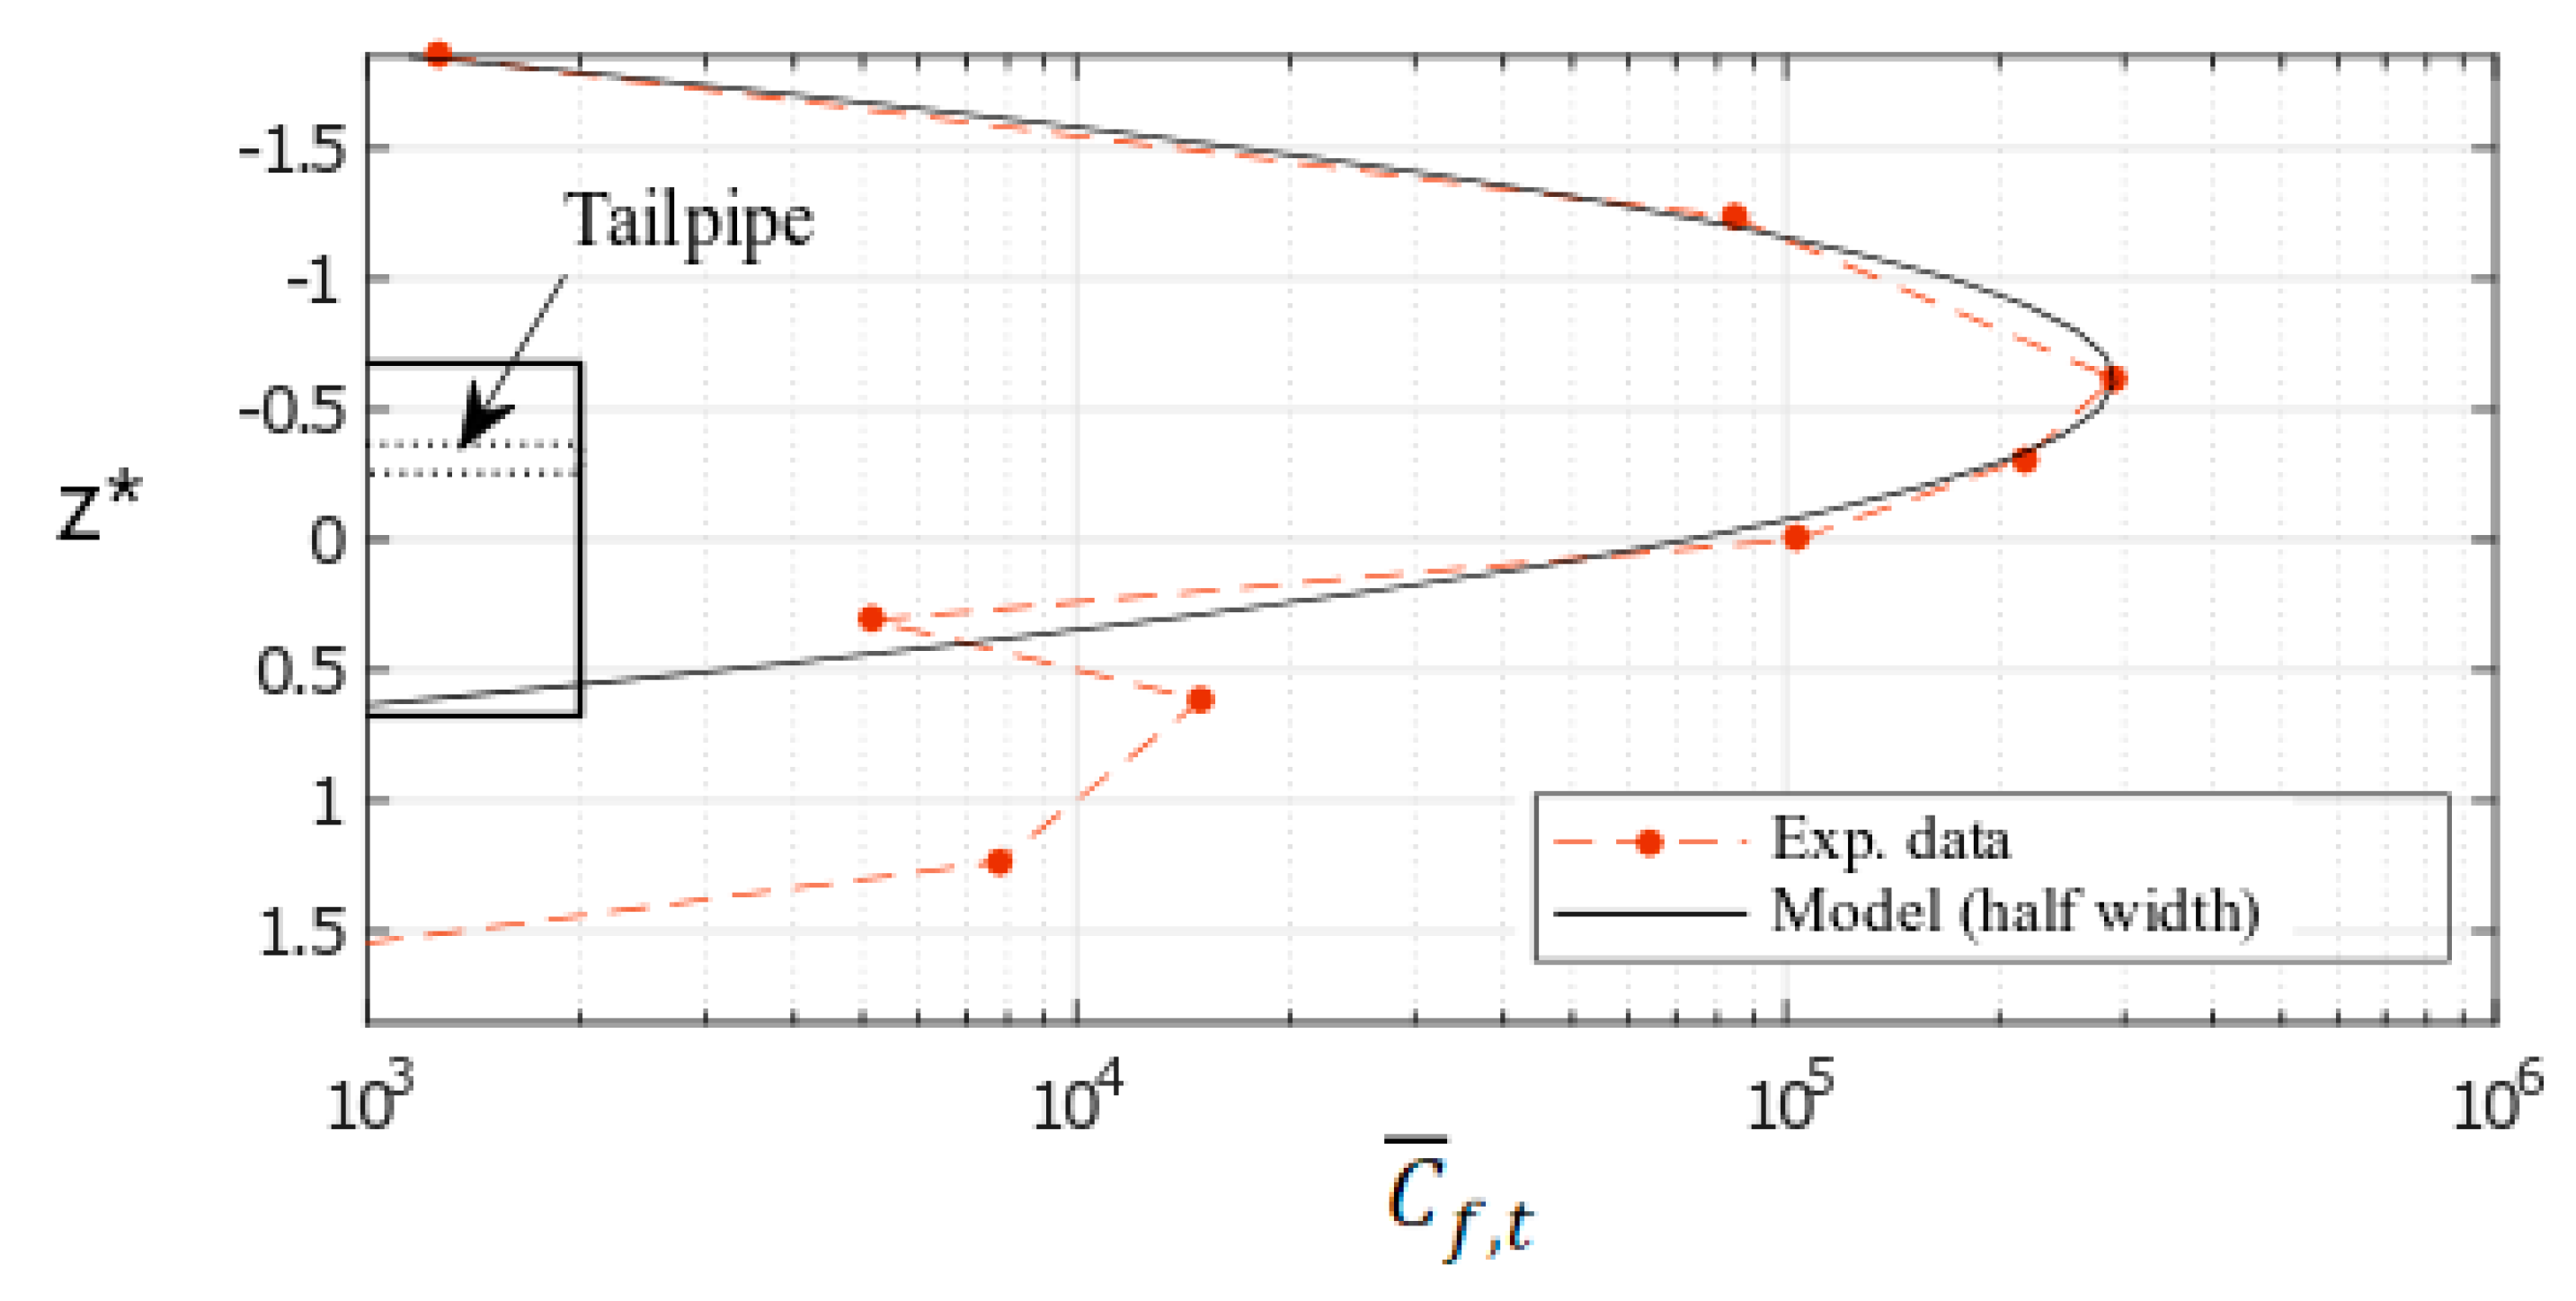
Taking that point into account, a first attempt was tried to improve the model. It considered the sole half-width of the vehicle containing the tailpipe. The updated model was applied at the same position as for Figure 7 showing that the correlation was significantly improved (Figure 8) on the tailpipe side. The diffusion coefficient in the z direction was re-evaluated to Dz = 0.0215 m2/s. In the previous model, Dz was overestimated (0.0253 m2/s), the difference being 18%.
To date, only a limited number of points were re-analysed and further investigations are then required. Nevertheless, it is believed that this preliminary result concerning the improved model is encouraging. The present model would be an asset to improve numerical models.

3.2. Two Vehicles

In real urban conditions, a single vehicle is not often encountered. Due to the traffic load, traffic lights and infrastructures (roundabout, road crossings…), the distance between two vehicles may be shortened while the vehicle speed is reduced. When the inter-vehicle distance is small, then an interaction between the two vehicles can arise in terms of fluid mechanics. The flow in the gap can be influenced by both vehicles (suction effect for instance). In the previous section, the key role of the recirculation region on the particle dispersion in the wake of a single vehicle was underlined. The interest is now focused on discussing the impact of the inter-vehicle distance on the mean and turbulent flow characteristics between two car models. It is reminded that the rear slant angle of the leading vehicle was either φ = 0°, 25° or 35° while the following one was always a square back vehicle (φ = 0°). Six dimensionless inter-vehicle distances were studied (D = d/h = 0.93; 1.85; 2.78; 3.70; 4.63 and 5.56). The case with the single vehicle will be considered as a reference case for which D tends to be infinite (D→∞). Here, the attention is drawn to the flow between the vehicles. Particles were not considered at this stage.
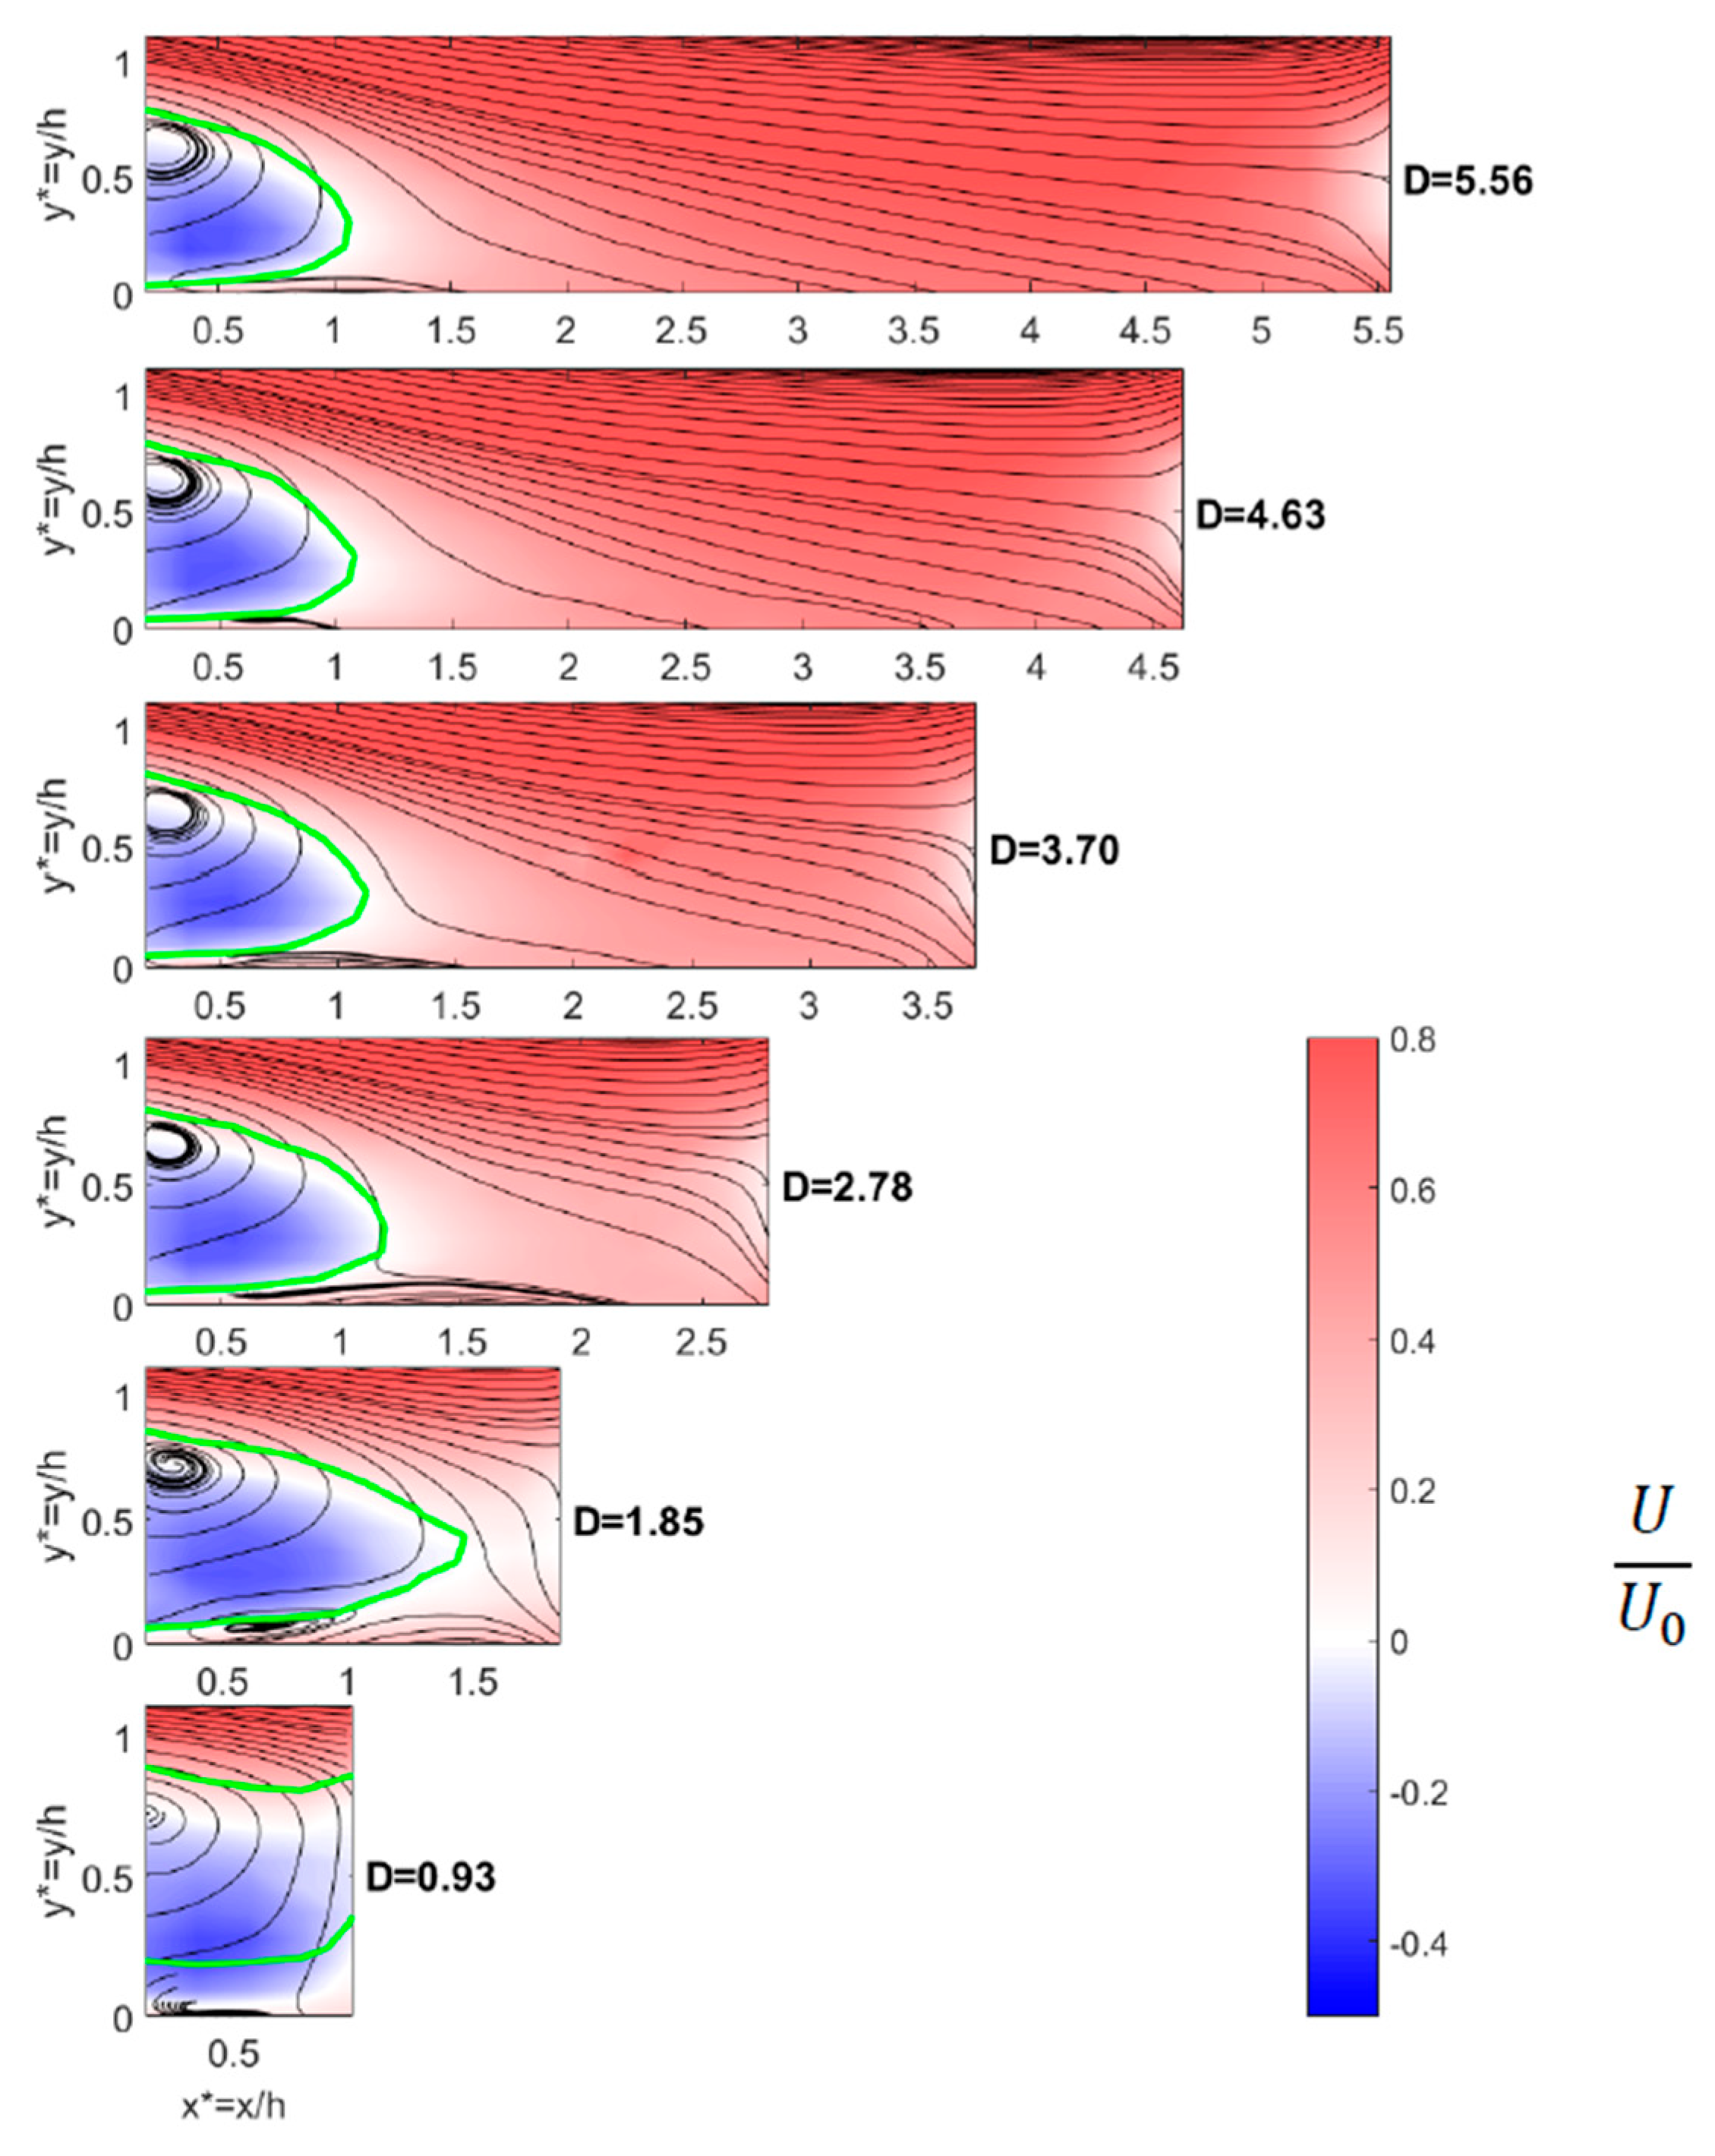
First, the influence of the inter vehicle distance on the recirculation length was studied. Table 7 provides the results for each experimental conditions. As an example, Figure 9 present the streamlines and dimensionless streamwise velocity for z* = 0 for the six inter-vehicle distances for φ = 35°. The green lines represent the isocontours (U = 0) used to define the recirculation length.
A critical inter-vehicle distance can be identified for each configuration. For φ = 0°, when D > 2.78, Lr/h appears to be constant (Lr/h ~ 1.4). Fluctuations are less than 3% with respect to the SV case. For φ = 35°, when D > 2.78, Lr/h ~ 1.08 and the corresponding fluctuations are below 6%. For φ = 25°, the critical inter-vehicle distance is D = 1.85. Above that distance, Lr/h ~ 0.57 with a fluctuation of ~5%. Overall, above these distances the following vehicle has a minor influence on the mean flow developing between the two vehicles.
In Table 8, the dimensionless positions of the centres of the upper (xA*; yA*) and lower (xB*; yB*) vortices appearing in the recirculation region are indicated.
The present findings show that the centre of upper vortex is almost stable for φ = 0° (xA/h ~ 0.70 and yA/h ~ 0.85), except for D = 0.93 where it tends to be closer to the rear face of the vehicle. Although the dispersion seems to be slightly larger for the longitudinal position xB*, a similar trend is observed for the lower vortex (xB/h ~ 0.7 and yB/h ~ 0.15). For φ = 25°, the lower vortex is always located at the underside level of the vehicle (yB/h ~ 0.1) while the upper vortex is at xA/h ~ 0.2 and yA/h ~ 0.40, except for D = 0.93. It is due to the downwash effect on the rear slant. For φ = 35°, the positions of both upper and lower vortices are remarkably stable for all D: xA/h ~ 0.25 and yA/h ~ 0.65 for the upper one, xB/h ~ 0.70 and yB/h ~ 0.05 for the lower one.
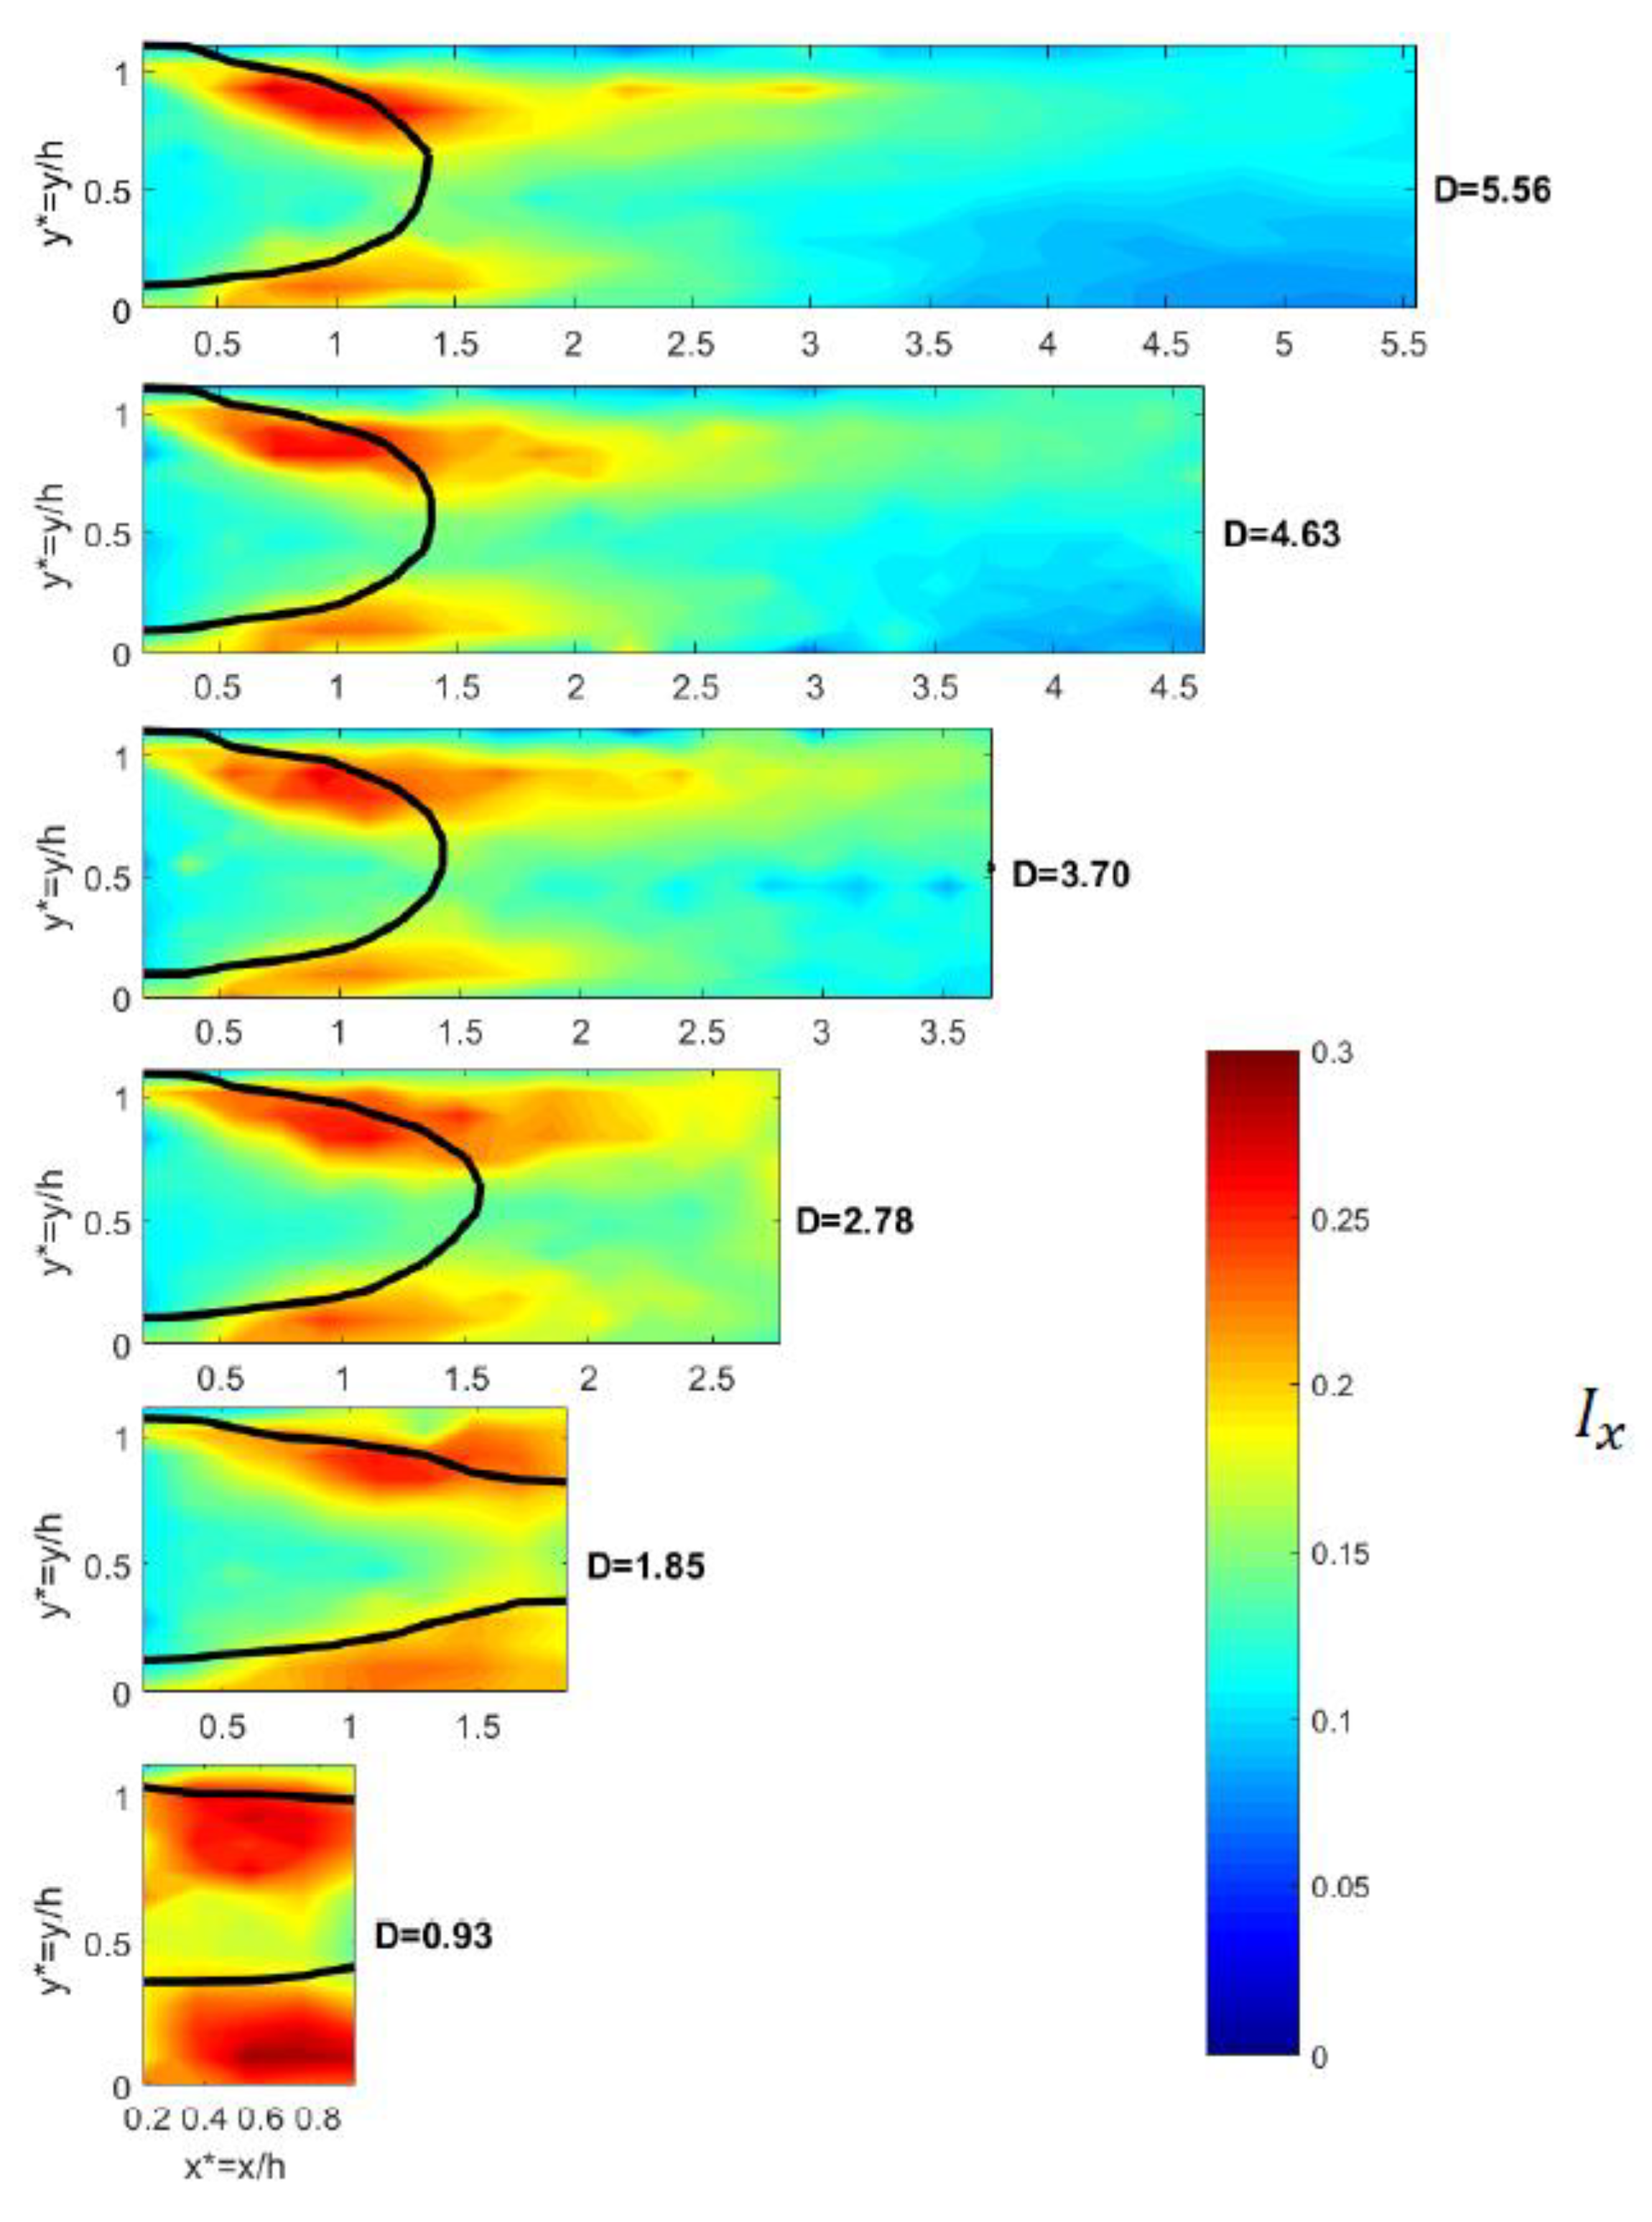
To compare the results of the longitudinal turbulent intensity (Ix) with those obtained for a single vehicle (Figure 4), the corresponding findings are presented on Figure 10 for the 6 dimensionless inter-vehicle distances, the leading vehicle having, for this example, a rear slant angle φ = 0°.
For the largest dimensionless inter-vehicle distance (D = 5.56), the highest levels of turbulence intensity are 28% in the upper shear layer and 23% in the lower shear layer. These magnitudes are very close to that observed for a single vehicle (Figure 4, top). Furthermore, in the upper shear layer, the maximum turbulent intensity remains nearly constant for all D (~26 to 28%) while in the lower part of the flow, the maximum (29%) is reached for the shortest inter-vehicle distance (D = 0.93). Overall, it is noticed that for D > 2.78, similar trends are depicted confirming the previous observation regarding the critical inter-vehicle distance.
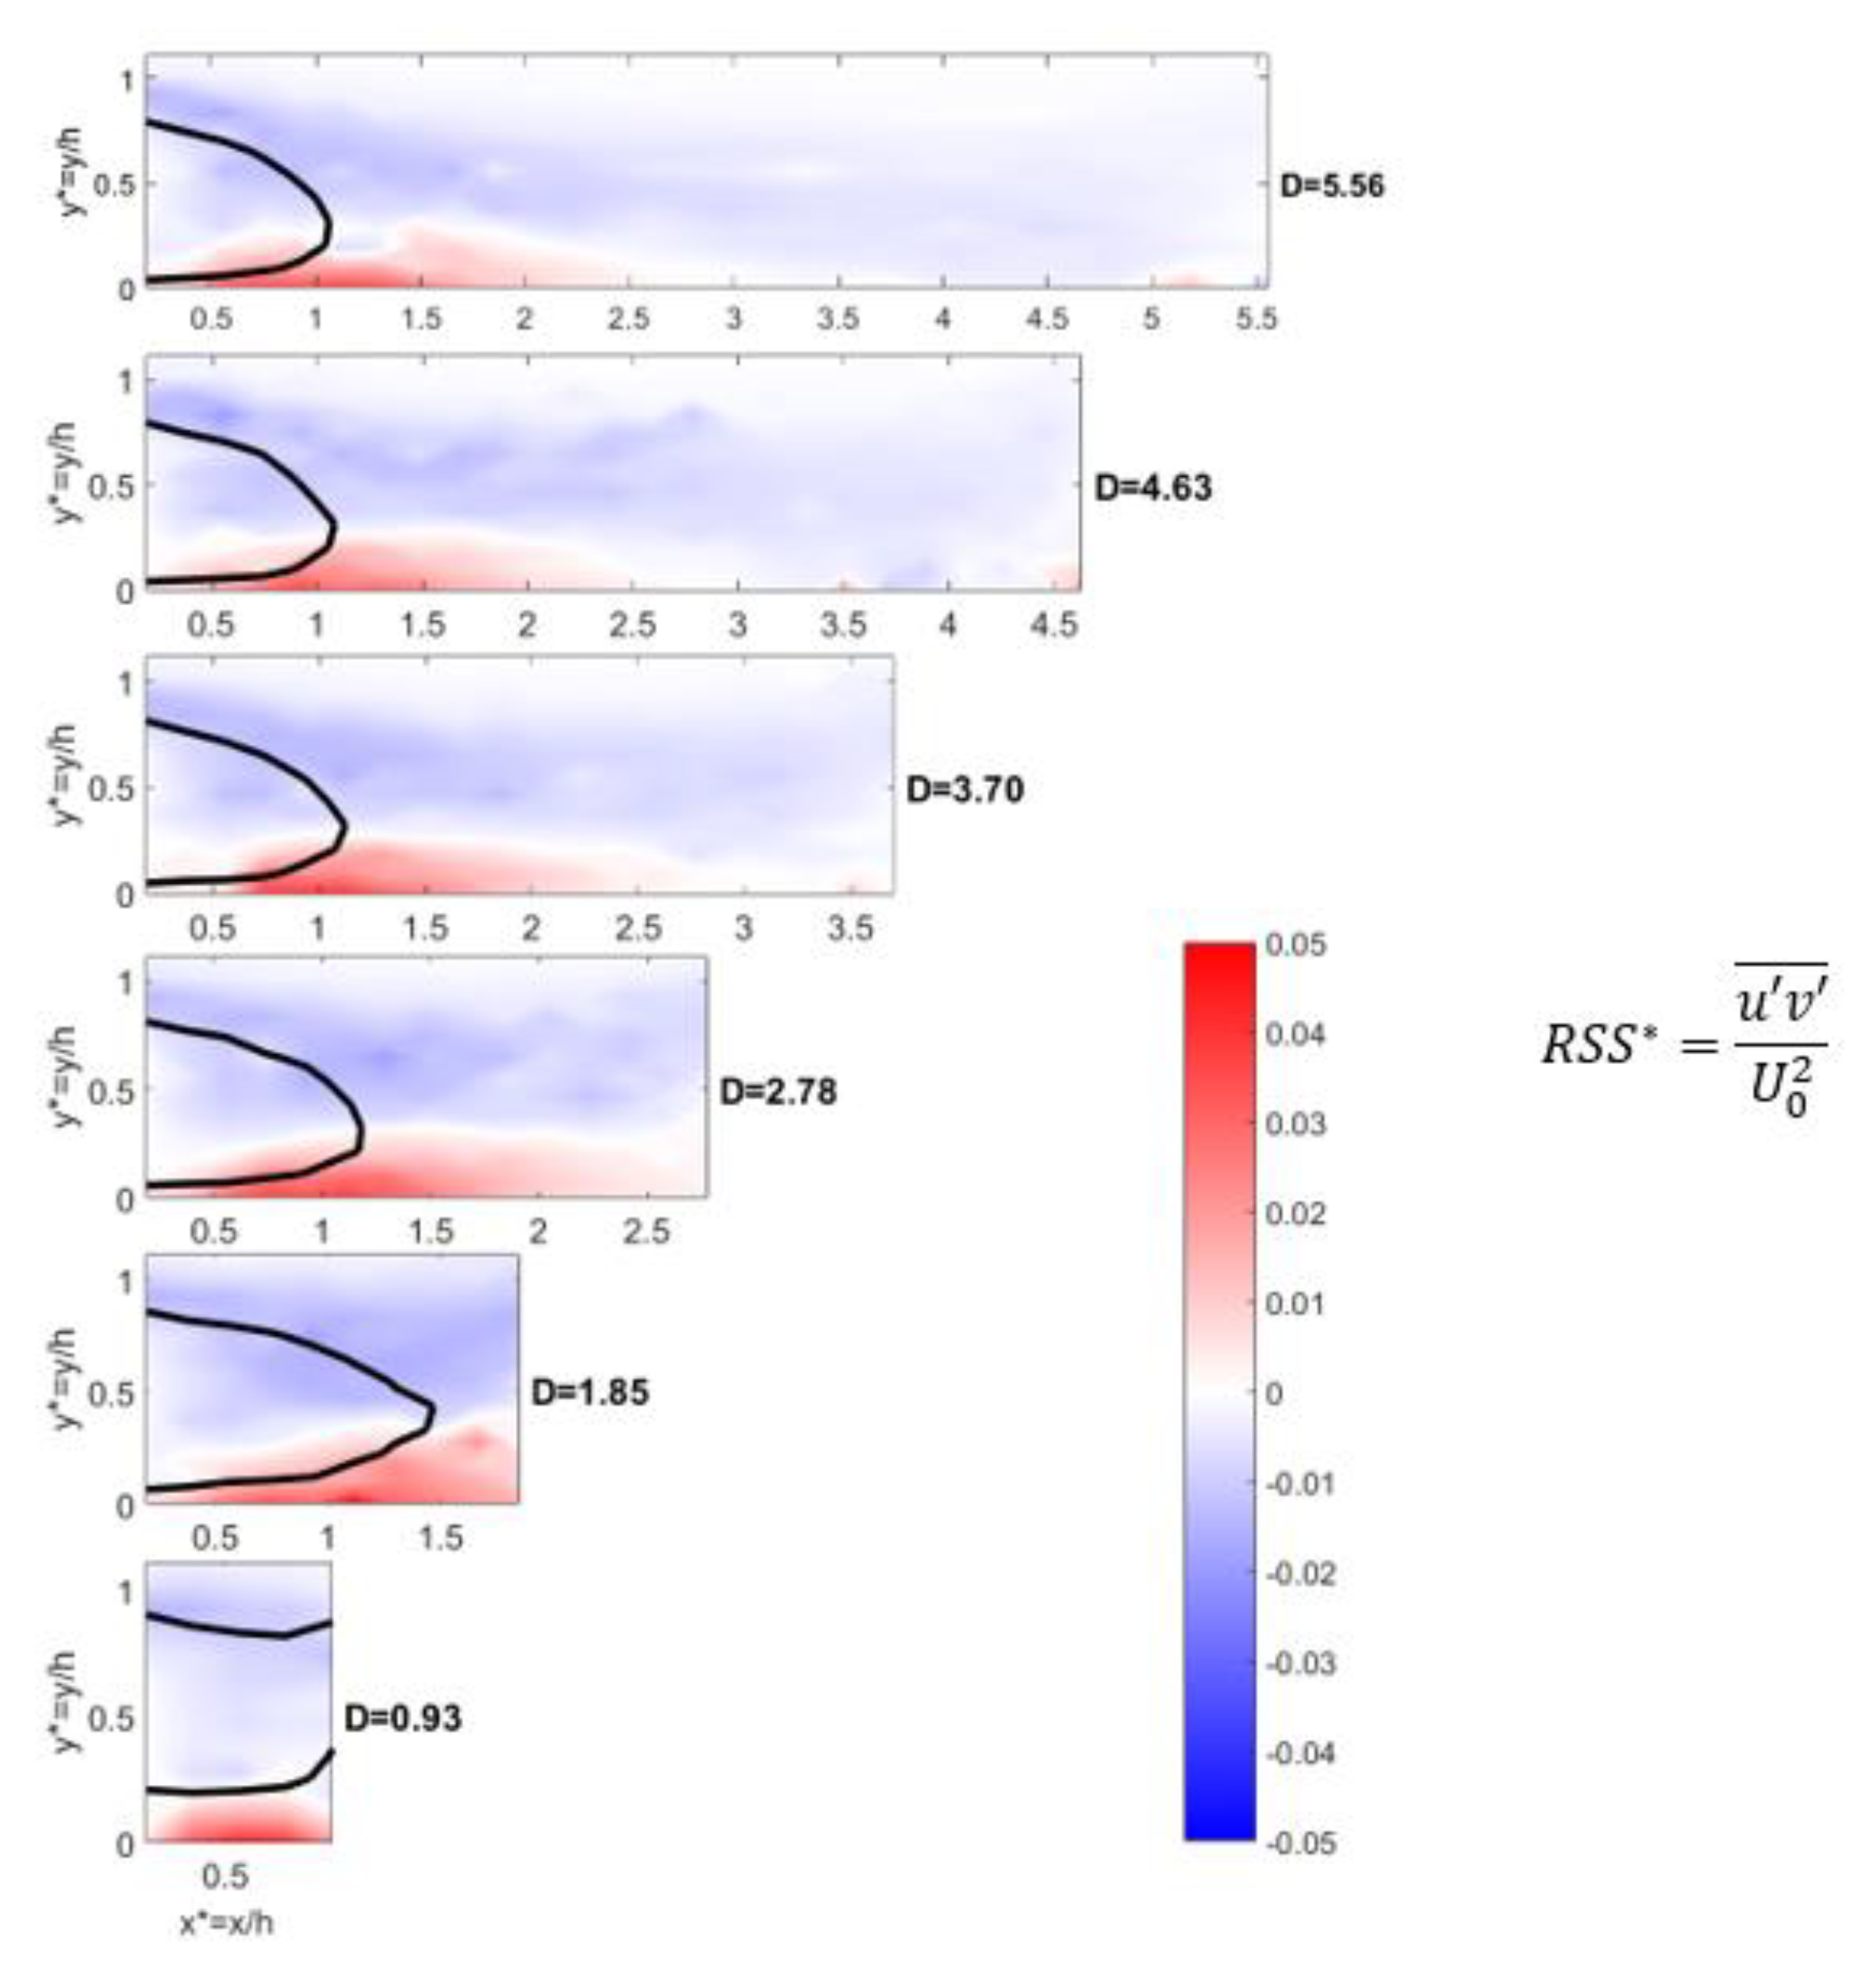
In order to deepen the characterization of the turbulent part, the maximum values of the dimensionless turbulent kinetic energy (TKE*) and their corresponding dimensionless positions are provided as a function of the dimensionless inter-vehicle distance for the three configurations (Table 9). A 2D vertical map of the TKE* at the centreline of the wind tunnel (z* = 0) is presented on Figure 11 for the six inter-vehicle distances for φ = 35°. On this figure, the red lines correspond to the isocontours U/U0 = 0. Similarly, the maximum and minimum values of the dimensionless Reynolds Shear Stresses (RSS*) in both upper and lower shear layers are given in Table 10 with their dimensionless positions. The reference values for a single vehicle (D→∞) are also indicated. Figure 12 present the 2D vertical map of RSS* field at the centreline of the wind tunnel (z* = 0) for the six inter-vehicle distances for φ = 35°. On this figure, the black lines correspond to the isocontours U/U0 = 0.
For φ = 0°, the most intense region is found in the upper shear layer from D = 1.85 to D = 5.56. An active region is shown for 0.5 < x* < 2 and 0.5 < y* < 1 closed to the boundary of the recirculation region. In these cases, the 2D map of the TKE* is not symmetric. For the shortest inter vehicle distance (D = 0.93), two intense regions are depicted, which are almost symmetric with respect to y* = 0.5. The maximum of TKE* in the upper shear layer is 0.068 while it is 0.065 in the lower one. For φ = 25°, the results are quite different. The 2D maps of the TKE* exhibit a major peak in the lower shear layer over a limited area (x* < 0.5 and y* < 0.2), which is the sole region of turbulent activity in the close wake. The downwash effect on the rear slant avoids peaks in the upper shear layer. In terms of magnitude, the region of this turbulent activity spreads over a smallest area compared to φ = 0°. For the shortest inter-vehicle distance, no more symmetry is observed as for φ = 0°. For φ = 35°, the most intense region is still located in the lower shear layer and spreads over a longer distance compared to φ = 25° (0.5 < x* < 1.5; 0 < y* < 0.2). These results are consistent with those of [49] for a single vehicle (SV, D→∞).
The RSS represent the correlation between the fluctuations of the velocity components in both horizontal and vertical directions. In the present experiments, negative values are always observed in the upper shear layer while positive ones are depicted in the lower shear layer. This is in agreement with the results of [49]. Furthermore, the relative area of each of them changes with the rear slant angle. For φ = 0°, the distribution of RSS* is almost symmetric with respect to y* = 0.5 (RSS* < 0 for y* > 0.5; RSS* > 0 for y* < 0.5). The magnitude is larger in the upper shear layer (~0.03 to 0.04) compared to the lower one (~0.015 to 0.020), except for D = 0.93 where close values are found (~0.03). For φ = 25°, the region of negative RSS* becomes significantly larger compared to that associated with positive values. One more time, it can be explained by the downwash effect created by the rear slant and the attachment of the flow in it (in this region, U > 0 and V < 0). Furthermore, larger magnitudes are observed in the lower shear layer even for the shortest inter vehicle distances (~0.02 to 0.03) compared to the upper one (~0.01 to 0.02). For φ = 35°, the situation is rebalanced. The flow is no more attached on the rear slant explaining a larger area of positive RSS in the lower shear layer. In terms of magnitude, it is more intense in this lower shear layer (~0.035 to 0.05) compared to the upper one (~0.015 to 0.02).

4. Conclusions and Perspectives

In the present paper, new results dealing with the dispersion of UFP in the wake of three simplified car models were reported. Based on wind tunnel experiments at a reduced scale, the relation between the flow dynamics (mean and turbulent) and the Particle Number Concentration (PNC) fields is studied. First, a brief description of the main properties of the flow in the wake of a single vehicle is given. The key role of the recirculation region in the close wake on the dispersion of UFP in the close and far fields is pointed out. Depending on the rear slant angle (φ), the crucial role of longitudinal vortices developing from the side of the vehicle on the particle dispersion was also depicted (φ = 25°). They strongly influenced the dynamics of UFP emitted from the tailpipe of simplified car models. Then, an analytical model was developed aiming at describing the UFP concentration fields in the wake of three Ahmed bodies. On the one hand, the developed model is almost accurate to depict the vertical dispersion for the three rear slants. The dispersion coefficient in the vertical direction (Dy) is stronger for φ = 0° compared to φ = 35° and φ = 25°, respectively. On the other hand, the model seems to be less efficient to assess the transversal dispersion coefficient (Dz) although some good results were obtained for φ = 0°. Indeed, for φ = 25°, the longitudinal vortices, which originate from the edges of the car model, modify the PNC fields. A second peak appears on the profiles impacting the accuracy of the model. Based on this finding, an improved version of the model is suggested. It only considers the half width of the car model containing the tailpipe. Applied to some preliminary points, it improved significantly the description of the UFP dispersion for φ = 25°. In the last part of the present paper, a new set of experiments is presented considering the interaction of two car models depending on the inter vehicle distance. A critical distance was identified above which the presence of the second vehicle has not a strong influence of the development of the recirculation region. Altogether, it is believed that the present results bring new insights on the understanding of pollutant dispersion in the wake of vehicle and their related issues for ground transportation. Future works will be dedicated to the study of particle dispersion with two vehicles and different inter-vehicle distances. A better calibration and Improvement of the analytical model will be suggested for the benefit of computing engineers and numerical analysts.

Author Contributions

Conceptualization, F.M. and G.F.; methodology, F.M., G.F. and R.R.; software, R.R. and C.S.; validation, F.M., G.F., R.R. and C.S.; formal analysis, R.R. and C.S.; investigation, F.M., G.F., R.R. and C.S.; resources, F.M.; data curation, R.R. and C.S.; writing—original draft preparation, F.M.; writing—review and editing, F.M. and F.L.; visualization, F.M., R.R. and F.L.; supervision, F.M., G.F., F.L. and A.M.; project administration, F.M., G.F., F.L. and A.M.; funding acquisition, F.M., G.F. and A.M. All authors have read and agreed to the published version of the manuscript.

Funding

ESTACA and Regional Council of Pays de la Loire (France) funded this research.

Conflicts of Interest

The authors declare no conflict of interest.

References

  1. Pasquier, A.; André, M. Considering criteria related to spatial variabilities for the assessment of air pollution from traffic. Transp. Res. Procedia 2017, 25, 3358–3373. [Google Scholar] [CrossRef]
  2. Int Panis, L.; De Geus, B.; Vandenbulcke, G.; Willems, H.; Degraeuwe, B.; Bleux, N.; Mishra, V.; Thomas, I.; Meeusen, R. Exposure to particulate matter in traffic: A comparison of cyclists and car passengers. Atmos. Environ. 2010, 44, 2263–2270. [Google Scholar] [CrossRef]
  3. Joodatnia, P.M.; Kumar, P.; Robins, A. The behaviour of traffic produced nanoparticles in a car cabin and resulting exposure rates. Atmos. Environ. 2013, 65, 40–51. [Google Scholar] [CrossRef] [Green Version]
  4. Knibbs, L.D.; de Dear, R.J. Exposure to ultrafine particles and PM2.5 in four Sydney transport modes. Atmos. Environ. 2010, 44, 3224–3227. [Google Scholar] [CrossRef] [Green Version]
  5. Knibbs, L.D.; Cole-Hunter, T.; Morawska, L. A review of commuter exposure to ultrafine particles and its health effects. Atmos. Environ. 2011, 45, 2611–2622. [Google Scholar] [CrossRef] [Green Version]
  6. Xu, B.; Zhu, Y. Investigation on lowering commuters’ in-cabin exposure to ultrafine particles. Transp. Res. Part D Transp. Environ. 2013, 18, 122–130. [Google Scholar] [CrossRef]
  7. Airparif. Mesures Dans le Flux de Circulation. Etude Exploratoire; Rapport Airparif (Internal Report); Airparif: Paris, France, 2007; p. 35. [Google Scholar]
  8. Airparif. Exposition des Automobilistes Franciliens à la Pollution Atmosphérique Liée au Trafic Routier: Trajet «Domicile-Travail»; Rapport Airparif (Internal Report); Airparif: Paris, France, 2009; p. 104. [Google Scholar]
  9. Hudda, N.; Eckel, S.P.; Knibbs, L.D.; Sioutas, C.; Delfino, R.J.; Fruin, S.A. Linking in-vehicle ultrafine particle exposures to on-road concentrations. Atmos. Environ. 2012, 59, 578–586. [Google Scholar] [CrossRef] [Green Version]
  10. Hudda, N.; Kostenidou, E.; Sioutas, C.; Delfino, R.J.; Fruin, S.A. Vehicle and driving characteristics that influence in-cabin particle number concentrations. Environ. Sci. Technol. 2011, 45, 8691–8697. [Google Scholar] [CrossRef]
  11. Mehel, A.; Murzyn, F.; Cuvelier, P.; Deville Cavellin, L.; Baudic, A.; Joly, F.; Patte-Rouland, B.; Varéa, E.; Sioutas, C. Rapport Final du Projet CAPTIHV, Caractérisation et Analyse des Polluants Issus du Transport Automobile s’Infiltrant Dans les Habitacles des Véhicules; ADEME: Paris, France, 2019; p. 136. Available online: https://www.ademe.fr/caracterisation-analyse-polluants-issus-transport-automobile-sinfiltrant-habitacles-vehicules (accessed on 27 November 2019).
  12. Knibbs, L.D.; de Dear, R.J.; Morawska, L. Effect of cabin ventilation rate on ultrafine particle exposure inside automobiles. Environ. Sci. Technol. 2010, 44, 3546–3551. [Google Scholar] [CrossRef]
  13. ANSES. Concentrations de CO2 Dans L’air Intérieur et Ses Effets sur la Santé. Avis de l’Anses; Rapport D’expertise Collective; ANSES: Maisons-Alfort, France, 2013; 273p. [Google Scholar]
  14. ANSES. Particules de l’air Ambiant Extérieur. Effets Sanitaires des Particules de L’air Ambiant Extérieur Selon les Composés, les Sources et la Granulométrie. Impact sur la Pollution Atmosphérique des Technologies et de la Composition du Parc de Véhicules Automobiles Circulant en France, Avis de l’ANSES; Rapport de Synthèse et de Recommandations de L’expertise Collective; ANSES: Maisons-Alfort, France, 2019; p. 42. [Google Scholar]
  15. Lelieveld, J.; Klingmüller, K.; Pozzer, A.; Pöschl, U.; Fnais, M.; Daiber, A.; Münzel, T. Cardiovascular disease burden from ambient air pollution in Europe reassessed using novel hazard ratio functions. Eur. Heart J. 2019, 40, 1–7. [Google Scholar] [CrossRef] [Green Version]
  16. World Health Organization. Air Quality Guidelines for Particulate Matter, Ozone, Nitrogen Dioxide and Sulfur Dioxide; Report; World Health Organization: Geneva, Switzerland, 2006; 22p. [Google Scholar]
  17. World Health Organization. Review of Evidence on Health Aspects of Air Pollution—REVIHAAP Project; Technical report; World Health Organization: Geneva, Switzerland, 2013; p. 302. [Google Scholar]
  18. World Health Organization. Human Health in Areas with Industrial Contamination; Mudu, P., Terracini, B., Martuzzi, M., Eds.; World Health Organization: Geneva, Switzerland, 2014; p. 361. [Google Scholar]
  19. U.S. EPA. Final Report, 2009: Integrated Science Assessment (ISA) for Particulate Matter; EPA/600/R-08/139F; U.S. Environmental Protection Agency: Washington, DC, USA, 2009.
  20. Centre International de Recherche sur le Cancer. Les gaz d’échappement des moteurs Diesel cancérogènes. In Communiqué de Presse n°213; Centre International de Recherche sur le Cancer: Lyon, France, 2012; 5p. [Google Scholar]
  21. Valentino, S. Effets Multigénérationnels D’une Exposition Maternelle aux Gaz D’échappement de Moteur Diesel Pendant la Gestation sur le Développement Foeto-Placentaire Dans un Modèle Lapin. Ph.D. Thesis, University of Paris Saclay, Jouy en Josas, France, 24 November 2016; p. 505. [Google Scholar]
  22. Buzea, C.; Pacheco, I.I.; Robbie, K. Nanomaterials and nanoparticles: Sources and toxicity. Biointerphases 2007, 2, 17–71. [Google Scholar] [CrossRef] [PubMed] [Green Version]
  23. Maesano, C.N.; Morel, G.; Matynia, A.; Ratsombath, N.; Bonnety, J.; Legros, G.; Da Costa, P.; Prud’homme, J.; Annesi-Maesano, I. Impacts on human mortality due to reductions in PM10 concentrations through different traffic scenarios in Paris, France. Sci. Total Environ. 2020, 698, 134257. [Google Scholar] [CrossRef] [PubMed]
  24. ADEME. La pollution de l’air en 10 questions. In Comment Respirer un Air de Meilleure Qualité; ADEME: Paris, France, 2018; p. 27. [Google Scholar]
  25. Morawska, L.; Ristovski, Z.; Jayaratne, E.R.; Keogh, D.U.; Ling, X. Ambient nano and ultrafine particles from motor vehicle emissions: Characteristics, ambient processing and implications on human exposure. Atmos. Environ. 2008, 42, 8113–8138. [Google Scholar] [CrossRef] [Green Version]
  26. Jeng, C.J.; Kindzierski, W.B.; Smith, D.W. Particle Penetration through Inclined and L -Shaped Cracks. J. Environ. Eng. 2007, 133, 331–339. [Google Scholar] [CrossRef]
  27. Liu, D.-L.; Nazaroff, W.W. Particle penetration through building cracks. Aerosol Sci. Technol. 2003, 37, 565–573. [Google Scholar] [CrossRef] [Green Version]
  28. Lee, E. Passenger Exposures to Ultrafine Particules and In-Cabin Air Quality Control. Ph.D. Thesis, University of California Los Angeles, Los Angeles, CA, USA, 2013; p. 137. [Google Scholar]
  29. Cole-Hunter, T.; Morawska, L.; Stewart, I.; Jayaratne, R.; Solomon, C. Inhaled particle counts on bicycle commute routes of low and high proximity to motorised traffic. Atmos. Environ. 2012, 6, 197–203. [Google Scholar] [CrossRef] [Green Version]
  30. Grady, M.; Jung, H.; Kim, Y.C.; Park, J.K.; Lee, B.C. Vehicle Cabin Air Quality with Fractional Air Recirculation. SAE Tech. Pap. 2013. [Google Scholar] [CrossRef] [Green Version]
  31. Morin, J.-P.; Gouriou, F.; Preterre, D.; Bobbia, M.; Delmas, V. Évaluation de l’exposition aux polluants atmosphériques des conducteurs de véhicules automobiles par la mise en œuvre de mesures dynamiques dans l’habitacle du véhicule. Archives Maladies Professionnelles l’Environnement 2009, 70, 184–192. [Google Scholar] [CrossRef]
  32. Campagnolo, D.; Cattaneo, A.; Corbella, L.; Borghi, F.; Del Buono, L.; Rovelli, S.; Spinazzé, A.; Cavallo, D.M. In-vehicle airborne fine and ultra-fine particulate matter exposure: The impact of leading vehicle emissions. Environ. Int. 2019, 123, 407–416. [Google Scholar] [CrossRef]
  33. Ahmed, S.; Ramm, G.; Faltin, G. Some salient features of the time-averaged ground vehicle wake. SAE Tech. Pap. Ser. 1984, 1–30. [Google Scholar] [CrossRef]
  34. Gillieron, P.; Kourta, A. Aérodynamique Automobile Pour L’environnement, le Design et la Sécurité, 2nd ed.; Cépaduès: Toulouse, France, 2013; p. 340. [Google Scholar]
  35. Corallo, M.; Sheridan, J.; Thompson, M.C. Effect of aspect ratio on the near-wake flow structure of an Ahmed body. J. Wing Eng. Ind. Aerodyn. 2015, 147, 95–103. [Google Scholar] [CrossRef]
  36. Guilmineau, E. Computational study of the flow around a simplified car body. J. Wind Eng. Ind. Aerodyn. 2008, 96, 1207–1217. [Google Scholar] [CrossRef]
  37. Tunay, T.; Yaniktepe, B.; Sahin, B. Computational and experimental investigations of the vertical flow structures in the near wake region downstream of the Ahmed vehicle model. J. Wind Eng. Ind. Aerodyn. 2016, 159, 48–64. [Google Scholar] [CrossRef]
  38. Gosse, K. Etude Expérimentale de la Dispersion d’un Scalaire Passif Dans le Sillage Proche d’un Corps d’Ahmed. Ph.D. Thesis, University of Rouen, Rouen, France, 30 November 2005; 178p. [Google Scholar]
  39. Grandemange, M. Analysis and Control of Three-Dimensional Turbulent Wakes: From Axisymmetric Bodies to Road Vehicles. Ph.D. Thesis, ENSTA ParisTech, Palaiseau, France, 2 December 2013; p. 238. [Google Scholar]
  40. Grandemange, M.; Gohlke, M.; Cadot, O. Turbulent wake past a three-dimensional blunt body. Part 1. Global modes and bi-stability. J. Fluid Mech. 2013, 722, 51–84. [Google Scholar] [CrossRef] [Green Version]
  41. Eulalie, Y. Etude Aérodynamique et Contrôle de la Traînée Sur un Corps de Ahmed Culot Droit. Ph.D. Thesis, University of Bordeaux, Bordeaux, France, 15 December 2014; p. 198. [Google Scholar]
  42. Tunay, T.; Sahin, B.; Ozboloat, V. Effects of rear slant angles on the flow characteristics of Ahmed body. Exp. Therm. Fluid Sci. 2014, 57, 165–176. [Google Scholar] [CrossRef]
  43. Thacker, A. Contribution Expérimentale à L’analyse Stationnaire et Instationnaire de L’écoulement à L’arrière D’un Corps de Faible Allongement. Ph.D. Thesis, University of Orléans, Orléans, France, 14 December 2010; p. 212. [Google Scholar]
  44. Thacker, A.; Aubrun, S.; Leroy, A.; Devinant, P. Effects of suppressing the 3D separation on the rear slant on the flow structures around an Ahmed body. J. Wind Eng. Ind. Aerodyn. 2012, 107–108, 237–243. [Google Scholar] [CrossRef]
  45. Thacker, A.; Aubrun, S.; Leroy, A.; Devinant, P. Experimental characterization of flow unsteadiness in the centerline plane of an Ahmed body rear slant. Exp. Fluids 2012, 54, 1–16. [Google Scholar] [CrossRef]
  46. Lienhart, H.; Becker, S. Flow and turbulence structure in the wake of a simplified car model. SAE Tech. Pap. Ser. 2003, 1–12. [Google Scholar] [CrossRef] [Green Version]
  47. Wang, X.W.; Zhou, Y.; Pin, Y.F.; Chan, T.L. Turbulent near wake of an Ahmed vehicle model. Exp. Fluids 2013, 54, 1–19. [Google Scholar] [CrossRef]
  48. Leclerc, C. Réduction de la Traînée d’un Véhicule Automobile Simplifié à L’aide du Contrôle Actif Par Jet Synthétique. Ph.D. Thesis, Institut de Mécanique des Fluides de Toulouse, Toulouse, France, 11 January 2008; p. 330. [Google Scholar]
  49. Rodriguez, R. Etude Expérimentale de la Dispersion de Particules Ultrafines Dans le Sillage de Modèles Simplifies de Véhicules Automobiles. Ph.D. Thesis, Ecole Centrale de Nantes, Nantes, France, 22 October 2018; p. 270. [Google Scholar]
  50. West, G.S.; Apelt, C.J. The effect of tunnel blockage and aspect ratio on the mean flow past a circular cylinder with Reynolds numbers between 10,000 and 100,000. J. Fluid Mech. 1982, 114, 361–377. [Google Scholar] [CrossRef]
  51. Comité des Constructeurs Français d’Automobiles. L’industrie Automobile Française: Analyse et Statistiques; 2017; p. 98. Available online: https://ccfa.fr/wp-content/uploads/2018/09/analyse_statistiques_2018_fr.pdf (accessed on 27 November 2019).
  52. DANTEC Dynamics. BSA Flow Software v5.03—Users Guide; DANTEC Dynamics: Skovlunde, Denmark, 2012; p. 412. [Google Scholar]
  53. DANTEC Dynamics. LDA Calibration Certificate n°156; DANTEC Dynamics: Skovlunde, Denmark, 2012. [Google Scholar]
  54. Rodriguez, R.; Murzyn, F.; Aubry, J.; Mehel, A.; Larrarte, F. An innovative LDV data processing method for statistical error corrections. Application to homogeneous and non-homogeneous seeding. Flow Meas. Instrum. 2018, 60, 67–77. [Google Scholar] [CrossRef]
  55. SAFEX. SAFEX Fog Generator User’s Guide; SAFEX: Tangstedt, Germany, 2003; p. 28. [Google Scholar]
  56. SAFEX. SAFEX Inside Fog Fluids—Binding Manufacturer’s Declaration; SAFEX: Tangstedt, Germany, 2005; p. 2. [Google Scholar]
  57. Tropea, C.; Yarin, A.L.; Foss, J.F. Handbook of Experimental Fluid Mechanics; Springer: Berlin/Heidelberg, Germany, 2007; Volume 53, p. 1557. [Google Scholar]
  58. PALAS. DNP Digital 2000—Operating Manual; PALAS: Karlsruhe, Germany, 2009; p. 20. [Google Scholar]
  59. DEKATI. ELPI User Manual v4.11; DEKATI: Kangasala, Finland, 2010; p. 148. [Google Scholar]
  60. Mehel, A.; Murzyn, F. Effect of air velocity on nanoparticles dispersion in the wake of a vehicle model: Wind tunnel experiments. Atmos. Pollut. Res. 2015, 6, 612–617. [Google Scholar] [CrossRef] [Green Version]
  61. Rodriguez, R.; Balou, D.; Varéa, E.; Murzyn, F.; Mehel, A.; Patte-Rouland, B.; Larrarte, F. Correction des erreurs statistiques aléatoires et systématiques par une nouvelle méthode de traitement LDV. Application aux écoulements de sillage du corps d’Ahmed. In Proceedings of the 16ème Congrès Francophone de Techniques Laser Pour la Mécanique des Fluides, Dourdan, France, 17–21 September 2018; p. 8. [Google Scholar]
  62. Barros, D. Wake and Drag Manipulation of a Bluff Body Using Fluidic Forcing. Ph.D. Thesis, ISAE-ENSMA, Poitiers, France, 11 December 2015; p. 97. [Google Scholar]
  63. Lahaye, A. Caractérisation de L’écoulement Autour D’un Corps d’Ahmed à Culot Droit. Ph.D. Thesis, University of Orléans, Orléans, France, 6 June 2014; p. 159. [Google Scholar]
  64. Hucho, W.H. Aerodynamics of Road Vehicles; Butterworths and Co.: London, UK, 1987. [Google Scholar]
  65. Rodriguez, R.; Murzyn, F.; Mehel, A.; Larrarte, F. Ultrafine particle dispersion in the wake of a squareback vehicle model. In Proceedings of the 23rd Transport and Air Pollution Conference, Thessaloniki, Greece, 15–17 May 2019; p. 10. [Google Scholar]
  66. Rodriguez, R.; Murzyn, F.; Mehel, A.; Larrarte, F. Dispersion of ultrafine particles in the wake of car models: A wind tunnel study. J. Wind Eng. Ind. Aerodyn. 2019. under review. [Google Scholar]
  67. Carpentieri, M.; Kumar, P.; Robins, A. Wind tunnel measurements for dispersion modelling of vehicle wakes. Atmos. Environ. 2012, 62, 9–25. [Google Scholar] [CrossRef] [Green Version]
  68. Kanda, I.; Uehara, K.; Yamao, Y.; Yoshikawa, Y.; Morikawa, T. A wind-tunnel study on exhaust gas dispersion from road vehicles Part I: Velocity and concentration fields behind single vehicles. J. Wind Eng. Ind. Aerodyn. 2006, 94, 639–658. [Google Scholar] [CrossRef]
  69. Richards, K. Computational Modeling of Pollution Dispersion in the Near Wake of a Vehicle. Ph.D. Thesis, University of Nottingham, Nottingham, UK, 2002; p. 243. [Google Scholar]
  70. Murzyn, F.; Mouaze, D.; Chaplin, J.R. Optical fibre probe measurements of bubbly flow in hydraulic jumps. Int. J. Multiph. Flow 2005, 31, 141–154. [Google Scholar] [CrossRef]
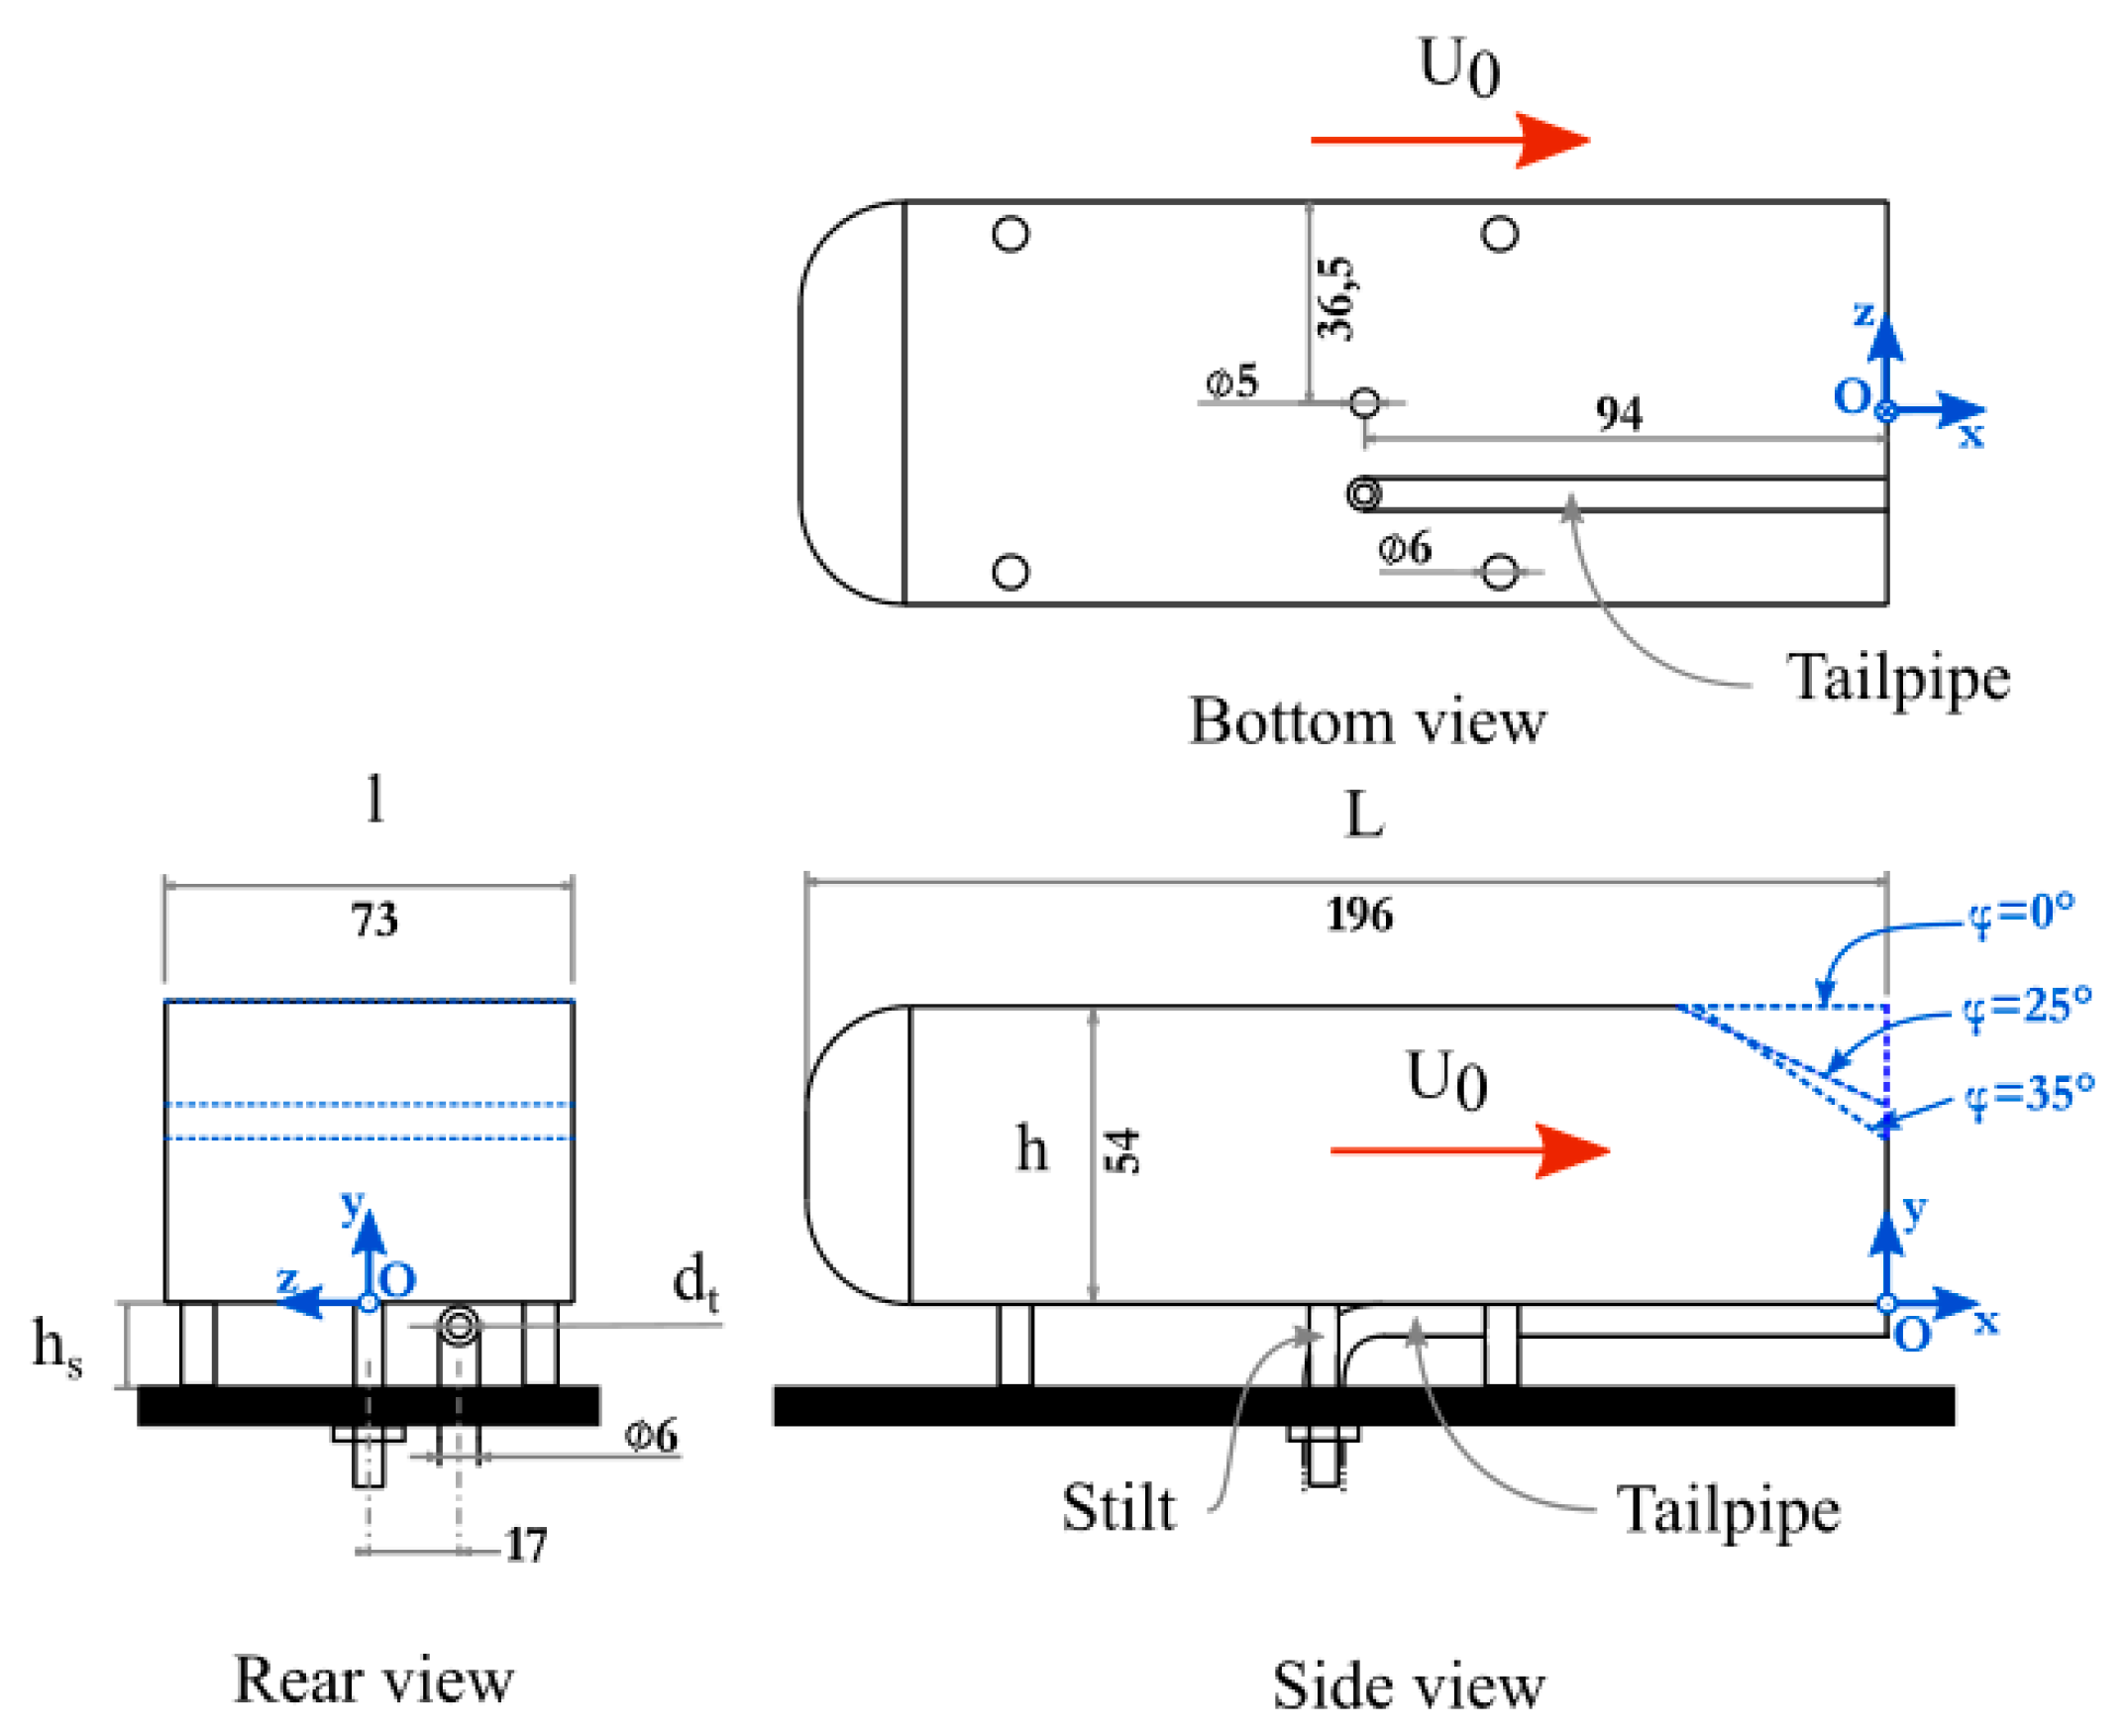
Figure 1. Ahmed bodies with all relevant notations and dimensions (in mm) [49].
Atmosphere 11 00039 g001
Figure 2. (a) Experimental setup and relevant notations; (b) Experimental setup with the two vehicles.
Atmosphere 11 00039 g002
Figure 3. Experimental setup [49].
Atmosphere 11 00039 g003
Figure 4. Turbulence intensity in the streamwise direction (Ix) for z* = 0 for the three car models (SV) [49].
Atmosphere 11 00039 g004
Figure 5. Normalized elevations as a function of dimensionless concentrations [49].
Atmosphere 11 00039 g005
Figure 6. Example of accurate modelling of the transversal dispersion of UFP (φ = 0°, x* = 2.43; y* = 0.52; r2 = 0.99) [49].
Atmosphere 11 00039 g006
Figure 7. Example of inaccurate modelling of the transversal dispersion of UFP (φ = 25°, x* = 5.20; y* = 0.33; r2 = 0.84) [49].
Atmosphere 11 00039 g007
Figure 8. Improvement of the modelling of the transversal dispersion of UFP (φ = 25°, x* = 5.20; y* = 0.33; r2 = 0.84) using the half width model [49].
Atmosphere 11 00039 g008
Figure 9. Streamlines and dimensionless streamwise velocity for z* = 0 for the six inter-vehicle distances D (φ = 35°). Green lines are isocontours U/U0 = 0.
Atmosphere 11 00039 g009
Figure 10. Turbulence intensity in the streamwise direction for z* = 0 for the six inter-vehicle distances D (φ = 0°). Black lines are isocontours U/U0 = 0.
Atmosphere 11 00039 g010
Figure 11. 2D vertical map of the TKE* at the centreline of the wind tunnel (z* = 0) for the six inter-vehicle distances (φ = 35°).
Atmosphere 11 00039 g011
Figure 12. 2D vertical map of the RSS* at the centreline of the wind tunnel (z* = 0) for the six inter-vehicle distances (φ = 35°).
Atmosphere 11 00039 g012
Table 1. Recirculation length as a function of the rear slant angle for a single vehicle.
Rear Slant Angle25°35°
Lr/h1.390.581.06
Table 2. Positions of upper (A) and lower (B) vortices of the present experiments.
Positions of Upper and Lower Vorticesφ = 0°φ = 25°φ = 35°
Centre of upper vortex A (xA*; yA*). Present study(0.62; 0.84)(0.19; 0.37)(0.21; 0.70)
Centre of upper vortex A (xA*; yA*). Literature(0.81; 0.82)(0.24; 0.38)(0.43; 0.67)
Center of lower vortex B (xB*; yB*). Present study(0.70; 0.14)N/AN/A
Center of lower vortex B (xB*; yB*). Literature(0.74; 0.13)(0.36; 0.06)(0.56; 0.09)
Table 3. Mean and standard deviation for r2 and percentage of profiles for which r2 > 0.9 (vertical diffusion coefficient Dy).
r2φ = 0°φ = 25°φ = 35°
Average0.9490.9060.983
Standard deviation0.0430.1000.015
r2 > 0.983.3%66.7%96.7%
Table 4. Mean values and the corresponding standard deviation for the diffusion coeffient in the vertical direction Dy for the three car models.
D y   ( m 2 / s ) φ = 0°φ = 25°φ = 35°
Mean value0.02070.01070.0182
Standard deviation (r2 > 0.9)0.00480.00650.0106
Table 5. Mean and standard deviation for r2 and percentage of profiles for which r2 > 0.9 (transversal diffusion coefficient Dz).
r2φ = 0°φ = 25°φ = 35°
Average0.8210.7540.811
Standard deviation0.0380.0860.094
r2 > 0.934%20%42%
Table 6. Mean values and the corresponding standard deviation for the diffusion coeffient in the vertical direction Dz for the three car models.
D z   ( m 2 / s ) φ = 0°φ = 25°φ = 35°
Mean value0.01670.02080.0321
Standard deviation (r2 > 0.9)0.00850.01040.0142
Table 7. Recirculation length as a function of the inter-vehicle distances. Comparison with a single vehicle (SV).
Dimensionless Recirculation Length (Lr/h)
D25°35°
0.930.930.930.93
1.851.850.631.47
2.781.550.581.18
3.701.430.581.12
4.631.390.571.08
5.561.400.551.07
SV (D→∞)1.390.581.06
Table 8. Positions (x*, y*) of lower and upper vortices in the recirculation region in the symmetric plane (z* = 0). Comparison with a single vehicle (SV).
Positions of the Lower and Upper Vortices
Dφ = 0°φ = 25°φ = 35°
Upper Vortex ALower Vortex BUpper Vortex ALower Vortex BUpper Vortex ALower Vortex B
0.93(0.44, 0.82)(0.45, 0.18)(0.28, 0.65)(0.34, 0.07)(0.21, 0.71)N/A
1.85(0.70, 0.86)(0.88, 0.15)(0.18, 0.36)(0.27, 0.08)(0.27, 0.73)(0.76, 0.09)
2.78(0.72, 0.86)(0.86, 0.14)(0.18, 0.36)(0.12, 0.08)(0.28, 0.67)(0.65, 0.05)
3.70(0.65, 0.82)(0.80, 0.15)(0.18, 0.38)(0.13, 0.08)(0.27, 0.65)(0.70, 0.06)
4.63(0.70, 0.87)(0.70, 0.13)(0.18, 0.37)(0.50, 0.09)(0.25, 0.65)(0.70, 0.05)
5.56(0.60, 0.85)(0.60, 0.13)(0.18, 0.37)(0.15, 0.08)(0.25, 0.63)(0.70, 0.05)
SV (D→∞)(0.62, 0.84)(0.70, 0.14)(0.19, 0.37)N/A(0.21, 0.70)N/A
Table 9. Peak of TKE* and the corresponding positions (x*, y*) in the symmetric plane (z* = 0).
Peaks of TKE and Corresponding Positions
Dφ = 0°φ = 25°φ = 35°
TKE*max and the Corresponding PositionTKE*max and the Corresponding PositionTKE*max and the Corresponding Position
0.930.068 at (0.55, 0.72)0.059 at (0.55, 0.00)0.074 at (0.38, 0.00)
1.850.054 at (1.10, 0.90)0.048 at (0.35, 0.00)0.074 at (1.10, 0.00)
2.780.059 at (1.10, 0.85)0.095 at (0.25, 0.00)0.062 at (0.75, 0.00)
3.700.056 at (0.85, 0.85)0.054 at (0.25, 0.09)0.063 at (0.75, 0.00)
4.630.060 at (0.85, 0.85)0.074 at (0.25, 0.19)0.067 at (0.60, 0.00)
5.560.064 at (1.25, 0.75)0.061 at (0.25, 0.09)0.074 at (1.10, 0.19)
SV (D→∞)0.070 at (0.99, 0.83)0.070 at (0.26, 0.09)0.080 at (0.49, 0.09)
Table 10. Minimum and maximum values of Reynolds Shear Stresses and their corresponding positions (x*, y*) in the symmetric plane (z* = 0).
Peaks of RSS in the Upper and Lower Shear Layers and the Corresponding Positions
Dφ = 0°φ = 25°φ = 35°
RSS*min and RSS*max the Corresponding PositionsRSS*min and RSS*max the Corresponding PositionsRSS*min and RSS*max the Corresponding Positions
0.93−0.030 at (0.74, 0.09)
0.032 at (0.74, 0.09)
−0.017 at (0.00, 0.93)
0.032 at (0.74, 0.00)
−0.014 at (0.00, 0.93)
0.042 at (0.55, 0.00)
1.85−0.031 at (1.66, 0.83)
0.018 at (0.37, 0.00)
−0.008 at (0.55, 0.37)
0.028 at (0.37, 0.00)
−0.018 at (0.93, 0.75)
0.050 at (1.11, 0.00)
2.78−0.031 at (1.11, 0.83)
0.016 at (1.48; 0.09)
−0.009 at (0.55, 0.37)
0.022 at (0.55, 0.00)
−0.018 at (1.30, 0.65)
0.038 at (1.11, 0.00)
3.70−0.031 at (1.11, 0.83)
0.026 at (0.55, 0.00)
−0.008 at (1.11, 0.19)
0.028 at (0.55, 0.00)
−0.015 at (1.11, 0.56)
0.038 at (1.11, 0.00)
4.63−0.036 at (0.93, 0.83)
0.017 at (0.37, 0.00)
−0.019 at (0.55, 0.37)
0.023 at (0.83, 0.00)
−0.019 at (0.55, 0.83)
0.035 at (0.93, 0.00)
5.56−0.042 at (1.3, 0.83)
0.019 at (0.55, 0.00)
−0.021 at (0.55, 0.37)
0.033 at (0.55, 0.00)
−0.016 at (0.55, 0.83)
0.037 at (1.11, 0.00)
SV (D→∞)−0.043 at (1.22, 0.83)
0.026 at (1.05, 0.18)
−0.021 at (0.65, 0.36)
0.035 at (0.32, 0.09)
−0.020 at (−0.05, 0.93)
0.044 at (0.82, 0.09)