Article

The Spatial–Temporal Variation of Tropospheric NO2 over China during 2005 to 2018

1
Key Laboratory of Middle Atmosphere and Global Environment Observation (LAGEO), Institute of Atmospheric Physics, Chinese Academy of Sciences, Beijing 100029, China
2
University of Chinese Academy of Sciences, Beijing 100049, China
*
Author to whom correspondence should be addressed.
Atmosphere 2019, 10(8), 444; https://doi.org/10.3390/atmos10080444
Submission received: 4 June 2019 / Revised: 11 July 2019 / Accepted: 26 July 2019 / Published: 1 August 2019
(This article belongs to the Special Issue Long Term Trends of Air Pollutants)

Abstract

:
In recent years, new and strict air quality regulations have been implemented in China. Therefore, it is of great significance to evaluate the current air pollution situation and effectiveness of actions. In this study, Ozone Monitoring Instrument (OMI) satellite data were used to detect the spatiotemporal characteristics of tropospheric NO2 columns over China from 2005 to 2018, including spatial distribution, seasonal cycles and long-term trends. The averaged NO2 pollution is higher in southeastern China and lower in the northwest, which are well delineated by the Heihe–Tengchong line. Furthermore, the NO2 loadings are highest in the North China Plain, with vertical column density (VCD) exceeding 13 × 1015 molec cm−2. Regarding the seasonal cycle, the NO2 loadings in eastern China is highest in winter and lowest in summer, while the western region shows the opposite feature. The amplitude of annual range increase gradually from the south to the north. If the entire period of 2005–2018 is taken into account, China has experienced little change in NO2. In fact, however, there appears to be significant trends of an increase followed by a downward tendency, with the turning point in the year 2012. In the former episode of 2005–2012, increasing trends overwhelm nearly the whole nation, especially in the Jing–Jin–Tang region, Shandong Province, and Northern Henan and Southern Hebei combined regions, where the rising rates were as high as 1.0–1.8 × 10¹⁵ molec cm−2 year−1. In contrast, the latter episode of 2013–2018 features remarkable declines in NO2 columns over China. Particularly, the regions where the decreased degree was remarkable in 2013–2018 were consistent with the regions where the upward trend was obvious in 2005–2012. Overall, this upward–downward pattern is true for most parts of China. However, some of the largest metropolises, such as Beijing, Shanghai and Guangzhou, witnessed a continuous decrease in the NO2 amounts, indicating earlier and more stringent measures adopted in these areas. Finally, it can be concluded that China’s recent efforts to cut NO2 pollution are successful, especially in mega cities.

1. Introduction

Nitrogen oxides (NOx = NO2 + NO) are important trace gases in the atmosphere that have devastating impacts on the atmospheric environment and human health. In the lower troposphere, nitrogen dioxide (NO2) plays a key role in air quality regulation and aerosols and ozone (O3) formation [1]. NO2 has a significant effect on atmospheric chemistry. O3 is a secondary pollutant in the troposphere that is largely determined by the photochemical reactions of NOx and volatile organic compounds (VOCS). On the other hand, a high level of NOx may likely combine with VOCS and other ultrafine particles and then produce photochemical smog and acid rain, respectively, further affecting people’s lives and health. Apart from these effects, NOx absorbs visible solar radiation and decreases atmospheric visibility, and to some extent, it affects global climate change [2,3]. As early as the 1960s, Barker et al. [4] proposed the maximum permissible concentration of NOx to be 0.5 mg/m3 at any one time and 0.15 mg/m3 for a 24 h average. In addition to the indirect impacts on the atmospheric environment, as a kind of strong toxic gas, NO2 has more direct influences on public health. Large amounts of NO2 are harmful to lung tissue and can lead to more respiratory diseases [5]. The World Health Organization (WHO) published Air Quality Guidelines (AQGs), which are aimed at reducing the detrimental effects of air pollution, while offering guidance to the public. The AQGs are focused on four main air pollutants: O3, particulate matter (PM), sulfur dioxide (SO2) and NO2. The report suggested that guideline values were 40 µg/m3 for annual NO2 concentration and 200 µg/m3 for 1 h NO2 concentration. The report also indicated that different studies had inconsistent outcomes regarding the levels of NO2 that could affect people. However, NO2 was proved to be strongly associated with respiratory morbidity in adults and children because 70–90% of NO2 can be absorbed from the respiratory tract of humans [6].
Troposphere NO2 is produced by both anthropogenic and natural sources. The major sources, such as fossil fuel consumption, biomass burning, lightning or soil release, are common causes of NO2 formation [7,8,9]. In addition, the existence of vehicles, power plants and some industries are also key factors in the NO2 production. Some sources may also emit NO that could be spontaneously oxidized to NO2 [10]. The highest NO2 levels have been observed in the most populated and industrialized regions worldwide, such as eastern China, western Europe, the eastern US and India [11,12]. Nowadays, China is one of the fastest developing countries in the world, accompanied by simultaneously serious environmental pollution problems [13,14]. The strong increase in NO2 pollution in China, especially over eastern China, is due to an increase in industrial development and traffic [15,16]. According to the Multi-resolution Emission Inventory for China (MEIC) [17], industry was the main source of NO2 emissions over China in 2010, accounting for 39% of the total, followed by power plants and traffic, accounting for 32% and 25%, respectively, and residential sources occupied the lowest proportion [18]. Wintertime is a special period with the highest NO2 concentrations because of the strong anthropogenic emissions in China, particularly with fossil fuels used for heating purposes.
Due to the importance of tropospheric NO2 as it relates to the atmospheric environment and ecosystems, as well as human activity, it is essential to continually and accurately observe NO2. However, there are only a limited number of observation stations in each country, and a complete worldwide ground monitoring network is still lacking, so it is difficult to obtain continuous and precise data for NO2 from ground-based measurements. By contrast, satellite measurements can not only provide observations with global coverage but also provide information with high spatial and temporal resolutions. Global tropospheric NO2 distributions are retrieved from the satellite instruments Global Ozone Monitoring Experiment (GOME, from 1995–2011) aboard ERS-2 [19,20], SCanning Imaging Absorption spectroMeter for Atmospheric ChartographY (SCIAMACHY, from 2002–2012) aboard the Envisat platform [21,22,23], Ozone Monitoring Instrument (OMI, since 2004) onboard Earth Observing System (EOS) Aura [24,25,26] and TROPOspheric Monitoring Instrument (TROPOMI, since 2017) aboard the Sentinel-5 Precursor [27]. A number of trend analyses studies have also been discussed [28,29,30,31]. Van der A et al. [32] investigated the tropospheric NO2 concentration characteristics over China during 1996–2005 based on satellite data from GOME and SCIAMACHY and found that the tropospheric NO2 columns were higher in densely populated and industrialized eastern China than in the western region, which has a sparser population density. Zhang et al. [33] reached the same conclusion. Moreover, the tropospheric NO2 sources over China and the main factors affecting the growing trend are discussed in detail in their study. Lin and McElroy [34] found a notable reduction of NOx over China between late 2008 and mid-2009, which was mainly affected by the economic downturn and stringent regulations in Olympics. Georgoulias et al. [35] used several satellite data to study the long-term tropospheric NO2 over the last two decades, which proved that tropospheric NO2 was sensitive to socioeconomic changes and monotonous linear trends cannot be efficiently described for such long periods. OMI has been providing observational results of various pollutant gases and greenhouse gases around the world and has been widely used to monitor and analyze NO2 as well as other pollutants over China since 2004 [36,37,38,39]. In particular, the tropospheric NO2 columns and total NO2 columns over China during 2004 and 2010 were analyzed by Xiao et al. [40] and it was found that the two parameters presented adverse variations during the same season. The total NO2 had the largest value in summer, while the tropospheric NO2 had the smallest value. Wintertime showed the opposite results. Van der A et al. [41] noted that a distinct decreasing trend was visible in 2012. Ai [42], Cai [43] and Li [44] have been comprehensively analyzing the NO2 concentrations in different regions of China over the last few years.
Recently the Chinese government has developed policies and plans to mitigate the adverse impacts of NO2 and other greenhouse gases [45]. For example, the 12th five-year plan (2011–2015) set a goal to reduce NOx by 10% from 2011 to 2015 [46]. The 13th five-year plan (2016–2020) continues insisting upon the goal of energy conservation and emission reduction [47]. The Clean Air Alliance of China (CAAC) also released the Air Pollution Prevention and Control Action Plan in 2013 with the aim to improve the national air quality, especially in Beijing–Tianjin–Hebei, the Yangtze River Delta and the Pearl River Delta [48]. However, there are few studies addressing the variations in NO2 over China after these control measures were implemented. In this study, we examine the changes in NO2 at the tropospheric level over China between 2005 and 2018 obtained from OMI, including the spatial variations, long-term trends and monthly and seasonal cycles.

2. Data and Methods

2.1. OMI NO2 Vertical Column Density (VCD) Product

The Aura is a sun-synchronous near-polar orbit satellite from the National Aeronautics and Space Administration’s (NASA) EOS. OMI is an important sensor onboard the EOS Aura satellite, which was launched on 15 July 2004. OMI is also inherited from GOME and SCIAMACHY and is combined with their advantages. OMI obtains daily measurements, which means the solar irradiance spectrum could be observed once per 24 h on a global scale, and now has provided more than 14 years of NO2 data products, including total vertical column densities of NO2 and stratospheric and tropospheric vertical column densities of NO2 [49,50]. Furthermore, the high spatial resolution (13 km × 24 km) allows for more finer details of atmospheric parameters.
A differential optical absorption spectroscopy (DOAS) method has been validated to effectively retrieve the NO2 slant column density (SCD) by OMI in the wavelength of 405–465 nm [51,52,53]. The accurate calculation of tropospheric NO2 vertical column densities (VCD) depends on the SCD and the tropospheric air mass factor (AMF) [54,55]. Many studies have also proved the creditability of OMI NO2 data products, and its accuracy can be accepted and used in NO2 researches. For example, Celarier et al. [5] used ground and aircraft-based measurements to validate the OMI tropospheric NO2 data and other principal quantities. The experimental results showed that the correlations between different instruments was 0.8–0.9. Lamsal et al. [56] compared OMI tropospheric NO2 data with in situ aircraft, MAX-DOAS and ground-based direct sun Pandora measurements, respectively. OMI NO2 data showed lower in urban areas and higher in remote regions. However, OMI retrievals generally were consistent with other methods, and the error was less than 20%. Ialongo et al. [57] present the comparison of NASA’s OMI standard product (SP) and the Royal Netherlands Meteorological Institute (KNMI) DOMINO product with ground-based observations by the Pandora spectrometer in Helsinki. Results indicated that both satellite- and ground-based showed a similar behavior in weekly and seasonal cycles. These researches all add credibility in using OMI NO2 data for air quality monitoring and analyzing. In this study, we focus on the study region of 4° N–60° N and 70° E–140° E, which covers nearly the entire area of China (see Figure 1), and we use the OMI Level-3 Global Gridded Tropospheric NO2 Data Product (QA4ECV) from 2005 to 2018, compiled by the KNMI [58]. The datasets are processed with a spatial resolution of 0.125° × 0.125°, and the cloud radiance is less than 50%.

2.2. Meteorological Data Set

Meteorological data were taken from Japanese 55-year Reanalysis (JRA-55) data, archived by the Japan Meteorological Agency. The data included total column precipitable water and temperature at pressure levels during the 14-year period. In addition, monthly means of wind speed data from the European Centre for Medium Range Weather Forecasts (ECMWF) were also used.

2.3. Trends Analysis Methods

Two independent statistical methods, namely, the least squares regression and the F-test, were used to analyze the trends over China during different periods. According to the least squares regression, the NO2 trend for each grid cell is assumed a Gaussian data distribution before calculating, and then it obtains the appropriate linear coefficient by linear fitting. In order to increase the robustness of the regression result, the F-test was performed after the calculation. An F-test is a homogeneity of variance test which is suitable for identifying the significance level of the linear trends. More details are given in Section 3.1. A trend is considered to be significant when the confidence level is above 95% for both least squares regression and the F-test [59].

3. Results and Discussion

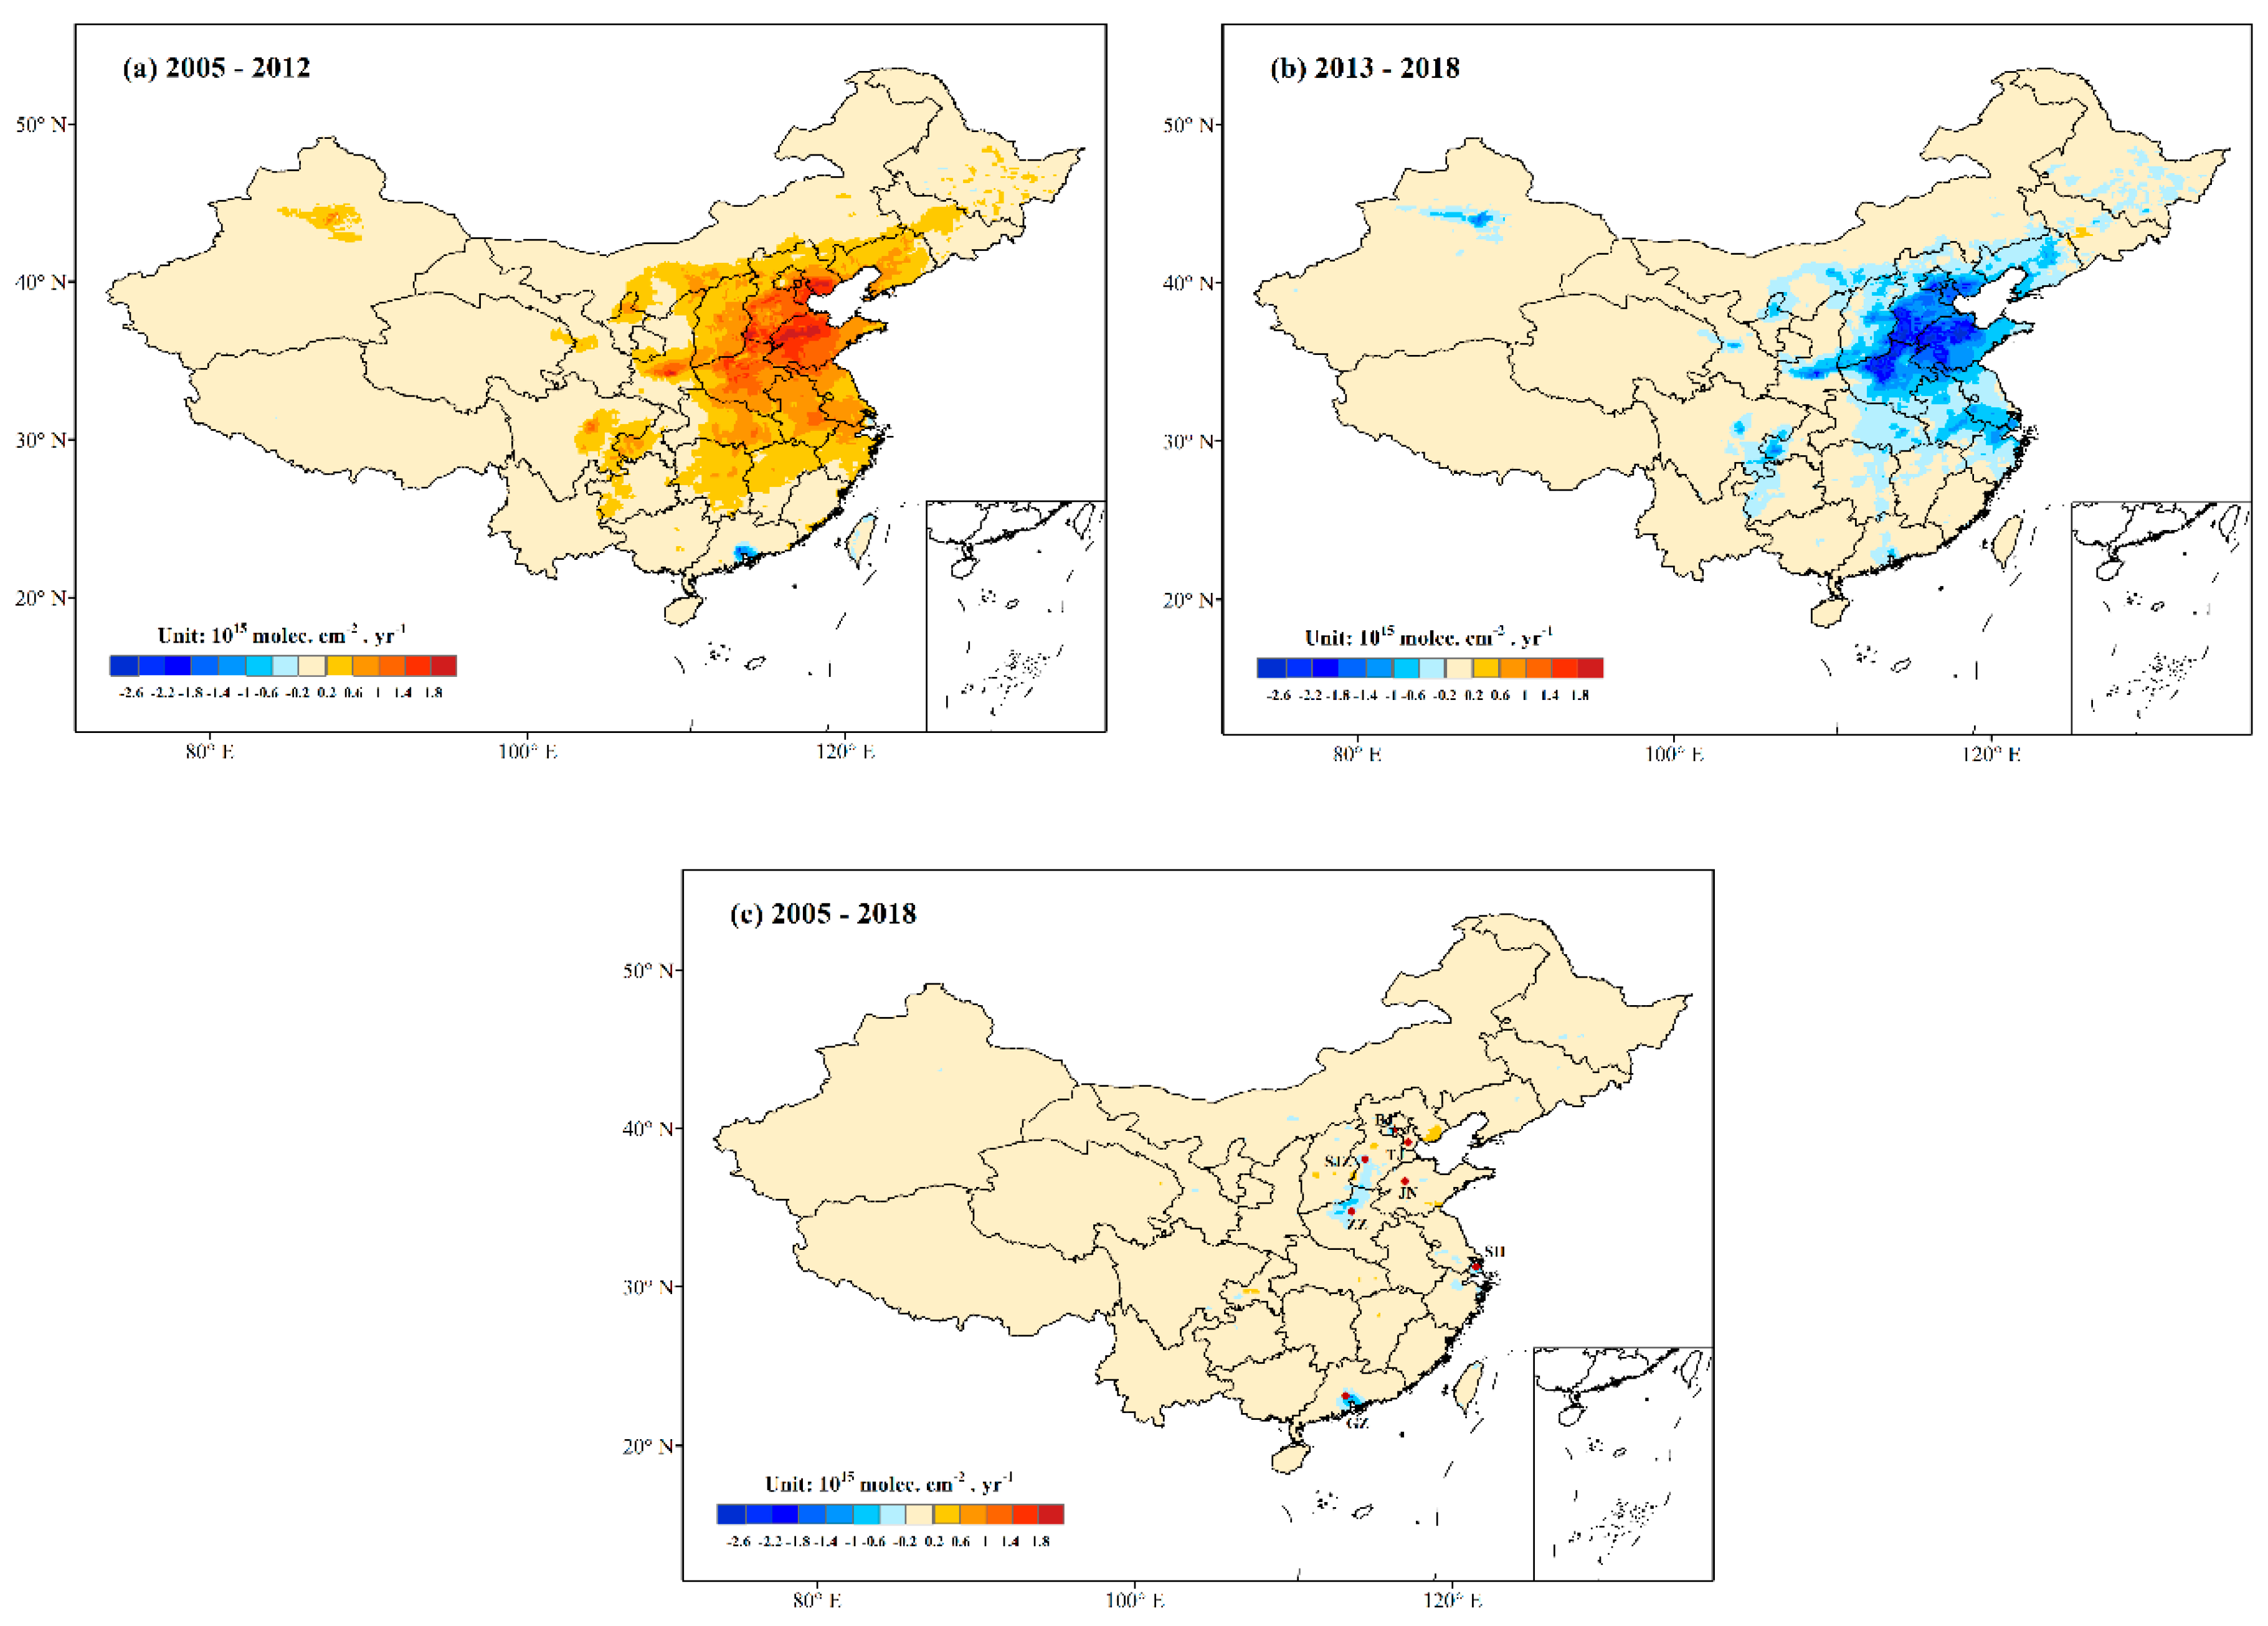
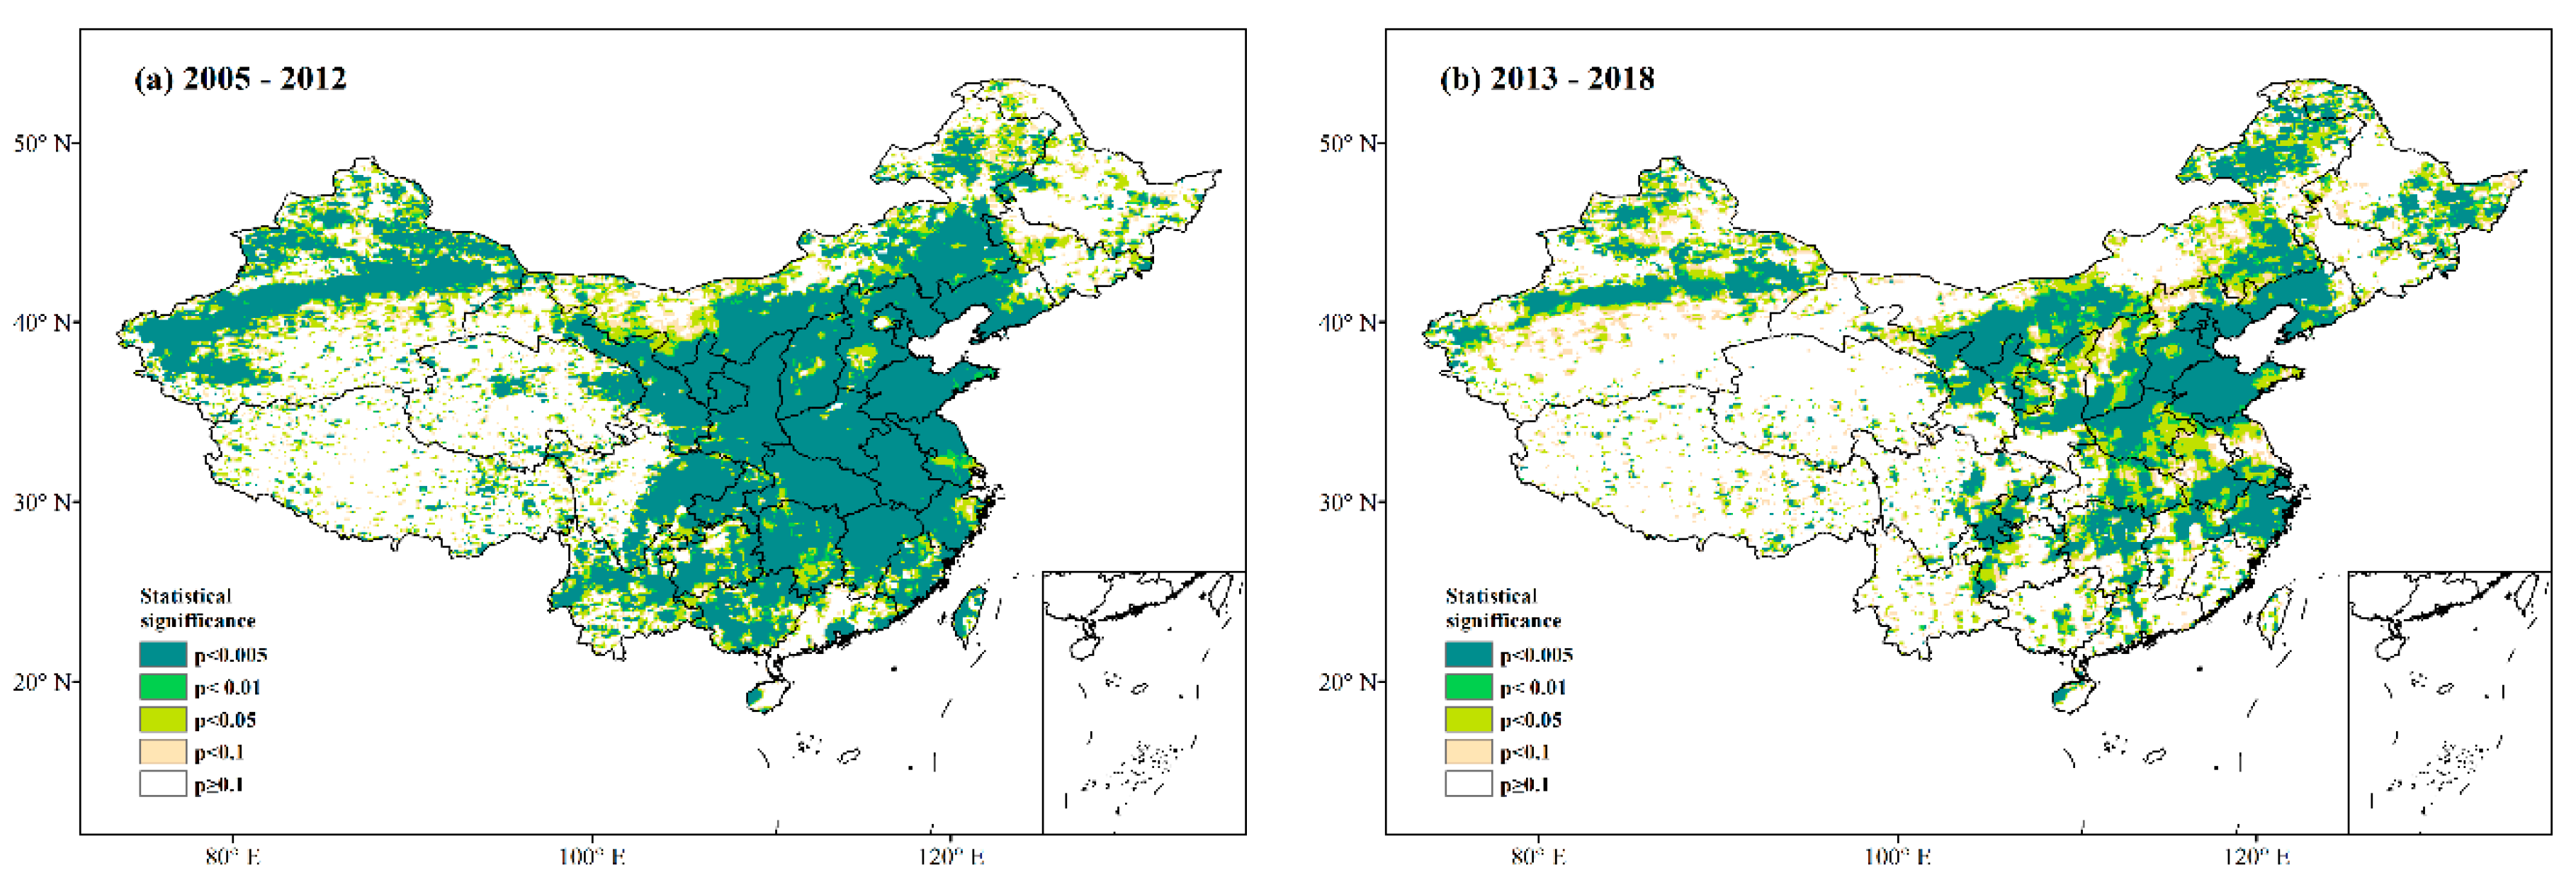
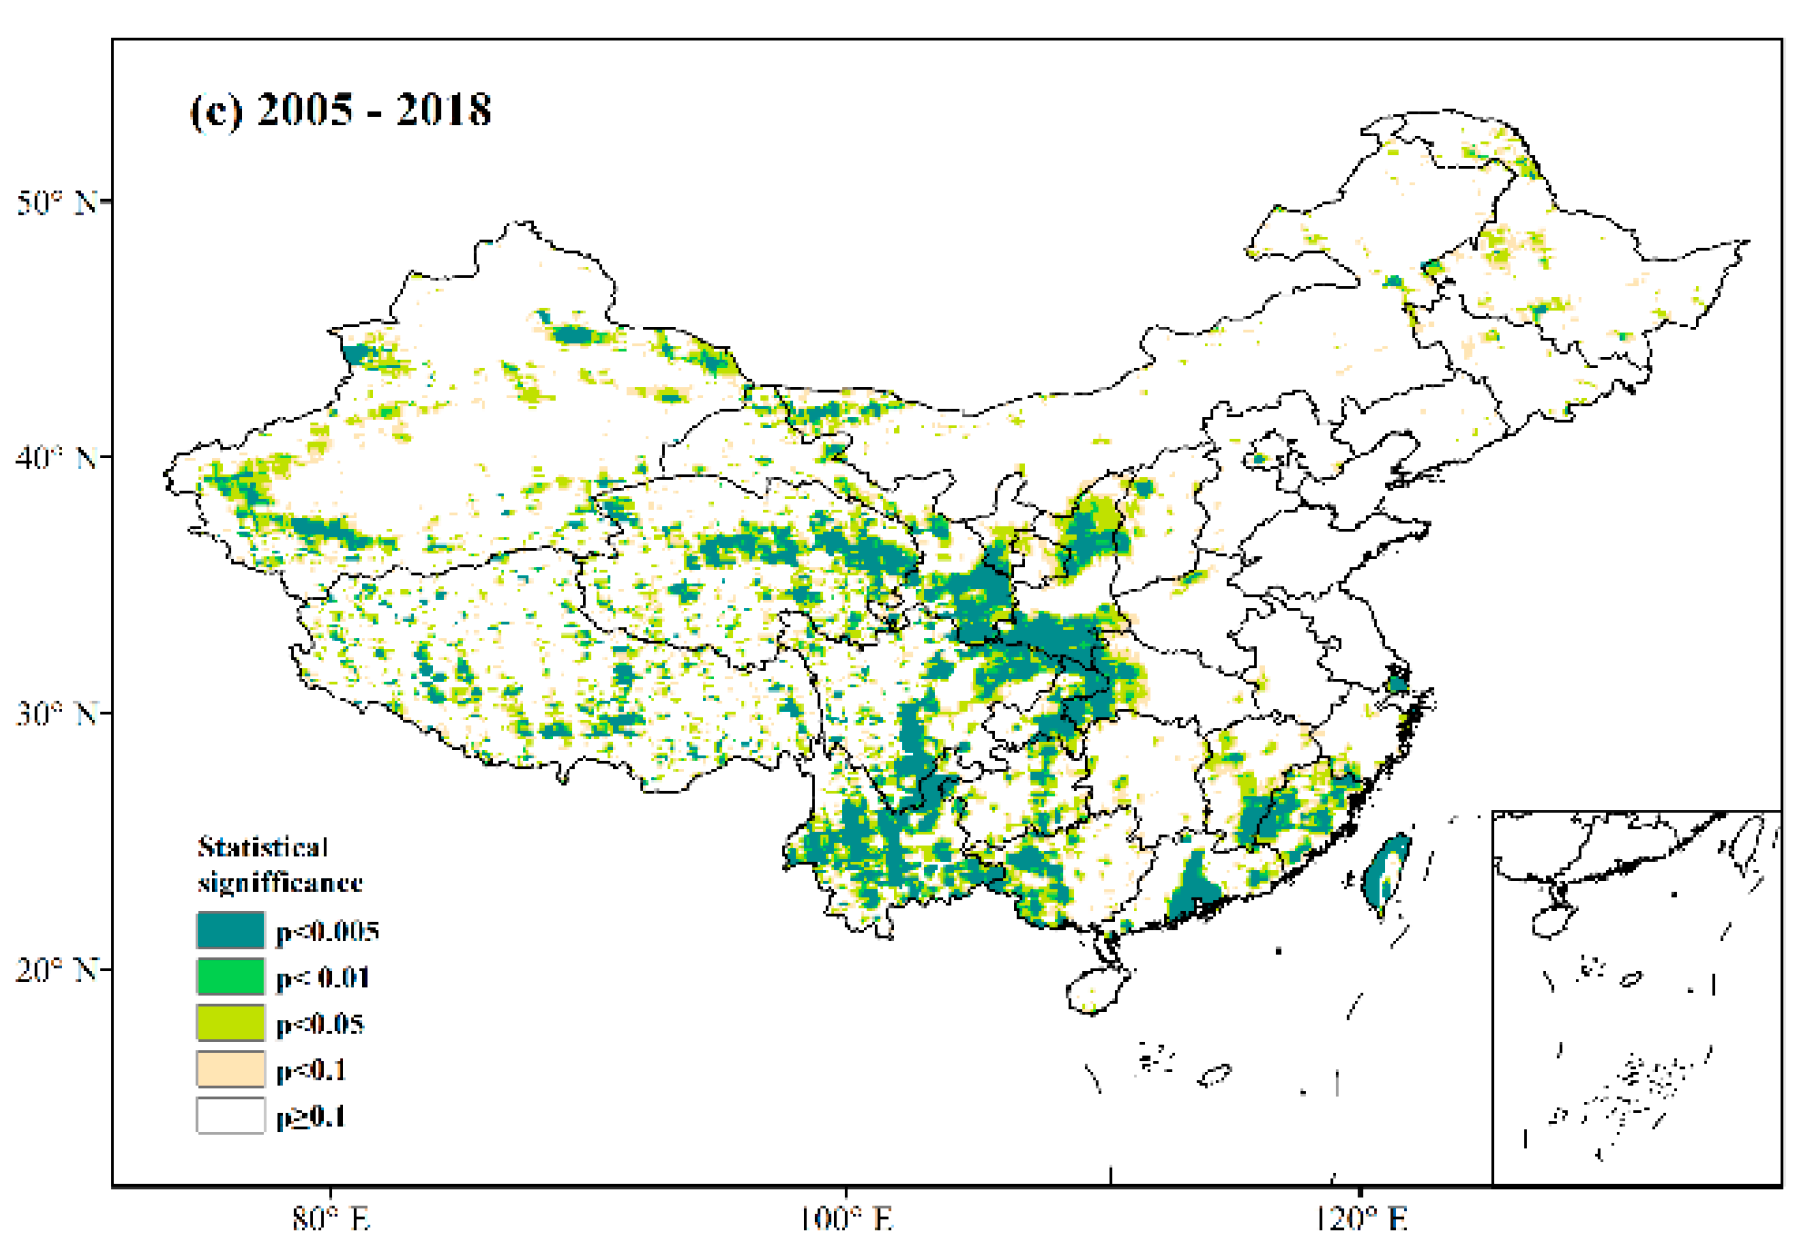
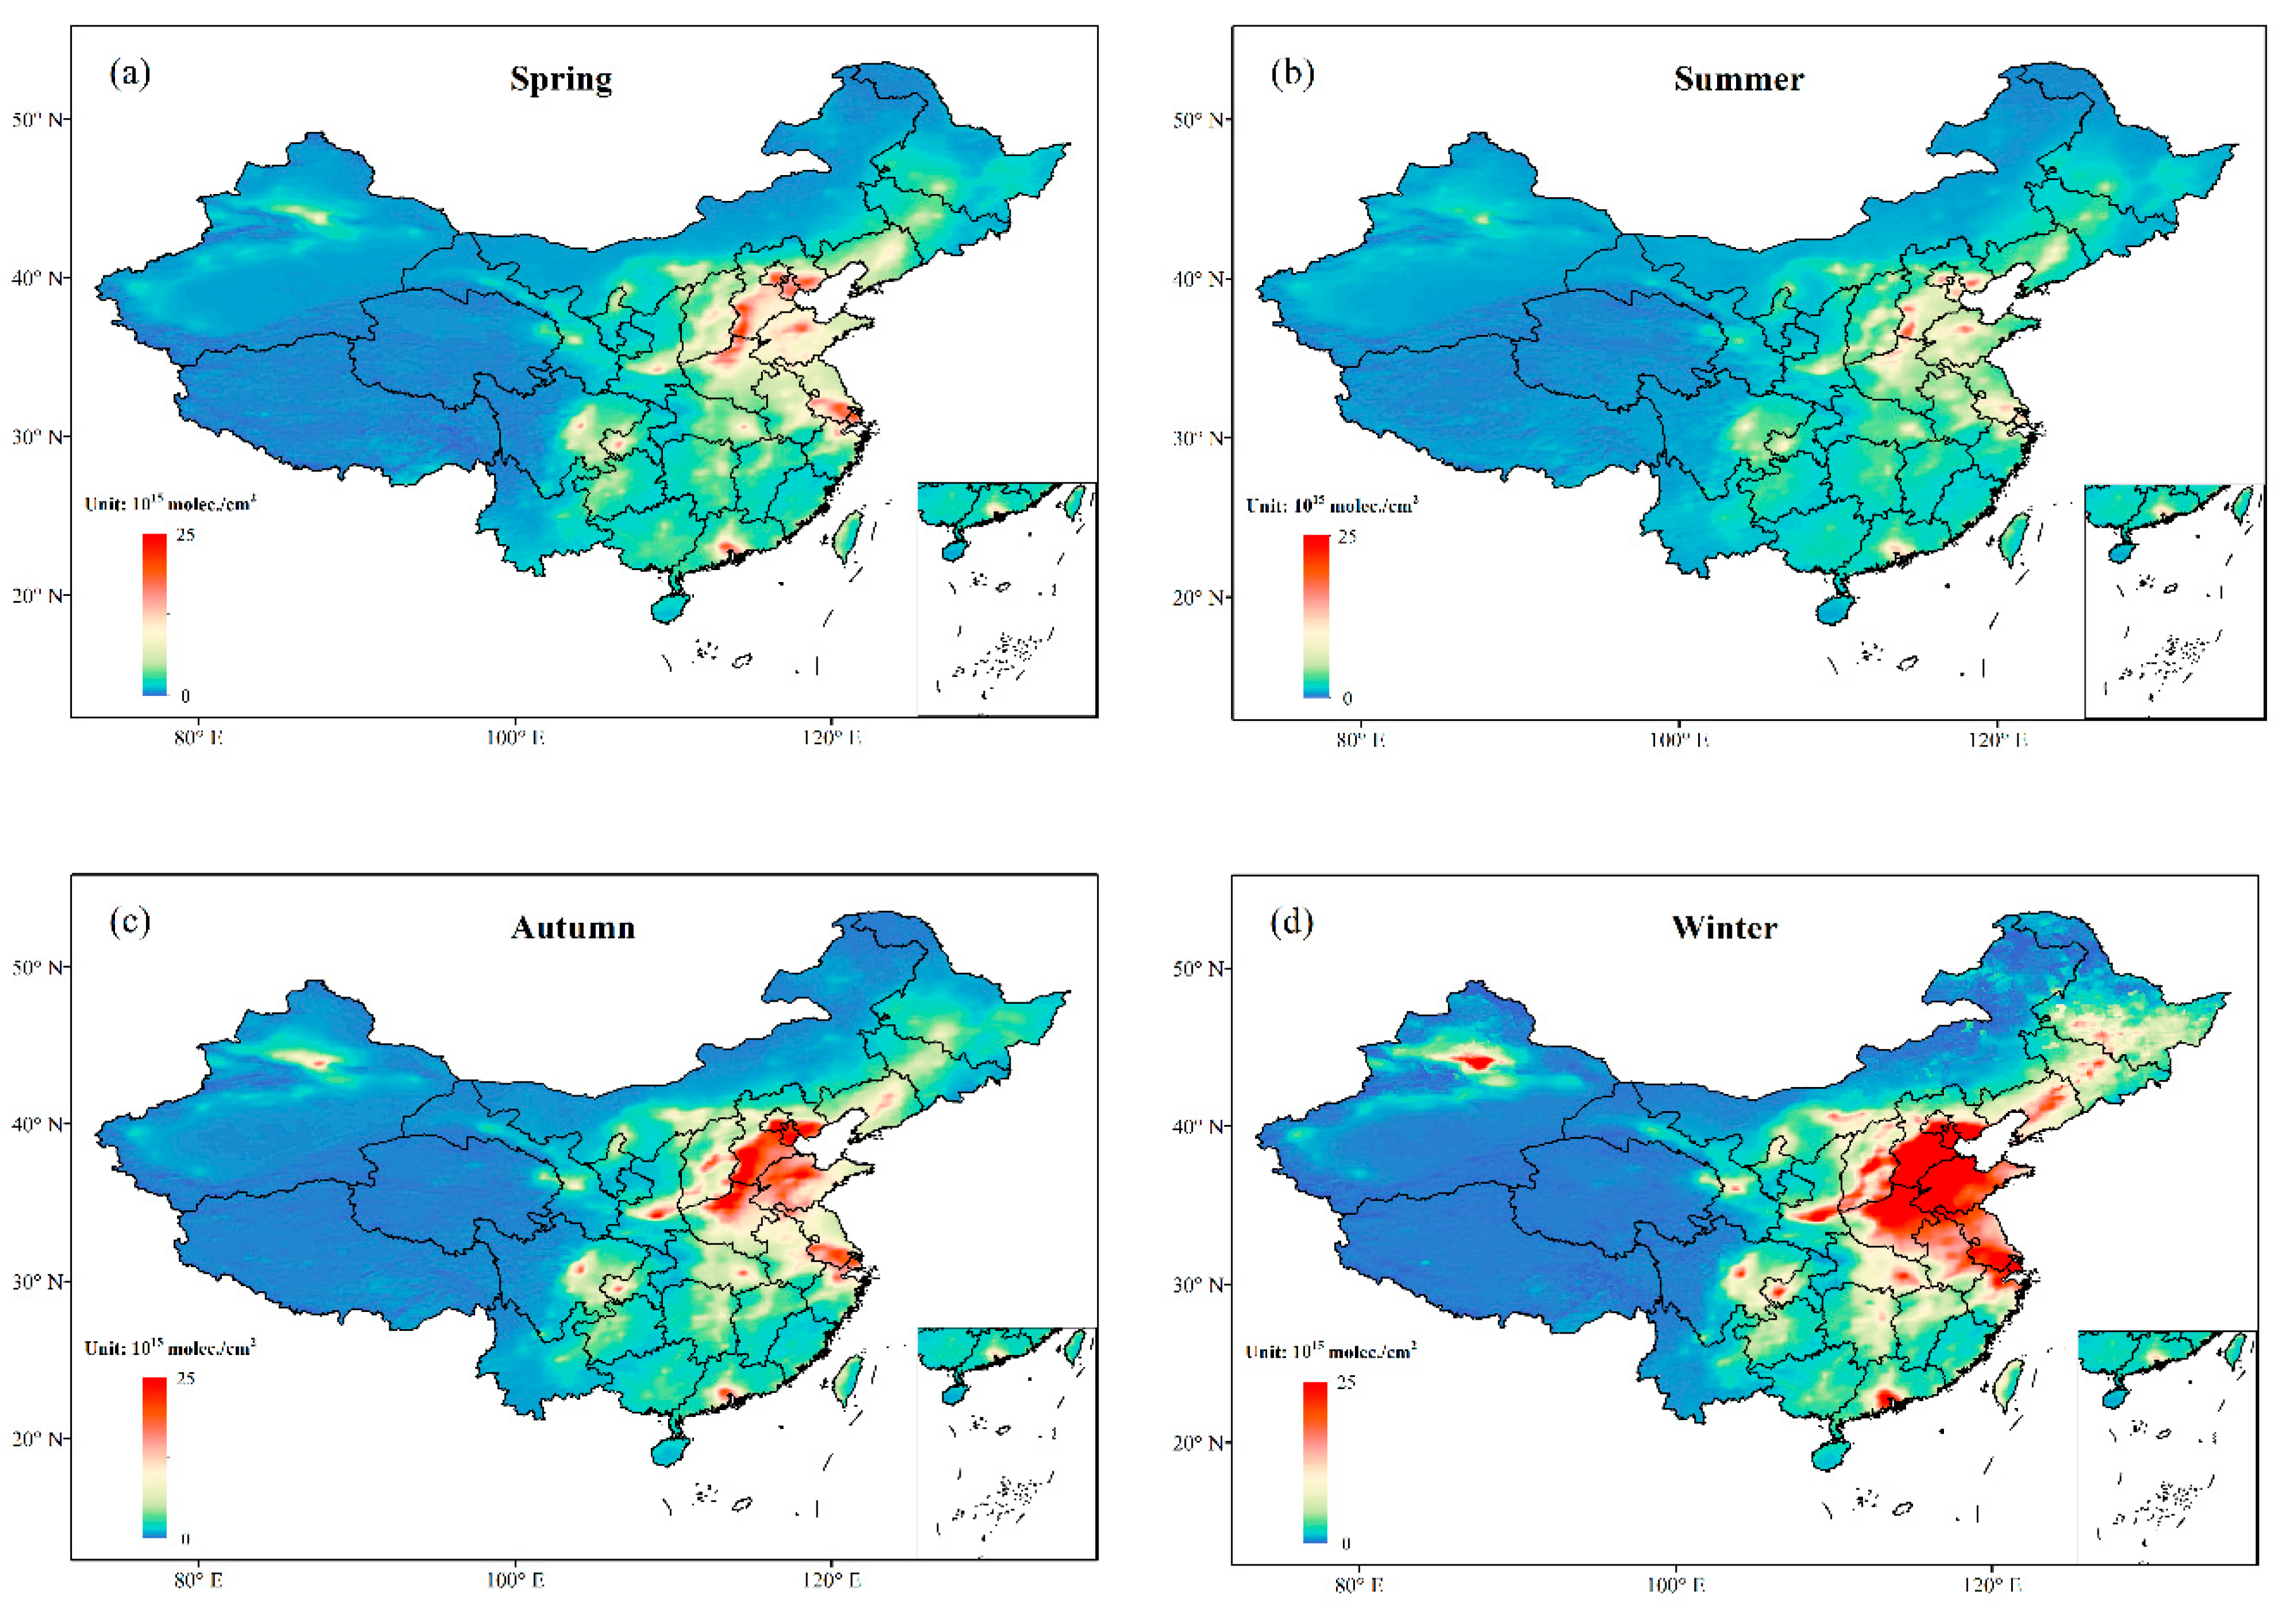
3.1. Spatial Distribution and Long-Term Trends of Tropospheric NO2 at the National Scale

Figure 1 shows the 14-year average distribution of tropospheric NO2 VCD over all of China from 2005 to 2018. Obviously, the NO2 pollution in China is significant, and the distribution of tropospheric NO2 is inhomogeneous. Previous studies have proven that NO2 production is largely influenced by human activities, which means that areas with large population densities and high levels of industrialization may accumulate high concentrations of NO2 [16]. The process of economic development and urbanization in the eastern region is much faster than in the western region in China, which explains why more serious NO2 pollution prevails in the eastern part than in the western area of China. This characteristic can also be divided by the Heihe–Tengchong line (the line begins in the northeast city of Heihe and ends in Tengchong in the southwest). The Heihe–Tengchong line is a boundary that demonstrates the different population densities, as well as geographic and climatic characteristics of the areas [60,61]. The southeast area of the line is the most densely populated area, and the area northwest of the line is sparsely populated. The North China Plain is the region over eastern China with the highest NO2 columns. In addition, the Yangtze River Delta, Pearl River Delta, Sichuan Basin and Urumqi also have high levels of NO2 columns located on both sides of the Heihe–Tengchong line. In addition, the capital city and nearly all the provincial capital cities, except Lhasa, have stronger NO2 concentrations compared to the rest areas in each province.
In this study, as Figure 1 indicates, to better understand the changes and characteristics of the 14-year NO2 concentrations over China in detail, we selected five areas with high NO2 columns, namely Jing–Jin–Tang (38.8° N–41° N, 115° E–119° E), Northern Henan and Southern Hebei combined (35° N–38° N, 113.9° E–115° E), Jinan in the Shandong Province (36.6° N–37.3° N, 116.8° E–118.8° E), the Yangtze River Delta (30.8° N–23.4° N, 112.8° E–114.6° E) and the Pearl River Delta (22° N–23.4° N, 112.8° E–114.6° E); the 14-year mean tropospheric NO2 VCD of the five hotspots are 13.46, 20.17, 18.85, 14.30 and 10.25 (×1015 molec cm−2), respectively.
As mentioned before, many environmental regulations have been implemented over China during 2005–2018. Since the 11th five-year plan put forward new proposals of emission reduction, more details of measures for air pollution prevention and control have been discussed. Some major regulations and policies during this period are listed in Table 1. As we can see, there are several essential policies promulgated in 2011, and then specifically implemented in 2012. Therefore, to access the effect of several measures and better explain the differences in the spatial variations of tropospheric NO2 VCD, the year of 2012 was chosen as a turning point to divide the whole period into two stages. The tropospheric NO2 VCD linear trends during the different stages over China are presented in Figure 2. Based on the OMI NO2 data, a linear regression line was fit in each grid cell. Two stages were plotted, as shown in Figure 2a,b. Their significance levels were also shown in Figure 3a,b. Notably, an obvious and widespread increasing trend occurs in nearly the whole nation during 2005–2012, especially in the Jing–Jin–Tang region, Shandong Province, and Northern Henan and Southern Hebei combined regions, where the increased values were as high as 1.0–1.8 (×1015 molec cm−2 year−1) (p < 0.05). In addition, the Yangtze River Delta, Chengdu–Chongqing zone, and Urumqi in the Xinjiang Province also showed a slight increase, with values ranging from 0.2 to 1.0 (×1015 molec cm−2 year−1) (p < 0.05). In contrast, megacities such as Beijing, Shanghai and Guangzhou dropped significantly during this period, although their basic amounts of NO2 column densities were still large. The change in Guangzhou was more prominent than those in the other two cities, with sharp declines of approximately −0.6 to −1.4 (×1015 molec cm−2 year−1) (p < 0.005). This result is analogous to the previous study on the distribution analysis of NO2 columns by Wang et al. [37,62].
As shown in Figure 2b, the averaged densities of tropospheric NO2 columns over China tended to decline markedly in most areas during the 2013–2018 period. In particular, the regions where the decreased degree was remarkable in 2013–2018 were consistent with the regions where the upward trend was obvious in 2005–2012, including the North China Plain, Yangtze River Delta, Chengdu–Chongqing zone, Pearl River Delta and Urumqi (all p < 0.05). Additionally, the trends in the megacities of Beijing, Shanghai and Guangzhou remained downward. However, the decline in Guangzhou had slowed compared with the previous stage (2005–2012), with values of approximately −0.2 to −0.6 (×1015 molec cm−2 year−1) in this period.
Subsequently, the overall linear trend and their significance levels over China during the 14-year period are shown in Figure 2c and Figure 3c. Overall, the NO2 concentrations in megacities such as Beijing, Shanghai and Guangzhou have decreased substantially, especially the Guangzhou in the Pearl River Delta. Although the significance levels are not significant in many areas, confidence levels in these cities are all above 95% (p < 0.05). It means that environmental protection measures have been effectively implemented and have had some effects in these regions. Simultaneously, there was also a significant reduction in the combined Northern Henan and Southern Hebei region. In contrast to these areas, a few cities and regions such as Tangshan and the main cities of Chongqing had an increased trend to a small extent. Most of the remaining regions were maintained in a stable state without remarkable fluctuations during the 14-year study period.

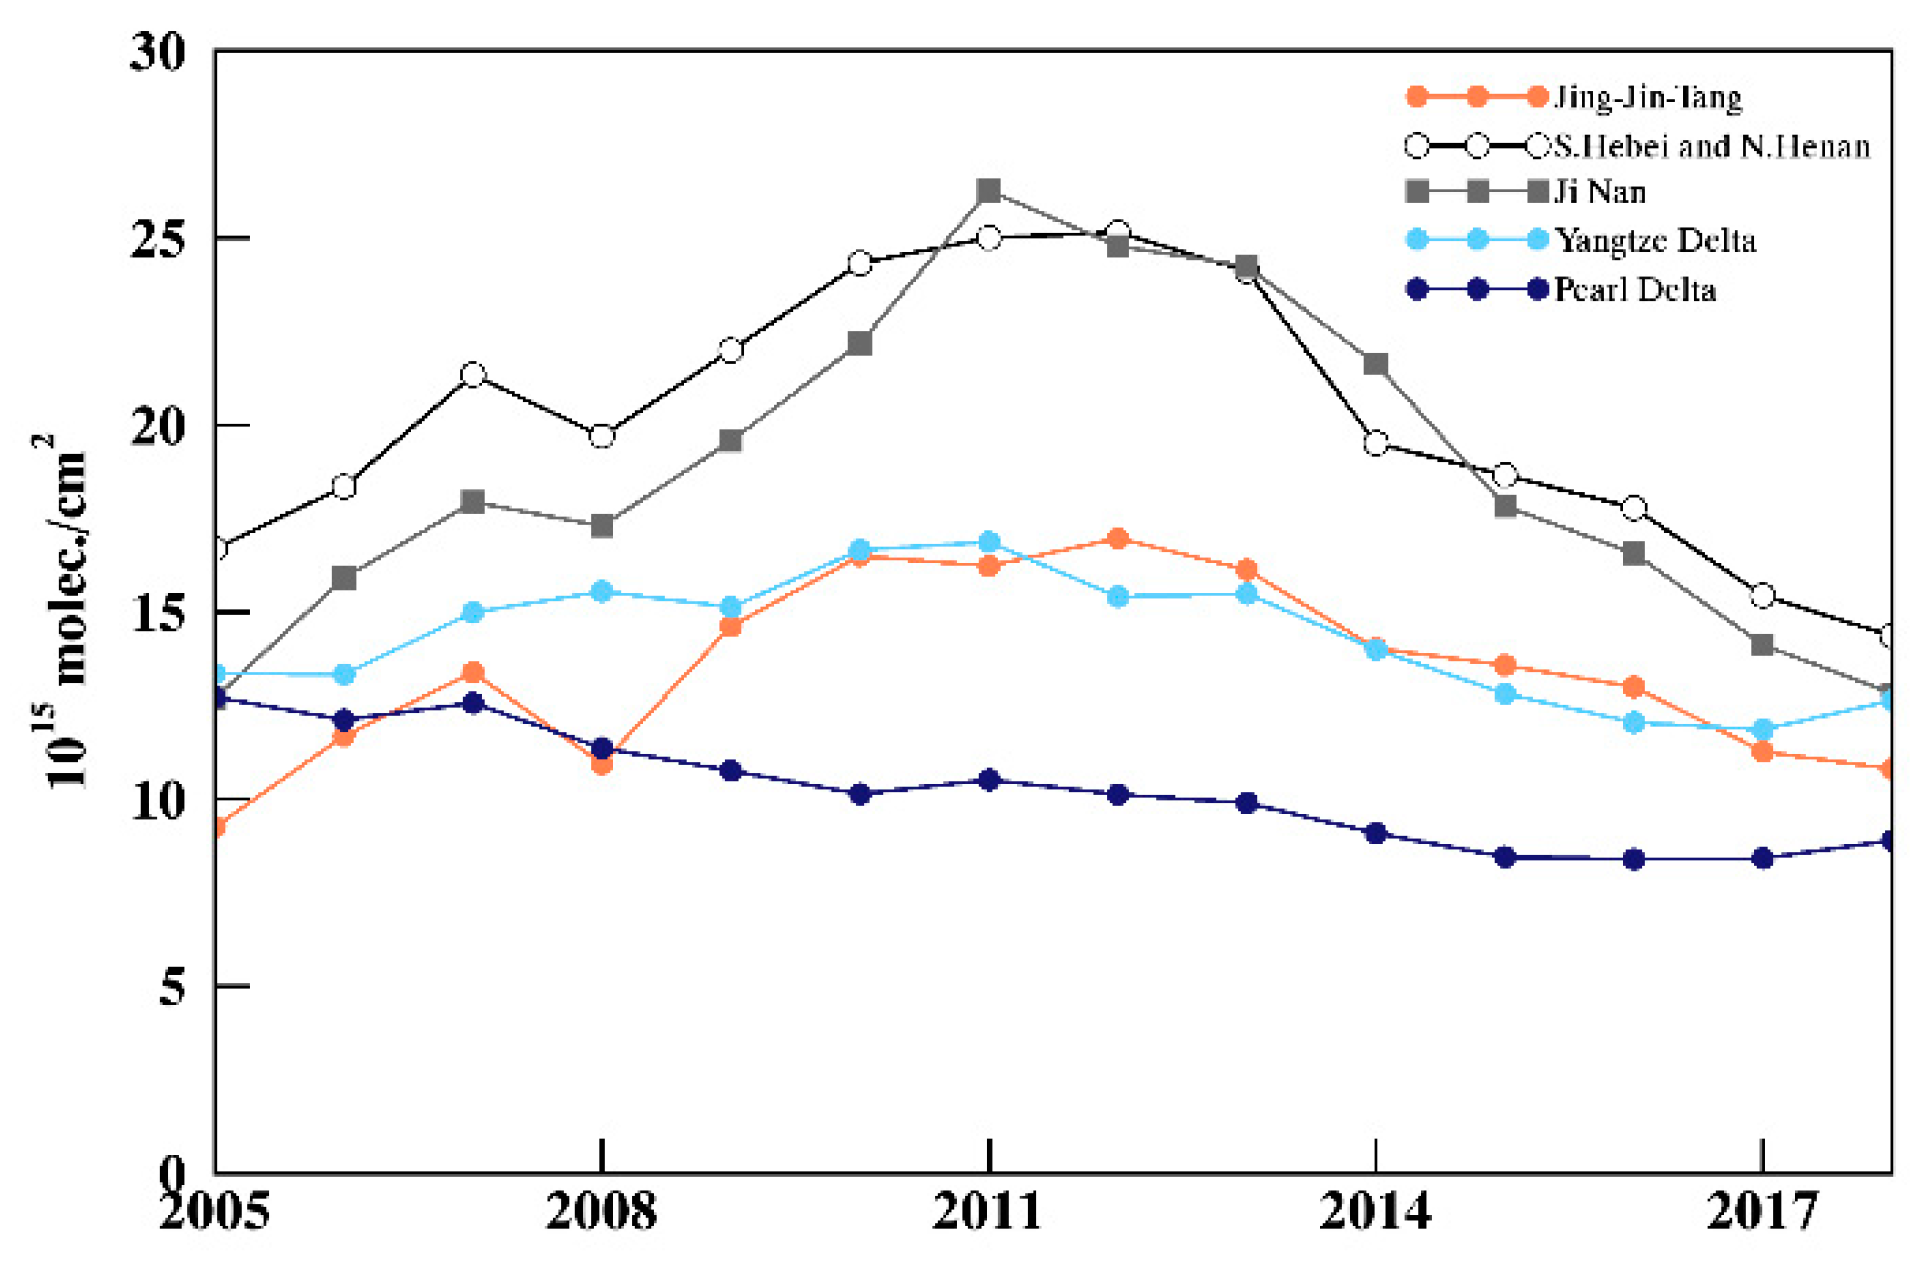
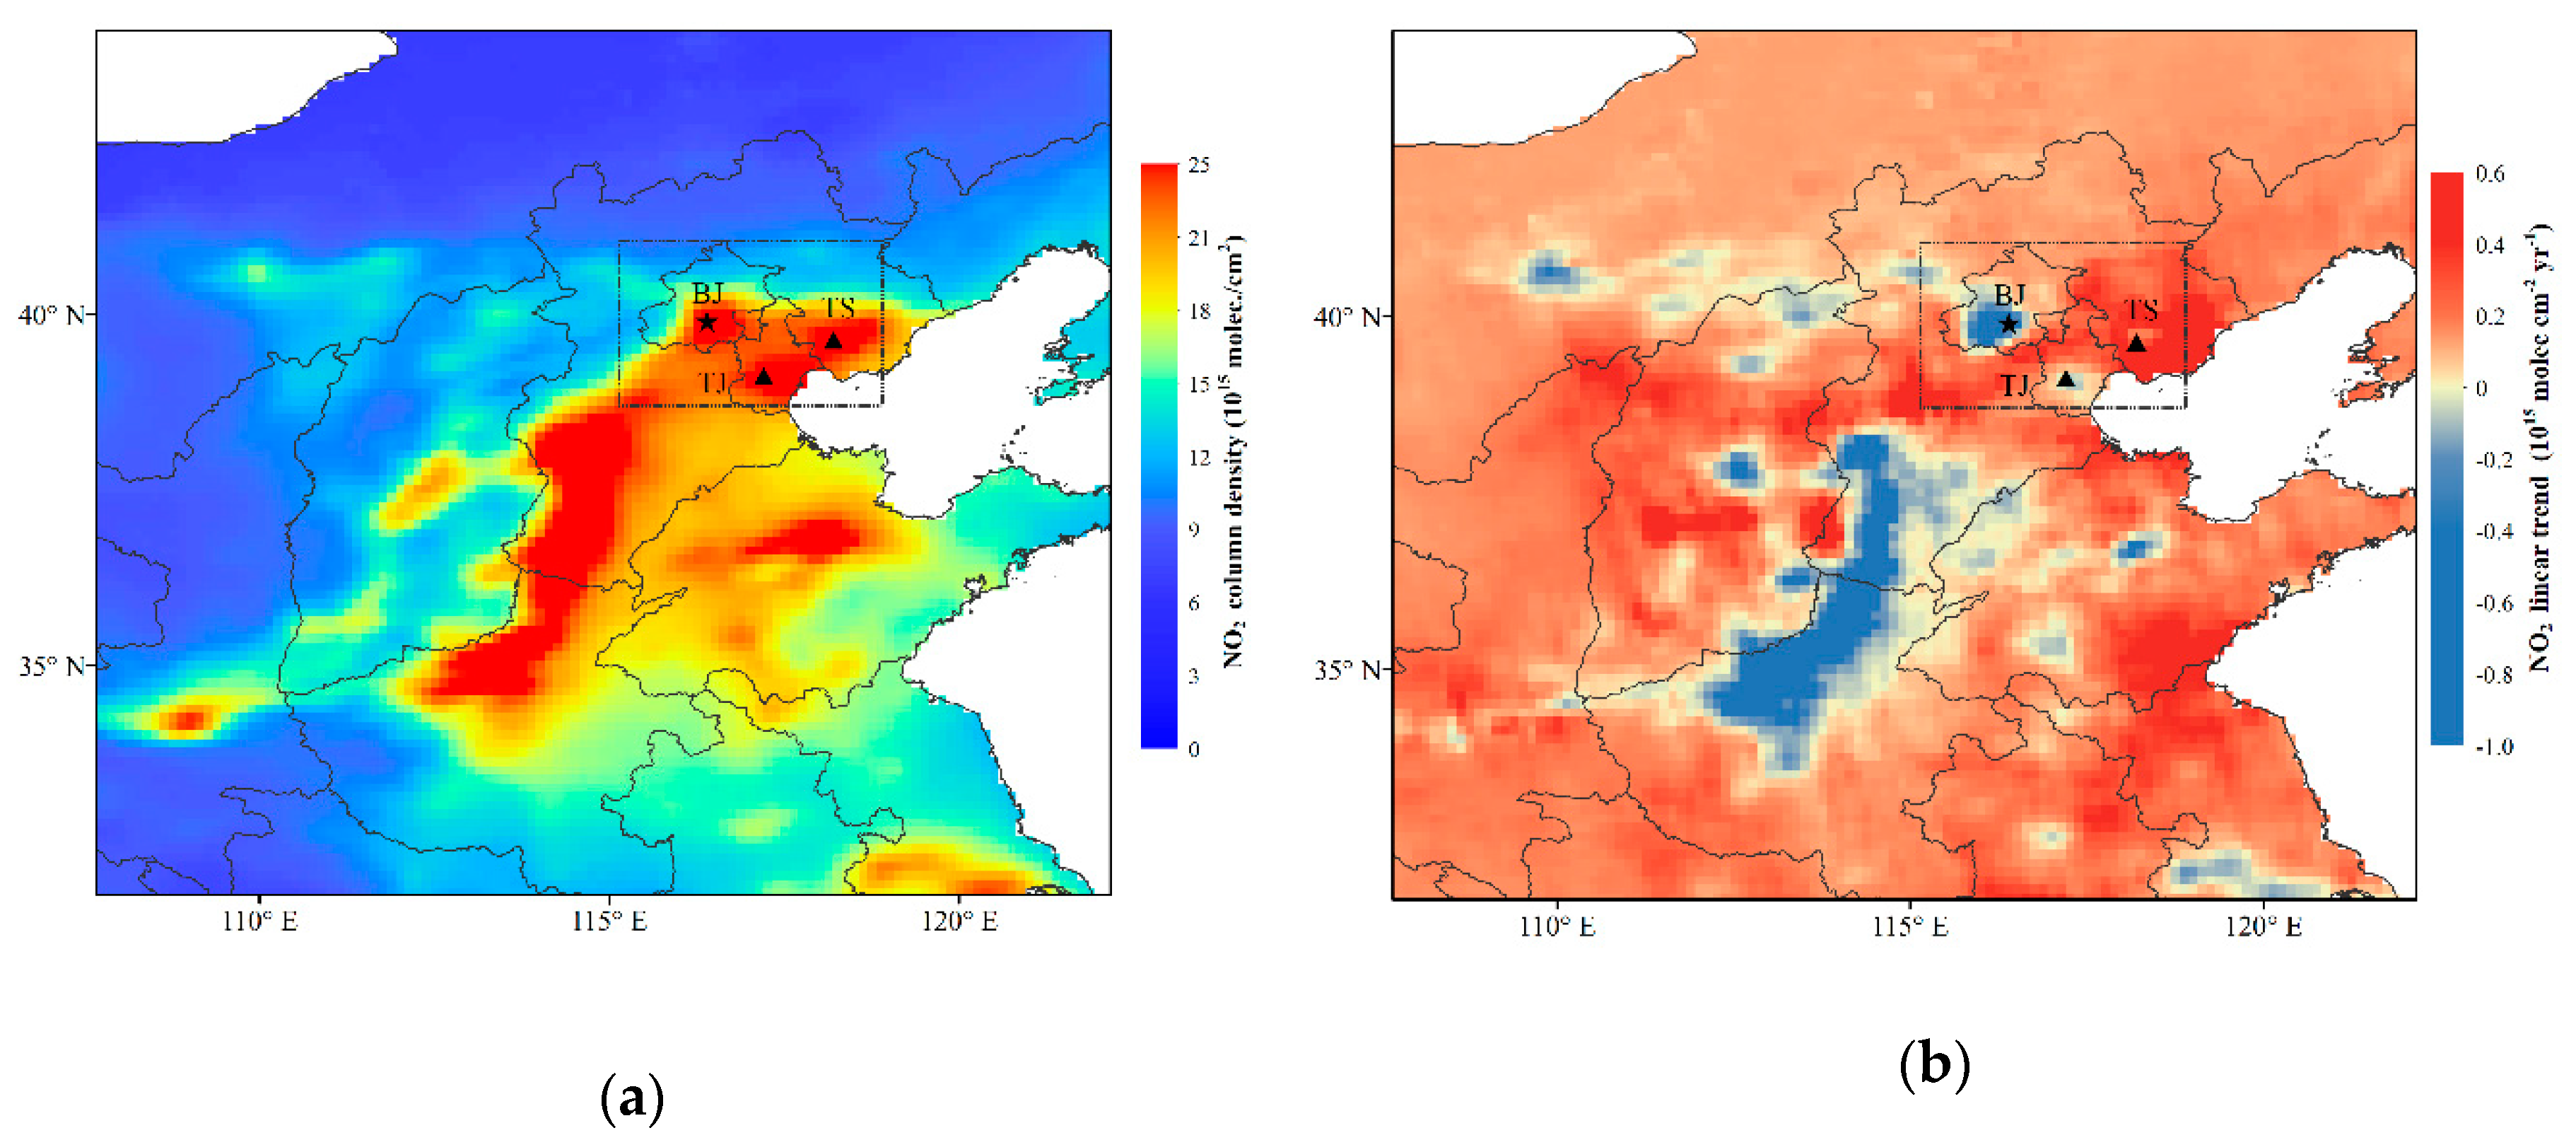
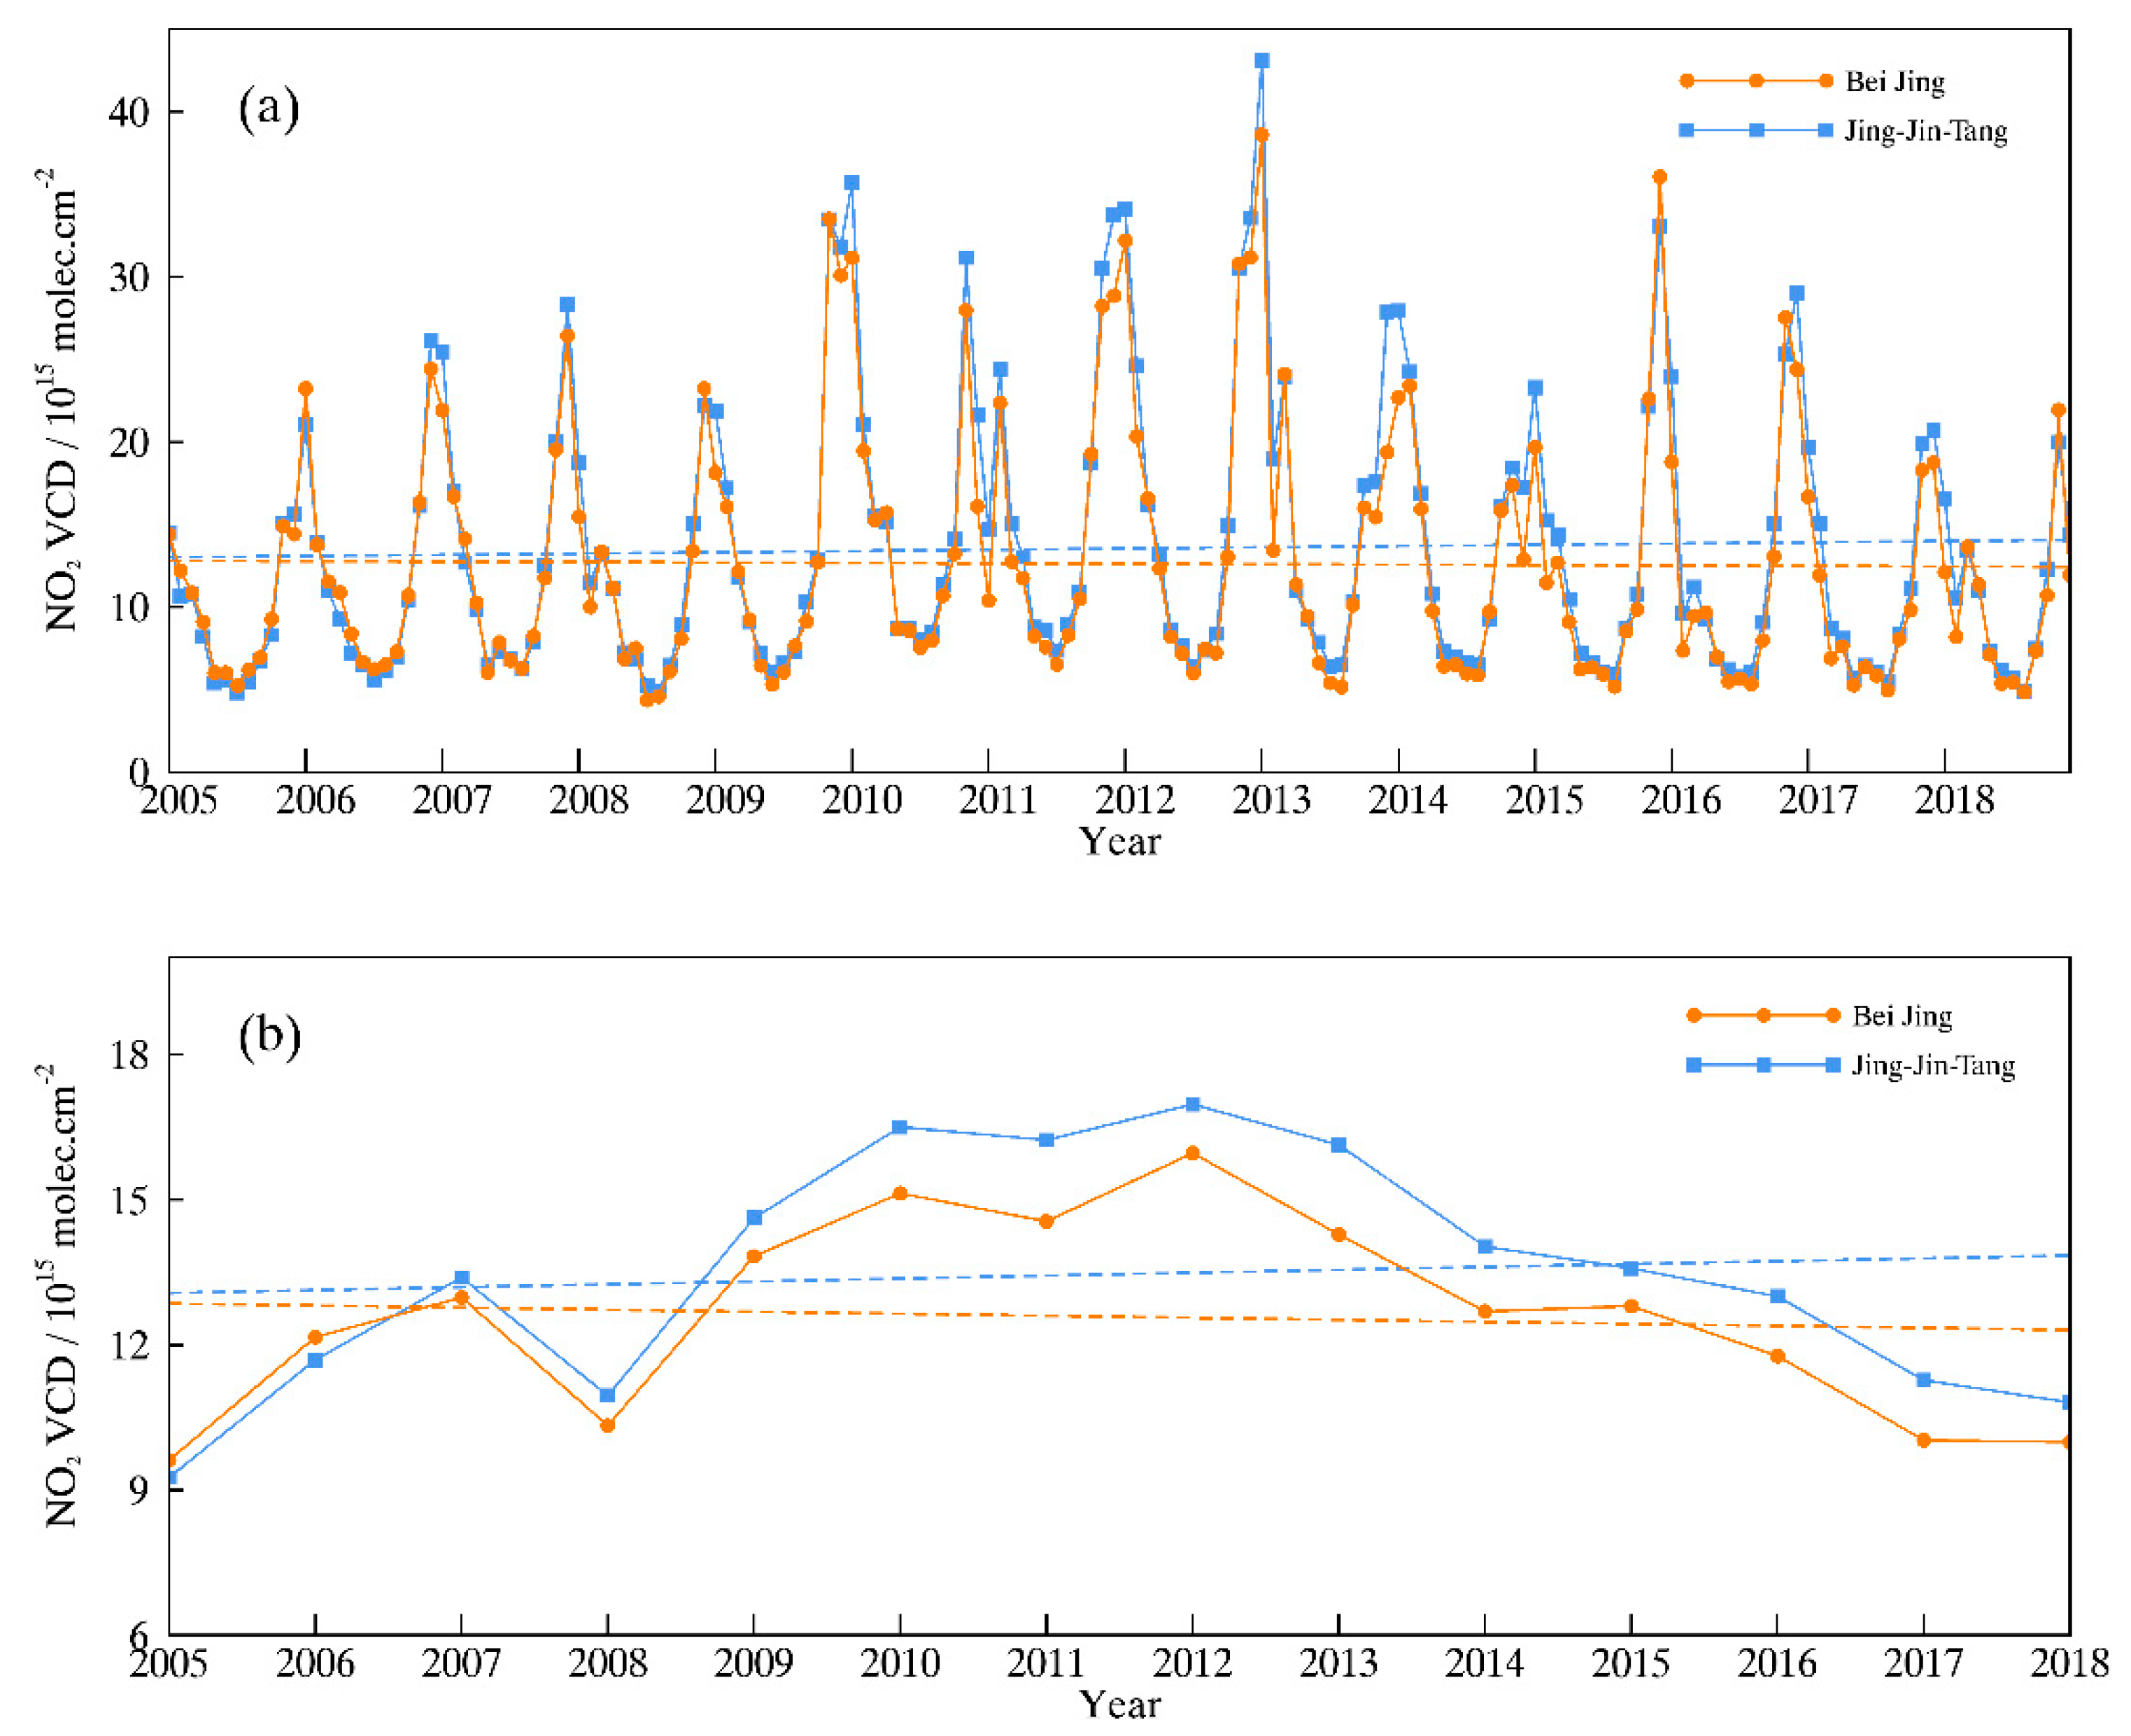
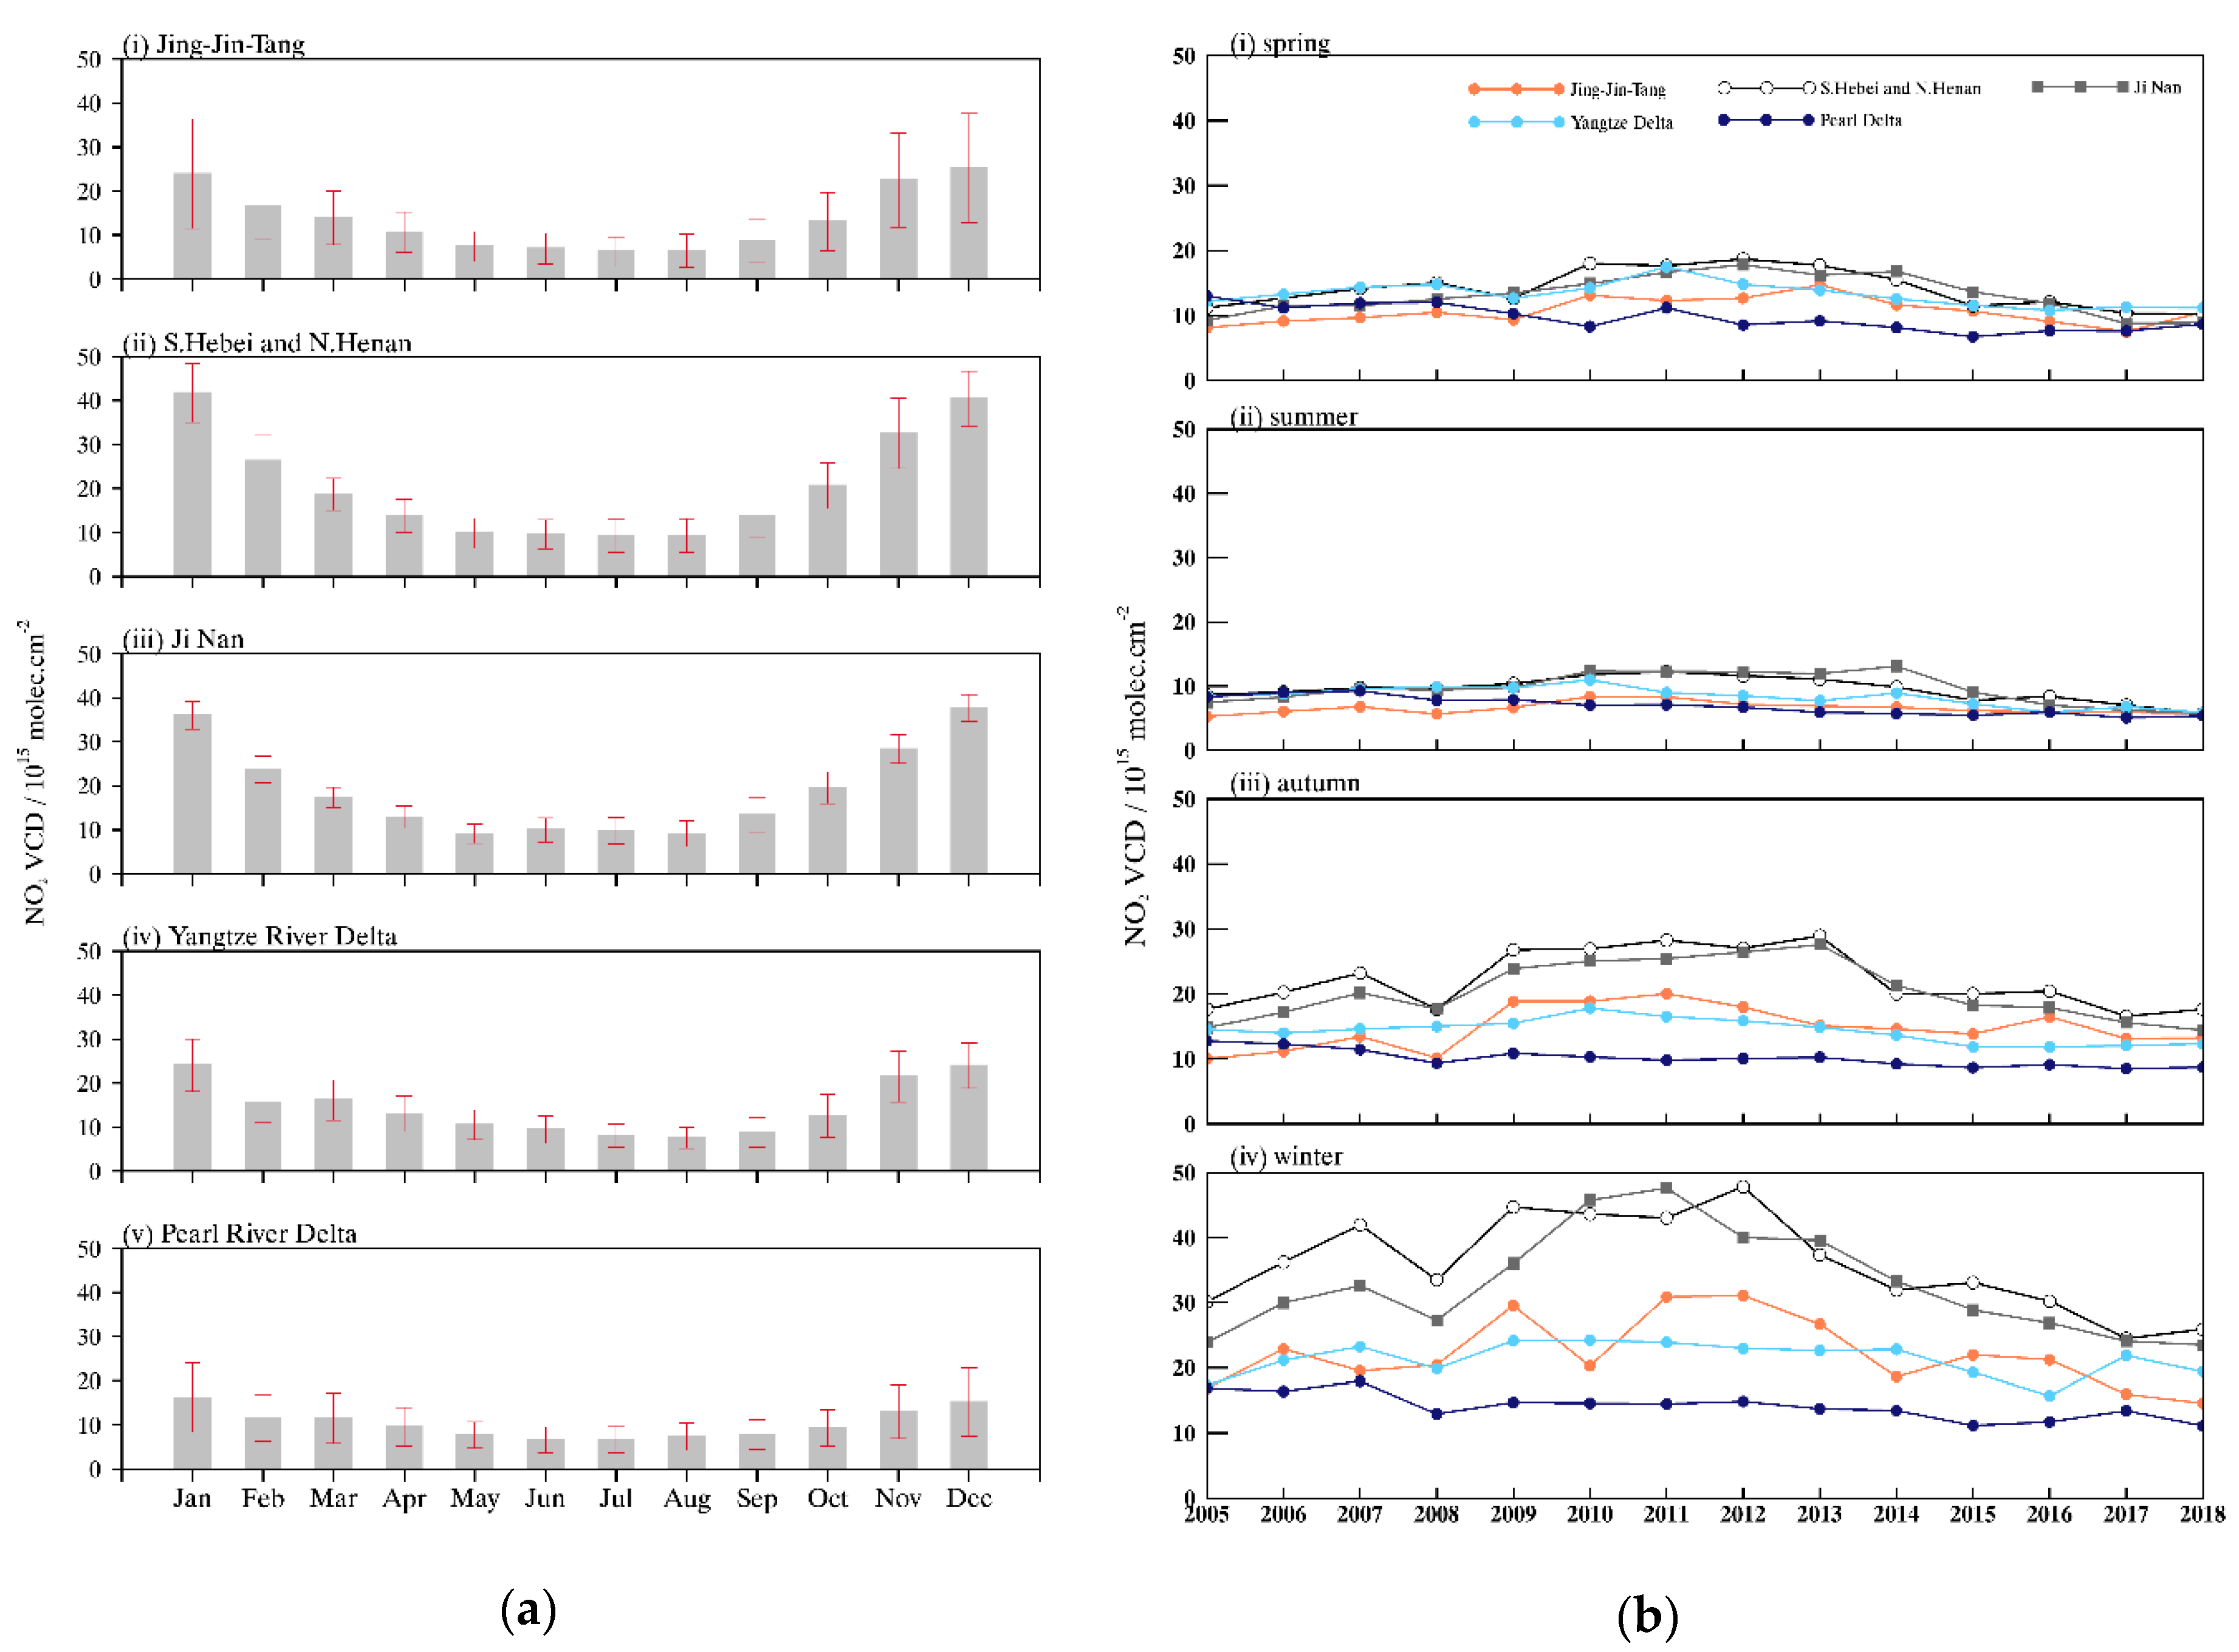
3.2. Spatial Distribution and Long-Term Trends of Tropospheric NO2 VCD at the Five Hotspots

The annual variations in the five hotspots present different change patterns in Figure 4. The mean tropospheric NO2 VCD in Jing–Jin–Tang, the combined Southern Hebei and Northern Henan (S. Hebei and N. Henan), Jinan, Yangtze River Delta and Pearl River Delta from 2005–2018 are 13.46, 20.17, 18.85, 14.30 and 10.25 (×1015 molec cm−2), respectively, as mentioned in Section 3.1. The S. Hebei and N. Henan combined region has a maximum value in the 14-year average of NO2 VCD, followed by Jinan, and the minimum is in the Pearl River Delta, which is consistent with the overall change in NO2 columns for the five main areas over the 14 years (see Figure 4). More specifically, S. Hebei and N. Henan were the regions with the highest NO2 columns until 2010, after which the highest value region swung back and forth between S. Hebei and N. Henan combined and Jinan, but both areas were higher than any other regions. Moreover, the annual changes in the S. Hebei and N. Henan combined region, Jinan and Jing–Jin–Tang are similar during the 14-year study period. The tropospheric NO2 VCD in the three regions increased significantly from 2005 to 2007, decreasing by 7.7%, 3.6% and 18.2%, respectively, in 2008. The reduction is closely related to a series of policies issued by the government during the 2008 Olympic Games, for instance, restrictions were imposed on traffic and emission reductions were expected for industrial activities, especially in Beijing and the surrounding cities [34,63]. Increasing trends with different levels appeared in the three regions during 2008–2011. However, the three regions have all shown a decreasing trend in recent years, where the NO2 VCD in the S. Hebei and N. Henan combined region, Jinan and Jing–Jin–Tang has decreased by 42.6%, 51.1% and 33.4%, respectively, since 2011.
By comparison, annual variations in the other two regions are relatively moderate, and the NO2 column concentrations are also comparatively smaller. The tropospheric NO2 VCD fluctuated over a small range in the Yangtze River Delta during 2005–2011 (increased by 26.3%), with a peak at 16.87 × 10¹⁵ molec cm−2 in 2011 and a subsequent, steady decline (decreased by 25.1% since 2011). The mean NO2 VCD dropped slowly in the Pearl River Delta during the 14-year period and decreased by 30.1% during this period. In brief, the tropospheric NO2 VCD in the five hotspots, except the Pearl River Delta, experienced a process of first increasing and then decreasing, and this process is not simply monotonous.
Table 2 shows the variations in tropospheric NO2 columns over some leading cities in the five areas we selected. The locations of these cities can be found in Figure 2c. Nearly all cities except Guangzhou had a growth of NO2 in 2012 compared with 2005 and then declined until 2018. Compared with 2005, the amount of NO2 in Jinan, Tianjin, Beijing, Zhengzhou and Shijiazhuang increased more obviously in 2012 and increased by 95.1%, 71.0%, 65.9%, 61.7% and 50.1%, respectively. By contrast, compared with 2012, all cities showed a downward trend in 2018, especially the cities with an obvious upward trend in the previous stage (2005–2012). Guangzhou was a more special situation that decreased in these two periods. In addition, Beijing had the lowest concentration of NO2 among these cities.
In fact, except for the policies enforced in 2008, the government has also proclaimed some measures and plans to prevent or control air pollution. As mentioned before, the 12th five-year plan implemented in 2012 and the Air Pollution Prevention and Control Action Plan implemented in 2013 are important policies for environmental governance in China. The changes in NO2 amount over China can also reflect the effectiveness of these policies to a certain extent.
Beijing, as the capital of China, is the political and cultural center of China. Beijing is also an area where various environmental protection policies are strictly implemented. Therefore, it is necessary to explore the effects of environmental governance. The detailed variation characteristics of the tropospheric NO2 VCD in Beijing and Jing–Jin–Tang were analyzed as follows. Figure 5a shows the 14-year averaged NO2 VCD in Beijing and the Jing–Jin–Tang region (12.58 and 13.46 × 10¹⁵ molec cm−2, respectively). It is evident that Beijing, Tianjin and Tangshan are major cities in the Jing–Jin–Tang region, all of which are characterized by high concentrations of NO2. Furthermore, the linear trend is reflected in Figure 5b. Compared with other areas in the Jing–Jin–Tang region, Beijing showed a significant downward trend during the 14-year study period, approximately −0.042 (×1015 molec cm−2 year−1) after the regional average. However, the Jing–Jin–Tang region had an opposite tendency, approximately 0.060 (×1015 molec cm−2 year−1) after the regional average. This result was mainly ascribed to the other areas in this region, especially Tangshan, which exhibited relatively strong growth trends.
Monthly variations in NO2 column densities in Beijing and the Jing–Jin–Tang region during the 14-year study period are presented in Figure 6a. First, an outstanding feature is revealed, where the variation in NO2 VCD shows a periodic seasonal cycle, with the highest values in winter and lowest in summer. This feature will be discussed in depth in Section 3.3. Second, the long-term trends in the two regions are described. The NO2 amount in Beijing is close to that of the Jing–Jin–Tang region every month, but the downward trend of the former is more obvious than the latter over the past 14 years. This characteristic is more evident in Figure 6b.
As Figure 6b depicts, the trends in the NO2 VCD in Beijing basically coincide with the Jing–Jin–Tang region. The values of NO2 VCD in Beijing were lower than those of Jing–Jin–Tang nearly every year, except in 2005 and 2006. Specifically, the two regions featured increasing NO2 from 2005 to 2007 and showed a significant drop in 2008 (decreasing by 20.4% in Beijing and 18.2% in Jing–Jin–Tang), mainly due to the pollution control regulations during the Olympic Games. From 2008 to 2012, Beijing and Jing–Jin–Tang showed an upward trend, reaching a maximum in 2012 (increasing by 54.5% and 55%, respectively, since 2008), and then, a steady downward trend has been sustained in recent years (decreasing by 37.4% and 36.2%, respectively, since 2012). Overall, the NO2 amount in Beijing has decreased by 3.8% since 2005, while the NO2 amount in Jing–Jin–Tang has increased by 14.3% since 2005.
Beijing and its surrounding areas differ greatly in their variations in NO2 columns, which may be due to the following reasons: On the one hand, Beijing has implemented stricter environmental control policies, including motor vehicle management and factory relocations since 2008, which has fundamentally curbed the emissions of NOx. This inference is affirmed by Diao et al. [64]. However, NO2 has a short life, especially in summer, so pollutants cannot be transported over long distances. Accordingly, the distributions of NO2 are associated with emission sources and meteorological conditions [63].

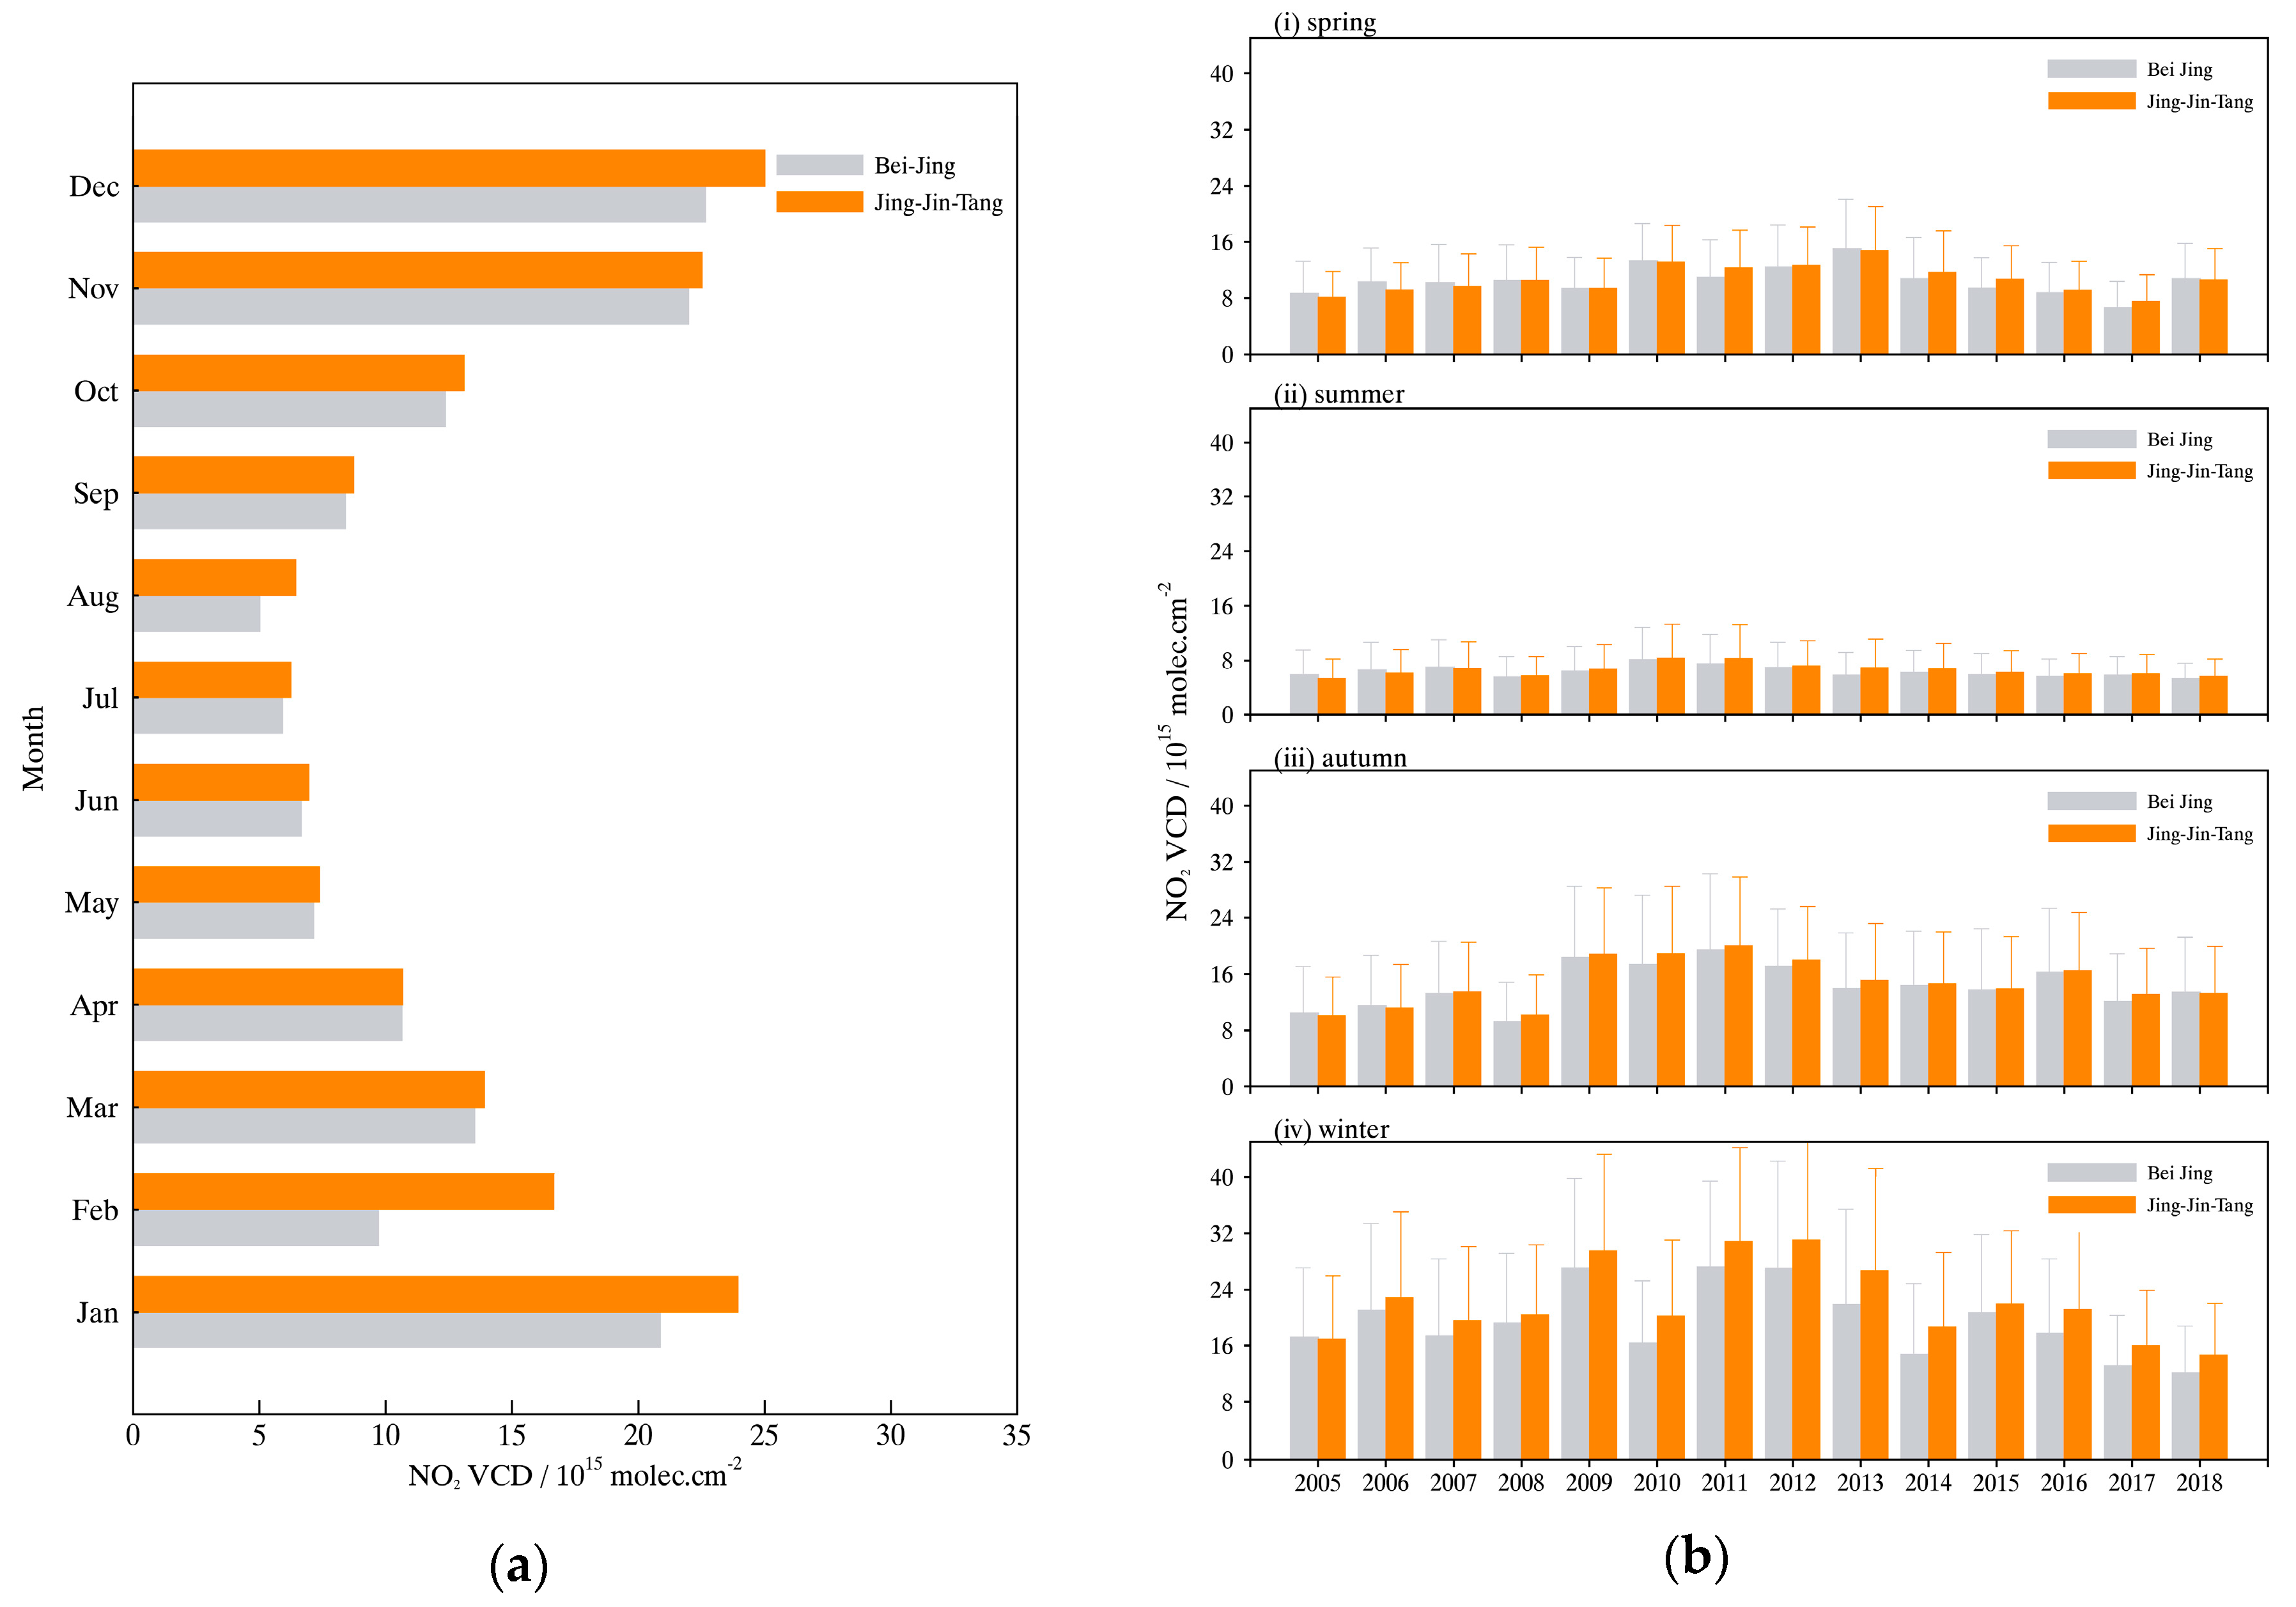
3.3. Monthly and Seasonal Patterns of Tropospheric NO2 VCD

The seasonal distributions of NO2 VCD over China over 14 years are shown in Figure 7. The seasonal variation features are noticeable throughout the country, where east China is the highest in winter and lowest in summer. In contrast, west China is the highest in summer and lowest in winter (except Urumqi). This difference is probably due to the differences in the generation of NOx in different regions. Van der A et al. [32] concluded that the main sources of NOx in the western part of China were natural emissions, which were dependent on temperature, soil and precipitation, while the NOx in eastern China was mainly related to human activities such as industrial emissions. In particular, coal-fired heating is a prime reason for large NOx emissions during wintertime. The NOx lifetime is longer in winter than in other seasons, causing severe air pollution at this time. In addition, the areas with high concentrations of NO2 are consistent with the areas of focus in Figure 1.
The analyses of time series are based on monthly averages and seasonal averages, which are shown in Figure 8. Monthly averages of NO2 VCD were calculated in five areas during the 14-year period and drawn in Figure 8a. Regardless of the regions we considered, winter (January, February and December) showed higher values than summer (June, July and August), forming a “V” shape in each chart. Moreover, annual range is the most evident in the S. Hebei and N. Henan combined region as well as in Jinan, where maximum minus minimum values exceed 25 (×1015 molec cm−2) in different months. Then, the Jing–Jin–Tang and Yangtze River Delta values are more than 15 (×1015 molec cm−2) regarding the difference between winter and summer. In contrast, the Pearl River Delta has the smallest amplitude in both numerical value and annual cycle, with the highest value in January and lowest value in August along with difference values of less than 5 (×1015 molec cm−2).
In Figure 8b, each chart depicts seasonal comparisons of the five regions during the whole period. The characteristics of long-term seasonal variations were remarkable in winter and autumn but were not obvious in summer and spring among the five specified regions for the 2005–2018 period. In winter, the S. Hebei and N. Henan combined region and Jinan had the maximum values of tropospheric NO2 VCD of the entire period. These regions also showed the most dramatic variability. The temporal patterns in the two regions were similar to those of the analysis we completed in Figure 4. For the Jing–Jin–Tang region, the changes in the NO2 amount during winter showed an increasing trend before 2009 and then a decreasing trend until 2018, except for the abnormal peak in 2010. The reduction rate of tropospheric NO2 VCD between 2011 and 2014 was larger than that between 2014 and 2018. In contrast, the changes in tropospheric NO2 columns in the Yangtze River Delta and Pearl River Delta were slight in winter during the 14-year period, and the NO2 amounts in the former region were all higher than those in the latter period of each year. The variations in tropospheric NO2 columns in autumn during the 14-year period were somewhat similar to those in winter. However, the NO2 levels were smaller than those in winter.
Similarly, a more detailed comparison and analysis of the seasonal variations between Beijing and Jing–Jin–Tang was carried out. As clearly shown in Figure 9a, conspicuous differences in the NO2 amount between Beijing and Jing–Jin–Tang occurred in January, February and December, and the difference values were approximately 3.06, 6.94 and 2.56 (×1015 molec cm−2), respectively. During other months, there were only subtle differences in NO2 amounts between the two regions. This point is more evident in Figure 9b. Compared with other seasons, the long-term changes in the NO2 columns in winter were the most significant; an intense contrast between the two regions was also apparent. In the past 14 years, the values of the NO2 columns in Beijing were basically smaller than those in Jing–Jin–Tang. Furthermore, the NO2 concentrations in both places have steadily decreased during winter since 2012. With the implementation of various measures, NO2 pollution has been more effectively controlled in Beijing than in the surrounding areas. In recent years, Beijing has taken more stringent measures to control air pollution during the winter heating period. The government has focused on key emission sources during autumn and winter, and several measures were proposed, including promoting the adjustment of transportation structure and encouraging investments in new high-technology industries such as clean energy.

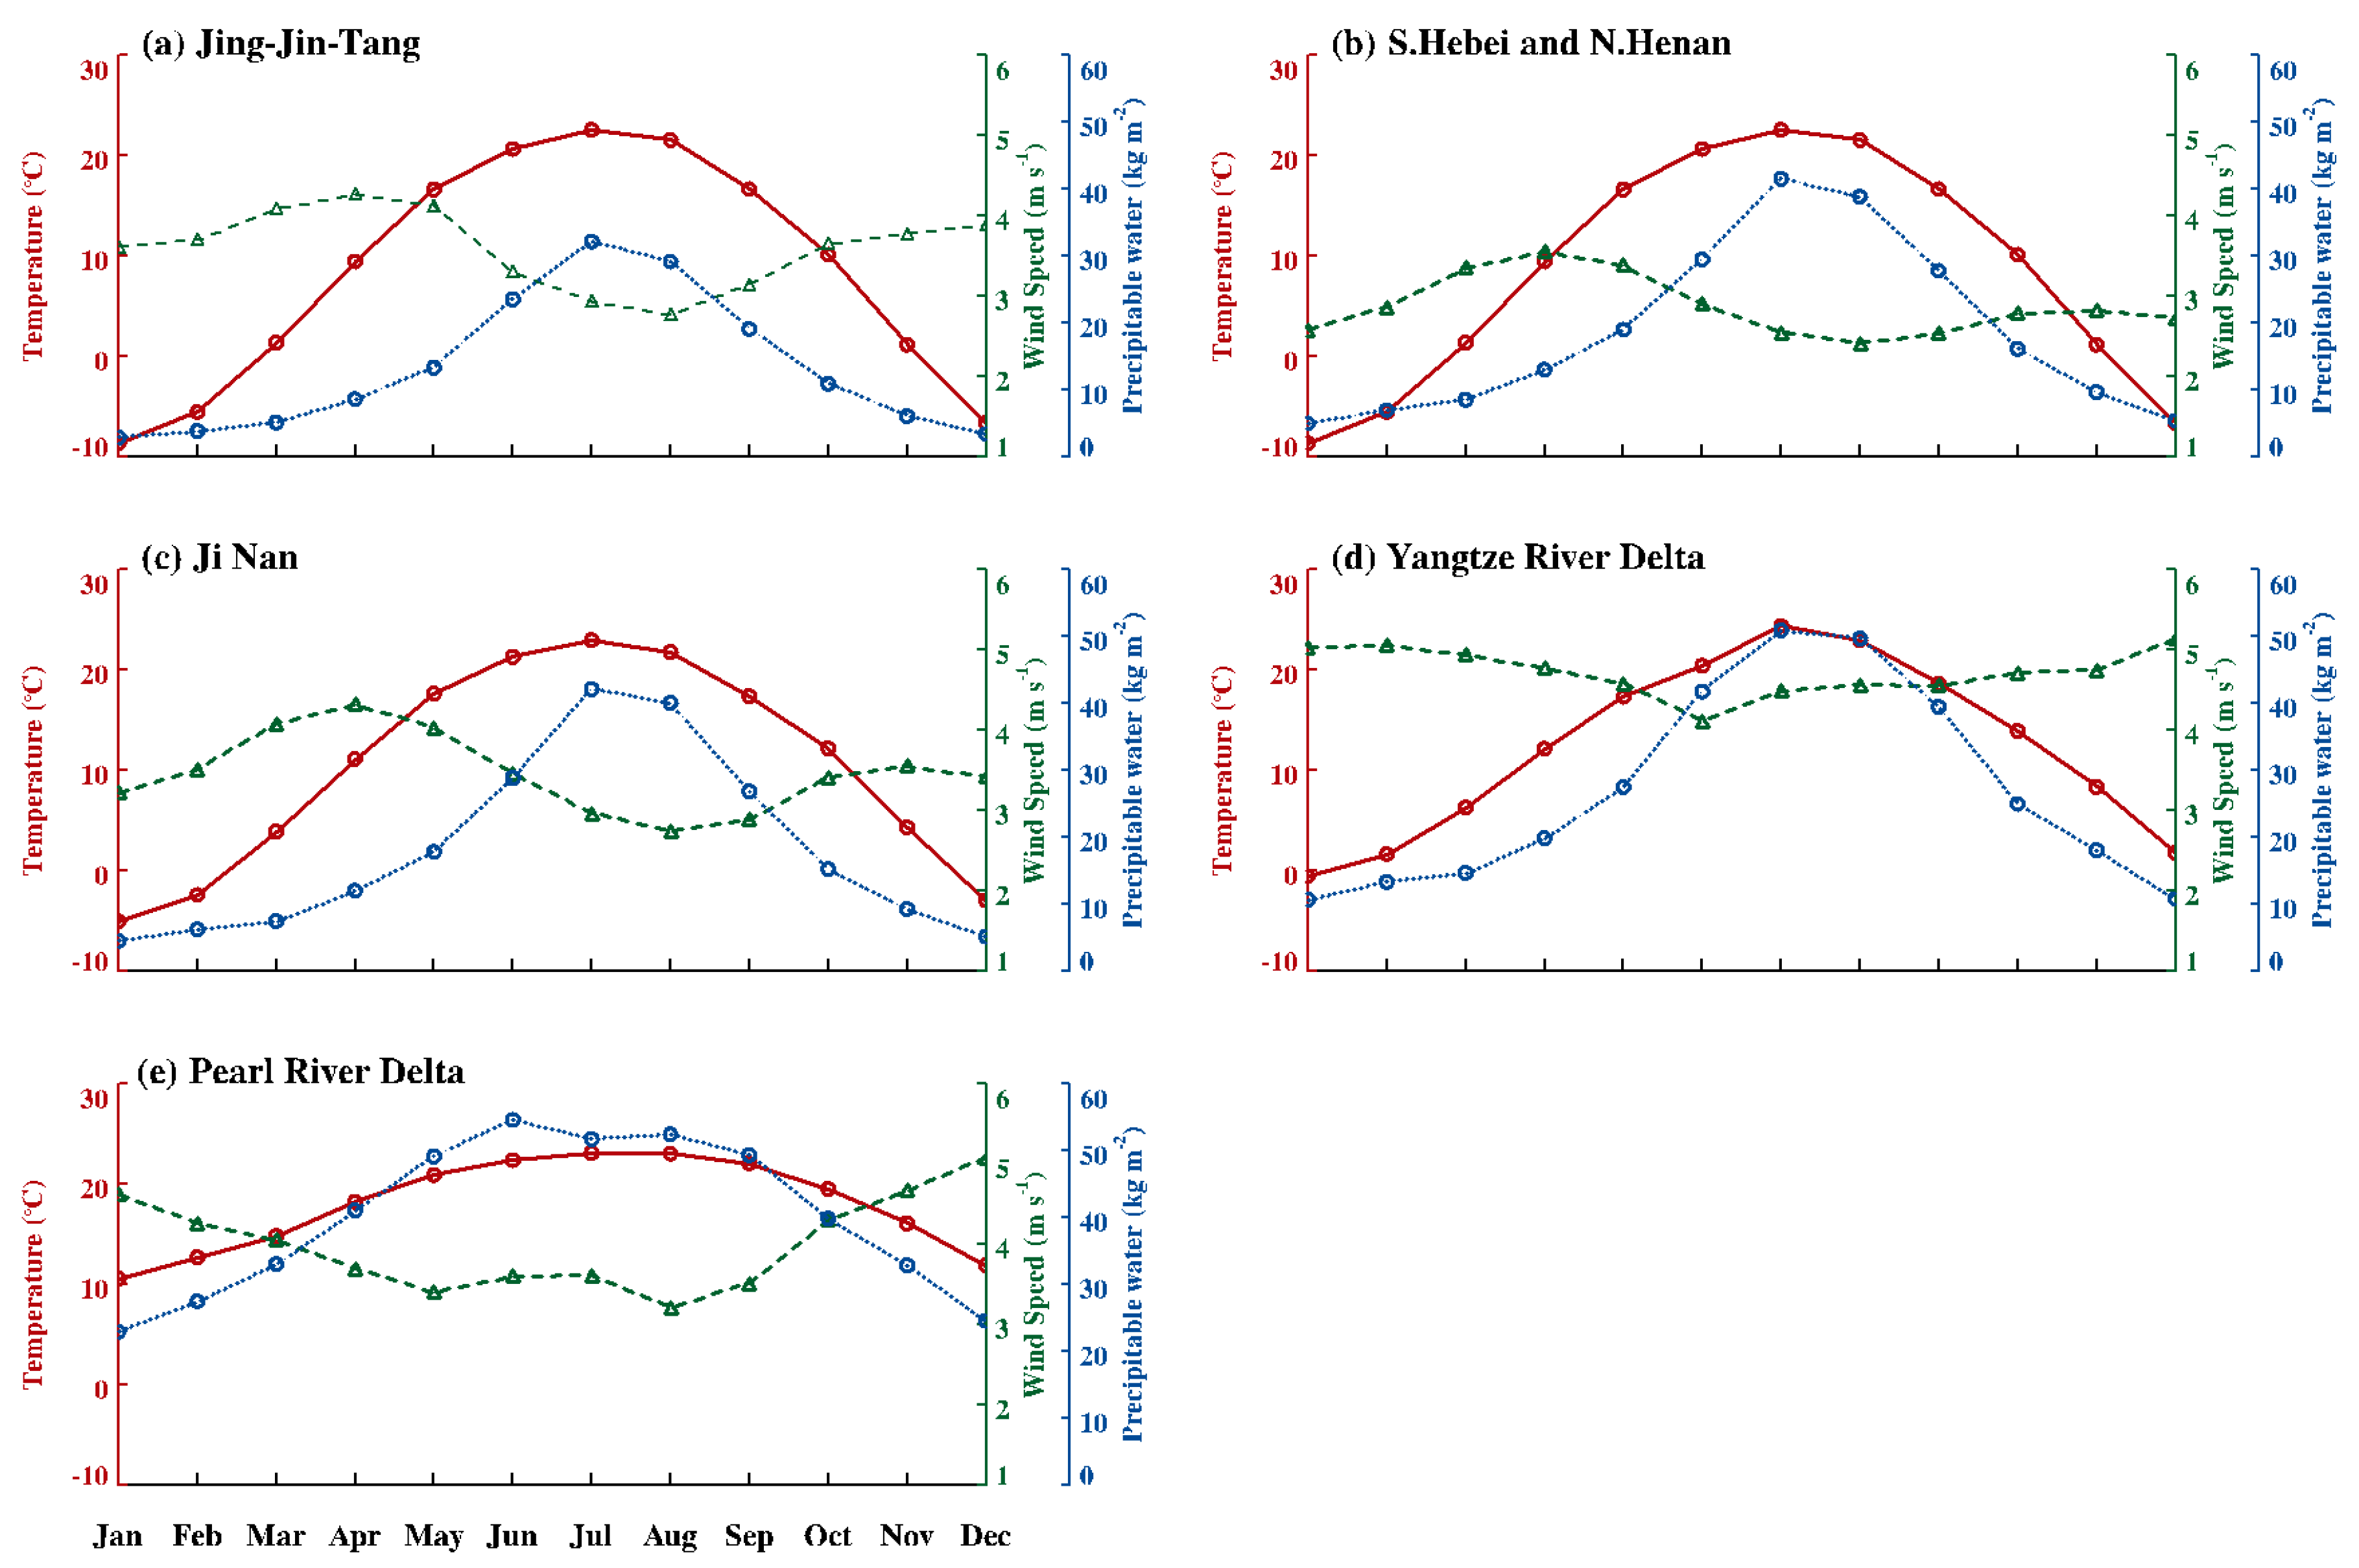
3.4. Impacts of Meteorological Conditions

Generally, three main factors need to be considered to explain the NO2 changes in a specific region, including the amount of NOx emission, NOx lifetime and the NO2 transportation among diffident regions [62]. As discussed in Section 3.3, NO2 variation has a significant seasonal characteristic, which is larger in winter and lower in summer. First, from the perspective of NOx emission, large increase in fossil fuel consumption is a prime reason due to large NOx emissions during wintertime. Then in winter, the lifetime of NOx is also larger than other seasons because of the weaker solar radiation and lower atmospheric temperature. All these factors delay the process of atmospheric chemical reactions. In contrast, the solar radiation is stronger in summer and chemical reaction is active, which are beneficial to NO2 removal. Finally, NO2 transportation is related to meteorological conditions. In winter, although the average wind speed is higher, the NO2 emissions are also larger. In addition, the atmospheric boundary layer is low in winter. It is easy to form an inversion layer, which leads NO2 remaining in the lower troposphere.
To further analyze the different monthly variations in different regions, we decided to investigate the meteorological conditions in these five areas. Figure 10 illustrates the annual cycle of precipitable water, wind speed and temperature at the five hotspots. Combined with the monthly average variations of NO2 in Figure 8a, it is obvious that NO2 monthly variation is associated with the seasonal change of meteorological conditions. Temperature and precipitable water are colder and less in winter which could weaken the rate of oxidation and wet deposition. In addition, compared with Jing–Jin–Tang, the S. Hebei and N. Henan combined region and Jinan, the Yangtze River Delta and the Pearl River Delta show distinct meteorological conditions. Both two regions are located at low latitudes in the Southern China and near the ocean, with average temperatures higher than other three areas. Moreover, with monsoon influence, there are more precipitation in the two regions, which are all beneficial to NO2 eliminated. This result is also consistent with the seasonal variations of NO2 concentration in the five hotspots.

4. Conclusions

In recent years, some new measures that can improve and prevent air contamination have been implemented in China. It is of great significance to understand the current air pollution situation by exploring the changes in NO2 concentrations. Furthermore, these new measures can also evaluate the beneficial effects of pollution policies and provide some reference for the next steps in air pollution control. Therefore, the results of this study describe the characteristics of tropospheric NO2 in terms of spatial distributions and temporal variations from 2005 to 2018 over China using OMI satellite data. The main conclusions are summarized as follows:
(1)
The NO2 pollution in China is significant, and the distribution of tropospheric NO2 VCD is uneven. This pollution is higher in southeastern China and lower in the northwest, which is well divided by the Heihe–Tengchong line. In addition, the North China Plain is the region over eastern China with the highest NO2 columns. Then, five areas with high NO2 columns in southeast China were selected for detailed discussion, including Jing–Jin–Tang, the combined regions of Northern Henan and Southern Hebei, Jinan in the Shandong Province, Yangtze River Delta and Pearl River Delta.
(2)
NO2 concentrations show long-term variability that varies regionally. On the one hand, the concentration of NO2 in the Pearl River Delta has been in a slow but steady decline apart from slight increases in 2007 and 2010. On the other hand, the annual variation in the NO2 columns displays two different stages in the other four areas. First, the NO2 amounts in these four regions increased significantly until 2011 or 2012, except in 2008, due to the strict measures taken for the Olympic Games. Subsequently, the growth of NO2 VCD has slowed down in recent years. Moreover, some of the largest metropolises in China, such as Beijing, Shanghai and Guangzhou, show a downward trend in the NO2 amounts during the 14-year study period.
(3)
The characteristics of the seasonal cycle are obvious in China. The NO2 amount in eastern China is the highest in winter and lowest in summer, while the western region (except Urumqi) shows the opposite feature. The features of monthly and quarterly variations also vary depending on the region under consideration. The monthly and quarterly variations in NO2 in the Pearl River Delta are relatively moderate. In contrast, the change in the S. Hebei and N. Henan combined region and Jinan are clearly primarily due to excessive coal heating during wintertime. In addition, meteorological conditions have significant impacts influenced in different regions, especially in the Yangtze River Delta and Pearl River Delta. The higher temperature, larger amount of precipitable water and faster wind speed are all beneficial to NO2 removal.
(4)
In particular, Beijing and its surrounding areas show different characteristics of NO2 variations. Beijing showed a significant downward trend during the 14-year study period. However, the Jing–Jin–Tang region showed the opposite tendency. For seasonal variations, conspicuous differences in NO2 amount between Beijing and Jing–Jin–Tang occur in winter (January, February and December), and the values of the NO2 columns in Beijing are basically smaller than those in Jing–Jin–Tang. The reasons for the different results are mainly because Beijing has implemented stricter environmental control policies.
Through the analysis of the spatial temporal variations in NO2 VCD during the 14 studied years, the effectiveness of several environmental protection policies implemented in China are seen. In the future, the factors affecting the changes in NO2 in different areas will be investigated in greater depth. Furthermore, specific control measures should be put forward according to different regions and different factors.

Author Contributions

C.W., T.W. and P.W. conceived and designed the experiments; C.W. collected and processed data; C.W. and T.W. analyzed and wrote the paper; and T.W. and P.W. contributed revisions to the paper.

Funding

This research was funded by the National Key R&D Program of China (Nos. 2017YFB0504000 and 2017YFC1501701) and the National Natural Science Foundation of China (No.41575034).

Acknowledgments

We thank NASA and KNMI for providing the OMI tropospheric NO2 data used in this study (http://www.temis.nl).

Conflicts of Interest

The authors declare no conflict of interest.

References

  1. Kasibhatla, P.S.; Levy, I.H.; Moxim, W.J.; Chameidest, W.L. The relative impact of stratospheric photochemical production on tropospheric NOy levels: A model study. J. Geophys. Res. Atmos. 1991, 96, 18631–18646. [Google Scholar] [CrossRef]
  2. Environmental Protection Agency. Air Quality Criteria for Nitrogen Oxides; Environmental Protection Agency: Washington, DC, USA, 1971.
  3. Environmental Protection Agency. Environmental Criteria and Assessment Office. Air Quality Criteria for Ozone and Other Photochemical Oxidants; U.S. Environmental Protection Agency: Washington, DC, USA, 1978.
  4. Barker, K.; Cambi, F.; Catcott, E.J.; Chambers, L.A.; Halliday, E.C.; Hasegawa, A.; Heimann, H.; Jammet, H.P.; Katz, M.; Leclerc, E.; et al. Air Pollution; World Health Organization: Geneva, Switzerland, 1961; Volume 437, pp. 40–45. [Google Scholar]
  5. Celarier, E.A.; Brinksma, E.J.; Gleason, J.F.; Veefkind, J.P.; Cede, A.; Herman, J.R.; Ionov, D.; Goutail, F.; Pommereau, J.P.; Lambert, J.C.; et al. Validation of Ozone Monitoring Instrument nitrogen dioxide columns. J. Geophys. Res. Atmos. 2008, 113, D15S15. [Google Scholar] [CrossRef]
  6. World Health Organization Regional Office for Europe. Air quality guidelines: Global update 2005. Particulate matter, ozone, nitrogen dioxide and sulfur dioxide. Indian J. Med. Res. 2007, 4, 492–493. [Google Scholar]
  7. Boersma, K.F.; Eskes, H.J.; Brinksma, E.J. Error analysis for tropospheric NO2 retrieval from space. J. Geophys. Res. Atmos. 2004, 109. [Google Scholar] [CrossRef]
  8. Yienger, J.J.; Levy, H., II. Empirical model of global soil-biogenic NOx emissions. J. Geophys. Res. Atmos. 1995, 100, 11447–11464. [Google Scholar] [CrossRef]
  9. Van der A, R.J.; Eskes, H.J.; Boersma, K.F.; van Noije, T.P.C.; Van Roozendael, M.; De Smedt, I.; Peters, D.H.M.U.; Meijer, E.W. Trends, seasonal variability and dominant NOx source derived from a ten year record of NO2 measured from space. J. Geophys. Res. Atmos. 2008, 113. [Google Scholar] [CrossRef]
  10. Heue, K.-P.; Richter, A.; Bruns, M.; Burrows, J.P.; Friedeburg, C.v.; Platt, U.; Pundt, I.; Wang, P.; Wagner, T. Validation of SCIAMACHY tropospheric NO2-coloumns with AMAXDOAS measurements. Atmos. Chem. Phys. 2005, 5, 1039–1051. [Google Scholar] [CrossRef]
  11. Schneider, P.; Lahoz, W.; van der A, R. Recent satellite-based trends of tropospheric nitrogen dioxide over large urban agglomerations worldwide. Atmos. Chem. Phys. 2015, 15, 1205–1220. [Google Scholar] [CrossRef] [Green Version]
  12. Krotkov, N.A.; McLinden, C.A.; Li, C.; Lamsal, L.N.; Celarier, E.A.; Marchenko, S.V.; Swartz, W.H.; Bucsela, E.J.; Joiner, J.; Duncan, B.N.; et al. Aura OMI observations of regional SO2 and NO2 pollution changes from 2005 to 2015. Atmos. Chem. Phys. 2016, 16, 4605–4629. [Google Scholar] [CrossRef]
  13. Wang, T.; Hendrick, F.; Wang, P.; Tang, G.; Clémer, K.; Yu, H.; Fayt, C.; Hermans, C.; Gielen, C.; Müller, G.F.; et al. Evaluation of tropospheric SO2 retrieved from MAX-DOAS measurements in Xianghe, China. Atmos. Chem. Phys. 2014, 14, 11149–11164. [Google Scholar] [CrossRef]
  14. Wang, T.; Wang, P.; Theys, N.; Tong, D.; Hendrick, F.; Zhang, Q.; Roozendael, M.V. Spatial and temporal changes in SO2 regimes over China in the recent decade and the driving mechanism. Atmos. Chem. Phys. 2018, 18, 18063–18078. [Google Scholar] [CrossRef]
  15. Streets, D.G.; Yarber, K.F.; Woo, J.H.; Carmichael, G.R. Biomass burning in Asia: Annual and seasonal estimates and atmospheric emissions. Glob. Biogeochem. Cycles 2003, 17, 1099. [Google Scholar] [CrossRef]
  16. Wang, Y.X.; McElroy, M.B. Asian emissions of CO and NOx: Constraints from aircraft and Chinese station data. J. Geophys. Res. Atmos. 2004, 109. [Google Scholar] [CrossRef]
  17. The Multi-resolution Emission Inventory for China (MEIC). Available online: http://www.meicmodel.org/ (accessed on 28 July 2019).
  18. Li, M.; Zhang, Q.; Kurokawa, J.I.; Woo, J.H.; He, K.; Lu, Z.; Ohara, T.; Song, Y.; Streets, D.G.; Carmichael, G.R. MIX: A mosaic Asian anthropogenic emission inventory under the international collaboration framework of the MICS-Asia and HTAP. Atmos. Chem. Phys. 2017, 17, 935–963. [Google Scholar] [CrossRef]
  19. Velders, G.J.M.; Granier, C.; Portmann, R.W.; Pfeilsticker, K.; Wenig, M.; Wagner, T.; Platt, U.; Richter, A.; Burrows, J.P. Global tropospheric NO2 column distributions: Comparing three-dimensional model calculations with GOME measurements. J. Geophys. Res. Atmos. 2001, 106, 12643–12660. [Google Scholar] [CrossRef]
  20. Richter, A.; Burrows, J.P. Tropospheric NO2 from GOME measurements. Adv. Space Res. 2002, 29, 1673–1683. [Google Scholar] [CrossRef]
  21. Kostadinov, I.; Petritoli, A.; Werner, R.; Valev, D.; Atanasov, A.; Bortoli, D.; Markova, T.; Ravegnani, F.; Palazzi, E.; Giovanelli, G. Validation of SCIAMACHY NO2 Vertical Column Densities with Mt. Cimone and Stara Zagora Ground-Based Zenith Sky DOAS Observations. In Proceedings of the Second Workshop on the Atmospheric Chemistry, Validation of Envisat (ACVE-2), ESA-ESRIN, Frascati, Italy, 3–7 May 2004. [Google Scholar]
  22. Schaub, D.; Brunner, D.; Boersma, K.F.; Keller, J.; Folini, D.; Buchmann, B.; Berresheim, H.; Staehelin, J. SCIAMACHY tropospheric NO2 over Switzerland: Estimates of NOx lifetimes and impact of the complex Alpine topography on the retrieval. Atmos. Chem. Phys. 2007, 7, 5971–5987. [Google Scholar] [CrossRef]
  23. Blond, N.; Boersma, K.F.; Eskes, H.J.; van der A, R.J.; Van Roozendael, M.; De Smedt, I.; Bergametti, G.; Vautard, R. Intercomparison of SCIAMACHY nitrogen dioxide observations in situ measurements and air quality modeling results over Western Europe. J. Geophys. Res. Atmos. 2007, 112. [Google Scholar] [CrossRef]
  24. Ialongo, I.; Hakkarainen, J.; Hyttinen, N.; Jalkanen, J.-P.; Johansson, L.; Boersma, K.F.; Krotkov, N.A.; Tamminen, J. Characterization of OMI tropospheric NO2 over the Baltic Sea region. Atmos. Chem. Phys. 2014, 14, 7795–7805. [Google Scholar] [CrossRef]
  25. Boersma, K.F.; Eskes, H.J.; Veefkind, J.P.; Brinksma, E.J.; van der A, R.J.; Sneep, M.; van den Oord, G.H.J.; Levelt, P.F.; Stammes, P.; Gleason, J.F.; et al. Near-real time retrieval of tropospheric NO2 from OMI. Atmos. Chem. Phys. 2007, 7, 2103–2118. [Google Scholar] [CrossRef]
  26. Bucsela, E.J.; Krotkov, N.A.; Celarier, E.A.; Lamsal, L.N.; Swartz, W.H.; Bhartia, P.K.; Boersma, K.F.; Veefkind, J.P.; Gleason, J.F.; Pickering, K.E. A new stratospheric and tropospheric NO2 retrieval algorithm for nadir-viewing satellite instruments: Applications to OMI. Atmos. Meas. Tech. 2013, 6, 2607–2626. [Google Scholar] [CrossRef]
  27. Griffin, D.; Zhao, X.; McLinden, C.A.; Boersma, F.; Bourassa, A.; Dammers, E.; Degenstein, D.; Eskes, H.; Fehr, L.; Fioletov, V.; et al. High-Resolution Mapping of Nitrogen Dioxide with TROPOMI: First Results and Validation over the Canadian Oil Sands. Geophys. Res. Lett. 2019, 46, 1049–1060. [Google Scholar] [CrossRef]
  28. Zhang, Q.; Geng, G.; Wang, S.; Andreas, R.; He, K. Satellite remote sensing of changes in NOx emissions over China: 1996–2010. Chin. Sci. Bull. 2012, 16, 1446–1453. [Google Scholar]
  29. Schneider, P.; van der A, R.J. A global single-sensor analysis of 2002–2011 tropospheric nitrogen dioxide trends observed from space. J. Geophys. Res. Atmos. 2012, 117. [Google Scholar] [CrossRef]
  30. Geddes, J.A.; Martin, R.V. Global deposition of total reactive nitrogen oxides from 1996 to 2014 constrained with satellite observations of NO2 columns. Atmos. Chem. Phys. 2017, 17, 1–44. [Google Scholar] [CrossRef]
  31. Xiao, K.; Wang, Y.; Wu, G.; Fu, B.; Zhu, Y. Spatiotemporal Characteristics of Air Pollutants (PM10, PM2.5, SO2, NO2, O3, and CO) in the Inland Basin City of Chengdu, Southwest China. Atmosphere 2018, 9, 74. [Google Scholar] [CrossRef]
  32. Van der A, R.J.; Peters, D.H.M.U.; Eskes, H.; Boersma, K.F.; Van Roozendael, M.; De Smedt, I.; Kelder, H.M. Detection of the trend and seasonal variation in tropospheric NO2 over China. J. Geophys. Res. Atmos. 2006, 111, 1–10. [Google Scholar] [CrossRef]
  33. Zhang, X.; Zhang, P.; Zhang, Y.; Li, X.; Qiu, H. The variation trend and temporal-spatial distribution as well as the source analysis of tropospheric NO2 in latest 10 years over China. Sci. China D Earth Sci. 2007, 37, 1409–1416. [Google Scholar]
  34. Lin, J.T.; McElroy, M.B. Detection from space of a reduction in anthropogenic emissions of nitrogen oxides during the Chinese economic downturn. Atmos. Chem. Phys. 2011, 11, 8171–8188. [Google Scholar] [CrossRef] [Green Version]
  35. Georgoulias, A.K.; Van der A, R.J.; Stammes, P.; Boersma, K.F.; Eskes, H.J. Trends and trend reversal detection in 2 decades of tropospheric NO2 satellite observations. Atmos. Chem. Phys. 2019, 19, 6269–6294. [Google Scholar] [CrossRef]
  36. Dirksen, R.J.; Boersma, K.F.; Eskes, H.J.; Ionov, D.V.; Bucsela, E.J.; Levelt, P.F.; Kelder, H.M. Evaluation of stratospheric NO2 retrieved from the Ozone Monitoring Instrument: Intercomparison, diurnal cycle, and trending. J. Geophys. Res. Atmos. 2011, 116. [Google Scholar] [CrossRef]
  37. Wang, T.; Wang, P.; Hendrick, F.; Yu, H.; Van Roozendael, M. The Spatial and Temporal Variability of Tropospheric NO2 during 2005–2014 over China Observed by the OMI. Atmos. Ocean. Sci. Lett. 2015, 8, 392–396. [Google Scholar]
  38. Liu, F.; Beirle, S.; Zhang, Q.; Van der A, R.J.; Zheng, B.; Tong, D.; He, K. NOx emission trends over Chinese cities estimated from OMI observations during 2005 to 2015. Atmos. Chem. Phys. 2017, 17, 9261. [Google Scholar] [CrossRef]
  39. Hou, Y.; Wang, L.; Zhou, Y.; Wang, S.; Liu, W.; Zhu, J. Analysis of the tropospheric column nitrogen dioxide over China based on satellite observations during 2008–2017. Atmos. Pollut. Res. 2019, 10, 651–655. [Google Scholar] [CrossRef]
  40. Xiao, Z.; Jiang, H.; Cheng, M. Characteristics of atmospheric NO2 over China using OMI remote sensing data. Acta Sci. Circumst. 2011, 31, 2080–2090. [Google Scholar]
  41. Van der A, R.J.; Mijling, B.; Ding, J.; Koukouli, M.E.; Liu, F.; Li, Q.; Mao, H.; Theys, N. Cleaning up the air: Effectiveness of air quality policy for SO2 and NOx emissions in China. Atmos. Chem. Phys. 2017, 17, 1–18. [Google Scholar] [CrossRef]
  42. Ai, J.; Sun, Y.; Zheng, F.; Ni, C.; Gui, K.; Zhang, X.; Jiang, W.; Liao, T. The spatial temporal variation and factor analysis of the tropospheric NO2 columns in the Sichuan Basin from 2005 to 2016. Atmos. Pollut. Res. 2018, 9, 1157–1166. [Google Scholar] [CrossRef]
  43. Cai, K.; Zhang, Q.; Li, S.; Li, Y.; Ge, W. Spatial–Temporal Variations in NO2 and PM2.5 over the Chengdu–Chongqing Economic Zone in China during 2005–2015 Based on Satellite Remote Sensing. Sensors 2018, 18, 3950. [Google Scholar] [CrossRef]
  44. Li, Y.; Zheng, Y.; Liu, M.; Zheng, B.; Wang, T.; Tong, D.; Su, J.; Wang, P.; Lin, J.; Zhang, Q. Satellite-based observations of changes in nitrogen dioxides over the Beijing-Tianjin-Hebei region from 2011 to 2017. Acta Sci. Circumst. 2018, 38, 3797–3806. [Google Scholar]
  45. Ma, Z.; Liu, R.; Liu, Y.; Bi, J. Effects of air pollution control policies on PM2.5 pollution improvement in China from 2005 to 2017: A satellite-based perspective. Atmos. Chem. Phys. 2019, 19, 6861–6877. [Google Scholar] [CrossRef]
  46. Notice of the Ministry of Environmental Protection on Issuing the General Planning for the Development of Environmental Protection Legislation and Environmental Economic Policies in China during the 12th Five-Year Plan Period. Available online: http://www.gov.cn/zwgk/2011-09/07/content_1941731.htm (accessed on 9 April 2019).
  47. Notice of the Ministry of Environmental Protection on Issuing the General Planning for the Development of Environmental Protection Legislation and Environmental Economic Policies in China during the 13th Five-Year Plan Period. Available online: http://www.ndrc.gov.cn/gzdt/201701/t20170105_834501.html (accessed on 9 April 2019).
  48. Clean Air Alliance of China. State Council Air Pollution Prevention and Control Action Plan, Issue II. Available online: http://en.cleanairchina.org/product/6346.html (accessed on 9 April 2019).
  49. Levelt, P.F.; Veefkind, J.P.; Kroon, M.; Brinksma, E.J.; McPeters, R.D.; Labow, G.; Krotkov, N.; Ionov, D.; Hilsenrath, E.; Tamminen, J.; et al. The ozone monitoring instrument. IEEE Trans. Geosci. Remote Sens. 2006, 44, 1093–1101. [Google Scholar] [CrossRef]
  50. Levelt, P.F.; Joiner, J.; Tamminen, J.; Veefkind, J.P.; Bhartia, P.K.; Stein Zweers, D.C.; Duncan, B.N.; Streets, D.G.; Eskes, H.J.; van der A, R.J.; et al. The Ozone Monitoring Instrument: Overview of 14 years in space. Atmos. Chem. Phys. 2018, 18, 5699–5745. [Google Scholar] [CrossRef]
  51. Wenig, M.O.; Cede, A.M.; Bucsela, E.J.; Celarier, E.A.; Boersma, K.F.; Veefkind, J.P.; Brinksma, E.J.; Gleason, J.F.; Herman, J.R. Validation of OMI tropospheric NO2 column densities using direct-Sun mode Brewer measurements at NASA Goddard Space Flight Center. J. Geophys. Res. Atmos. 2008, 113, 1–10. [Google Scholar] [CrossRef]
  52. Bucsela, E.J.; Perring, A.E.; Cohen, R.C.; Boersma, K.F.; Celarier, E.A.; Gleason, J.F.; Wenig, M.O.; Bertram, T.H.; Wooldridge, P.J.; Dirksen, R.; et al. Comparison of tropospheric NO2 from in situ aircraft measurements with near-real-time and standard product data from OMI. J. Geophys. Res. Atmos. 2008, 113, 1–14. [Google Scholar] [CrossRef]
  53. Boersma, K.F.; Jacob, D.J.; Trainic, M.; Rudich, Y.; DeSmedt, I.; Dirksen, R.; Eskes, H.J. Validation of urban NO2 concentrations and their diurnal and seasonal variations observed from the SCIAMACHY and OMI sensors using in situ surface measurements in Israeli cities. Atmos. Chem. Phys. 2009, 9, 3867–3879. [Google Scholar] [CrossRef]
  54. Platt, U.; Stutz, J. Differential Optical Absorption Spectroscopy: Principles and Applications; Springer: Heidelberg, Germany, 2004. [Google Scholar]
  55. Bucsela, E.J.; Celarier, E.A.; Wenig, M.O.; Gleason, J.F.; Veefkind, J.P.; Boersma, K.F.; Brinksma, E.J. Algorithm for NO2 vertical column retrieval from the ozone monitoring instrument. IEEE Trans. Geosci. Remote Sens. 2006, 44, 1245–1258. [Google Scholar] [CrossRef]
  56. Lamsal, L.N.; Krotkov, N.A.; Celarier, E.A.; Swartz, W.H.; Pickering, K.E.; Bucsela, E.J.; Gleason, J.F.; Martin, R.V.; Philip, S.; Irie, H.; et al. Evaluation of OMI operational standard NO2 retrievals using in situ and surface-based NO2 observations. Atmos. Chem. Phys. 2014, 14, 11587–11609. [Google Scholar] [CrossRef]
  57. Ialongo, I.; Herman, J.R.; Krotkov, N.A.; Lamsal, L.N.; Boersma, K.F.; Hovila, J.; Tamminen, J. Comparison of OMI NO2 observations and their seasonal and weekly cycles with ground-based measurements in Helsinki. Atmos. Meas. Tech. 2016, 9, 5203–5212. [Google Scholar] [CrossRef]
  58. Tropospheric Emission Monitoring Internet Service. Available online: http://www.temis.nl (accessed on 28 July 2019).
  59. Zhao, W.; Guo, J.; Yao, Z.; Yun, Y.; Jia, S.; Wang, W.; Zhang, P.; Xu, H.; Liu, H.; Gao, L.; et al. Declining hailstorm frequency in China during 1961–2015 and its potential influential factors. Int. J. Climatol. 2018, 38, 4116–4126. [Google Scholar] [CrossRef]
  60. Chen, M.; Gong, Y.; Li, Y.; Lu, D.; Zhang, H. Population distribution and urbanization on both sides of the Hu Huanyong Line: Answering the Premier’s question. J. Geogr. Sci. 2016, 26, 1593–1610. [Google Scholar] [CrossRef]
  61. Wang, W.N.; Cheng, T.; Gu, X.; Chen, H.; Guo, H.; Wang, Y.; Bao, F.; Shi, S.; Xu, B.; Zuo, X.; et al. Assessing Spatial and Temporal Patterns of Observed Ground-level Ozone in China. Sci. Rep. 2017, 7, 3651. [Google Scholar] [CrossRef] [PubMed]
  62. Wang, T.; Wang, P.; Yu, H.; Sun, L. Analysis of the characteristics of tropospheric NO2 in Xianghe based on MAX-DOAS measurement. Clim. Environ. Res. 2014, 19, 51–60. [Google Scholar]
  63. Yu, H.; Wang, P.; Zong, X.; Li, X.; Lv, D. Changes of NO2 column Concentration during the Olympic Games in Beijing. Chin. Sci. Bull. 2009, 54, 299–304. [Google Scholar]
  64. Diao, B.; Ding, L.; Su, P.; Cheng, J. The Spatial-Temporal Characteristics and Influential Factors of NOx Emissions in China: A Spatial Econometric Analysis. Int. J. Environ. Res. Public Health 2018, 15, 1405. [Google Scholar] [CrossRef] [PubMed]
Figure 1. The spatial distribution of the average 14-year tropospheric NO2 vertical column density (VCD) from 2005 to 2018 (unit: 1015 molec cm−2). The red boxes denote the five hotspots we selected. From north to south, these hotspots are Beijing–Tianjin–Tangshan, South of Hebei and North of Henan combined, Jinan, Yangtze River Delta and Pearl River Delta. Triangles indicate the mean capital city of each province. The red line denotes the Heihe–Tengchong line (Hu Huaiyong line).
Atmosphere 10 00444 g001
Figure 2. Tropospheric NO2 VCD linear trends over China (unit: 1015 molec cm−2 year−1): (a) from 2005–2012; (b) from 2013–2018; and (c) from 2005–2018. The red dots denote the seven cities we discussed in Section 3.2. From north to south, these cities are Beijing, Tianjin, Shijiazhuang, Jinan, Zhengzhou, Shanghai and Guangzhou.).
Atmosphere 10 00444 g002
Figure 3. The significance levels of linear trends over China: (a) from 2005–2012; (b) from 2013–2018; and (c) from 2005–2018.
Atmosphere 10 00444 g003aAtmosphere 10 00444 g003b
Figure 4. Annual variations in tropospheric NO2 VCD in the five hotspots we selected during 2005–2018. (unit: 1015 molec cm−2).
Atmosphere 10 00444 g004
Figure 5. (a) Tropospheric NO2 VCD in Beijing and Jing–Jin–Tang averaged from 2005 to 2018 (unit: 1015 molec cm−2) and (b) tropospheric NO2 VCD linear trends in Beijing and Jing–Jin–Tang from 2005 to 2018 (unit: 1015 molec cm−2 year−1). The black boxes denote the locations of Beijing and the Jing–Jin–Tang region. Triangles indicate the three cities (Beijing, Tangshan and Tianjin).
Atmosphere 10 00444 g005
Figure 6. (a) Monthly variations in the tropospheric NO2 VCD in Beijing and Jing–Jin–Tang from January 2005 to December 2018 (unit: 1015 molec cm−2); (b) Yearly averaged variations in tropospheric NO2 VCD in Beijing and Jing–Jin–Tang from 2005 to 2018 (unit: 1015 molec cm−2).
Atmosphere 10 00444 g006
Figure 7. Seasonal NO2 column over China during 2005–2018 (unit: 1015 molec cm−2): (a) spring; (b) summer; (c) autumn; and (d) winter.
Atmosphere 10 00444 g007
Figure 8. (a) Monthly NO2 column averages in five hotspots during 2005–2018 (unit: 1015 molec cm−2), with error bars representing the standard error; and (b) variations in the seasonally averaged columns in five hotspots during 2005–2018 (unit: 1015 molec cm−2).
Atmosphere 10 00444 g008
Figure 9. (a) Monthly averages in NO2 columns in Beijing and Jing–Jin–Tang during 2005–2018 (unit: 1015 molec cm−2); and (b) seasonal variations in NO2 columns in Beijing and Jing–Jin–Tang during 2005–2018 (unit: 1015 molec cm−2), with error bars representing the standard error.
Atmosphere 10 00444 g009
Figure 10. Annual cycle of precipitable water (unit: kg m−2), wind speed (unit: m s−1) and temperature (unit: °C) at 975 hPa in five areas.
Atmosphere 10 00444 g010
Table 1. Major environmental regulations over China in recent years.
Year of ImplementationRegulationMain GoalsReference
2006–2010The 11th five-year planThe SO2 should be reduced by 10% from 2005 to 2010, but it lacks effective measures to reduce NOx emission.Ma et al. [45]
2011–2015The 12th five-year planThe NOx should be reduced by 10% from 2011 to 2015.Chinese National Government [46]
2012Ambient air quality standards (GB3095-2012)The concentration limitation of atmosphere NOx in China has been issued.Van der A et al. [41]
2013The Air Pollution Prevention and Control Action PlanAimed to improve the national air quality, especially in Beijing–Tianjin–Hebei, Yangtze River Delta and Pearl River Delta.CAAC [48]
2013–2017APPC-APPM2.5 pollution has been paid more attention to.Ma et al. [45]
2016–2020The 13th five-year planIt insists upon the goal of energy conservation and emission reduction.Chinese National Government [47]
Table 2. The change in tropospheric NO2 columns over some leading cities in high concentration regions during 2005–2018. (unit: 1015 molec cm−2).
City200520122018Rate of Change (2005–2012) (%)Rate of Change (2012–2018) (%)
Beijing9.6215.969.9965.9−37.4
Tianjin14.2524.3715.5771.0−36.1
Shijiazhuang14.3221.5014.2050.1−34.0
Zhengzhou14.9424.1613.0161.7−46.2
Jinan12.7024.7812.8395.1−48.2
Shanghai11.8212.7710.638.0−16.8
Guangzhou14.4810.859.23−25.1−14.9

