Changes in the Relationship between Particulate Matter and Surface Temperature in Seoul from 2002–2017


Abstract
1. Introduction
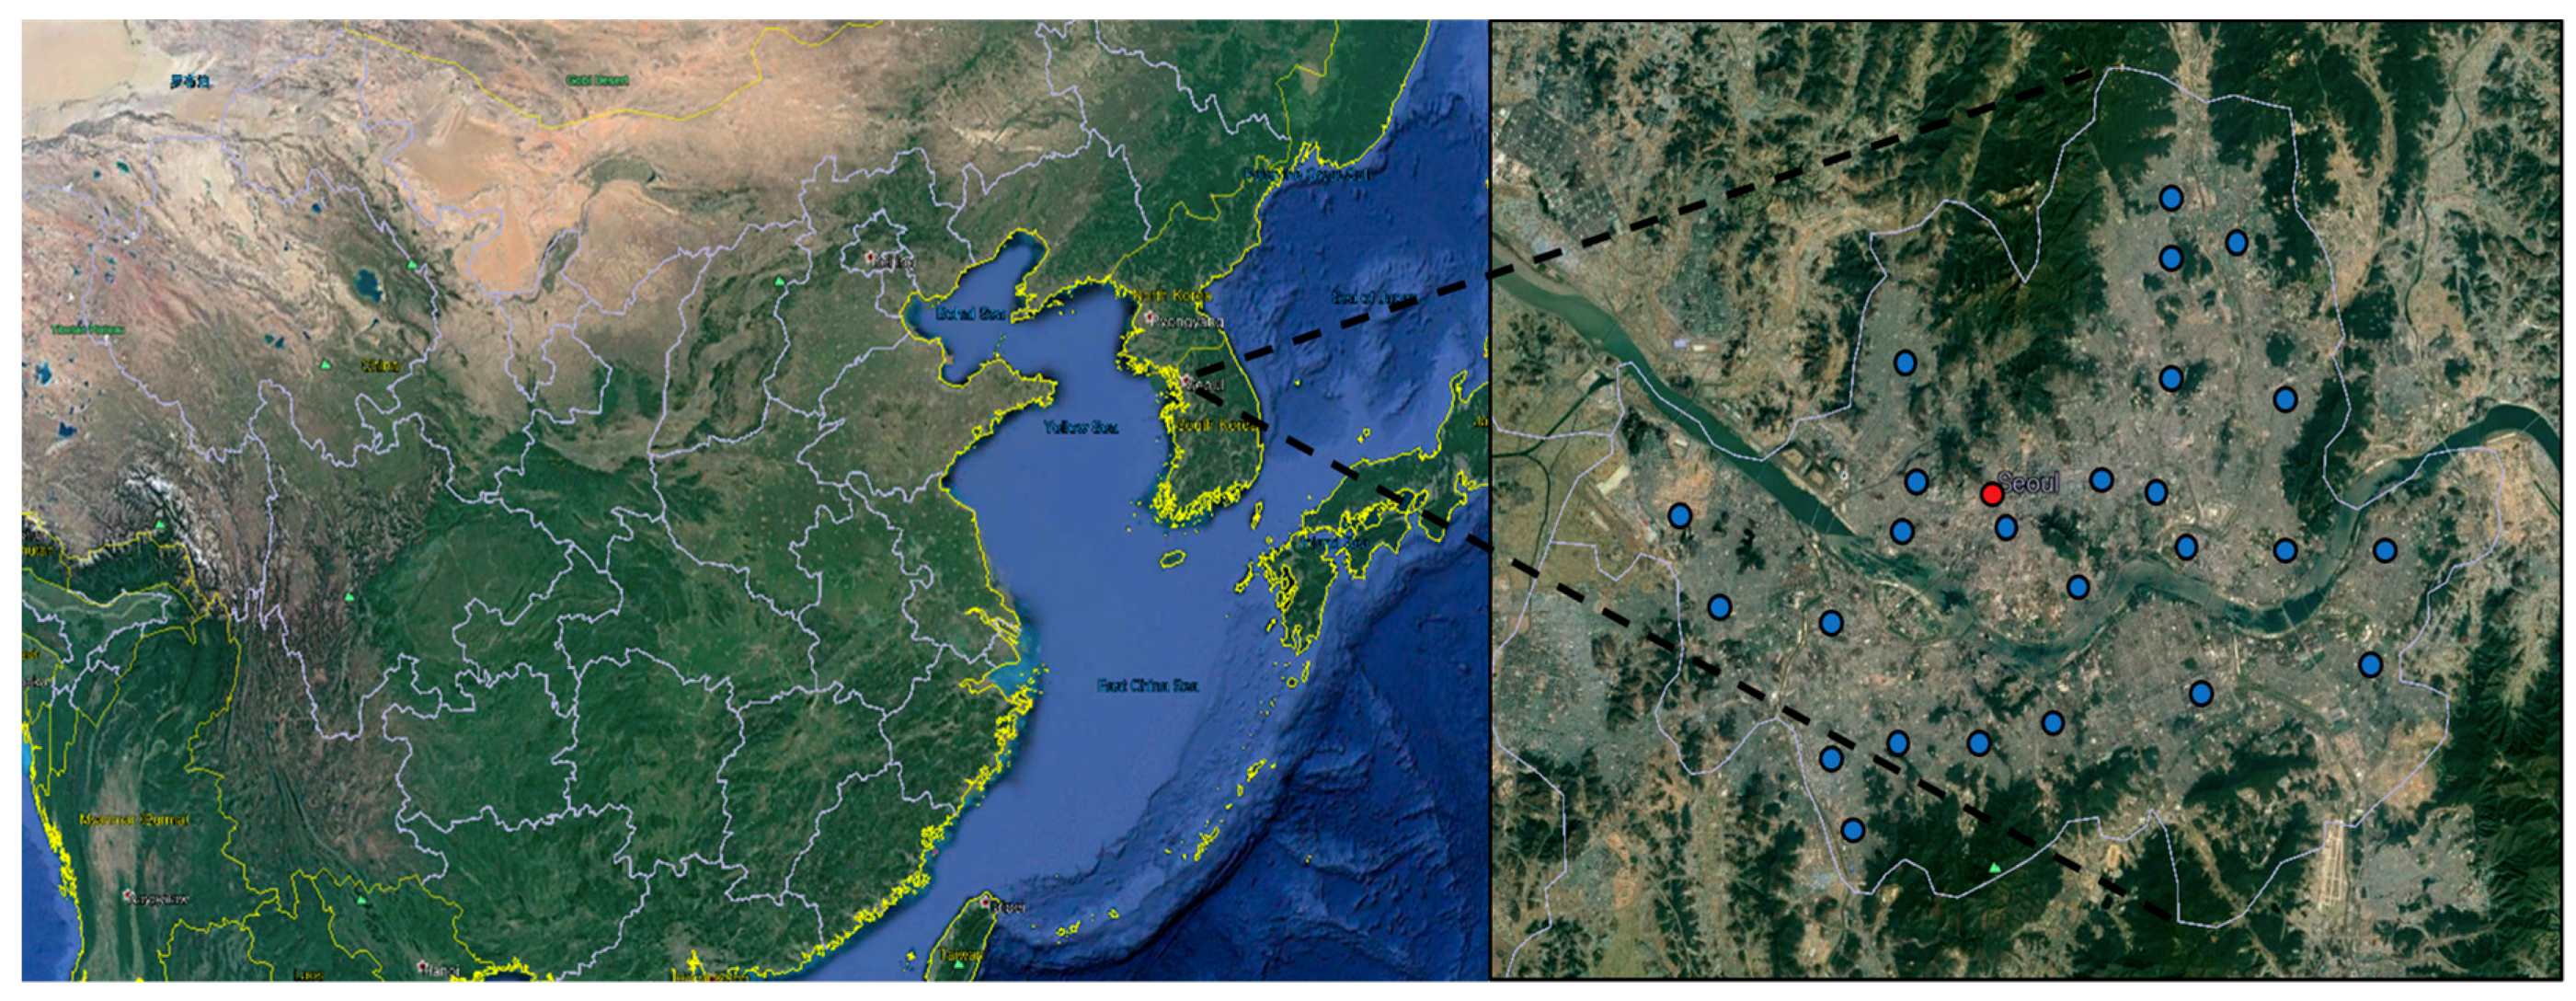
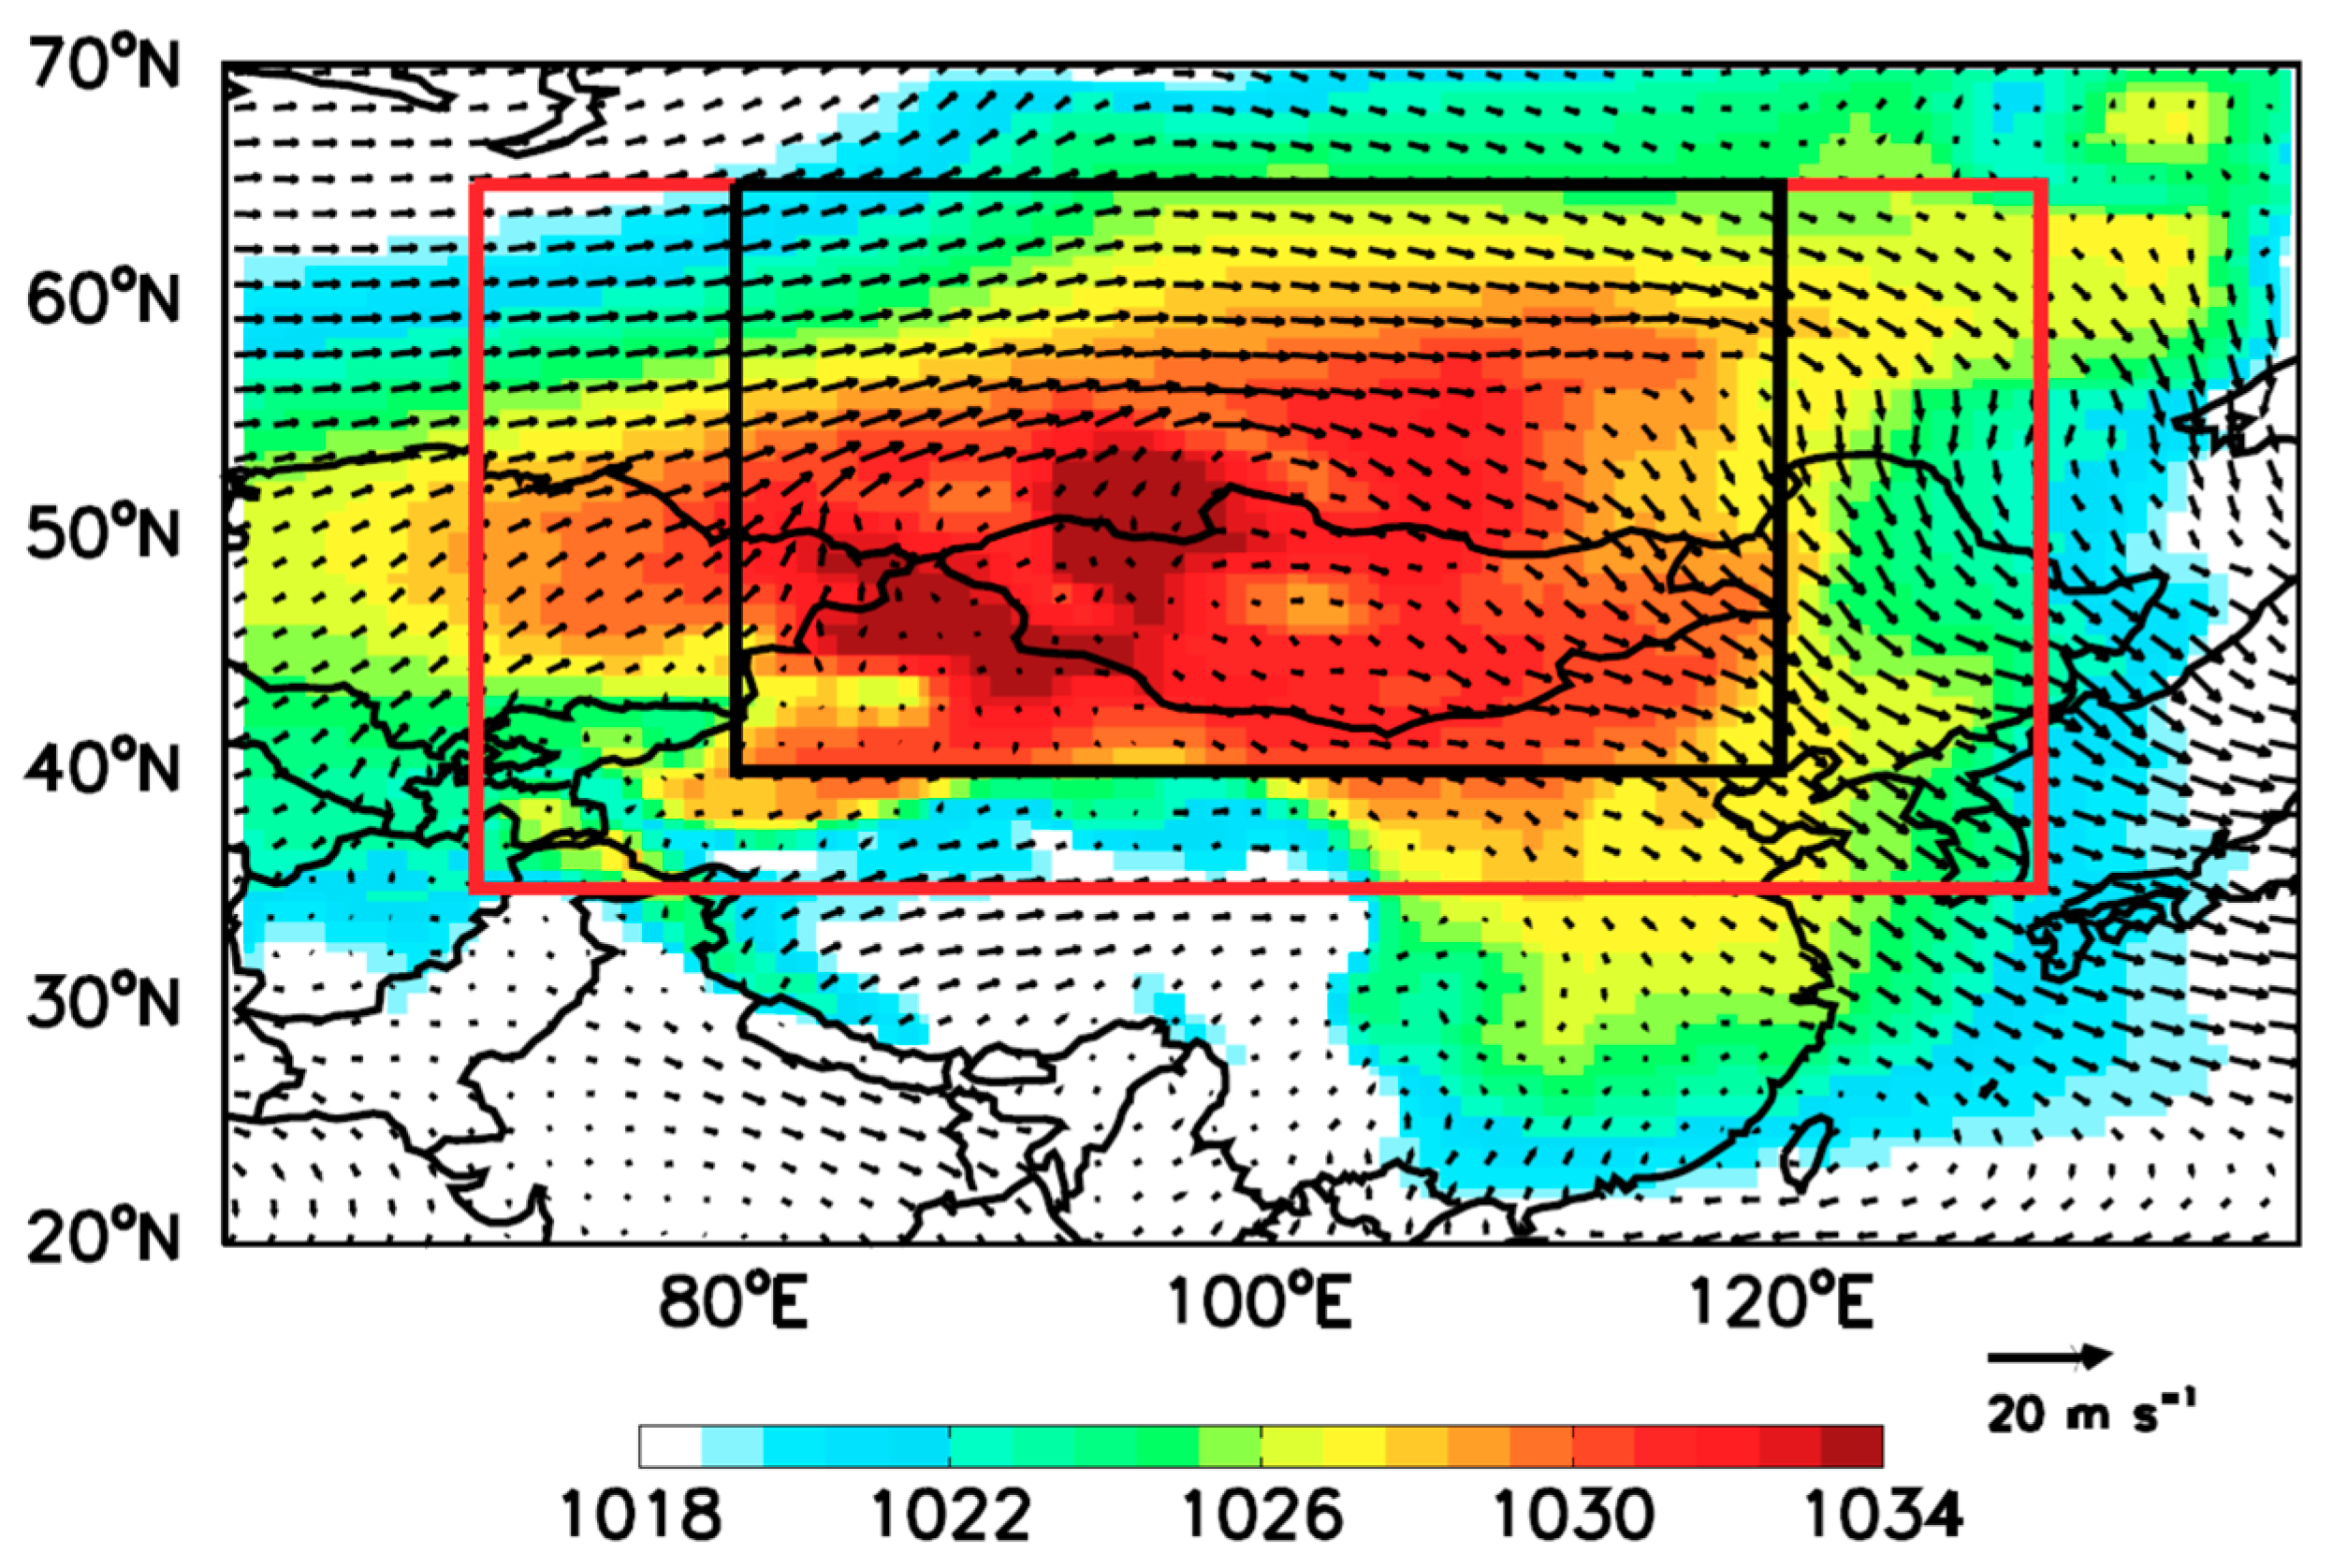
2. Domain and Data
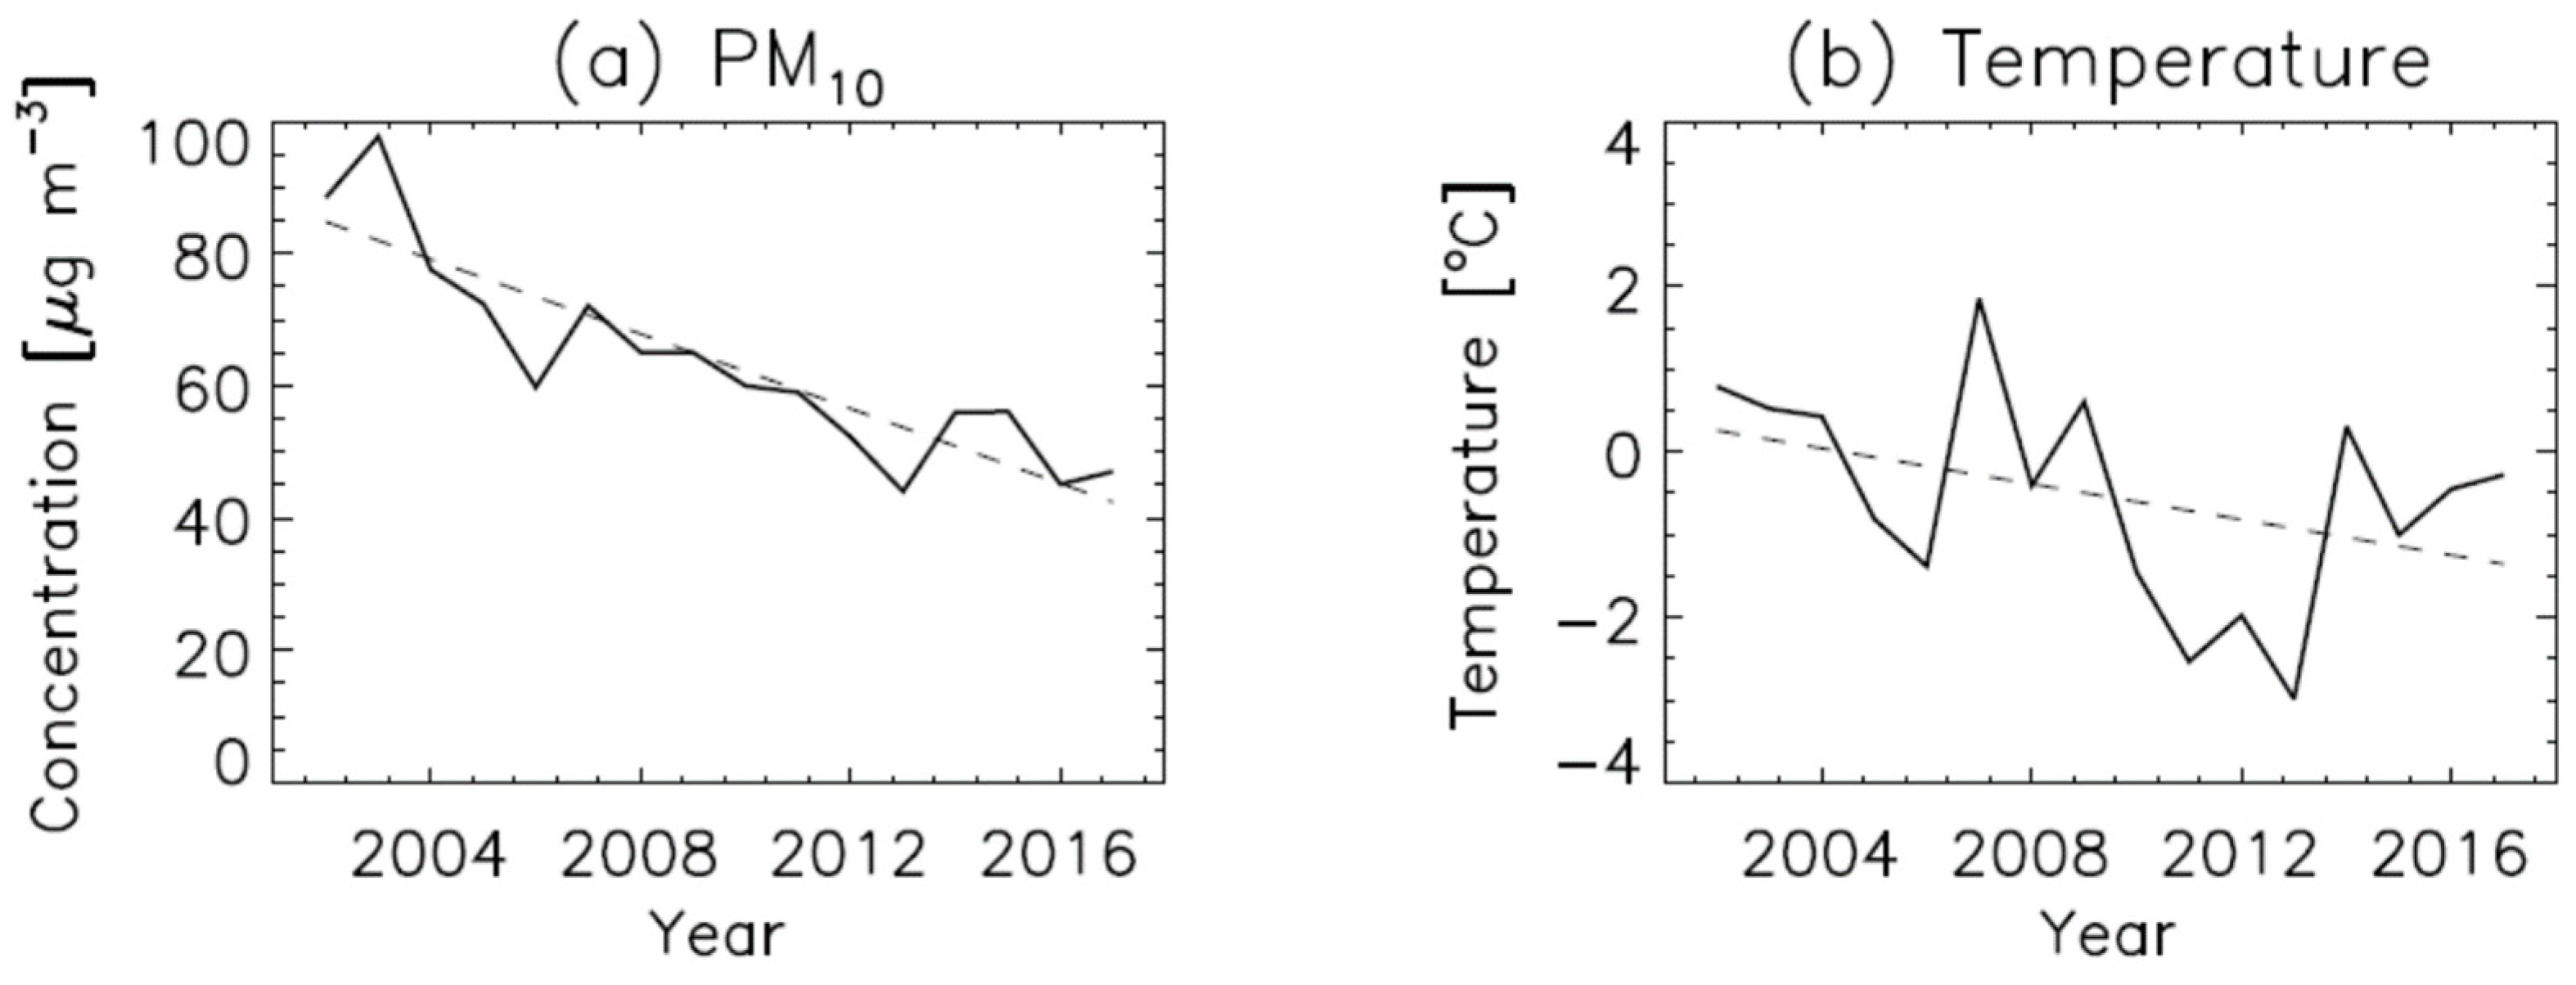
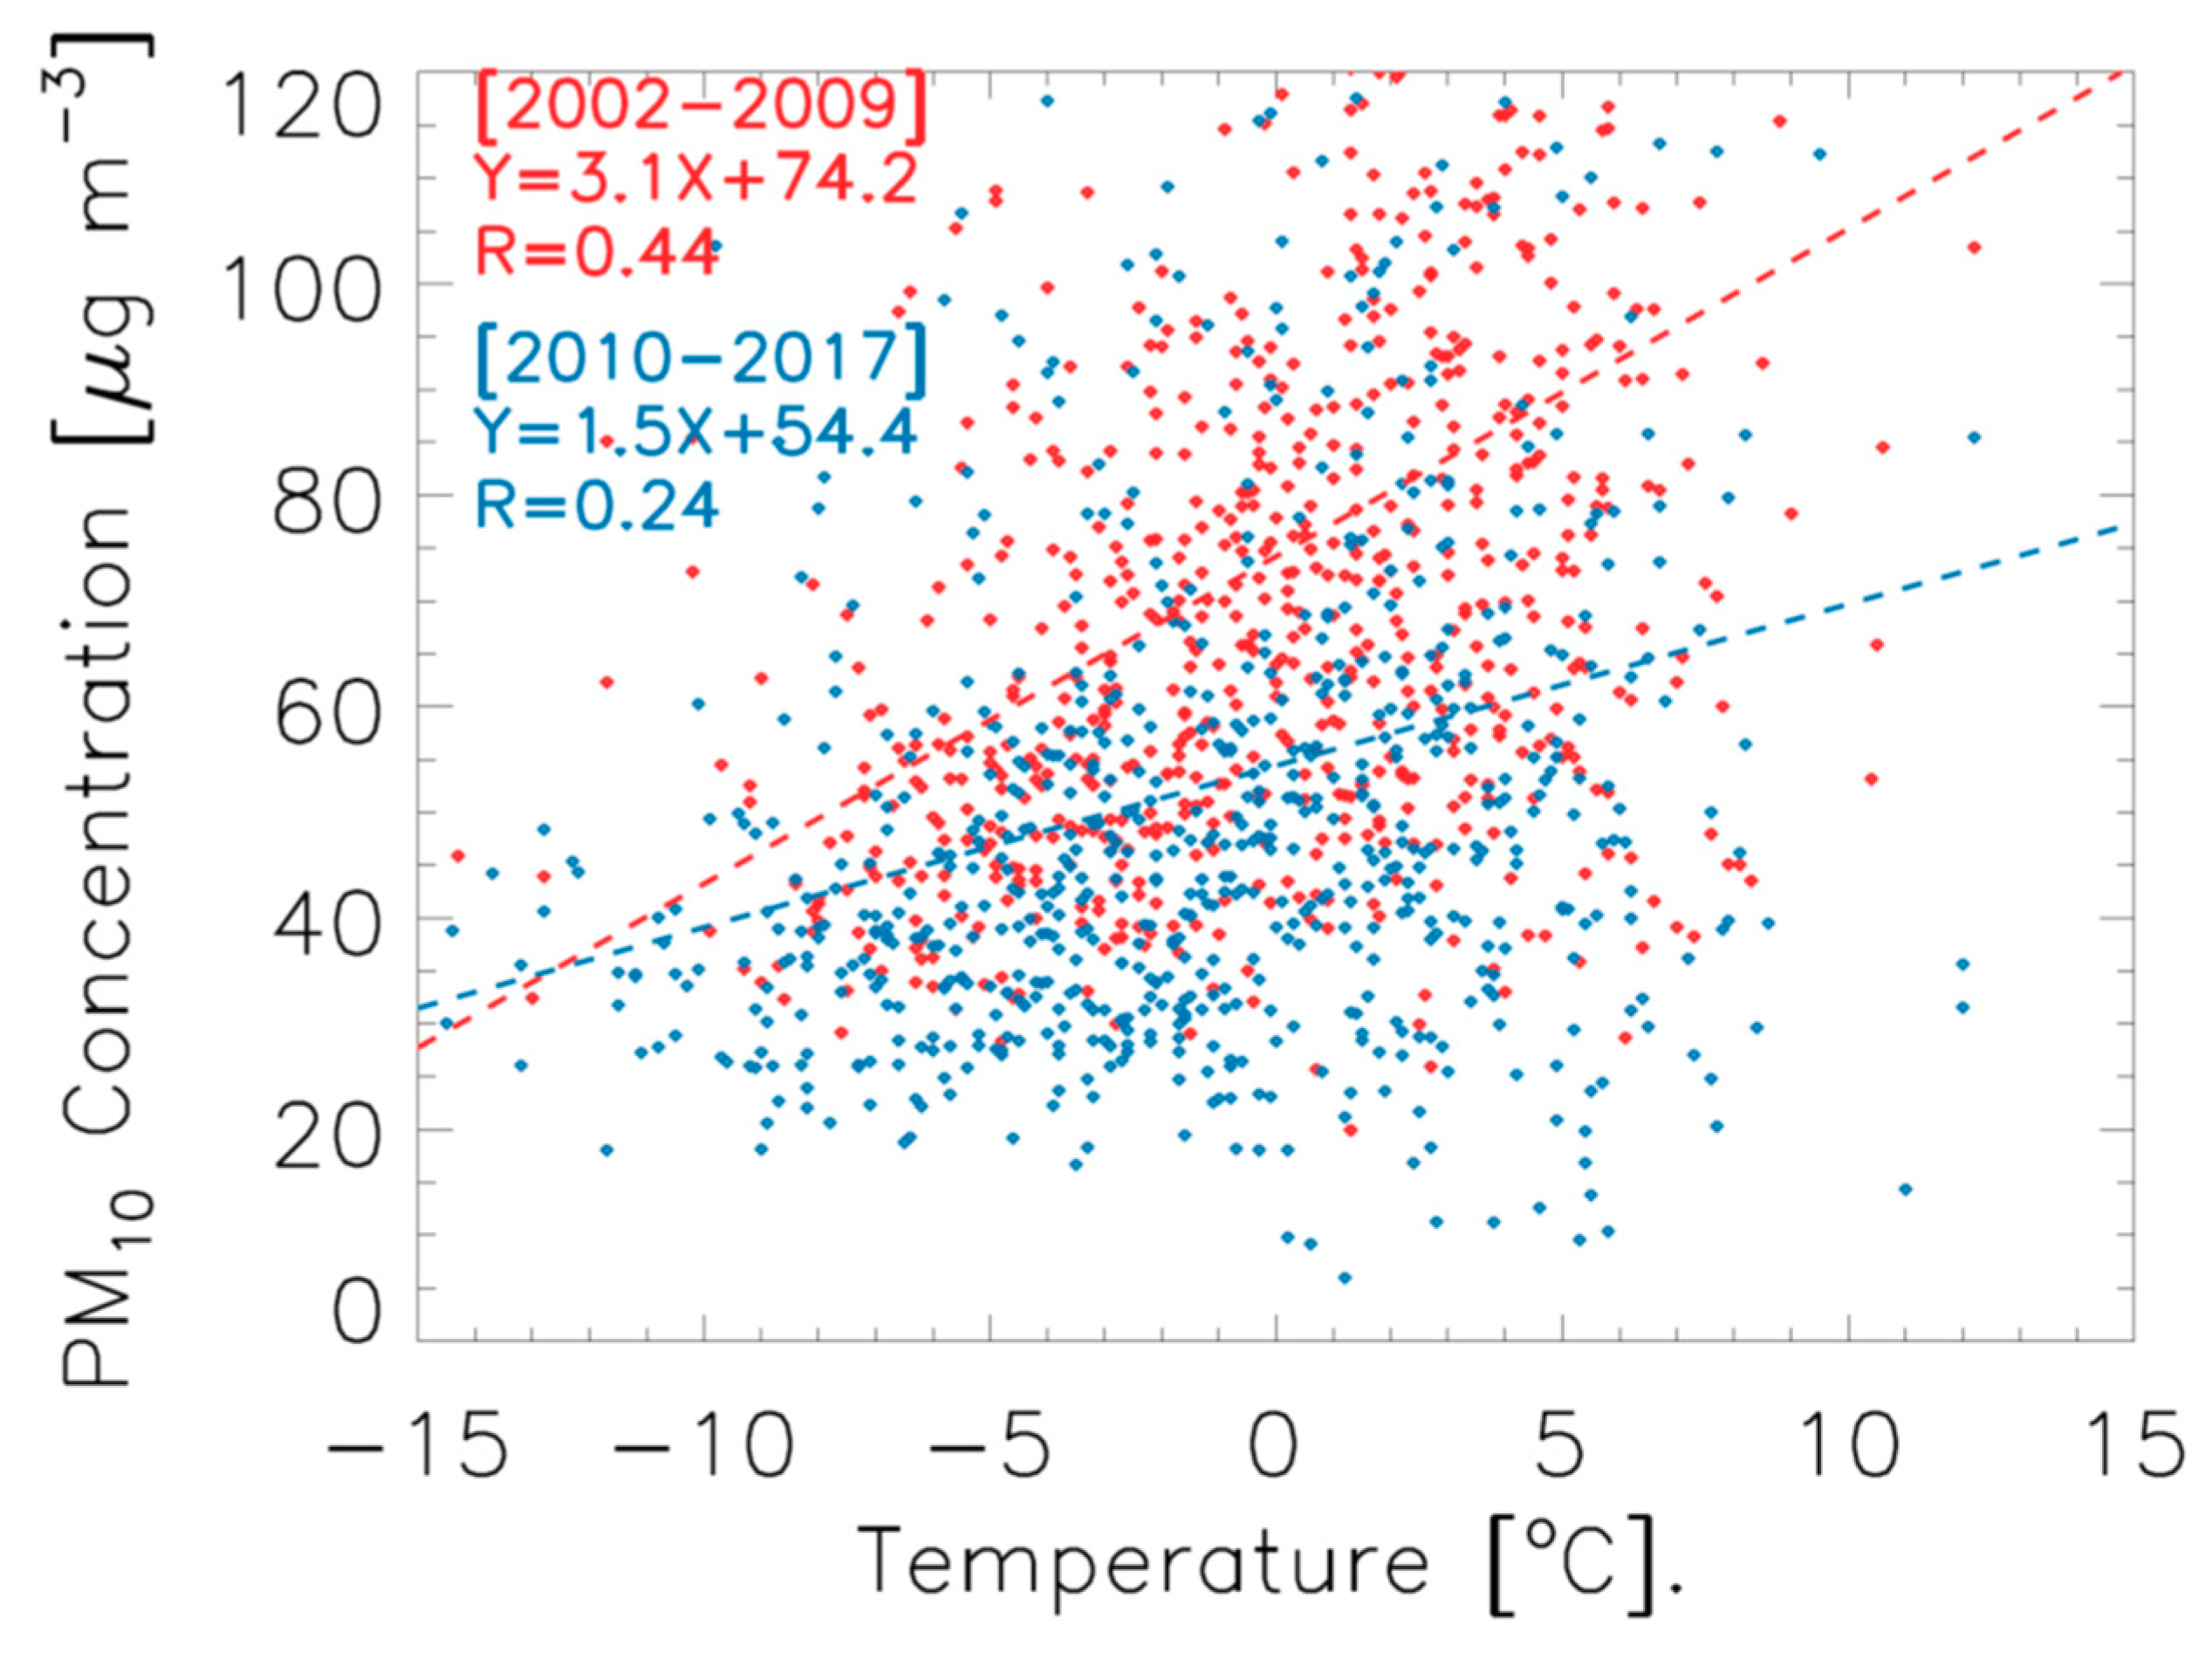
3. Results and Discussion
4. Conclusion
Funding
Acknowledgments
Conflicts of Interest
References
- Kim, H.C.; Kim, S.; Kim, B.-U.; Jin, C.-S.; Hong, S.; Park, R.; Son, S.-W.; Bae, C.; Bae, M.; Song, C.-K. Recent increase of surface particulate matter concentrations in the Seoul Metropolitan Area, Korea. Sci. Rep. 2017, 7, 4710. [Google Scholar] [CrossRef]
- Chun, Y.; Lim, J.-Y. The recent characteristics of Asian dust and haze events in Seoul, Korea. Meteorol. Atmos. Phys. 2004, 87, 143–152. [Google Scholar]
- Kim, Y.P.; Lee, G. Trend of air quality in Seoul: Policy and science. Aerosol Air Q. Res. 2018, 18, 2141–2156. [Google Scholar] [CrossRef]
- Ohara, T.; Akimoto, H.; Kurokawa, J.-I.; Horii, N.; Yamaji, K.; Yan, X.; Hayasaka, T. An Asian emission inventory of anthropogenic emission sources for the period 1980–2020. Atmos. Chem. Phys. 2007, 7, 4419–4444. [Google Scholar] [CrossRef]
- Lee, D.-G.; Lee, Y.-M.; Jang, K.-W.; Yoo, C.; Kang, K.-H.; Lee, J.-H.; Jung, S.-W.; Park, J.-M.; Lee, S.-B.; Han, J.-S. Korean national emissions inventory system and 2007 air pollutant emissions. Asian J. Atmos. Environ. 2011, 5, 278–291. [Google Scholar] [CrossRef]
- Ryou, H.G.; Heo, J.; Kim, S.-Y. Source apportionment of PM10 and PM2.5 air pollution, and possible impacts of study characteristics in South Korea. Environ. Pollut. 2018, 240, 963–972. [Google Scholar] [CrossRef]
- Han, S.B.; Song, S.K.; Choi, Y.N. Meteorological and air quality analyses of a long-lasting haze episode observed in South Korea during winter season. In Proceedings of the AGU Fall Meeting Abstracts, Washington, DC, USA, 10–14 December 2018. [Google Scholar]
- Huang, R.-J.; Zhang, Y.; Bozzetti, C.; Ho, K.-F.; Cao, J.-J.; Han, Y.; Daellenbach, K.R.; Slowik, J.G.; Platt, S.M.; Canonaco, F. High secondary aerosol contribution to particulate pollution during haze events in China. Nature 2014, 514, 218. [Google Scholar] [CrossRef] [PubMed]
- Zhang, X.; Sun, J.; Wang, Y.; Li, W.; Zhang, Q.; Wang, W.; Quan, J.; Cao, G.; Wang, J.; Yang, Y. Factors contributing to haze and fog in China. Chin. Sci. Bull. 2013, 58, 1178–1187. [Google Scholar] [CrossRef]
- Liu, T.; Gong, S.; He, J.; Yu, M.; Wang, Q.; Li, H.; Liu, W.; Zhang, J.; Li, L.; Wang, X. Attributions of meteorological and emission factors to the 2015 winter severe haze pollution episodes in China’s Jing-Jin-Ji area. Atmos. Chem. Phys. 2017, 17, 2971–2980. [Google Scholar] [CrossRef]
- Kim, K.-H.; Shon, Z.-H. Long-term changes in PM10 levels in urban air in relation with air quality control efforts. Atmos. Environ. 2011, 45, 3309–3317. [Google Scholar] [CrossRef]
- Han, S.H.; Kim, Y.P. Long-term Trends of the Concentrations of Mass and Chemical Composition in PM 2.5 over Seoul. J. Korean Soc. Atmos. Environ. 2015, 31, 143–156. [Google Scholar] [CrossRef]
- Yang, Y.; Liao, H.; Lou, S. Increase in winter haze over eastern China in recent decades: Roles of variations in meteorological parameters and anthropogenic emissions. J. Geophys. Res. Atmos. 2016, 121, 13–50. [Google Scholar] [CrossRef]
- Lee, J.; Kim, K.-Y. Analysis of source regions and meteorological factors for the variability of spring PM10 concentrations in Seoul, Korea. Atmos. Environ. 2018, 175, 199–209. [Google Scholar] [CrossRef]
- Lee, S.; Ho, C.-H.; Choi, Y.-S. High-PM10 concentration episodes in Seoul, Korea: Background sources and related meteorological conditions. Atmos. Environ. 2011, 45, 7240–7247. [Google Scholar] [CrossRef]
- Zhang, H.; Wang, Y.; Hu, J.; Ying, Q.; Hu, X.-M. Relationships between meteorological parameters and criteria air pollutants in three megacities in China. Environ. Res. 2015, 140, 242–254. [Google Scholar] [CrossRef]
- Jeong, J.I.; Park, R.J. Winter monsoon variability and its impact on aerosol concentrations in East Asia. Environ. Pollut. 2017, 221, 285–292. [Google Scholar] [CrossRef] [PubMed]
- Jeong, J.I.; Park, R.J.; Yeh, S.-W. Dissimilar effects of two El Niño types on PM2.5 concentrations in East Asia. Environ. Pollut. 2018, 242, 1395–1403. [Google Scholar] [CrossRef]
- Yi, K.; Liu, J.; Wang, X.; Ma, J.; Hu, J.; Wan, Y.; Xu, J.; Yang, H.; Liu, H.; Xiang, S. A combined Arctic-tropical climate pattern controlling the inter-annual climate variability of wintertime PM2.5 over the North China Plain. Environ. Pollut. 2019, 245, 607–615. [Google Scholar] [CrossRef]
- Jeong, J.I.; Park, R.J. Effects of the meteorological variability on regional air quality in East Asia. Atmos. Environ. 2013, 69, 46–55. [Google Scholar] [CrossRef]
- Kim, H.C.; Kim, E.; Bae, C.; Cho, J.H.; Kim, B.-U.; Kim, S. Regional contributions to particulate matter concentration in the Seoul metropolitan area, South Korea: Seasonal variation and sensitivity to meteorology and emissions inventory. Atmos. Chem. Phys. 2017, 17, 10315–10332. [Google Scholar] [CrossRef]
- Ahmed, E.; Kim, K.-H.; Shon, Z.-H.; Song, S.-K. Long-term trend of airborne particulate matter in Seoul, Korea from 2004 to 2013. Atmos. Environ. 2015, 101, 125–133. [Google Scholar] [CrossRef]
- Stocker, T.F.; Qin, D.; Plattner, G.K.; Tignor, M.; Allen, S.K.; Boschung, J.; Nauels, A.; Xia, Y.; Bex, V.; Midgley, P.M. (Eds.) Climate Change 2013: The Physical Science Basis; Contribution of Working Group I to the Fifth Assessment Report of the Intergovernmental Panel on Climate Change; Cambridge University Press: Cambridge, UK; New York, NY, USA, 2013. [Google Scholar]
- Air Korea. Available online: https://www.airkorea.or.kr/eng (accessed on 30 March 2019).
- Jung, C.-H.; Cho, Y.-S.; Hwang, S.M.; Jung, Y.G.; Ryu, J.C.; Shin, D.S. Analysis of measurement error for PM-10 mass concentration by inter-comparison study. J. Korean Soc. Atmos. Environ. 2007, 23, 689–698. [Google Scholar] [CrossRef]
- Jung, C.-H.; Park, J.-H.; Hwang, S.M. Analysis of Measurement Error for PM-2.5 Mass Concentration by Inter-Comparison Study. J. Environ. Impact Assess. 2010, 19, 431–441. [Google Scholar]
- Chang, C.T.; Tsai, C.J. A model for the relative humidity effect on the readings of the PM10 beta-gauge monitor. J. Aerosol Sci. 2003, 34, 1685–1697. [Google Scholar] [CrossRef]
- Korea Meteorological Administration (KMA). Available online: http://web.kma.go.kr/eng/ (accessed on 30 March 2019).
- Dee, D.P.; Uppala, S.M.; Simmons, A.J.; Berrisford, P.; Poli, P.; Kobayashi, S.; Andrae, U.; Balmaseda, M.A.; Balsamo, G.; Bauer, D.P. The ERA-Interim reanalysis: Configuration and performance of the data assimilation system. Q. J. Royal Meteorol. Soc. 2011, 137, 553–597. [Google Scholar] [CrossRef]
- Gong, D.-Y.; Ho, C.-H. The Siberian High and climate change over middle to high latitude Asia. Theor. Appl. Climatol. 2002, 72, 1–9. [Google Scholar] [CrossRef]
- Cohen, J.; Saito, K.; Entekhabi, D. The role of the Siberian high in Northern Hemisphere climate variability. Geophys. Res. Lett. 2001, 28, 299–302. [Google Scholar] [CrossRef]
- Panagiotopoulos, F.; Shahgedanova, M.; Hannachi, A.; Stephenson, D.B. Observed trends and teleconnections of the Siberian high: A recently declining center of action. J. Clim. 2005, 18, 1411–1422. [Google Scholar] [CrossRef]
- He, J.; Gong, S.; Liu, H.; An, X.; Yu, Y.; Zhao, S.; Wu, L.; Song, C.; Zhou, C.; Wang, J. Influences of meteorological conditions on interannual variations of particulate matter pollution during winter in the Beijing–Tianjin–Hebei area. J. Meteorol. Res. 2017, 31, 1062–1069. [Google Scholar] [CrossRef]
- Zhao, S.; Feng, T.; Tie, X.; Dai, W.; Zhou, J.; Long, X.; Li, G.; Cao, J. Short-term weather patterns modulate air quality in Eastern China during 2015–2016 winter. J. Geophys. Res. Atmos. 2018, 124, 986–1002. [Google Scholar] [CrossRef]
- Hou, Y.H.; Yang, X.Q.; Li, G.; Wang, Q. Four indexes and their change rates Siberian High. J. Nanjing Inst. Meteorol. 2008, 31, 326–330. [Google Scholar]
- Jia, B.; Wang, Y.; Yao, Y.; Xie, Y. A new indicator on the impact of large-scale circulation on wintertime particulate matter pollution over China. Atmos. Chem. Phys. 2015, 15, 11919–11929. [Google Scholar] [CrossRef]
- Lee, M. An analysis on the concentration characteristics of PM2.5 in Seoul, Korea from 2005 to 2012. Asia-Pac. J. Atmos. Sci. 2014, 50, 585–594. [Google Scholar] [CrossRef]
- Li, C.; Stevens, B.; Marotzke, J. Eurasian winter cooling in the warming hiatus of 1998–2012. Geophys. Res. Lett. 2015, 42, 8131–8139. [Google Scholar] [CrossRef]
- Niu, F.; Li, Z.; Li, C.; Lee, K.-H.; Wang, M. Increase of wintertime fog in China: Potential impacts of weakening of the Eastern Asian monsoon circulation and increasing aerosol loading. J. Geophys. Res. Atmo. 2010, 115, D00K20. [Google Scholar] [CrossRef]
- Li, Q.; Zhang, R.; Wang, Y. Interannual variation of the wintertime fog–haze days across central and eastern China and its relation with East Asian winter monsoon. Int. J. Climatol. 2016, 36, 346–354. [Google Scholar] [CrossRef]


| Meteorology Variables | Surface Temperature | Surface Wind Speed | Surface Pressure | Surface Relative Humidity |
|---|---|---|---|---|
| PM10 | 0.35 ** | −0.13 ** | 0.25 ** | 0.17 ** |
© 2019 by the author. Licensee MDPI, Basel, Switzerland. This article is an open access article distributed under the terms and conditions of the Creative Commons Attribution (CC BY) license (http://creativecommons.org/licenses/by/4.0/).
Share and Cite
Kim, M.J. Changes in the Relationship between Particulate Matter and Surface Temperature in Seoul from 2002–2017. Atmosphere 2019, 10, 238. https://doi.org/10.3390/atmos10050238
Kim MJ. Changes in the Relationship between Particulate Matter and Surface Temperature in Seoul from 2002–2017. Atmosphere. 2019; 10(5):238. https://doi.org/10.3390/atmos10050238
Chicago/Turabian StyleKim, Minjoong J. 2019. "Changes in the Relationship between Particulate Matter and Surface Temperature in Seoul from 2002–2017" Atmosphere 10, no. 5: 238. https://doi.org/10.3390/atmos10050238
APA StyleKim, M. J. (2019). Changes in the Relationship between Particulate Matter and Surface Temperature in Seoul from 2002–2017. Atmosphere, 10(5), 238. https://doi.org/10.3390/atmos10050238