Particulate Emissions of Euro 4 Motorcycles and Sampling Considerations


Abstract
1. Introduction
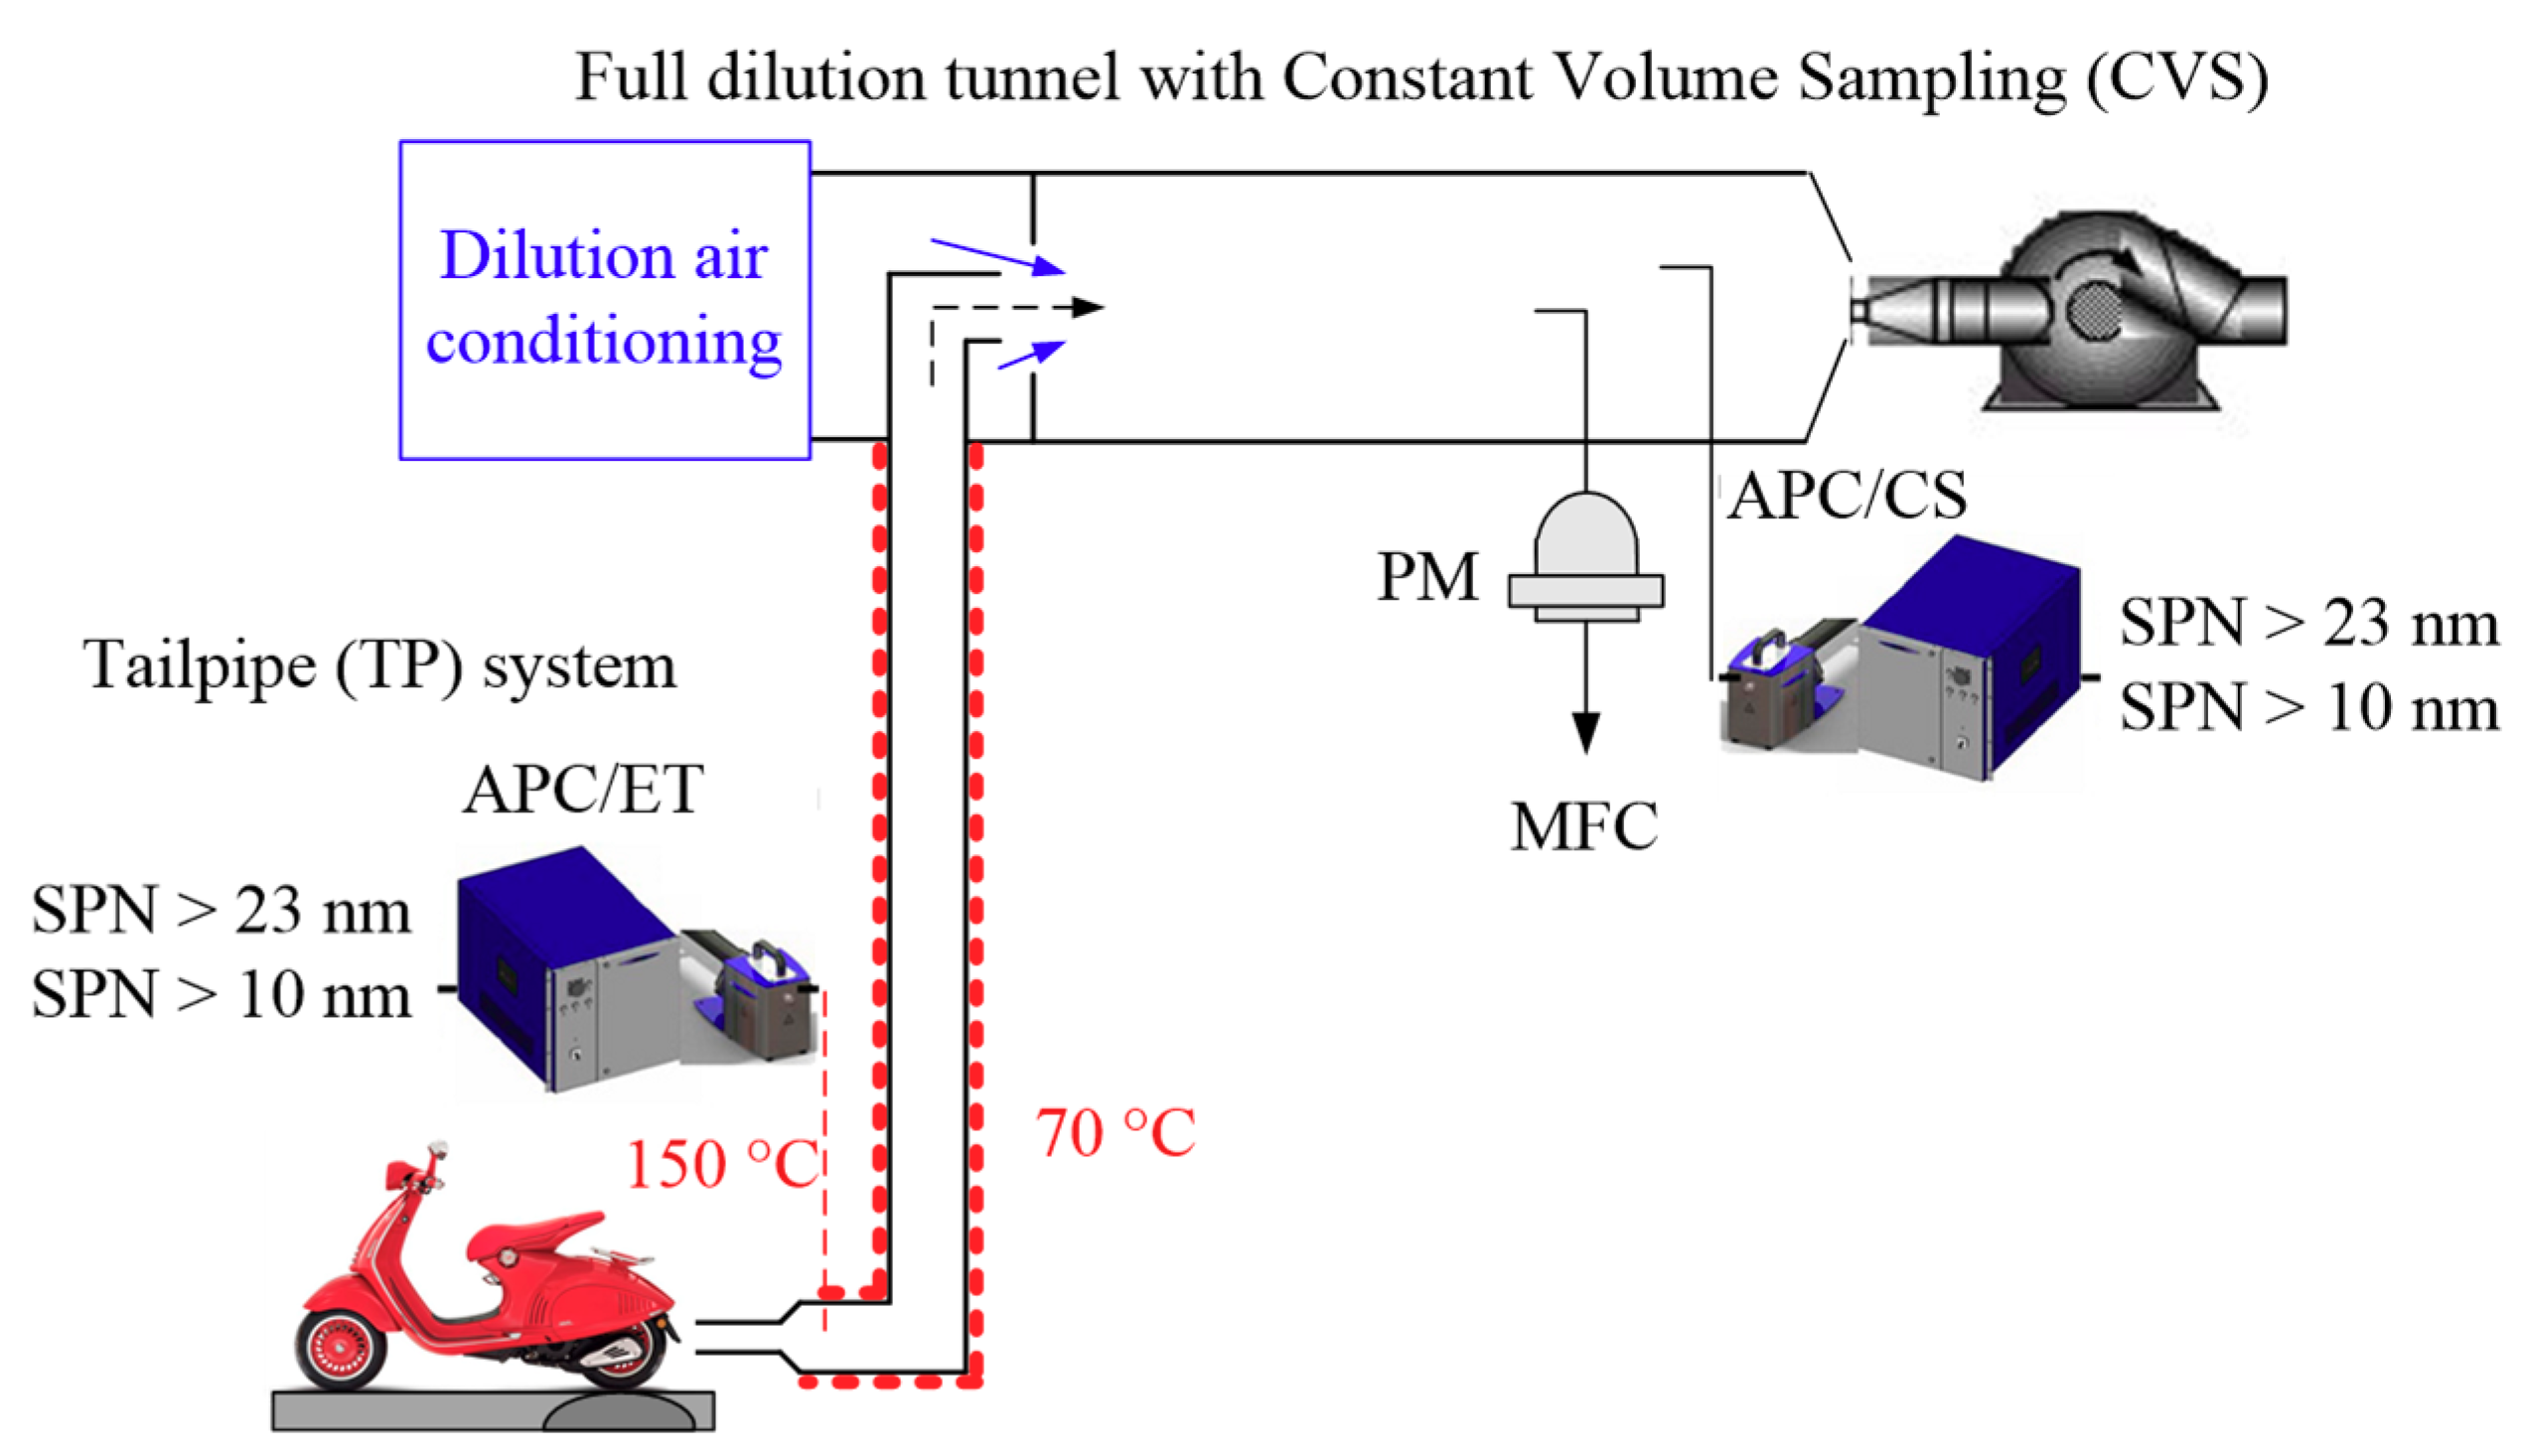
2. Experiments
- 2-wheel mopeds (L1e-B) with engine displacement ≤ 50 cm3, maximum speed ≤ 45 km/h, and power ≤ 4 kW.
- Low performance motorcycles (L3e-A1) with engine displacement ≤ 125 cm3, power/weight ratio ≤ 0.1 kW/kg, and maximum power ≤ 11 kW.
- Medium performance motorcycles (L3e-A2) with power/weight ratio ≤ 0.2 kW/kg, and maximum power ≤ 35 kW.
- High performance motorcycles (L3e-A3) with power/weight ratio > 0.2 kW/kg, and maximum power > 35 kW.
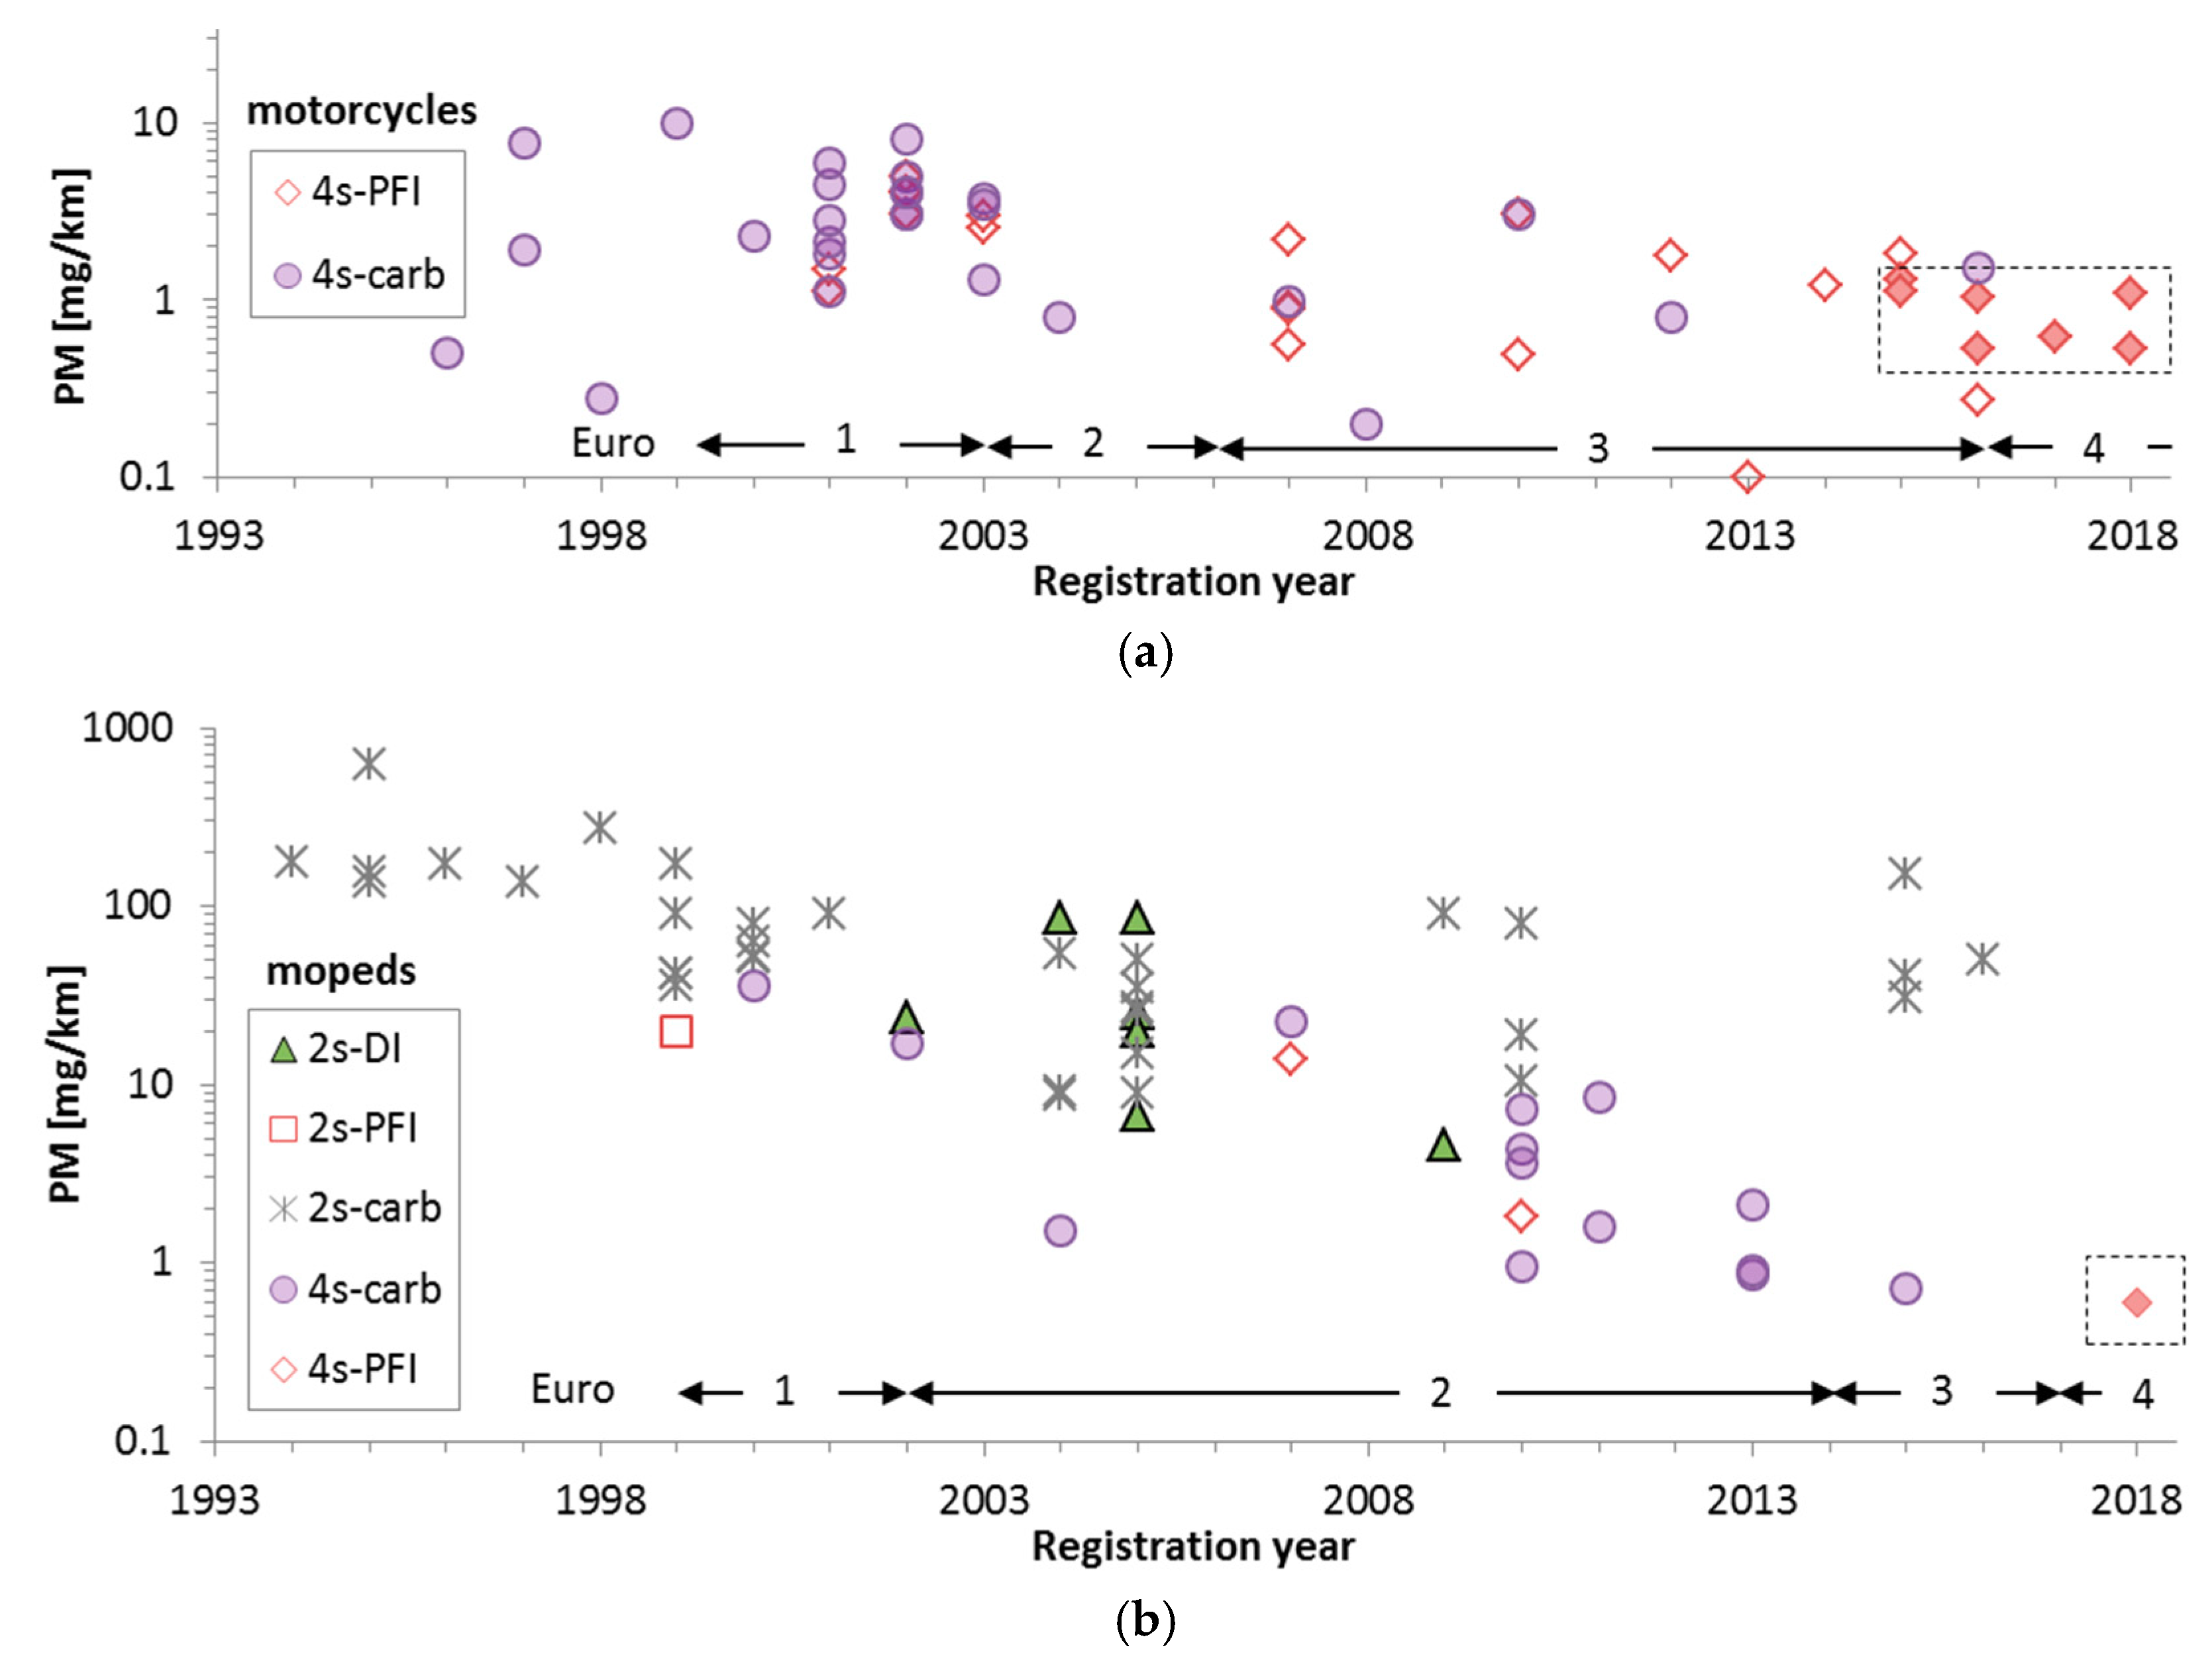
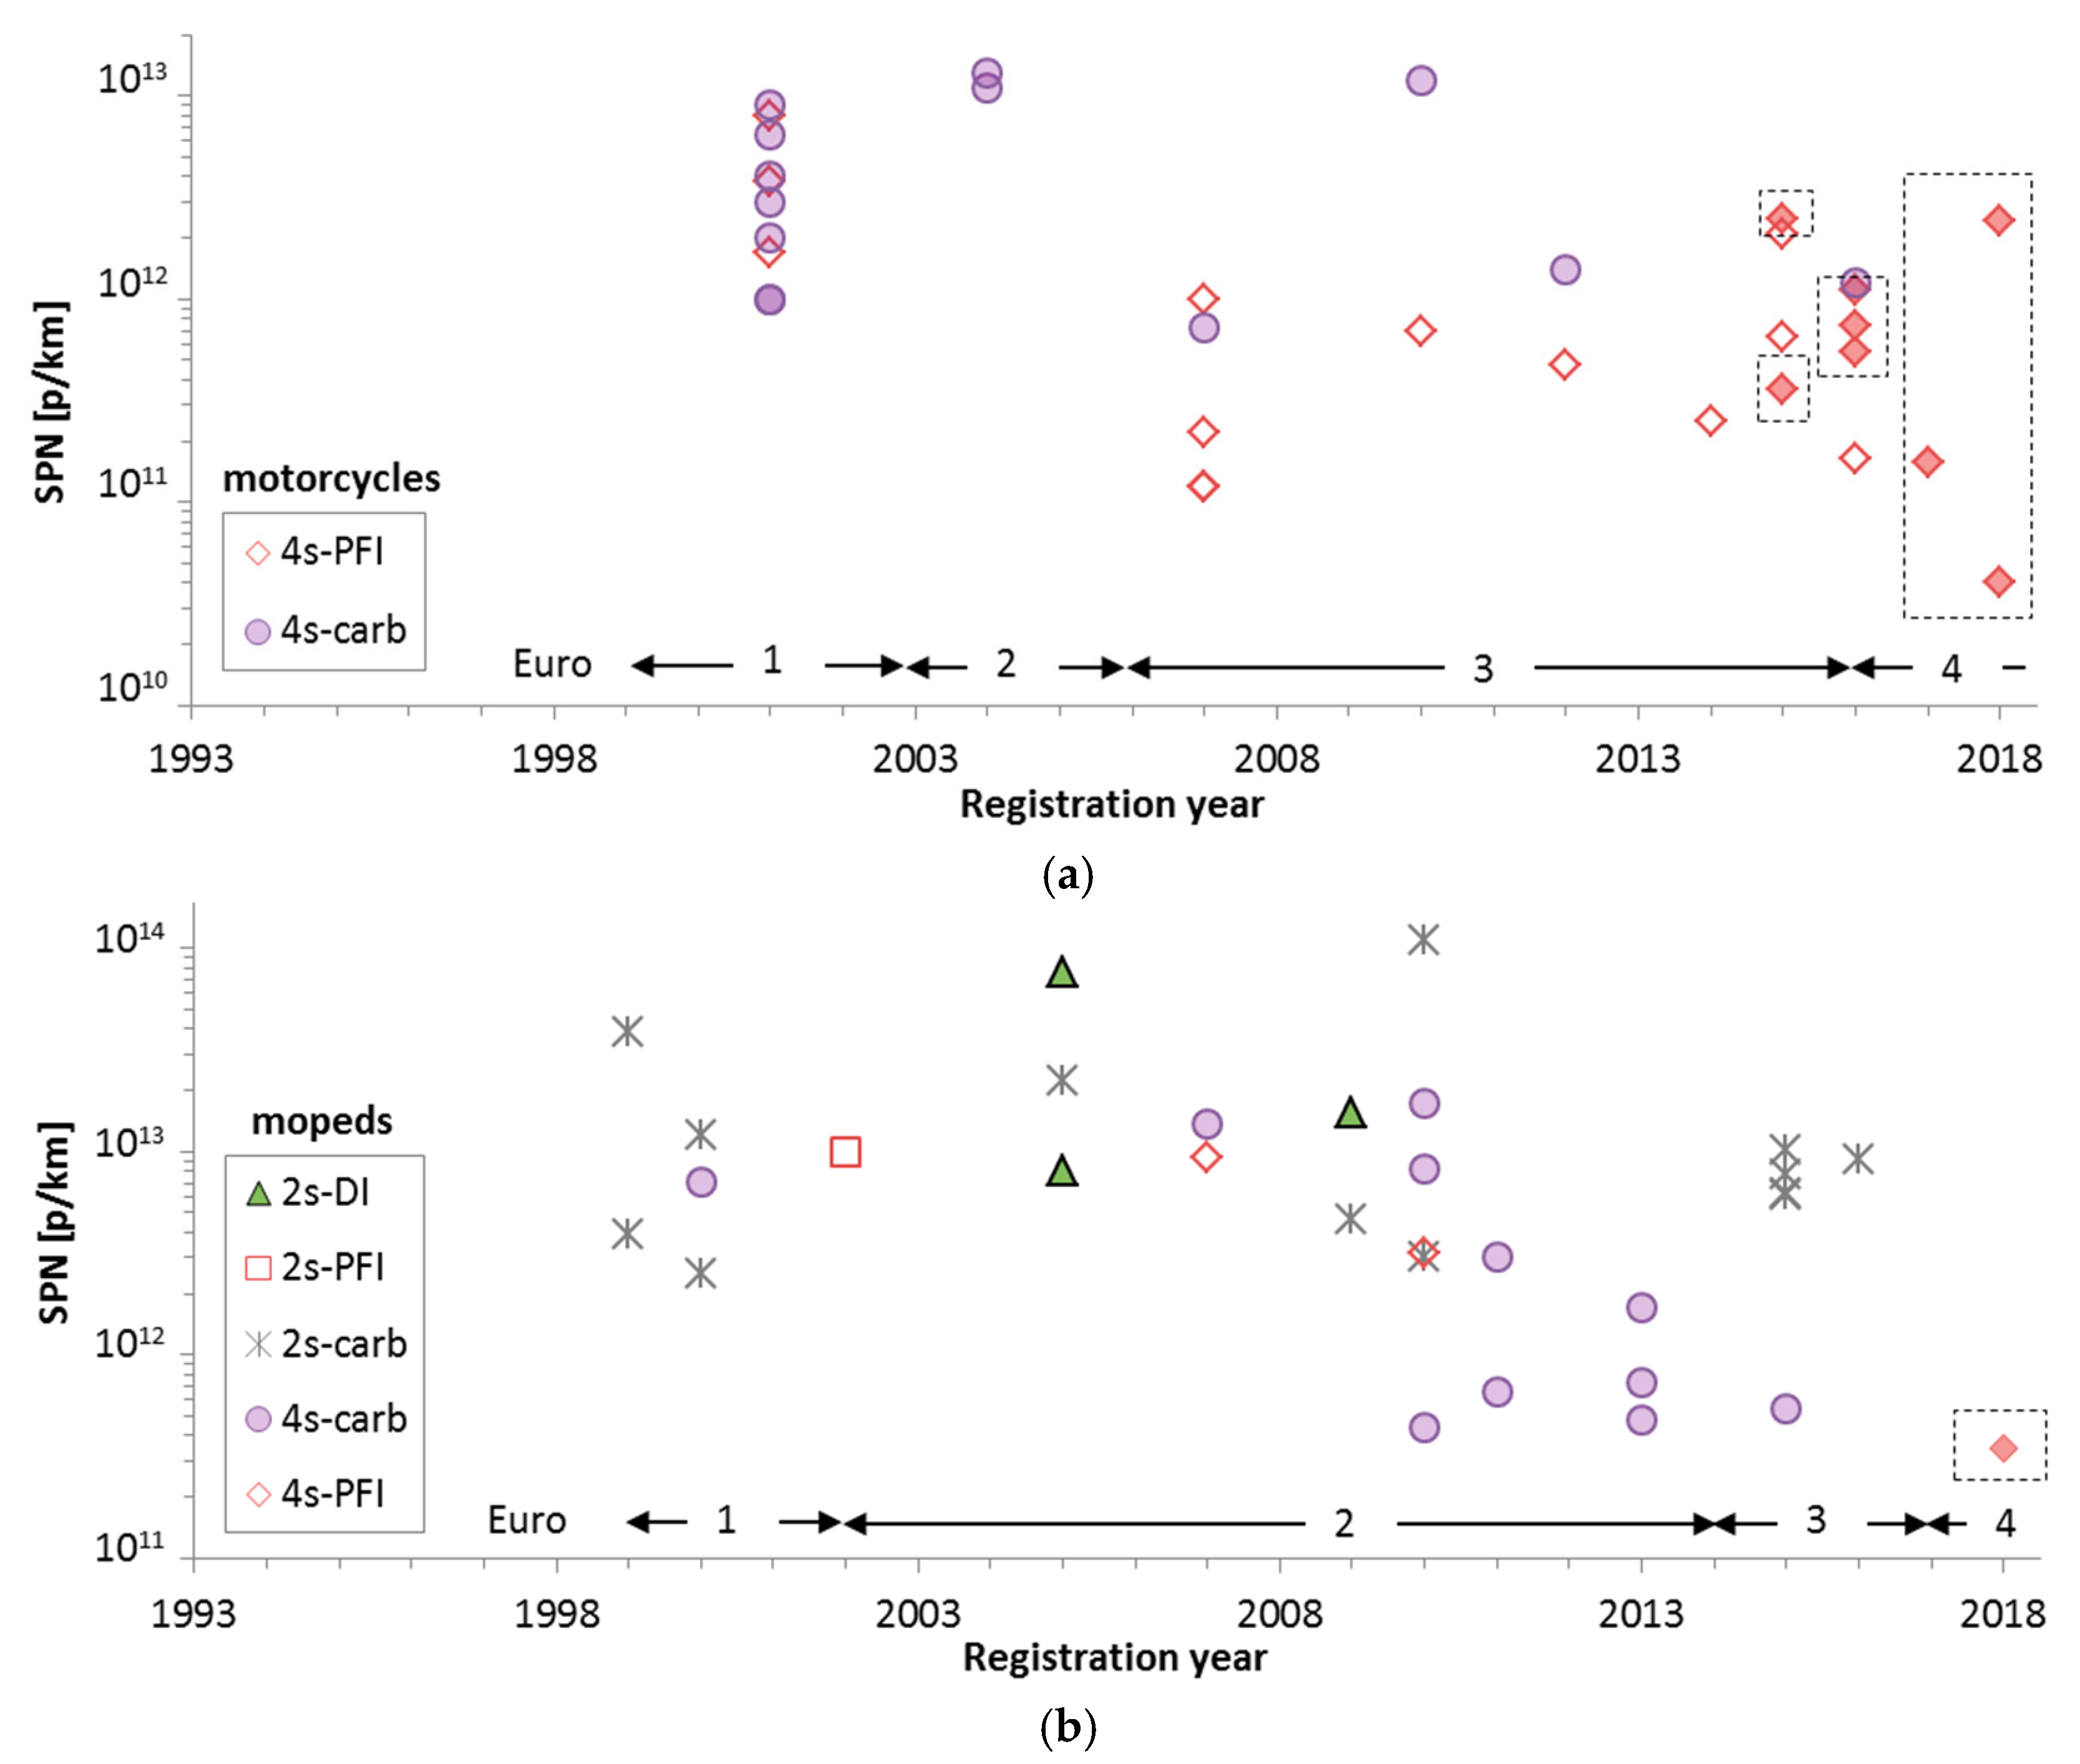
3. Results
4. Discussion
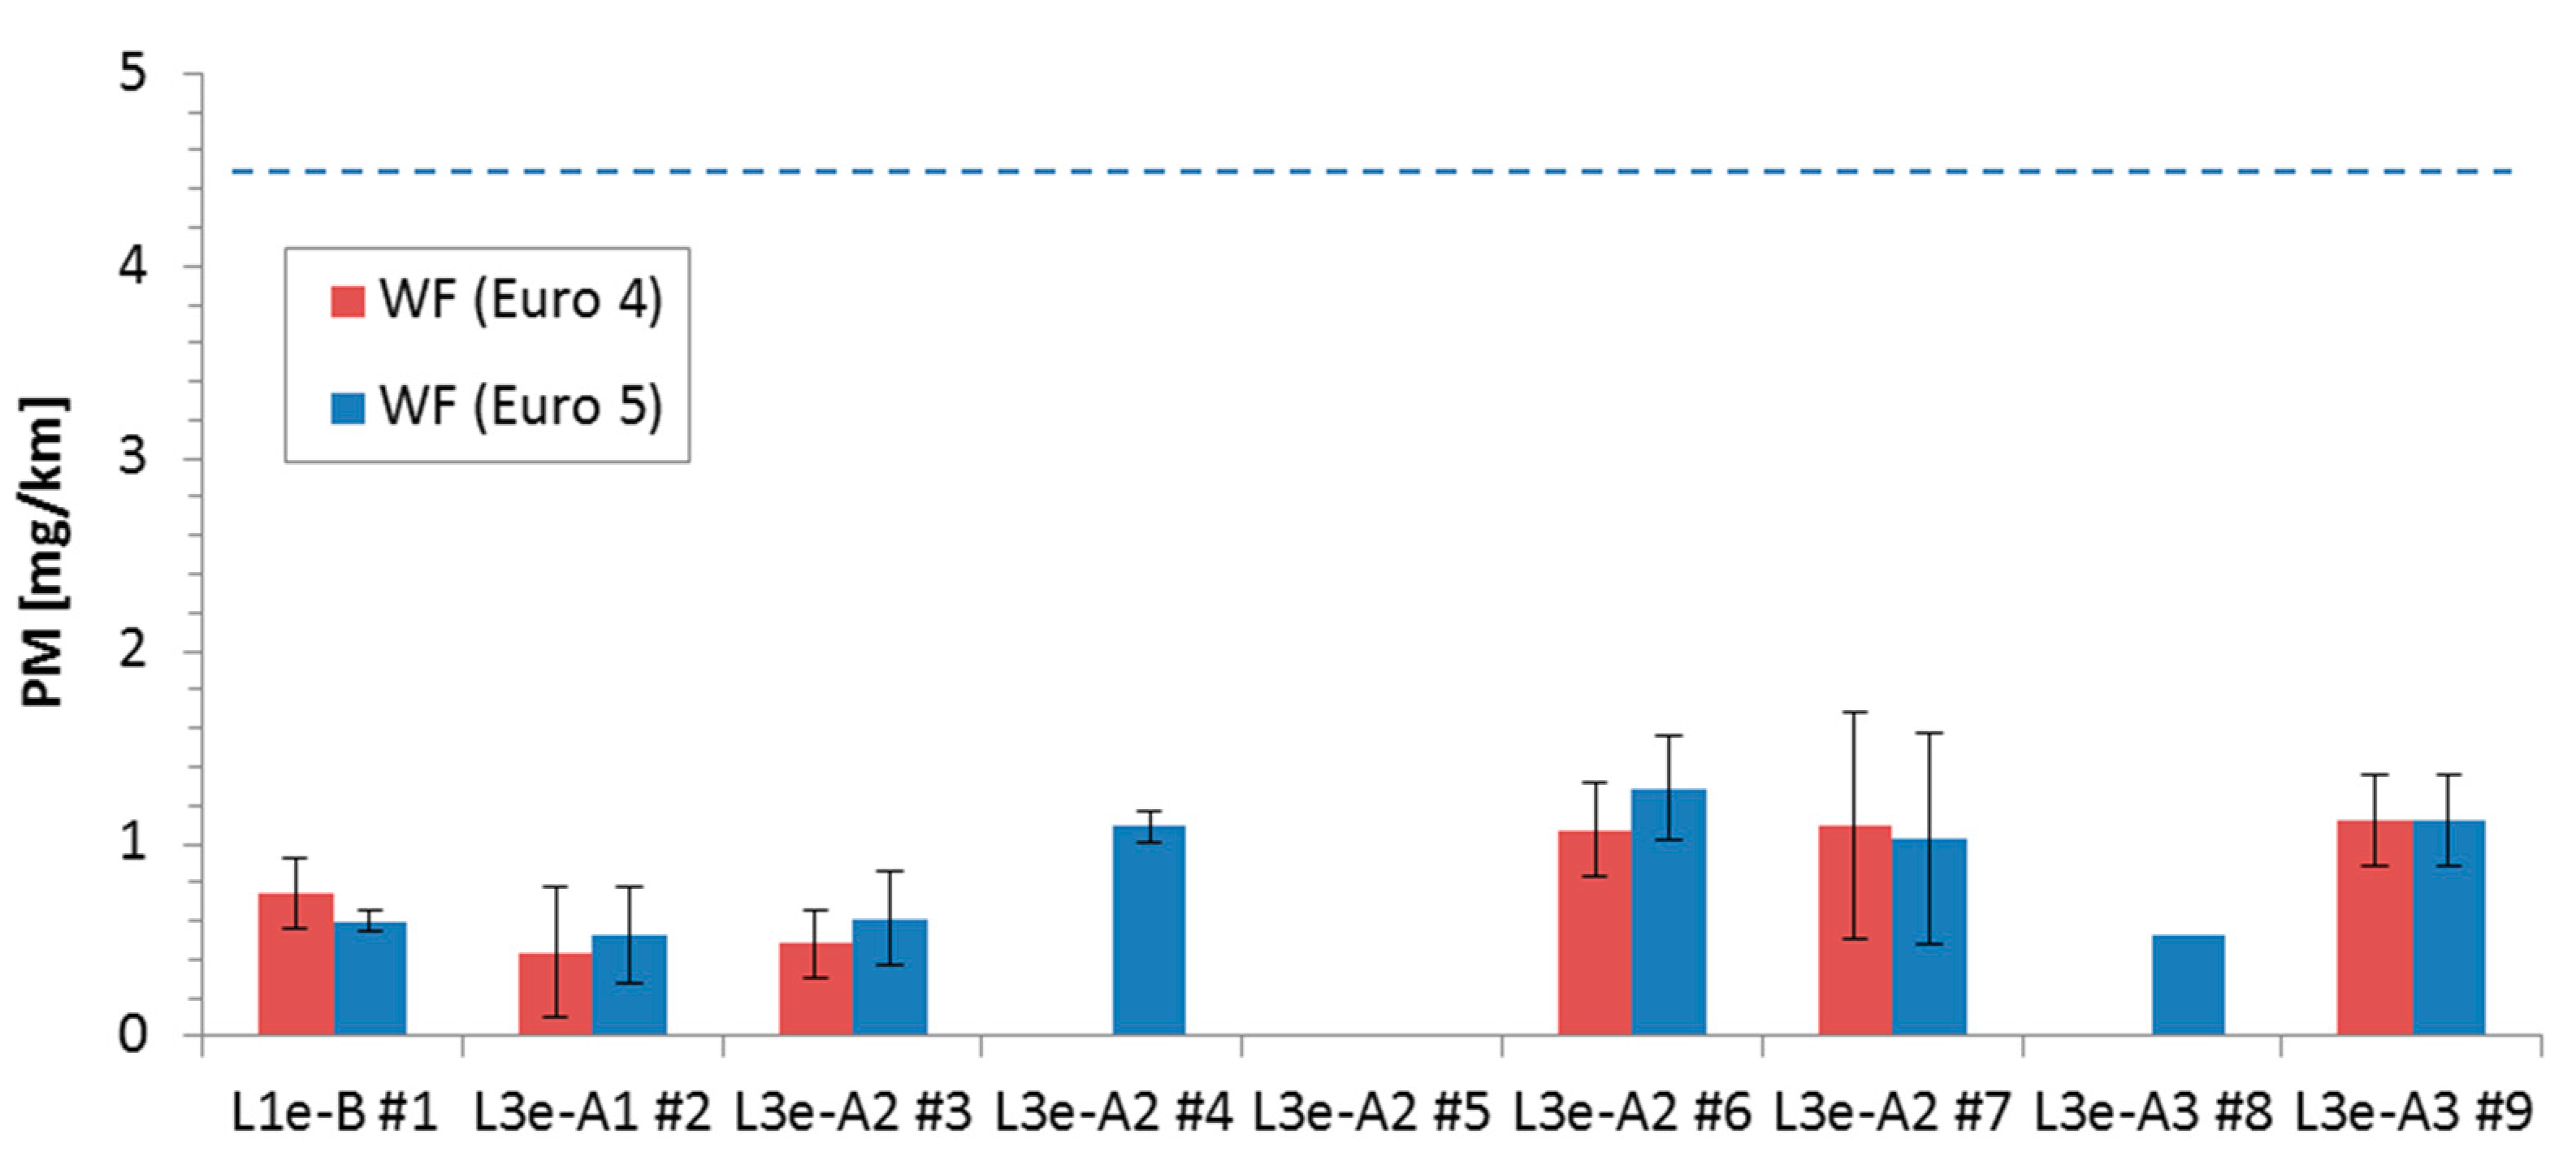
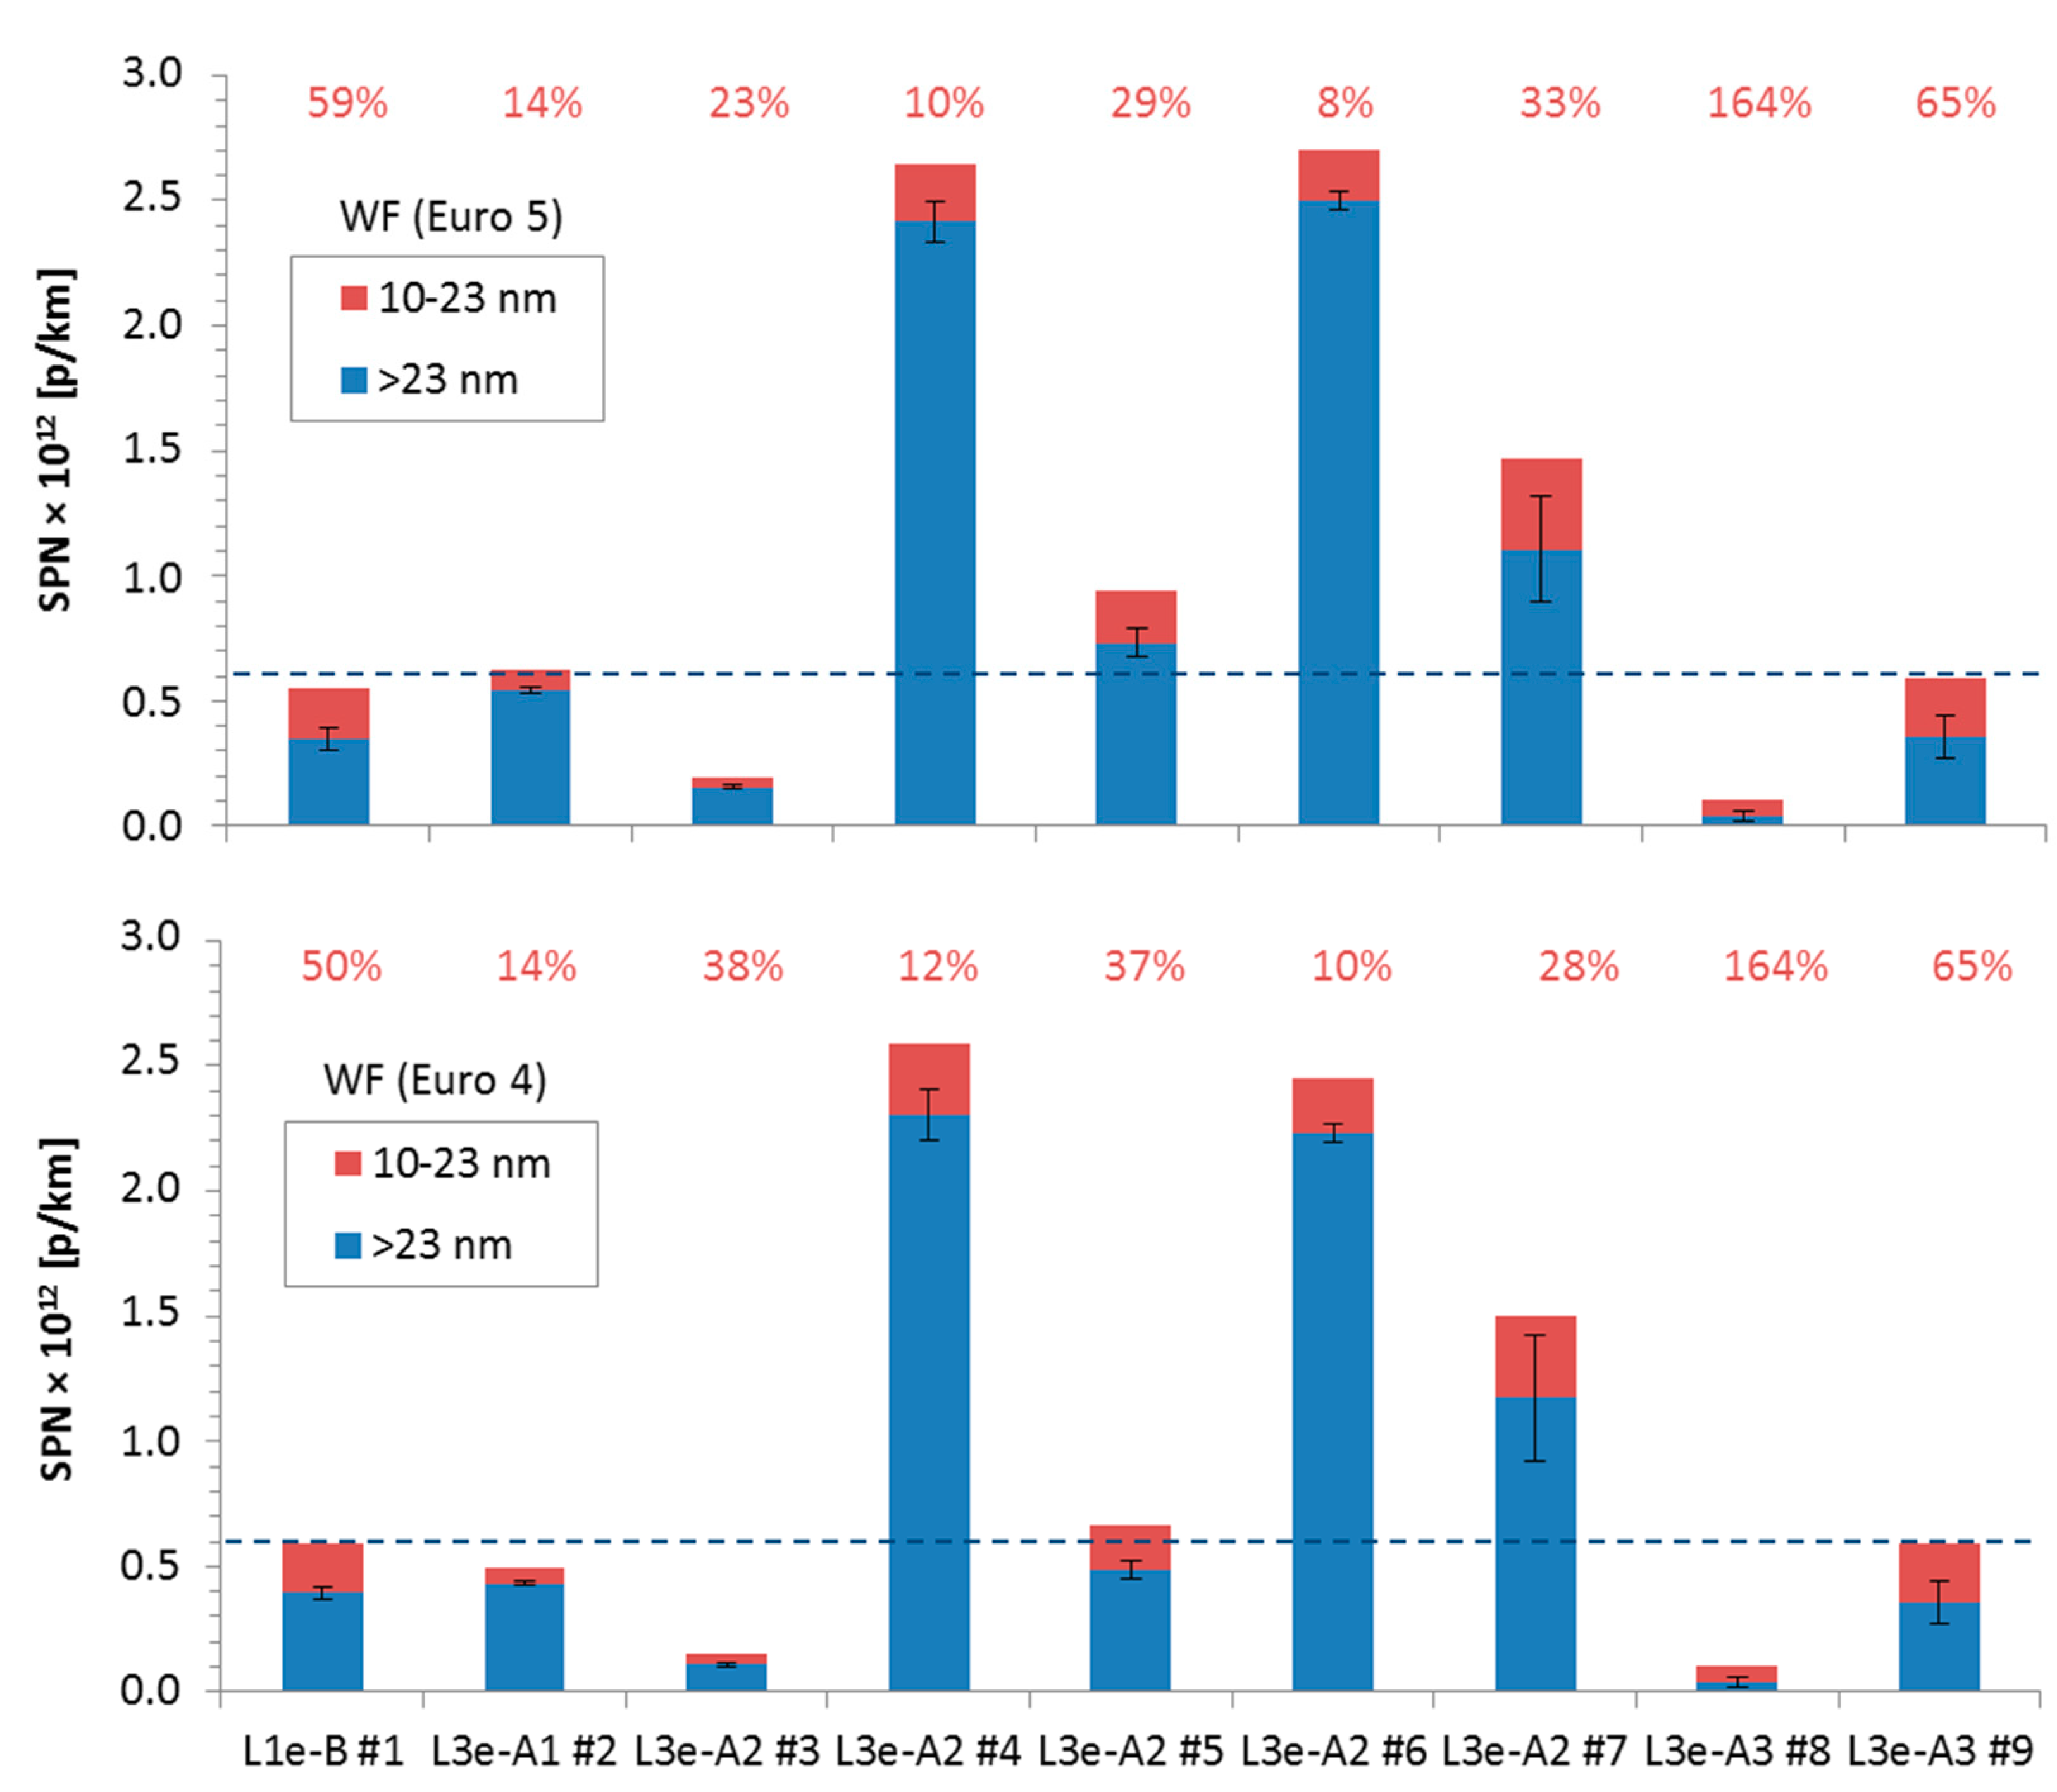
4.1. Emission Levels
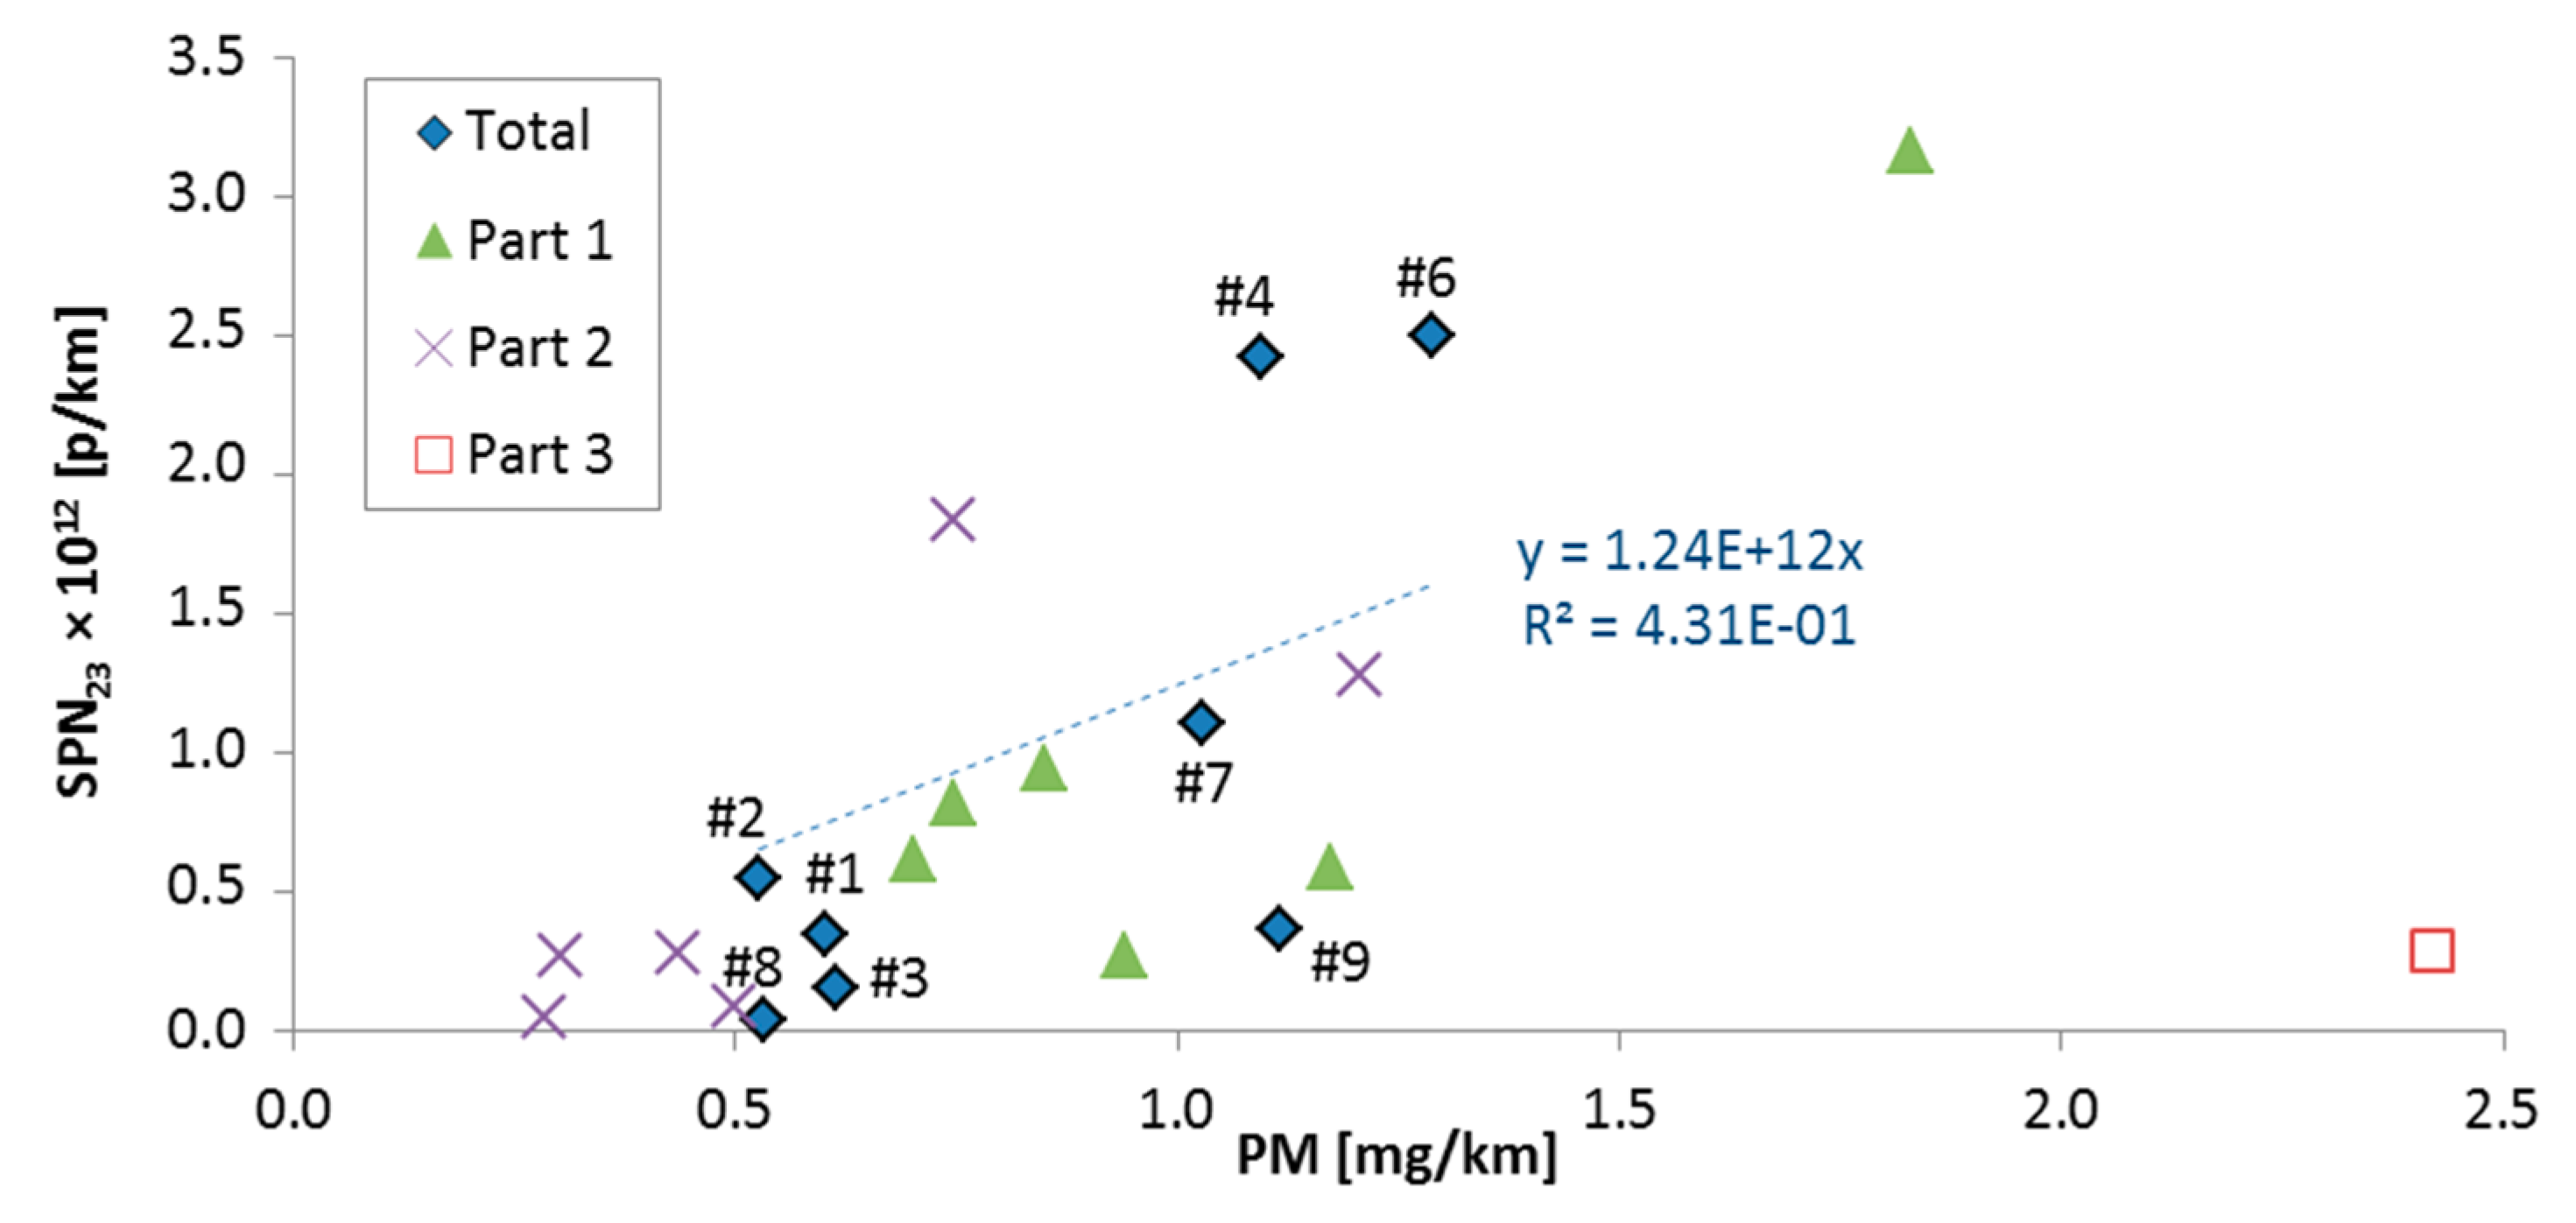
4.2. Correlation PM–SPN
4.3. Sub-23 nm Fractions
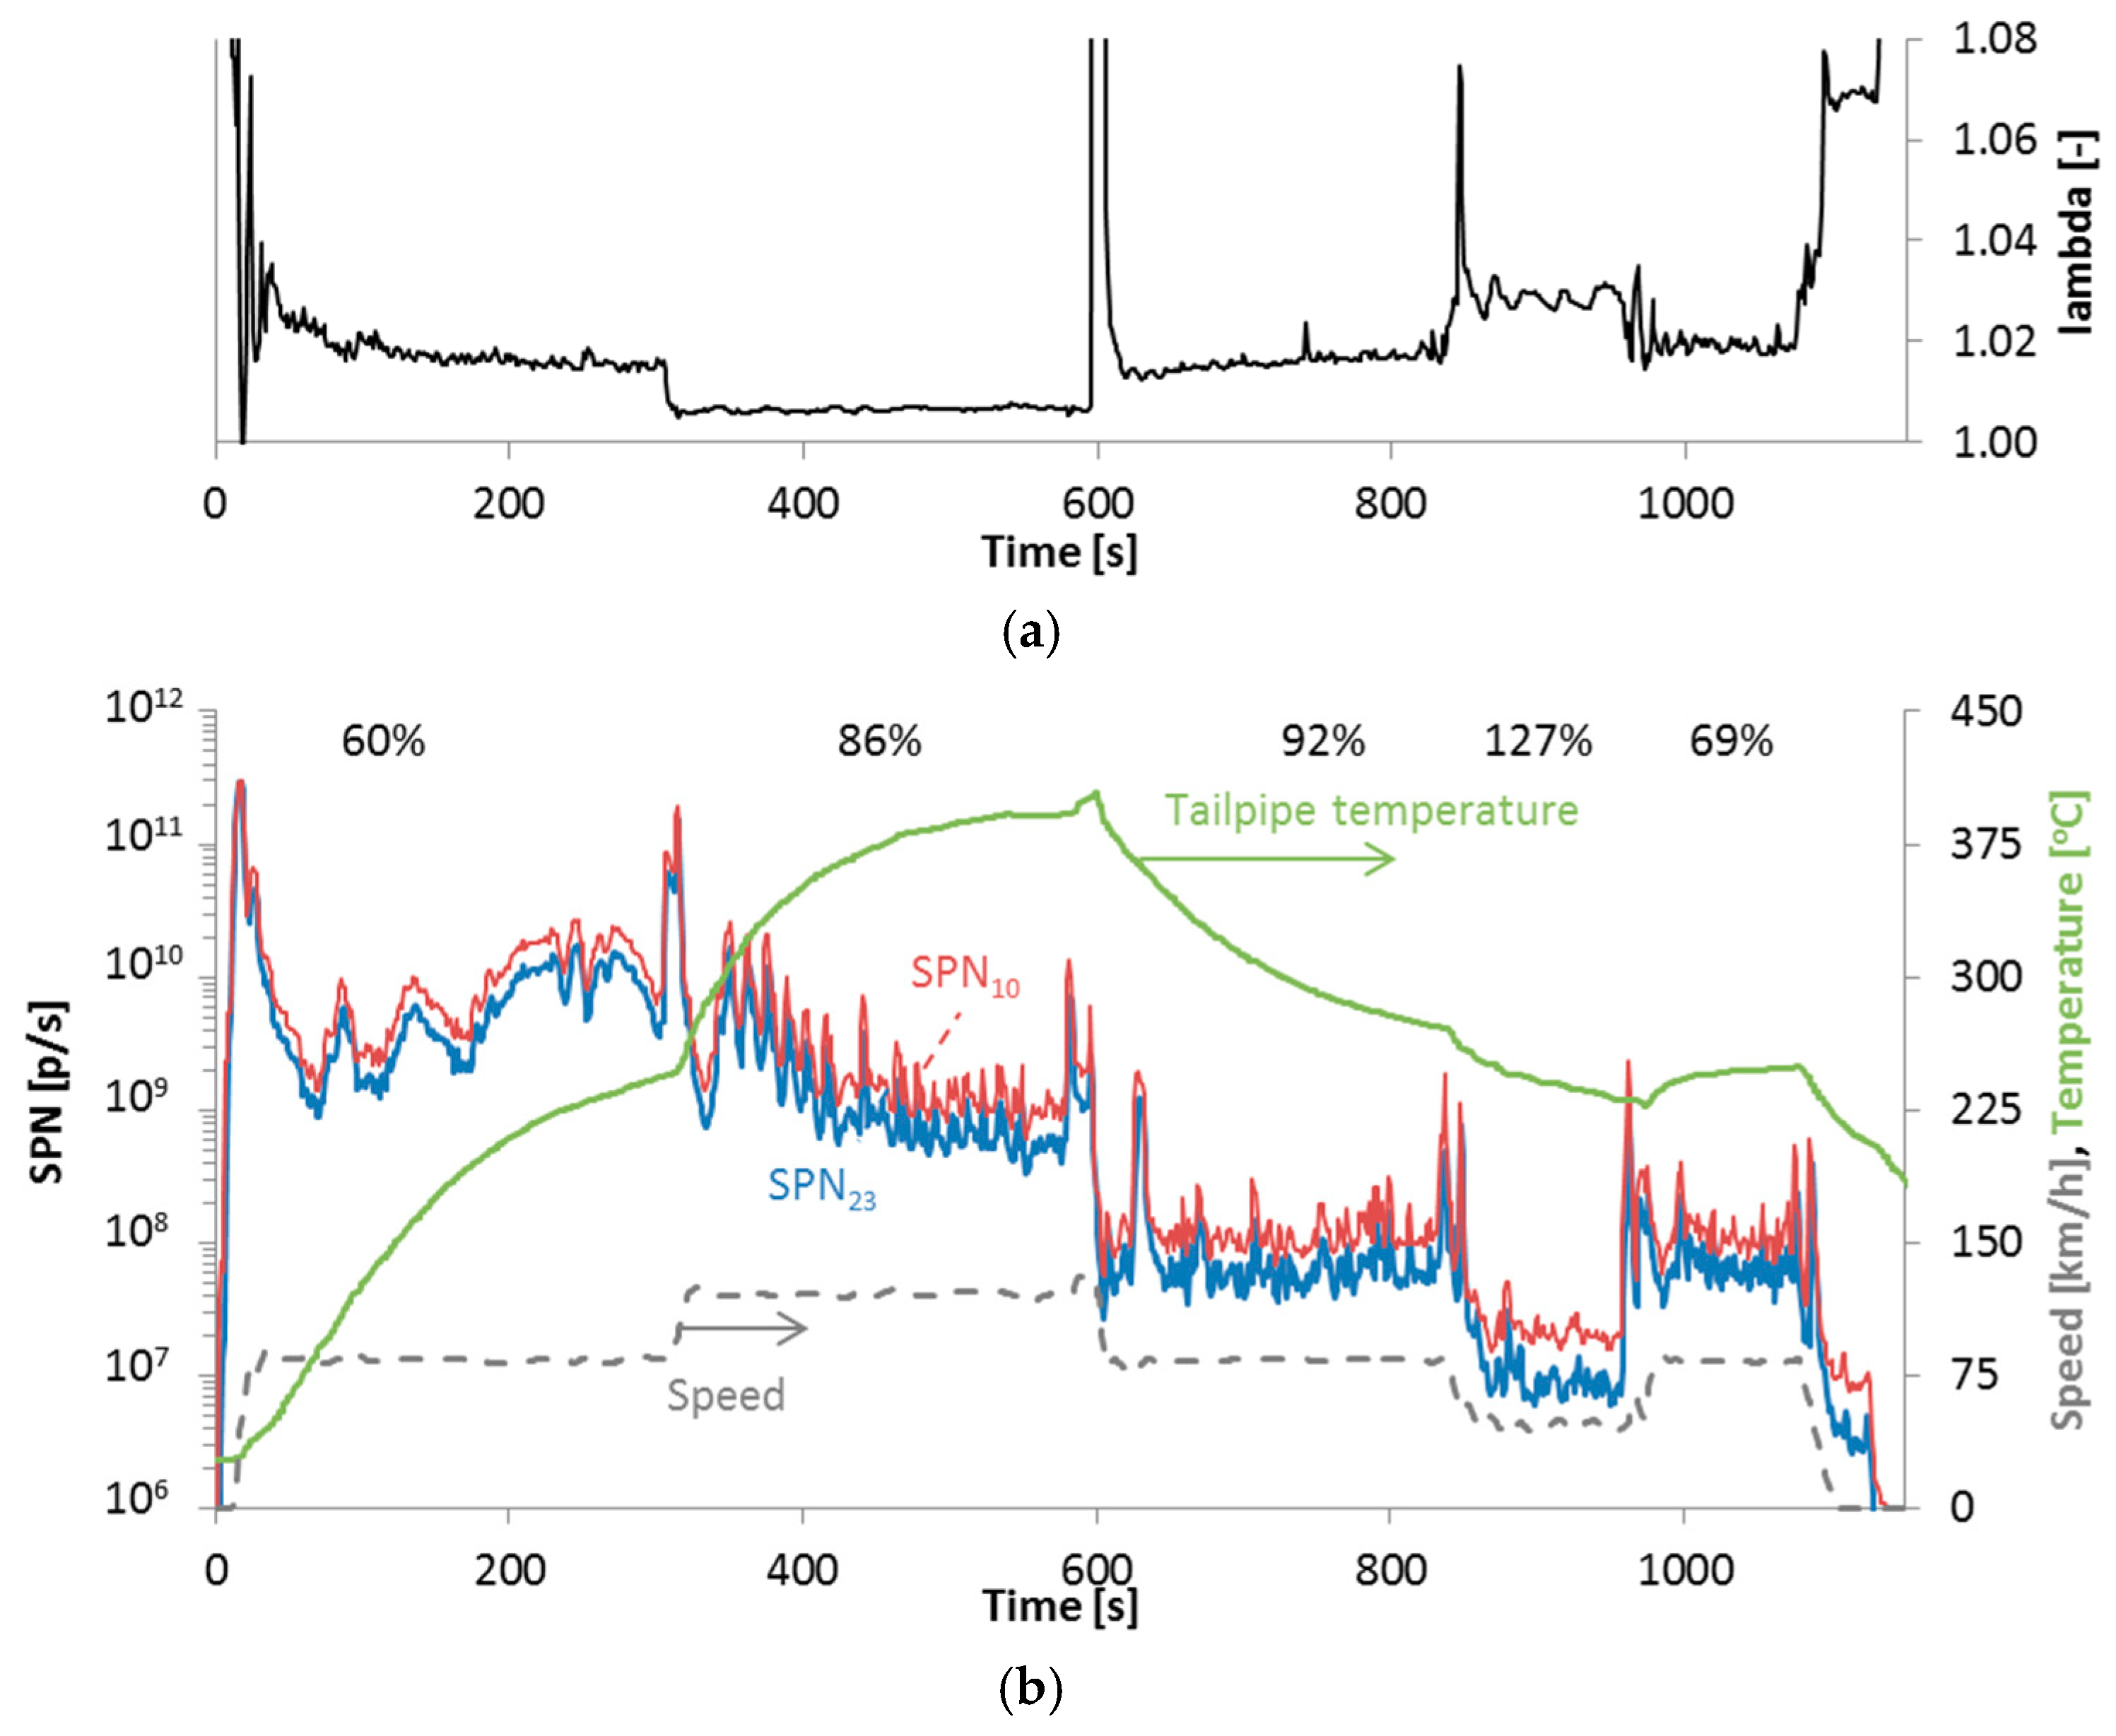
4.4. Tailpipe vs. Dilution Tunnel
5. Conclusions
Author Contributions
Funding
Acknowledgments
Conflicts of Interest
Disclaimer
Appendix A

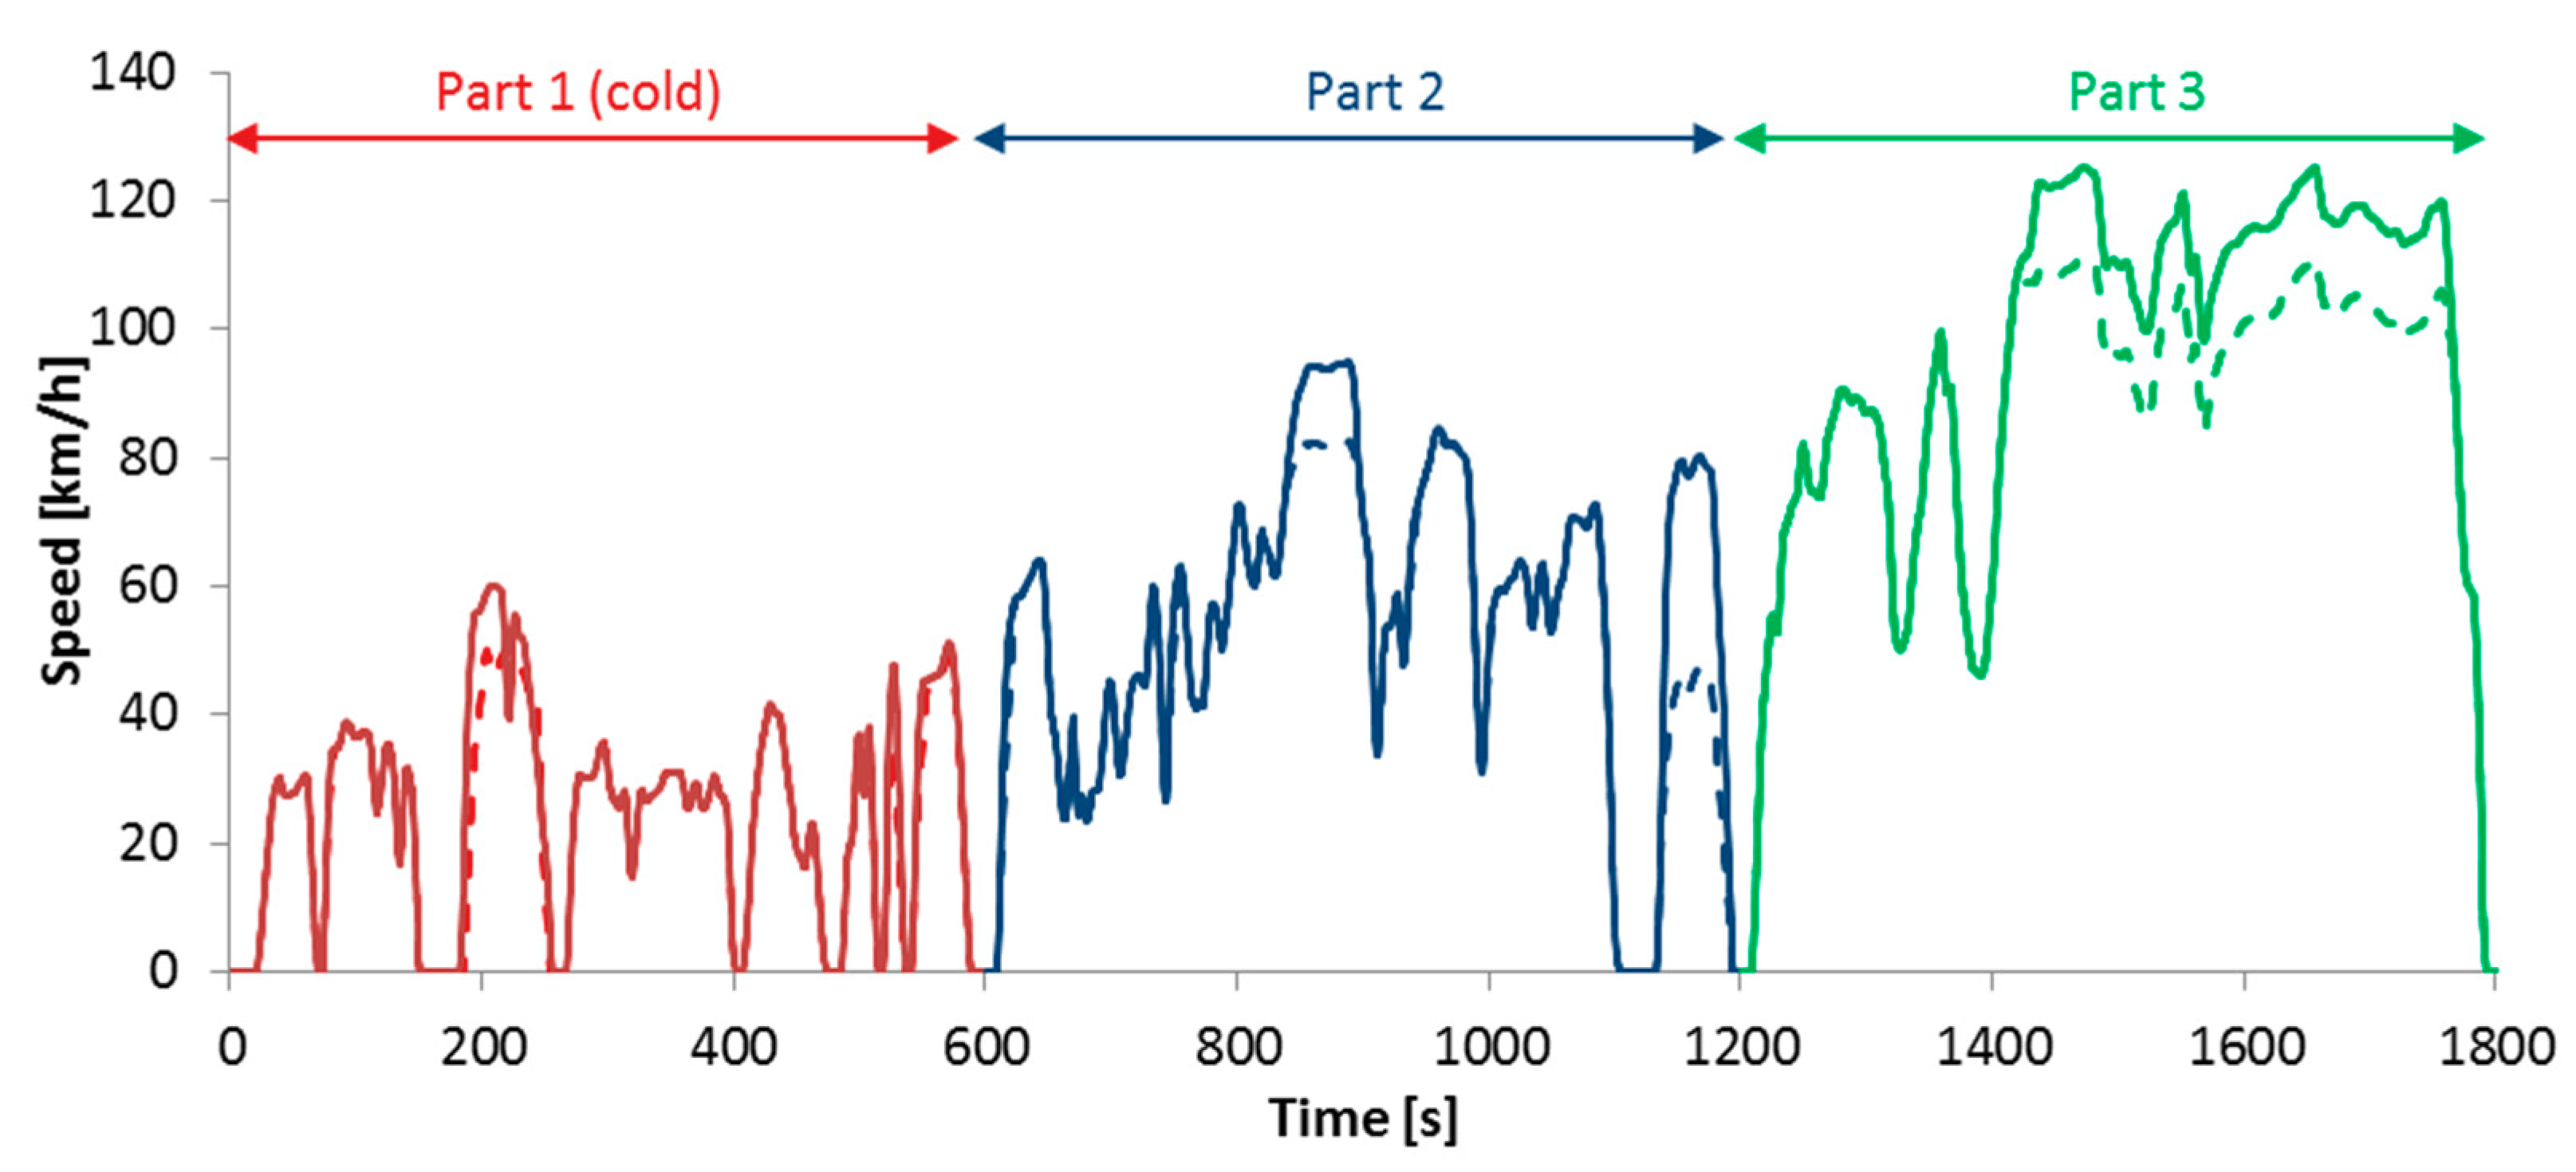
| Code | WMTC | 1 | 2-1 | 2-2 | 3-2 | Constant Speeds | ||
|---|---|---|---|---|---|---|---|---|
| Speed [km/h] | 22.8 | 36.8 km/h | 39.5 | 57.8 | 45.0 | 85.0 | 120.0 | |
| #1 | L1e-B | 0.10 | 0.20 | |||||
| #2 | L3e-A1 | 0.10 | ||||||
| #3 | L3e-A2 | 0.15 | ||||||
| #4 | L3e-A2 | 0.20 | ||||||
| #5 | L3e-A2 | 0.19 | ||||||
| #6 | L3e-A2 | 0.17 | ||||||
| #7 | L3e-A2 | 0.19 | ||||||
| #8 | L3e-A3 | 0.31 | 0.47 | 0.33 | 0.54 | 1.03 | ||
| #9 | L3e-A3 | 0.26 | 0.39 | |||||
References
- Health Effects Institute. State of Global Air 2019, Special Report; Health Effects Institute: Boston, MA, USA, 2019. [Google Scholar]
- Kumar, P.; Morawska, L.; Birmili, W.; Paasonen, P.; Hu, M.; Kulmala, M.; Harrison, R.M.; Norford, L.; Britter, R. Ultrafine particles in cities. Environ. Int. 2014, 66, 1–10. [Google Scholar] [CrossRef] [PubMed]
- Stabile, L.; Massimo, A.; Rizza, V.; D’Apuzzo, M.; Evangelisti, A.; Scungio, M.; Frattolillo, A.; Cortellessa, G.; Buonanno, G. A novel approach to evaluate the lung cancer risk of airborne particles emitted in a city. Sci. Total Environ. 2019, 656, 1032–1042. [Google Scholar] [CrossRef] [PubMed]
- Harrison, R.M.; Shi, J.P.; Xi, S.; Khan, A.; Mark, D.; Kinnersley, R.; Yin, J. Measurement of number, mass and size distribution of particles in the atmosphere. Philos. Trans. R. Soc. London. Ser. A Math. Phys. Eng. Sci. 2000, 358, 2567–2580. [Google Scholar] [CrossRef]
- World Health Organization Review of Evidence on Health Aspects of Air Pollution—REVIHAAP project. 2013. Available online: http://www.euro.who.int/en/health-topics/environment-and-health/air-quality/publications/2013/review-of-evidence-on-health-aspects-of-air-pollution-revihaap-project-final-technical-report (accessed on 19 July 2019).
- Giechaskiel, B.; Alföldy, B.; Drossinos, Y. A metric for health effects studies of diesel exhaust particles. J. Aerosol. Sci. 2009, 40, 639–651. [Google Scholar] [CrossRef]
- Rönkkö, T.; Kuuluvainen, H.; Karjalainen, P.; Keskinen, J.; Hillamo, R.; Niemi, J.V.; Pirjola, L.; Timonen, H.J.; Saarikoski, S.; Saukko, E.; et al. Traffic is a major source of atmospheric nanocluster aerosol. Proc. Natl. Acad. Sci. USA 2017, 114, 7549–7554. [Google Scholar] [CrossRef]
- Bousiotis, D.; Dall’Osto, M.; Beddows, D.C.S.; Pope, F.D.; Harrison, R.M. Analysis of new particle formation (NPF) events at nearby rural, urban background and urban roadside sites. Atmos. Chem. Phys. 2019, 19, 5679–5694. [Google Scholar] [CrossRef]
- Platt, S.M.; Haddad, I.E.; Pieber, S.M.; Huang, R.-J.; Zardini, A.A.; Clairotte, M.; Suarez-Bertoa, R.; Barmet, P.; Pfaffenberger, L.; Wolf, R.; et al. Two-stroke scooters are a dominant source of air pollution in many cities. Nat. Commun. 2014, 5, 3749. [Google Scholar] [CrossRef]
- Guerreiro, C.; González Ortiz, A.; de Leeuw, F.; Viana, M.; Colette, A. Air Quality in Europe - 2018 Report; European Environment Agency, Publications Office of the European Union: Luxembourg, 2018; ISBN 978-92-9213-989-6. [Google Scholar]
- Giechaskiel, B.; Maricq, M.; Ntziachristos, L.; Dardiotis, C.; Wang, X.; Axmann, H.; Bergmann, A.; Schindler, W. Review of motor vehicle particulate emissions sampling and measurement: From smoke and filter mass to particle number. J. Aerosol. Sci. 2014, 67, 48–86. [Google Scholar] [CrossRef]
- Giechaskiel, B.; Mamakos, A.; Andersson, J.; Dilara, P.; Martini, G.; Schindler, W.; Bergmann, A. Measurement of automotive nonvolatile particle number emissions within the European legislative framework: A review. Aerosol. Sci. Technol. 2012, 46, 719–749. [Google Scholar] [CrossRef]
- Giechaskiel, B.; Joshi, A.; Ntziachristos, L.; Dilara, P. European regulatory framework and particulate matter emissions of gasoline light-duty vehicles: A review. Catalysts 2019, 9, 586. [Google Scholar] [CrossRef]
- Martini, G. PMP IWG Progress Report. Available online: https://wiki.unece.org/display/trans/PMP+49th+Session (accessed on 19 July 2019).
- Giechaskiel, B.; Vanhanen, J.; Väkevä, M.; Martini, G. Investigation of vehicle exhaust sub-23 nm particle emissions. Aerosol. Sci. Technol. 2017, 51, 626–641. [Google Scholar] [CrossRef]
- Giechaskiel, B.; Lähde, T.; Suarez-Bertoa, R.; Clairotte, M.; Grigoratos, T.; Zardini, A.; Perujo, A.; Martini, G. Particle number measurements in the European legislation and future JRC activities. Combust. Engines 2018, 174, 3–16. [Google Scholar]
- Giechaskiel, B.; Lähde, T.; Drossinos, Y. Regulating particle number measurements from the tailpipe of light-duty vehicles: The next step? Environ. Res. 2019, 172, 1–9. [Google Scholar] [CrossRef] [PubMed]
- Iodice, P.; Senatore, A. Exhaust emissions of new high-performance motorcycles in hot and cold conditions. Int. J. Environ. Sci. Technol. 2015, 12, 3133–3144. [Google Scholar] [CrossRef]
- European Commission-Directorate General for Mobility and Transport. EU Transport in Figures: Statistical Pocketbook; Publications Office of the European Union: Luxembourg, 2018; ISBN 978-92-79-73951-4. [Google Scholar]
- ACEM Association des Constructeurs Européens de Motocycles. Market data. Available online: https://www.acem.eu/market-data (accessed on 19 July 2019).
- Ntziachristos, L.; Giechaskiel, B.; Pistikopoulos, P.; Fysikas, E.; Samaras, Z. Particle emissions characteristics of different on-road vehicles. SAE Trans. 2003, 112, 1568–1578. [Google Scholar]
- Ntziachristos, L.; Pistikopoulos, P.; Samaras, Z. Particle characterization from two-stroke powered two-wheelers. Int. J. Engine. Res. 2005, 6, 263–275. [Google Scholar] [CrossRef]
- Czerwinski, J.; Comte, P.; Napoli, S.; Wili, P. Summer cold start and nanoparticulates of small scooters. SAE Tech. Pap. 2002. [Google Scholar] [CrossRef]
- Czerwinski, J.; Comte, P.; Reutimann, F. Nanoparticle emissions of a DI 2-stroke scooter with varying oil- & fuel quality. SAE Trans. 2005, 114, 541–596. [Google Scholar]
- Czerwinski, J.; Comte, P.; Larsen, B.; Martini, G.; Mayer, A. Research on particle emissions of modern 2-stroke scooters. SAE Tech. Pap. 2006. [Google Scholar] [CrossRef]
- Czerwinski, J.; Comte, P.; Makkee, M.; Reutimann, F. (Particle) emissions of small 2- & 4-stroke scooters with (hydrous) ethanol blends. SAE Tech. Pap. 2010. [CrossRef]
- Favre, C.; May, J.; Bosteels, D.; Tromayer, J.; Neumann, G.; Kirchberger, R.; Eichlseder, H. Regulated and Non-Regulated Emissions of Selected State-of-the-Art European Mopeds. In Proceedings of the SIA 2011 Congress, Strasbourg, France, 30 November 2011. [Google Scholar]
- Santino, D.; Picini, P.; Martino, L. Particulate matter emissions from two-stroke mopeds. SAE Tech. Pap. 2001. [Google Scholar] [CrossRef]
- Yang, H.; Hsieh, L.; Liu, H.; Mi, H. Polycyclic aromatic hydrocarbon emissions from motorcycles. Atmos. Environ. 2005, 39, 17–25. [Google Scholar] [CrossRef]
- Spezzano, P.; Picini, P.; Cataldi, D.; Messale, F.; Manni, C. Particle- and gas-phase emissions of polycyclic aromatic hydrocarbons from two-stroke, 50-cm3 mopeds. Atmos. Environ. 2008, 42, 4332–4344. [Google Scholar] [CrossRef]
- Adam, T.; Farfaletti, A.; Montero, L.; Martini, G.; Manfredi, U.; Larsen, B.; Santi, G.D.; Krasenbrink, A.; Astorga, C. Chemical characterization of emissions from modern two-stroke mopeds complying with legislative regulation in Europe (Euro-2). Environ. Sci. Technol. 2010, 44, 505–512. [Google Scholar] [CrossRef]
- Clairotte, M.; Adam, T.W.; Chirico, R.; Giechaskiel, B.; Manfredi, U.; Elsasser, M.; Sklorz, M.; DeCarlo, P.F.; Heringa, M.F.; Zimmermann, R.; et al. Online characterization of regulated and unregulated gaseous and particulate exhaust emissions from two-stroke mopeds: A chemometric approach. Analytica Chimica Acta 2012, 717, 28–38. [Google Scholar] [CrossRef]
- Prati, M.V.; Costagliola, M.A. Emissions of fine particles and organic compounds from mopeds. Environ. Eng. Sci. 2009, 26, 111–122. [Google Scholar] [CrossRef]
- Zardini, A.A.; Platt, S.M.; Clairotte, M.; El Haddad, I.; Temime-Roussel, B.; Marchand, N.; Ježek, I.; Drinovec, L.; Močnik, G.; Slowik, J.G.; et al. Effects of alkylate fuel on exhaust emissions and secondary aerosol formation of a 2-stroke and a 4-stroke scooter. Atmos. Environ. 2014, 94, 307–315. [Google Scholar] [CrossRef]
- Andersson, J.D.; Lance, D.L.; Jemma, C.A. DfT motorcycle emissions measurement programmes: Unregulated emissions results. SAE Tech. Pap. 2003. [Google Scholar] [CrossRef]
- Martini, G.; Astorga, G.; Adam, T.; Bonnel, P.; Farfaletti, A.; Junninen, H.; Manfredi, U.; Montero, L.; Müller, A.; Krasenbrink, A.; et al. Physical & Chemical Characterization of Emissions from 2-Stroke Motorcycles: (Comparison with 4-Stroke Engines); Office for Official Publications of the European Communities: Luxembourg, 2009. [Google Scholar]
- Momenimovahed, A.; Olfert, J.S.; Checkel, M.D.; Pathak, S.; Sood, V.; Singh, Y.; Singal, S.K. Real-time driving cycle measurements of ultrafine particle emissions from two wheelers and comparison with passenger cars. Int. J. Automot. Technol. 2014, 15, 1053–1061. [Google Scholar] [CrossRef]
- Czerwinski, J.; Comte, P. Limited emissions and nanoparticulates of a scooter with 2-stroke direct injection (TSDI). SAE Tech. Pap. 2003. [Google Scholar] [CrossRef]
- Seggiani, M.; Prati, M.V.; Costagliola, M.A.; Puccini, M.; Vitolo, S. Bioethanol–gasoline fuel blends: Exhaust emissions and morphological characterization of particulate from a moped engine. J. Air. Waste. Manag. Assoc. 2012, 62, 888–897. [Google Scholar] [CrossRef]
- Mayer, A.; Czerwinski, J.; Kasper, M.; Ulrich, A.; Mooney, J.J. Metal oxide particle emissions from diesel and petrol engines. SAE Tech. Pap. 2012. [Google Scholar] [CrossRef]
- Favre, C.; Bosteels, D.; May, J.; De Souza, I.; Beale, L.; Andersson, J. An emissions performance evaluation of state-of-the-art motorcycles over Euro 3 and WMTC drive cycles. SAE Tech. Pap. 2009. [Google Scholar] [CrossRef]
- Spezzano, P.; Picini, P.; Cataldi, D.; Messale, F.; Manni, C.; Santino, D. Particle-phase polycyclic aromatic hydrocarbon emissions from non-catalysed, in-use four-stroke scooters. Environ. Monit. Assess. 2007, 133, 105–117. [Google Scholar] [CrossRef]
- Costagliola, M.A.; Prati, M.V.; Florio, S.; Scorletti, P.; Terna, D.; Iodice, P.; Buono, D.; Senatore, A. Performances and emissions of a 4-stroke motorcycle fuelled with ethanol/gasoline blends. Fuel 2016, 183, 470–477. [Google Scholar] [CrossRef]
- Kontses, A.; Ntziachristos, L.; Zardini, A.A.; Papadopoulos, G.; Giechaskiel, B. Particulate emissions from L-Category vehicles towards Euro 5. Environ. Res. 2019. submitted. [Google Scholar]
- Ntziachristos, L.; Vonk, W.A.; Papadopoulos, G.; van Mensch, P.; Geivanidis, S.; Mellios, G.; Papadimitriou, G.; Steven, H.; Elstgeest, M.; Ligterink, N.E.; et al. Effect Study of the Environmental Step Euro 5 for L-category Vehicles; European Commission: Brussels, Belgium, 2017; ISBN 978-92-79-70203-7. [Google Scholar]
- Giechaskiel, B.; Zardini, A.; Martini, G. Particle emission measurements from L-category vehicles. SAE Int. J. Engines 2015, 8, 2322–2337. [Google Scholar] [CrossRef]
- Giechaskiel, B.; Arndt, M.; Schindler, W.; Bergmann, A.; Silvis, W.; Drossinos, Y. Sampling of non-volatile vehicle exhaust particles: A simplified guide. SAE Int. J. Engines. 2012, 5, 379–399. [Google Scholar] [CrossRef]
- Czerwinski, J.; Comte, P.; Mayer, A.; Reutimann, F. Investigations of changes of the 2-stroke scooters nanoparticles in the exhaust- and cvs-system. SAE Tech. Pap. 2013. [Google Scholar] [CrossRef]
- Giechaskiel, B.; Chirico, R.; DeCarlo, P.F.; Clairotte, M.; Adam, T.; Martini, G.; Heringa, M.F.; Richter, R.; Prevot, A.S.H.; Baltensperger, U. Evaluation of the particle measurement programme (PMP) protocol to remove the vehicles’ exhaust aerosol volatile phase. Sci. Total. Environ. 2010, 408, 5106–5116. [Google Scholar] [CrossRef]
- Giechaskiel, B.; Cresnoverh, M.; Jörgl, H.; Bergmann, A. Calibration and accuracy of a particle number measurement system. Meas. Sci. Technol. 2010, 21, 045102. [Google Scholar] [CrossRef]
- Giechaskiel, B.; Manfredi, U.; Martini, G. Engine exhaust solid sub-23 nm particles: I. literature survey. SAE Int. J. Fuels. Lubr. 2014, 7, 950–964. [Google Scholar] [CrossRef]
- Amanatidis, S.; Ntziachristos, L.; Giechaskiel, B.; Katsaounis, D.; Samaras, Z.; Bergmann, A. Evaluation of an oxidation catalyst (“catalytic stripper”) in eliminating volatile material from combustion aerosol. J. Aerosol. Sci. 2013, 57, 144–155. [Google Scholar] [CrossRef]
- Giechaskiel, B.; Wang, X.; Horn, H.-G.; Spielvogel, J.; Gerhart, C.; Southgate, J.; Jing, L.; Kasper, M.; Drossinos, Y.; Krasenbrink, A. Calibration of condensation particle counters for legislated vehicle number emission measurements. Aerosol. Sci. Technol. 2009, 43, 1164–1173. [Google Scholar] [CrossRef]
- Wang, X.; Caldow, R.; Sem, G.J.; Hama, N.; Sakurai, H. Evaluation of a condensation particle counter for vehicle emission measurement: Experimental procedure and effects of calibration aerosol material. J. Aerosol. Sci. 2010, 41, 306–318. [Google Scholar] [CrossRef]
- Takegawa, N.; Sakurai, H. Laboratory evaluation of a TSI condensation particle counter (model 3771) under airborne measurement conditions. Aerosol. Sci. Technol. 2011, 45, 272–283. [Google Scholar] [CrossRef]
- Yamada, H.; Funato, K.; Sakurai, H. Application of the PMP methodology to the measurement of sub-23 nm solid particles: Calibration procedures, experimental uncertainties, and data correction methods. J. Aerosol. Sci. 2015, 88, 58–71. [Google Scholar] [CrossRef]
- Joshi, A.; Johnson, T. Gasoline particulate filters—A review. Emiss. Control. Sci. Technol. 2018, 4, 219–239. [Google Scholar] [CrossRef]
- Maricq, M.M.; Szente, J.; Loos, M.; Vogt, R. Motor vehicle PM emissions measurement at LEV III levels. SAE Int. J. Engines 2011, 4, 597–609. [Google Scholar] [CrossRef]
- Chase, R.E.; Duszkiewicz, G.J.; Richert, J.F.O.; Lewis, D.; Maricq, M.M.; Xu, N. PM measurement artifact: organic vapor deposition on different filter media. SAE Tech. Pap. 2004. [Google Scholar] [CrossRef]
- Giechaskiel, B. Differences between tailpipe and dilution tunnel sub-23 nm non-volatile (solid) particle number measurements. Aerosol. Sci. Technol. 2019, 1–13. [Google Scholar] [CrossRef]


| Code | Category | Power (kW) | Displ. (cm3) | MY | TR | Max Speed (km/h) | Mileage (km) | Mass 1 (kg) | Power/Mass (kW/kg) |
|---|---|---|---|---|---|---|---|---|---|
| #1 | L1e-B | 2.4 | 50 | 2018 | CVT | 45 | 500 | 98 | 0.02 |
| #2 | L3e-A1 | 9.0 | 125 | 2016 | MT | 95 | 2350 | 142 | 0.06 |
| #3 | L3e-A2 | 11.0 | 155 | 2017 | CVT | 101 | 1000 | 157 | 0.07 |
| #4 | L3e-A2 | 15.6 | 278 | 2018 | CVT | 115 | 300 | 158 | 0.10 |
| #5 | L3e-A2 | 18.5 | 279 | 2016 | CVT | 128 | 1000 | 179 | 0.10 |
| #6 | L3e-A2 | 18.5 | 280 | 2015 | CVT | 128 | 3100 | 179 | 0.10 |
| #7 | L3e-A2 | 32.0 | 693 | 2016 | MT | 120 | 1000 | 162 | 0.20 |
| #8 | L3e-A3 | 103.0 | 798 | 2018 | MT | >140 | 850 | 209 | 0.49 |
| #9 | L3e-A3 | 92.0 | 1170 | 2015 | MT | >140 | 1150 | 254 | 0.36 |
| Code | Category | WMTC | Parts | WF (Euro 4) | WF (Euro 5) |
|---|---|---|---|---|---|
| #1 | L1e-B | 1 | P1 + P1 (reduced) | 30-70 | 50-50 |
| #2 | L3e-A1 | 1 | P1 + P1 (reduced) | 30-70 | 50-50 |
| #3 | L3e-A2 | 2-1 | P1 + P2 (reduced) | 30-70 | 50-50 |
| #4 | L3e-A2 | 2-2 | P1 + P2 | 30-70 | 50-50 |
| #5 | L3e-A2 | 2-2 | P1 + P2 | 30-70 | 50-50 |
| #6 | L3e-A2 | 2-2 | P1 + P2 | 30-70 | 50-50 |
| #7 | L3e-A2 | 2-2 | P1 + P2 | 30-70 | 50-50 |
| #8 | L3e-A3 | 3-2 | P1 + P2 +P3 | 25-50-25 | 25-50-25 |
| #9 | L3e-A3 | 3-2 | P1 + P2 + P3 | 25-50-25 | 25-50-25 |
© 2019 by the authors. Licensee MDPI, Basel, Switzerland. This article is an open access article distributed under the terms and conditions of the Creative Commons Attribution (CC BY) license (http://creativecommons.org/licenses/by/4.0/).
Share and Cite
Giechaskiel, B.; Zardini, A.A.; Lähde, T.; Perujo, A.; Kontses, A.; Ntziachristos, L. Particulate Emissions of Euro 4 Motorcycles and Sampling Considerations. Atmosphere 2019, 10, 421. https://doi.org/10.3390/atmos10070421
Giechaskiel B, Zardini AA, Lähde T, Perujo A, Kontses A, Ntziachristos L. Particulate Emissions of Euro 4 Motorcycles and Sampling Considerations. Atmosphere. 2019; 10(7):421. https://doi.org/10.3390/atmos10070421
Chicago/Turabian StyleGiechaskiel, Barouch, Alessandro A. Zardini, Tero Lähde, Adolfo Perujo, Anastasios Kontses, and Leonidas Ntziachristos. 2019. "Particulate Emissions of Euro 4 Motorcycles and Sampling Considerations" Atmosphere 10, no. 7: 421. https://doi.org/10.3390/atmos10070421
APA StyleGiechaskiel, B., Zardini, A. A., Lähde, T., Perujo, A., Kontses, A., & Ntziachristos, L. (2019). Particulate Emissions of Euro 4 Motorcycles and Sampling Considerations. Atmosphere, 10(7), 421. https://doi.org/10.3390/atmos10070421