Abstract
We analyse Swarm satellite magnetic field and electron density data one month before and one month after 12 strong earthquakes that have occurred in the first 2.5 years of Swarm satellite mission lifetime in the Mediterranean region (magnitude M6.1+) or in the rest of the world (M6.7+). The search for anomalies was limited to the area centred at each earthquake epicentre and bounded by a circle that scales with magnitude according to the Dobrovolsky’s radius. We define the magnetic and electron density anomalies statistically in terms of specific thresholds with respect to the same statistical quantity along the whole residual satellite track (|geomagnetic latitude| ≤ 50°, quiet geomagnetic conditions). Once normalized by the analysed satellite tracks, the anomalies associated to all earthquakes resemble a linear dependence with earthquake magnitude, so supporting the statistical correlation with earthquakes and excluding a relationship by chance.
1. Introduction
The ionosphere is the ionized part of the atmosphere extending from about 50 to 1000 km above the terrestrial surface. The concentration of ions and electrons in the ionosphere plays a fundamental role in the radio-wave propagation and atmospheric electricity (e.g., [1,2]). Ionospheric features vary according to geographic latitude and longitude, time of the day, season and altitude (e.g., [3]). Besides these regular variations, ionosphere is sensitive to forcing from above, i.e., by magnetospheric phenomena triggered by Sun-Earth interaction, and from below, such as tropospheric (e.g., [4,5,6,7]) and lithospheric processes (e.g., [8,9,10]).
Concerning lithospheric processes, it is currently consolidated that large earthquakes (EQ) trigger co-seismic ionospheric disturbances, known as seismo-travelling ionospheric disturbances (STIDs) that propagate like a circular wave from the projection of the epicenter into the ionosphere. STIDs can be detected by measuring plasma variations from ground-based and space-borne instruments (see, e.g., [11,12] and references therein). Beside the post-shock effects in the ionosphere, it is interesting to search for EQ signatures in the ionosphere prior to the EQ occurrence. In this work, we are then interested on the possibility that the ionosphere is affected by a great earthquake (EQ), not only after, but also before its occurrence, i.e., on what is called Lithosphere-Atmosphere-Ionosphere Coupling, or simply LAIC (e.g., [13,14]).
There exists a consolidated literature demonstrating the lithospheric origin of geomagnetic variations prior than large seismic events. Although pioneering works on electromagnetic signals associated to seismic events date back to the first half of 1960s with Breiner [15], Moore [16] and Stacey [17], a milestone in the literature regarding ULF geomagnetic anomalies can be considered the paper by Fraser-Smith [18] in which a clear ULF anomalous signal before the Loma-Prieta earthquake (1989, Ms 7.1, California) is described. Thereafter, a lot was done and many publications reported observations of electromagnetic (EM) phenomena during the preparatory stages of large earthquakes. They relied on both ground-based measurements of lithospheric emissions ranging from DC to VHF (e.g., [18,19,20,21]; and satellite observations of high atmosphere plasma perturbations and radio emissions related to earthquakes (e.g., [22,23,24,25]). Laboratory and fieldwork experiments confirmed that co-seismic EM phenomena, due to variations of physical parameters of rocks, associated to seismic and volcanic events have a solid base: see, for example, the reviews published by Johnston [26] and Zlotnicki and Nisida [27], and, recently, the study of Donner et al. [20], based on ground EM signals. Of course, one of the main issues in these kinds of studies is the robust identification of the lithospheric origin: the present work intends to contribute with the application of recent techniques that, as others developed with this aim (e.g., [28,29,30,31]), may represent a step forward in the topic.
Satellite data have been analysed heavily to detect LAIC effects in the ionosphere. Particularly important was DEMETER satellite mission, specifically designed to this purpose, but also other satellite missions, such as CHAMP, have been analysed with that purpose.
For instance, Balasis and Mandea [32] analysed a rather significant period of CHAMP magnetic field data to detect anomalies unexplained by typical ionospheric state and potentially associated to EQs. The method relied on the use of wavelet spectral analysis, also proposed by Mandea and Balasis [33].
Ryu et al. [34] took advantage of the simultaneous measurements of DEMETER and CHAMP. In particular, they analysed the electron density and temperature, ion density composition and temperature for investigating ionospheric fluctuations related to the earthquakes occurred in September 2004 near to the south coast of Honshu, Japan. The authors found that, within a very small longitudinal distance around the epicenter, an ion temperature anomaly arose a week before the two main earthquakes. Electron density and ion composition fluctuations at the epicenter position were observed with concurrent downward ion drift by “Thermal plasma analyzer” onboard DEMETER.
Data from DEMETER have been also used to study the seismo-ionospheric coupling before Wenchuan earthquake (M 7.9) of 12 May 2008 [35] and seven large (M ≥ 6.8) earthquakes in the north-east Asia region at mid-latitude [36]. The main result was the detection of a gradual enhancement of the Equatorial Ionospheric Anomaly (EIA) intensity starting one month prior the event, reaching its maximum eight days before followed by a decreasing behavior, very likely due to an external electric field generated over the epicenter, affecting the existing E × B drifts responsible of the EIA.
Wang et al. [37] applied heavy data mining to large data sets of DEMETER from 1 January 2008 to 30 June 2008, in order to test the accuracy of this method as a possible earthquake prediction tool. The main result is that the prediction accuracy reaches 0.7 when both the electron density and temperature from DEMETER are considered as featuring the pre-seismic ionosphere anomalies. The precursor time is about 5 days.
The Chile earthquake (Mw 8.8) that occurred on 27 February 2010 at 06:34 UTC (UTC = LT + 3:00) has been deeply investigated by Akhoondzadeh [38]. Ion and electron density, electron temperature and VLF electric field from DEMETER have been analysed prior to the event, in conjunction with the Aerosol Optical Depth (AOD) and together with other parameters, including Total Electron Content (TEC) from ground-based receivers of the Global Positioning System (GPS) signals. All these parameters show anomalies occurring from 1 to 6 days before the earthquake. The author indicates that multi-precursors analysis is more effective in seismo-LAIC precursors’ studies and that different precursors may occur at different time due to the still not well explained LAIC mechanism.
By using proton density data from GOES-15, Hazra and Islam [39] carried out a deep investigation of some ionospheric anomalies linked with a series of moderate-strong earthquakes including that one with M7.5 occurred on 17 November 2013 and located to the east west oriented plate boundary between the Antarctica and Scotia sea plates. In particular, the proton density shows spikes several hours before the occurrences of earthquakes with an amplitude that seems to be dependent on the earthquakes magnitude. To explain the results, the authors proposed a simple model. On the average, the proton density should decrease toward the earthquake date, due to the plate movements under Scotia Sea, for which the submicron aerosols emerge: the ionosphere is more ionized and electric field becomes stronger. The resulting accelerated electrons and the huge amount of protons coming from solar radiation produce a decrease proton density in ionosphere.
More recently, Akhoondzadeh et al. [40], De Santis et al. [41], Marchetti and Akhoondzadeh [42], Akhoondzadeh et al. [43] and Marchetti et al. [44] performed deep analyses of particular important case studies, where some original techniques were applied in order to discriminate between solar effects and potential lithospheric effects preceding strong earthquakes. In particular, De Santis et al. [41] were the first to analyse the magnetic field of the Swarm satellites for searching pre-earthquake ionospheric patterns: they studied Swarm magnetic data around the M7.8 earthquake occurred on 25 April 2015 in Nepal. They detected a series of anomalies with an S-shape (sigmoid) pattern analogous with the same pattern of the cumulative number of earthquakes, supporting an ionospheric effect of LAIC in concomitance of the earthquake.
In this paper, we analyse magnetic field and electron density data provided by Swarm satellites in space and time around the epicenters and the occurrences of twelve M6+ earthquakes in the period of 2014–2016. In the Results, we present the most interesting findings of all the analyses, while in the Discussion and Conclusions we discuss the results and propose some interpretation. In the final section, we describe the Swarm data and the earthquake case studies that we have analysed in our work, and the algorithms used in the analyses.
Most of the work here presented, including the obtained results, were taken during the SAFE (SwArm For Earthquake study; http://safe-swarm.ingv.it/) project, funded by ESA. The main goal of the project was not to propose a scheme of earthquake prediction from satellite data analysis, but another goal as well important and worth performing: to analyse Swarm satellite data, in order to possibly detect electromagnetic anomalies related to the phase of preparation of large earthquakes. This paper represents one of the attempts to reach that important goal.
2. Results
All the algorithms described in the Section Materials and Methods (MASS, NeLOG and NeSTAD) were systematically applied to all 12 case studies (Table 2 in Section Materials and Methods). A first visual analysis of the satellite tracks allowed selecting a set of tracks with “anomalous characteristics” not directly explained with known geomagnetic perturbations.
2.1. MASS Results
Figure 1 shows a magnetic anomaly that preceded the 1 April 2014 M8.2 Chile EQ by 27 days. The characteristics of this anomaly could make possible to think about charged particles due to stress on the fault (or from ionosphere particles charged, for example, by electromagnetic waves). It is interesting to note that the disturbance follows the magnetic field lines as the signal corresponds to the conjugated magnetic coordinate (+ 10 ° if the source is at −10° of geomagnetic latitude).
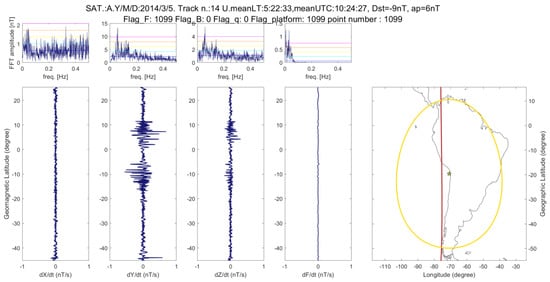
Figure 1.
Example from MASS algorithm of anomalous tracks (on 5 March 2014; Sat A.), especially visible in Y magnetic component 27 days before the 1 April 2014 M8.2 Chile EQ.
Figure 2 reports a magnetic anomaly that preceded by 11 days the 24 May 2014 M6.9 North Aegean Sea EQ. This track has a very strong and unusual aspect for a nighttime (23:22 local time), especially taking into account that the geomagnetic indices are sufficiently low (Dst = 6 nT, ap = 3 nT, AE = 54 nT).
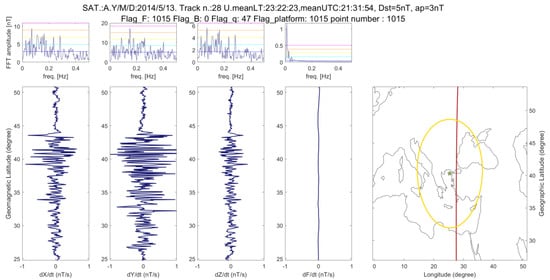
Figure 2.
An example from MASS algorithm of anomalous track in all magnetic components (Satellite A) on 13 May 2014, i.e., 11 days before the 24 May 2014 M6.9 North Aegean Sea EQ.
Figure 3 exhibits a magnetic anomaly that preceded by 25 days the 15 April 2016 M7.0 Japan EQ. The anomaly is evident in Y magnetic component and it is at the same latitude of the epicenter. Figure 4 and Figure 5 report the output of the systematic research of anomalies in the magnetic field in the 12 case studies by applying the MASS algorithm, in terms of the cumulative number of anomalies vs. time for each magnetic field component and total intensity. The threshold for each case study is selected after some runs with different thresholds. Generally (but not always), for a greater earthquake magnitude we use a greater threshold, this is in accordance with the idea that an earthquake that will release a greater energy also it could have stronger and more anomalies in the preparatory phase before the event (we tried to verify this hypothesis later in this work). The results are shown into two figures, based on the magnitude of the seismic events: the Figure 4 reports the events with magnitude between 7.0 and 8.3, while Figure 5 reports the events with a magnitude between 6.1 and 6.9.
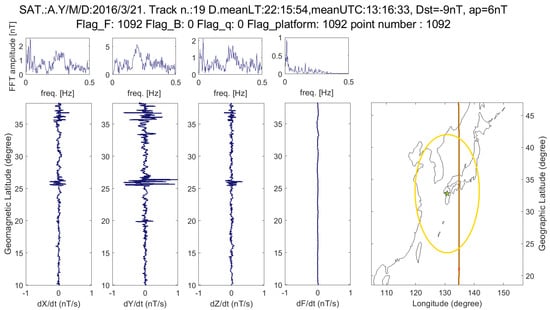
Figure 3.
An example from MASS algorithm of anomalous track in Y magnetic component (Satellite A) on 21 March 2016, i.e., 25 days before the 15 April 2016 M7.0 Japan EQ.
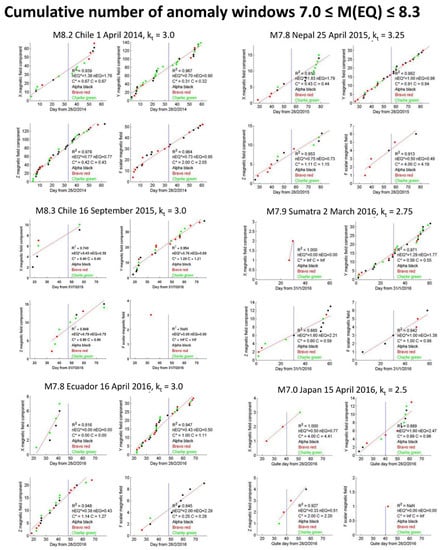
Figure 4.
Cumulative number of the anomaly tracks identified by MASS algorithm on X,Y,Z and F magnetic field, one month before and one month after the earthquake with magnitude between 7.0 and 8.3. The anomaly tracks are selected only in geomagnetic quiet time (|Dst| ≤ 20 nT and ap ≤ 10 nT). Each point is an anomaly track, the color identifies the satellite (black: Alpha, red: Bravo and green Charlie). Three automatic quality indicators (R2, nEQ, and C; the latter two also with their non normalized values with respect the number of tracks, nEQ* and C*) are computed for all analyses.
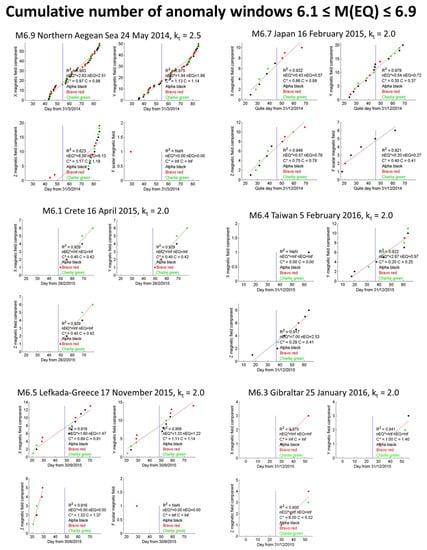
Figure 5.
Cumulative number of the anomaly tracks identified by MASS algorithm on X,Y,Z and F magnetic field, one month before and one month after the earthquakes with magnitude between 6.1 and 6.9. The anomaly tracks are selected only in geomagnetic quiet time (|Dst| ≤ 20 nT and ap ≤ 10 nT). Each point is an anomaly track, the color identifies the satellite (black: Alpha, red: Bravo and green: Charlie). Three automatic quality indicators (R2, nEQ, and C; the latter two also with their non normalized values with respect the number of tracks, nEQ* and C*) are computed for all analyses.
The results were classified by magnitude. It is interesting to note that the analysis of the magnetic data shows a better performance for the highest magnitude earthquakes showing a "better" cumulate than those of lower magnitude. The fact that magnetic analysis is more efficient for major earthquakes is comforting since greater release of energy could imply some greater effects during and after the event and greater influence on the ionosphere.
2.2. NeLOG Results
Figure 6 reports an electron density anomaly that preceded by about 8 h the 25 April 2015 M7.8 Nepal EQ. It is interesting to note that the anomaly highlighted in this track contains a small increase in electronic density and close to a depletion of the same amount. In addition, electron temperature presents quick variations in correspondence with the Ne anomaly. The magnetic signal of the same track was proposed as anomalous also by De Santis et al. [41].
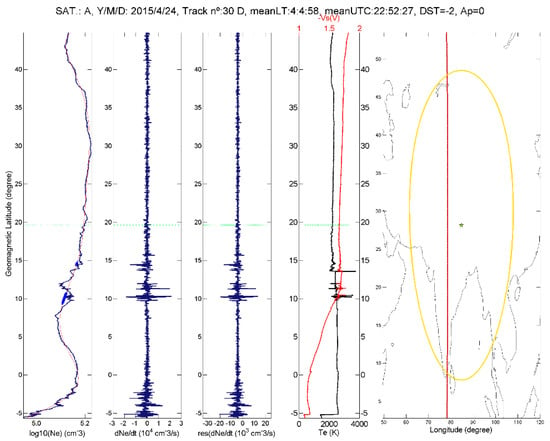
Figure 6.
An anomalous track identified by NeLOG (Sat A, 24 April 2014) on Electron Density Ne before the 25 April 2015 M7.8 Nepal EQ.
Figure 7 reports an electron density anomaly that preceded by about 2 days the 2 March 2016 M7.9 Sumatra EQ. Geomagnetic indices are quite low: Dst = 18 nT, ap = 2 nT and AE = 41 nT. The anomaly is very close to the magnetic equator, showing also the characteristic Equatorial Ionospheric Anomaly (EIA) that usually appears in daytime. From the analysis of these 12 earthquakes, it emerges that this type of equatorial anomalies is sometimes visible. This aspect would require probably a deeper research insight into a future systematic study with a greater number of case studies.
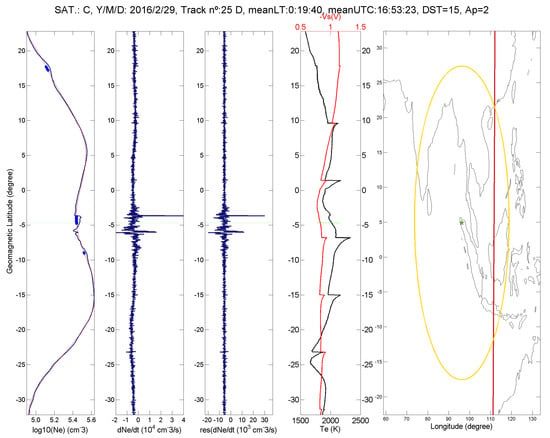
Figure 7.
An anomalous track identified by NeLOG (Sat C, 29 February 2016) on Electron Density Ne before the 2 March 2016 M7.9 Sumatra EQ.
Figure 8 reports the revised analysis performed by NeLOG one month before and one month after the M8.2 1 April 2014 Chile EQ. The threshold is kt = 4.0. It is possible to notice an acceleration in the number of anomalies about 24 days before the earthquake (evidenced by the light blue oval), visible also as the trend in the cumulated number in the first part has a greater slope than in the central part. This acceleration corresponds to about 8 days before the seismic activation of the fault [45] and could be a good candidate for a possible precursor effect. The apparent lack of further anomalies is due to the satellite coverage for the local time selection. The linear fit coefficient R2 (=0.93) is well less than 0.97, which is a good indication for a non-random source of anomalies.
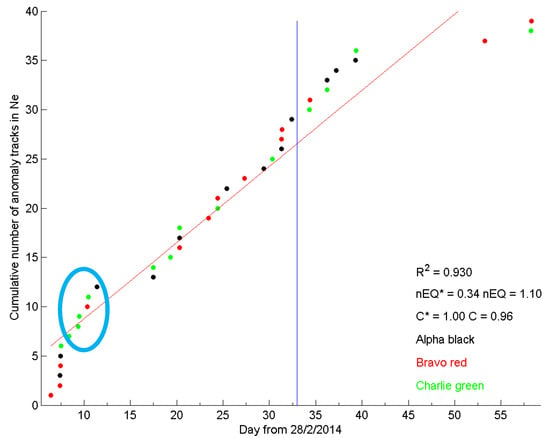
Figure 8.
Cumulative number of anomaly samples detected by NeLOG on Electron Density Ne, one month before and one month after M8.2 1 April 2014 Chile EQ. Threshold is kt = 4.0, the anomalies are selected only with geomagnetic quiet time (|Dst| ≤ 20 nT and ap ≤ 10 nT) and in night time (22 ≤ LT ≤ 6). The cyan oval shows a clear significant increase of electron density anomalies.
Figure 9 presents the NeLOG analysis systematically applied to all the investigated earthquakes. The threshold was selected for each case study, generally higher for large magnitude events and it ranges from kt = 2.0 to kt = 4.0. Red shadowed boxes indicate the time characterized by disturbed geomagnetic conditions that are then discarded for the analysis. Observing the cumulative trends of the abnormal tracks shown in Figure 9, some interesting trends were highlighted in cyan. An interesting feature is the increase in anomalies prior to the earthquake, indicating a possible seismic activation or an increase of the stress along the fault plane.
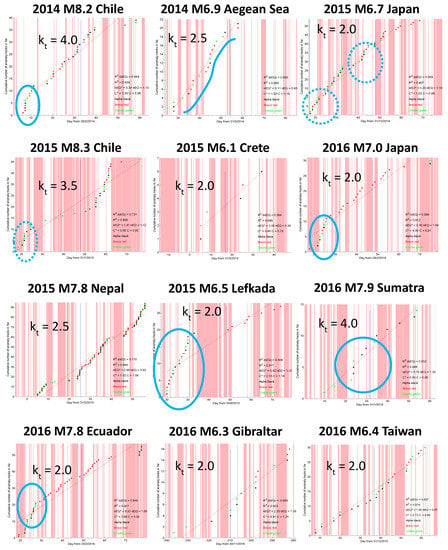
Figure 9.
Cumulative number of anomaly tracks detected by NeLOG on Electron Density Ne, one month before and one month after the 12 earthquakes studied in this paper. The threshold is adjusted for each earthquake. The anomalies are selected only in geomagnetic quiet times (|Dst| ≤ 20 nT), while disturbed magnetic periods are evidenced in pink.
The 1 April 2014 M8.2 Chile, the 15 April 2016 M7.0 Japan, the 17 November 2015 M6.5 Lefkada-Greece and the 16 April 2016 M7.8 Ecuador earthquakes present a sort of increase of anomalies about 25 days before the occurrence of the earthquake. In addition, the 16 September 2015 M8.3 Chile EQ has the same feature, but it is also in the middle of geomagnetically disturbed days, so it is easier to think at a possible external source for these anomalies. In addition, the 16 February 2015 M6.7 Japan earthquake presents some interesting features, but the geomagnetic conditions are too disturbed to make a reasonable hypothesis about the possible origin of these anomalies.
The cases of the 24 April 2014 M6.9 Aegean Sea and the 2 March 2016 M7.9 Sumatra earthquakes seem to have a sigmoidal shape of the cumulative number of electron density anomalous tracks about a week before the mainshocks that is very promising as a seismo-induced ionospheric phenomenon.
For the 17 November 2015 M6.5 Lefkada-Greece earthquake, comparing the two geomagnetically low disturbed periods (20 to 30 and 50 to 60 on abscissa of the corresponding figure), before the earthquake there are many more anomalies than after the earthquake (15 vs. 4). This could be a possible lithosphere-source for some of the pre-earthquake anomalies.
2.3. NeSTAD Results
Figure 10 reports the anomalies found by applying the NeSTAD tagging criteria reported in section Material and Methods. In the figure, nine out of twelve EQ are reported, as in the remaining three cases, no anomalies were tagged. Similarly to what reported in Figure 9 for NeLOG, blue lines indicate the time of the EQ occurrence, while red shadowed boxes indicate the days characterized by disturbed geomagnetic conditions that are discarded.
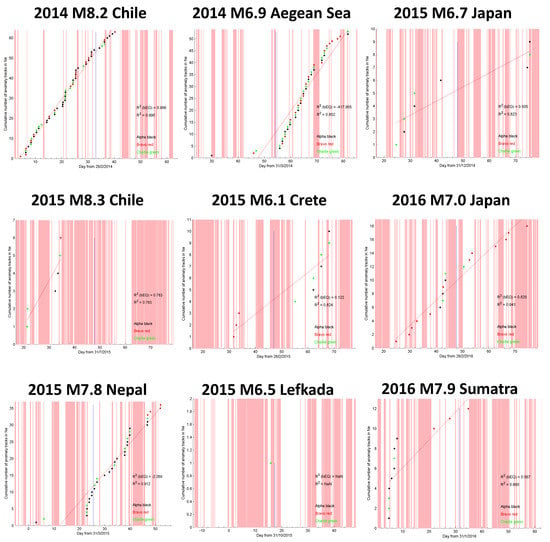
Figure 10.
Cumulative number of anomaly tracks detected by NeSTAD on Electron Density Ne, one month before and one month after nine of the earthquakes studied in this paper (for the other three earthquakes, there are not NeSTAD anomaly tracks). For each earthquake, the best tagging criteria are selected. (Pink periods are those magnetically disturbed).
In most cases, as already noticed for the NeLOG results, the EQs are characterized by disturbed geomagnetic conditions before and after the EQ that may limit the tagging of the LAIC-related anomalies. Bearing this in mind, the most noticeable results are those related to the 2015 M7.8 Nepal EQ and to the 2016 M7.0 Japan EQ. In both cases, an S-shaped pattern of the cumulated number of anomalies is found, mimicking what expected for the evolution of a large earthquake [41]. In particular, for the former a sudden increase in the number of anomalies is found starting from 3 days in advance, while for the latter 7–8 days in advance.
It is also interesting to note the behavior of the cumulative number of anomalies for 2014 M8.2 Chile, characterized by an increase since the beginning of the considered time window and another small increase 3 days before the EQ occurrence. However, in this case the S-shape is not significantly found all over the considered period.
Other ambiguous situations are found for the 2015 earthquakes of Chile M8.3, Japan M6.7 and Crete M6.1, also because their analyses are seriously limited by the geomagnetic conditions right before and after the EQ occurrence. Also for the 2016 Sumatra M7.9, NeSTAD is not able to provide a clear indication: three anomalies from Bravo satellites are found close to the EQ occurrence, two before and 1 after the main shock, while nine occur at the beginning of the considered time window.
Another intriguing feature arises for the case of the 2014 M6.9 Aegean Sea EQ, where a post-seismic meaningful increase of anomalies is identified, while only few (two) are found before the EQ. This is the only case in which such a behaviour is found. We notice that, NeLOG is not reporting a similar behavior, reinforcing the idea that it is strongly related to NeSTAD approach of anomaly tagging.
2.4. Example of Validation
In this section we apply the same automatic algorithms of MASS, NeLOG and NeSTAD to an alternative period of the same seismic region, which is characterized by low seismicity. We will focus on the data observed in the same area of event of Nepal region (EQ occurred on 25 April 2015), in order to validate or confute the results concerning this case.
Figure 11 shows the results obtained applying MASS, NeLOG and NeSTAD algorithms to the magnetic field and electron density satellite data observed in the same area of the 2015 Nepal earthquake, but in a period without particular seismic activity, i.e., June and July 2014. In fact, in this period no shallow (depth ≤ 50 km) M5.5+ earthquakes happened in this area. The above methods are applied with the same conditions and parameters for the real case.
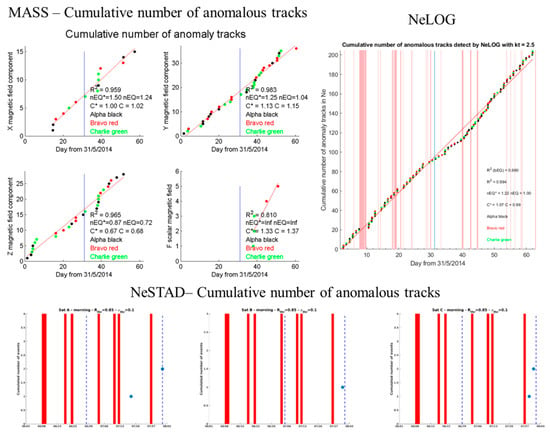
Figure 11.
Results of the MASS, NeLOG and NeSTAD algorithms applied to the area of the 2015 Nepal earthquake but in a period without particular seismic activity, i.e., June and July 2014.
Comparing the real case with this confutation analysis, it is possible to note that the latter does not seem to have special features around the virtual event, i.e., the “false” earthquake. Furthermore, no quality indicator of the Y component of magnetic field passes the check.
2.5. Electron Density and Magnetic Field Concomitant Anomalies
Figure 12 shows a comparison between anomalies in the magnetic field and electron density Ne, by means of MASS algorithm and NeLOG algorithm, respectively. Figure 13 shows the comparison between the tracks of the day before the M7.0 Japan 15 April 2016 earthquake and a track that preceded the earthquake by just 2 h. On 14 April 2016 (the first day) geomagnetic conditions were disturbed (Dst = −38 nT, ap = 39 nT and AE = 805 nT). On the second day (15 April 2016) the geomagnetic conditions are calm (Dst = −3 nT, ap = 6 nT and AE = 59 nT). It is interesting to note that the track, that precedes by 2 h the earthquake, shows (both in magnetic field and electron density) more disturbances than the previous-day track (it is in the same area and at the same local time). We cannot exclude that such effects are a residual of the small magnetic storm, but track 21 may contain an interesting signal of possible lithospheric origin.
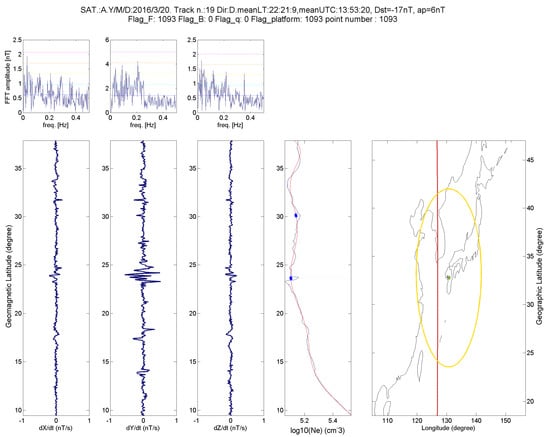
Figure 12.
An anomalous track identified by MASS (Y magnetic component) and NeLOG (Sat Alpha 20 March 2016), 26 days before the 15 April 2016 M7.0 Japan EQ.
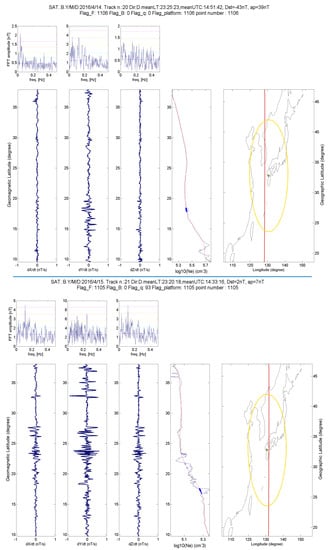
Figure 13.
Comparison between track 20 of Swarm-Bravo satellite on 14 April 2016 (i.e., the day before the 15 April 2016 M7.0 Japan EQ) and track 21 of Swarm-Bravo satellite on 15 April 2016 (i.e., two hours before the earthquake).
As a comparative summary of the capabilities of the three algorithms in detecting LAIC-related anomalies, Table 1 reports the results in detecting an S-shape of the cumulative number of anomalies around the EQ. According to such a table, the 2015 M7.8 Nepal and the 2016 M7.0 Japan EQs are those in which all the three algorithms are successful in identifying an anomaly pattern analogous to that of the cumulative number of earthquakes (see also De Santis et al. [41]).

Table 1.
Summary of the capability of MASS, NeSTAD and NeLOG. “OK!” indicates success in detecting LAIC-related anomalies, “~” indicates no clear indication, while “No” indicates failure in detecting it.
2.6. Possible Lithospheric Origin of the Detected Anomalies
Figure 14 and Figure 15 show the number of anomalous tracks for each case study as calculated by MASS for Y magnetic field (East) component and NeLOG for Ne with a fixed threshold (kt = 2.0) for all case studies, respectively, properly normalized with respect to the all considered quiet tracks, drawn with respect to magnitude. If we fit the points, a reliable linear relation appears with magnitude (continuous line).
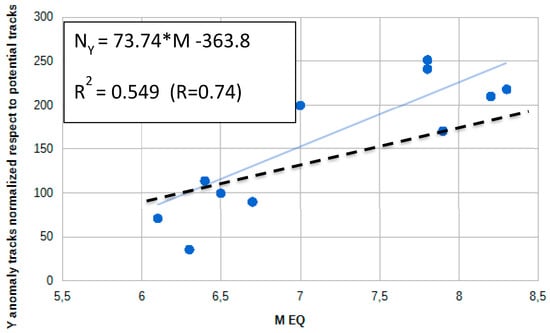
Figure 14.
Number of anomalous tracks in Y magnetic component (NY) with respect to earthquake magnitude as calculated by MASS algorithm. The number of anomaly tracks is normalized with respect to quiet tracks analysed for each specified earthquake. The dashed line indicates the result obtained from a random simulation, once imposed the same first starting point for M6.1. The rate of increase of the random anomalies is less pronounced than that one of real cases.
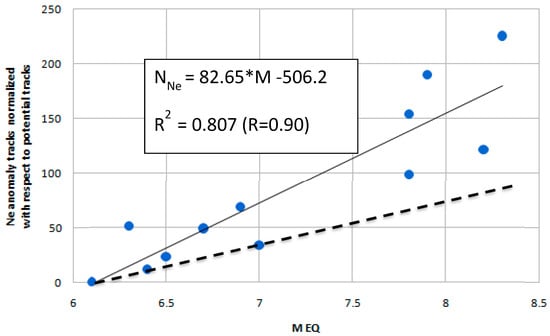
Figure 15.
Number of anomalous tracks for Electron density (NNe) with respect to earthquake magnitude as calculated by NeLOG algorithm. The number of anomaly tracks is normalized with respect to quiet tracks analysed for the specified earthquake. The dashed line indicates the result obtained from a random simulation, once imposed the same first starting point for M6.1. The rate of increase of the random anomalies is less pronounced than that of real cases.
Despite the fact we normalized for the quiet tracks, in these analyses, there could be a bias due to the size of the satellite tracks for different Dobrovolsky’s areas [46] (please see also Materials and Methods for its definition) and different satellite passages (higher magnitude earthquakes have larger Dobrovolsky’s area, so the probability that an anomaly is inside Dobrovolsky’s area by chance is higher). Therefore, we compare the results obtained from real case studies with the corresponding ones obtained from synthetic anomalous tracks (dashed line).
The increase of the anomalies with magnitude is more pronounced than the simulated cases (the continuous line slope is roughly the double for real cases with respect to the random cases, dashed line slope), so it would support the conclusion that in the most conservative hypothesis at least the half of the identified anomalies are likely of seismic origin.
3. Discussion and Conclusions
In this work, we were not interested in earthquake prediction, rather in confirming the existence of pre-earthquake anomalies in satellite data. We analysed the magnetic field and the electron density of the ionosphere as observed by Swarm satellites in correspondence of 30 days before and 30 days after the occurrences of twelve EQs with magnitude from 6.1 to 8.3, in the period 2014–2016, i.e., in practice during the first two and half years of the Swarm satellite mission.
To exclude the external sources for ionospheric disturbances we selected only geomagnetic quiet time for all the used approaches in magnetic and electron density analyses. Nevertheless, this selection is necessary to reduce the analysed time and so it decreases the probability to detect an anomaly from satellite that is also limited by orbital conditions, i.e., to be able to detect a disturbance in ionosphere the satellite needs to pass in the right moment above the epicentral area.
Despite this, in general, most of the analysed EQs show some precursory anomalies in the ionospheric magnetic field and electron density. In some cases, the anomalous behaviour is more pronounced, while, in others, it is weak and in a wide number of the analyzed case studies, we have been able to identified a S-shape behavior, probably linked to the seismic event in one or more of the presented methods.
Overall, the anomalous tracks present a dependence with magnitude, increasing their number with the increase of EQ magnitude, being also the double with respect to a random simulation, pointing to a LAIC effect preceding most, or even all, the events here studied and confirming that at least M6+ shallow earthquakes could produce a disturbance in ionosphere before their occurrence.
4. Materials and Methods
4.1. Swarm Magnetic Field and Plasma Datasets
Swarm is a constellation of three ESA twin quasi-polar orbiting satellites, launched on 22 November 2013 and mainly dedicated to the study of the Earth’s magnetic field. Its configuration is specially designed: two satellites (Alpha and Charlie) orbit side-by-side at an initial altitude of 460 km, decaying naturally to lower altitudes; the third satellite (Bravo) orbits at about 530 km [47]. Onboard each satellite, there is a variety of instruments to analyze the ionosphere in situ: magnetometers, electric field instruments, accelerometers, retroreflectors and Global Navigation Satellite System receivers operating in Precise Orbit Determination (POD) configuration. In this paper, we analyze systematically the magnetic field data measured by the two magnetometers and the plasma parameters measured by the two Langmuir probes on-board each Swarm spacecraft. In detail:
- a)
- Vector field magnetometer (VFM). It is a fluxgate magnetometer with a Compact Spherical Coil sensor, similar to the previous missions Oersted, CHAMP and SAC-C. The VFM data are provided at two time resolutions, High-Rate (HR, 50 Hz) and Low-Rate (LR, 1 Hz). The values of the geomagnetic field components are given in spherical coordinates (colatitude, latitude and radial distant) referred to the NEC (North, East, Center) frame and the time UTC. In this work we will use the Low-Rate (1 Hz) data.
- b)
- Absolute Scalar Magnetometer (ASM). It is based on the Electron Spin Resonance (ESR) principle using the Zeeman effect. The main objective of ASM is to calibrate the vector data. The instrument is located at the end of the boom, around 2 m distant from the VFM instrument. The ASM data are provided at 1 Hz rate.
- c)
- Langmuir probe (LP). It determines the local properties of the plasma, such as temperature and density by measuring the collected current due to electrons and ions. In this paper, LP electron density, electron temperature and spacecraft potential data, stored in Swarm L1B EFIx_PL_1B product, are used. This kind of data is not the most updated, but for our purposes, they are adequate, because the variations are important, and not their absolute values. Data are provided at 2 Hz rate.
The Swarm L1B data available at Swarm Dissemination server (ftp://swarm-diss.eo.esa.int) are used for this study (see the “Swarm-L1b-Product-Definition” document for more details [48]). Please note that for Charlie satellite, no ASM (scalar) data are available from 5th November 2014 (19:37 UTC) due to a technical problem. In this paper, the total intensity for Charlie satellite is computed from vector components of VFM.
The electron density and electron temperature have been provided by the original Swarm Electric Field Instrument data L1b (EFI) product or by Advanced - Provisional Plasma dataset. All the L1b data are provided by ESA in CDF data format.
The flag field is a quality flag and the possible values are expressed by means of an integer 8 bit number (see for details SWARM-GSEG-EOPG-TN-15-003_Plasma_Dataset_User_Note.pdf). To our scope, when bit 6 and 7 are both set (<0.1% of all data) Te and Ve data should be discarded, but this does not apply to Ne data. If bit 8 is set, data (Ne, Te, Vs) can be optionally discarded or replaced by interpolated data.
The electron density Ne is the main parameter here used for the ionospheric characterization of the seismic events. We let the reader notice that Ne is provided without calibration by ESA. According to a first quick comparison carried out by ESA with other independent measurements and models, the current values are up to a few 10% too high at low density (https://earth.esa.int/web/guest/missions/esa-eo-missions/swarm/data-handbook/preliminary-level-1b-plasma-dataset). Possible calibration can be achieved by relying on independent measurements of the in-situ plasma density, like those from Incoherent Scattering Radars, which are out of the scope of this paper. However, for the purposes of our work, Ne calibration is not an issue as we focus on Ne variations possibly related to EQ events.
4.2. Earthquakes Selection: The 12 Case Studies
The main criterion for the EQ selection is its occurrence after the launch of the Swarm constellation until 2016, the completion of the SAFE project. Each selected EQ is characterized by magnitude, depth, localization (latitude and sea/land). The used catalog is that from USGS [49]. In addition, geomagnetic conditions characterizing the days before and after the EQ are taken into account. Geomagnetic conditions are provided in terms of the Dst and ap indices [50] as provided by the Word Data Centre for Geomagnetism, Kyoto University, Japan [51].
The shallow earthquakes (depth < 40 km) occurred in Mediterranean region with M6+ and worldwide with M7+ are taken into account for the final choice within the framework of the SAFE Project. In particular, we do not consider earthquakes occurred at high magnetic latitudes or very close to the magnetic equator, in order to be as far as possible from geographical sectors in which the ionosphere is more exposed to the formation of ionospheric irregularities not related to LAIC, that may overwhelm the detection of those LAIC-triggered. We selected the earthquakes with higher magnitude, as we expect that such events could produce some detectable effects to the ionosphere.
Table 2 reports the selected events, in terms of location, geographic coordinates of the epicenter, time information, magnitude and depth. Other more information can be found in SAFE Project’s website [52].

Table 2.
List of the selected earthquakes ordered with decreasing magnitude for this paper.
4.3. Description of the Algorithms
To our scope, we apply three algorithms (MASS, NeLOG and NeSTAD, definitions below) to search for different types of anomalies on magnetic field and electron density data. MASS algorithm is dedicated to magnetic field satellite data analysis; NeLOG and NeSTAD are dedicated to the analysis of electron density satellite data: the former is able to detected slower anomalies, the latter is more restrictive and dedicate to more rapid anomalies. In some cases, a satellite track contains each type of anomalies, in other cases only one type or nothing. All three algorithms share the same philosophy: the background used to identify the anomaly is chosen track by track, in a way that all the methods are not affected by model choice and its possible imperfections.
4.3.1. MASS Algorithm
The MAgnetic Swarm anomaly detection by Spline analysis (MASS) algorithm searches for anomalies on magnetic data for each individual Swarm satellite track. The steps are as follows:
We first extract from the original CDF file only the used columns by different routines. The final file will contain additional information including the type of satellite, i.e., A for Alpha, B for Bravo, and C for Charlie, the number of track (a semi-orbit), the data quality flags, the times UTC and Local Time (LT).
We also transform the geographic latitude into geomagnetic latitude using the IGRF position of North geomagnetic Pole. For the files at 1 Hz of time resolution (Low Resolution), we use both vector and scalar information from the VFM and ASM magnetometers, respectively. For Charlie satellite, the intensity of magnetic field is calculated from VFM data, as the ASM on board this satellite was switched off for problems after launch.
The second step is to associate the time of the track with the corresponding geomagnetic Dst and ap indices. In this case, we adapt different routines to select the correct geomagnetic index at the same time (every hour for Dst and every 3 h for the ap) of that reported in the different satellite tracks.
The data processing involves not only the selection of the Swarm magnetic data into the Dobrovolsky’s area, but also other data to take into account any possible influence of the external magnetic fields. The Dobrovolsky’s area is a circular region with a radius RDb that scales with the magnitude M, i.e., RDb (km) = 100.43M [46], and it is considered a good approximation for the preparation region of the EQ (e.g., [53,54]).
For each individual track, the main goal is the detection and identification of single anomalies, i.e., an unusual behaviour with respect to the typical trend of the considered magnetic data. This anomaly can be defined by visual techniques or taking into account the root mean squares (RMS) of the residual of the whole orbital track, between −50° and + 50° geomagnetic latitude (or a smaller section of the track), to avoid typical disturbances at high latitudes. In our case, we developed and adapted different routines including different approaches to treat the magnetic data. The synthetic scheme of work was as follows:
- -
- To use a routine to analyse the satellite tracks and to separate them according to the local time. In a first attempt, the tracks with local time between 6 am and 10 pm were not used due to the influence of the external field, which increases in daytimes. After several night-time analyses, the study has been then extended to all daytime, too.
- -
- The first time derivative (in terms of first differences) is applied for each track in order to extract more information from the magnetic data, since in this way we remove part of the long trend and highlight the possible anomalies.
- -
- We remove the remaining long trend using a fitting by cubic splines. We choose the correct damping parameter and knot points for the splines in order to remove in a correct way the long spatial or temporal wavelengths of the magnetic data along the selected track.
- -
- Then, we apply the fitting to different geomagnetic field elements: the three orthogonal components X, Y, Z and the intensity F.
- -
- Finally and using the best fitting we analyse the residuals looking for a possible anomaly.
An automatic search of anomalies is then performed. The track is then analysed by small moving windows of 3.0° (or different size) latitude width. It computes the root mean squares in this window (rms) and compares it with the RMS of the whole track. The algorithm produces an output file with one line for each analysed track. In each line of the file there is the time, satellite, track number (semi-orbit, ~32 total number of tracks in a day) and the indication of how many windows have rms > RMS * kt for each magnetic field component and for the absolute scalar intensity of magnetic field. The value of kt is the chosen threshold (normally in the range kt = 2–4). The anomaly windows are counted only if the window centre is in the Dobrovolsky’s area and geomagnetic conditions are quiet (generally |Dst| ≤ 20 nT and ap ≤ 10 nT as used in this work, but the algorithm would allow the selection and use of different limits). Next to the number of anomalous windows in this file is also reported the number of windows that could potentially be anomalous (so they are inside the Dobrovolsky’s area and in quiet geomagnetic conditions).
The output file is manually and automatically analysed for each magnetic field component at a time, extracting only those tracks that have one or more anomalous windows. Some more advanced techniques can be applied to identify patterns of a sequence of anomalies in terms of cumulative operations (e.g., [41]).
4.3.2. NeLOG Algorithm
The input data of LOGarithm of electron density Ne (NeLOG) is provided by the original Swarm Electric Field Instrument data at 2 Hz (Provisional/Advanced Plasma Dataset). For each event, the electron density Ne, the electron temperature Te and the spacecraft potential Vs are selected 1 month before and 1 month after the day of the main shock. This is to find different patterns during the preparation phase of the EQ event and the aftershock period.
NeLOG selects the satellite tracks in Dobrovolsky’s area +/− 5° outside and with mean Local Time between 10 pm and 6 am. The night-time is selected to avoid disturbance from diurnal ionospheric activity (as Equatorial Ionospheric Anomaly). Then, the algorithm produces a geographic representation of area, epicenter and Dobrovolsky’s circle, compared with the plot of decimal logarithm of electron density (we analyse the electron density because, among the plasma quantities, it is the only measured value analysed in a systematic way as it is less sensitive to instrumental calibration errors). The decimal logarithm of electron density is then fitted by a 10-degree polynomial. This degree is selected as the best choice as compromise between a low rms of residuals and a not too high polynomial degree.
The fit is performed within minimum and maximum Dobrovolsky’s latitude (regardless of the longitude) +/− 5°. The calculation of the RMS (quadratic residual between satellite track and polynomial fit) is performed within minimum and maximum Dobrovolsky’s latitude. The last 5° of fit are then cut to avoid the fitting edge errors.
In the output graph, if the residual of a sample is > threshold kt * RMS, a blue star is inserted on the satellite track to mark the point as anomaly.
A track is selected as anomalous if it has more than 10 anomalous samples in the Dobrovolsky’s area and geomagnetic indices are quiet (generally, |Dst| ≤ 20 nT and ap ≤ 10 nT, but other limits could be chosen).
The analysis is performed for all three satellites of the Swarm constellation: Alpha, Bravo and Charlie. Finally, a cumulative graph of all the anomalous tracks (i.e., the ones that have at least 10 anomalous samples) is plotted along with some statistical indicators to objectively evaluate the performed analysis.
4.3.3. NeSTAD Algorithm
The Ne Single Track Anomaly Detection (NeSTAD) algorithm has been developed with the aim of tagging anomalies of in-situ electron density (Ne), as measured by the Swarm Langmuir Probe instrument. NeSTAD is able to assign to each track, i.e., a portion of Swarm data covering a region of interest in a given time interval, some “anomaly parameters”, that identify the behaviour of Ne as “anomalous” or not. The anomaly parameters can be then used to define criteria to tag anomalies of interest for the SAFE purposes. NeSTAD is fed with the following data input:
- Swarm Langmuir Probe data: Swarm EFIx_PL (and Plasma Preliminary);
- Swarm Level 2 Ionospheric Bubble Index (IBI, Park et al. [55]);
- Dst index.
In addition, NeSTAD requires as input the geographical and time ranges over which Ne data of the given Swarm satellite are analysed. The time range is expressed in days before and after a given day, that it is typically the day of a selected EQ event. The geographical range can be selected in two ways:
- 1)
- Manually selecting the boundaries in terms of minimum and maximum values of latitude and longitude
- 2)
- Selecting the center of the geographical range, i.e., the longitude-latitude coordinates (λ0, ϕ0), of the epicentre of a selected EQ, from which the geographical range is:
- Longitudinal extent = λ0 ± RDb (1 + ε);
- Latitudinal extent = Latitude = ϕ0 ± RDb (1 + ε);
where ε is the “excess area parameter” and it is user defined (default value is 0.1). In order to avoid large electron density gradients, found in the high latitude ionosphere, latitudes > 60° N and < 60° S are not considered, independently of the geographical range selection.
For each track in the geographical and time ranges, the following quantity is evaluated for each i-th time interval along the track:
A distribution of is then obtained for each track. A veto from IBI data is the applied on this distribution to remove from the distribution the contribution identified as being due to equatorial plasma bubbles (EPBs). EPBs are steep electron density depletions elongated on the magnetic field lines at low-latitudes whose occurrence maximizes in correspondence with the expected position of the crests of the EIA and during the hours after the local sunset [56]. They can be detected by in-situ measurements of the plasma density from Swarm (see, e.g., [30,31,57,58]). As they appear as steep Ne variations, the veto from IBI data allows to reduce the risk to misidentify an EQ-related anomaly with those due to EPBs.
To apply the veto from IBI data on distribution, all the i-th values of in correspondence of which IBI(ti) is found to be 1, i.e., identified as a plasma bubble event, are discarded. Values corresponding to IBI(ti) =0 are conversely kept in the distribution. This enables removing the contribution due to the presence of the EPBs and then excluding from the anomaly tagging those related to the electron density gradients embedded in the EPBs.
The quantity is able to identify steep variations in the electron density time profile, behaving like a high-pass filter on the electron density data. The distribution is then used to identify outliers. The outliers of the track are identified through an outliers analysis made on the distribution of , by means of the general theory of statistical data analysis, without any a priori physical assumption.
According to the general theory of statistical data analysis [59], most values of the distribution of a physical quantity are expected to fall in the inter-quartile range (IQR) that is the distance between the 1st and the 3rd quartile. For double tail distributions, as that of is, the outliers are identified by the values lying above Q3 + k ∙IQR and below Q1 - k ∙IQR, where Q1 and Q3 are the 1st and 3rd quartile, respectively. The parameter k is the factor for determining the threshold for outliers and in the literature, k=1.5 identifies the “mild” outliers, while k=3 identifies the “strong” outliers. The outlier k parameter is one of the selectable features of the NeSTAD (default value is 1.5, i.e., mild outliers identification).
The outliers of are then filtered out to obtain a filtered track and the following parameters, “track anomaly parameters”, are derived:
- : percentage difference between the maximum of the filtered () and of the original track ().
- σ: standard deviation of the distribution of the filtered track
- %: percentage of outliers identified in the track.
Figure 16 shows an example of NeSTAD analysis on a track recorded for Swarm B on 15 May 2014. This is extracted from the analysis of the Northern Aegean Sea EQ (M6.9) occurred on 24 May 2014. Left panel reports the electron density as a function of the latitude. The text above the plot indicates the Universal and Local Times of first and last point of the track. Between left and right panels, a blue arrow indicates the direction of the satellite. Red curve in the middle panel reports the data prior the outlier analysis, while black curve reports it after the outliers filtering procedure. Anomaly parameters R, σ and % are reported in the top part of the middle panel. Right panel reports the electron density (in cm−3) as a function of the latitude and longitude of the track, over the geographical range defined by the epicenter (red cross) of the EQ. The dark red circle represents the Dobrovolsky’s area of the EQ. The orange lines represent the position of the dip equator and the isoclinic lines at ±15° and ±20°, i.e., the expected position of the crests of the EIA. In the upper part of the figure, the satellite, the date (format: YYYYMMDD) and a flag indicating the Dst conditions of the UT day are also reported. By following what reported in Cander and Mihajlovic [60], the geomagnetic conditions of the UT day are selected according to the minimum peak reached by the Dst index in the UT day. Such conditions are summarized in Table 3.
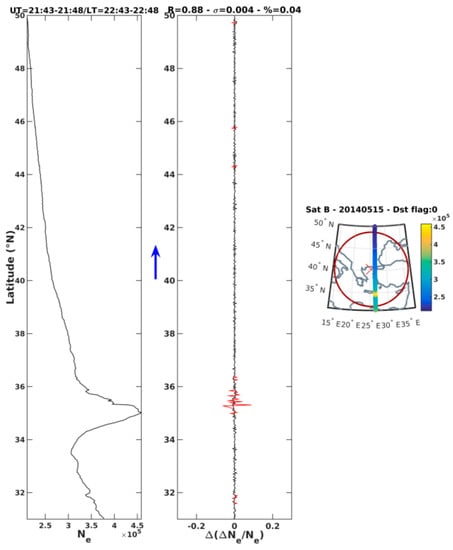
Figure 16.
Example of NeSTAD analysis on a track recorded for Swarm B on 15 May 2014.

Table 3.
Table of the geomagnetic conditions and corresponding Dst flags.
Figure 17 shows an example of NeSTAD analysis on a track in which IBI index identifies some part of the track related to plasma bubbles (purple portion of the curve in the left and right panels). Portion of the track in which plasma bubbles are involved is removed from the outliers analysis, as shown in the middle panel.
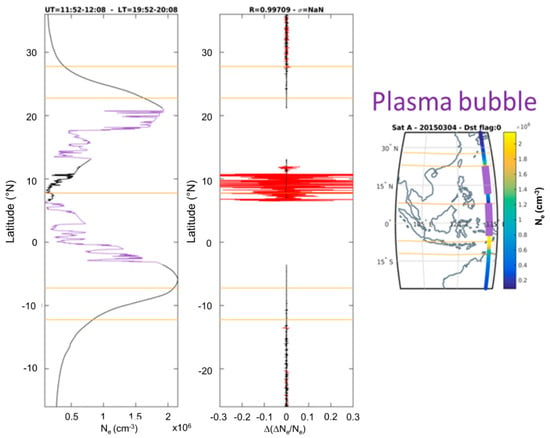
Figure 17.
Example of NeSTAD analysis on a track in which IBI index identifies some part of the track related to plasma bubbles (purple portion of the curve in the left and right panels). Portion of the track in which plasma bubbles are involved is removed by means of the outliers analysis, as shown in the middle panel.
Summarizing, the NeSTAD is able to provide anomaly parameters (i.e., R, σ and %) upon which tagging criteria can be applied to tag track anomalies possibly related to LAIC. Tagging algorithm based on NeSTAD output and selection criteria used in the frame of SAFE are described in the section Results.
The default values of the following parameters have been used to perform the analysis of the selected events:
- Days before the event = 30
- Days after the event = 30
- Outliers k = 1.5 – mild outliers
Anomaly parameters evaluated by NeSTAD are used to tag anomalies on track-by-track basis as being possibly related to LAIC events. Tagging criteria have been adopted with the aim of minimizing the effect due to the external forcing leading to misidentified LAIC anomalies, as follows:
- Case events at low latitudes
- R > Rthr = 0.85 i.e., only the strongly identified anomalies are taken into account, and standard deviation of the filtered track below σthr = 0.1 or standard deviation of the filtered track above σthr = 0.1 independently on R value.
- Morning tracks (02-06 LT), to remove the impact of the equatorial fountain during the day and to minimize the impact of the plasma bubble formation during night-time
- Case events at mid latitudes
- Rthr = 0.7 and standard deviation of the filtered track below σthr = 0.1 or standard deviation of the filtered track above σthr = 0.1 independently of the R value.
- Night time tracks (18 to 06 LT), because during night time and at mid latitudes the ionosphere is expected to be less turbulent.
- In both cases quiet ionospheric conditions (Dst flag = 0, i.e., absolute value of Dst in the considered day not exceeding 20 nT) are required.
The result of the tagging criteria application is provided in terms of the cumulative frequency of the tagged anomalies (see Results section).
Author Contributions
Conceptualization, A.D.S.(Angelo De Santis), L.P., R.D.G. and G.D.F.; Methodology, A.D.S.(Angelo De Santis); Software, F.J.P.C., D.M., L.S., G.C., A.I. and A.D.S.(Anna De Santis); Validation, D.M. and L.S.; Formal Analysis, F.J.P.C., L.S. and D.M.; Investigation, A.D.S.(Angelo De Santis), D.M., D.S., E.Q. and L.S.; Resources, A.D.S.(Angelo De Santis), L.P., G.D.F.; Data Curation, D.M., S.A.C., L.S. and A.P.; Writing–Original Draft Preparation, A.D.S.(Angelo De Santis), D.M., S.A.C.; Writing–Review & Editing, all authors; Visualization, D.M., L.S. and A.D.S.(Anna De Santis); Supervision, A.D.S.(Angelo De Santis), L.P., R.D.G., C.C.; Project Administration, E.Q., L.A., M.C., F.S., C.A. and D.D.; Funding Acquisition, A.D.S.(Angelo De Santis) and C.A.
Funding
This research was funded by the European Space Agency (ESA) grant number 4000113862/15/NL/MP and Italian Space Agency (ASI) grant number CUP F12F16000110005 and the APC was funded by Istituto Nazionale di Geofisica eVulcanologia (INGV).
Acknowledgments
We greatly thank the ESA officer assigned to SAFE project, Roger Haagmans, who supervised and motivated many specific choices in the scientific research directions. Also the ASI officer, Simona Zoffoli, is thanked for her energetic impulses at several stages of the LIMADOU-Science Project.
Conflicts of Interest
The authors declare that they have not conflicts of interest.
References
- Rawer, K. Wave Propagation in the Ionosphere; Springer: Dordrecht, The Netherlands, 1993. [Google Scholar]
- Kelley, M.C. The Earth’s Ionosphere: Plasma Physics and Electrodynamics (Vol. 96); Academic press: Cambridge, MA, USA, 2009. [Google Scholar]
- Hargreaves, J.K. The Solar-Terrestrial Environment: An Introduction to Geospace-the Science of the Terrestrial Upper Atmosphere, Ionosphere, and Magnetosphere; Cambridge University Press: Cambridge, UK, 1992. [Google Scholar]
- Laštovička, J. Forcing of the ionosphere by waves from below. J. Atmos. Sol-Terr. Phys. 2006, 3–5, 479–497. [Google Scholar] [CrossRef]
- Immel, T.J.; Mende, S.B.; Hagan, M.E.; Kintner, P.M.; England, S.L. Evidence of tropospheric effects on the ionosphere. Eos Trans. Am. Geophys. Union 2009, 9, 69–70. [Google Scholar] [CrossRef]
- Zettergren, M.D.; Snively, J.B. Ionospheric signatures of acoustic waves generated by transient tropospheric forcing. Geophys. Res. Lett. 2013, 20, 5345–5349. [Google Scholar] [CrossRef]
- Cesaroni, C.; Alfonsi, L.; Pezzopane, M.; Martinis, C.; Baumgardner, J.; Wroten, J.; Umbriaco, G. The first use of coordinated ionospheric radio and optical observations over Italy: Convergence of high-and low-latitude storm-induced effects. J. Geophys. Res. Space Phys. 2017, 11, 11,794–11,806. [Google Scholar] [CrossRef]
- Pulinets, S.A.; Boyarchuk, K.A. Ionospheric Precursors of Earthquakes; Springer Verlag: Berlin, Germany, 2004. [Google Scholar]
- Piša, D.; Nĕmec, F.; Santolik, O.; Parrot, M.; Rycroft, M. Additional attenuation of natural VLF electromagnetic waves observed by the DEMETER spacecraft resulting from preseismic activity. J. Geophys. Res. Space Phys. 2013, 118, 5286–5295. [Google Scholar] [CrossRef]
- De Santis, A.; Franceschi, De G.; Spogli, L.; Perrone, L.; Alfonsi, L.; Qamili, E.; Cianchini, G.; Di Giovambattista, R..; Salvi, S.; Filippi, E.; et al. Geospace perturbations induced by the Earth: The state of the art and future trends. Phys. Chem. Earth Parts A/B/C 2015, 85–86, 17–33. [Google Scholar] [CrossRef]
- Maruyama, T.; Tsugawa, T.; Kato, H.; Saito, A.; Otsuka, Y.; Nishioka, M. Ionospheric multiple stratifications and irregularities induced by the 2011 off the Pacific coast of Tohoku Earthquake. Earth Planets Space 2011, 7, 65. [Google Scholar] [CrossRef]
- Liu, J.Y.; Chen, C.H.; Lin, C.H.; Tsai, H.F.; Chen, C.H.; Kamogawa, M. Ionospheric disturbances triggered by the 11 March 2011 M9.0 Tohoku earthquake. J. Geophys Res. Space Phys. 2011, 116, A06319. [Google Scholar] [CrossRef]
- Freund, F.T. Pre-earthquake signals: Underlying physical processes. J. Asian Earth Sci. 2011, 41, 383–400. [Google Scholar] [CrossRef]
- Pulinets, S.A.; Ouzounov, O. Lithosphere–Atmosphere–Ionosphere Coupling (LAIC) model. An unified concept for earthquake precursors validation. J. Asian Earth Sci. 2011, 41, 371–382. [Google Scholar] [CrossRef]
- Breiner, S. Piezomagnetic effect at the time of local earthquakes. Nature 1964, 202, 790–791. [Google Scholar] [CrossRef]
- Moore, G.V. Magnetic disturbance preceding the 1964 Alaska earthquake. Nature 1964, 203, 508–509. [Google Scholar] [CrossRef]
- Stacey, F.D. Seismo-magnetic effect and the possibility of forecasting earthquakes. Nature 1963, 200, 1083. [Google Scholar] [CrossRef]
- Fraser-Smith, A.C.; Bernardi, A.; McGill, P.R.; Ladd, M.E.; Helliwell, R.A.; Villard, O.G. Low-frequency magnetic field measurements near the epicenter of the Ms 7.1 Loma Prieta earthquake. Geophys. Res. Lett. 1990, 17, 1465–1468. [Google Scholar] [CrossRef]
- Molchanov, O.A.; Kopytenko, Yu.A.; Voronov, P.M.; Kopytenko, E.A.; Matiashvili, T.G.; Fraser-Smith, A.C.; Bernardi, A. Results of ULF magnetic field measurements near the epicenters of the Spitak (Ms = 6.9) and Loma Prieta (Ms = 7.1) earthquakes: Comparative analysis. Geophys. Res. Lett. 1992, 19, 1495–1498. [Google Scholar] [CrossRef]
- Donner, R.V.; Potirakis, S.M.; Balasis, G.; Eftaxias, K.; Kurths, J. Temporal correlation patterns in pre-seismic electromagnetic emissions reveal distinct complexity profiles prior to major earthquakes. Phys. Chem. Earth Parts A/B/C 2015, 86, 44–55. [Google Scholar] [CrossRef]
- Gaffet, S.; Guglielmi, Y.; Virieux, J.; Waysand, G.; Chwala, A.; Stolz, R.; Emblanch, C.; Auguste, M.; Boyer, D.; Cavaillou, A. Simultaneous seismic and magnetic measurements in the Low-Noise Underground Laboratory (LSBB) of Rustrel, France, during the 2001 January 26 Indian earthquake. Geophys. J. Int. 2003, 155, 981–990. [Google Scholar] [CrossRef]
- Larkina, V.I.; Nalivayko, A.V.; Gershenzon, N.I.; Gokhberg, M.; Liperovskiy, V.A.; Shalimov, S.L. Observation of VLF emission, related with seismic activity, on the Interkosmos-19 satellite. Geomagn. Aeron. 1984, 23, 684–687. [Google Scholar]
- Hayakawa, M.; Kawate, R.; Molchanov, O.A.; Yumoto, K. Results of ultra-low frequency magnetic field measurements during the Guam earthquake of 8 August 1993. Geophys. Res. Lett. 1996, 3, 241–244. [Google Scholar] [CrossRef]
- Galperin, Yu. I.; Hayakawa, M. On the Magnetospheric Effects of Experimental Ground Explosions Observed from AUREOL-3. J. Geomagn. Geoelectr. 1996, 48, 1241. [Google Scholar] [CrossRef]
- Parrot, M. Use of satellites to detect seismo-electromagnetic effects. Adv. Space Res. 1995, 15, 27–35. [Google Scholar] [CrossRef]
- Johnston, M.J.S. Review of electric and magnetic fields accompanying seismic and volcanic activity. Surv. Geophys. 1997, 18, 441–475. [Google Scholar] [CrossRef]
- Zlotnicki, J.; Nisida, Y. Review of morphological insights of self-potential anomalies on volcano. Surv. Geophys. 2003, 24, 291–338. [Google Scholar] [CrossRef]
- Eftaxias, K.; Contoyiannis, Y.; Balasis, G.; Karamanos, K.; Kopanas, J.; Antonopoulos, G.; Koulouras, G.; Nomicos, C. Evidence of fractional-Brownian-motion-type asperity model for earthquake generation in candidate pre-seismic electromagnetic emissions. Nat. Hazards Earth Syst. Sci. 2008, 8, 657–669. [Google Scholar] [CrossRef]
- Finkelstein, M.; Price, C.; Eppelbaum, L. Is the geodynamic process in preparation of strong earthquakes reflected in the geomagnetic field? J. Geophys. Eng. 2012, 9, 585–594. [Google Scholar] [CrossRef]
- Balasis, G.; Daglis, I.A.; Georgiou, M.; Papadimitriou, C.; Haagmans, R. Magnetospheric ULF wave studies in the frame of Swarm mission: A time-frequency analysis tool for automated detection of pulsations in magnetic and electric field observations. Earth Planet. Space 2013, 11, 18. [Google Scholar] [CrossRef]
- Balasis, G.; Papadimitriou, C.; Boutsi, A.Z. Ionospheric response to solar and interplanetary disturbances: A Swarm perspective. Philos. Trans. R. Soc. A 2019, 2148. [Google Scholar] [CrossRef]
- Balasis, G.; Mandea, M. Can electromagnetic disturbances related to the recent great earthquakes be detected by satellite magnetometers? Tectonophysics 2007, 431, 173–195. [Google Scholar] [CrossRef]
- Mandea, M.; Balasis, G. The SGR 1806-20 magnetar signature on the Earth’s magnetic field. Geophys. J. Int. 2006, 2, 586–591. [Google Scholar] [CrossRef]
- Ryu, K.; Chae, J.S.; Lee, E.; Parrot, M. Fluctuations in the ionosphere related to Honshu Twin Large Earthquakes of September 2004 observed by the DEMETER and CHAMP satellites. J. Atmos. Sol-Terr. Phys. 2014, 121, 110–122. [Google Scholar] [CrossRef]
- Ryu, K.; Parrot, M.; Kim, S.G.; Jeong, K.S.; Chae, J.S.; Pulinets, S.; Oyama, K.I. Suspected seismo-ionospheric coupling observed by satellite measurements and GPS TEC related to the M7.9 Wenchuan earthquake of 12 May 2008. J. Geophys. Res. Space Phys. 2014, 12, 10–305. [Google Scholar] [CrossRef]
- Ryu, K.; Oyama, K.I.; Bankov, L.; Chen, C.H.; Devi, M.; Liu, H.; Liu, J.Y. Precursory enhancement of EIA in the morning sector: Contribution from mid-latitude large earthquakes in the north-east Asian region. Adv. Space Res. 2016, 57, 268–280. [Google Scholar] [CrossRef]
- Wang, Y.D.; Pi, D.C.; Zhang, X.M.; Shen, X.H. Seismo-ionospheric precursory anomalies detection from DEMETER satellite data based on data mining. Nat. Hazards 2015, 76, 823–837. [Google Scholar] [CrossRef]
- Akhoondzadeh, M. Ant Colony Optimization detects anomalous aerosol variations associated with the Chile earthquake of 27 February 2010. Adv. Space Res. 2015, 55, 1754–1763. [Google Scholar] [CrossRef]
- Hazra, P.; Islam, T. Proton Density Variation in Ionosphere Before Strong Earthquake Using GOES-15 Data. In Computational Advancement in Communication Circuits and Systems; Maharatna, K., Dalapati, G., Banerjee, P., Mallick, A., Mukherjee, M., Eds.; Lecture Notes in Electrical Engineering, Vol 335; Springer: New Delhi, India, 2015. [Google Scholar]
- Akhoondzadeh, M.; De Santis, A.; Marchetti, D.; Piscini, A.; Cianchini, G. Multi precursors analysis associated with the powerful Ecuador (MW=7.8) earthquake of 16 April 2016 using Swarm satellites data in conjunction with other multi-platform satellite and ground data. Adv. Space Res. 2018, 61, 248–263. [Google Scholar] [CrossRef]
- De Santis, A.; Balasis, G.; Pavón-Carrasco, F.J.; Cianchini, G.; Mandea, M. Potential earthquake precursory pattern from space: The 2015 Nepal event as seen by magnetic Swarm satellites. Earth Planet. Sci. Lett. 2017, 461, 119–126. [Google Scholar] [CrossRef]
- Marchetti, D.; Akhoondzadeh, M. Analysis of Swarm satellites data showing seismo-ionospheric anomalies around the time of the strong Mexico (Mw=8.2) earthquake of 08 September 2017. Adv. Space Res. 2018, 62, 614–623. [Google Scholar] [CrossRef]
- Akhoondzadeh, M.; De Santis, A.; Marchetti, D.; Piscini, A.; Jin, S. Anomalous seismo-LAI variations potentially associated with the 2017 Mw=7.3 Sarpol-e Zahab (Iran) earthquake from Swarm satellites, GPS TEC and climatological data. Adv. Space Res. 2019, 64, 143–158. [Google Scholar] [CrossRef]
- Marchetti, D.; De Santis, A.; D’Arcangelo, S.; Poggio, F.; Jin, S.; Piscini, A.; Campuzano, S.A. Magnetic Field and Electron Density Anomalies from Swarm Satellites Preceding the Major Earthquakes of the 2016–2017 Amatrice-Norcia (Central Italy) Seismic Sequence. Pure Appl. Geophs. 2019, in press. [Google Scholar] [CrossRef]
- Lay, T.; Yue, H.; Brodsky, E.E.; An, C. The 1 April 2014 Iquique, Chile, Mw8.1 earthquake rupture sequence. Geophys. Res. Lett. 2014, 41, 3818–3825. [Google Scholar] [CrossRef]
- Dobrovolsky, I.P.; Zubkov, S.I.; Miachkin, V.I. Estimation of the size of earthquake preparation zones. PAGEOPH 1979, 117, 1025. [Google Scholar] [CrossRef]
- Friis-Christensen, E.; Lühr, H.; Hulot, G. Swarm: A constellation to study the Earth’s magnetic field. Earth Planets Space 2006, 58, 351–358. [Google Scholar] [CrossRef]
- “Swarm-L1b-Product-Definition”. Available online: https://earth.esa.int/web/guest/missions/esa-eo-missions/swarm/data-handbook/level-1b-product-definitions (accessed on 17 January 2019).
- United States Geological Survey. Available online: https://earthquake.usgs.gov/earthquakes/search/ (accessed on 11 February 2019).
- Perrone, L.; De Franceschi, G. Solar, ionospheric and geomagnetic indices. Ann. Geophys. 1998, 5–6, 843–855. [Google Scholar]
- Word Data Centre for Geomagnetism, Kyoto University. Available online: http://wdc.kugi.kyoto-u.ac.jp/wdc/Sec3.html (accessed on 11 February 2019).
- SAFE Project web site. Available online: http://safe-swarm.ingv.it/resources/data/earthquakes-boards. (accessed on 25 May 2019).
- Plastino, W.; Bella, F.; Catalano, P.G.; Di Giovambattista, R. Radon groundwater anomalies related to the Umbria–Marche, September 26, 1997. Earthq. Geofis. Int. 2002, 4, 369–375. [Google Scholar]
- Vizzini, F.; Brai, M. In-soil radon anomalies as precursors of earthquakes: A case study in the SE slope of Mt. Etna in a period of quite stable weather conditions. J. Environ. Radioact. 2012, 113, 131–141. [Google Scholar] [CrossRef]
- Park, J.; Noja, M.; Stolle, C.; Lühr, H. The Ionospheric Bubble Index deduced from magnetic field and plasma observations onboard Swarm. Earth Planets Space 2013, 11, 13. [Google Scholar] [CrossRef]
- Balan, N.; Liu, L.; Le, H. A brief review of equatorial ionization anomaly and ionospheric irregularities. Earth Planet. Phys. 2018, 4, 257–275. [Google Scholar] [CrossRef]
- Spogli, L.; Cesaroni, C.; Di Mauro, D.; Pezzopane, M.; Alfonsi, L.; Musicò, E.; Linty, N. Formation of ionospheric irregularities over Southeast Asia during the 2015 St. Patrick’s Day storm. J. Geophys. Res. Space Phys. 2016, 12, 12,211–12,233. [Google Scholar] [CrossRef]
- Balasis, G.; Papadimitriou, C.; Daglis, I.A.; Pilipenko, V. ULF wave power features in the topside ionosphere revealed by Swarm observations. Geophys. Res. Lett. 2015, 17, 6922–6930. [Google Scholar] [CrossRef]
- Barnett, V.; Lewis, T. Outliers in Statistical Data, 3rd ed.; J. Wiley & Sons: Hoboken, NJ, USA, 1994; XVII; 582p. [Google Scholar]
- Cander, L.R.; Mihajlovic, S.J. Ionospheric spatial and temporal variations during the 29–31 October 2003 storm. J. Atmos. Sol-Terr. Phys. 2005, 67, 1118–1128. [Google Scholar] [CrossRef]
© 2019 by the authors. Licensee MDPI, Basel, Switzerland. This article is an open access article distributed under the terms and conditions of the Creative Commons Attribution (CC BY) license (http://creativecommons.org/licenses/by/4.0/).