Article

Radiosonde-Observed Vertical Profiles and Increasing Trends of Temperature and Humidity during 2005–2018 at the South Pole

1
Collaborative Innovation Center on Forecast and Evaluation of Meteorological Disasters, School of Remote Sensing and Geomatics Engineering, Nanjing University of Information Science and Technology, Nanjing 210044, China
2
Collaborative Innovation Center on Forecast and Evaluation of Meteorological Disasters, School of Atmospheric Physics, Nanjing University of Information Science and Technology, Nanjing 210044, China
3
School of Atmospheric Sciences, and Guangdong Province Key Laboratory for Climate Change and Natural Disaster Studies, Sun Yat-sen University, Zhuhai 519082, China
4
Southern Marine Science and Engineering Guangdong Laboratory (Zhuhai), Zhuhai 519082, China
5
Edgemont Junior–Senior High School, New York, NY 10583, USA
6
Institute of Environment, Energy and Sustainability, The Chinese University of Hong Kong, Hong Kong 999077, China
7
SOA Key Laboratory for Polar Science, Polar Research Institute of China, Shanghai 200136, China
8
Institute of Atmospheric Physics, the Chinese Academy of Sciences, Beijing 100029, China
*
Authors to whom correspondence should be addressed.
Atmosphere 2019, 10(7), 365; https://doi.org/10.3390/atmos10070365
Submission received: 3 May 2019 / Revised: 17 June 2019 / Accepted: 26 June 2019 / Published: 1 July 2019

Abstract

:
The vertical profiles and trends of temperature and humidity at the South Pole up to 10 km above mean sea level (amsl) were investigated by using radiosonde data collected from March 2005 to February 2018. During an average year between 2005 and 2018, the highest (lowest) temperature in the lower troposphere was approximately −25 °C (−60 °C) in December (July) at a height of about 500 m above the surface (at the surface). A temperature inversion layer above the surface was found during the whole year but was weaker during the summer, while the inversion layers at the tropopause (about 8 km amsl) mostly disappeared during spring and winter. General warming trends were found at all heights and months, but in a few heights and months cooling trends still occurred (e.g., in September below 7 km amsl). Nevertheless, seasonal and yearly averaged temperatures all presented warming trends: 1.1, 1.3, 0.6, 1.5 and 1.1 °C/decade at the surface, and 0.7, 1.0, 0.3, 0.3 and 0.6 °C/decade for the layer average from the surface to 10 km amsl, for spring, summer, autumn, winter, and yearly average, respectively. Most of the water vapor was confined in the lowermost 3 km of the atmosphere with a maximum of 0.35 g kg−1 in December at a 200 m height above surface, and the specific humidity had the similar characteristic of annual cycle and inversion layers as the temperature. At heights below 5 km amsl, increasing trends of specific humidity larger than 0.02 g kg−1/decade occurred during summer months, including the late spring and early autumn, and the annual mean showed an increasing trend of about 0.01–0.02 g kg−1/decade. Meanwhile, above 5 km amsl, the trends became small and generally less than 0.02 g kg−1/decade in all the months, and beyond 7 km amsl the specific humidity remained almost invariant due to its small moisture content as compared with lower levels. From the surface to 10 km amsl, the specific humidity averaged trends of 0.0062, 0.019, 0.0013, 0.002 and 0.007 g kg−1/decade for spring, summer, autumn, winter and yearly average, respectively.

1. Introduction

Antarctica is closely coupled with other parts of the global climate system and is a key region to examine in regards to climate change [1,2,3,4]. Turner et al. (2005) found significant warming of annual mean surface temperature across the Antarctic Peninsula, with a trend of 0.53 °C/decade at the Faraday/Vernadsky station in the 1951–2000 period, but little change was recognized across the rest of the continent. Over the South Pole, a cooling trend of −0.17 °C/decade for the annual mean temperature in the 1951–2000 period was found at the Amundsen–Scott station [5]. Chapman and Walsh (2007) found great warming (larger than 0.3 °C/decade) over the Antarctic Peninsula, small warming (about 0.1 °C/decade) across West Antarctica and much of East Antarctica, but a cooling swath (about −0.1 °C/decade) around the South Pole during 1958–2002 [6]. Through combining satellite and surface observations, Steig et al. (2009) showed similar trends over a longer time span 1957–2006 [7]. Nicolas and Bromwich (2014) further extended that period to 1958–2012 and recognized analogous warming patterns over the Antarctica with no significant trend at the South Pole [8].
For the upper air, Angell (1999) presented that the annual mean temperature trend was about 0.25 °C/decade in the south polar climate zone for 850–300 hPa layer with radiosonde data during 1958–1998 [9]. Marshall (2002) also found a warming trend during 1960–1999 for four Antarctic stations at 850, 500 and 300 hPa levels, but a cooling trend at the 100 hPa level [1]. Turner et al. (2006) showed that warming has occurred throughout the troposphere over Antarctica with a maximum increase in the mid-troposphere (400 to 600 hPa), and a warming trend of about 0.4 °C/decade was found over the South Pole in this layer in the spring and winter during the 1971–2003 period [10]. In the stratosphere, Thompson et al. (2005) reported that the temperature over the Southern Hemisphere polar cap, averaged over 60–90° S, had a significant cooling trend of up to −3.75 °C/decade at about 70 hPa in November for the 1979–2003 period [11]. Screen and Simmonds (2012) summarized that the recent half-century temperature change over Antarctica could be characterized by mid-tropospheric warming and stratospheric cooling [12].
Few reports have presented the long-term humidity trend over the polar regions of Antarctica due to extreme low temperatures that have made humidity observation difficult. However, precipitable water at this region has frequently been studied. Using radiosoundings, it was found that precipitable water over Antarctica varies seasonally, from values of 0.2–0.4 mm in the winter to more than 0.6 mm in summer over Dome C [13]. Through global positioning system (GPS) observations, Sarti et al. (2013) found a nearly zero trend of precipitable water at Mario Zucchelli Station, Antarctica [14]. By using model reanalysis, radiosonde, global positioning system and microwave satellite observations, Chen and Liu (2016) showed that there was an evident increasing trend of the precipitable water over polar regions varying from 0.07 to 0.34 mm/decade for the different data sources and/or the time spans during 1979–2014 [15].
Due to the lack of observations over Antarctica, previous studies have been more interested in surface climatology, and most of the stations examined have been along the coast, while few studies have focused on the long-term vertical profiles and trends in the interior of the continent. Therefore, to specifically recognize the climate characteristics of temperature and humidity at the South Pole, this study investigates the daily radiosonde profiles at the Amundsen-Scott South Pole Station during 2005–2018. The rest of this paper is organized as follows: The data and methods used in this study are described in Section 2; Section 3 presents the results of the temperature and humidity profiles and trends; summary and conclusions are given in Section 4.

2. Data and Methods

The data used here are the daily 00 UTC radiosonde profiles at Amundsen-Scott South Pole Station, recorded in the Integrated Global Radiosonde Archive (IGRA, https://www.ncdc.noaa.gov/data-access/weather-balloon/integrated-global-radiosonde-archive). The Amundsen-Scott station is located at the South Pole, on the high plateau of Antarctica at an elevation of 2835 m above mean sea level. Radiosonde datasets are frequently used in climate analysis [11,16,17,18,19,20]. Although the IGRA radiosonde dataset applies quality control algorithms to remove gross errors, it needs caution to use the data for long-term trend analysis due to discontinuities caused by changes in instrumentation, observing practice or station location [21]. Radiosonde observation of temperature started at Amundsen-Scott in 1961, but humidity observation has only been available since 1990, and pre-2005 findings are incompatible with post-2005 results due to an instrumental upgrade from Vaisala RS90 to Vaisala RS92 in 15 February 2005. Therefore, to ensure data reliability and to focus on the variation in the new century, we selected the data from March 2005–February 2019 for analysis. There were a total of 4895 profiles observed during this selected period, with radiosonde profile observations of temperature and humidity available from surface to pressure levels up to about 10 hPa, with a diverse interval ranging from 5 to 50 hPa approximately. For the days without observation, the profiles were interpolated with a 10-day average to account for each missing day. Since the observation levels were not unified in these radiosonde profiles, and to facilitate the analysis, the meteorological variables were linearly interpolated to a 50-m interval profile. Furthermore, the data were frequently missing beyond a 10-km height amsl (hereafter, the altitudes are heights amsl, unless specified), so only the data below 10 km altitude are analyzed here. For the seasonal and yearly analysis, the summer season of a year includes its December and the next year’s January and February, while yearly average is calculated with data from March of the year to February of the following year. Additionally, ERA-Interim data [22] were used to investigate the mechanism of the cooling trend in September. ERA-Interim is a global atmospheric reanalysis with a spatial resolution of 0.75° × 0.75°.

3. Results

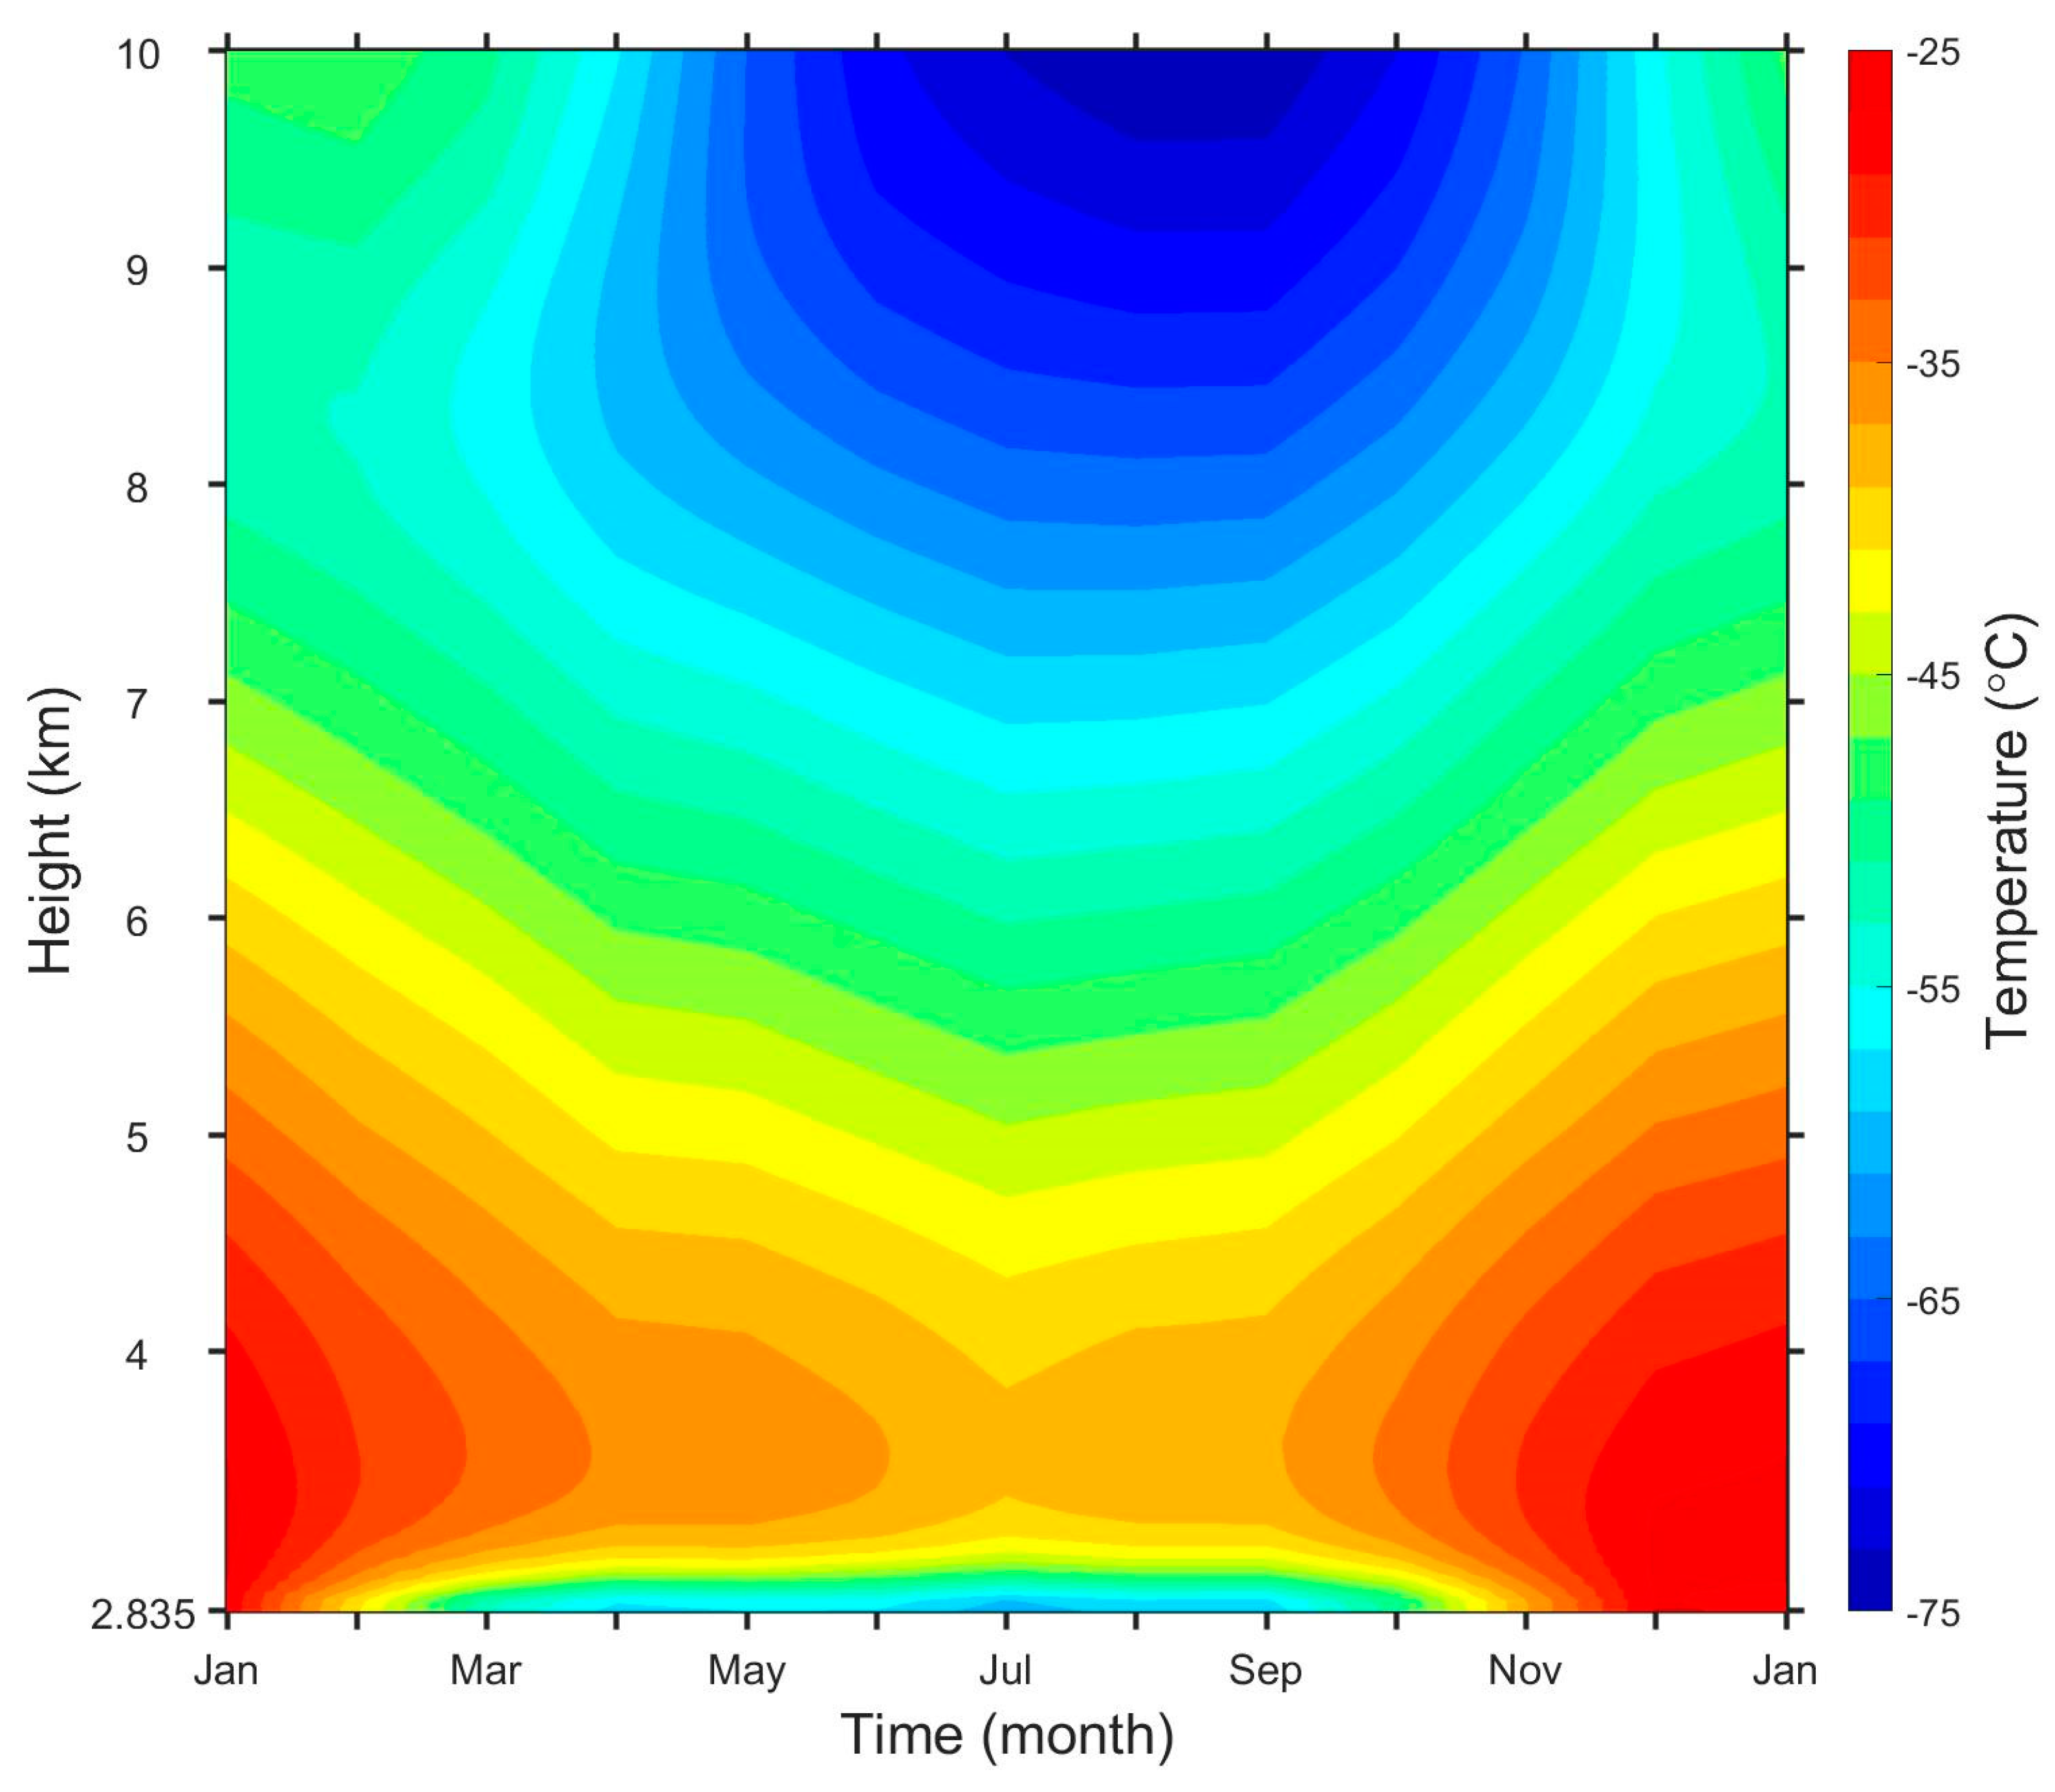
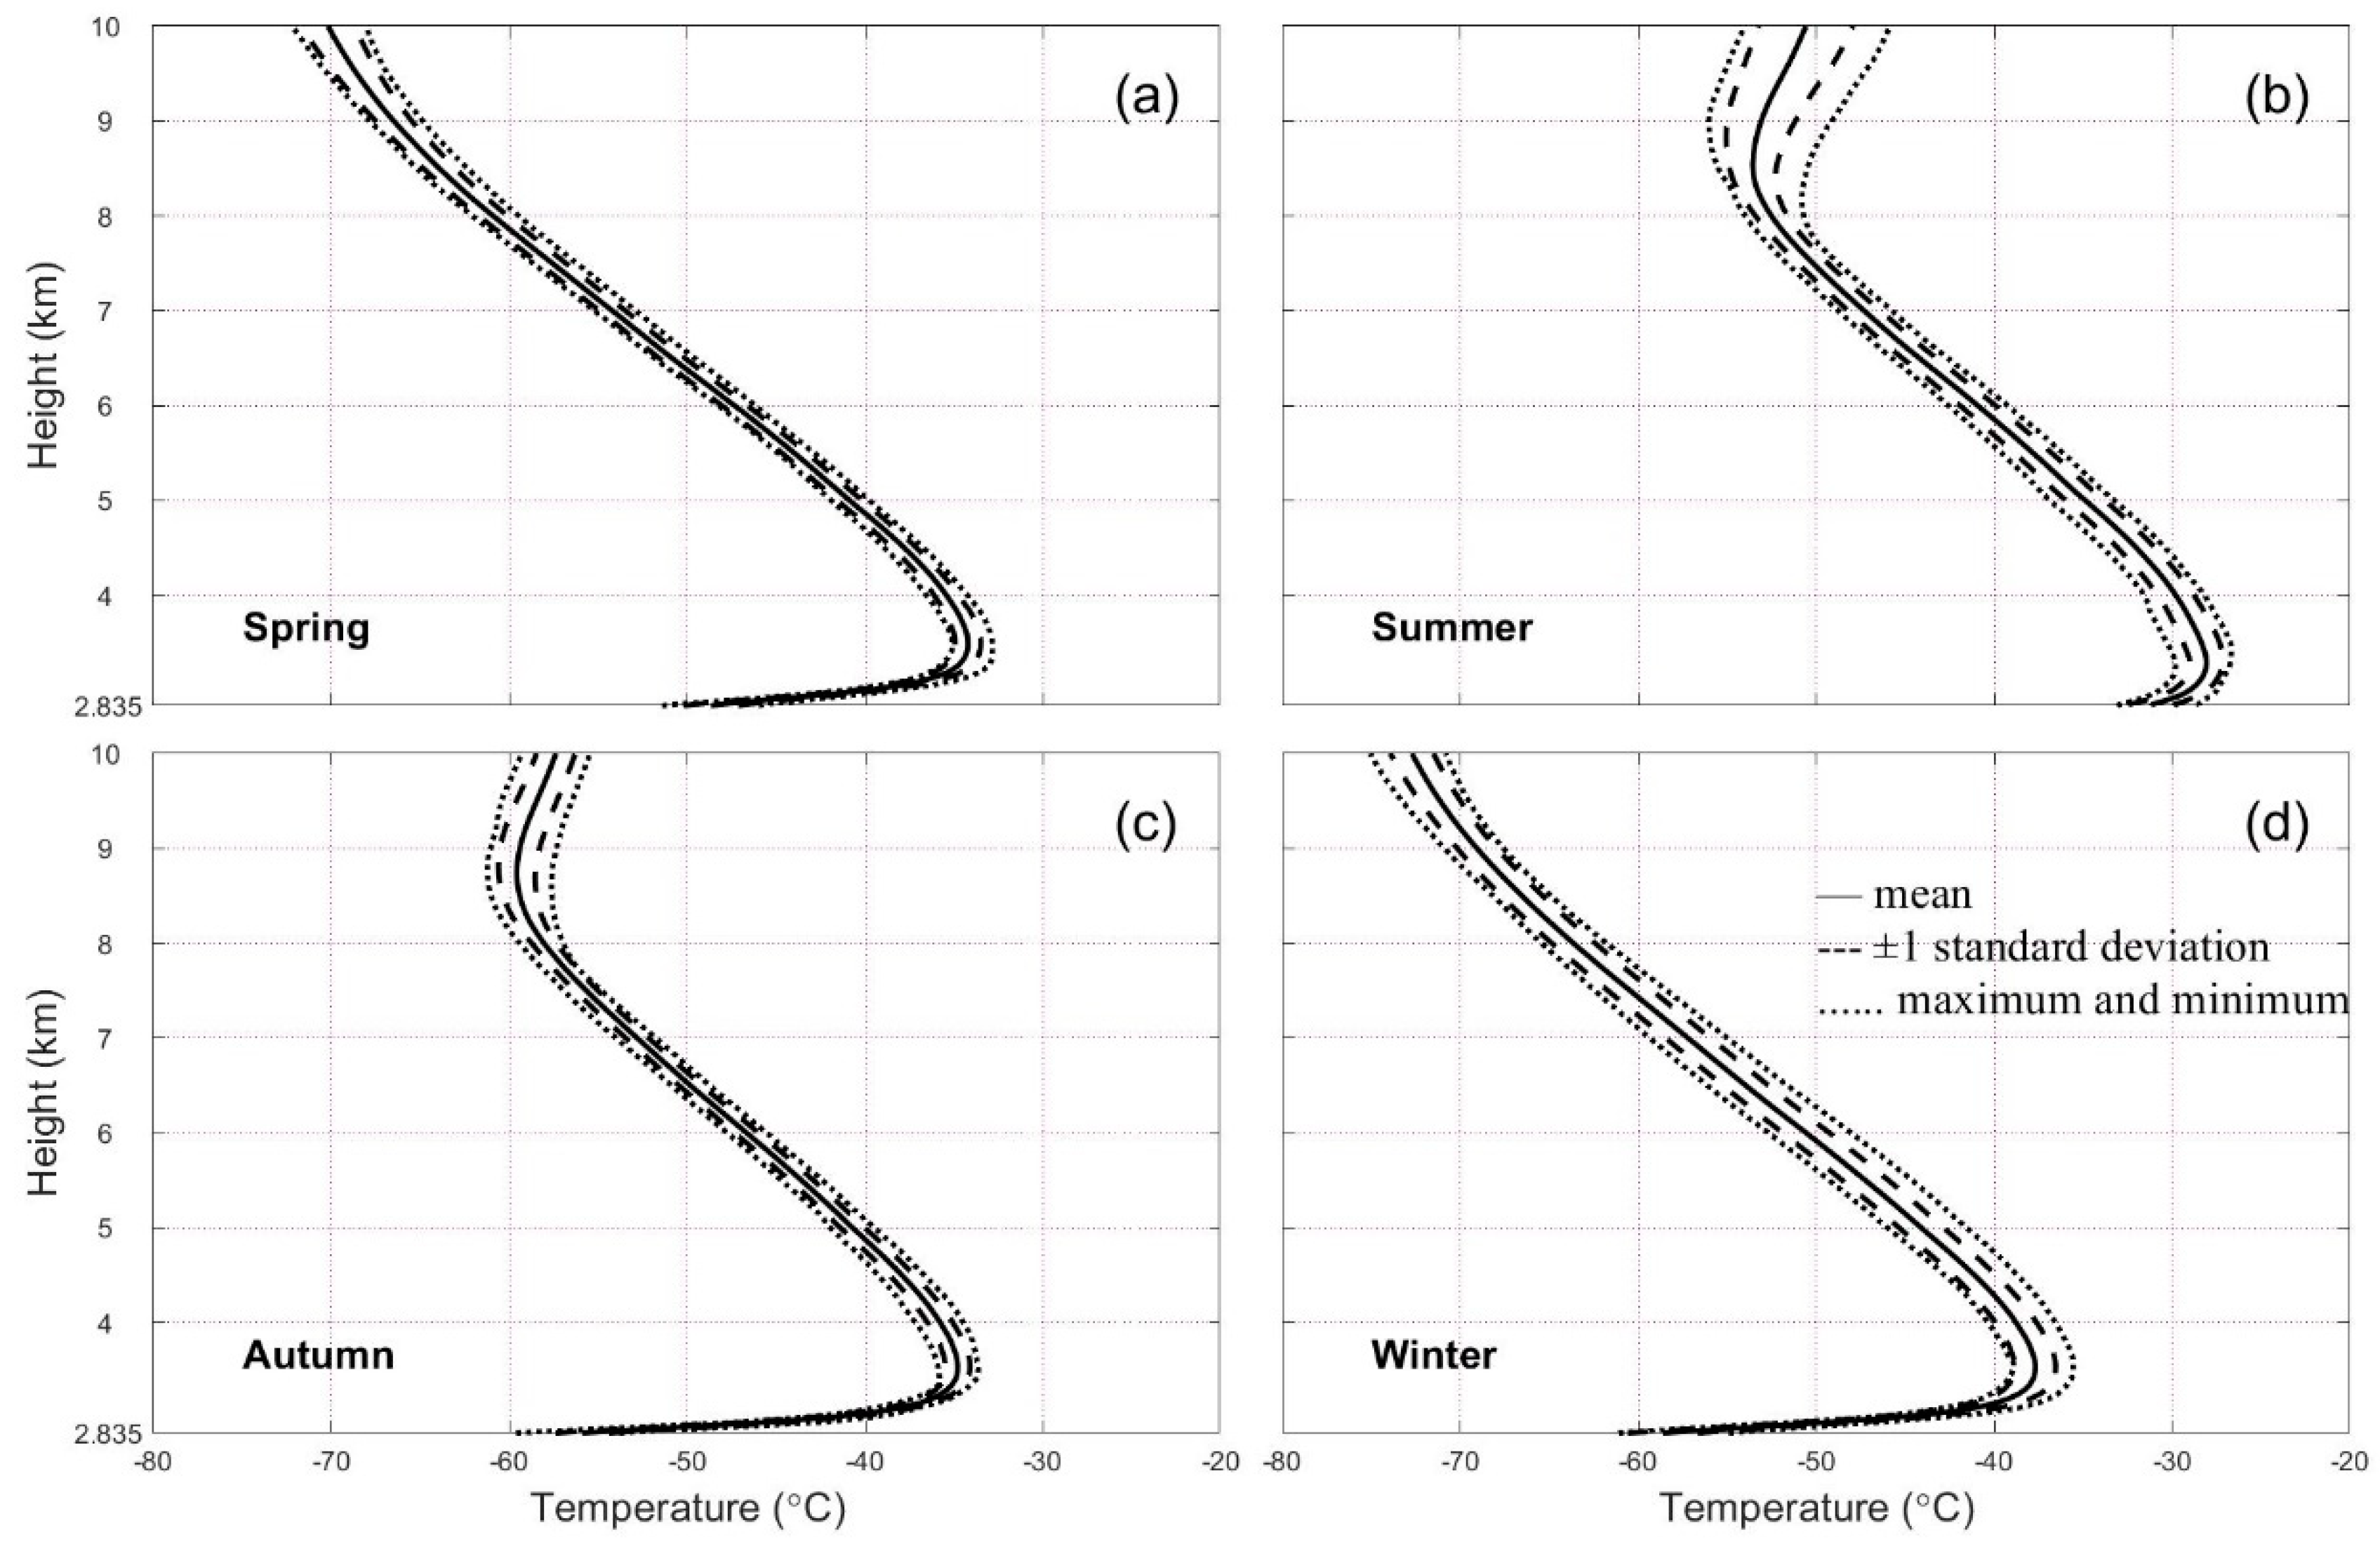
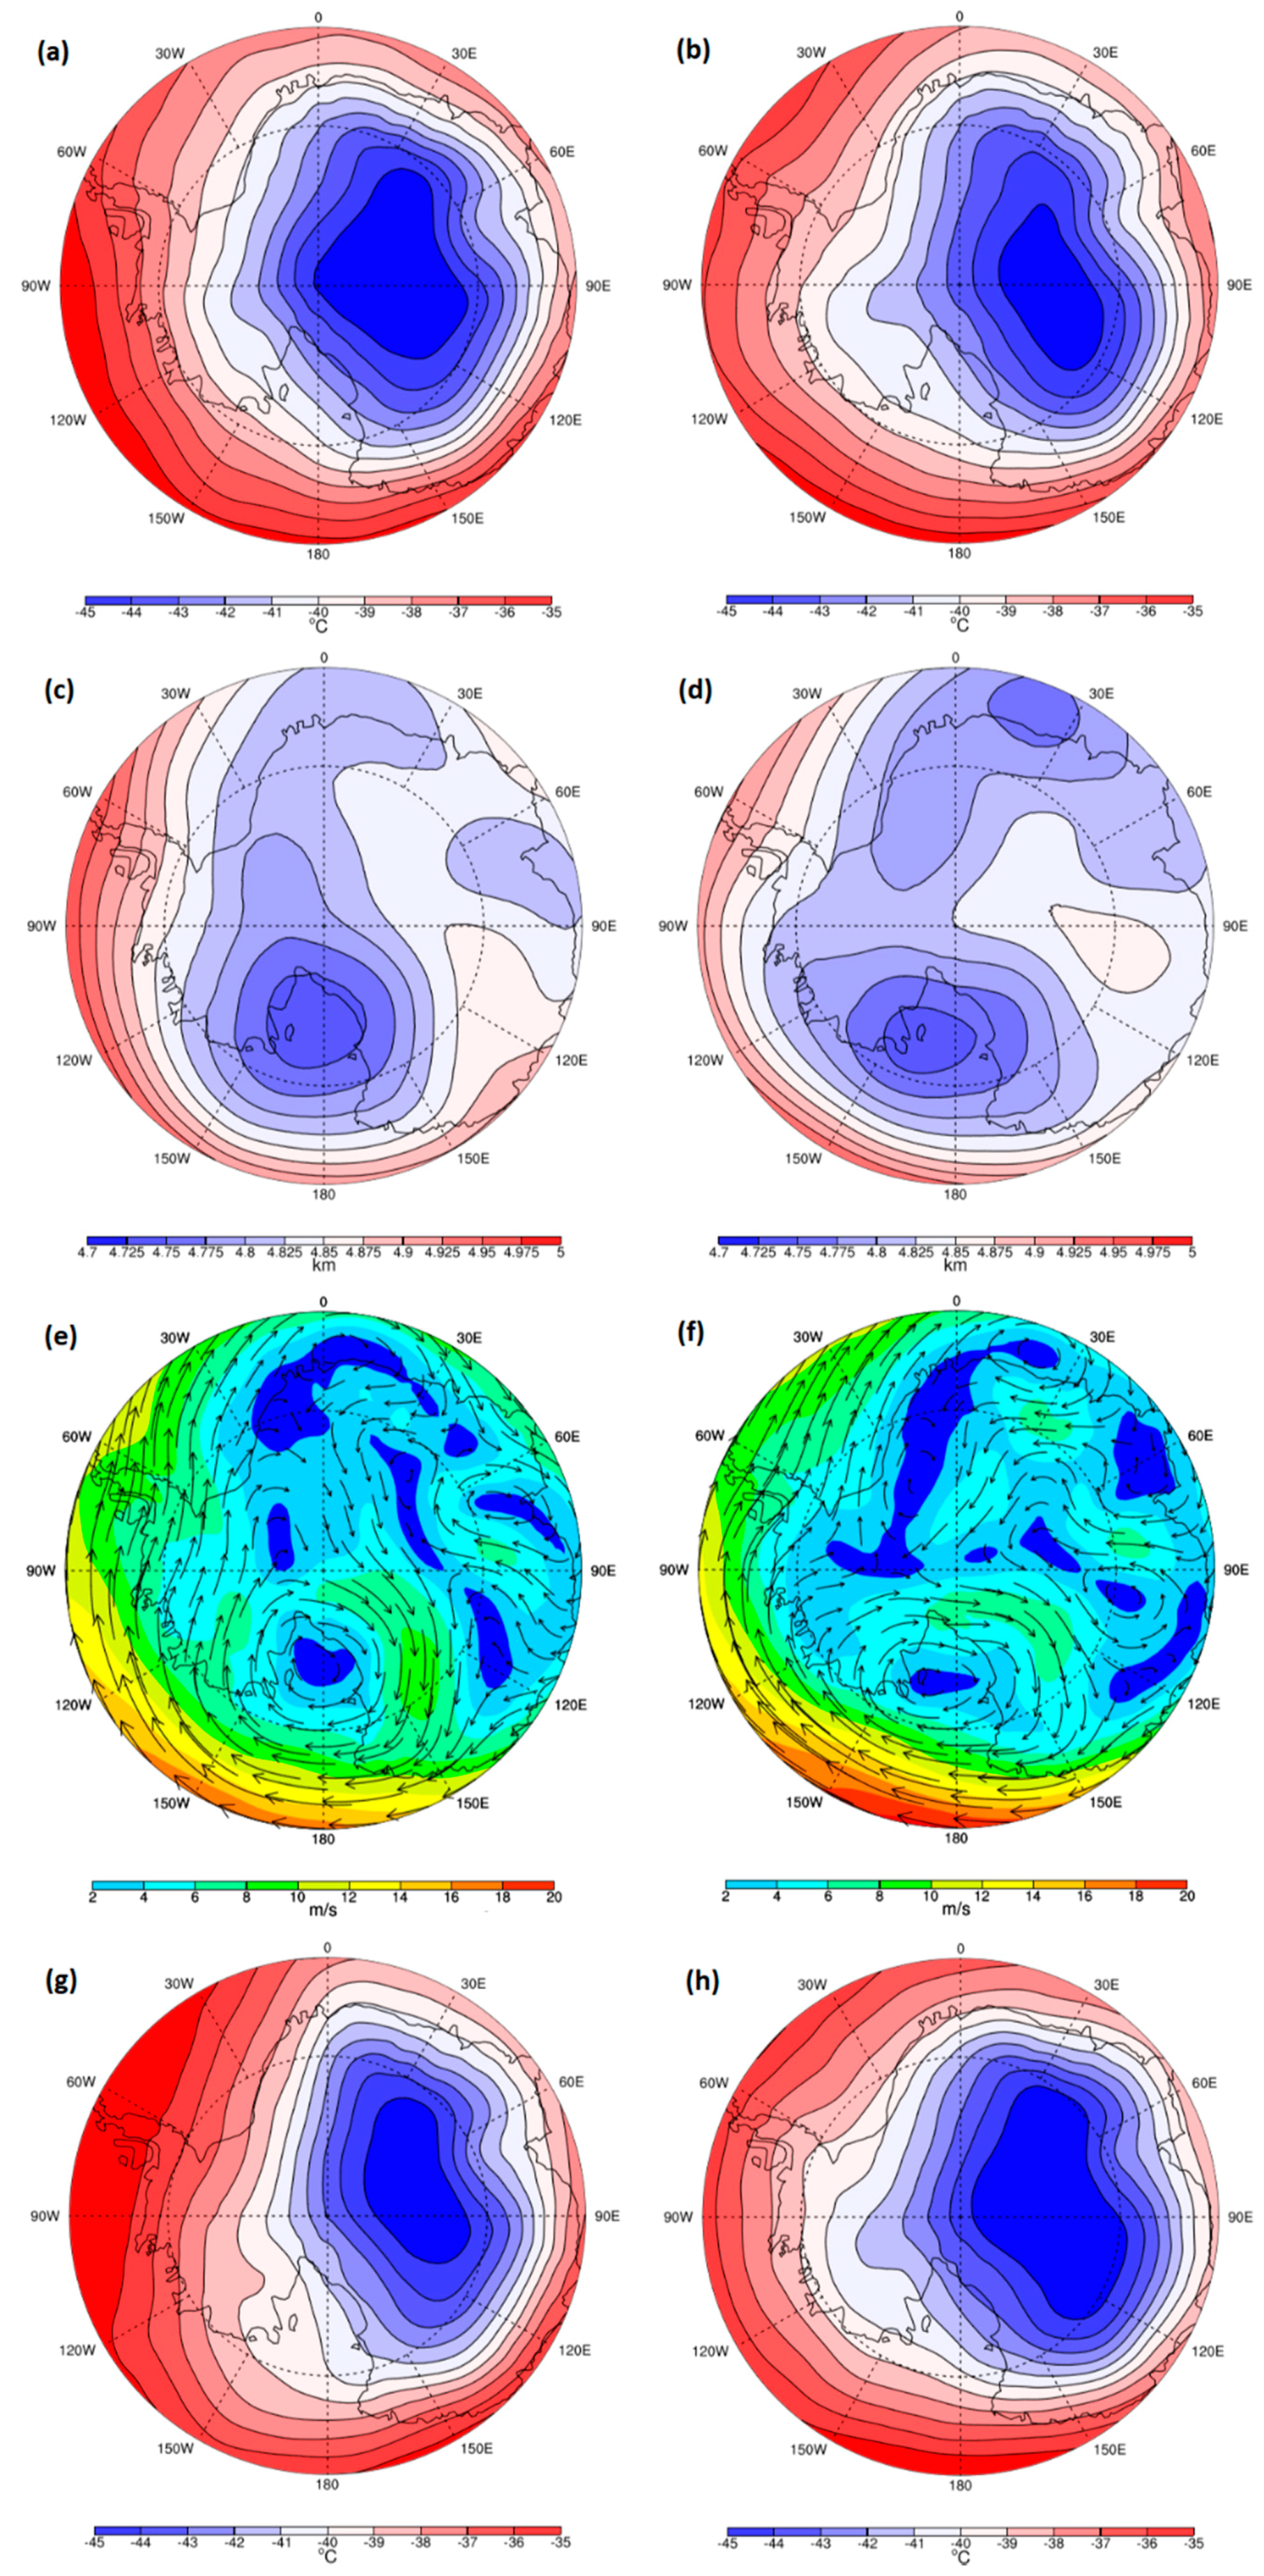
3.1. Mean State of Temperature

Figure 1 shows the mean annual cycle of the temperature over the South Pole during 2005–2018. The seasonal variations at each altitude were basically similar (i.e., the lowest temperature occurred in winter (June, July, August (JJA)), and the highest in summer (December, January, February (DJF)). In the lower troposphere, the highest temperature of approximately −25 °C was in December at about 500 m above the surface, while the lowest temperature of −60 °C was at the surface in July. At a height of 10 km, the lowest temperature reaching −75 °C tended to appear in late winter.
The vertical profiles for the maximum, minimum and mean temperature, as well as ±1 standard deviation in each of the four seasons during 2005–2018, are shown in Figure 2. The mean surface temperature in spring (September, October, November (SON)), autumn (March, April, May (MAM)) and winter was lower than −40 °C, while in summer it was about −30 °C. An inversion layer just above the surface was found in all the four seasons, but was weaker in summer. The average temperature difference was around 20 °C between the inversion top and base in autumn and winter, which is similar with the findings of Pietroni et al. (2014) through a microwave radiometer [23], indicating a lapse rate of about −20 °C/km (the temperature increased about 20 °C for every 1 km rise). Above the inversion layer, the tropospheric temperature decreased linearly at a rate of about 0.6 °C/100 m. In summer (December, January and February (DJF)) and autumn, an evident inversion layer was found capping the troposphere at a height of 8–9 km, showing the transition region from troposphere to stratosphere. Relatively broader standard deviations and maximum–minimums were found in summer, indicating a larger interannual temperature variability.
Figure 3 presents the annual variation in the occurrence frequency of the temperature inversion layers in weekly slots during the 2005–2018 period. It can be seen that near-surface temperature inversion layers of about 0.5–1 km thick persisted during the whole year, but were shallower and less frequent in summer days. Similar results were found by Zhang et al. (2011) using 1990–2009 radiosonde observations from six Antarctica stations [24]. Further, a clear temperature inversion at the tropopause around 8–10 km amsl appeared only in summer and autumn days when local irradiance was strong.

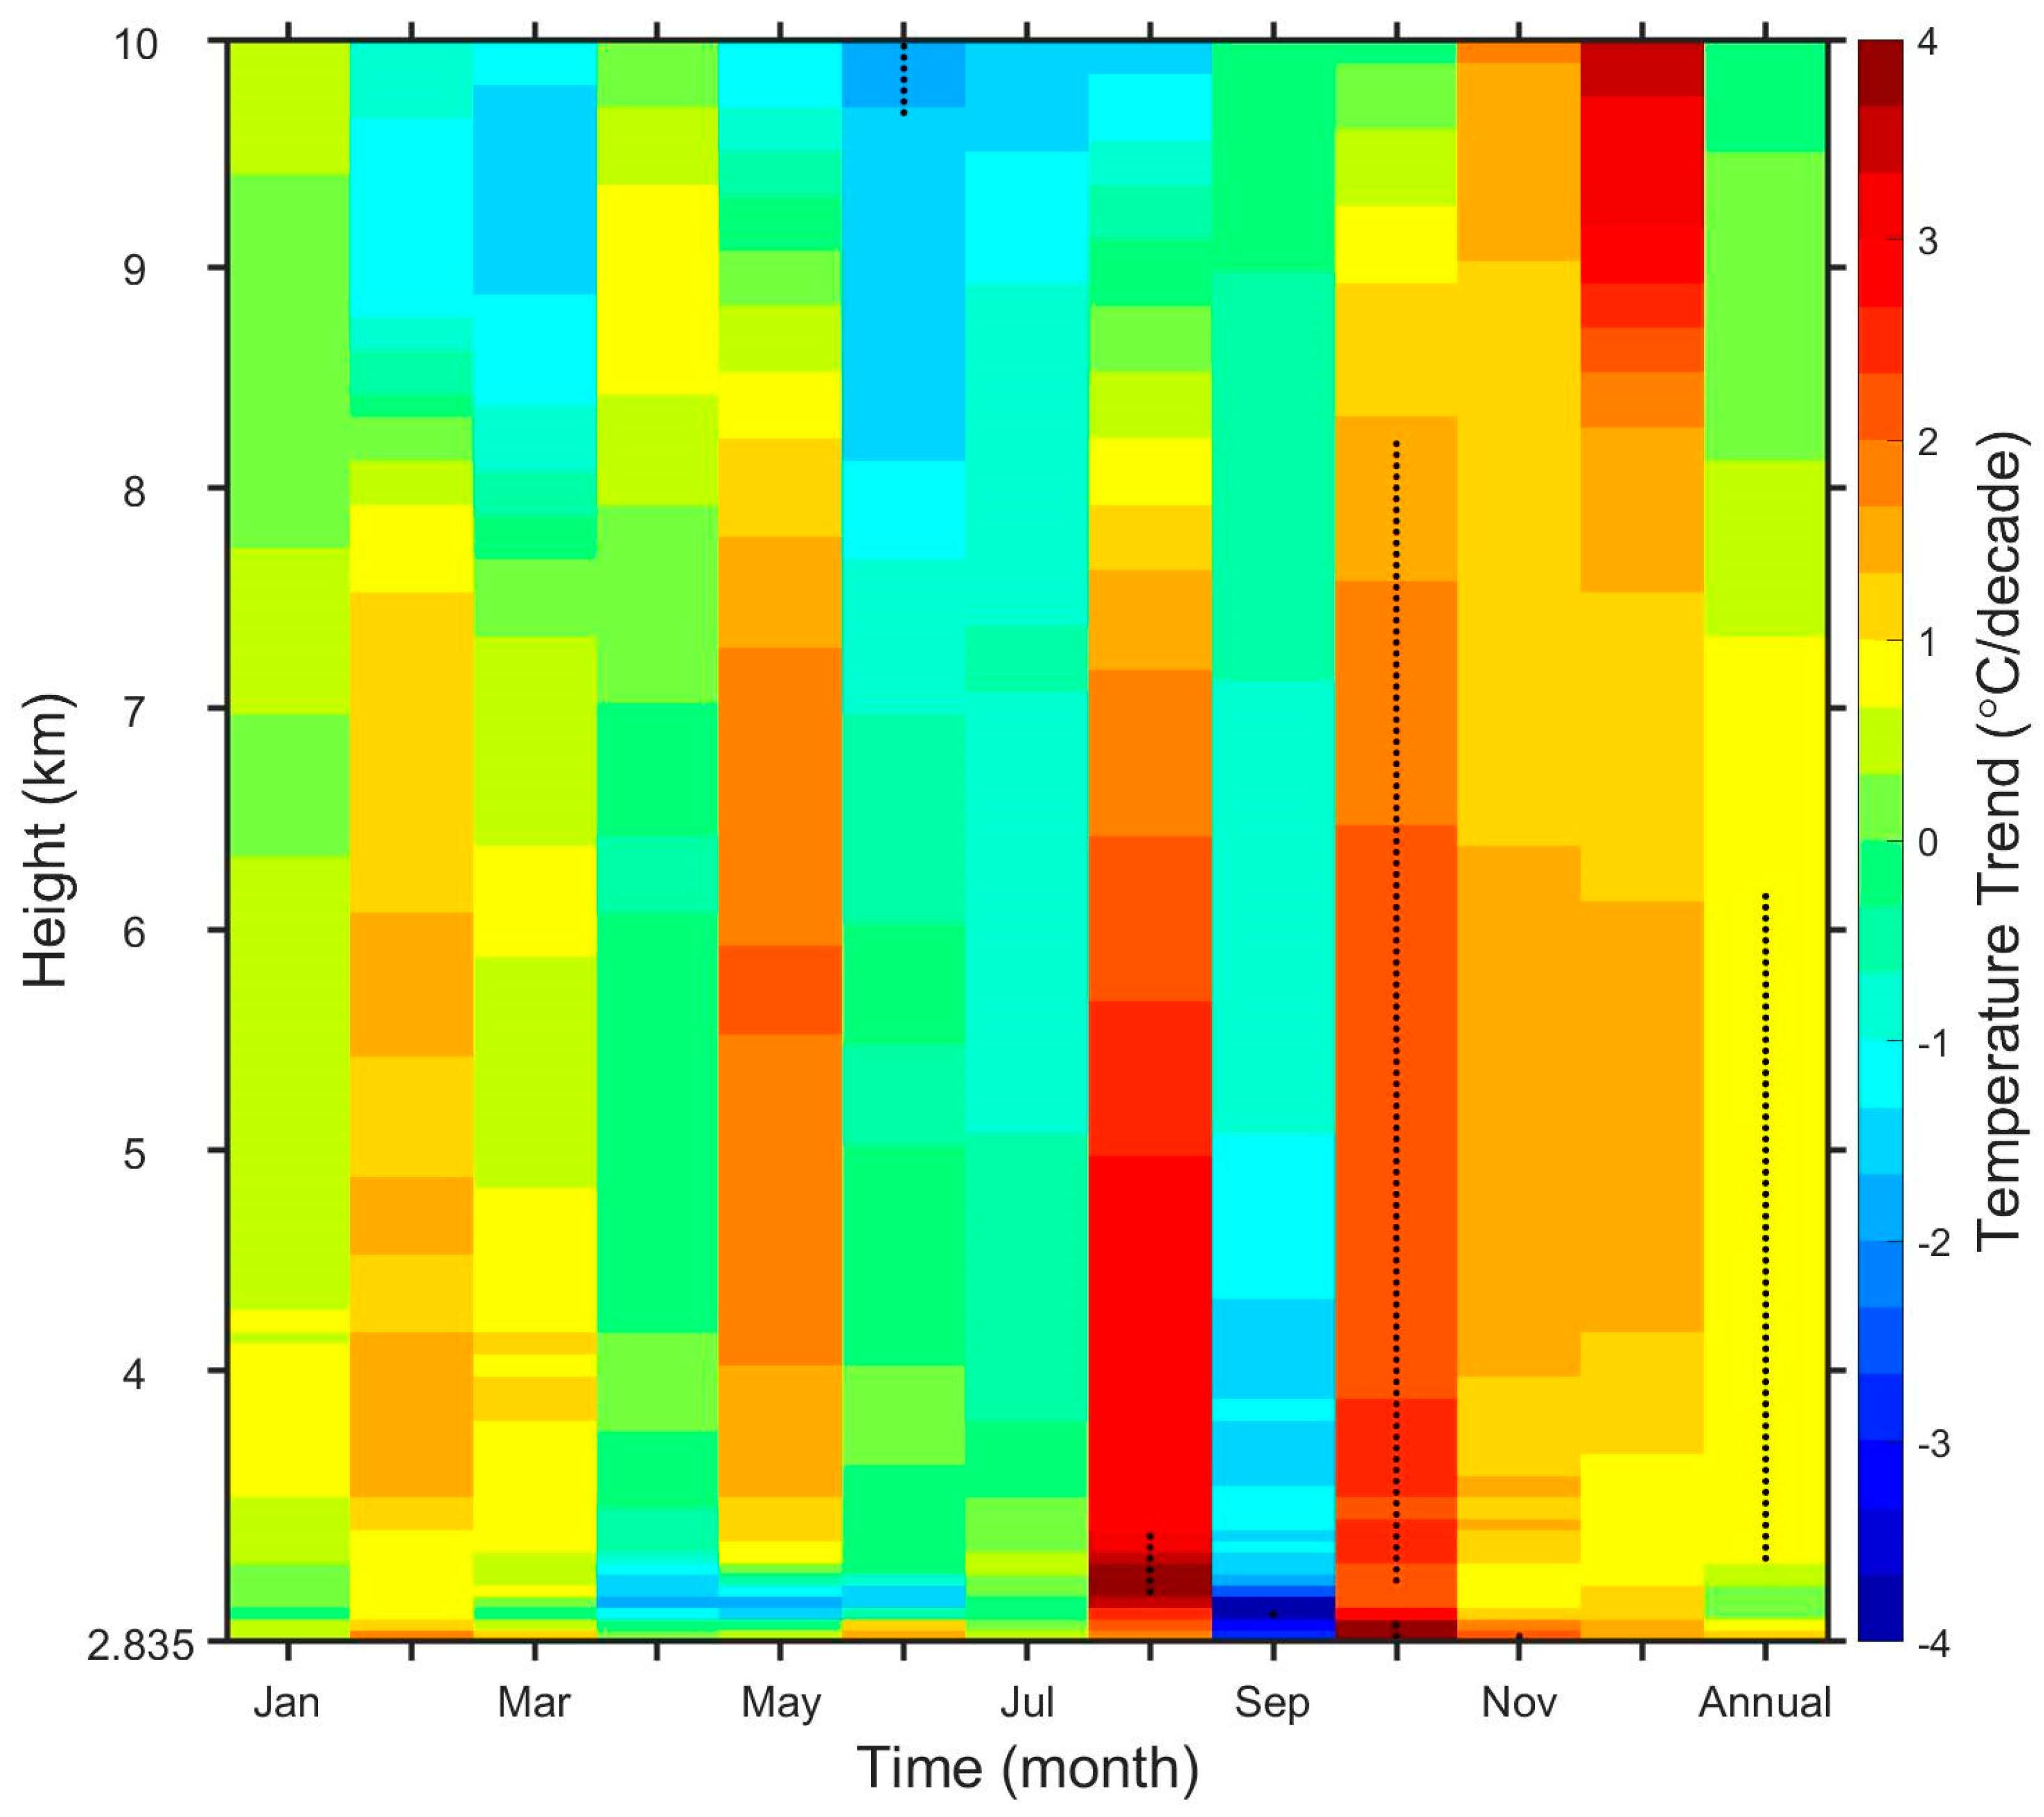
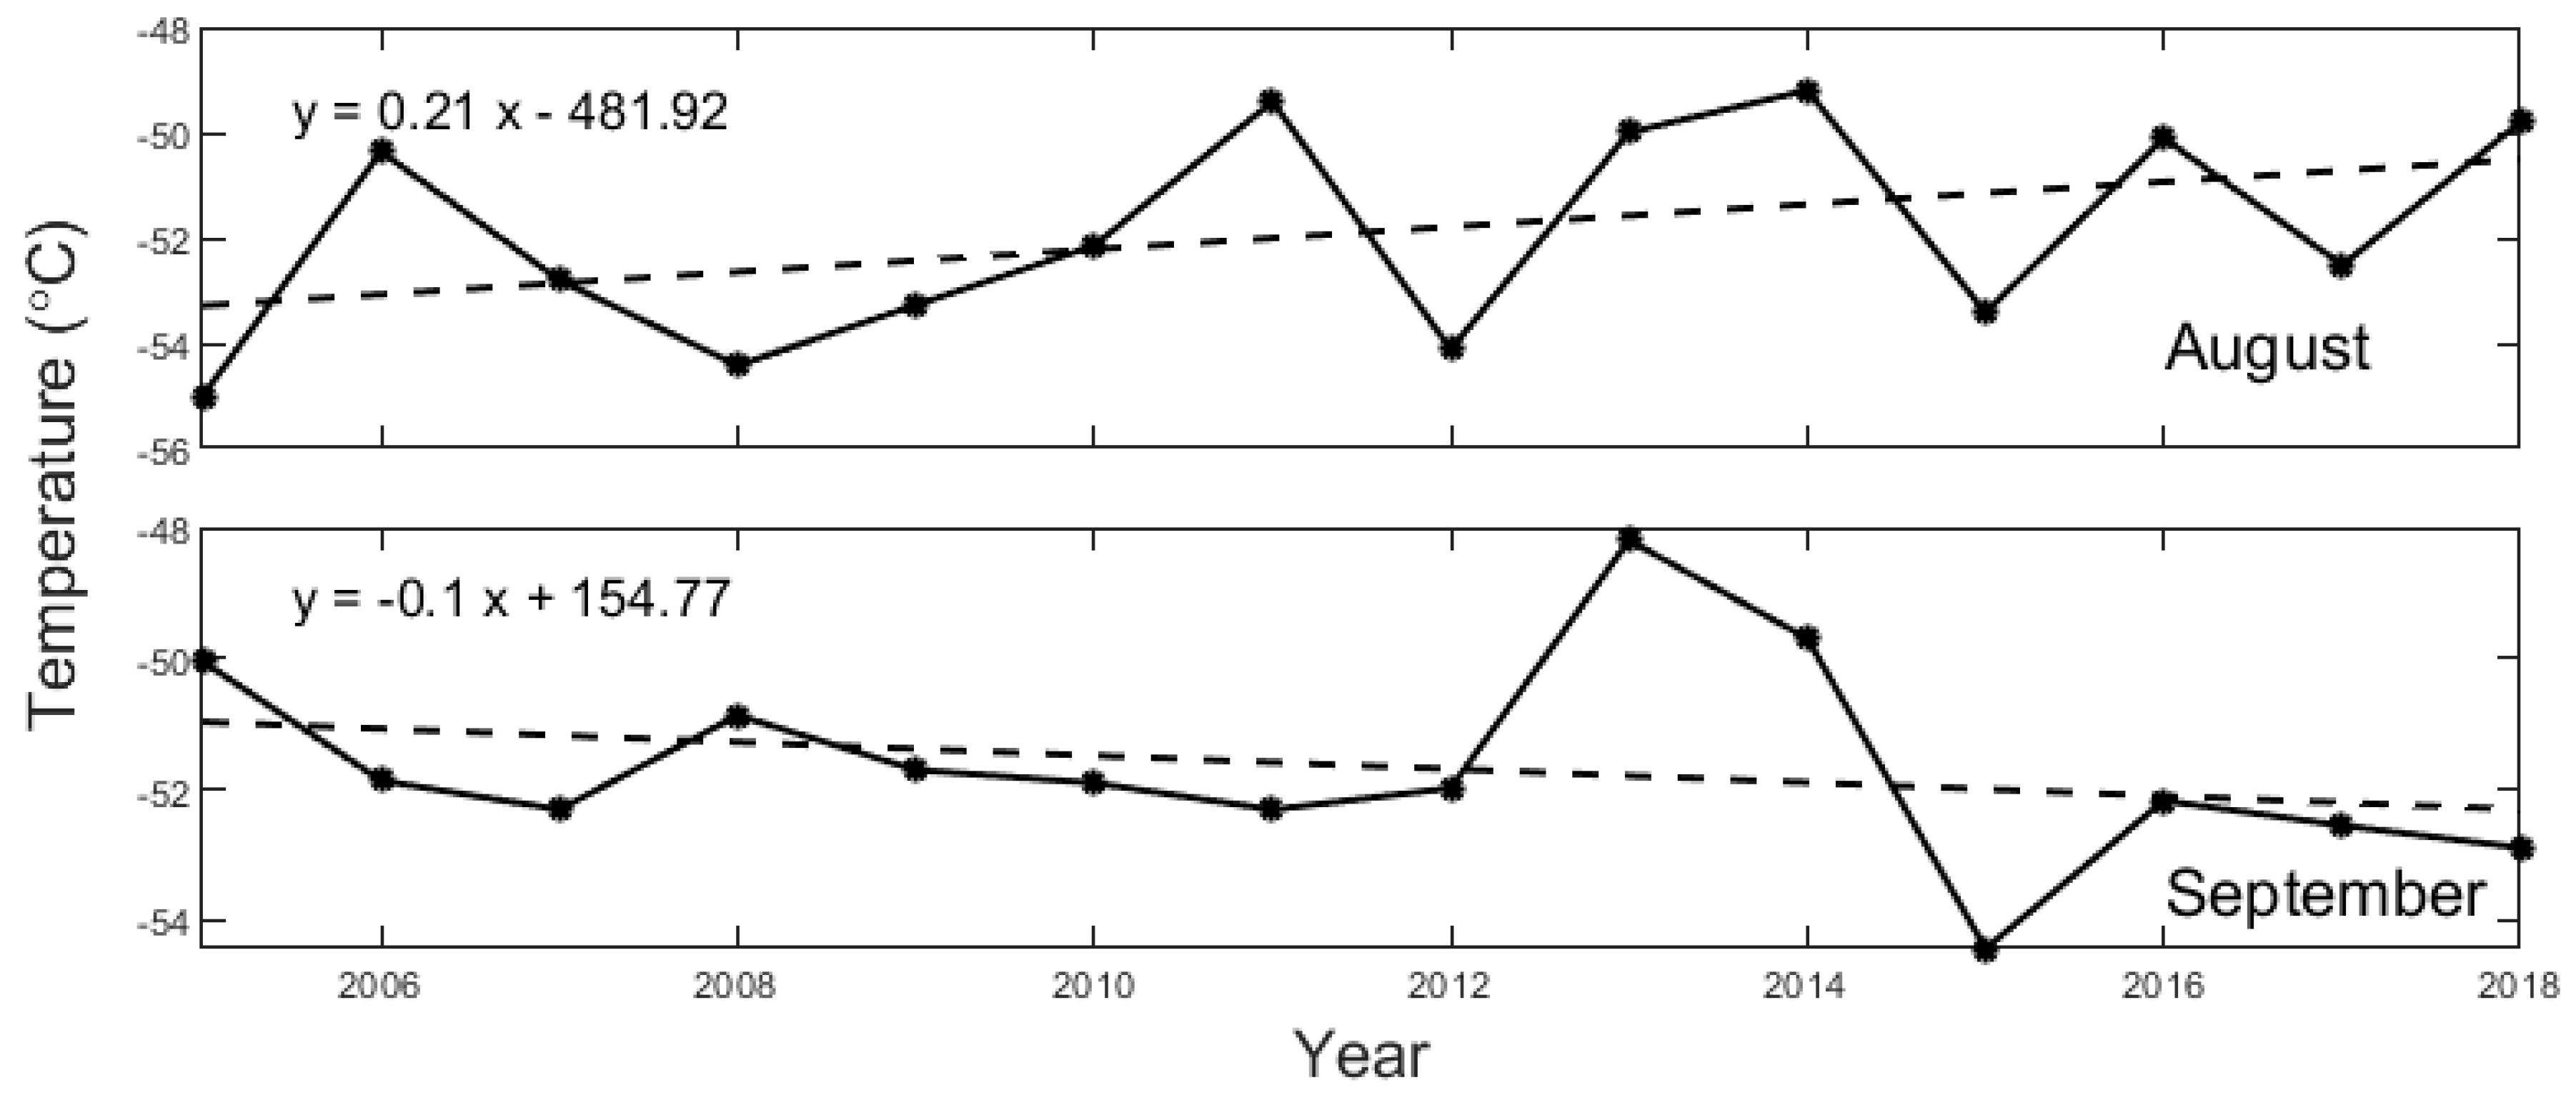
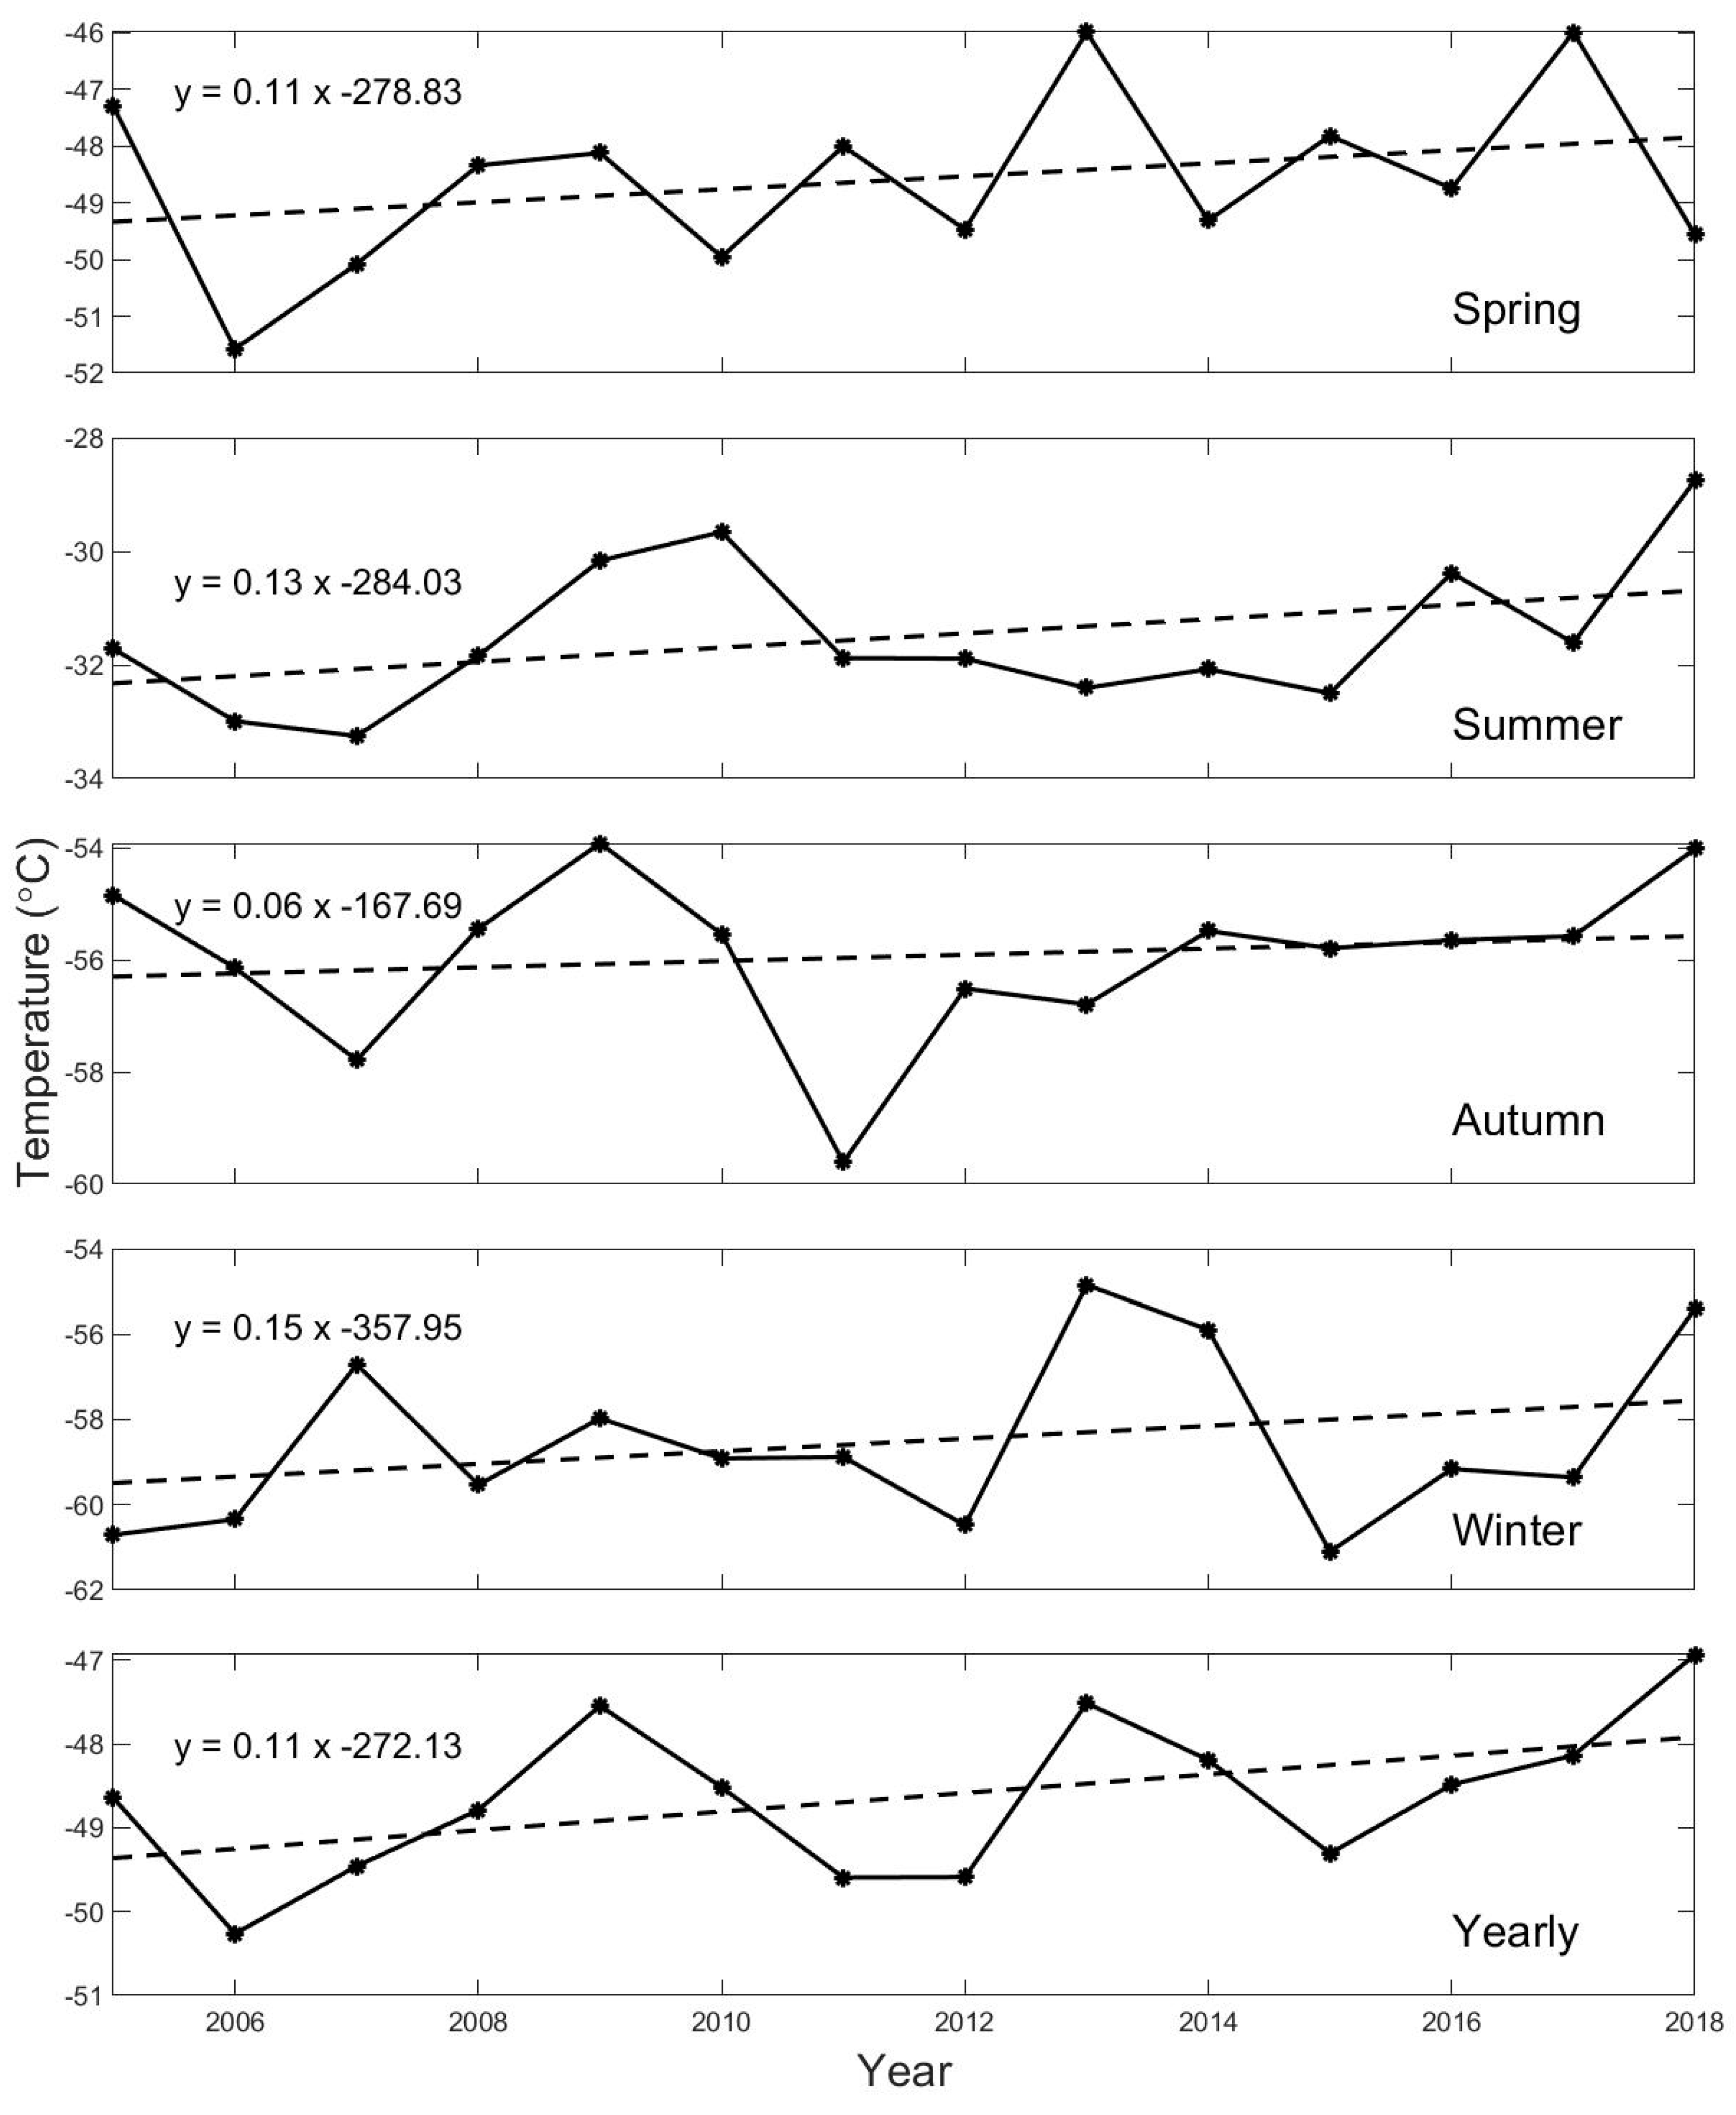
3.2. Trends of Temperature

Figure 4 displays the linear trends of the temperature for monthly and annual means at each height level up to 10 km during 2005–2018. All trends (at a level for a specific month or whole year) were calculated by using the least square regression method. For the annual mean temperature, an obvious warming trend of about 1 °C/decade was found at the surface and in the atmosphere above. Near land surface, warming trends were shown in most of the months, and the maximum warming occurred in October, reaching 4 °C/decade. In contrast, a significant surface cooling was found in September, being about −3 °C/decade.
In the troposphere (around 3–8 km), temperature trends were similar to those at the surface. The maximum warming trend occurred in August and October, while in September cooling trends of about −1 °C/decade appeared. For levels above 8 km, a warming at a rate of about 2.5 °C/decade was derived in December, but slight cooling was shown in autumn and winter months (i.e., MAM and JJA).
Under global warming, there are disturbances of cooling trends over some areas for some specific seasons, especially in the center of major continents. For example, there is a trend of decreasing surface temperature over the center of North America during the summer season [25,26], which is explained by land–air interaction and local human activity [27], influences from the Atlantic sea surface temperature (SST) [28,29], Pacific Decadal Oscillation and Pacific SST [30], radiation and aerosol [31] and circulations [32]. A similar cooling trend was observed during September over the South Pole, although this phenomenon has hardly been investigated so far. The impact of circulation at 500 hPa was analyzed in this study using ERA-Interim data to understand the phenomenon. Figure 5 shows the averaged surface–10 km amsl temperature in August and September during 2005–2018, while Figure 6 shows the spatial pattern of temperature for August and September and the geopotential height and winds for August at 500 hPa during 2005–2008 and 2015–2018. The first and last four years (i.e., 2005–2008 and 2015–2018) were chosen for comparison to show more clearly the pattern change from the beginning to the end of the 2005–2018 period. Seen in Figure 5, the averaged surface–10 km amsl temperature showed an increasing trend in August, but a decreasing trend in September. Figure 6 further confirms such a discrepancy between the two months—from 2005–2008 to 2015–2018 the cold area shrunk in August, but expanded in September. The warming in August led to a decreased polar high and temperature gradient, which in turn caused a weakened pressure gradient and atmospheric circulation. In particular, the anti-cyclonic circulation at south Antarctica, which exchanged cold air masses over the South Pole to the warm air masses at lower latitudes [33], was significantly reduced. From August to September, Antarctica and its surrounding areas became warmer due to stronger solar irradiance. However, due to reduced circulation in 2015–2018 comparing with 2005–2008, less warm air at lower latitudes was transferred to the polar area, which played an important role in the cooling trend in September. Russell and McGregor (2010) found that atmospheric circulation change is an important driving factor of temperature fluctuations in Antarctica [34], while other factors, such as the interactions between land, sea and air, also altered the regional climate [35,36,37]. Deeper investigation will be carried out to further understand these associated mechanisms.
Figure 7 shows the trends of seasonal and yearly mean temperature within the whole troposphere (from the land surface to 10 km amsl) during 2005–2018. It can be seen that the whole troposphere warmed evidently during 2005–2018 for all seasons, and the strongest warming occurred in summer, with a trend of 1.0 °C/decade, while the mildest warming occurred in autumn and winter with a trend of 0.3 °C/decade. The yearly mean temperature showed an increasing trend of 0.6 °C/decade. The trends for surface air temperature (shown in Figure 8) were more significant, with the spring, summer, autumn, winter and yearly average temperatures increasing at a rate of 1.1, 1.3, 0.6, 1.5 and 1.1 °C/decade, respectively.

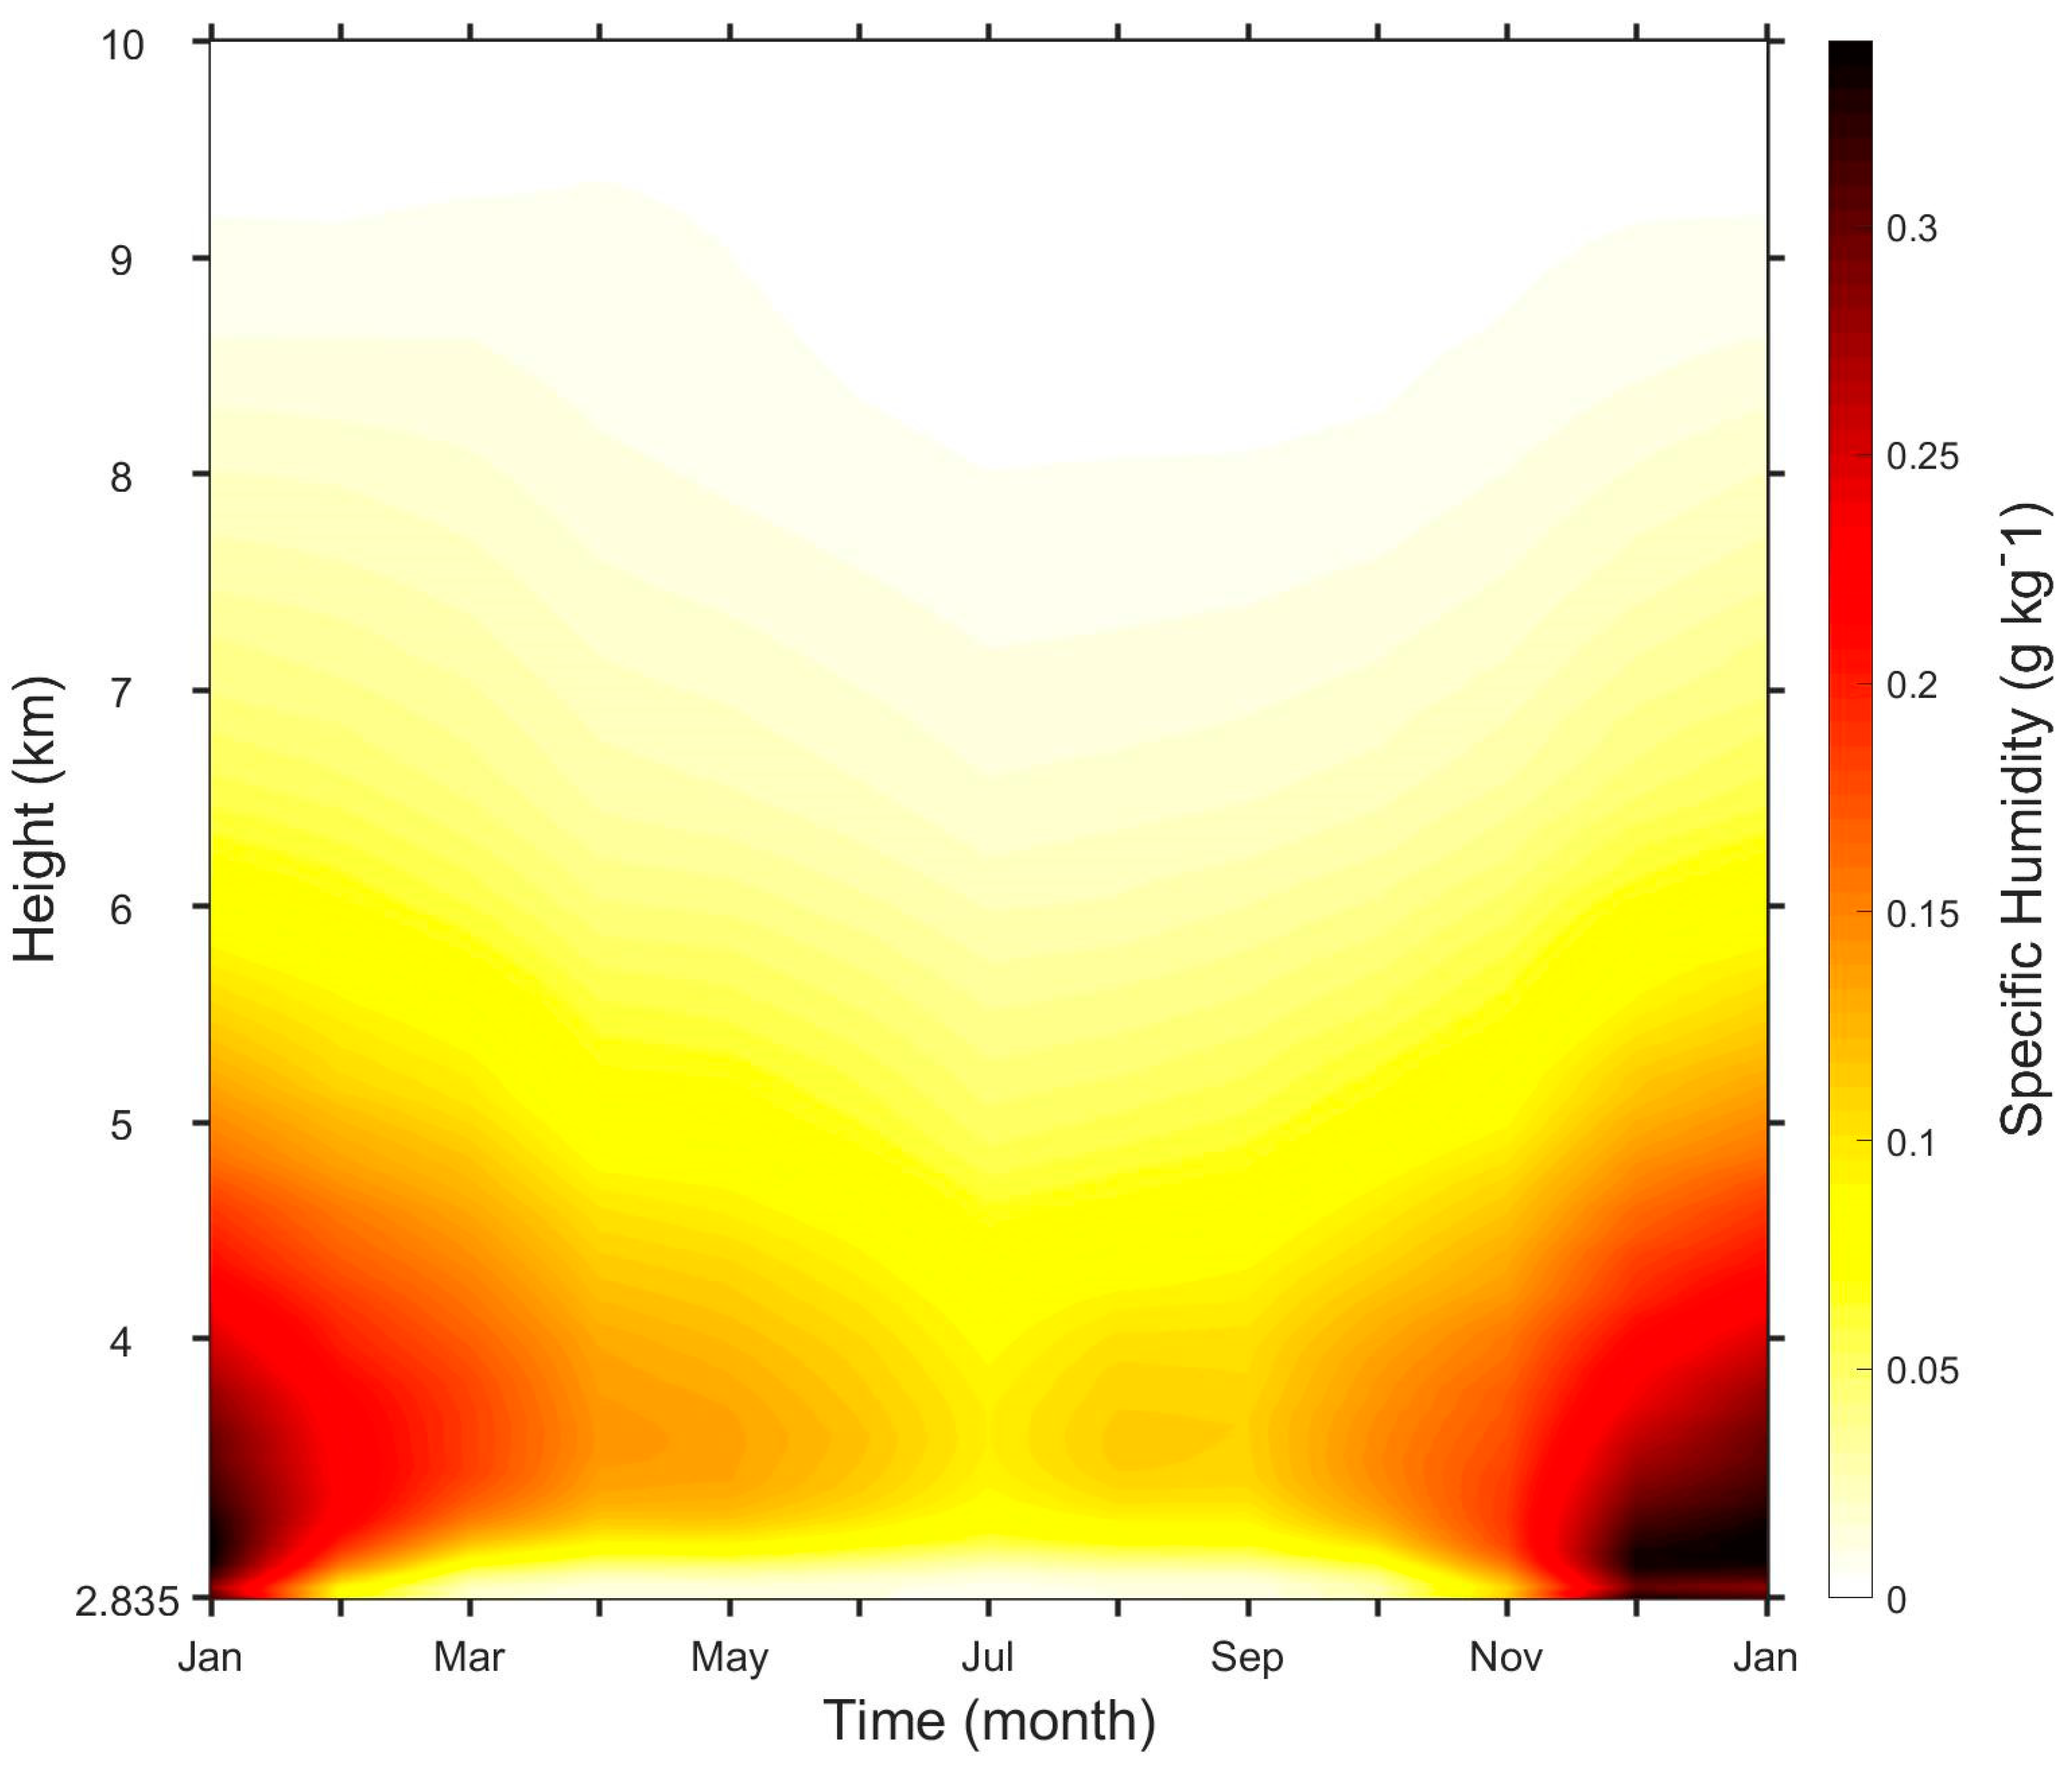
3.3. Mean State of Humidity

Figure 9 reveals the annual cycle of the specific humidity during 2005–2018. Most of the water vapor concentrated in the lowermost 3 km of the atmosphere (i.e., below 6 km amsl). The maximum humidity occurred in December at about 200 m above the surface with a value exceeding 0.35 g kg−1. Similar to the temperature inversion, humidity inversions also persisted just above the surface to about a 0.5–1 km height throughout the year, but were shallower and less frequent for summer days (also refer to Figure 10). Previous studies have also found humidity inversion in the surface layer accompanied with deposition at nighttime, using tower observations in Antarctic region [38,39]. The humidity inversion accompanying the temperature inversion is explained by the cold ice covering the ground, which creates a temperature inversion a few hundred meters high which confines most of the turbulence [40]. Vihma et al. (2011) also investigated the relationship between humidity inversion and temperature inversion and revealed dependencies between them [41,42]. Above the humidity inversion layer, the specific humidity decreased with height until reaching nearly zero at the tropopause, except for summer days when another humidity inversion appeared near the tropopause (Figure 10). The frequent humidity inversion at the tropopause on summer days should be attributed to the existence of clouds, which is consistent with the results of visual observations and remote sensing findings [43,44].

3.4. Trends of Humidity

The linear trends of the monthly and annual mean specific humidity at each height up to 10 km during 2005–2018 are presented in Figure 11. Below 5 km amsl, the annual mean specific humidity at all height levels has continued to increase over the past decade, with trends of about 0.01–0.02 g kg−1/decade, while stronger trends were observed in certain months. Trends larger than 0.02 g kg−1/decade appeared in summer months, including late spring and early autumn, and maximum values of 0.06 to 0.08g kg−1/decade were detected in December. From April to August, the wetting trends were generally smaller than 0.02 g kg−1/decade, and drying trends exceeding −0.02 g kg−1/decade took place in September, which was in accordance with the strong cooling trends in September. At an altitude range between 5 and 7 km, the wetting trend became small, generally less than 0.02 g kg−1/decade, except in January, November and December. Above 7 km height, the specific humidity remained almost invariant due to its small moisture content compared with lower levels.
The pattern of the trends of the specific humidity below 7 km generally coincides with those of temperature, which shows strong increases around summer months, and decreases in September. Nevertheless, inconsistency between the two still exits. For example, in May and August there was strong warming but only small wetting. However, the statistically significant trends in monthly mean temperature and humidity demonstrated quite similar patterns. Figure 12 further shows the trends of seasonal and yearly means of the height-averaged specific humidity from the surface to 10 km above the surface during 2005–2018. Similar to the warming trends, the seasonally averaged specific humidity also kept increasing in all the four seasons, and the strongest increase occurred in the summer, with a trend of 0.019 g kg−1/decade. For the other three seasons, the increasing trends were much smaller, with values of 0.0062, 0.0013 and 0.002 g kg−1/decade for spring, autumn and winter, respectively. The yearly humidity showed an increasing trend of about 0.007 g kg−1/decade.
The ratios between the trends of the surface to 10 km amsl averaged specific humidity and temperature were 0.009, 0.019, 0.004 and 0.007 g kg−1/°C in spring, summer, autumn and winter, respectively, which were largest (smallest) in summer (winter) and generally proportional to the height-averaged temperature. However, for spring and autumn, two seasons that had similar average temperatures, the ratios were significantly different. Therefore, near the South Pole, the moistening process was not just a simple response to warming following the Clausius–Clapeyron equation. Detailed analysis also showed that the change of humidity within the troposphere did not always follow that of the temperature there (see Figure 4 and Figure 11). Considering the site is distant from the ocean, we suggested that the change in atmospheric circulation in past decades could also be essential to the change of humidity within the troposphere through modulating the water vapor fluxes near the South Pole.

4. Summary and Conclusions

The radiosonde vertical profiles up to 10 km amsl at the South Pole in the period 2005–2018 were analyzed in this paper, and the mean annual cycle as well as the long-term trends of temperature and humidity in the vertical column were presented.
A significant annual cycle of the temperature at all heights was found with the highest temperature in summer and lowest temperature in winter. The highest (lowest) temperature in the lower troposphere was approximately −25 °C (−60 °C) in December (July) at a height of about 500 m above the surface (at surface). Surface inversion layers of about 500 m thick were commonly observed throughout the year, but they were shallower and less frequent in summer days. On the other hand, temperature inversion at the tropopause around 8–10 km amsl appeared only during summer and autumn days. The annual mean temperature throughout the troposphere showed warming trends of about 0.5–1.0 °C/decade. Near the surface, the maximum warming trend was found in October, reaching 4 °C/decade, while a drastic cooling trend of about −3 °C/decade was observed in September. Overall, the seasonal and annual mean surface temperature at the surface all showed warming trends—1.1, 1.3, 0.6, 1.5 and 1.1 °C/decade for spring, summer, autumn, winter and yearly average, respectively. For the height-averaged temperature within the surface to 10 km amsl, the warming trends were 0.7, 1.0, 0.3, 0.3 and 0.6 °C/decade for spring, summer, autumn, winter and yearly average, respectively.
Most of the water vapor was found in the lowermost 3 km of the atmosphere, and showed a similar annual cycle to temperature. The maximum humidity with a value exceeding 0.35 g kg−1 occurred in the summer at about a 200-m height above surface. Like the temperature inversions, humidity inversion layers also persisted just above the surface to about 0.5–1 km height, but were shallower and less frequent during summer days. The near-surface humidity inversion is attributed to the temperature inversion that is caused by cold ice covering the ground [39,45]. Furthermore, humidity inversion was also frequently observed at the tropopause (around 8–10 km amsl), for summer days, indicating the existence of cloud there. In the past 13 years, the annual mean specific humidity has continued increasing, with trends of about 0.01–0.02 g kg−1/decade at all levels below 5 km amsl, but almost invariant above that height. For the monthly means, values larger than 0.02 g kg−1/decade were found below 7 km amsl in the summer months, including the late spring and early autumn, but not around the winter months. Drying trends exceeding −0.02 g kg−1/decade took place in September, which is in accordance with the strong cooling trends recorded in September. Above 7 km amsl, the trends were insignificant for all of the months. The height-averaged specific humidity within surface to 10 km amsl had trends of 0.0062, 0.019, 0.0013, 0.002 and 0.007g kg−1/decade for spring, summer, autumn, winter and yearly average, respectively.
The monthly fluctuations of trends in Figure 4 and Figure 9 suggest the existence of climatological intra-seasonal variability. Similar phenomena have also occurred at other stations in Antarctica (Figures not shown). The potential causes for the intra-seasonal variations are complicated, and are related to ozone loss, downward wave coupling, cloud cover, greenhouse gas increase, atmospheric and ocean circulation alternation, air-sea-ice feedback, and so on [46,47,48]. These causes interact with each other, resulting in monthly fluctuations of temperature and humidity trends. In regards to ozone depletion, the seasonal recovery of polar ozone may be delayed by the late timing of vortex breakup [49]. The stratospheric ozone hole can induce tropospheric circulation changes, and the seasonal transition of tropospheric circulation is affected by the stratospheric final warming events [50]. Another potential mechanism is downward wave coupling, which also interacts with ozone depletion. The climatological downward wave coupling dominates the intra-seasonal dynamical coupling between the stratosphere and the troposphere, and is stronger than zonal mean coupling on the intra-seasonal time scale [51,52]. Temporal changes in stratospheric ozone associated with past depletion and future recovery significantly impact downward wave coupling. During the period of ozone depletion, the spring bounded wave geometry, which is favorable for downward wave coupling, extends into early summer due to a delay in the vortex breakup date, and leads to increased downward wave coupling during November–December [53]. Results from greenhouse gas research has shown that with the increase of atmospheric CO2 concentrations, Antarctic Oscillation exhibits a positive trend [54]. The primary intra-seasonal mode associated with Antarctic Oscillation is in connection with net upward longwave radiative fluxes and cloud cover [55]. Clouds exert an important influence on modulating radiative fluxes [44,56], and the variations in the local cloud cover and the radiative properties of Antarctica can also affect the general circulation of the atmosphere. As for atmosphere–ocean–ice interaction, sea ice has hindered the thermal interaction between atmosphere and ocean. Renwick et al. (2012) pointed out that sea ice variability can be caused by fluctuations of the atmospheric circulation associated with intra-seasonal climate variability [57]. In addition, the variability of oceanic Antarctic circumpolar transport is on intra-seasonal timescales [58], indicating the possibility of differences in monthly trends. Nonetheless, the interactions among these factors are complex, and future studies will be necessary to further clarify the characteristics and mechanisms of Antarctica’s climate intra-seasonal variability.

Author Contributions

Conceptualization, Y.L. and Q.Y.; methodology, Y.L. and Q.Y.; software, M.X.; validation and investigation, M.X., Y.L., Q.Y., A.E.G., B.H., Y.Y., L.Y. and L.W.; data and resources, M.X. and A.E.G.; writing—original draft preparation, M.X.; writing—review and editing, Y.L., Q.Y., A.E.G., B.H., Y.Y., L.Y. and L.W.

Funding

This study was supported by the National Key Research and Development Program of Ministry of Science and Technology of China (2016YFA0602100), the Opening Fund of Key Laboratory of Land Surface Process and Climate Change in Cold and Arid Regions, CAS (No. LPCC2018001, LPCC2018005), and the Opening fund of State Key Laboratory of Cryospheric Science (SKLCS-OP-2019-09).

Acknowledgments

We thank the anonymous reviewers for their time and effort in reviewing our manuscript and for their insightful comments and valuable suggestions.

Conflicts of Interest

The authors declare no conflict of interest.

References

  1. Marshall, G.J. Trends in Antarctic geopotential height and temperature: A comparison between radiosonde and ncep-ncar reanalysis data. J. Clim. 2002, 15, 659–674. [Google Scholar] [CrossRef]
  2. Guglielmin, M.; Cannone, N. A permafrost warming in a cooling Antarctica? Clim. Chang. 2012, 111, 177–195. [Google Scholar] [CrossRef]
  3. Turner, J.; Lu, H.; White, I.; King, J.C.; Phillips, T.; Hosking, J.S.; Deb, P. Absence of 21st century warming on Antarctic Peninsula consistent with natural variability. Nature 2016, 535, 411–415. [Google Scholar] [CrossRef] [PubMed] [Green Version]
  4. Oliva, M.; Navarro, F.; Hrbáček, F.; Hernández, A.; Nývlt, D.; Pereira, P.; Trigo, R. Recent regional climate cooling on the Antarctic Peninsula and associated impacts on the cryosphere. Sci. Total Environ. 2017, 580, 210–223. [Google Scholar] [CrossRef] [PubMed]
  5. Turner, J.; Colwell, S.R.; Marshall, G.J.; Lachlan-Cope, T.A.; Carleton, A.M.; Jones, P.D.; Lagun, V.; Reid, P.A.; Iagovkinaf, S. Antarctic climate change during the last 50 years. Int. J. Climatol. 2005, 25, 279–294. [Google Scholar] [CrossRef]
  6. Chapman, W.L.; Walsh, J.E. A Synthesis of Antarctic Temperatures. J. Clim. 2007, 20, 4096–4117. [Google Scholar] [CrossRef]
  7. Steig, E.J.; Schneider, D.P.; Rutherford, S.D. Warming of the Antarctic ice-sheet surface since the 1957 International Geophysical Year. Nature 2009, 457, 459–462. [Google Scholar] [CrossRef] [PubMed]
  8. Nicolas, J.P.; Bromwich, D.H. New reconstruction of Antarctic near-surface temperatures: Multidecadal trends and reliability of global reanalyses. J. Clim. 2014, 27, 8070–8093. [Google Scholar] [CrossRef]
  9. Angell, J.K. Comparison of surface and tropospheric temperature trends estimated from a 63-Station Radiosonde Network, 1958–1998. Geophys. Res. Lett. 1999, 26, 2761–2764. [Google Scholar] [CrossRef]
  10. Turner, J.; Lachlan-Cope, T.A.; Colwell, S.; Marshall, G.J.; Connolley, W.M. Significant Warming of the Antarctic Winter Troposphere. Science 2006, 311, 1914–1917. [Google Scholar] [CrossRef] [PubMed]
  11. Thompson, D.W.J.; Solomon, S. Recent Stratospheric Climate Trends as Evidenced in Radiosonde Data: Global Structure and Tropospheric Linkages. J. Clim. 2005, 18, 4785–4795. [Google Scholar] [CrossRef]
  12. Screen, J.A.; Simmonds, I. Half-century air temperature change above Antarctica: Observed trends and spatial reconstructions. J. Geophys. Res. 2012, 117, D16108. [Google Scholar] [CrossRef]
  13. Tomasi, C.; Petkov, B.H.; Benedetti, E. Annual cycles of pressure, temperature, absolute humidity and precipitable water from the radiosoundings performed at Dome C, Antarctica, over the 2005–2009 period. Antarct. Sci. 2012, 24, 637–658. [Google Scholar] [CrossRef]
  14. Sarti, P.; Negusini, M.; Tomasi, C.; Petkov, B.H.; Capra, A. Thirteen years of integrated precipitable water derived by GPS at Mario Zucchelli Station, Antarctica. Ann. Geophys. 2013, 56, R0221. [Google Scholar] [CrossRef]
  15. Chen, B.; Liu, Z. Global water vapor variability and trend from the latest 36 year (1979 to 2014) data of ECMWF and NCEP reanalyses, radiosonde, GPS, and microwave satellite. J. Geophys. Res. Atmos. 2016, 121, 11442–11462. [Google Scholar] [CrossRef]
  16. Allen, R.J.; Sherwood, S.C. Warming maximum in the tropical upper troposphere deduced from thermal winds. Nat. Geosci. 2008, 1, 399–403. [Google Scholar] [CrossRef]
  17. Vautard, R.; Cattiaux, J.; Yiou, P.; Thépaut, J.N.; Ciais, P. Northern Hemisphere atmospheric stilling partly attributed to an increase in surface roughness. Nat. Geosci. 2010, 3, 756–761. [Google Scholar] [CrossRef]
  18. Cohen, J.L.; Furtado, J.C.; Barlow, M.A.; Alexeev, V.A.; Cherry, J.E. Arctic warming, increasing snow cover and widespread boreal winter cooling. Environ. Res. Lett. 2012, 7, 14007–14014. [Google Scholar] [CrossRef]
  19. Guo, J.; Miao, Y.; Zhang, Y.; Liu, H.; Li, Z.; Zhang, W.; He, J.; Lou, M.; Yan, Y.; Bian, L.; et al. The climatology of planetary boundary layer height in China derived from radiosonde and reanalysis data. Atmos. Chem. Phys. 2016, 16, 13309. [Google Scholar] [CrossRef]
  20. Maturilli, M.; Kayser, M. Arctic warming, moisture increase and circulation changes observed in the Ny-Ålesund homogenized radiosonde record. Theor. Appl. Climatol. 2017, 130, 1–17. [Google Scholar] [CrossRef]
  21. Durre, I.; Vose, R.S.; Wuertz, D.B. Overview of the integrated global radiosonde archive. J. Clim. 2006, 19, 53–68. [Google Scholar] [CrossRef]
  22. ERA Interim. Available online: https://apps.ecmwf.int/datasets/data/interim-full-moda/levtype=pl/ (accessed on 28 June 2019).
  23. Pietroni, I.; Argentini, S.; Petenko, I. One Year of Surface-Based Temperature Inversions at Dome C, Antarctica. Bound. Layer Meteorol. 2014, 150, 131–151. [Google Scholar] [CrossRef]
  24. Zhang, Y.; Seidel, D.J.; Golaz, J.C. Climatological Characteristics of Arctic and Antarctic Surface-Based Inversions*. J. Clim. 2011, 24, 5167–5186. [Google Scholar] [CrossRef]
  25. Vose, R.S.; Asheville, N.C.; Easterling, D.R.; Gleason, B. Maximum and minimum temperature trends for the globe: An update through 2004. Geophys. Res. 2005, 32. [Google Scholar] [CrossRef] [Green Version]
  26. Pan, Y.Z.; Gao, W.; Yu, A.M. Micrornas regulate cyp3a4 expression via direct and indirect targeting. Drug Metab. 2009, 37, 2112–2117. [Google Scholar] [CrossRef] [PubMed]
  27. Kalnay, E.; Cai, M. Impact of urbanization and land-use change on climate. Nature (Lond.) 2003, 423, 528–531. [Google Scholar] [CrossRef] [PubMed]
  28. Robinson, D.A.; Jones, S.B.; Wraith, J.M.; Or, D.; Friedman, S.P. A review of advances in dielectric and electrical conductivity measurement in soils using time domain reflectometry. Vadose Zone J. 2003, 2, 444–475. [Google Scholar] [CrossRef]
  29. Kunkel, K.E.; Liang, X.Z.; Zhu, J.; Lin, Y. Can cgcms simulate the twentieth-century “warming hole” in the central united states? J. Clim. 2006, 19, 4137–4153. [Google Scholar] [CrossRef]
  30. Wang, C.; Kucharski, F.; Barimalala, R.; Bracco, A. Teleconnections of the tropical Atlantic to the tropical Indian and pacific oceans: A review of recent findings. Meteorol. Z. 2009, 18, 445–454. [Google Scholar] [CrossRef]
  31. Leibensperger, E.M.; Mickley, L.J.; Jacob, D.J.; Chen, W.T.; Seinfeld, J.H.; Nenes, A.; Adams, P.J.; Streets, D.G.; Kumar, N.; Rind, D. Climatic effects of 1950–2050 changes in US anthropogenic aerosols—Part 1: Aerosol trends and radiative forcing. Atmos. Chem. Phys. 2012, 12, 3333–3348. [Google Scholar] [CrossRef]
  32. Zaitao, P. Altered hydrologic feedback in a warming climate introduces a “warming hole”. Geophys. Res. Lett. 2004, 31, L17109. [Google Scholar]
  33. Ricaud, P.; Carminati, F.; Courcoux, Y.; Pellegrini, A.; Attié, J.-L.; el Amraoui, L.; Abida, R.; Genthon, C.; August, T.; Warner, J. Statistical analyses and correlation between tropospheric temperature and humidity at Dome C, Antarctica. Antarct. Sci. 2014, 26, 290–308. [Google Scholar] [CrossRef]
  34. Russell, A.; McGregor, G.R. Southern hemisphere atmospheric circulation: Impacts on Antarctic climate and reconstructions from Antarctic ice core data. Clim. Chang. 2010, 99, 155–192. [Google Scholar] [CrossRef]
  35. Monaghan, A.J.; Bromwich, D.H.; Chapman, W.; Comiso, J.C. Recent variability and trends of Antarctic near-surface temperature. J. Geophys. Res. 2008, 113, D04105. [Google Scholar] [CrossRef]
  36. Ding, Q.; Steig, E.J.; Battisti, D.S.; Küttel, M. Winter warming in west Antarctica caused by central tropical pacific warming. Nat. Geosci. 2011, 4, 398–403. [Google Scholar] [CrossRef]
  37. Schneider, D.; Okumura, Y.; Deser, C. Observed Antarctic interannual climate variability and tropical linkages. J. Clim. 2012, 25, 4048–4066. [Google Scholar] [CrossRef]
  38. Genthon, C.; Town, M.S.; Six, D.; Favier, V.; Argentini, S.; Pellegrini, A. Pellegrini Meteorological atmospheric boundary layer measurements and ECMWF analyses during summer at Dome C, Antarctica. J. Geophys. Res. Atmos. 2010, 115. [Google Scholar] [CrossRef]
  39. Liu, C.; Li, Y.; Yang, Q.; Wang, L. On the surface fluxes characteristics and roughness lengths at Zhongshan station, Antarctica. Int. J. Dig. Earth 2017, 1–15. [Google Scholar] [CrossRef]
  40. Travouillon, T.; Ashley, M.C.B.; Burton, M.G.; Storey, J.W.V.; Loewenstein, R.F. Atmospheric turbulence at the south pole and its implications for astronomy. Astron. Astrophys. 2003, 400, 1163–1172. [Google Scholar] [CrossRef]
  41. Vihma, T.; Kilpeläinen, T.; Manninen, M.; Sjöblom, A.; Jakobson, E.; Palo, T.; Jaagus, J.; Maturilli, M. Characteristics of temperature and humidity inversions and low-level jets over Svalbard Fjords in spring. Adv. Meteor. 2011, 486807. [Google Scholar] [CrossRef]
  42. Vihma, T.; Tuovinen, E.; Savijärvi, H. Interaction of katabatic winds and near-surface temperatures in the Antarctic. J. Geophys. Res. 2011, 116. [Google Scholar] [CrossRef]
  43. Mahesh, A.; Walden, V.P.; Warren, S.G. Ground-based infrared remote sensing of cloud properties over the Antarctic Plateau. Part I: Cloud-base heights. J. Appl. Meteorol. 2001, 40, 1265–1278. [Google Scholar] [CrossRef]
  44. Bromwich, D.H.; Nicolas, J.P.; Hines, K.M.; Kay, J.E.; Key, E.L.; Lazzara, M.A. Tropospheric clouds in Antarctica. Rev. Geophys. 2012, 50, 605–606. [Google Scholar] [CrossRef]
  45. Nygård, T.; Valkonen, T.; Vihma, T. Antarctic Low-Tropospheric Humidity Inversions: 10-Yr Climatology. J. Clim. 2013, 26, 5205–5219. [Google Scholar] [CrossRef]
  46. Vaughan, D.G.; Marshall, G.J.; Connolley, W.M.; Parkinson, C.; Mulvaney, R.; Hodgson, D.A.; King, J.C.; Pudsey, C.J.; Turner, J. Recent rapid regional climate warming on the Antarctic Peninsula. Clim. Chang. 2003, 60, 243–274. [Google Scholar] [CrossRef]
  47. Shine, K.P.; Bourqui, M.S.; Forster, P.D.; Hare, S.H.; Langematz, U.; Braesicke, P.; Grewe, V.; Ponater, M.; Schnadt, C.; Smith, C.A.; et al. A comparison of model-simulated trends in stratospheric temperatures. Q. J. R. Meteorol. Soc. 2003, 129, 1565–1588. [Google Scholar] [CrossRef] [Green Version]
  48. Randel, W.J.; Shine, K.P.; Austin, J.; Barnett, J.; Claud, C.; Gillett, N.P.; Keckhut, P.; Langematz, U.; Lin, R.; Long, C. An update of observed stratospheric temperature trends. J. Geophys. Res. 2009, 114, D02107. [Google Scholar] [CrossRef]
  49. Salby, M.L.; Callaghan, P.F. Influenceofplanetarywave activity on the stratospheric final warming and spring ozone. J. Geophys. Res. 2007, 112, D20111. [Google Scholar] [CrossRef]
  50. Black, R.X.; Mcdaniel, B.A. Interannual Variability in the Southern Hemisphere Circulation Organized by Stratospheric Final Warming Events. J. Atmos. Sci. 2006, 64, 2968–2974. [Google Scholar] [CrossRef]
  51. Shaw, T.A.; Perlwitz, J.; Harnik, N. Downward wave coupling between the stratosphere and troposphere: The importance of meridional wave guiding and comparison with zonal-mean coupling. J. Clim. 2010, 23, 6365–6381. [Google Scholar] [CrossRef]
  52. Harnik, N.; Perlwitz, J.; Shaw, T.A. Observed decadal changes in downward wave coupling between the stratosphere and troposphere in the Southern Hemisphere. J. Clim. 2011, 24, 4558–4569. [Google Scholar] [CrossRef]
  53. Shaw, T.A.; Perlwitz, J.; Harnik, N.; Newman, P.A.; Pawson, S. The Impact of Stratospheric Ozone Changes on Downward Wave Coupling in the Southern Hemisphere. J. Clim. 2011, 24, 4210–4229. [Google Scholar] [CrossRef]
  54. Cai, W.; Whetton, P.; Karoly, D.J. The Response of the Antarctic Oscillation to Increasing and Stabilized Atmospheric CO2. J. Clim. 2003, 16, 101525–101538. [Google Scholar] [CrossRef]
  55. Yu, L.; Zhang, Z.; Zhou, M.; Zhong, S.; Sun, B.; Hsu, H.; Gao, Z.; Wu, H.; Ban, J. The intraseasonal variability of winter semester surface air temperature in Antarctica. Polar Res. 2011, 30, 6039. [Google Scholar] [CrossRef]
  56. Scott, R.C.; Lubin, D.; Vogelmann, A.M.; Kato, S. West Antarctic Ice Sheet cloud cover and surface radiation budget from NASA A-train satellites. J. Clim. 2017. [Google Scholar] [CrossRef]
  57. Renwick, J.A.; Kohout, A.; Dean, S. Atmospheric forcing of Antarctic sea ice on intraseasonal timescales. J. Clim. 2012, 25, 5962–5975. [Google Scholar] [CrossRef]
  58. Matthews, A.J.; Meredith, M.P. Variability of Antarctic circumpolar transport and the Southern Annular Mode associated with the Madden-Julian Oscillation. Geophys. Res. Lett. 2004, 31, L24312. [Google Scholar] [CrossRef]
Figure 1. Mean annual cycle of temperature at each height level up to 10 km during 2005–2018.
Atmosphere 10 00365 g001
Figure 2. Temperature profiles for (a) spring, (b) summer, (c) autumn and (d) winter from Amundsen–Scott radiosonde profiles during 2005–2018. The long-term seasonal mean is indicated by the solid lines and ±1 standard deviations are shown as the dashed lines, while maximum and minimum temperatures are represented with dotted lines.
Atmosphere 10 00365 g002
Figure 3. Occurrence frequency of temperature inversion layers in weekly slots at each height level up to 10 km during 2005–2018.
Atmosphere 10 00365 g003
Figure 4. Temperature trends calculated from monthly and annual means at each height level up to 10 km during 2005–2018. Dots indicate that trends are significant at a 95% confidence level.
Atmosphere 10 00365 g004
Figure 5. Averaged surface–10 km amsl temperature trends for August and September during 2005–2018 (the real lines). Linear fitted lines (the dashed lines) and the corresponding equations are also presented.
Atmosphere 10 00365 g005
Figure 6. The spatial pattern of temperature in (a,b) August and (g,h) September, and geopotential (c,d) height and (e,f) winds in August at 500 hPa during 2005–2008 (left panels) and 2015–2018 (right panels).
Atmosphere 10 00365 g006
Figure 7. The seasonal and yearly means of temperature within the troposphere (from the surface up to 10 km amsl) during 2005–2018 (the real lines). Linear fitted lines (the dashed lines) and the corresponding equations are also presented.
Atmosphere 10 00365 g007
Figure 8. Similar to Figure 5, but for surface air temperature.
Atmosphere 10 00365 g008
Figure 9. Mean annual cycle of specific humidity at each height level up to 10 km during 2005–2018.
Atmosphere 10 00365 g009
Figure 10. Occurrence frequency of specific humidity inversion layers in weekly slots at each height level up to 10 km during 2005–2018.
Atmosphere 10 00365 g010
Figure 11. Same as Figure 4, but for specific humidity.
Atmosphere 10 00365 g011
Figure 12. Same as Figure 5, but for specific humidity.
Atmosphere 10 00365 g012

