Article

Web Application for Atmospheric Aerosol Data Management: Software and Case Study in the Spanish Network on Environmental Differential Mobility Analysers

by
Javier Andrade-Garda
1,
Sonia Suárez-Garaboa
1,
Antonio Álvarez-Rodríguez
2,
María Piñeiro-Iglesias
3,
Purificación López-Mahía
3,
Elías Díaz-Ramiro
4,
Begoña Artíñano
4 and
Francisco J. Gómez-Moreno
4,*
1
Departamento de Computación, Facultad de Informática, Universidade da Coruña, Grupo ISLA, Elviña, 15071 A Coruña, Spain
2
Transglobal, Grupo Davila, Muelle de Guixar, 36207 Vigo, Spain
3
Grupo QANAP, IUMA, CICA, Departamento de Química, Facultad de Ciencias, Universidade da Coruña, Zapateira, 15071 A Coruña, Spain
4
Department of Environment, CIEMAT, 28040 Madrid, Spain
*
Author to whom correspondence should be addressed.
Atmosphere 2019, 10(5), 279; https://doi.org/10.3390/atmos10050279
Submission received: 25 March 2019 / Revised: 9 May 2019 / Accepted: 14 May 2019 / Published: 17 May 2019
(This article belongs to the Special Issue Atmospheric Aerosol Regional Monitoring)

Abstract

:
SCALA© (Sampling Campaigns for Aerosols in the Low Atmosphere) is a web-based software system that was developed in a multidisciplinary manner to integrally support the documentation and the management and analysis of atmospheric aerosol data from sampling campaigns. The software development process applied considered the prototyping and the evolutionary approaches. The software product (SCALA©) allows for the comprehensive management of the sampling campaigns’ life cycle (management of the profiles and processes involved in the start-up, development and closure of a campaign) and provides support for both intra- and inter-campaigns data analysis. The pilot deployment of SCALA© considers the Spanish Network on Environmental Differential Mobility Analysers (DMAs) (REDMAAS) and the PROACLIM project. This research project involves, among other objectives, the study of temporal and spatial variations of the atmospheric aerosol through a set of microphysical properties (size distribution, optical properties, hygroscopicity, etc.) measured in several locations in Spain. The main conclusions regarding size distribution are presented in this work. These have been have been extracted through SCALA© from the data collected in the REDMAAS 2015 and 2019 intercomparison campaigns and two years (2015 and 2016) of measurements with two Scanning Mobility Particle Sizers (SMPS) at CIEMAT (Madrid, central Spain) and UDC (A Coruña, NW of Spain) sites.

1. Introduction

Atmospheric particles present a great heterogeneity that characterises both their spatio-temporal distribution in the atmosphere and their physico-chemical properties. One of the most important properties is their size, as it affects their behaviour and provides information about their origin and history. In fact, size distributions play an important role in understanding the processes where the aerosol is involved and its changes associated in both the short and long term [1,2]. Thus, for example, the processes of radiation-material interaction known as scattering and absorption depend on particle size. Conversely, health effect studies need the size distribution to obtain the particle fraction that is deposited in the respiratory system and even that which is able to penetrate into the bloodstream [3,4].
With regards to the effect of atmospheric particles in global warming, they influence the climate system and play a key role in the Earth’s radiative balance [5,6]. Atmospheric aerosols produce a net climate cooling effect, although there are specific warning components. As the 5th Assessment Report (AR5) [7] asserts “there is high confidence that the global mean total aerosol radiative forcing has counteracted a substantial portion of radiative forcing from well-mixed greenhouse gases”. Since the atmospheric aerosols contribute to a net reduction of 5–10% in the solar energy received at the Earth’s surface, the dynamics of the atmospheric aerosol load and behaviour is of vital importance for the science and policy of global climate change [8]. Optical properties are, in particular, dependent on the size, shape and chemical composition, but aerosol can either absorb or scatter radiation contributing to the cooling or warming depending on its state along its lifecycle in the atmosphere. Thus, the ageing process highly modifies not only the already complex initial structure of particles, and therefore their optical properties (absorption/scattering), but also their hygroscopicity, thus modifying the wet removal efficiency and their lifetime in the atmosphere [9,10,11,12].
On the other hand, aerosol size evolves permanently as a function of temperature and relative humidity by sublimation or condensation processes on pre-existent particles or by coagulation and fragmentation processes [13]. Aerosol size distribution therefore presents a high spatial and temporal variability depending on aerosol sources, atmospheric processes, and characteristics of the airmass, representing a high uncertainty source in climate models.
From an air quality point of view, the current standards (PM10 and PM2.5) are based on the particle mass concentrations. These concentrations are not the most adequate to measure the particles below 100 nm, where the number concentration is the key parameter [14]. Moreover, some toxicological findings suggest stronger effects of smaller particles, particulate matter with aerodynamic diameter <2.5 μm (PM2.5), or even smaller particles with diameter <0.1 μm, compared with larger, coarse particles with diameter 2.5–10 μm (PM2.5–10) [15]. Thus, the current standard could not be representative enough to reach conclusions about the relationship between the ultrafine particles and their health effects [16,17].
The particle size distribution measurements in the submicron range are mainly done by using an instrument usually known as SMPS (Scanning Mobility Particle Sizer), which is a combination of a DMA (Differential Mobility Analyser) and a CPC (Condensation Particle Counter). As this is a complex instrument, it requires strict quality control protocols. This, as well as the increase in the number of instruments deployed all over the world, have given rise to the creation of several instrumental networks that provide criteria and procedures for data quality assurance. In Europe, ACTRIS (Aerosols, Clouds, and Trace gases Research InfraStructure network, http://www.actris.net/) is the reference network [18]. In Spain, the REDMAAS was established in 2010 including research groups and interested companies [19]. The main purpose and advantages of these networks are the establishment of common and validated protocols for measuring and data treatment, as well as calibration and intercomparison exercises that provide a solid ground to fulfil the data quality objectives.
For the instruments belonging to these networks, and previously to any measurement period, it is obviously necessary to check that all of them providing data are working properly and the quality protocols are implemented and compatible. Moreover, it is also necessary to assure that all the instruments involved in the size distribution measurements give comparable results. With this aim, periodical intercomparison exercises (campaigns, e.g., one per year) are highly recommended. Once the instruments are working properly, the measurement period can start to obtain time series. After the time series were obtained, they were analysed in order to interpret daily, weekly and seasonal evolution and variations of particle size distributions and particle number concentration. In addition, a statistical study has to be conducted to identify similar patterns of aerosol behaviour between the different considered stations. Moreover, regarding to aerosol formation processes, a detailed analysis of the temporal series searching for nucleation and shrinkage events is highly desirable.
The Spanish R&D Plan supported the PROACLIM project during 2015–2017. This research project involved, among other objectives, the study of temporal and spatial variations of the atmospheric aerosol through a group of microphysical properties (size distribution, optical properties, hygroscopicity, etc.) in several locations in Spain. As part of this project, and in order to support the above-described work in REDMAAS (intercomparison campaigns, measurement campaigns and data analysis), a web-based software application was developed: SCALA©. This software: (i) allows to manage related data and documentation and (ii) provides data analysis support for the study of the geographical variations in Spain of the aerosol size distribution considering the REDMAAS network.
The necessity of SCALA© arises from the fact that the associated work was traditionally carried out in an eminently manual way. Thus, for example, dates and places for a campaign were agreed on after an extensive exchange of e-mails and, or, telephone calls, and data processing and analysis were done by integrating and managing a hand-made spreadsheet by the environment technicians. In the best case, the agreement was made using Doodle and data were exchanged through Dropbox or Google Drive for later integration and analysis. In the case of REDMAAS website, it was only possible to upload photos and documentation related to campaigns (not measurement data). Moreover, a previous great effort of standardisation of formats was required for this integration and then, to proceed with the data analysis, it was also necessary a skilled handling of, for example, a spreadsheet such as Excel and, or, a package such as R [20].
In short, there was no software application supporting in a holistic way the work associated with all the sampling campaigns activities. For this reason, SCALA© was developed as a holistic solution to the problem presented (Figure 1). In this way, the provided computer support avoids arbitrary errors in the manual manipulation of data (efficacy) and optimises the effort (efficiency). As an example of the last, it should be noted that simply preparing the data files to be uploaded to the ACTRIS website could lead to one month of work the first time due to the complexity of its format and, mainly, to the ad-hoc work needed to be done depending on each measuring instrument considered. Currently, with SCALA©, the standardisation of the files takes less than 30 minutes (much less even if, for example, macros are used in Excel). In addition, the call for campaigns, the work during the campaigns and the subsequent data analysis have been significantly improved and fully integrated into a unique software tool. In fact, once the data have been uploaded to the application, the data analysis both intra- and inter-campaigns is immediate.
In this article we give a description of SCALA© (software development process followed and product functionalities achieved) and present its application to a real case in the frame of the Spanish REDMAAS: main conclusions regarding size distribution from the data collected in the REDMAAS 2015 and 2019 intercomparison campaigns and two years (2015 and 2016) of measurements with two SMPS at CIEMAT and UDC sites are provided.

2. SCALA© Description

2.1. Software Process Followed in SCALA© Development

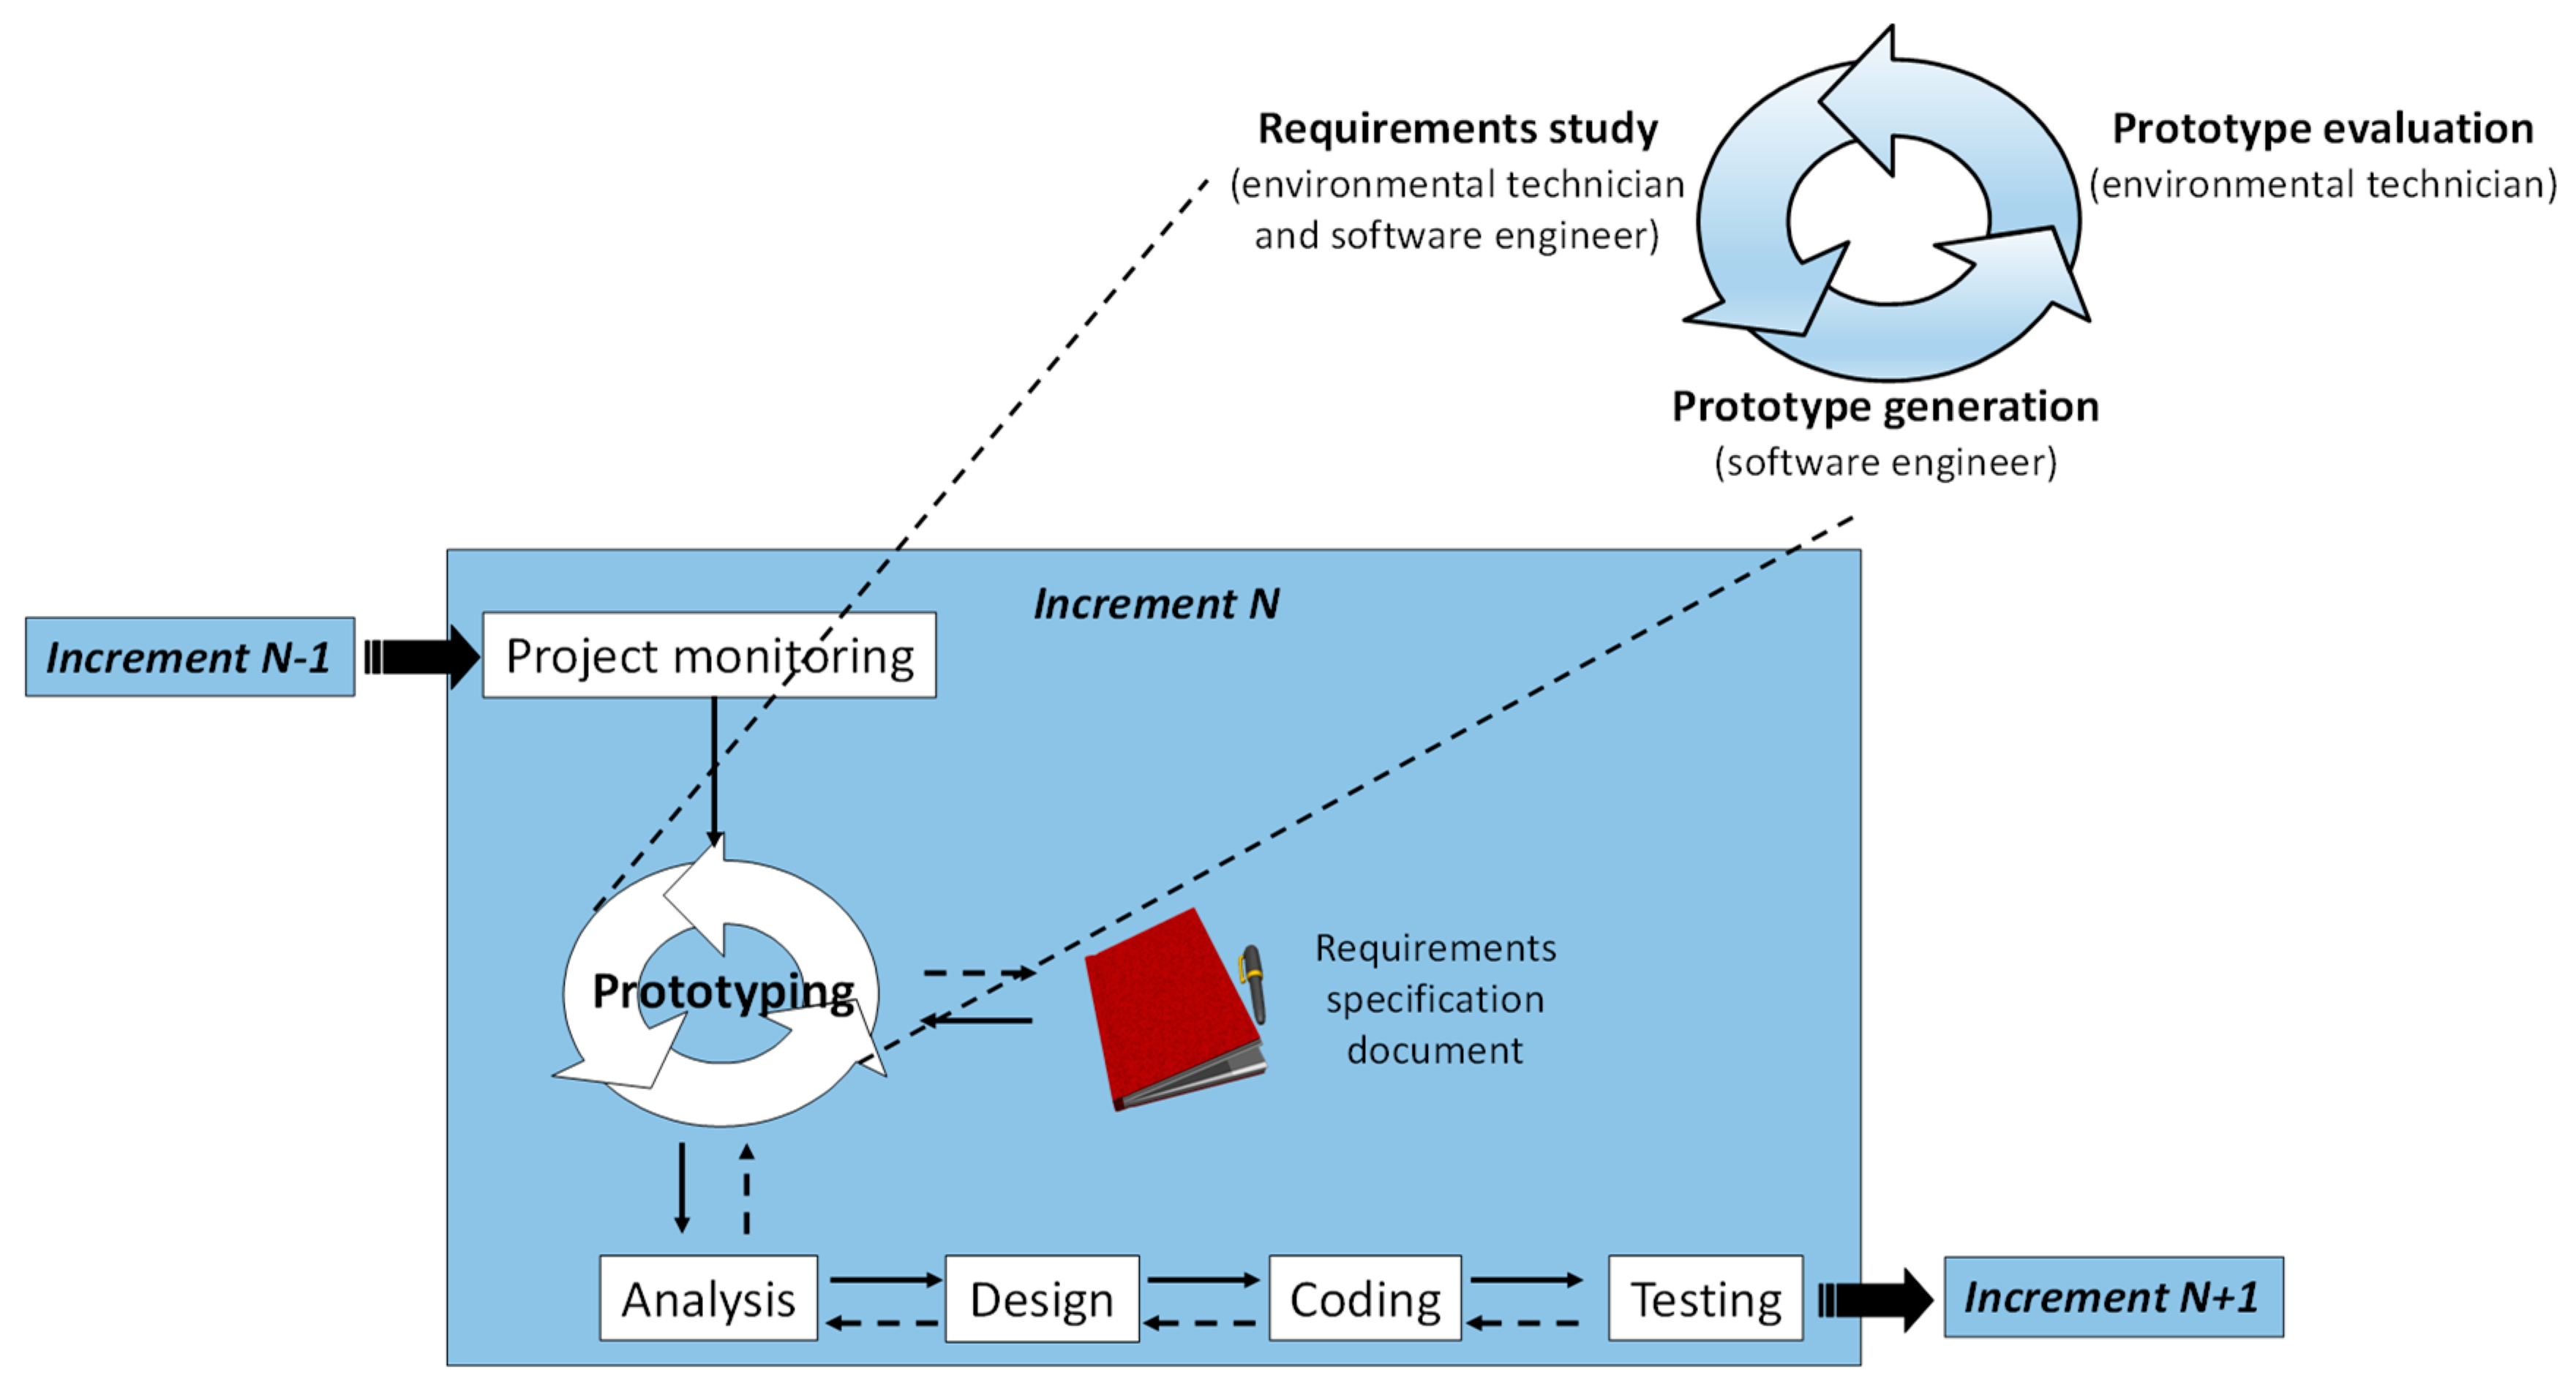
The web platform (https://proaclim.udc.es), which has a public section (in Spanish) to promote and inform about the PROACLIM project and a private functional section (in English or Spanish depending on the registered user’s selection) for managing and analysing data and documentation from campaigns, was developed in increments (Figure 2) (i.e., following an incremental software development model [21]).
The software development started with several working meetings between the environmental technicians and the software developers in order to establish the functionalities of the software product. As a result, a SRS (Software Requirements Specifications) [22] document was agreed.
In the following, and based on this SRS, the software process continued considering three software development paradigms: Prototyping, Incremental and Waterfall [21]. This approach is quite similar to the one described in [23], which introduces interesting advantages: (i) it emphasises active participation and involvement of environmental technicians along the entire development project, focusing on their requirements, their real needs, and the progressive software validation, (ii) it allows the partial and progressive software product development and implantation and (iii) it allows to decide when the new requirements appeared in the development stage—and, therefore, after the definition stage (SRS)—should be considered.
Prototyping greatly facilitated the creation of the model of the desired application, thus allowing for the maximum involvement of users in the detailed requirements identification and the SCALA©’s interface design. From the point of view of environmental technicians (users), this approach has basically allowed for defining the appearance of the screens and the “screens dynamics” of the software (i.e., the interface). From the point of view of software engineers, requirement details have been clarified and a stable basis upon to develop the software application was established. In the case of SCALA©, Prototyping involved static HTML pages that presented some interaction using links and fictitious selectors.
The incremental development approach guided the development of SCALA© through three increments or deliveries, since it allows for the development of software considering the features that the application must fulfil in a progressive manner. Each of these increments can be considered as a new development (sub)process (following, in this case, the classical Waterfall development cycle), whose results have to be integrated in the already existing ones (software of the previous increments). Next, we describe the activities for each increment, without considering the already described Prototyping:
  • Project monitoring. In this activity the effort, duration and cost of the project are studied. First, the planning for the whole project is done (estimated data). Then, at the beginning of each increment, this planning is monitored (real vs. estimated data) and readjusted if needed. The project leader (a software engineer in our case) performs this activity, and both environmental technicians and software engineers are involved.
  • Analysis. In this activity, the features that will be considered in the coding activity are analysed, specified and documented. In our case, SCALA© has been developed following the Object-Oriented technical paradigm [22]. Taking this into account, the work team has basically employed in this activity (i) UML (Unified Modelling Language) [24] use-case diagrams and (ii) UML sequence diagrams, to show the sequence of messages between the user and the application and the necessary intermediate steps for each use-case identified. The next section briefly describes the main use-cases identified. These diagrams were developed by software engineers and validated by environmental technicians.
  • Design. This activity, as well as the following one, is performed only by software engineers, since these are technical activities. In this activity, and starting from the previous diagrams, software engineers define an adequate design solution. In the case of SCALA©, they mainly develop UML class and package diagrams.
  • Coding. This activity implies the codification of the previous design specifications into the selected platform. For SCALA© development different technologies were employed, all of them free (open source). The most relevant ones are the following: MySQL as DBMS (Data Base Management System), Java EE (Java Platform, Enterprise Edition) and JavaScript, HTML, Apache Tomcat and Apache HTTP Server, and R and JRI (an interface between Java and R allowing for the execution of R code in Java applications).
  • Testing. This is the last activity of each increment, where the four test levels (i.e., white box and black box approaches) [22] are performed considering the software developed. The most important here is the validation or user level. In this level, the portion of the software application developed is presented to users, who use and validate it. The goal is to assure that the software developed fulfils the specified features (SRS document) and the details agreed during the Prototyping.
Although SCALA© development was finished at the end of the third increment (seven months), partial “versions” were delivered to environmental technicians at the end of each increment (functional increments at the fourth, sixth and seventh month), thereby avoiding the main limitation of classical development approaches (e.g., Waterfall): there is no (functional) software before the end of the development.
Changes in established requirements and new requirements obviously emerged after agreeing on the SRS document. Nevertheless, the Incremental approach also provides a suitable framework to manage these issues. Thus, the project monitoring activity in each increment was used to evaluate these SRS modifications. Those which had an acceptable impact were agreed to be considered in the following increments. Modifications with a greater impact were agreed to be considered in the next version of SCALA© (cf. last section of conclusions and future work).
Finally, it should be noted that it was not necessary to provide any additional training for SCALA© due to the continuous involvement in the development process by environmental technicians. A very light user manual (fifteen pages) was deemed sufficient. This continuous involvement also avoided non-desirable software.

2.2. Overview of SCALA©

SCALA© has the following user profiles: administrator, group manager, campaign manager, technical user, and external/guest/anonymous user (i.e., non-registered user). Next, we briefly describe these profiles and the main features of SCALA© considering the three increments involved in its development.
The user profiles in SCALA© are:
  • Administrator. This profile corresponds to the technical administrator (of the software application).
  • Group manager. This profile corresponds to the responsible for managing a group (of environmental technicians). She/he manages the members and instruments of her/his group, votes in the surveys about the campaigns the group was invited to, and sets the configuration for the group equipment in campaigns.
  • Campaign manager. This profile corresponds to a group manager that registers a campaign. The campaign manager for a campaign is the group manager that registered it in SCALA©.
  • Technical user. This profile corresponds to a member belonging to a group (of environmental technicians).
  • External/guest/anonymous user. This profile corresponds to a non-registered user, who can request access to SCALA©.
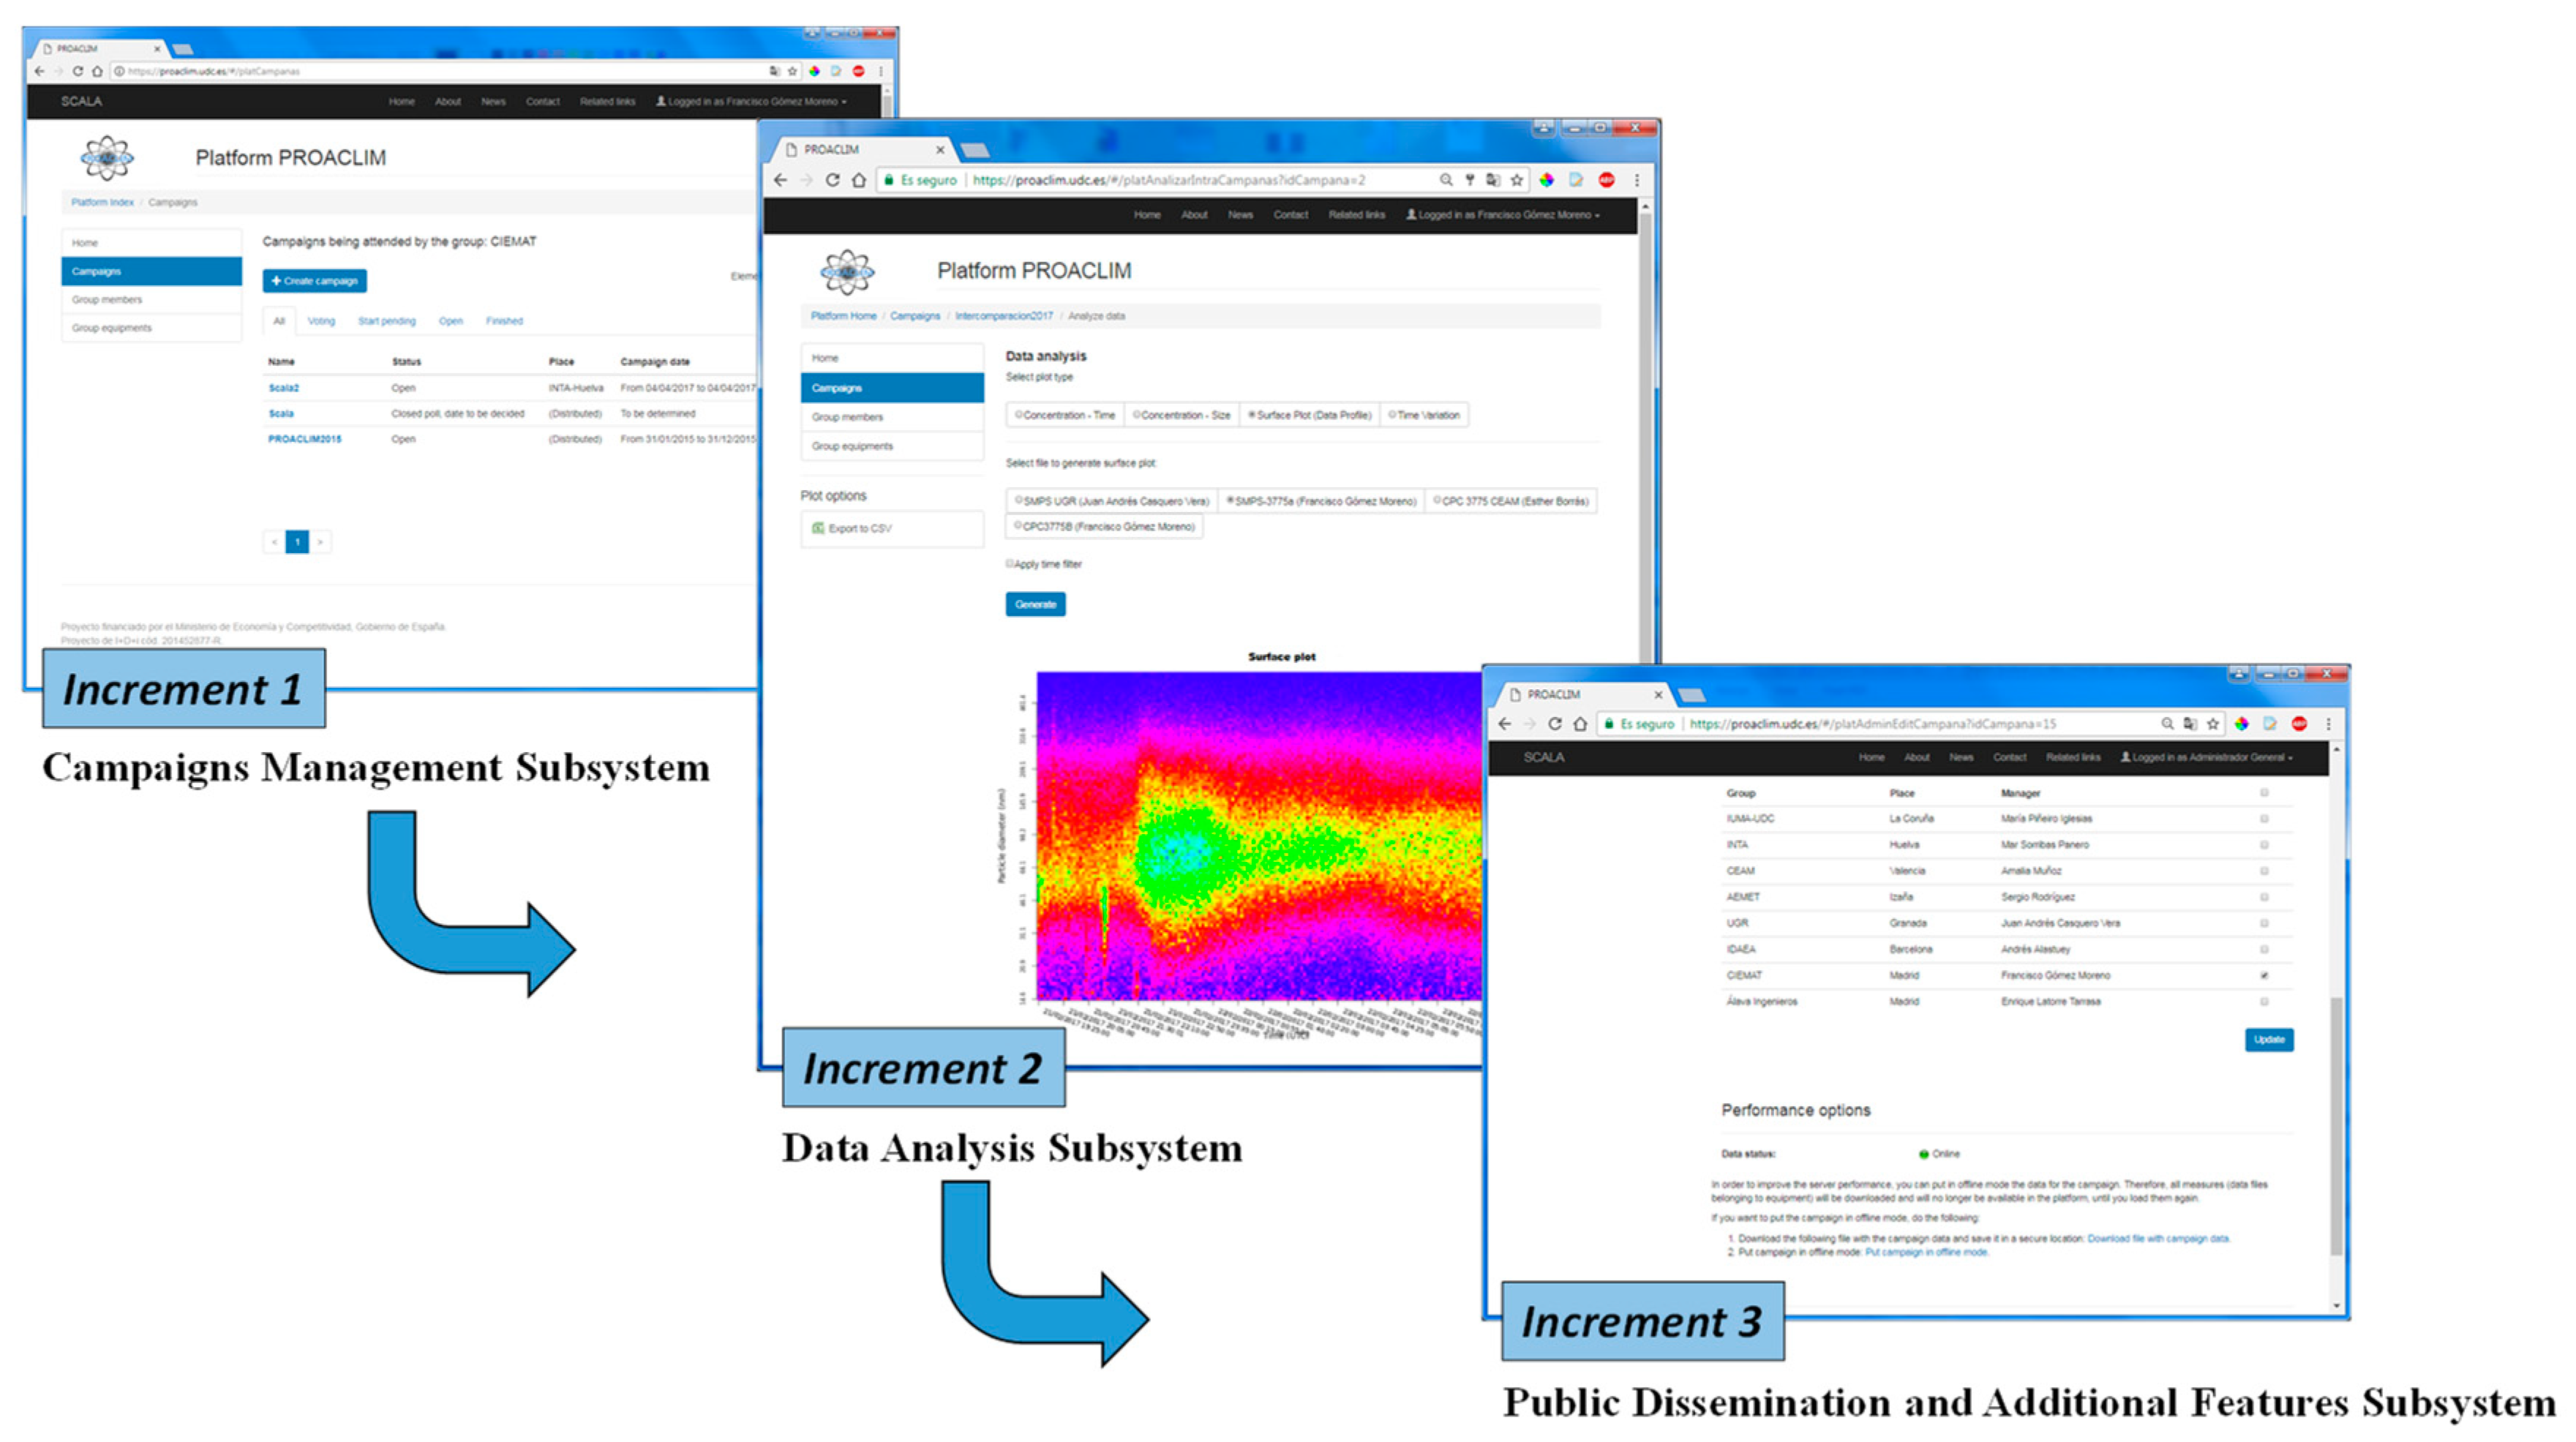
The main features of SCALA©, considering the aforementioned profiles and the three increments involved in its development, are as follows (Figure 3):
  •  First increment: Campaigns Management Subsystem.
    User, groups and equipment management (by the administrator).
    General software settings (by the administrator).
    Management of campaigns life cycle (by the campaign manager):
    -
    Invitations to groups for participation in a campaign.
    -
    Campaign surveys management (for date and place agreement).
    -
    Campaign opening.
    -
    Campaign closing.
    Data files, documentation and incidents upload (by technical users and, or, group managers).
  •  Second increment: Data Analysis Subsystem.
    Intra and inter-campaign analysis (by technical users, group managers and, or, campaign managers):
    -
    Data files selection.
    -
    On-line charts:
    Surface plot (Data profile): For a selected equipment and a measurement data file, representation of the concentration values for each size and date.
    Time variation plots: Comparative analysis of data taking into account different groupings: per weekday, per hour and per month.
    -
    On-line and Excel charts:
    Concentration-time: Evolution of the total concentration of particles considering all sizes and the time in which the measurements were made.
    Concentration-size: Evolution of the concentration considering the particle size using the average concentration contained in a data file for each particle size.
    -
    Data and chart exportation to Excel (for concentration-time and concentration-size charts) and data exportation to CSV (for data profile and time variation plots charts).
  •  Third increment: Public Dissemination and Additional Features Subsystem.
    Performance optimisation of the application (by the administrator):
    -
    Putting campaigns in off-line and on-line mode.
    Requesting access to SCALA© (by non-registered users).
    Public promotion/dissemination of the PROACLIM project:
    -
    Information about the project and groups involved.
    -
    News section, with events (published by group managers) and campaigns information (published automatically when a campaign manager finally decides the place and date for a campaign).

2.3. Pilot Deployment of SCALA©

The pilot deployment of SCALA© involved the Spanish REDMAAS and the aforementioned PROACLIM project. In this scenario, the SCALA©’s server is hosted on a Dell PowerEdge T110 II configured as follows:
  • Intel® Xeon® E3-1240v2 processor (4 cores, 3.30GHz, 8MB cache, 69W).
  • 8GB RAM 1.600MHz.
  • 2 hard disks Near Line SAS 1TB 6Gbps in RAID 1 through a PERC H200 hardware controller.
  • DVD+/−RW SATA.
  • External hard disk (3TB) for back-up purposes.
  • Ubuntu 14.04 LTS as operating system.
Additionally, this server is connected to an uninterruptible power supply (UPS) to assure its constant availability or its correct shut down in case of power-interruptions. The selected UPS was a Dell Smart-UPS 1.500VA LCD 230V.

3. SCALA© in the Spanish REDMAAS: Result Analysis

During September–October 2015 there was a PROACLIM intercomparison campaign involving several groups belonging to REDMAAS [25]. In this section, we will show the main results obtained during this campaign through SCALA©. In order to simplify the graphics, only the data obtained by two groups (UDC and CIEMAT; authors of this paper) have been included.
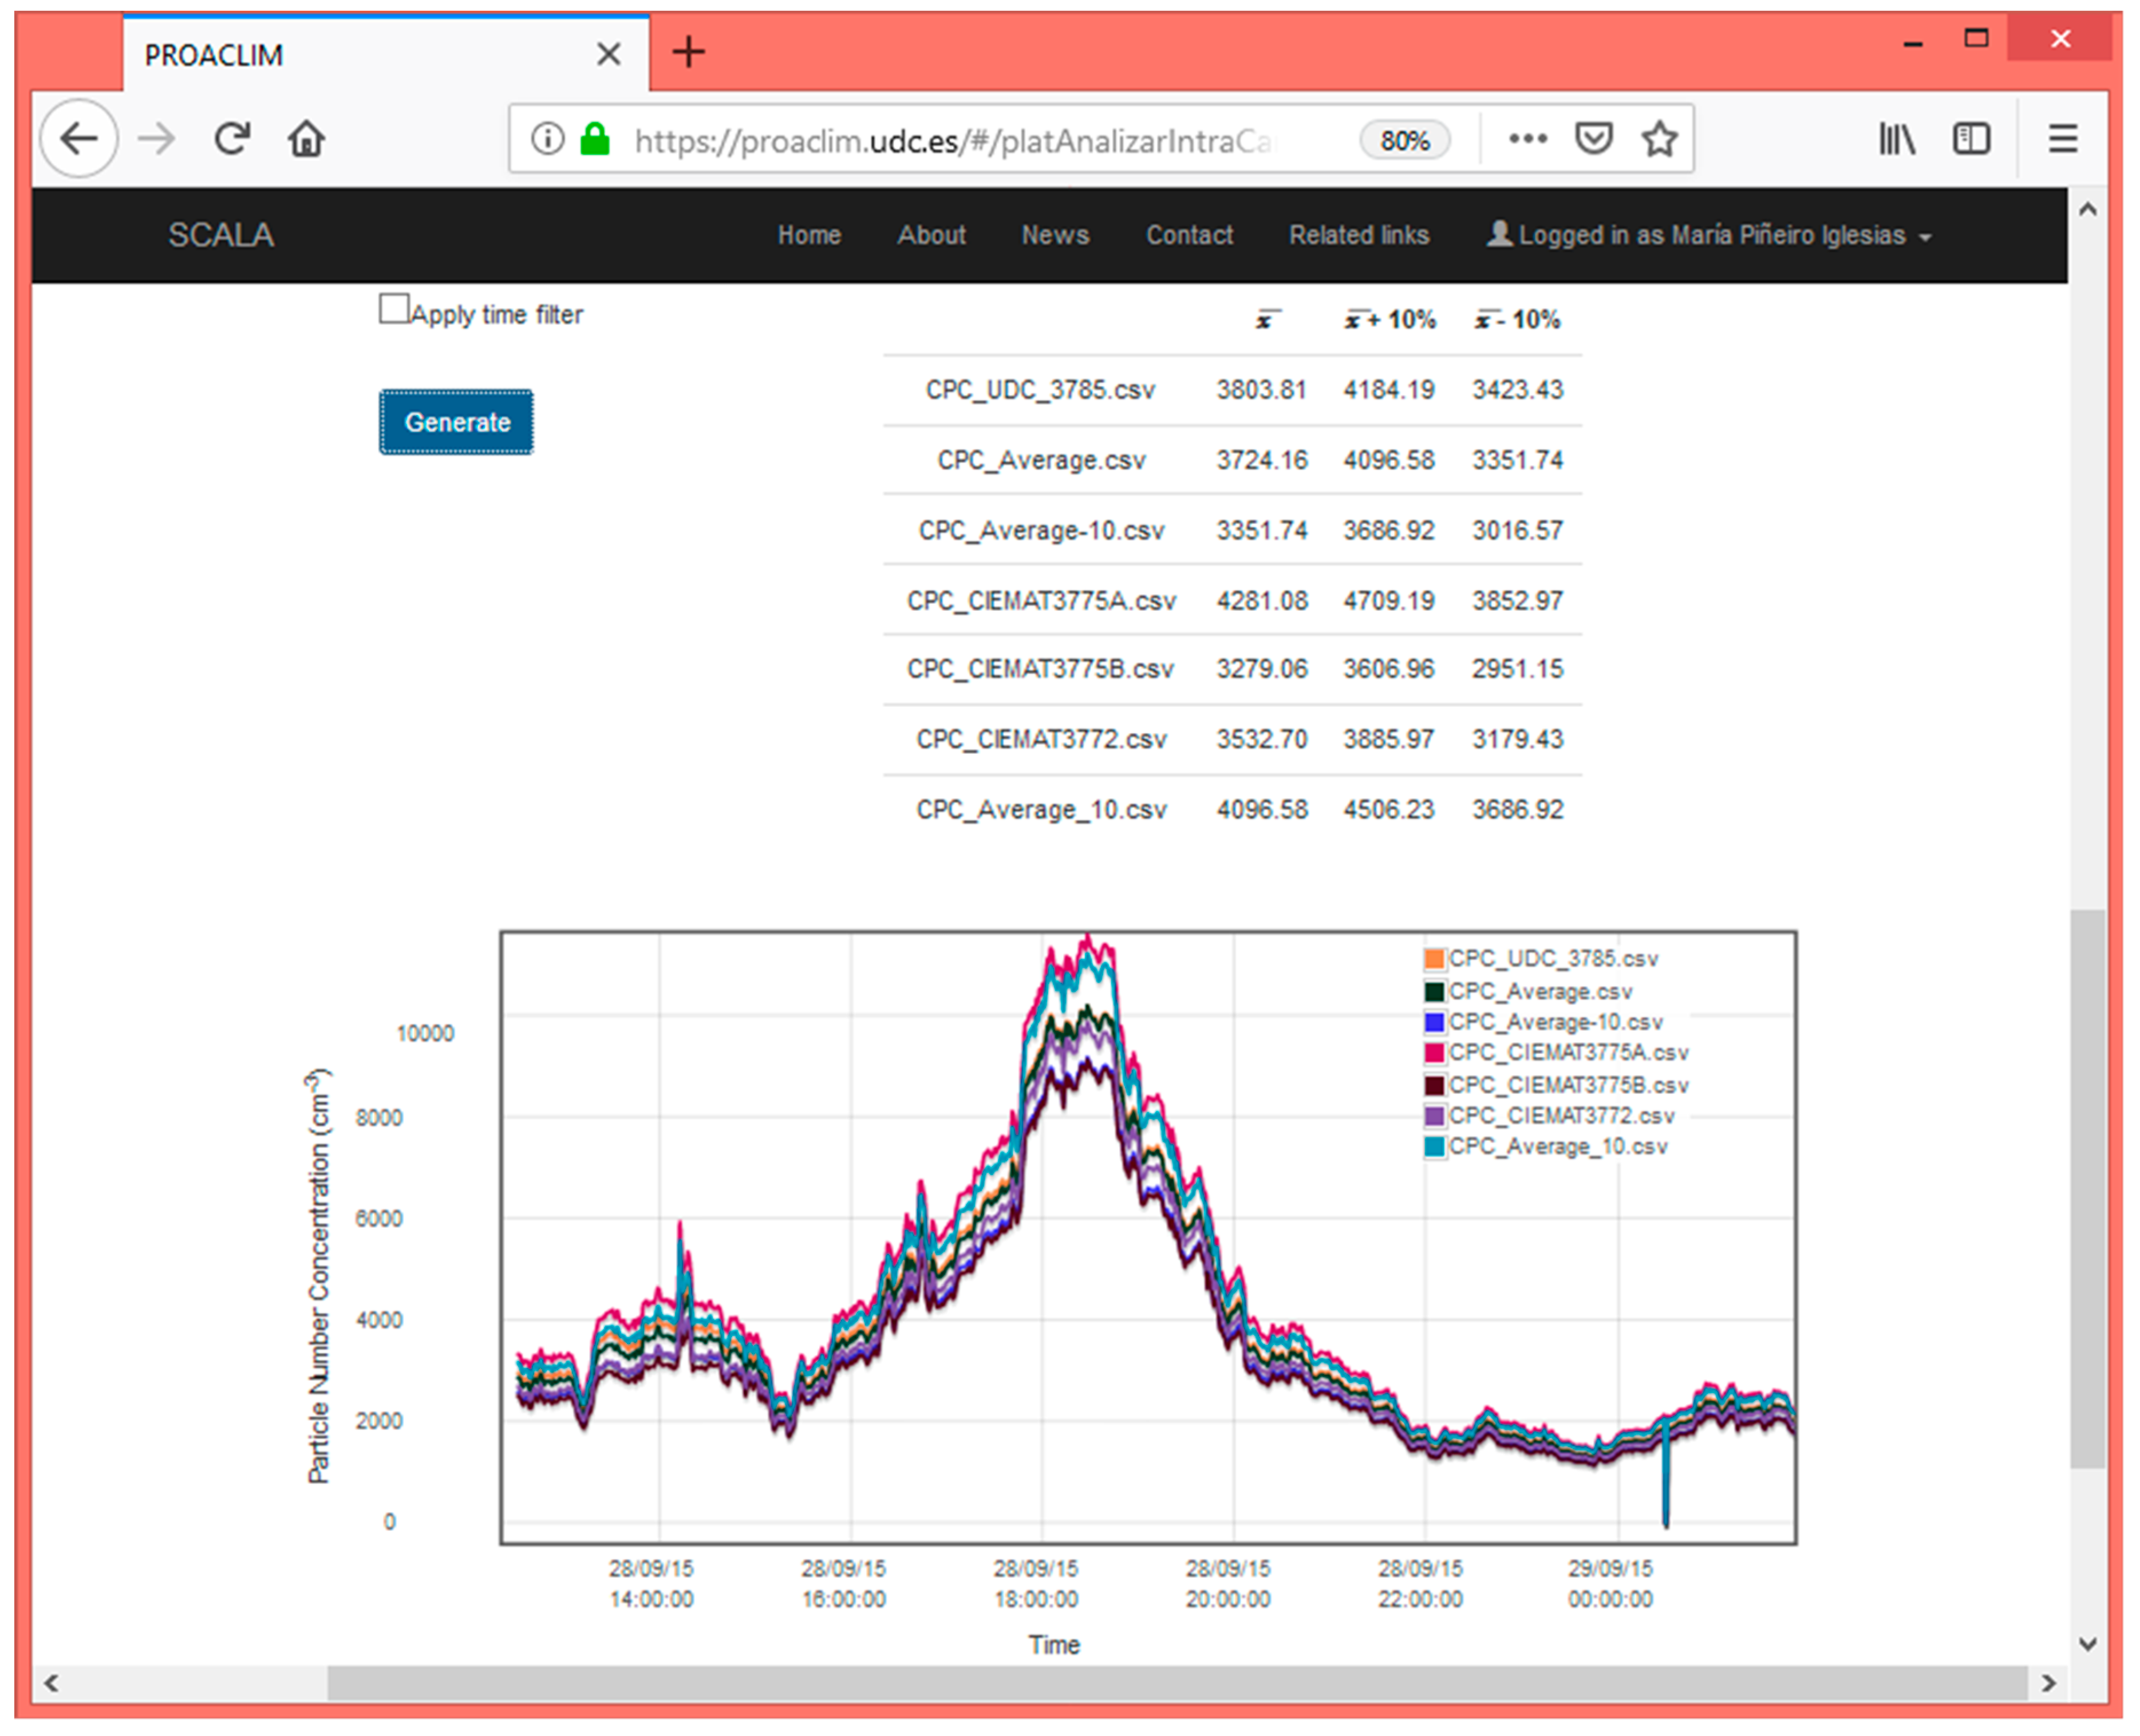
First, the CPCs were checked for the flow rates and later they were intercompared by sampling atmospheric air for more than 12 hours. As the different CPCs have different cut sizes, a diffusion battery was installed in the sampling line to remove the particles smaller than 10 nm making them more comparable. The main results can be found in Figure 4, which shows the time evolution of the particle number concentration of the CIEMAT and UDC CPCs, and the average values and the +/− 10% band, which is the acceptable range for this kind of instruments. The CPCs are in this accepted band most of the time, indicating they are valid in this concentration range and with the kind of particles measured at the site, CIEMAT facilities in Madrid (40.5° N, 3.7° W, 657 m a.s.l. (metres above sea level)). The site lies 9 km north-northwest of Madrid centre and is surrounded by three natural forested areas, Dehesa de la Villa Park (∼0.2 km away), Casa de Campo Park (∼2.8 km away) and the Monte del Pardo forest area (∼3.6 km away). CIEMAT is directly influenced by the urban sources, especially in winter, but also by Saharan dust episodes, especially in summer. A meteorological tower is installed at this site where temperature, wind speed and direction, precipitation, solar radiation and atmospheric pressure are measured and registered.
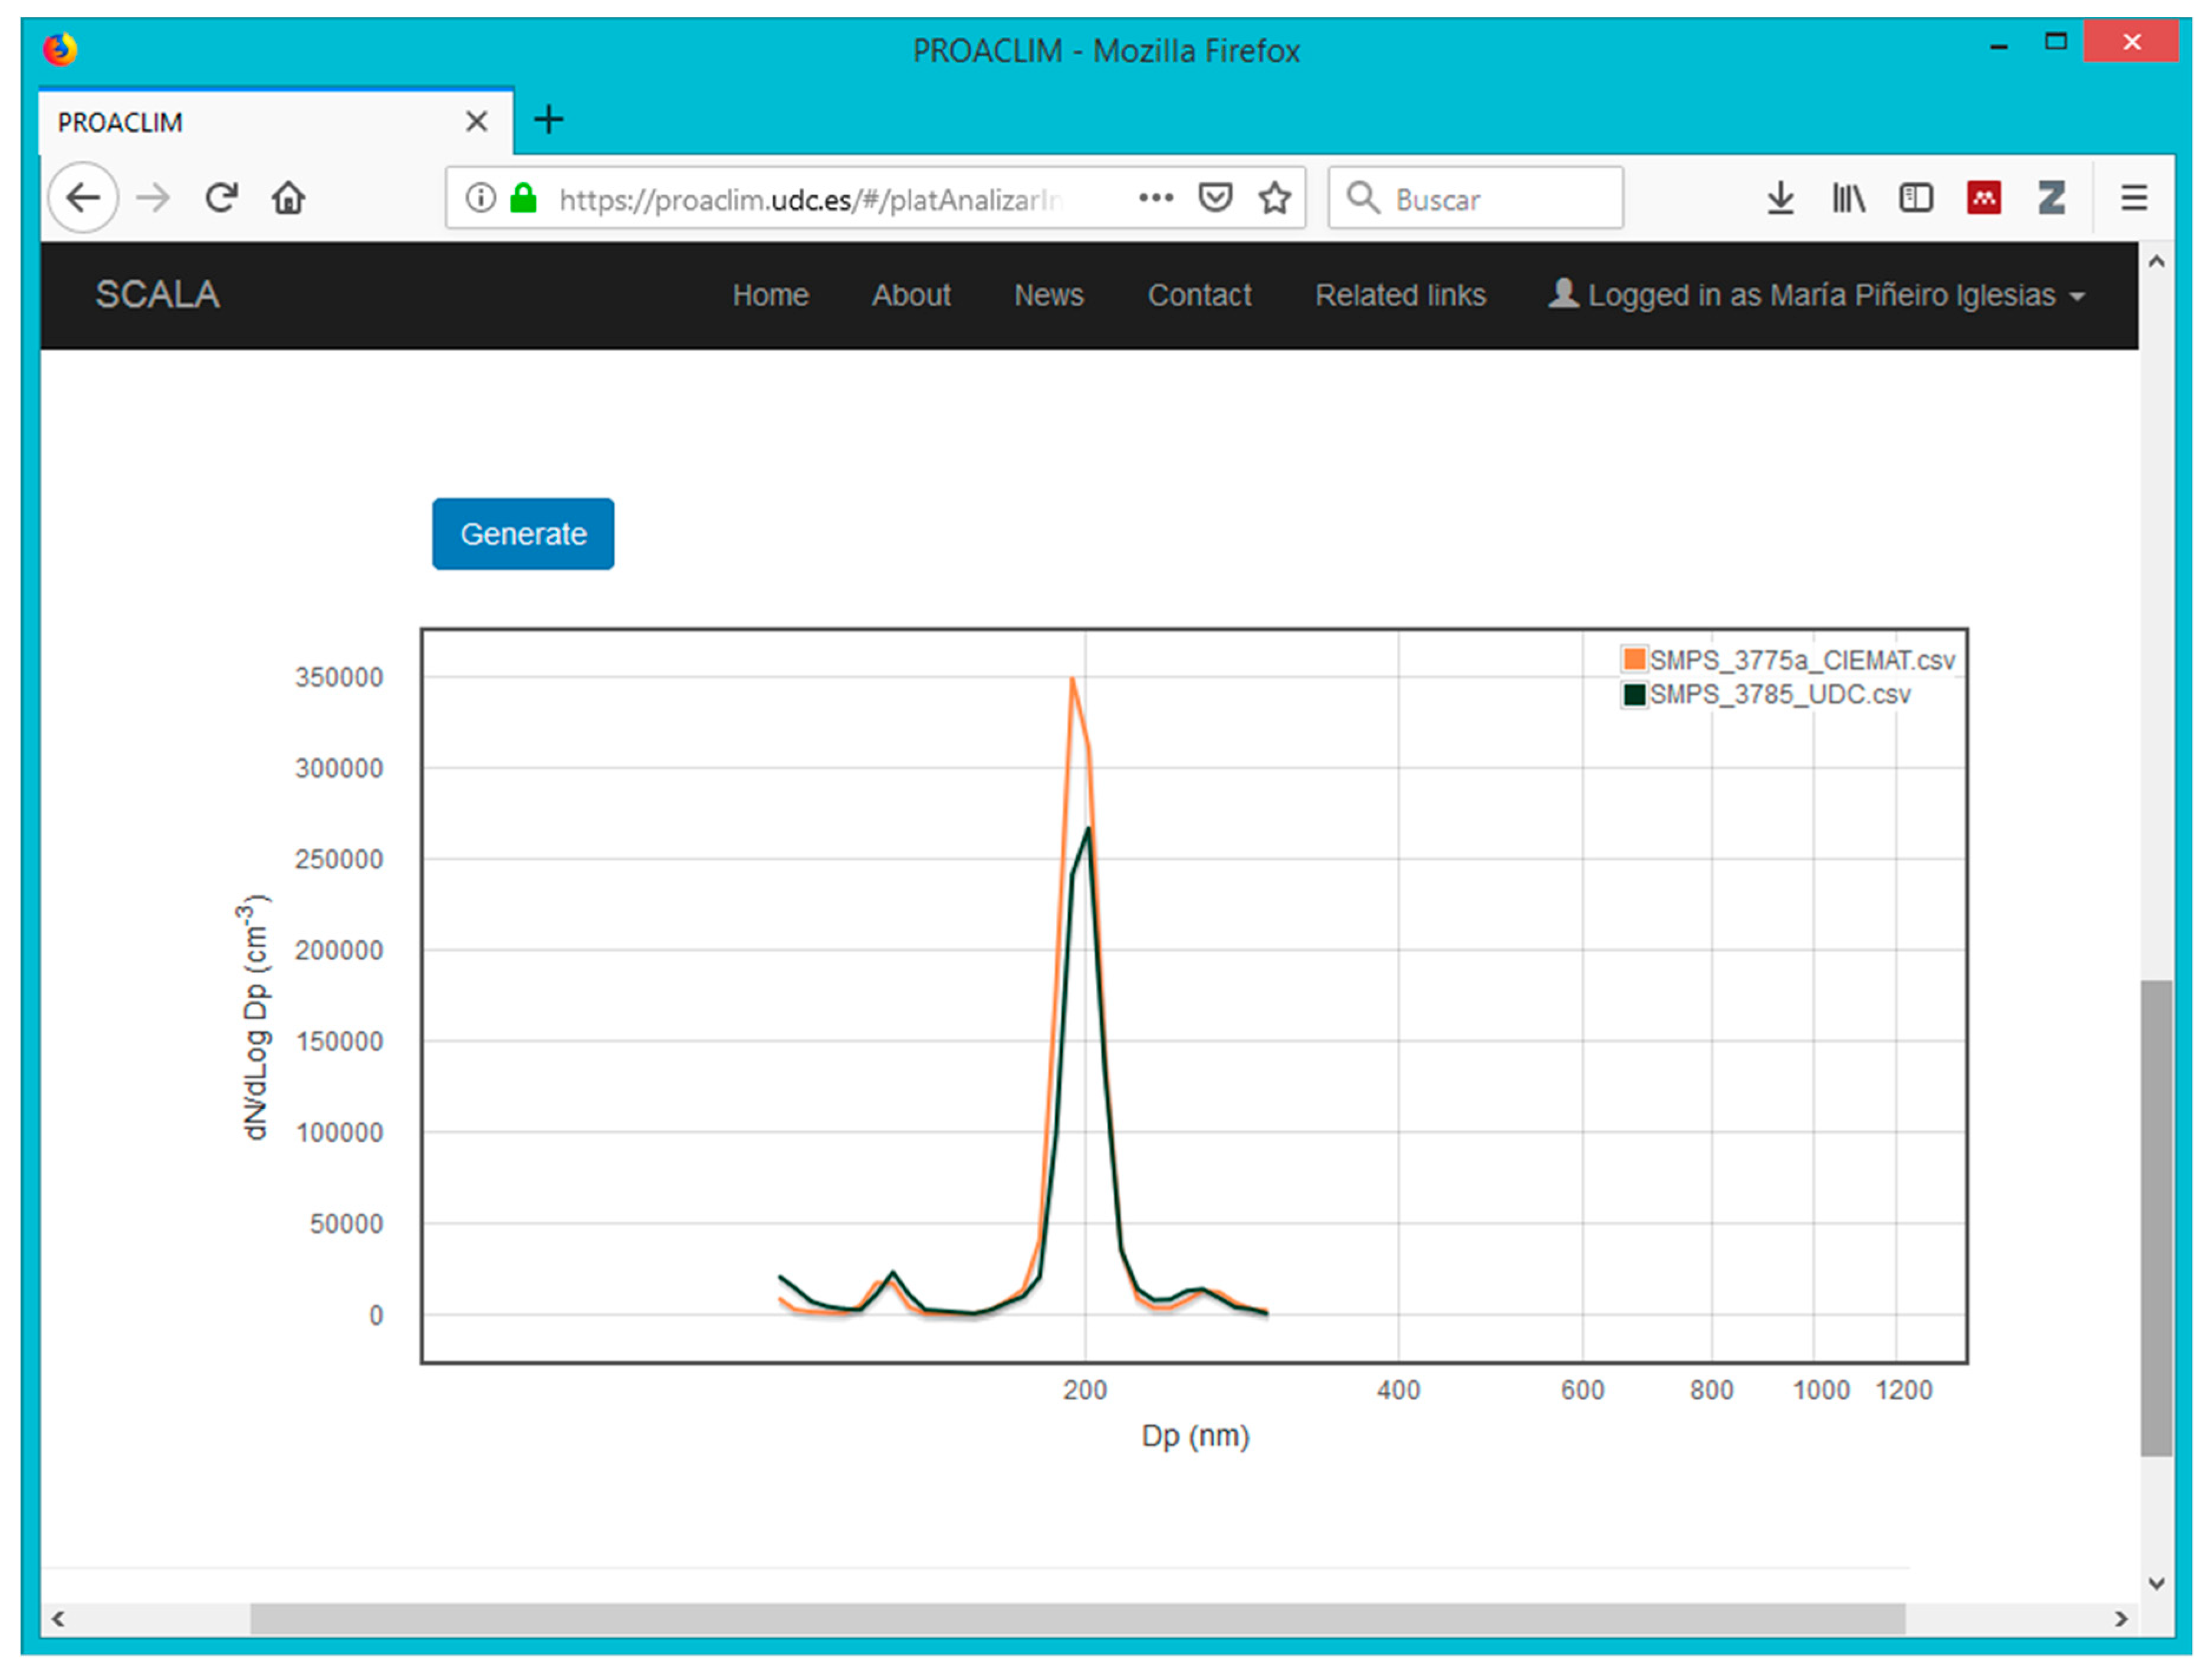
Once the CPCs were checked, they were installed with the DMA to form the SMPS. Two DMAs belonging to CIEMAT and UDC were available, so after assembling them the flow rates and the high voltage sources were checked. Some latex particles were also used to check the DMA calibrations. Particle sizes of 80 nm and 200 nm were introduced in the SMPS observing deviations smaller than 5% in both cases, as shown in Figure 5.
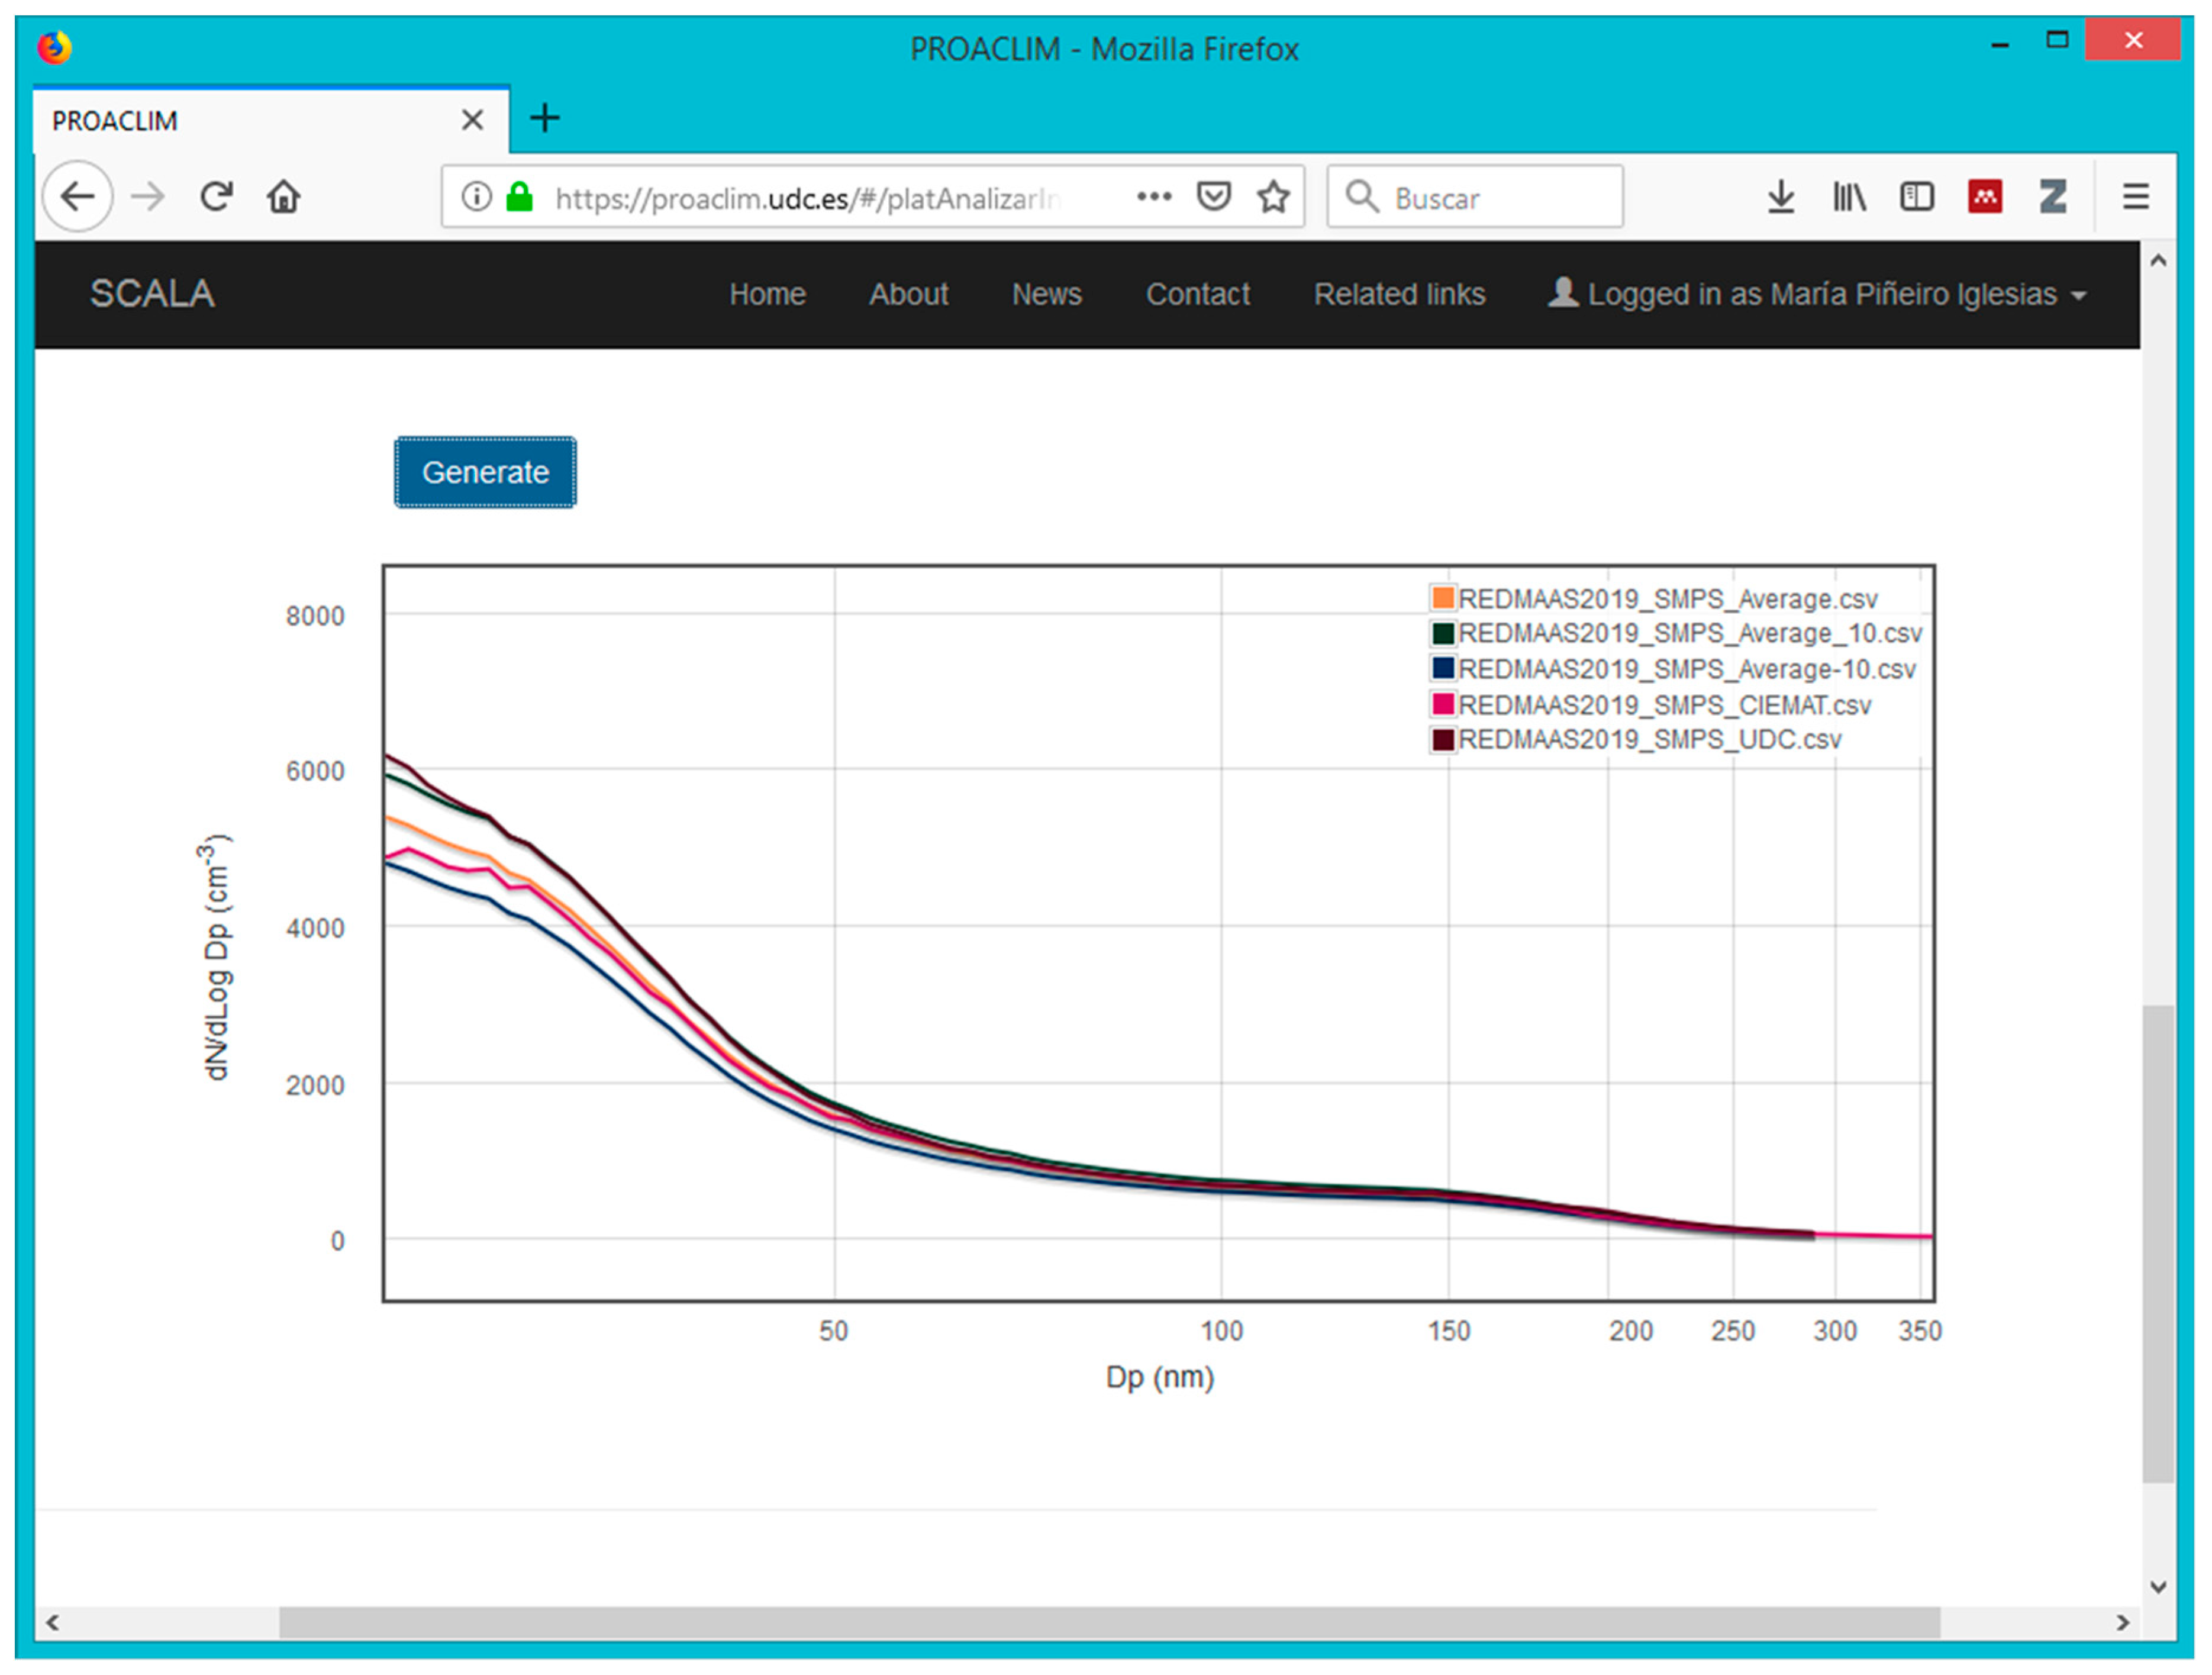
To finish the intercomparison, the complete SMPS systems could be compared. In Figure 6, the results for other intercomparison campaign (REDMAAS2019), performed in March 2019 at CIEMAT site, are shown. It includes both SMPS belonging to CIEMAT and UDC, the average values and the +/− 10% band for all the campaign participants. It is possible to see that above 20 nm, both systems are included in the band and only below this size can some differences be observed.
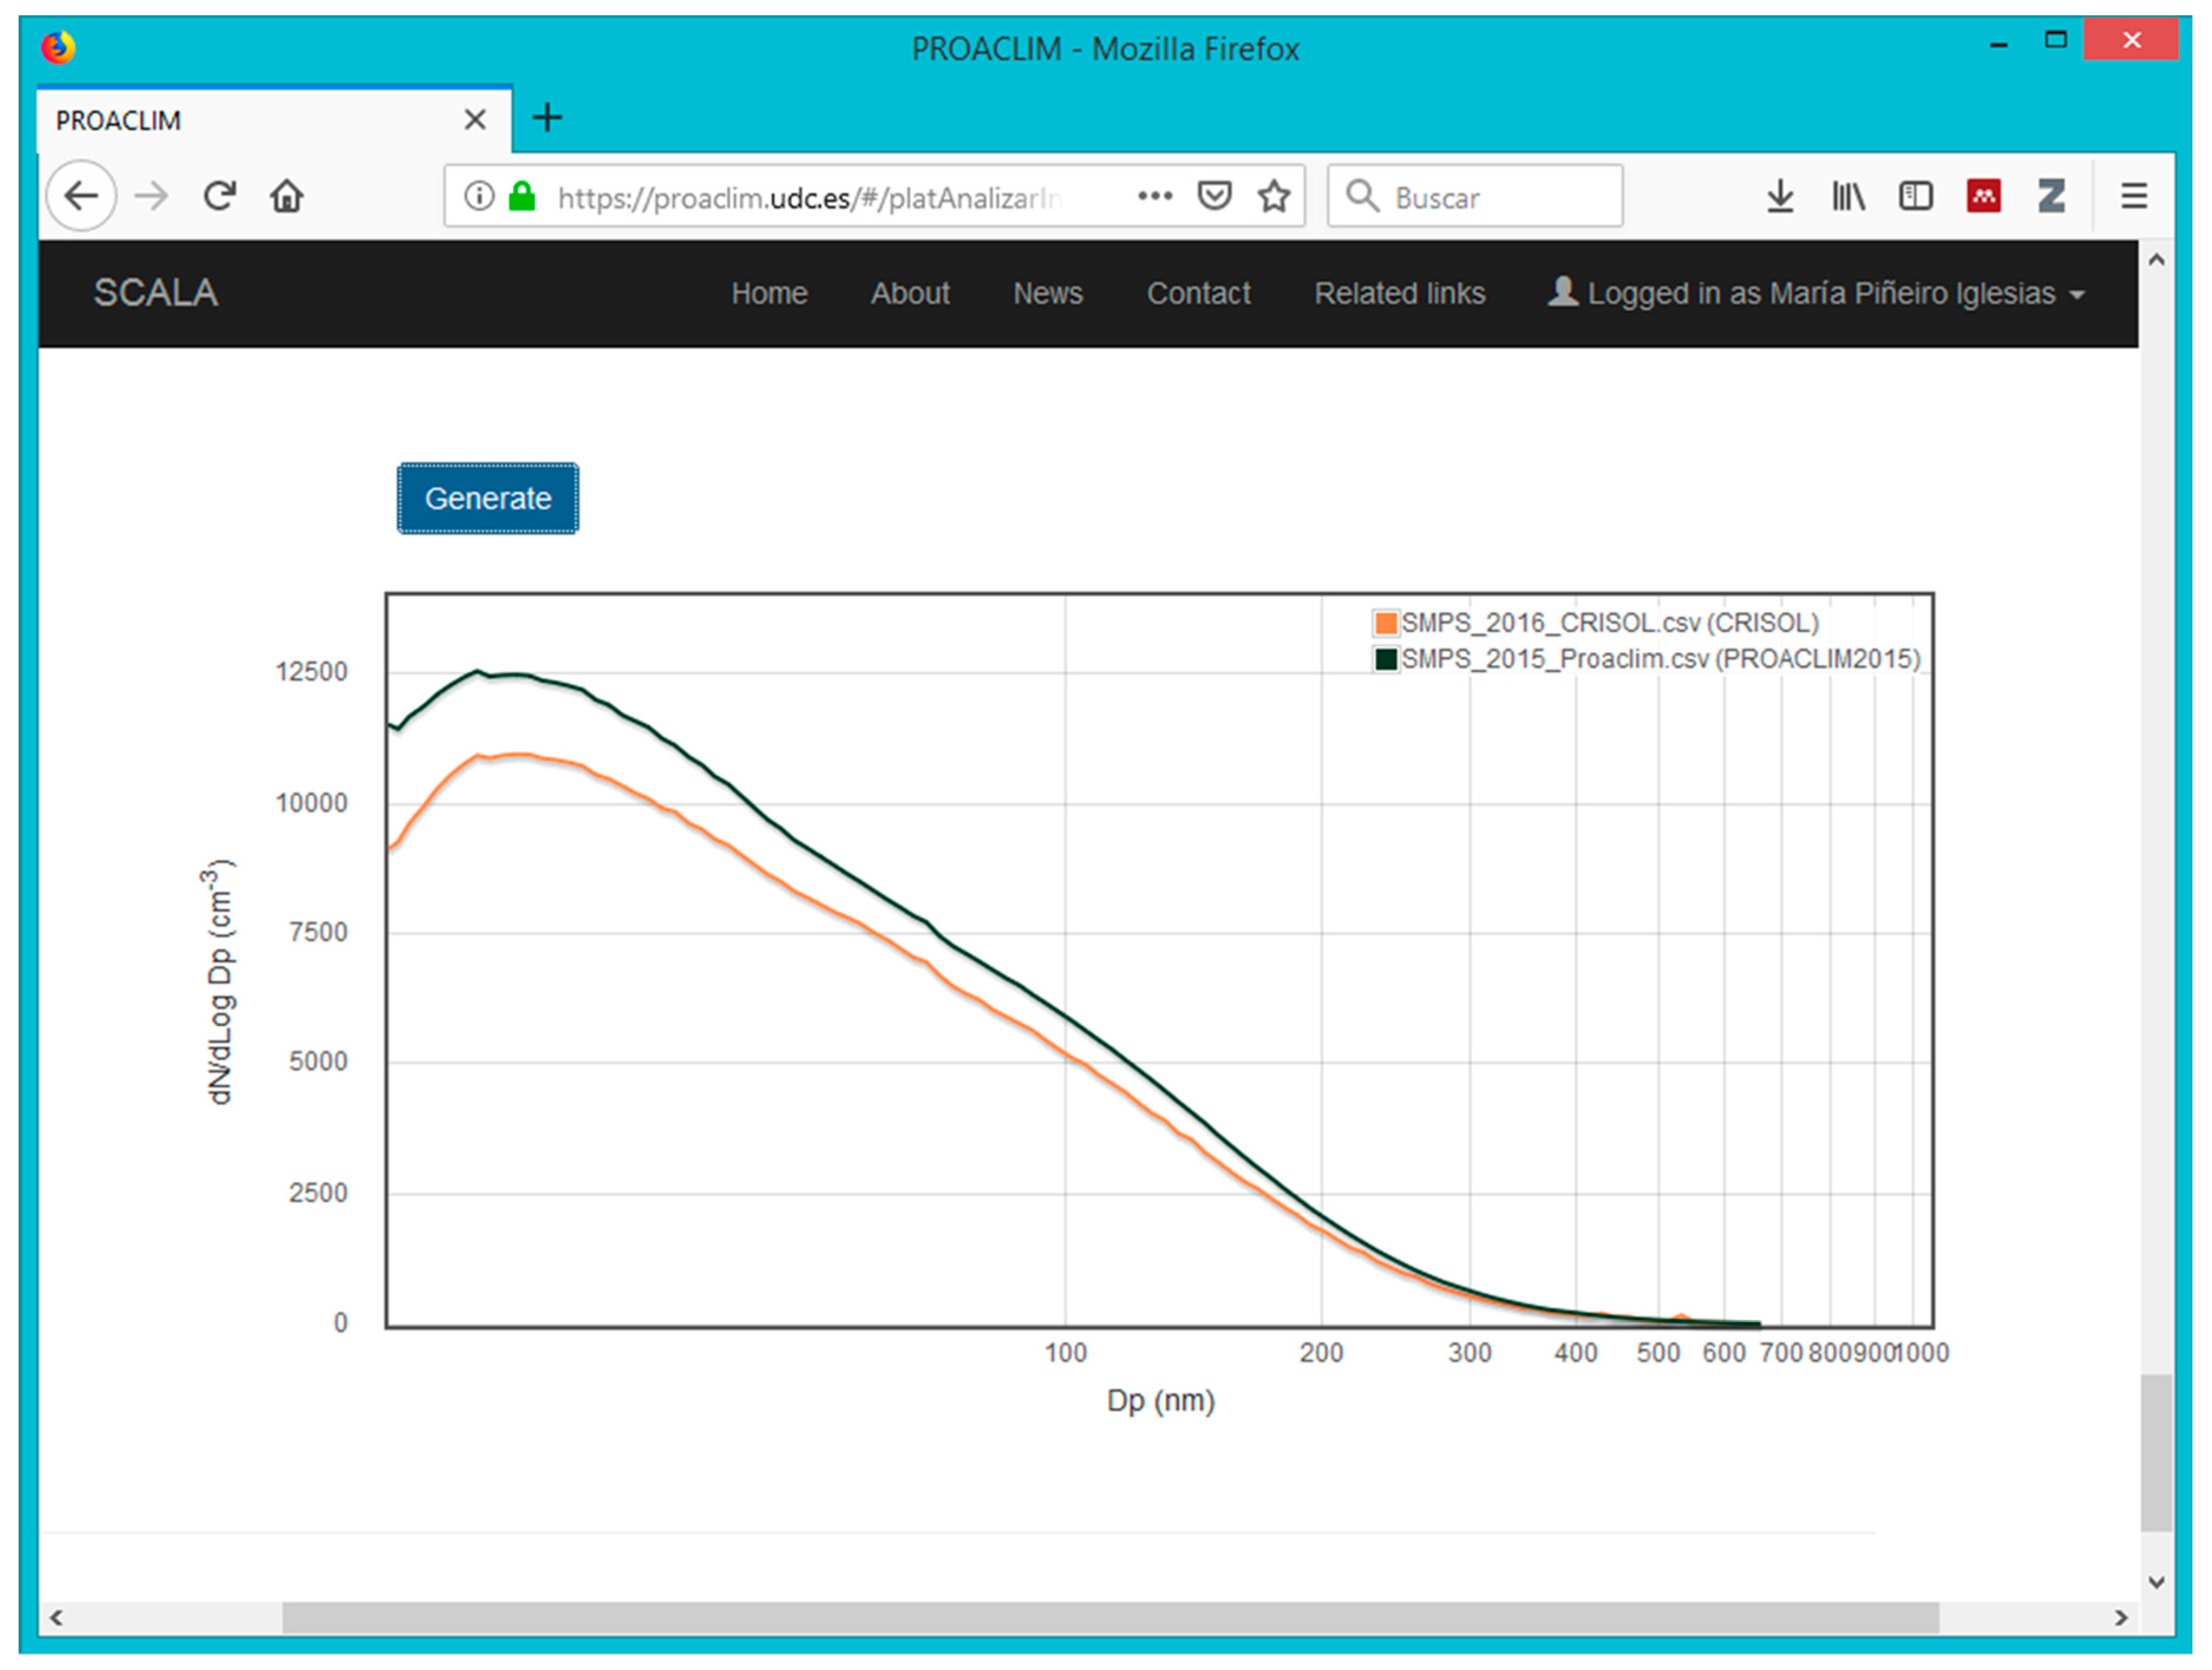
The web platform has a functionality to compare the evolution of a parameter among different campaigns, if it was significant. For example, in Figure 7, it is possible to see the average size distributions for two different campaigns (PROACLIM and CRISOL) during two years (2015 and 2016 respectively) at the CIEMAT site. The difference between them is caused by the different meteorology those years. The meteorological data were obtained from the meteorological tower available at CIEMAT. The main difference between the two years is the precipitation: 2016 was a rainy year, with an accumulated precipitation of 361 mm, while during 2015 it was only 226 mm, a drier period. This higher precipitation cleaned the atmosphere in a higher degree and it is the main reason for the lower concentration. Other meteorological parameters showed similar values for both years, with no important differences between 2015 and 2016.
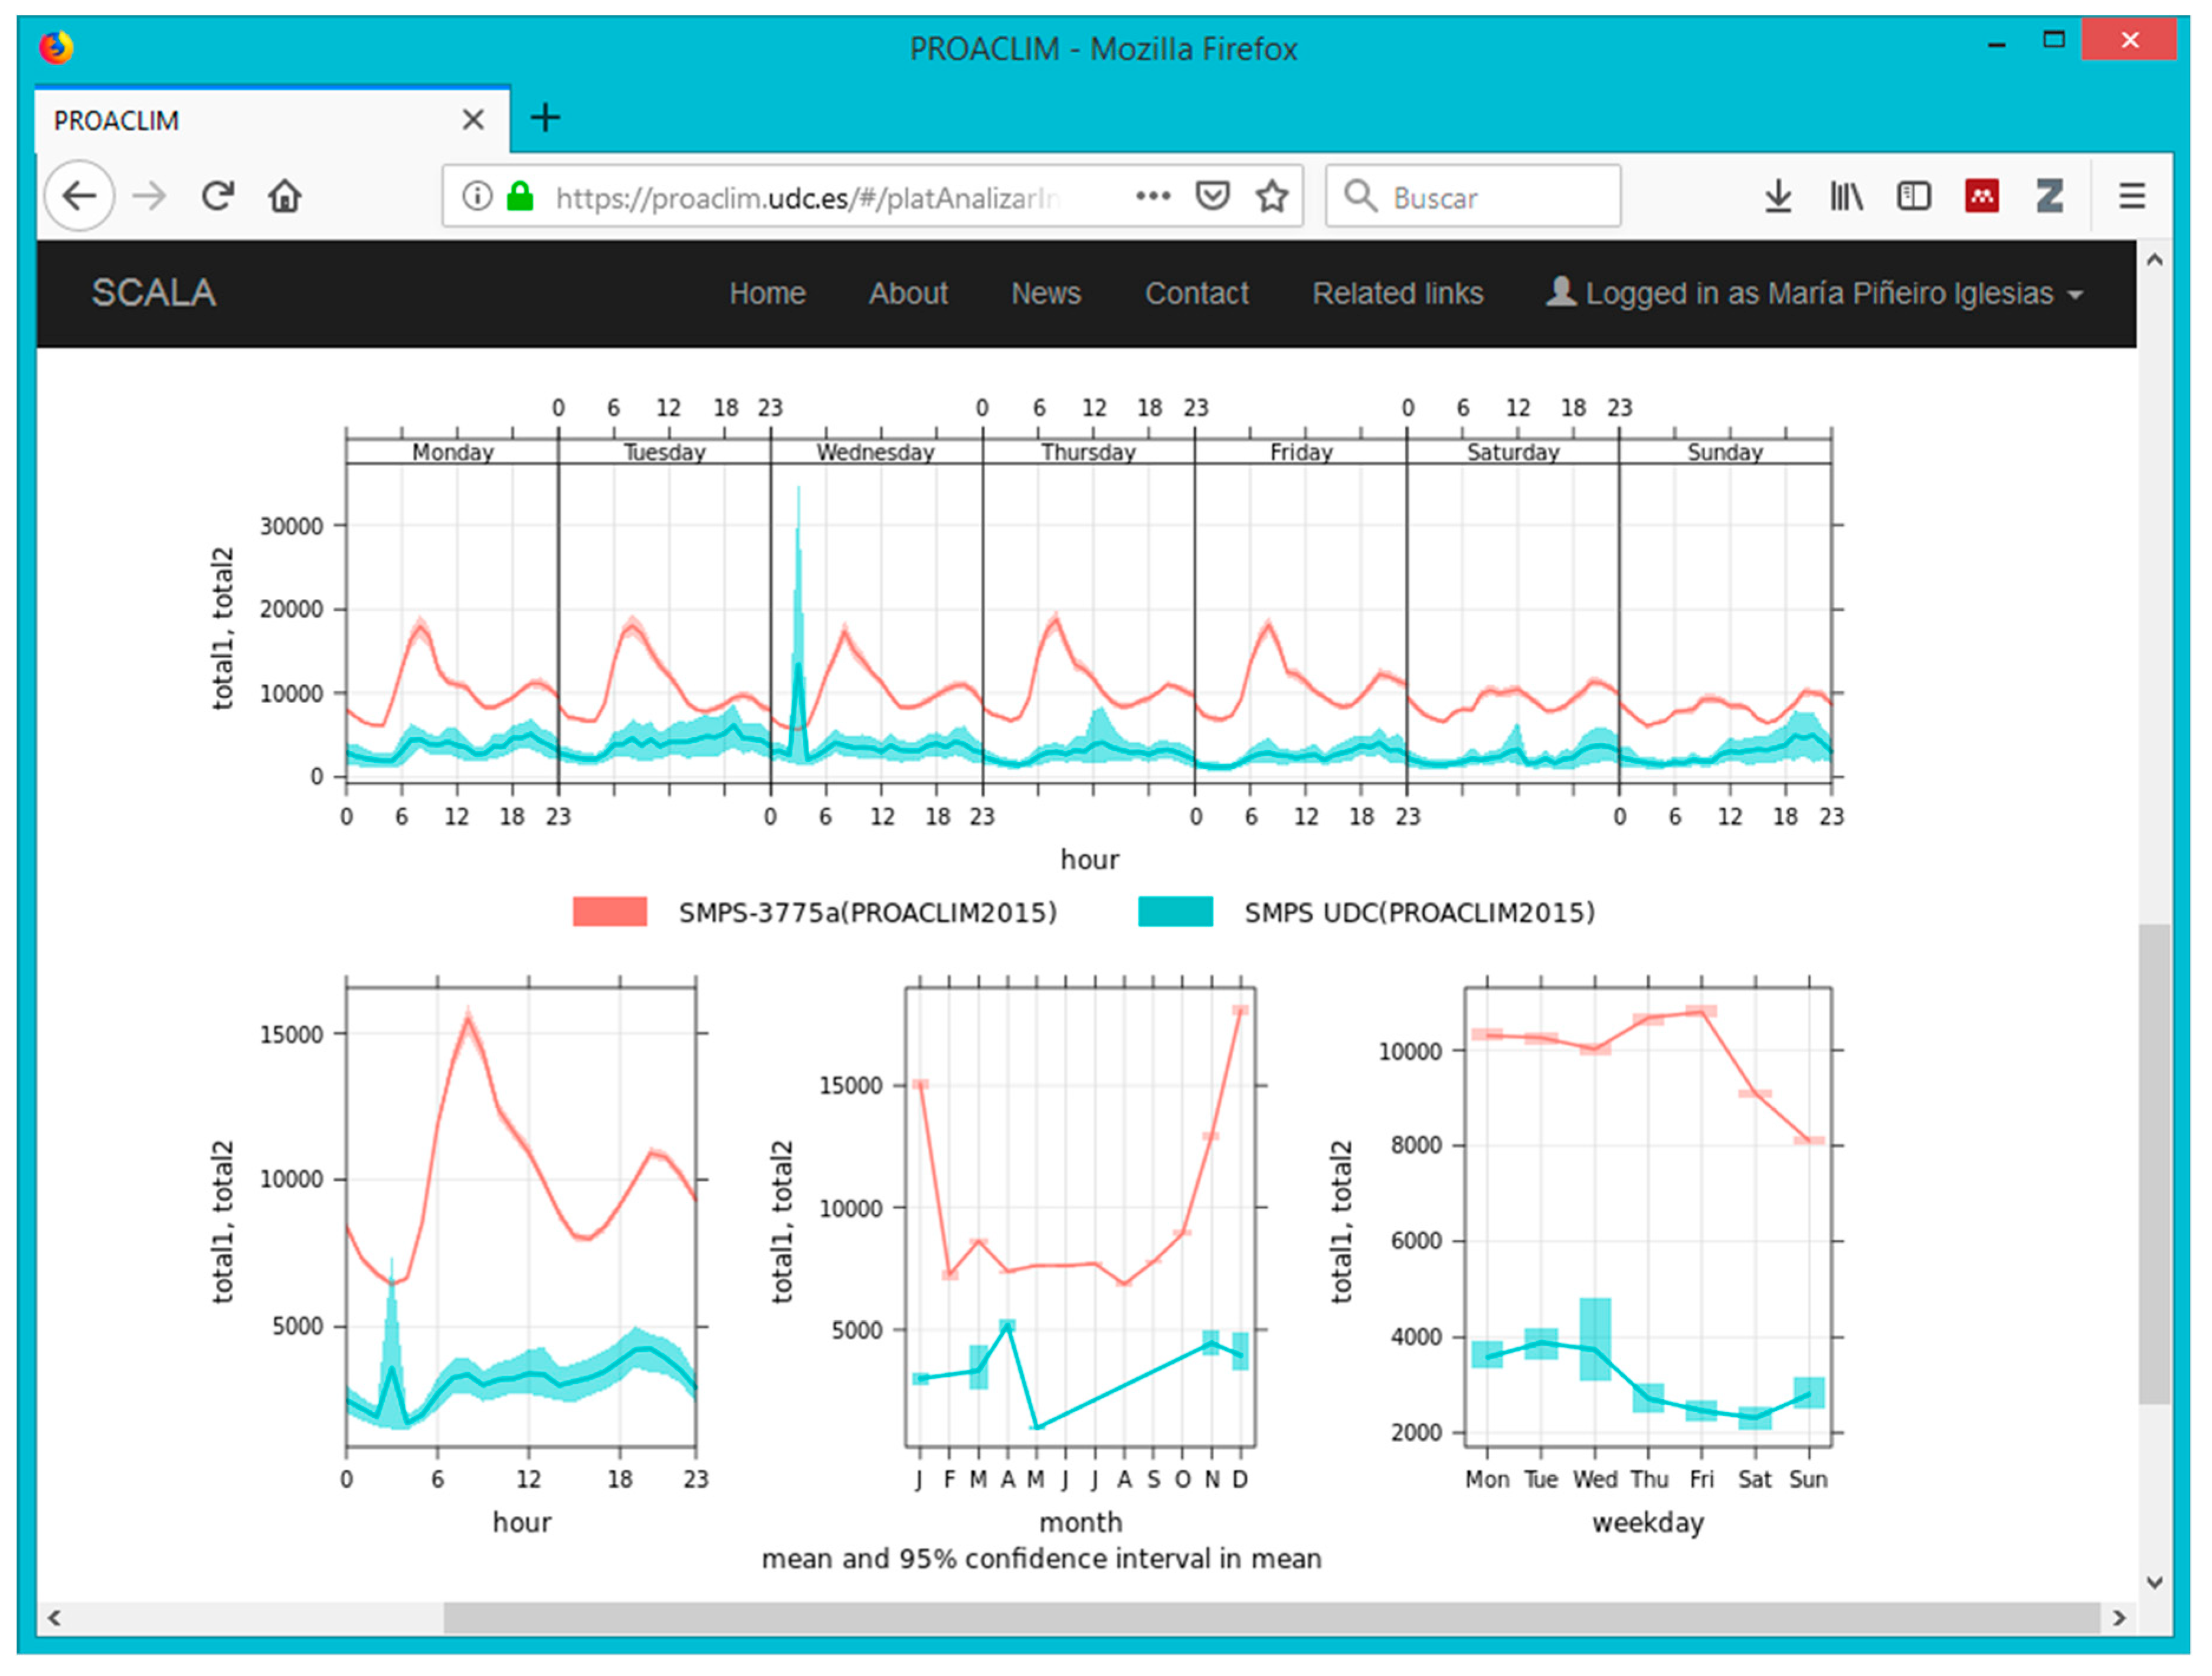
The system is also able to average other parameters throughout a long period of time, obtaining statistical values for different periods with the Openair R package [26,27]. Thus, for example, the average daily evolution for a year at CIEMAT (Madrid) and UDC (A Coruña, 43.3° N, 8.4° W, 45 m a.s.l.) sites is shown in Figure 8 for the year 2015.
The UDC site is located in the surroundings of A Coruña city and classified as urban background site, ∼1 km from the coastline. The main anthropogenic sources are the emissions from traffic and domestic activities, but also, industrial emissions can influence air quality in the study area. Because of its proximity to the sea, the local wind pattern is mainly driven by the land-sea breeze. North-westerly synoptic winds are dominant and generally carry relatively clean air from the sea, but other wind directions are also recorded, with a significant contribution to air pollution levels at this site.
In this figure, for CIEMAT site, it is possible to see the annual average for the weekdays, showing a clear difference between working days and weekends so, it can be clearly deduced that the main particle source is traffic at 7:00 and 20:00 hours. A maximum at around 12h can be observed on some days, this maximum being related to new particle formation enhanced by solar radiation. It is also possible to observe that the highest concentrations were measured in the period October–January when the pollution episodes usually appear at this site. The lowest concentration was recorded during August, the traditional vacation month in Madrid, when general activity, and in particular traffic, is much reduced.
It is also possible to compare different periods of the year, or periods with different scenarios (not polluted; mild polluted; air pollution episode) in the same or different sites. The software allows for seeing the different aerosol properties in both the UDC and the CIEMAT stations. At the UDC station, the number concentrations are usually lower than at CIEMAT site and the evening peak generated by traffic is more important at that site. Surprisingly, while in Madrid the morning peak is more pronounced, at the UDC station it is observed in the evening, caused by the wind pattern in the area that transports the air from populated and industrial areas to the measurement site. It is also interesting to see the different evolution in the particle number concentration over the course of the week. While at the CIEMAT site there is a drop in this parameter only at the weekend, at the UDC station, the drop starts on Thursdays and lasts for more days.
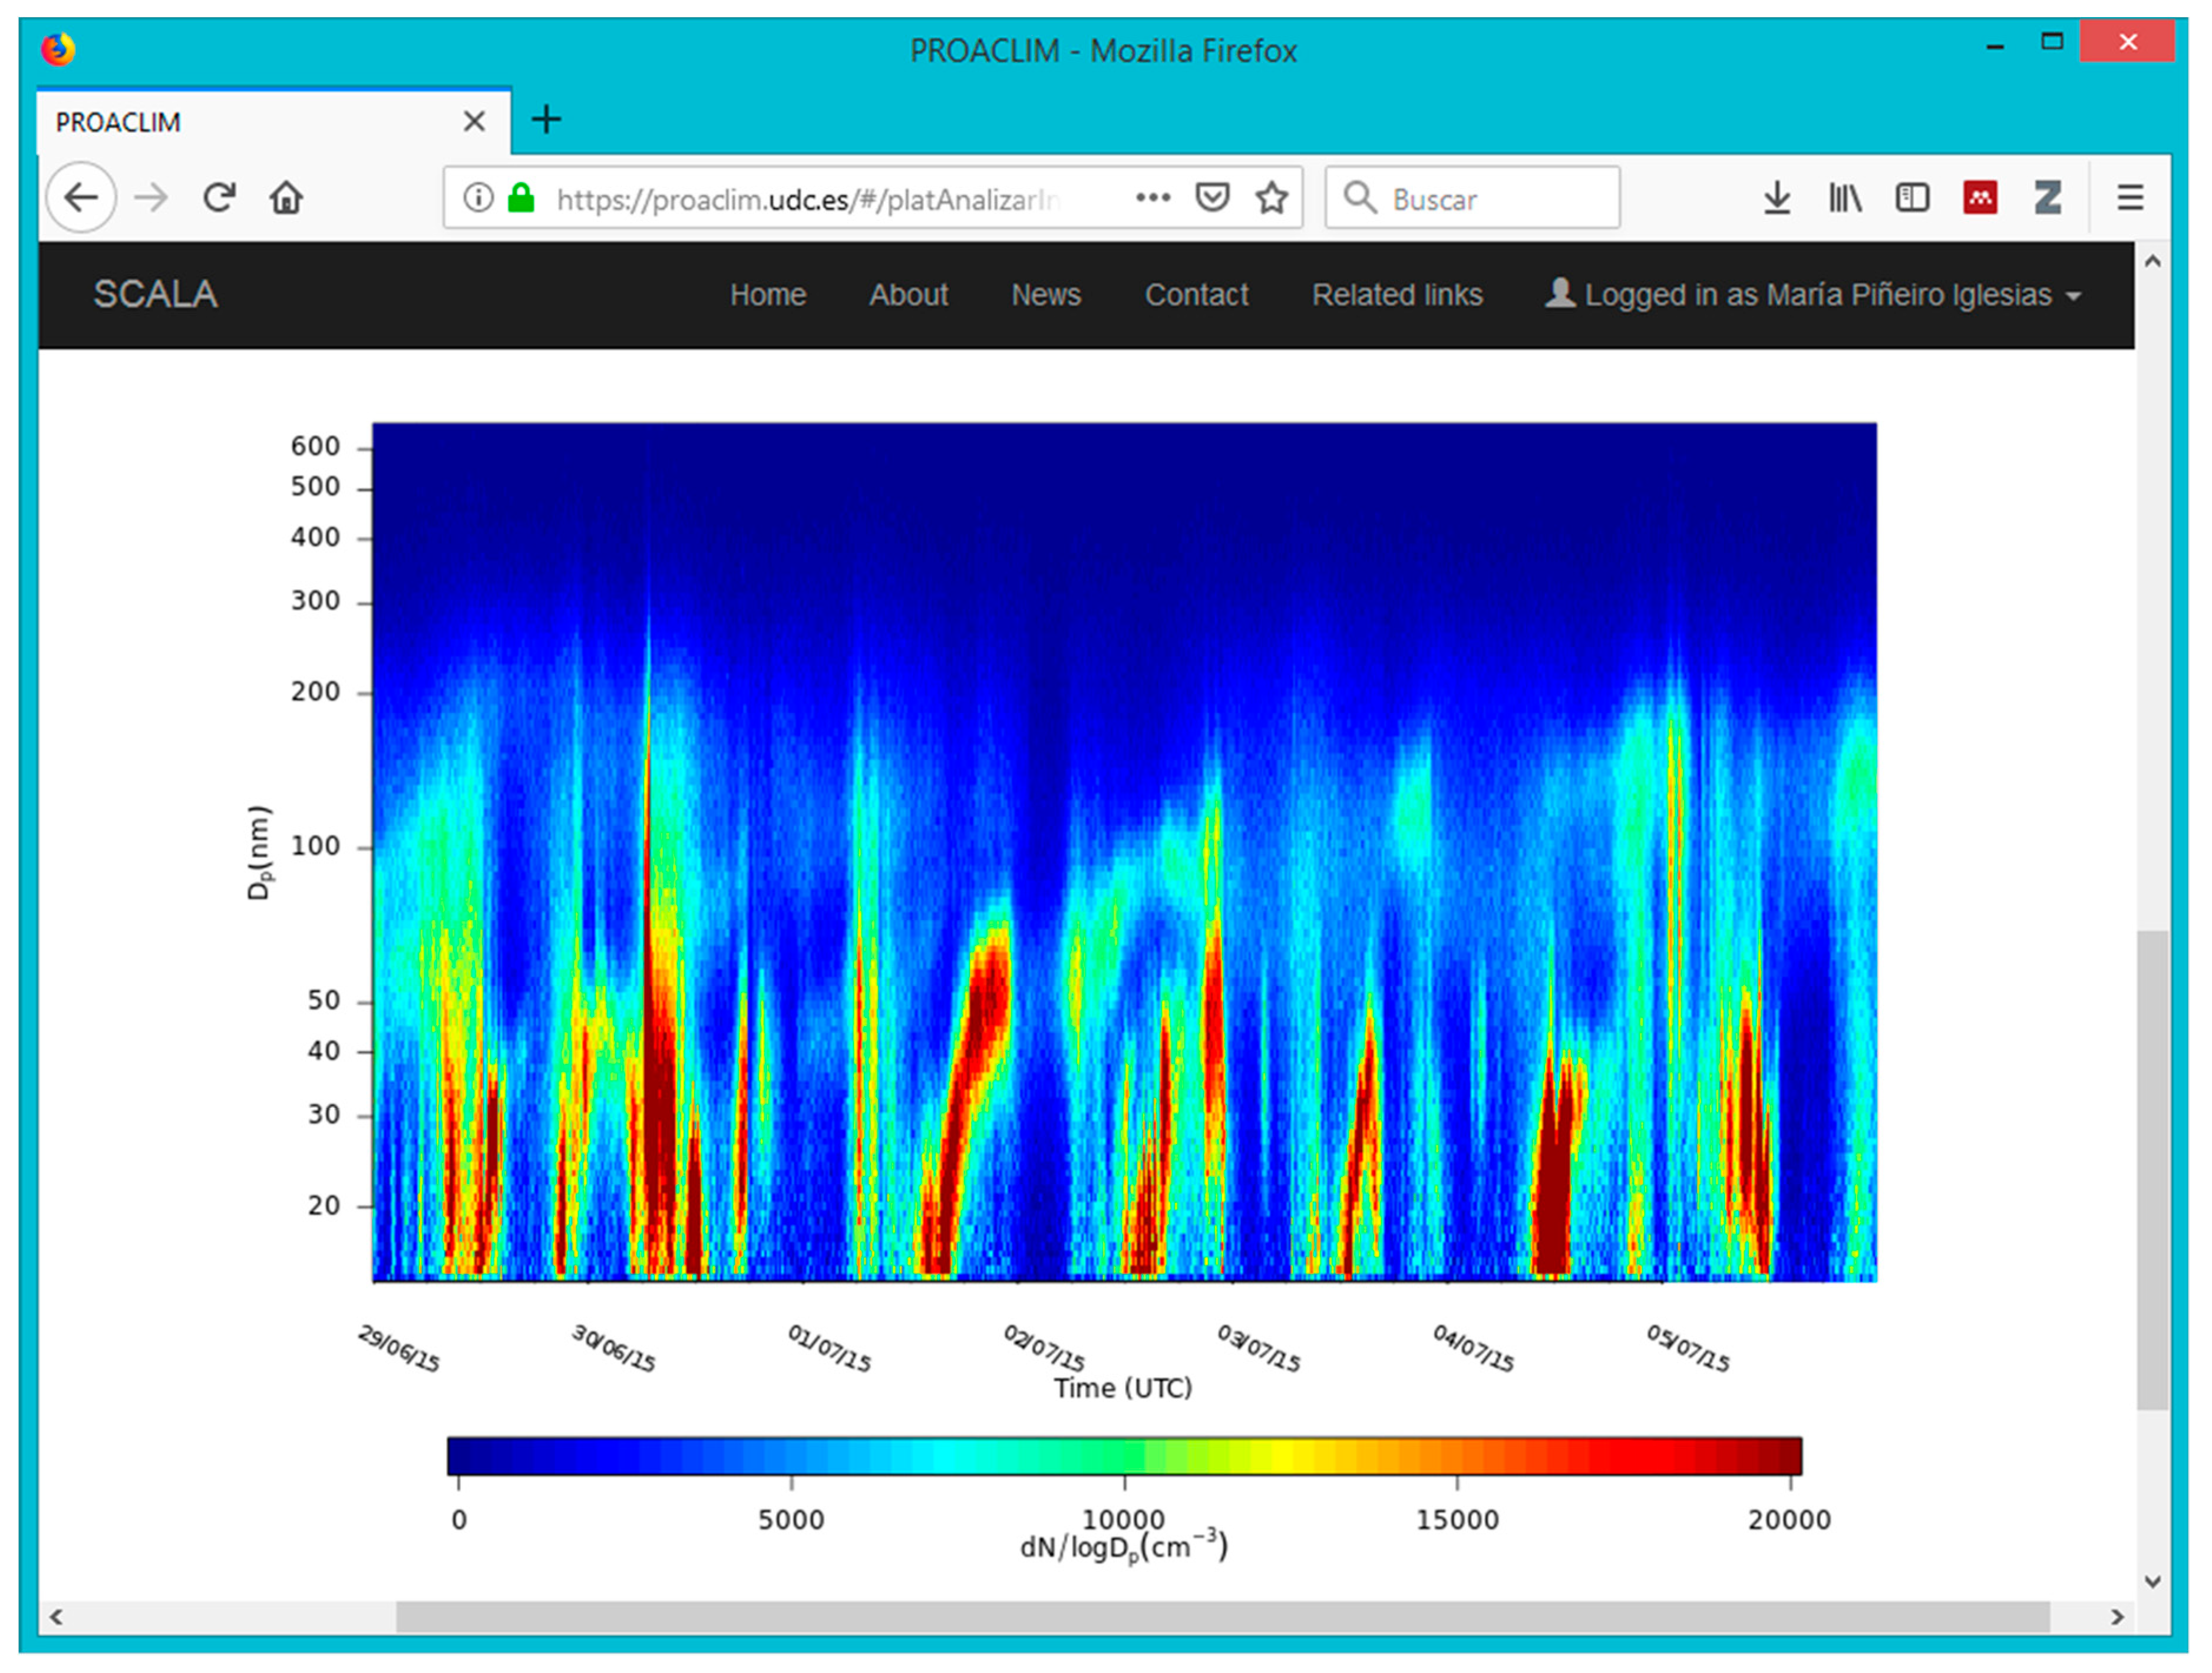
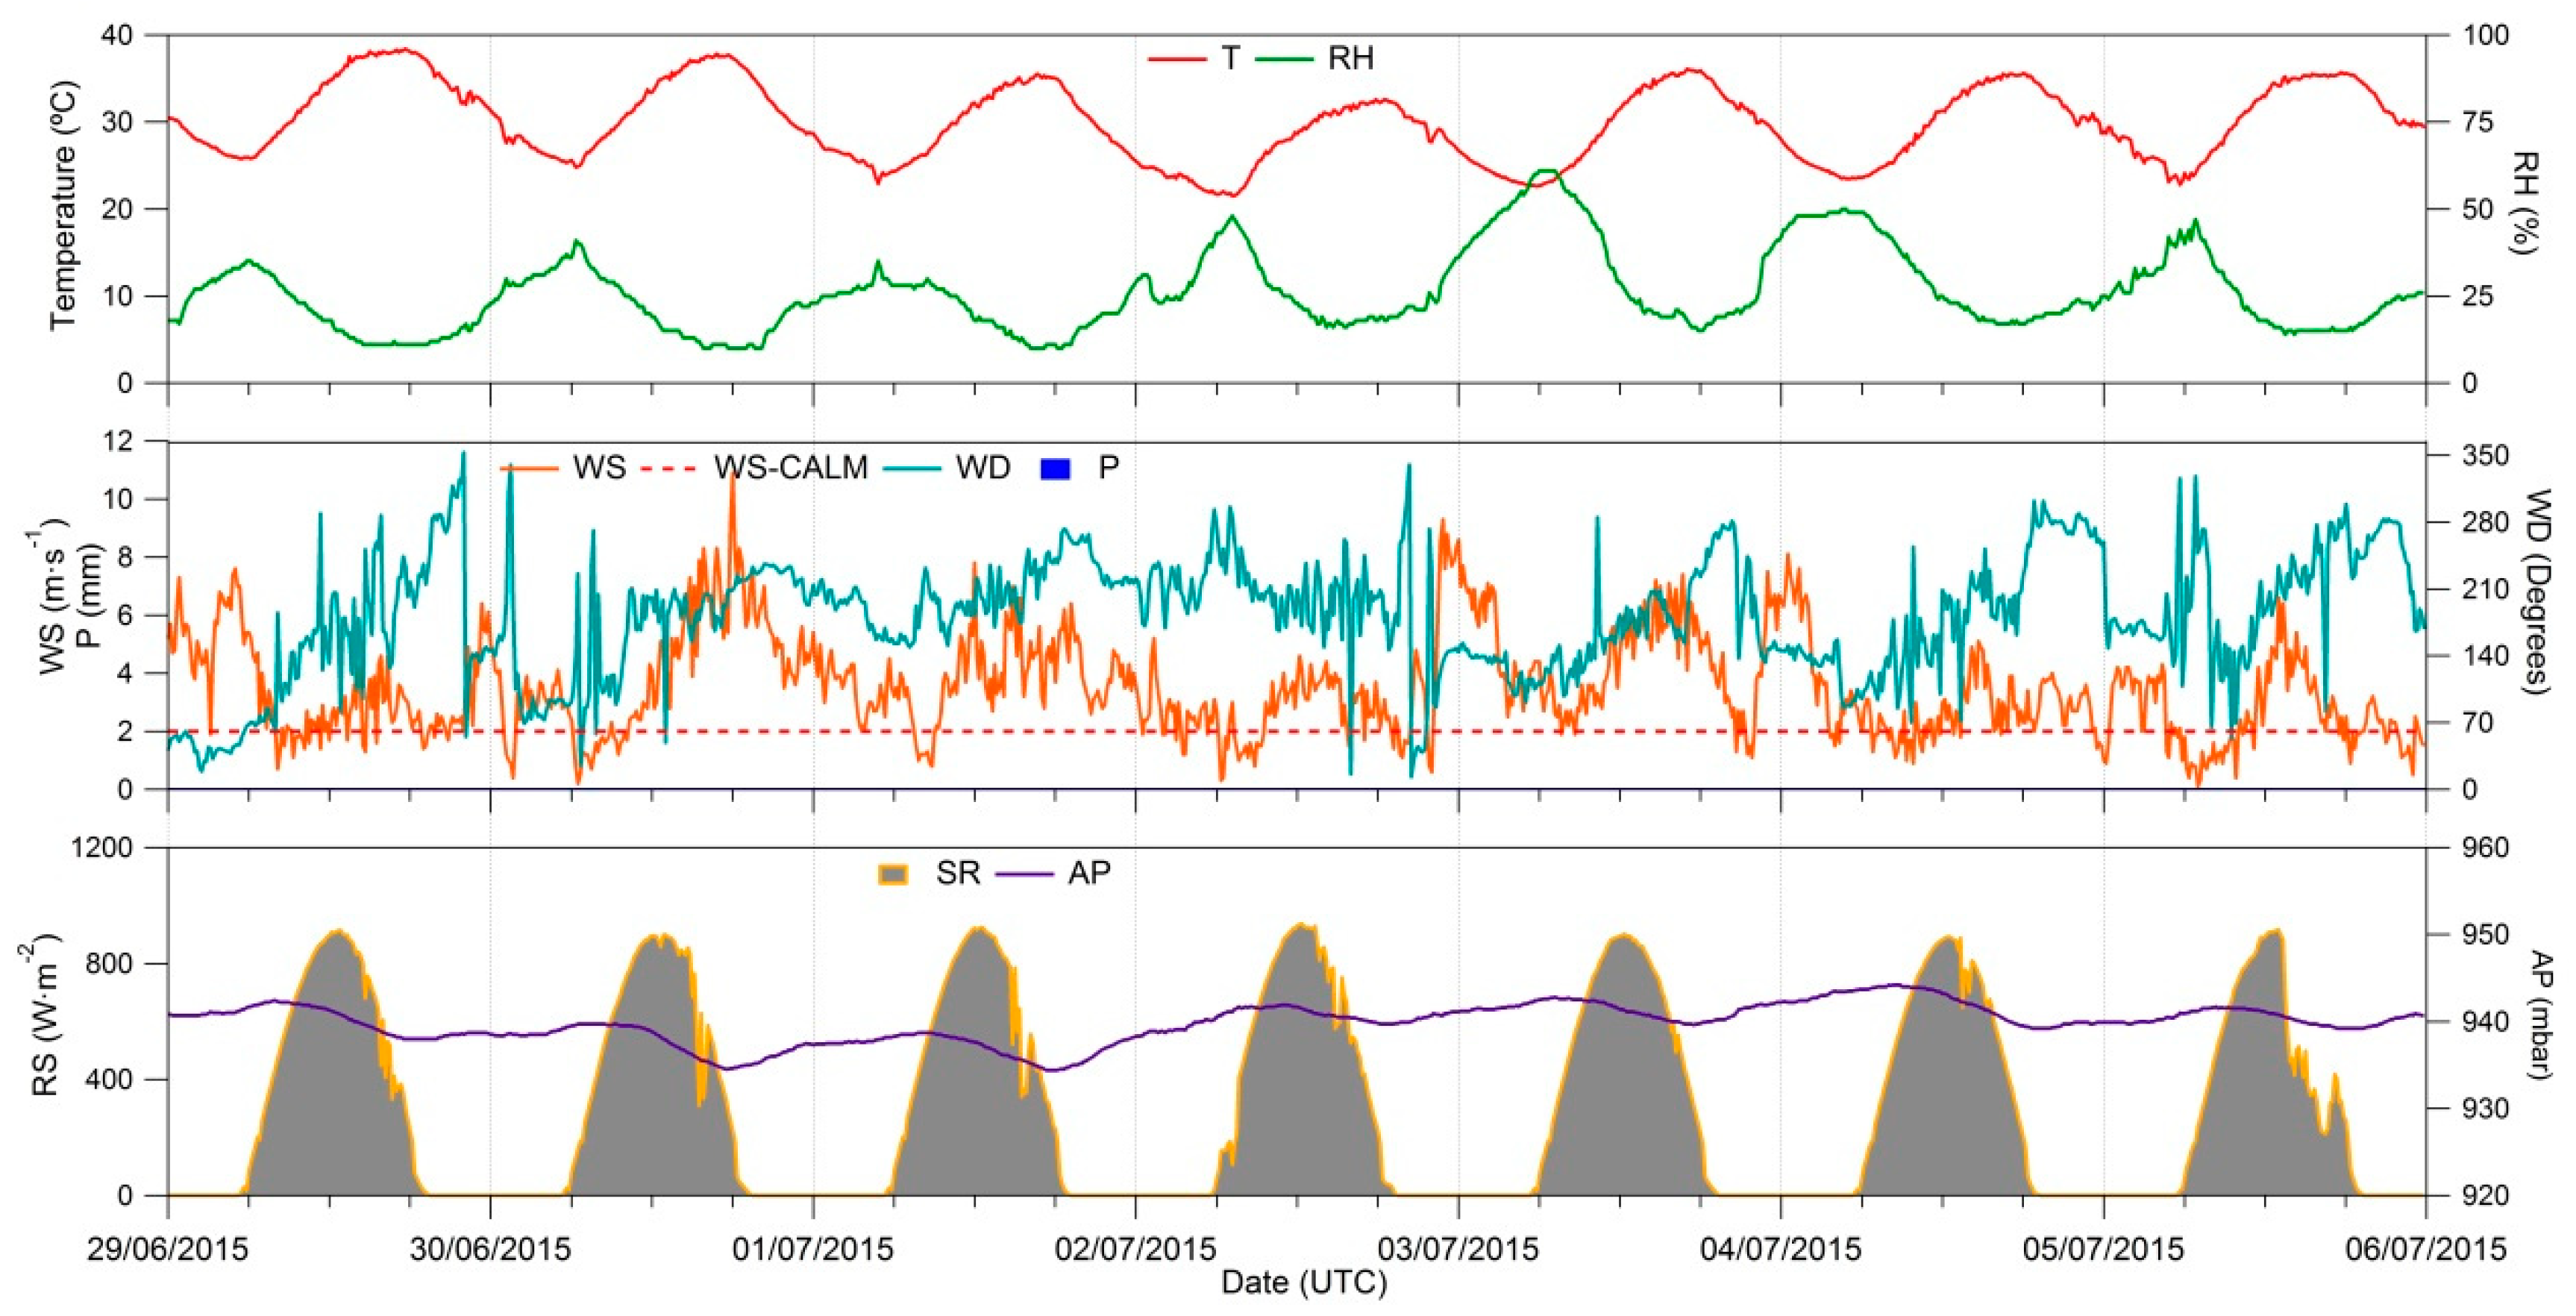
In order to study nucleation events and particle size evolution, the SCALA© software can also generate surface plots [28]. An example can be found in Figure 9 for a week of data (29 June–5 July 2015 at CIEMAT site; selected from the uploaded file with a year of data by applying a time filter). This evolution of the particle size distribution over time, together with other different data, e.g., meteorological ones (see Figure 10 for the same week), can aid in understanding aerosol particle behaviour in the atmosphere.
On July 1st, there was a period with low wind speed, which can be considered as calm. After this period, a slight increase in the wind appeared at 9 UTC contributing with new airmasses where particle nucleation was developed. This can be seen in Figure 9, for 8–9 hours there was the typical banana shape indicating the nucleation event. Another interesting day is July 3rd, where the typical rotating wind direction in Madrid (see day June 29th) appeared at around 6 UTC and lasted until 15 UTC, when there was a backward motion in the airmass rotation direction. This was also observed in Figure 9, where a nucleation event is followed by a shrinkage event. This last phenomenon is not very rare at the CIEMAT site, and has been previously studied in [13]. In the current case, the shrinkage event could be caused by receiving an old airmass, the same that arrived some hours before and with the same smaller sizes. Another possible reason is the slight increase in the wind speed, which can produce a semivolatile evaporation in the particle phase (this can be helped by the higher temperatures during those hours). On Sunday July 5th, there was a strong decrease in the solar radiation after midday, which meant a lack of nucleation events as solar radiation is considered an important parameter of the nucleation process. The maximum concentrations observed during Tuesday June 30th were due to the traffic emissions between 6–9 UTC, when the wind speed is low and the particles can be accumulated. The evolution at these same hours during Thursday July 2nd was similar, although the particle concentrations were not so high.

4. Conclusions

It is shown in this work how a multidisciplinary group of researchers working with an appropriate and clearly established software development process can develop a nice, useful and novel software application. This application allows environmental technicians to research in atmospheric aerosol with a number of both qualitative and quantitative improvements. Specifically, the research work regarding the REDMAAS network has been considered here as an example of application. These campaigns and measurements with SMPS at CIEMAT and UDC sites have been analysed using SCALA© in order to conduct R&D activities providing interesting results such as, for example, [25,29]. Currently, the campaigns involving the different groups of the Spanish REDMAAS are managed through SCALA©. Several enlargements are planned to be considered through a new R&D project (CRISOL), supported by the Spanish R&D Plan, regarding instruments and data related with aerosol gaseous precursors, which finally will support direct radiative forcing calculations of climate relevance.
Specifically, environmental technicians and software engineers agreed new requirements to be considered for the second version of SCALA© in order to support such R&D project. Next, the most outstanding issues of such new requirements are listed:
  • Consideration of more atmospheric aerosol properties, together with the associated functionalities for their analysis. SCALA© currently considers only the size property, but others, such as optical properties (e.g., absorption), are very interesting.
  • Inclusion of the instruments related with the gaseous precursors and their data. This new module will be similar to that already working for the aerosol and will manage the new instruments used during the campaigns and the gaseous species identified and quantified. The connection with the already existing modules in SCALA© will allow for representing and analysing data from both phases, gaseous and particulate ones.
  • Inclusion of direct radiative forcing calculations. To use, for example, the most recently used radiative transfer code GRASP (Generalised Retrieval of Aerosol and Surface Properties) [30], it is necessary to introduce data using a driver that depends on every instrument providing data. This new version of SCALA© will be able to convert the usual particle size distribution file to the file required by GRASP. As a result, it will be possible to analyse the gaseous precursors to generate particles, their size distribution and to prepare files for a radiative transfer code, all using the same tool.

Author Contributions

J.A.-G., S.S.-G., and A.Á.-R. technically designed and developed the software system SCALA©. M.P.-I., P.L.-M., B.A. and F.J.G.-M. established the requirements for the software SCALA© and conducted the studies presented. Finally, E. Díaz-Ramiro collaborated in those studies and also provided support for the integration with the R package. J.A.-G., M.P.-I. and F.J.G.-M. wrote the early versions of the paper and supervised the last versions. All co-authors participated in writing the paper.

Funding

This research was funded by the Spanish R&D Plan (PROACLIM project: CGL2014-52877-R and CRISOL project: CGL2017-85344-R), Xunta de Galicia (GRC2013-047 and ED431C 2017/28) and Madrid Regional Government (TIGAS-CM Project: Y2018/EMT-5177).

Acknowledgments

Our thanks go to all the institutions that disseminate their models, satellite images, and other types of environmental and meteorological information through Internet. Authors would also like to acknowledge all the people who share their knowledge about software through Internet and, specially, Lucía Chas, for her invaluable technical support in improving the first version and developing the second version of SCALA©.

Conflicts of Interest

The authors declare no conflict of interest.

References

  1. de Foy, B.; Schauer, J.J. Origin of high particle number concentrations reaching the St. Louis, Midwest Supersite. J. Environ. Sci. 2015, 34, 219–231. [Google Scholar] [CrossRef]
  2. Gao, J.; Chai, F.; Wang, T.; Wang, S.; Wang, W. Particle number size distribution and new particle formation: New characteristics during the special pollution control period in Beijing. J. Environ. Sci. 2012, 24, 14–21. [Google Scholar] [CrossRef]
  3. Oberdorster, G. Toxicology of ultrafine particles: In vivo studies. Philos. Trans. R. Soc. Lond. Ser. A Math. Phys. Eng. Sci. 2000, 358, 2719–2740. [Google Scholar] [CrossRef]
  4. Oberdörster, G.; Oberdörster, E.; Oberdörster, J. Nanotoxicology: An Emerging Discipline Evolving from Studies of Ultrafine Particles. Environ. Health Perspect. 2005, 113, 823–839. [Google Scholar] [CrossRef] [Green Version]
  5. Xu, P.; Zhang, J.; Ji, D.; Liu, Z.; Tang, G.; Jiang, C.; Wang, Y. Characterization of submicron particles during autumn in Beijing, China. J. Environ. Sci. 2018, 63, 16–27. [Google Scholar] [CrossRef]
  6. Yan, J.; Chen, L.; Lin, Q.; Zhao, S.; Li, L. Pollutants identification of ambient aerosols by two types of aerosol mass spectrometers over southeast coastal area, China. J. Environ. Sci. 2018, 64, 252–263. [Google Scholar] [CrossRef] [PubMed]
  7. Stocker, T.F.; Qin, D.; Plattner, G.K.; Tignor, M.; Allen, S.K.; Boschung, J.; Nauels, A.; Xia, Y.; Bex, V.; Midgley, P.M. IPCC 2013, Intergovernmental Panel on Climate Change. Summary for Policymakers. In Climate Change 2013: The Physical Science Basis; Cambridge University Press: New York, NY, USA, 2013. [Google Scholar]
  8. Fuzzi, S.; Andreae, M.O.; Huebert, B.J.; Kulmala, M.; Bond, T.C.; Boy, M.; Doherty, S.J.; Guenther, A.; Kanakidou, M.; Kawamura, K.; et al. Critical assessment of the current state of scientific knowledge, terminology, and research needs concerning the role of organic aerosols in the atmosphere, climate, and global change. Atmos. Chem. Phys. 2006, 6, 2017–2038. [Google Scholar] [CrossRef] [Green Version]
  9. Coz, E.; Leck, C. Morphology and state of mixture of atmospheric soot aggregates during the winter season over Southern Asia-a quantitative approach. Tellus B Chem. Phys. Meteorol. 2011, 63, 107–116. [Google Scholar] [CrossRef] [Green Version]
  10. Koch, D.; Schulz, M.; Kinne, S.; McNaughton, C.; Spackman, J.R.; Balkanski, Y.; Bauer, S.; Berntsen, T.; Bond, T.C.; Boucher, O.; et al. Evaluation of black carbon estimations in global aerosol models. Atmos. Chem. Phys. 2009, 9, 9001–9026. [Google Scholar] [CrossRef] [Green Version]
  11. Lim, S.; Lee, M.; Kim, S.-W.; Yoon, S.-C.; Lee, G.; Lee, Y.J. Absorption and scattering properties of organic carbon versus sulfate dominant aerosols at Gosan climate observatory in Northeast Asia. Atmos. Chem. Phys. 2014, 14, 7781–7793. [Google Scholar] [CrossRef] [Green Version]
  12. Liu, D.; Allan, J.; Corris, B.; Flynn, M.; Andrews, E.; Ogren, J.; Beswick, K.; Bower, K.; Burgess, R.; Choularton, T.; et al. Carbonaceous aerosols contributed by traffic and solid fuel burning at a polluted rural site in Northwestern England. Atmos. Chem. Phys. 2011, 11, 1603–1619. [Google Scholar] [CrossRef] [Green Version]
  13. Alonso-Blanco, E.; Gómez-Moreno, F.J.; Núñez, L.; Pujadas, M.; Cusack, M.; Artíñano, B. Aerosol particle shrinkage event phenomenology in a South European suburban area during 2009–2015. Atmos. Environ. 2017, 160, 154–164. [Google Scholar] [CrossRef]
  14. Seinfeld, J.H.; Pandis, S.N. Atmospheric Chemistry and Physics: From Air Pollution to Climate Change; John Wiley & Sons, Ltd.: New York, NY, USA, 1998. [Google Scholar]
  15. Samoli, E.; Andersen, Z.J.; Katsouyanni, K.; Hennig, F.; Kuhlbusch, T.A.J.; Bellander, T.; Cattani, G.; Cyrys, J.; Forastiere, F.; Jacquemin, B.; et al. Exposure to ultrafine particles and respiratory hospitalisations in five European cities. Eur. Respir. J. 2016, 48, 674–682. [Google Scholar] [CrossRef]
  16. Penttinen, P.; Timonen, K.L.; Tiittanen, P.; Mirme, A.; Ruuskanen, J.; Pekkanen, J. Number concentration and size of particles in urban air: Effects on spirometric lung function in adult asthmatic subjects. Environ. Health Perspect. 2001, 109, 319–323. [Google Scholar] [CrossRef]
  17. Peters, A.; Wichmann, H.E.; Tuch, T.; Heinrich, J.; Heyder, J. Respiratory effects are associated with the number of ultrafine particles. Am. J. Respir. Crit. Care Med. 1997, 155, 1376–1383. [Google Scholar] [CrossRef] [PubMed]
  18. Wiedensohler, A.; Birmili, W.; Nowak, A.; Sonntag, A.; Weinhold, K.; Merkel, M.; Wehner, B.; Tuch, T.; Pfeifer, S.; Fiebig, M.; et al. Mobility particle size spectrometers: Harmonization of technical standards and data structure to facilitate high quality long-term observations of atmospheric particle number size distributions. Atmos. Meas. Tech. 2012, 5, 657–685. [Google Scholar] [CrossRef]
  19. Gómez-Moreno, F.J.; Sastre, M.; Artíñano, B.; Piñeiro-Iglesias, M.; López-Mahía, P.; Pey, J.; Ripoll, A.; Alastuey, A.; Sorribas, M.; Fernández, M.; et al. The Spanish Network on Environmental DMAs: Introduction and main activities. In Proceedings of the IV Spanish Meeting on Aerosol Science and Technology (RECTA), Granada, Spain, 28–30 June 2010. [Google Scholar]
  20. The R Development Core Team. R: A Language and Environment for Statistical Computing; R Foundation for Statistical Computing: Vienna, Austria, 2018. [Google Scholar]
  21. Sommerville, I. Software Engineering, 10th ed.; Pearson: London, UK, 2015. [Google Scholar]
  22. Pressman, R.S.; Maxim, B.R. Software Engineering: A Practitioner’s Approach, 8th ed.; McGraw-Hill: New York, NY, USA, 2015. [Google Scholar]
  23. Andrade, J.; Ares, J.; García, R.; Presa, J.; Rodríguez, S.; Piñeiro-Iglesias, M.; López-Mahía, P.; Muniategui, S.; Prada, D. Development of a Web-based Support System for Both Homogeneous and Heterogeneous Air Quality Control Networks: Process and Product. Environ. Monit. Assess. 2007, 133, 139–148. [Google Scholar] [CrossRef]
  24. Object Management Group. Available online: www.uml.org (accessed on 16 May 2019).
  25. Gómez-Moreno, F.J.; Alonso, E.; Artíñano, B.; Rodríguez-Maroto, J.; Rojas, E.; Piñeiro-Iglesias, M.; López-Mahía, P.; Pérez, N.; Alastuey, A.; Archilla, V.; et al. The REDMAAS 2015 intercomparison campaign (CPC+ long/nano-SMPS+UFPM): First results. In Proceedings of the European Aerosol Conference (EAC), Tours, France, 4–9 September 2016. [Google Scholar]
  26. Carslaw, D.C.; Ropkins, K. Openair—An R package for air quality data analysis. Environ. Model. Softw. 2012, 27–28, 52–61. [Google Scholar] [CrossRef]
  27. Carslaw, D. The openair manual—Open-source tools for analysing air pollution data. Man. Version 2015, 1, 1–4. [Google Scholar]
  28. Nychka, D.; Furrer, R.; Paige, J.; Sain, S. Fields: Tools for Spatial Data; University Corporation for Atmospheric Research: Boulder, CO, USA, 2017. [Google Scholar]
  29. Alonso-Blanco, E.; Gómez-Moreno, F.J.; Artíñano, B.; Samitier, S.I.; Juncal, V.; Iglesias, M.P.; Mahía, P.L.; Pérez, N.; Brines, M.; Alastuey, A.; et al. Atmospheric Particle Size Distributions in the Spanish Network of Environmental DMAs (REDMAAS). IOP Conf. Ser. Earth Environ. Sci. 2015, 28, 012001. [Google Scholar] [CrossRef] [Green Version]
  30. Derimian, Y.; Dubovik, O.; Huang, X.; Lapyonok, T.; Litvinov, P.; Kostinski, A.B.; Dubuisson, P.; Ducos, F. Comprehensive tool for calculation of radiative fluxes: Illustration of shortwave aerosol radiative effect sensitivities to the details in aerosol and underlying surface characteristics. Atmos. Chem. Phys. 2016, 16, 5763–5780. [Google Scholar] [CrossRef]
Figure 1. Holistic solution: phases considered for a campaign in SCALA©.
Atmosphere 10 00279 g001
Figure 2. Process followed in SCALA© development.
Atmosphere 10 00279 g002
Figure 3. Increments in SCALA© development.
Atmosphere 10 00279 g003
Figure 4. Evolution of the Particle number concentration (cm−3) vs. Time (UTC) measured during the sampling period. It includes the measurements by the CIEMAT and UDC instruments, the average values and the +/− 10% band.
Atmosphere 10 00279 g004
Figure 5. dN/dLog dp (cm−3) vs. dp (nm) for the Scanning Mobility Particle Sizers (SMPS) calibration checks with 200 nm latex particles.
Atmosphere 10 00279 g005
Figure 6. dN/dLog dp (cm−3) vs. dp (nm) for the SMPS intercomparison during REDMAAS2019.
Atmosphere 10 00279 g006
Figure 7. Average dN/dLog dp (cm−3) vs. dp (nm) for the SMPS at CIEMAT site during campaigns PROACLIM and CRISOL (years 2015 and 2016).
Atmosphere 10 00279 g007
Figure 8. Total particle number concentration (cm−3) vs. time (UTC hour, month and day) for the year 2015 at CIEMAT (total1) and UDC (total2) sites.
Atmosphere 10 00279 g008
Figure 9. A surface plot showing the evolution of the particle size distribution during a week (29 June–5 July 2015).
Atmosphere 10 00279 g009
Figure 10. Meteorological parameter evolution during the week 29 June–5 July 2015. Temperature (T), Relative Humidity (RH), Wind Speed (WS) and Direction (WD), Solar Radiation (RS) and Pressure (AP) are shown.
Atmosphere 10 00279 g010