Article

Contribution of Fine Particles to Air Emission at Different Phases of Biomass Burning

School of Engineering and Built Environment, Griffith University, Nathan 4111, Queensland, Australia
*
Author to whom correspondence should be addressed.
Atmosphere 2019, 10(5), 278; https://doi.org/10.3390/atmos10050278
Submission received: 16 April 2019 / Revised: 10 May 2019 / Accepted: 14 May 2019 / Published: 16 May 2019
(This article belongs to the Special Issue Biomass Burning and Their Impacts)

Abstract

:
Particle size distribution in biomass smoke was observed for different burning phases, including flaming and smouldering, during the combustion of nine common Australian vegetation representatives. Smoke particles generated during the smouldering phase of combustions were found to be coarser as compared to flaming aerosols for all hard species. In contrast, for leafy species, this trend was inversed. In addition, the combustion process was investigated over the entire duration of burning by acquiring data with one second time resolution for all nine species. Particles were separately characterised in two categories: fine particles with dominating diffusion properties measurable with diffusion-based instruments (Dp < 200 nm), and coarse particles with dominating inertia (Dp > 200 nm). It was found that fine particles contribute to more than 90 percent of the total fresh smoke particles for all investigated species.

1. Introduction

Biomass burning (BB) emissions stem from a variety of sources, including wild fires as a natural source and prescribed controlled burnings, agricultural activities, waste burning and heating as anthropogenic causes [1]. Biomass burning processes result in the emission of mainly CO2 and a variety of trace gases, such as CO, CH4, N2O, NOx and non-methane organic compounds (NMOCs), as well as the formation of particulate matter (PM) composed of elemental and organic carbon and some fractions of inorganic material [2]. Depending on their size distribution, chemical composition and morphology, particle emissions from biomass burning can affect human health. Particle size of PM is the main factor influencing its deposition depth in the respiratory system and consequent health impacts on humans [3,4,5]. Particulate matter with a diameter of less than 2.5 µm (PM2.5) has a major impact on the physiochemical properties of the atmosphere. These particles have an adverse effect on visibility, scattering and absorption of solar radiation, alter the formation of cloud nuclei and contribute to climate change due to their light scattering and absorption properties [6]. Biomass burning particles also account for two-thirds of the overall primary organic aerosol [7]. Milic et al. [8] have reported that organic material contributes to up to 90% of the sub-micron mass in the non- refractory fraction of biomass burning plume in case of Australia’s Northern Territory savannah fires. Also, Alonso-Blanco and colleagues [9] have found that during wildfire days, the number of particles with a diameter of less than 200 nm had demonstrated an up to sevenfold jump as compared to normal days.
Particles of nuclei mode, i.e., with an aerodynamic diameter smaller than 10 nm, can be produced either by combustion or by the conversion of gaseous volatile compounds to particles through homogenous condensation; Atkein mode particles, with an aerodynamic diameter between 10 nm and 100 nm, are formed by the growth of nucleation particles through heterogeneous processes [10,11]. In fresh smoke that is less than a few minutes old and very close to the fire, laboratory and field studies have detected substantial presence of numerous particles of nucleation and Atkein mode, which would transfer to accumulation mode (aerodynamic diameter between 100 nm and 1 µm) with further aging up to half an hour [12,13]. These ultrafine particles (UFP) (particles with Dp < 100 nm) are easily deposited in deeper parts of the respiratory tract and the pulmonary/alveolar zone through diffusion mechanisms. They contain organic materials, such as polycyclic aromatic hydrocarbons (PAHs), causing inflammatory and genotoxic responses, and heavy metals [14,15]. Only recently, some studies have focused on exclusively investigating these chemical and elemental components in UFPs as well as their biological effects [14,16,17,18].
Particle size distribution is known to be affected by different factors, including fuel density, composition, moisture content (fresh/dry), combustion phase (flaming/mixing/smouldering) and fuel type (branch, foliage, log, etc.) [12,19,20,21]. In the literature, BB particle concentration peaks have mainly been observed in ultrafine mode, being around 100–150 nm for different cereal straws [22,23], around 30–200 nm and 40–45 nm for wet fuels (e.g., Montana grass and Tundra cores) and some dry fuels (e.g., pine wood and needle and Dambo grass), respectively [24], 100 nm for agricultural open burning with 25–80 nm for flaming and a bimodal distribution with peaks at 10 nm and 50 nm for smouldering [6]. Wu et al. [13] reported a dominance of Dp < 200 nm with geometric mean diameters (GMD) of 30–50 nm and 20–90 nm for two biomass burning events in Beijing, China. However, some literature reported outcomes confirming presence of concentration peaks from biomass burning for particle sizes representing accumulation mode [22]. They reported a bimodal distribution of particles with peaks at 300–400 nm and 10,000 nm acquired during bushfires in Amazonian and African Savanna regions.
Size distribution and number concentration of biomass burning PM have been investigated in various studies around the world for a range of different fuel types using a variety of analytical instruments. Hosseini et al. [19] used a number of TSI instruments (TSI, St.Paul, USA), including a fast mobility particle sizer (FMPS) for measurements of 7–520 nm particles and an aerodynamic particle sizer (APS) for larger particles in the range of 0.5–20 µm. They investigated the air emission from a number of fuel types at different burning conditions, including flaming, smouldering and open burning. For most of their fuels, the major modes were between 29 and 52 nm. Similarly, Rissler et al. [25] studied particles of smoke with a size range of 3 nm–3.3 µm for wildfire emissions in Amazonia. They observed all three common modes in airborne particulates: nucleation mode with geometrical median diameters (GMDs) of around 12 nm, Aitken mode with GMDs between 61 and 92 nm and accumulation mode with GMDs between 128 and 190 nm.
Chen et al. [26] reported the results of the size distribution study of particles containing a range of chemical compositions in straw burning smoke. Their results were all within the size range of accumulation mode. Hossain and colleagues [27] used a scanning mobility particle sizer (SMPS), particle size distribution analyser (PSD), volatility tandem differential analyser (VTDA), and transmission electron microscopy (TEM) to compare size distributions of hardwood (oak), softwood (pine) and rice straw smoke particles for flaming, smouldering and open burning conditions. For all conditions in case of wood burning, they observed a bimodal distribution, whereas for rice straw a unimodal distribution was found for all three burning conditions.
Wardoyo et al. [28] undertook a series of laboratory experiments and reported that for different grass species, smoke particles produced in rapid burning are generally smaller (diameter between 30 to 60 nm) as compared to slow burning process particles with a common size range of 60–210 nm.
It ought to be noticed that very few studies were undertaken in Australia, regardless of the fact that the country accounts for approximately 15% of global burned lands annually. This study firstly investigated the size distribution of nanoparticles generated by the flaming and smouldering burning phases during the combustion of nine local plants indigenous to South East Queensland, Australia. Next, the combustion process was investigated over the entire burning duration by acquiring data every second for all the species. Particles were divided into two categories: fine particles with dominating diffusion properties measurable with diffusion-based instruments (Dp < 200 nm) and coarse particles with dominating inertia (Dp > 200 nm).

2. Materials and Methods

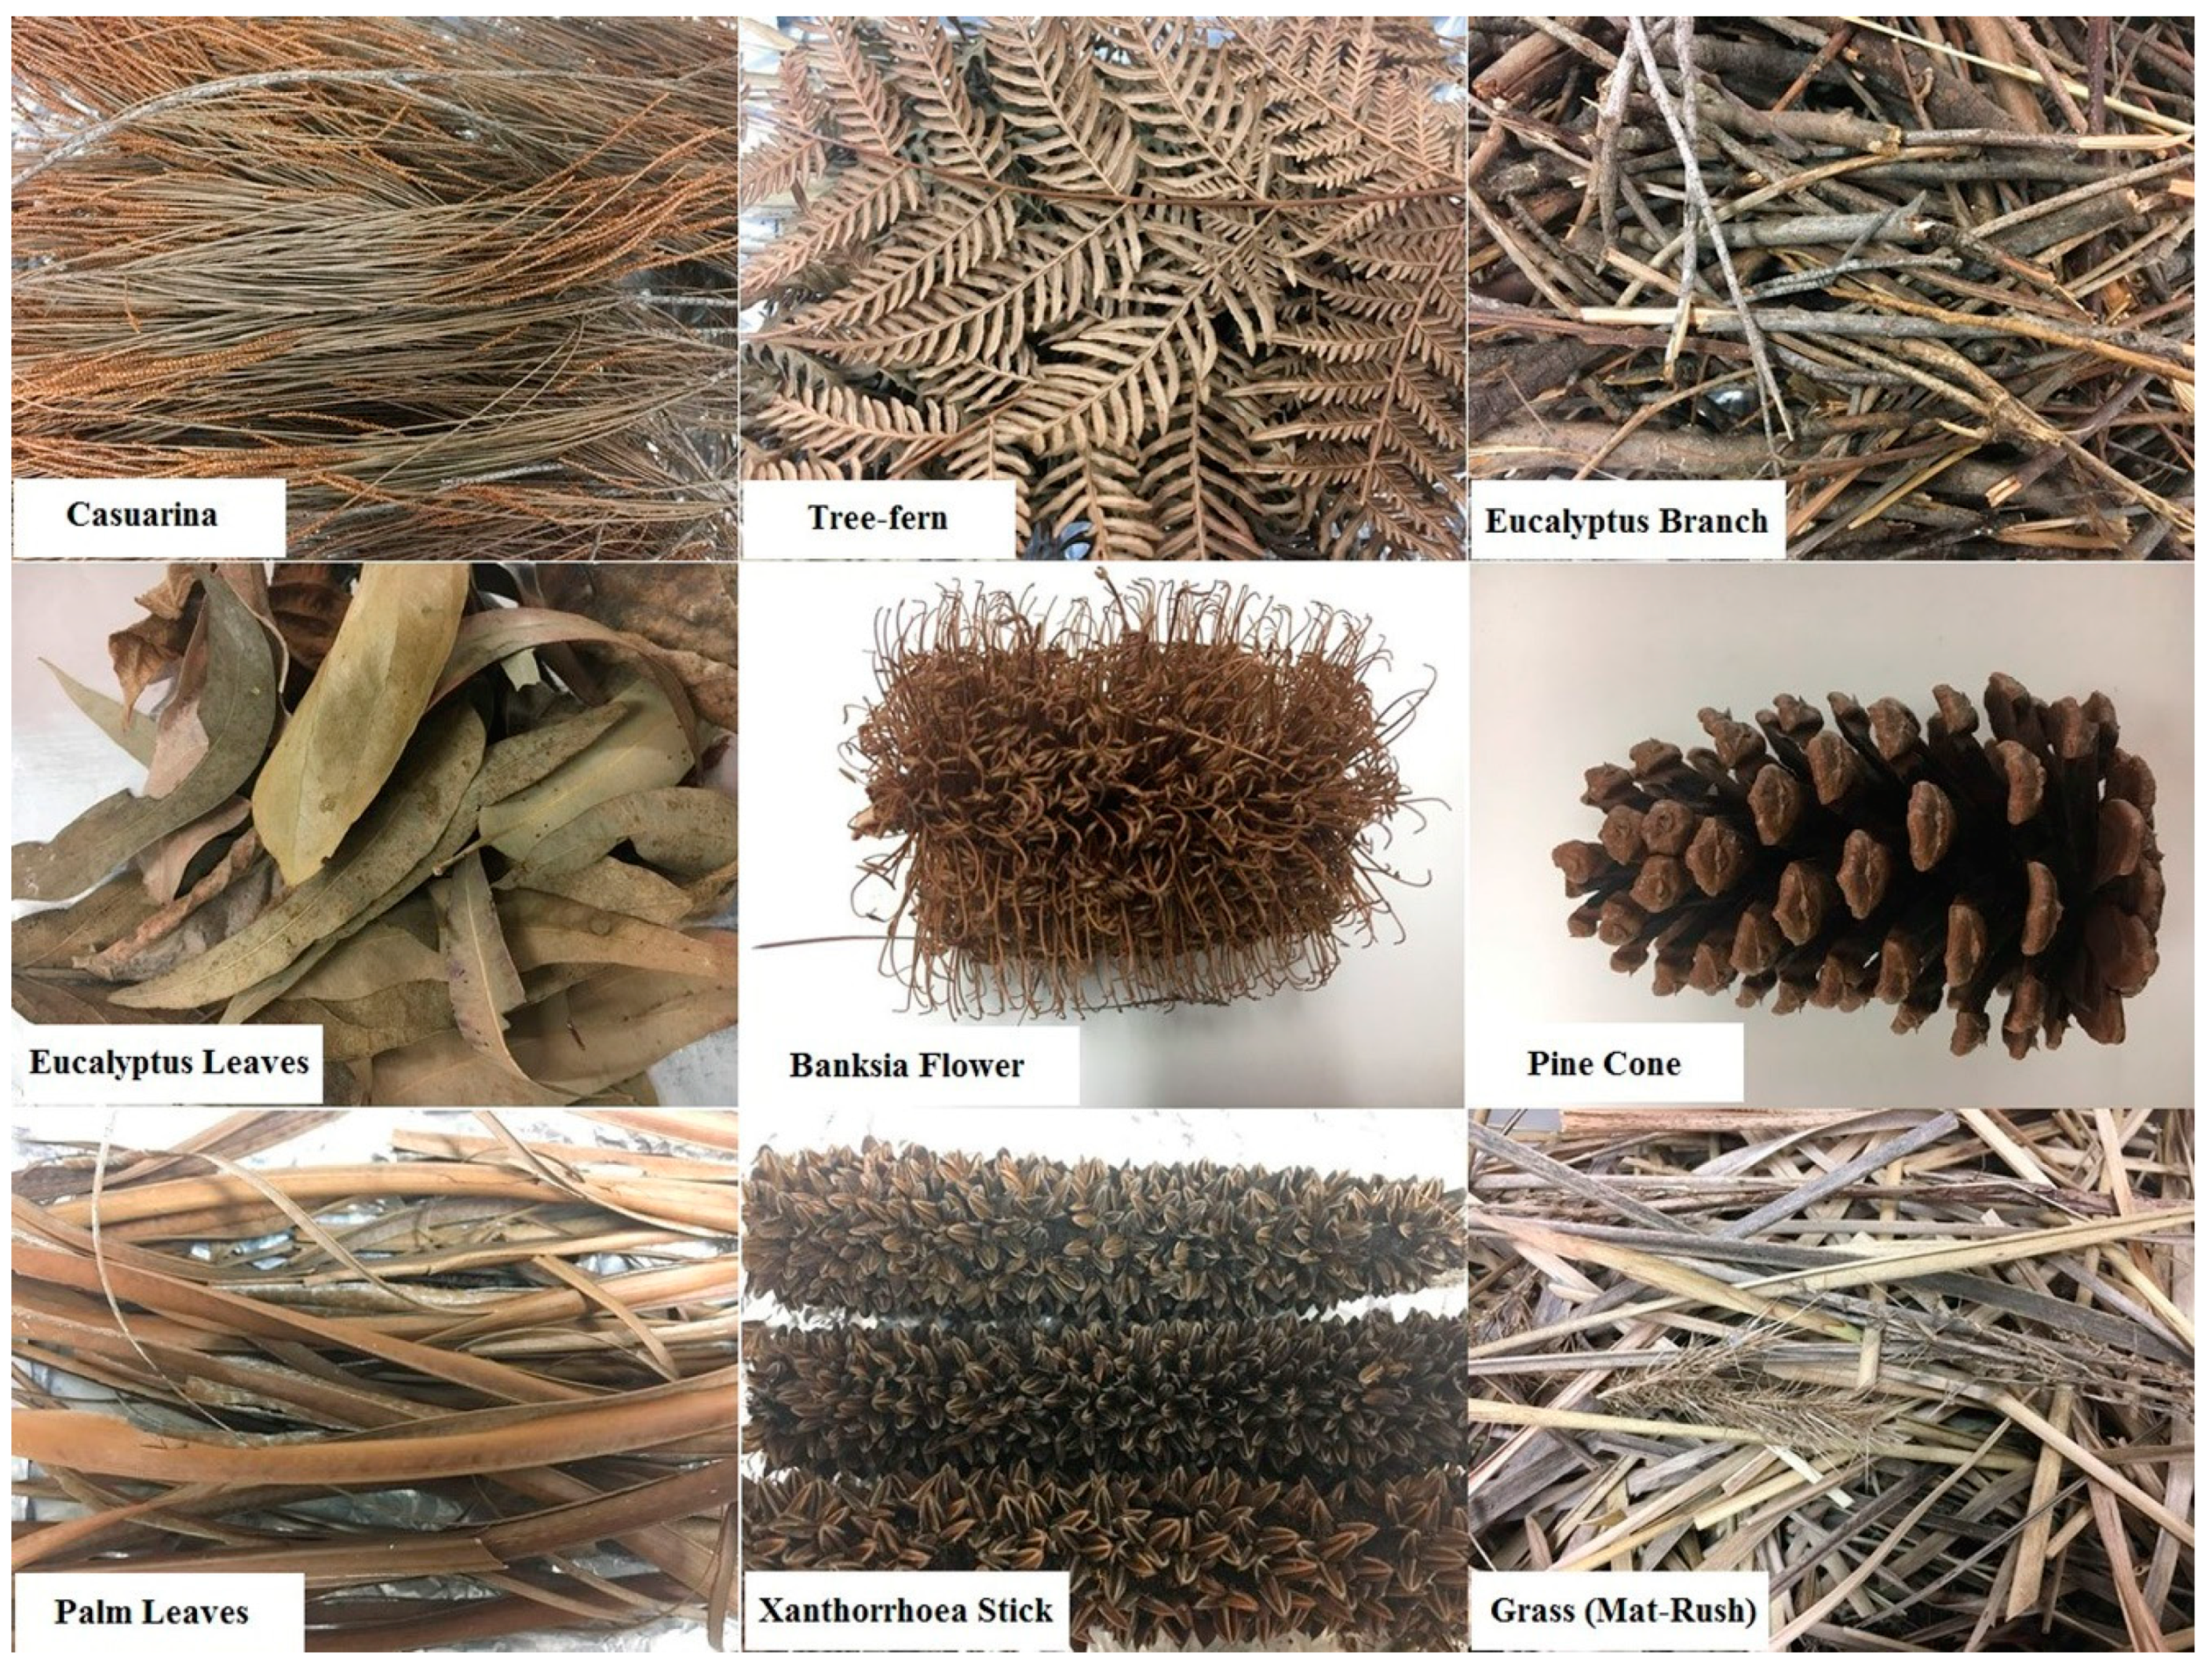
2.1. Vegetation Collection and Classification

Nine ubiquitous species of vegetation local to South East Queensland, Australia, were chosen as biomass fuels (see Figure 1). They include dry eucalyptus branches (mostly with a diameter of less than 20 mm), dried and fallen leaves (belonging to a variety of the eucalyptus species), grass (mat rush), dried palm leaves, banksia flower, xanthorrhoea stick, dried tree fern, dried casuarina leaves and stalks and pine cone. All materials were collected on sunny days from different locations of the Toohey forest, which occupies an area of approximately 260 hectares. Then identical species were mixed to achieve more integrated results and placed in an oven set at 60 °C for 48 h, in order to reduce the excess moisture content and enhance the following burning process. Then the materials were removed from the oven and left in laboratory-controlled conditions (25 °C and 45–50% RH) for 24 h so that all the materials were in an identical moisture equilibrium. On the completion of the 24 h fuel moisture equilibrating procedure in the laboratory, 20 g samples were prepared by weighing on analytical balance with a resolution of 0.01 mg (HR202, A&D Tokyo, Japan). Fuels were ignited with the aid of ethanol (few drops) to provide even burning performed on a home-made steel tray with the dimensions of 28 × 17 cm.

2.2. Burning and Aerosol Sampling

The controlled burning experiments were undertaken in the fume cabinet in order to (1) ensure no air emission escape to the laboratory space and (2) minimize the influence of any particles alien to the combustion aerosol reaching the sample collection zone and interfering with the results. As was measured, the concentration of particles in the ambient air was up to 4000 cm−1. This result is approximately three orders of magnitude lower as compared to combustion aerosols produced in the experiments, which corresponds to much less than 1% contribution and could be neglected. Aerosol collection was performed through a 150 mm long stainless-steel pipe placed at a height of 16 cm above the flame. The pipe was connected to a particular aerosol monitoring instrument described below, with 30 cm long silicon tubing ensuring that the air sample was sufficiently cold at the instrument entry point to avoid any damage. If the number concentration was beyond the capability range of the instruments, 10-fold and 100-fold aerosol diluters were used in all corresponding experimental runs. They utilized clean air filtered by a high-efficiency particulate air (HEPA) filter to ensure no influence of alien particles on the results.
To precisely identify the size distribution of combustion aerosols in different combustion phases, monitoring was undertaken for the flaming (commencing 5 s after ignition to ensure no presence of ethanol combustion products remaining in the emission stream, as was confirmed by an independent experiment involving monitoring of the combustion of ethanol in the amount used in the experiments) and smouldering (commencing at the stage when the open flame disappeared) phases by scanning mobility particle sizer (Model 3080, SMPS, TSI, St. Paul, USA). Considering the instrument’s operation requirements, the duration of the monitoring scan was set to 40 seconds, ensuring that even the fastest combustion scenarios would be comprehensively covered with no phase overlapping during monitoring. At least six repeats were made to compensate for some possible instabilities of the combustion processes and the averages along with standard deviations (STDs) were recorded.
Considering the very dynamic nature of the biomass burning process, it was very important to monitor air emission on a frequent basis and over the complete duration of the process starting from ignition and completed at the entire extinction of smoke particles. Such capability is offered by the diffusion aerosol spectrometer (DAS) (Model 2702M, Aeronanotech, Moscow, Russia) [29]. The instrument is capable of monitoring airborne particles with a time resolution of one second in two size ranges (3 nm–200 nm and 200 nm–10,000 nm) in parallel, combining condensation particle counting for smaller sizes of <200 nm and light scattering for particles larger than 200 nm. At least six combustion replicates were undertaken for each fuel material described above.

3. Results and Discussions

It ought to be noticed that all species demonstrated different behaviours during combustion, which is very important for the evaluation of potential environmental hazards and air contamination during natural fires of different vegetation types. In particular, xanthorrhoea stick had a phase of flaming around 60 s and smouldered for almost 4 min afterwards. Eucalyptus leaves had a very fast and intense flaming phase of around 40 s. Eucalyptus branches had a very laminar and steady flaming phase for less than two minutes and then smouldered for up to 15 min. The mat rush flaming phase was around 60 s, and then it smouldered for less than 2 min. Tree fern exhibited only one phase of burning holding the flames until the end for around 60 s without any noticeable smouldering phase (which is normally marked with white smoke production). Casuarina burned with intense flaming of 40 s and then one minute of smouldering. Palm leaves had a flaming phase of 40 s and a smouldering phase of 3 min. Banksia flower flaming lasted 40 s, and smouldering continued for more than 3 min. Pinecones had 90 s long flaming and smouldered for almost 8 min.
Figure 2 shows the monitoring results of the combustion for each plant involved in this project, as described above. As is seen, the particle number concentration did not vary much and was usually within one order of magnitude for all species involved. As mentioned in the introduction section, the particle characteristics are very sensitive to a number of combustion parameters, such as the scale of the fire, moisture content, fuel type, and so forth. The use of similar weights of the fuel samples, moisture equilibration and identical combustion/sampling facility minimised the influence of those parameters, making the graphs in Figure 2 suitable for the direct comparison of peak diameters and modes for different burning phases for all species.
It should be noted that the results reported in the literature on flaming and smouldering size distribution are quite contradictive. They are highly depended on the biomass material (straw, wood, foliage, forest, savannah or grass), and flaming particles are usually reported to be larger than smouldering particles [12,27]. However, at low combustion efficiencies, which are associated with extreme smouldering conditions, particles become larger again [12].
In our study, the general trend of the diagrams shows that for most of the fuels, smouldering burning produced higher particle number concentrations compared to flaming burning, with flaming modes larger than smouldering ones. However, this trend was sometimes inversed. For example, the results obtained for xanthorrhoea stick and eucalyptus branches demonstrated higher particle number concentrations and smaller mode diameters for the flaming phase as compared to the smouldering phase. One possible explanation for these mode size shifts between different burning phases is that for the various organic carbon compounds present in the fuel, melting points are affected by the differential temperature of each burning condition. For instance, Hays and colleagues [30] found over 200 compounds in an emissions stream originated from rice straw combustion processes. According to [31], these compounds have melting points ranging between 0 °C and 250+ °C, which covers flaming (>200 °C) and smouldering (<200 °C) temperature ranges.
In the current study, the harder species (eucalyptus branch, xanthorrhoea stick and pine cone) are known to contain larger quantities of volatile compounds, which were evaporated into the flaming emission and subsequently condensed at lower temperature zones upon moving further away from the source. Such condensation was responsible for smaller mode numbers for flaming as well as making a significant contribution to the number concentrations during this combustion phase.
Table 1 summarizes the particle statistics information obtained by the SMPS. Results represent average values for all repetitions. As is seen, the flaming mode sizes varied from 52 nm for eucalyptus branch to 302 nm for eucalyptus leaves. Smouldering mode sizes ranged between 68.5 nm for xanthorrhoea and 130 nm for pine cone. Interestingly, one of the fuels, tree fern, exhibited only one phase of burning, which was flaming with no measurable smouldering phase.
Hosseini et al. [19] reported bimodality observed in their investigation of smouldering aerosols in a size range of 7–520 nm. One mode was detected within the nucleation region with the peak at around 10 nm, and the other one was in the range of 30–50 nm. It must be highlighted that no bimodality was observed in the current investigation for all fuel types during flaming aerosol release within the investigated size range. However, there was some bimodality detected during the smouldering of casuarina, eucalyptus leaves, pine cone, and banksia flower. As is seen, the peak of the small mode was beyond the investigated size range; however, its general presence is clear in corresponding graphs.
The very useful capability of a DAS enabled to acquire separate results for the total particulate matter (from 3 nm to 10,000 nm) as well as for fine particles with a diameter range of 3–200 nm at one second intervals over the entire combustion process for each fuel was used in this project. The general trends for most of the fuels appear to be similar and on a par with the SMPS results, with the majority of the produced particles being in the fine and ultrafine range. The difference was mainly related to the duration of combustion for each fuel type varying from 85 s for tree fern to 1054 s for eucalyptus branch.
The results of DAS monitoring of the entire combustion process for all nine species are presented in Figure 3. Average data obtained from 6+ replicates for each burning and their error bars are presented. It is shown that all fuels exhibited similar trends showing a spike in number concentrations of particles with Dp < 200 nm right after the ignition and a slump in it by the end of the burning process. For all fuels, fine particles represent the vast majority of combustion aerosols, dominating over particles in the coarse range by more than two orders of magnitude in some cases. Some species produced higher number concentrations of fine particles for the flaming phase (banksia flower, casuarina, eucalyptus branch and xanthorrhoea stick), and others had higher number concentrations of fine particles during the smouldering phase (palm leaves, mat rush, pine cone and eucalyptus leaves).
A very illustrative parameter suggested for comparison between combustion-sourced air emissions related to different species is the ratio of particles with a diameter larger than 200 nm by the total number of particles (here referred to as C/T ratio). This parameter has been obtained for each type of burning vegetation representative, and the results are shown in Figure 4. As is seen, the results are rather fuel specific and provide very limited possibilities for generalisation; some of them tend to demonstrated a relatively distinctive increase with the progress of the burning process (banksia flower and xanthorrhoea stick), whilst most of others showed more fluctuations along the entire monitoring procedure. A peak in C/T ratios is observed during the flaming phases followed by a decrease by the beginning of smouldering. Then another peak is observed mid-smouldering and closer to the end of the burning processes before it goes back to the background ratio (0.056 ± 0.02). The C/T ratios are distinctively larger at this “mid-smouldering ratio peak” compared to the beginning of the burning process and compared to the “flaming” values for harder species (pine cone, eucalyptus branch, and xanthorrhoea stick) and banksia flower (which also has a hard middle part). In contrast, for leafy species (casuarina, palm leaves and eucalyptus leaves), the C/T ratio peak for the flaming was higher than the smouldering one. Mat rush (grass) and tree fern had an initial sudden peak in this ratio right after the ignition. Furthermore, maximum ratios were higher for harder species compared to leafy ones.
The percentage of the fine particle contribution to the total particles produced during the whole burning processes is provided in Table 2 for each vegetation type. It is clear that the majority of the fresh smoke particles belong to the fine category, which are known to be associated with health issues; such particles are currently considered as potential contributors to health problems with the cardiorespiratory and central nervous system [32].

4. Conclusions

The nine biomass fuels used in this study were typical Australian vegetation representatives of both a harder, woody nature and leafy materials. It was shown that the size distributions of nanoparticles released to the atmosphere from the combustion of harder fuels (eucalyptus branch, xanthorrhoea stick and pine cone) were larger for smouldering modes as compared to the flaming ones. In contrast, the situation was the opposite for leafy fuels, where flaming mode-associated particles were larger.
The ratio of the number of particles with a diameter larger than 200 nm to the total number of produced aerosols was calculated with one second intervals for the entire combustion processes duration, and two peaks were observed during the flaming and smouldering phases. For harder species, the smouldering peak was higher than the flaming peak, while for the leafy species the situation was the opposite, and the flaming peak dominated.
Finally, it should be noted that the combustion of all species was responsible for aerosol production with fine particles (Dp < 200 nm), accounting for more than 90% of the total produced particles. In many investigations, such particles are left out of consideration, as the majority of optical instruments used at the bushfire frontline are not sophisticated enough and blind for any aerosols below 300 nm. This is especially important as, according to this study, fine particles, which are usually considered as minor contributors to the total mass released to the atmosphere, in reality could be quite substantial. It is seen from the results that their amount in some cases dominated by more than two orders of magnitude over coarse ones, making them a significant contributor of the mass delivered to the ambient air. As also mentioned by the WHO [32], clinical and toxicological studies have shown that fine and ultrafine particles in part act through mechanisms not shared with PM2.5 or PM10 and larger particles. On this basis, special attention needs to be paid to the health effects associated with fine bushfire-related aerosols in the future.

Author Contributions

Conceptualization, N.O. and I.E.A.; Methodology, N.O. and I.E.A.; Formal Analysis, N.O. and I.E.A.; Investigation, N.O.; Resources, I.E.A.; Data Curation, N.O. and I.E.A.; Writing—Original Draft Preparation, N.O.; Writing—Review & Editing, I.E.A.; Supervision, I.E.A.; Project Administration, I.E.A.; Funding Acquisition, I.E.A.

Funding

This research received no external funding.

Conflicts of Interest

The authors declare no conflict of interest.

References

  1. Ordou, N.; Agranovski, I. Mass distribution and elemental analysis of the resultant atmospheric aerosol particles generated in controlled biomass burning processes. Atmos. Res. 2017, 198, 108–112. [Google Scholar] [CrossRef]
  2. Mallet, M.; Desservettaz, M.; Miljevic, B.; Milic, A.; Ristovski, Z.; Alroe, J.; Griffith, D.W. Biomass burning emissions in north Australia during the early dry season: An overview of the 2014 SAFIRED campaign. Atmos. Chem. Phys. 2017, 17, 13681–13697. [Google Scholar] [CrossRef]
  3. Nayek, S.; Padhy, P.K. Daily personal exposure of women cooks to respirable particulate matters during cooking with solid bio-fuels in a rural community of West Bengal, India. Aerosol. Air Qual. Res. 2017, 17, 245–252. [Google Scholar] [CrossRef]
  4. Karthikeyan, S.; Balasubramanian, R.; Iouri, K. Particulate air pollution from bushfires: Human exposure and possible health effects. J. Toxicol. Environ. Health Part A Curr. Issues 2006, 69, 1895–1908. [Google Scholar] [CrossRef] [PubMed]
  5. Pope, C.A., III; Dockery, D.W. Health effects of fine particulate air pollution: Lines that connect. J. Air Waste Manag. Assoc. 2006, 56, 709–742. [Google Scholar] [CrossRef]
  6. Costa, M.A.M.; Carvalho, J.; Neto, T.S.; Anselmo, E.; Lima, B.; Kura, L.; Santos, J. Real-time sampling of particulate matter smaller than 2.5 μm from Amazon forest biomass combustion. Atmos. Environ. 2012, 54, 480–489. [Google Scholar] [CrossRef]
  7. Bond, T.C.; Doherty, S.J.; Fahey, D.; Forster, P.; Berntsen, T.; DeAngelo, B.; Koch, D. Bounding the role of black carbon in the climate system: A scientific assessment. J. Geophys. Res. Atmos. 2013, 118, 5380–5552. [Google Scholar] [CrossRef] [Green Version]
  8. Milic, A.; Mallet, M.D.; Cravigan, L.T.; Alroe, J.; Ristovski, Z.D.; Selleck, P.; Paton-Walsh, C. Biomass burning and biogenic aerosols in northern Australia during the SAFIRED campaign. Atmos. Chem. Phys. 2017, 17, 3945–3961. [Google Scholar] [CrossRef] [Green Version]
  9. Alonso-Blanco, E.; Calvo, A.I.; Pont, V.; Mallet, M.; Fraile, R.; Castro, A. Impact of biomass burning on aerosol size distribution, aerosol optical properties and associated radiative forcing. Aerosol Air Qual. Res. 2014, 14, 708–724. [Google Scholar] [CrossRef]
  10. Chen, S.-C.; Hsu, S.-C.; Tsai, C.-J.; Chou, C.C.-K.; Lin, N.-H.; Lee, C.-T.; Pui, D.Y. Dynamic variations of ultrafine, fine and coarse particles at the Lu-Lin background site in East Asia. Atmos. Environ. 2013, 78, 154–162. [Google Scholar] [CrossRef]
  11. Souza, M.L.; Allen, A.G.; Cardoso, A.A. Understanding aerosol formation mechanisms in a subtropical atmosphere impacted by biomass burning and agroindustry. Atmos. Res. 2017, 183, 94–103. [Google Scholar] [CrossRef]
  12. Janhäll, S.; Andreae, M.O.; Pöschl, U. Biomass burning aerosol emissions from vegetation fires: Particle number and mass emission factors and size distributions. Atmos. Chem. Phys. 2010, 10, 1427–1439. [Google Scholar] [CrossRef]
  13. Wu, Z.; Zheng, J.; Wang, Y.; Shang, D.; Du, Z.; Zhang, Y.; Hu, M. Chemical and physical properties of biomass burning aerosols and their CCN activity: A case study in Beijing, China. Sci. Total Environ. 2017, 579, 1260–1268. [Google Scholar] [CrossRef]
  14. Corsini, E.; Vecchi, R.; Marabini, L.; Fermo, P.; Becagli, S.; Bernardoni, V.; Galli, C.L. The chemical composition of ultrafine particles and associated biological effects at an alpine town impacted by wood burning. Sci. Total Environ. 2017, 587, 223–231. [Google Scholar] [CrossRef]
  15. Sarigiannis, D.A.; Karakitsios, S.P.; Zikopoulos, D.; Nikolaki, S.; Kermenidou, M. Lung cancer risk from PAHs emitted from biomass combustion. Environ. Res. 2015, 137, 147–156. [Google Scholar] [CrossRef] [PubMed]
  16. Longhin, E.; Gualtieri, M.; Capasso, L.; Bengalli, R.; Mollerup, S.; Holme, J.A.; Parenti, P. Physico-chemical properties and biological effects of diesel and biomass particles. Environ. Pollut. 2016, 215, 366–375. [Google Scholar] [CrossRef]
  17. Ozgen, S.; Becagli, S.; Bernardoni, V.; Caserini, S.; Caruso, D.; Corbella, L.; Lonati, G. Analysis of the chemical composition of ultrafine particles from two domestic solid biomass fired room heaters under simulated real-world use. Atmos. Environ. 2017, 150, 87–97. [Google Scholar] [CrossRef] [Green Version]
  18. Zhu, C.-S.; Cao, J.-J.; Tsai, C.-J.; Zhang, Z.-S.; Tao, J. Biomass burning tracers in rural and urban ultrafine particles in Xi’an, China. Atmos. Pollut. Res. 2017, 8, 614–618. [Google Scholar] [CrossRef]
  19. Hosseini, S.; Li, Q.; Cocker, D.; Weise, D.; Miller, A.; Shrivastava, M.; Jung, H. Particle size distributions from laboratory-scale biomass fires using fast response instruments. Atmos. Chem. Phys. 2010, 10, 8065–8076. [Google Scholar] [CrossRef] [Green Version]
  20. Popovicheva, O.B.; Shonija, N.K.; Persiantseva, N.; Timofeev, M.; Diapouli, E.; Eleftheriadis, K.; Borgese, L.; Nguyen, X.A. Aerosol Pollutants during Agricultural Biomass Burning: A Case Study in Ba Vi Region in Hanoi, Vietnam. Aerosol Air Qual. Res. 2017, 17, 2762–2779. [Google Scholar] [CrossRef] [Green Version]
  21. Park, S.-S.; Sim, S.Y.; Bae, M.-S.; Schauer, J.J. Size distribution of water-soluble components in particulate matter emitted from biomass burning. Atmos. Environ. 2013, 73, 62–72. [Google Scholar] [CrossRef]
  22. Reid, J.S.; Eck, T.F.; Christopher, S.A.; Koppmann, R.; Dubovik, O.; Eleuterio, D.; Zhang, J. A review of biomass burning emissions part III: Intensive optical properties of biomass burning particles. Atmos. Chem. Phys. 2005, 5, 827–849. [Google Scholar] [CrossRef]
  23. Zhang, H.; Hu, D.; Chen, J.; Ye, X.; Wang, S.X.; Hao, J.M.; An, Z. Particle size distribution and polycyclic aromatic hydrocarbons emissions from agricultural crop residue burning. Environ. Sci. Technol. 2011, 45, 5477–5482. [Google Scholar] [CrossRef]
  24. Chakrabarty, R.K.; Moosmuller, H.; Garro, M.A.; Arnott, W.P.; Walker, J.; Susott, R.A.; Babbitt, R.E.; Wold, C.E.; Lincoln, E.N.; Hao, W.M. Emissions from the laboratory combustion of wildland fuels: Particle morphology and size. J. Geophys. Res. Atmos. 2006, 111. [Google Scholar] [CrossRef] [Green Version]
  25. Rissler, J.; Vestin, A.; Swietlicki, E.; Fisch, G.; Zhou, J.; Artaxo, P.; Andreae, M. Size distribution and hygroscopic properties of aerosol particles from dry-season biomass burning in Amazonia. Atmos. Chem. Phys. 2006, 6, 471–491. [Google Scholar] [CrossRef] [Green Version]
  26. Chen, K.; Yin, Y.; Kong, S.F.; Xiao, H.; Wu, Y.X.; Chen, J.H.; Li, A.H. Size-resolved chemical composition of atmospheric particles during a straw burning period at Mt. Huang (the Yellow Mountain) of China. Atmos. Environ. 2014, 84, 380–389. [Google Scholar] [CrossRef]
  27. Hossain, A.M.; Park, S.; Kim, J.-S.; Park, K. Volatility and mixing states of ultrafine particles from biomass burning. J. Hazard. Mater. 2012, 205, 189–197. [Google Scholar] [CrossRef]
  28. Wardoyo, A.Y.P.; Morawska, L.; Ristovski, Z.D.; Jamriska, M.; Carr, S.; Johnson, G. Size distribution of particles emitted from grass fires in the Northern Territory, Australia. Atmos. Environ. 2007, 41, 8609–8619. [Google Scholar] [CrossRef] [Green Version]
  29. Zagaynov, V. The inverse problem and aerosol measurement. In Aerosols—Science and Technology; Agranovski, I.E., Ed.; Wiley-VCH: Weinheim, Germany, 2010; pp. 252–256. [Google Scholar]
  30. Hays, M.D.; Fine, P.M.; Geron, C.D.; Kleeman, M.J.; Gullett, B.K. Open burning of agricultural biomass: Physical and chemical properties of particle-phase emissions. Atmos. Environ. 2005, 39, 6747–6764. [Google Scholar] [CrossRef]
  31. Chow, J.C.; Yu, J.Z.; Watson, J.G.; Ho, S.S.H.; Bohannan, T.L.; Hays, M.D.; Fung, K.K. The application of thermal hods for determining chemical composition of carbonaceous aerosols: A review. J. Environ. Sci. Health A 2007, 42, 1521–1541. [Google Scholar] [CrossRef]
  32. World Health Organisation. Review of Evidence on Health Aspects of Air Pollution—REVIHAAP; WHO Regional Office for Europe: Copenhagen, Denmark, 2013; pp. 9–10. Available online: www.euro.who.int/__data/assets/pdf_file/0020/182432/e96762-final.pdf (accessed on 15 May 2019).
Figure 1. Biofuel types used in this project.
Atmosphere 10 00278 g001
Figure 2. Size distribution of the smoke particles for the flaming (F) and smouldering (S) phases produced by scanning mobility particle sizer (SMPS). Error bars represent standard deviation of at least six replicates.
Atmosphere 10 00278 g002
Figure 3. Fine particles with a diameter below 200 nm and coarse particulate matter with a diameter above 200 nm released from combustion processes. Error bars represent standard deviation of at least six replicates. Shaded areas represent the flaming phase of the combustion.
Atmosphere 10 00278 g003
Figure 4. A ratio of the number of particles with diameter larger than 200 nm to the total number of the particle produced in combustion processes. Shaded areas represent the flaming phase of the combustion.
Atmosphere 10 00278 g004
Table 1. Particle statistics information provided by SMPS for smoke particles of the flaming (F) and smouldering (S) phases. Values are averages of at least six replicates. Standard deviations for geometric mean diameter values are within the 10–20 nm range.
Fuel TypeEucalyptus LeavesEucalyptus BranchesGrass (Matt Rush)Palm LeavesBanksia FlowerXanthorrhoeaPine ConeCasuarinaTree-Fern
Burning PhaseFSFSFSFSFSFSFSFS1-Phase
Median(nm)282.778.852.685.1122.786.2143.993.5151.175.464.967.683.6122.2159.089.993.3
Mean(nm)287.396.762.198.7145.2102.7164.4110.8162.292.077.185.3113.1144.1183.6112.6110.9
Geo. Mean(nm)265.181.354.383.4127.888.3143.395.0139.377.267.969.394.3118.9160.992.099.4
Mode(nm)302.673.952.582.1114.483.0149.887.6159.473.961.168.668.6130.4133.476.185.3
Geo.Std. Dev.1.51.81.61.81.61.71.71.71.81.81.61.91.81.91.71.91.6
Table 2. Percentage of fine particle number in total smoke particles for each species.
Species%UF/Total
Eucalyptus leaves89.6
Eucalyptus branch93.4
Grass (mat rush)91.2
Palm leaves92.2
Banksia flower80.1
Xanthorrhoea91.7
Pine cone84.5
Casuarina90.1
Tree fern94.9

