Abstract
A novel geostationary satellite, the H8/AHI (Himawari-8/Advanced Himawari Imager), greatly improved the scan times per day covering East Asia, and the operational products have been stably provided for a period of time. Currently, atmospheric aerosol pollution is a major concern in China. H8/AHI aerosol products with a high temporal resolution are helpful for real-time monitoring of subtle aerosol variation. However, the H8/AHI aerosol optical thickness (AOT) product has been updated three times since its launch, and the evaluation of this dataset is currently rare. In order to validate its accuracy, this study compared the H8/AHI Level-3 (L3) hourly AOT products of all versions with measurements obtained from eleven sunphotometer sites located in eastern China from 2015 to 2018. Moderate Resolution Imaging Spectroradiometer (MODIS) Collection 6 AOT products from the same period were also used for inter-comparison. Although the H8/AHI AOT retrievals in version 010 show a moderate agreement with ground-based observations (correlation coefficient (R): 0.66–0.85), and the time series analysis shows that it can effectively monitor hourly variation, it suffers from an obvious underestimation of 0.3 compared to ground-based and MODIS observations. After the retrieval algorithm updated the predefined aerosol model, the overall underestimation of AHI AOTs was solved (version 010 slope: 0.43–0.62, version 030 slope: 0.75–1.02), and the AOTs in version 030 show a high agreement with observations from ten sites (R: 0.73–0.91). In addition, the surface reflectance dataset derived from the minimum reflectivity model in version 010 is inaccurate in parts of eastern China, for both “bright” and “dark” land surfaces, which leads to the overestimation of the AOT values under low aerosol loads at the Beijing and Xianghe sites. After the update of the surface dataset in version 030, this phenomenon was alleviated, resulting in no significant difference in scatterplots under different surface conditions. The AOTs of H8/AHI version 030 show a significant improvement compared to the previous two versions, but the spatial distribution of AHI is still different from MODIS AOT products due to the differences in sensors and algorithms. Therefore, although the evaluation in this study demonstrates the effectiveness of H8/AHI AOT products for aerosol monitoring at fine temporal resolutions, the performance of H8/AHI AOT products needs further study by considering more conditions.
1. Introduction
Atmospheric aerosols directly and indirectly affect the radiation budget balance of the Earth-atmosphere system through a variety of natural processes and anthropogenic processes [1,2] and also have a negative impact on public health [3]. Satellite remote sensing is a promising approach to ultimately learn about the long-term trends and spatial patterns of atmospheric aerosols. As the most widely used satellite aerosol sensor, the MODIS (Moderate Resolution Imaging Spectroradiometer) onboard Terra and Aqua satellites provide aerosol products twice per day with a nearly full global coverage [4,5], greatly helping the community improve the understanding of aerosol characteristics, with various associated applications [6,7,8]. However, the sparse observations of polar-orbit satellites make it difficult to cope with the needs of assessing particulate matter exposure in real-time [9,10,11].
Recently, several geostationary orbit satellites have become available in response to the higher temporal resolution for observing aerosol diurnal variation over a large spatial scale. The Himawari-8, developed by the Japan Meteorological Agency (JMA), is a new generation of geostationary meteorological satellites that has state-of-the-art optical sensors with great improvements over those previously available in the geostationary orbit [12,13]. The Advanced Himawari Imager (AHI) onboard the Himawari-8 is a 16-channel multispectral imager’ the first six bands (0.47μm–2.2μm) from visible to shortwave IR can be used to observe the radiance of atmospheric aerosols and Earth’s surface at 10-minute intervals in East Asia during the daytime [14]. Firstly, the JMA derived an aerosol optical thickness (AOT) dataset from the Himawari-8/Advanced Himawari Imager (H8/AHI) to monitor dust events in East Asia [15]. Thereafter, She et al. [16] developed a simple dust detection and intensity estimation method using the observations from the H8/AHI. Yan et al. [17] developed a minimum albedo aerosol retrieval method based on the H8/AHI. Zhang et al. [18] retrieved an AOT dataset over East Asia from the H8/AHI using six typical aerosol models and improved channel relationships. Yang et al. [19] retrieved a new H8/AHI AOT dataset over mainland China using a traditional dark target algorithm. Later, the Japan Aerospace Exploration Agency (JAXA) released their H8/AHI aerosol products via the JAXA Himawari Monitor website, including a Level-2 (L2) dataset of 10-minute interval and hourly Level-3 (L3) products with two sub-datasets (AOTpure and AOTmerged) and three versions (010, 020, 030) [20].
Eastern China is suffering serve aerosol pollution with heavy loading and diverse sources [21,22], and the high spatial–temporal resolution of H8/AHI could provide great help. Given the use of approximations and assumptions of the surface reflectance and the aerosol model in satellite aerosol retrievals, ground validations are needed to examine the uncertainties of aerosol products desired for applications [23,24,25,26] However, there are few assessment papers about this novel geostationary satellite at present. A preliminary evaluation of the JAXA H8/AHI AOD (Aerosol Optical Depth) products over eastern China has been conducted using the AERONET (Aerosol Robotic Network) [27] observations by Wang et al. [28] and Zang et al. [29] for estimating hourly particulate matter concentrations, but the ground-based sites they used for long-term observations are very limited, and no one has compared the differences between the three versions. Therefore, a comprehensive assessment of the different versions of JAXA H8/AHI AOT products in eastern China is needed.
In this study, we provide an evaluation of the AOD products of three JAXA H8/AHI versions over eastern China based on eleven long-term ground sunphotometer sites and Terra/Aqua-MODIS 3 km AOD products. The remainder of this paper is organized as follows: Section 2 describes the data and methods. Spatial–temporal comparisons and the inter-comparison of different versions are discussed in Section 3. The key findings are summarized in Section 4.
2. Data and Methods
2.1. JAXA Himawari-8-AHI Aerosol Dataset
The H8/AHI AOT products are developed by the Earth Observation Research Centre of JAXA. Firstly, L2 AOToriginal products are retrieved from the H8/AHI’s multispectral measurements at 10-minute intervals, based on a minimum reflectance technique, normalized difference vegetation index, and assumed aerosol model [30,31]. Cloud-free pixels are identified using the Cloud and Aerosol Unbiased Decision Intellectual Algorithm (CLAUDIA) developed by Ishida and Nakajima [32] and Ishida et al. [33]. More details of the retrieval flow are documented in the article of Daisaku [15]. Then, an hourly spatial–temporal combined algorithm is applied to the L2 dataset (referred to as AOToriginal) to produce a more accurate L3 dataset with 5km resolution, named AOTpure, with rigorous cloud screening. In order to solve the problem of null values, another sub-dataset, AOTmerged, is created by interpolating AOTpure with the same algorithm for AOTpure processed in the L3 product.
As the versions of the L3 products are updated from 010 to 030, the combined algorithms of L3 products (using spatial–temporal variability characteristics of the L2 original retrievals surrounding 12.5 km and past 1 hour to eliminate cloud-contaminated pixels and derive a highly accurate L3 AOT dataset [34]) are invariable. The basic methods for AOT retrieval, such as the cloud processing and the optimal estimation step, are also consistent (which only fixed minor bugs, added a quality flag, and improved the iteration of optical estimation). However, the aerosol model and surface reflectance preset-dataset, as the input for the AOT retrieval method, was updated based on historical data and new research [31]. Therefore, in the follow-up discussion, we only focused on the differences caused by the aerosol model and surface reflectance. More details of the retrieval flow are documented in Daisaku et al. [15] and its official document [20].
In this study, H8/AHI L3 AOT products (versions 010, 020, 030, from 8:00 to 17:00 China Standard Time (CST) daily, UTC+8 in China) downloaded from the JAXA Himawari Monitor website were validated. The coverage periods for different versions are shown in Figure 1. In order to fully evaluate the L3 products, we set three different study periods. The first, from September 2015 to August 2017, covered the complete season cycle for two years and can be used to accurately validate version 010 AOT retrievals of different types (AOTmerged and AOTpure) by eliminating accidental errors. The second period was from June to August 2018, which was covered by three versions at the same time; this was used to compare the differences between the three versions (010, 020, 030). The last period, from August to December 2018, was only used for version 030. In addition, the quality of H8/AHI AOT data was classified using four confidence levels, i.e., “very good”, “good”, “marginal”, “no confidence”. Only the AOT data at 500nm with the highest confidence level (“very good”) were used.
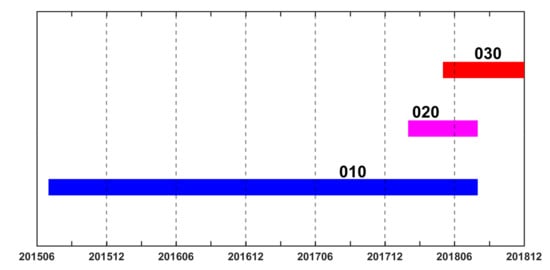
Figure 1.
The coverage periods for the three versions validated here. The blue line stands for version 010 since the launch of Himawari-8/Advanced Himawari Imager (H8/AHI). Versions 020 and 030 (violet and red lines) were subsequently released in 2018.
2.2. MODIS C6 Data
The AOT products of MODIS, the most widely used satellite aerosol sensor, have very high precision at a global scale [23,24,25]. The MODIS C6 3 km AOT data (Optical Depth Land and Ocean) for Terra and Aqua were also obtained for the matched time period, and only high quality (Quality Flag = 3) AOT retrievals were considered.
2.3. Ground Sunphotometer Measurements
The Cimel sunphotometer is a multichannel, automatic, sun-and-sky scanning radiometer that measures and retrieves aerosol optical properties with a high AOT accuracy around 0.01–0.02 [35,36]. As shown in Figure 2, eleven permanent sunphotometer sites evenly distributed across eastern China were used here, including four Aerosol Robotic Network (AERONET) sites (Beijing, Xianghe, Xuzhou, and Taihu), one site (Wuhan) operated by Wuhan University [37], which is a member of CARSNET (China Meteorological Administration Aerosol Remote Sensing Network) [38], and six Sun-Sky Radiometer Observation Network (SONET) sites [39,40] (Yanqihu, Jiaozuo, Songshan, Hefei, Nanjing, and Shanghai). There are three levels of AERONET data (http://aeronet.gsfc.nasa.gov). In order to further guarantee the quality of AERONET AOTs, we adopt the new V3 Level 1.5 dataset, which is consolidated by improving the input criteria from that of the V2. At the Wuhan and SONET sites, Level 1.5 AOT data derived following the method of Smirnov et al. [40,41] were used. The details of all sites can be found in Table 1.
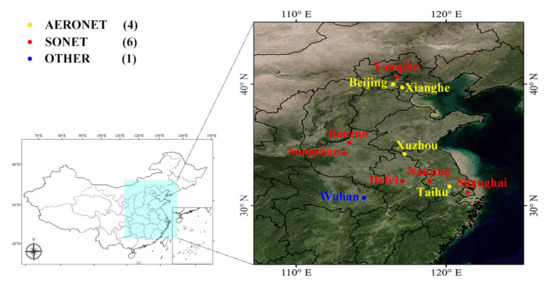
Figure 2.
Study area and locations of sites. The cyan-blue rectangle in the left panel represents the eastern China region and the colored dots in the right panel show the locations of eleven ground sunphotometer sites.

Table 1.
Information about the eleven ground sunphotometer sites.
2.4. Data Integration
The most important issue for comparisons between different datasets is the matchup strategy of spatial and temporal scales. For ground-based sites, the measurements taken within ±30 minutes of satellite sensor scan time were used. For satellite data, the pixels of a large window surrounding each site was averaged to eliminate spatial heterogeneity. Considering the merged strategy of AHI L3 products [34] (merging the values of observations surrounding 12.5km and past 1 hour in the L2 dataset), in this paper, a window of 3 × 3 pixels (15 × 15 km2) with the ground-based site in the center pixel was chosen. Then, the spatial average of AOTs in this window was compared to the temporal mean of ground-based observations within the past 1 hour of satellite scanning. As auxiliary data, the MODIS 3 km AOT products of two satellites, Terra and Aqua (overpass at about 10:30/13:30 CST), which used the same spatial–temporal strategy as H8/AHI, was used for inter-comparison. In order to account for the potential error in the satellite and ground-based datasets, an additional constraint condition of at least 30% effective satellite retrievals within the window and at least two ground-based observations within an hour (possibly four or five AERONET observations in the past 1 hour) were considered [4,36].
For spatial distribution comparisons of different AOT products, considering the reliability, a bottom-up strategy was adopted: the monthly mean per image consists of at least two daily satellite AOT observations, the seasonal mean consists of at least two monthly observations, and the annual average per pixel must include four seasonal observations. When comparing MODIS AOT products with one corresponding image from H8/AHI at the closest moment, there would be an inevitable time difference of about 30 minutes, so we used the AHI AOT mean of two closest moments (for example, for a MODIS/Aqua overpass at about 13:30 CST, the AHI images of 13:00 and 14:00 are used).
2.5. Evaluation Metrics
In this study, several metrics were used to validate the satellite aerosol products with ground-based observations: (i) the correlation coefficient (R), refers to the relationship between the AHI aerosol retrievals and the ground-based measurements; (ii) percentage (%) refers to the percentage of AHI AOT retrievals falling within the expected error (EE) (), which are two linear envelope lines below and above the 1:1 line on the scatterplot, embracing most matchup points. The standard is proposed by MODIS assessment team and widely used [4]. It was applied in this study to assess whether the AHI retrievals achieve the same accuracy as the ground measurements and MODIS AOT; (iii) mean difference () describes the mean bias between two datasets; (iv) root mean square error () refers to the satellite products’ absolute deviation from ground-based AOTs. The bigger the first and second metrics, the closer the AHI is to the ground-based data; the smaller the third and fourth ones, the smaller the gap between satellite retrievals and the ground-based data.
3. Results and Discussion
3.1. Evaluation of the H8/AHI Version 010 Dataset
As the L3 versions of AHI AOT products are updated from 010 to 030, the retrieval method and combined strategies are invariable. Version 010 contains data covering the longest time, which can be used to verify the overall H8/AHI L3 aerosol quality across the board. AOTpure is directly merged from L2 original data, so we use this dataset for a numerical analysis. (In fact, we compared AOTpure and AOTmerged with ground-based measurements, and the results were basically the same).
3.1.1. Comparison between H8/AHI Version 010 and Ground Sites
Figure 3 shows a comparison between the AOTpure of version 010 and the ground match-ups from five sites (Beijing, Xianghe, Xuzhou, Taihu, and Wuhan). At all five sites, obvious underestimations (slopes range from 0.43 to 0.62) and high uncertainty (RMSE > 0.3) are observed. The largest R of 0.85 and the smallest intercept of −0.03 appear at the Xuzhou site, while the Beijing site has the smallest R of 0.66 and the largest intercept of 0.22. However, some overestimations at low aerosol loading (τ < 0.15) are found at the Beijing and Xianghe sites, and the smaller the AOT, the greater the deviation. This phenomenon does not seem to exist at other sites, where most of the AOTs are larger than 0.3.
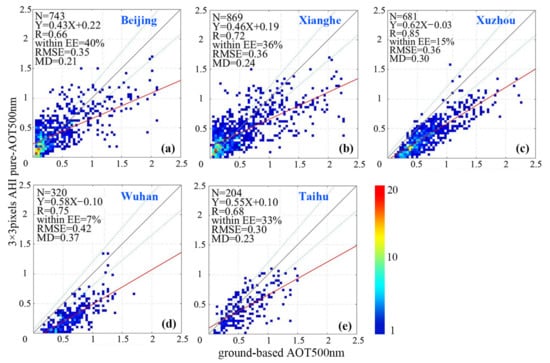
Figure 3.
Scatterplots of the H8/AHI version 010 dataset of aerosol optical thickness (AOT)pure against ground-based measurements at 500nm during 8:00–17:00 CST from September 2015 to August 2017. There are five sites: (a) Beijing, (b) Xianghe, (c) Xuzhou, (d) Wuhan, and (e) Taihu. The color bar indicates the number of data points, the solid red line is a linear regression, the gray solid line is the 1:1 line, and the dashed blue lines symmetrical to the grey line are the expected error (EE) envelopes. The means in text representation in the figure have been described in the evaluation metrics section.
3.1.2. Inter-Comparison between H8/AHI and MODIS
To further evaluate the dataset of version 010, MODIS 3 km AOT products were introduced for inter-comparison. The collocations of AHI and ground-based measurements were selected for the corresponding times (values at 10:00 and 11:00 for Terra’s overpass time, and at 13:00 and 14:00 for Aqua’s overpass time). As shown in Figure 4, MODIS performs better than H8/AHI; it has a smaller RMSE, a higher correlation coefficient (over 0.9), and more data fall into the error envelope. The Xuzhou site has a relatively better performance, and the Xianghe site has a greater correlation coefficient than the Beijing site (0.72 versus 0.66), although they are geographically adjacent. In the case of low aerosol loading (τ < 0.15), both the retrievals of AHI and MODIS are overestimated at the Beijing site, but MODIS returned to a normal level and had a very high correlation coefficient of 0.98 at the Xianghe site.
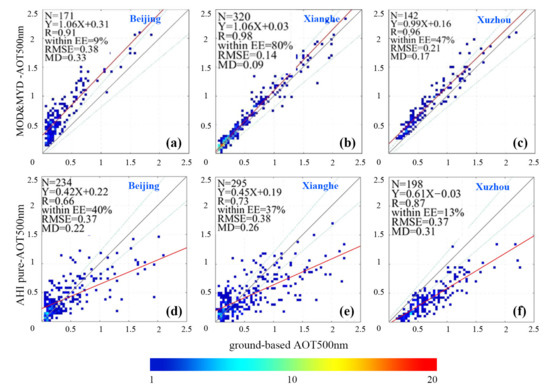
Figure 4.
Scatterplots of the AOTs from different satellites against ground-based measurement at 500nm. The top row represents MODIS 3 km AOT products and the bottom row is the 5 km AOTpure of version 010 with the same spatial range at Beijing, Xianghe, and Xuzhou. The means in the figure represent the same elements as in Figure 3.
3.1.3. AOT Deviation Dependent on the Aerosol Concentration
Figure 5 shows the magnitude of the underestimation of H8/AHI version 010 and the number distribution under different AOTs from ground-based sites. The period of one year, from September 2015 to August 2016, and covering five sites was chosen in order to avoid seasonal biases. An obvious decreasing trend of the mean deviation with an increase in the ground AOT can be seen in all five sites. Most absolute values for the deviations are below 0.3 when the ground-based AOT < 1.2, but the values increase rapidly to 1.0 when the ground-based AOT >1.2. At low AOTs (τ < 0.15), a slightly positive bias can be found.
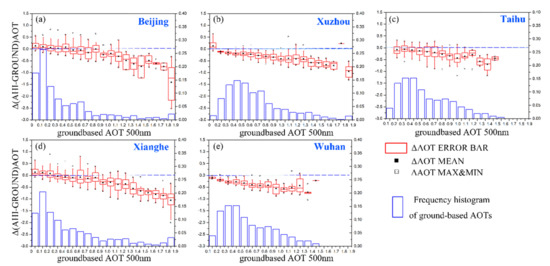
Figure 5.
The difference between H8/AHI L3 AOTpure and ground-based AOTs from September 2015 to August 2016. (a) Beijing; (b) Xuzhou; (c) Taihu; (d) Xianghe; (e) Wuhan. The difference is estimated by the best linear fit to 1 standard deviation of the biases (top–bottom intervals of the red vertical rectangle), median (short middle line in the vertical red rectangles), the means of the D-value in each frequency interval (black square points), max & min observations (grey square points) of the left-hand axis and labels. The bottom blue columns represent the sampling frequency by 0.1 increments (horizontal axis) of the right-hand axis and labels.
3.1.4. Temporal Variation Evaluation
Most studies of the polar orbiting satellites have analyzed the daily and monthly AOT variation. In order to verify the capability of the geostationary satellite H8/AHI, this section analyzes the dataset at a finer scale (hourly). Days with more data were chosen for reliable comparisons, which can also be considered as screening out the data of sunny days. One day with more than seven retrievals (theoretically, the maximum is 10) in the AHI AOTpure dataset at the Beijing and Xuzhou sites and more than four retrievals at the Taihu site (loose constraint was needed under the actual weather conditions) was treated as a cloud-free day. The corresponding data from MODIS and the ground sunphotometers were selected for the same date from 2015 to 2017. As shown in Figure 6, it is easy to see that the variation in the AHI AOTpure dataset is consistent with the ground-based observations. The best result is in Beijing, and the mean differences range from −0.11 to 0.21 during most days. By contrast, the corresponding MODIS AOTs show an obvious overestimation. In Xuzhou, negative deviations ranging from −0.39 to −0.12 are exhibited, against a small difference between MODIS and ground-based datasets. In addition, there is not even one value at the Taihu site in two years of MODIS AOT products because of its strict quality control and short overpass time. In contrast, H8/AHI exhibits a great advantage in capturing the subtle dynamic variations in aerosols, with a slight underestimation.
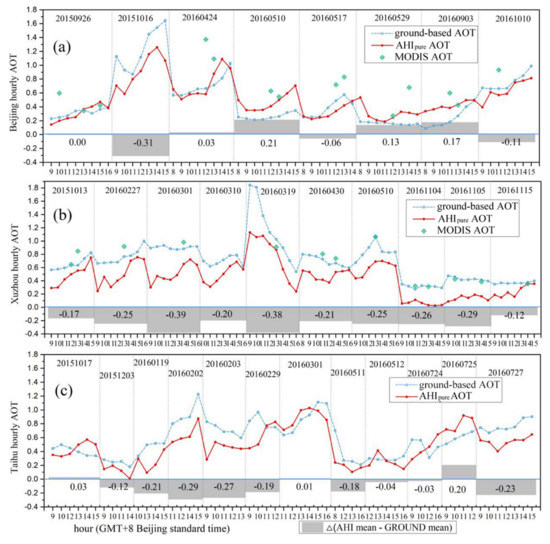
Figure 6.
Differences between retrievals of H8/AHI version 010 and the ground-based measurements. (a) Beijing; (b) Xuzhou; (c) Taihu. The solid red line represents the daily mean of at least 7 AHI retrievals in one day (4 in panel c due to limited data), and the dashed blue line represents the ground match-up AOTs. The green points are the Moderate Resolution Imaging Spectroradiometer (MODIS) match-ups. The gray shaded columns and the number shown are the difference between the two datasets.
3.1.5. Spatial Distribution Evaluation
This section compares the annual spatial distribution of AHI and MODIS AOT products. Because the angstrom exponent used to convert the AOT from 550 nm to 500 nm (the same as the H8/AHI) was not available in the MODIS 3 km dataset, we only conducted a qualitative comparison. AOTmerged interpolated from AOTpure to achieve fewer missing spatial observations was also compared. Figure 7 shows the spatial distributions of 2016 annual AOT means for the two datasets in H8/AHI and the MODIS AOT products (Terra) at 10:30 CST. It can be seen that the spatial variation of the two H8/AHI datasets is generally consistent, but AOTmerged tends to be lower than MODIS in areas with heavy aerosol loading. H8/AHI provides more retrievals in the northwest of the study area, whereas MODIS has fewer missing value pixels in Fujian province. Compared to AOTmerged in Figure 8c, the image of AOTpure in Figure 8b has more missing value pixels.
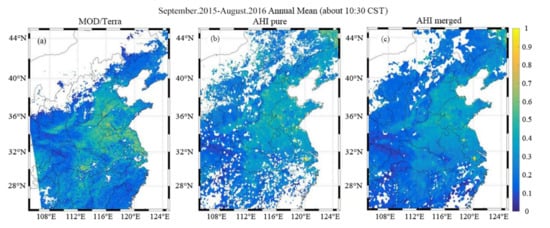
Figure 7.
The AOT annual mean spatial distribution of three datasets at about 10:30 a.m. China Standard Time (CST). (a) MOD04 3 km AOT dataset at about 10:30 a.m. CST; (b) H8/AHI AOTpure 5 km dataset; (c) H8/AHI AOTmerged 5 km dataset.
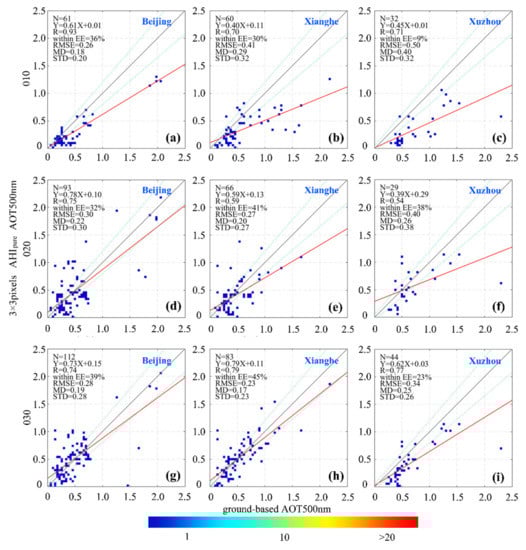
Figure 8.
Scatterplots of the AOTs from three versions of H8/AHI product against ground-based measurements. The three columns from left to right represent different sites and the rows from top to bottom represent version 010, 020, and 030.
3.1.6. Discussion of AHI Version 010
It is difficult to retrieve aerosol data from satellites due to the problem of effective separation of the underlying surface reflection and aerosol particle back-scattering signals. The assumptions of surface reflection and aerosol properties would affect the value of AOT retrieval [17,30].
The overall underestimation of AHI AOTs against ground-based observations at all sites in Figure 3 and the spatial distribution of AOT from AHI version 010 compared to MODIS AOT in Figure 7 indicate that the assumption of aerosol properties is not completely applicable to eastern China. This aerosol inappropriateness (inadequate aerosol type) seems to result in a systematic negative bias related to the actual aerosol loading, regardless of surface reflectance and time factors (Figure 5). On the other hand, Figure 6 shows that, compared to ground-based observations, the H8/AHI has the ability to effectively capture the hourly variations in aerosols, which also supports this conclusion. H8/AHI JAXA AOT products use the second minimum reflectance method to assume the actual surface and construct the surface reflectance dataset at every hour by considering the bidirectional reflectance distribution function. This assumption makes surface accuracy more dependent on prior knowledge and has little to do with the variation in angle (time) [1,42,43]. As a fixed-time sample drawn from of total collocations, the scatterplots (bottom row) in Figure 4 are similar to Figure 3, which supports this conclusion (we also analyzed the correlation coefficients every hour, but there was no significant difference). For AOTs from MODIS, the performance (top row, Figure 4) at the Beijing site is worse than the Xianghe site, which because the underlying surfaces of the Beijing (urban, bright surface) and Xianghe (woodland, dark surface) sites are significantly different in the DT (Dark Target, improved Dark Dense Vegetation) algorithm used in the MODIS C6 AOT product. Levy et al. concluded that surface assumptions tend to dominate AOT retrieval when there is low aerosol loading (τ < 0.15) [4]. Thus, the overestimation of satellite AOTs under low aerosol loadings means that the surface albedo of the Beijing site for the MODIS algorithm is not completely correct. However, the scatterplot of AHI AOT products is similar at the Beijing and Xianghe sites under low aerosol loadings, which could also be attributed to the inappropriate assumptions of surface albedo for AHI at the two sites. Considering that the two sites are geographically adjacent (Figure 2), one interpretation is that the surface dataset pre-defined by the second minimum reflectance method for version 010 may not be good in some regions, no matter how “bright” or “dark” a surface.
In addition, only three sites are present in Figure 4. This is because the products of MODIS did not provide sufficient retrievals for the remaining two sites of Wuhan and Taihu in the two years investigated. In contrast, AHI has a lot of data in the same hour. Figure 8 also shows the different spatial ranges between the two sensors. This is due to different assumptions about the surface reflectance, different cloud processing [44,45,46] and different quality control [4] for the two aerosol products. Therefore, the AOT products of AHI can help fill the gaps in existing satellite data, although the assumptions of parameters need to be upgraded.
3.2. Comparison between Three Versions
According to the official documentation of the H8/AHI, the aerosol model and surface reflectance are the main changes between the original L2 retrievals and the three L3 versions (010, 020, 030). Therefore, for data consistency, it is necessary to evaluate the differences between the three versions. As indicated in Figure 1, only a common period of three months can be used to compare the three versions, so we simply compared the AHI AOTs of the three versions to the ground-based observations at the Beijing, Xianghe, and Xuzhou sites (Figure 8). It can be seen that the total underestimation of AOTs was alleviated and more collocations fall into the error envelop from version 010 to 020. However, version 020 has a lower correlation coefficient than version 010. It seems that 020 is a transitional version. The scatterplot of version 030 is similar to that of version 020, but with a better correlation and a smaller deviation. The results indicate that the underestimation of AOTs in version 010 has been greatly improved in version 030 (slope of the fitting line: from 0.61 to 0.73 at the Beijing site, from 0.40 to 0.79 at Xianghe, and from 0.45 to 0.62 at Xuzhou). This can be attributed to the updating of the aerosol model. However, limited by insufficient ground-based data in the common timeframe, we cannot estimate the effect of surface reflectance, which is updated from version 010 to 030, on AOT. In future, more ground-based sites should be introduced to analyze the AHI AOT products of version 030 separately.
Figure 9 shows a spatial comparison of the seasonal mean images of three versions in the common time period. The blank areas in three images are generally consistent, but the missing pixels have been reduced in version 030, which indicates that the effective pixels of the updated surface reflectance dataset have increased. The small numerical differences in the spatial distribution of the three versions are related to the changes in the aerosol models. However, in some high-value areas of version 010 and 020 images, there are significant differences in the numerical magnitude for version 030. This seems to be due to significant changes in the surface dataset after the algorithm update.
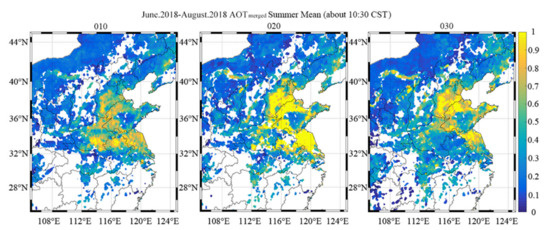
Figure 9.
The AOTmerged 5km summer mean spatial distribution of three versions at about 10:30 a.m. CST. (a) version 010; (b) version 020; (c) version 030.
3.3. Evaluation of the H8/AHI Version 030 Dataset
The observations from four AERONET sites and six SONET sites during the period of August 2018 to December 2018 are introduced to evaluate the overall performance and verify the impact of surface reflectance for the H8/AHI version 030 AOT products.
3.3.1. Comparison between H8/AHI Version 030 and Ground Sites
Figure 10 and Figure 11 show that the AOTs of AHI version 030 have a high correlation coefficient (R: 0.73–0.91) and low uncertainty (RMSE: 0.13–0.27) compared with ground-based observations from ten sites in eastern China. With a large percentage (37%–60%) of collocations falling within the EE and the slope reaching more than 0.75, the performance of version 030 has been greatly improved. However, as shown in Figure 12, although the spatial distribution of the seasonal mean from September to November 2018 is consistent with MODIS in magnitude, there are still some differences.
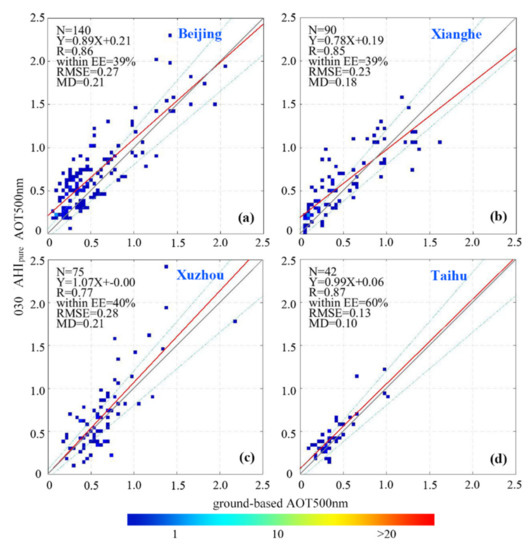
Figure 10.
Scatterplots of the AOTs from H8/AHI version 030 products against ground-based measurements from four AERONET sites.
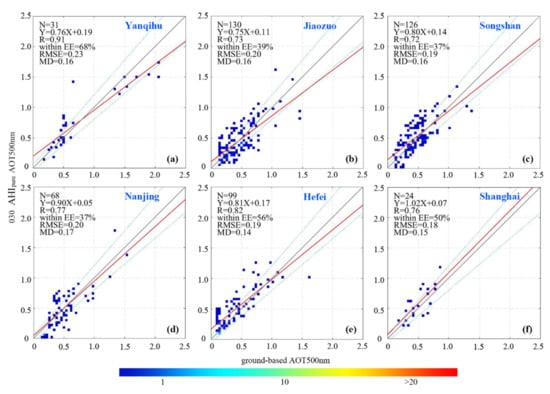
Figure 11.
Scatterplots of the AOTs from H8/AHI version 030 products against ground-based measurements from six Sun-Sky Radiometer Observation Network (SONET) sites.
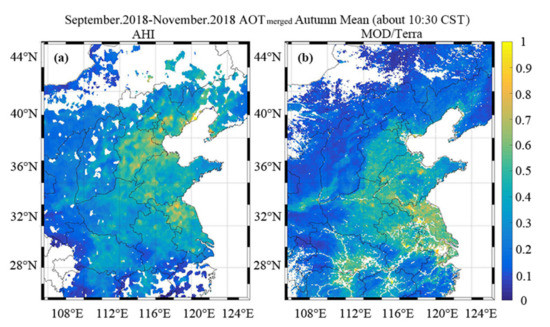
Figure 12.
The AOTmerged 5km summer mean spatial distribution of three versions at about 10:30 CST. (a) version 030; (b) MODIS/Terra.
3.3.2. Discussion of AHI Version 030
Compared with the scatterplot in Figure 3, the results from the same four AERONET sites (Figure 11) and the other six SONET sites (Figure 12) show a significant improvement in both the slope and the bias. This indicates that the update of the aerosol model has effectively solved the total underestimation problem. We then counted the collocations under low aerosol loading (τ < 0.15) at all ten sites; the average difference is 0.18 (MD, and RMSE = 0.23) of the 126 points. This result shows that an overestimation under low aerosol loading still seems to exist, but the magnitude is not large. In addition, the types of underlying surfaces at the ten sites are different (Table 1), but the scatterplots show overall consistency, which indicates that the updated surface reflectance dataset (improved second minimum reflectance method and more historical data) for version 030 is widely applicable to aerosol retrieval in eastern China. However, due to the differences in satellite sensor, aerosol retrieval algorithm, and cloud processing, the seasonal spatial distribution of AHI is still different from MODIS (Figure 12), and further research is needed.
4. Conclusions
In this study, we compared the H8/AHI L3 hourly AOT products with ground-based measurements and MODIS products on spatial and temporal scale over eastern China. Based on the official documentation, we found that the largest changes in the three versions (010, 020, 030) are the predefined aerosol model and the surface reflectance datasets, which may be seen in the historical dataset of AHI during past three years and in new research results [31,42,43]. However, the algorithm itself has not changed much, which provides a basis for our research. The comparison results at five sites indicate that the AOTs in version 010 of the H8/AHI L3 product has a moderate agreement with ground-based observations (R: 0.66–0.85) but an overall underestimation of about 0.3 (RMSE) (Figure 3 and Figure 4). This underestimation has a negative linear correlation with aerosol concentration (Figure 5). The AOTs in version 030 show a better performance than previous versions, with a high correlation coefficient (R: 0.73–0.91), low uncertainty (RMSE: 0.13–0.27), and good consistency (slope: 0.75–1.02, within EE: 37%–60%) (Figure 8, Figure 10, and Figure 11).
The aerosol model for the AHI AOT retrieval algorithm affects the magnitude of retrieved AOT, but it does not change the numerical variation trend of aerosol loading, the inappropriate aerosol model for eastern China leads to a general underestimation in the 010 version (Figure 5 and Figure 6). This has been solved in version 030 (Figure 10 and Figure 11) by the update of the aerosol model. The second minimum reflectance model used for AHI needs the accumulation of historical data under suitable atmospheric conditions, which does not depend entirely on the relationship between spectral band, like the AOT algorithm of MODIS. Therefore, the assumptions should have universal applicability to different underlying surfaces. The surface dataset in version 010 is not suitable for some areas of eastern China, which can be seen in the comparison between the Beijing and Xianghe sites (Figure 4). But in version 030, the performances at 10 sites with different underlying surfaces are basically similar (Figure 10 and Figure 11). This indicates that the surface reflectance datasets in version 030 can effectively assume different surfaces for eastern China.
In conclusion, the AOT products of H8/AHI can capture the fine hourly variations in aerosol loading (Figure 6) and provide effective retrievals after the update. However, compared to MODIS, the spatial distribution of AHI is still different due to the differences in the satellite sensor, aerosol retrieval algorithm, and cloud processing (Figure 7 and Figure 12). In addition, long-term aerosol monitoring also needs to take into account the spatial differences between the three versions (Figure 9). Future evaluations need to consider more conditions after accumulating more data.
Author Contributions
Data curation, Q.H. and Y.L.; Investigation and simulations, D.L.; Methodology, K.Q. and L.W.; Formal analysis, D.L. and K.Q.; Writing—original draft preparation, D.L. and K.Q.; Writing—review and editing, J.X., K.Q., L.H. and B.Z.; Supervision, L.W.
Funding
This study was supported by Xuzhou Key R&D Programs (Social Development (KC18225).
Acknowledgments
We are grateful to Wuhan University and Aerospace Information Research Institute (AIR) of Chinese Academy of Sciences (CAS) for providing the ground-based Sunphotometer measurements. We would also like to acknowledge Japan Aerospace Exploration Agency for providing the datasets (available from: ftp://ftp.ptree.jaxa.jp) and NASA for providing MODIS AOD datasets (available from: https://ladsweb.modaps.eosdis.nasa.gov).
Conflicts of Interest
The authors declare no conflicts of interest.
References
- Kaufman, Y.J.; Tanré, D.; Boucher, O. A satellite view of aerosols in the climate system. Nature 2002, 419, 215. [Google Scholar] [CrossRef]
- Li, Z.Q.; Guo, J.P.; Ding, A.J.; Liao, H.; Liu, J.J.; Sun, Y.L.; Wang, T.J.; Xue, H.W.; Zhang, H.S.; Zhu, B. Aerosol and boundary-layer interactions and impact on air quality. Natl. Sci. Rev. 2017, 4, 810–833. [Google Scholar] [CrossRef]
- Gu, Y.; Wong, T.W.; Law, C.K.; Dong, G.H.; Ho, K.F.; Yang, Y.; Yim, S.H.L. Impacts of Sectoral Emissions in China and the Implications: Air Quality, Public Health, Crop Production, and Economic Costs. Environ. Res. Lett. 2018, 13, 084008. [Google Scholar] [CrossRef]
- Levy, R.C.; Remer, L.A.; Kleidman, R.G.; Mattoo, S.; Ichoku, C.; Kahn, R.; Eck, T.F. Global evaluation of the Collection 5 MODIS dark-target aerosol products over land. Atmos. Chem. Phys. 2010, 10, 10399–10420. [Google Scholar]
- Yang, L.K.; Xue, Y.; Guang, J.; Kazemian, H.; Zhang, J.H.; Li, C. Improved Aerosol Optical Depth and Ångstrom Exponent Retrieval Over Land from MODIS Based on the Non-Lambertian Forward Model. IEEE Geosci. Remote Sens. Lett. 2014, 11, 1629–1633. [Google Scholar] [CrossRef]
- Guo, J.; Xia, F.; Zhang, Y.; Liu, H.; Li, J.; Lou, M.; He, J.; Yan, Y.; Wang, F.; Min, M.; et al. Impact of diurnal variability and meteorological factors on the PM2.5-AOD relationship: Implications for PM2.5 remote sensing. Environ. Pollut. 2017, 221, 94. [Google Scholar] [CrossRef] [PubMed]
- Qin, K.; Zou, J.; Guo, J.; Lu, M.; Bilal, M.; Zhang, K.F.; Ma, F.F.; Zhang, Y.S. Estimating PM1 concentrations from MODIS over Yangtze River Delta of China during 2014–2017. Atmos. Environ. 2018, 195, 149–158. [Google Scholar] [CrossRef]
- He, Q.S.; Li, C.C.; Tang, X.; Geng, F.H.; Wu, Y.L. Validation of MODIS derived aerosol optical depth over the Yangtze River Delta in China. Remote Sens. Environ. 2010, 114, 1649–1661. [Google Scholar] [CrossRef]
- Guo, J.P.; Zhang, X.Y.; Che, H.Z.; Song, S.L.; An, X.Q.; Cao, C.X.; Guang, J.; Zhang, H.; Wang, Y.Q.; Zhang, X.C.; et al. Correlation between PM concentrations and aerosol optical depth in eastern China. Atmos. Environ. 2009, 43, 5876–5886. [Google Scholar] [CrossRef]
- Fang, X.; Zou, B.; Liu, X.P.; Sternberg, T.; Zhai, L. Satellite-based ground PM2.5 estimation using timely structure adaptive modeling. Remote Sens. Environ. 2016, 186, 152–163. [Google Scholar] [CrossRef]
- Zang, Z.L.; Wang, W.Q.; You, W.; Ye, F.; Wang, C.M. Estimating ground-level PM2.5 concentrations in Beijing, China using aerosol optical depth and parameters of the temperature inversion layer. Sci. Total Environ. 2017, 575, 1219–1227. [Google Scholar] [CrossRef]
- Bessho, K.; Date, K.; Hayashi, M.; Ikeda, A.; Imai, T.; Inoue, H.; Kumagai, Y.; Miyakawa, T.; Murata, H.; Ohno, T.; et al. An introduction to Himawari-8/9—Japan’s new-generation geostationary meteorological satellites. J. Meteorol. Soc. Jpn. 2016, 94, 151–183. [Google Scholar] [CrossRef]
- Okuyama, A.; Andou, A.; Date, K.; Hoasaka, K.; Mori, N.; Murata, H.; Tabata, T.; Takahashi, M.; Yoshino, R.; Bessho, K. Preliminary validation of Himawari-8/AHI navigation and calibration, Proc. SPIE 9607. In Earth Observing Systems XX; International Society for Optics and Photonics: Bellingham, WA, USA, 2015. [Google Scholar]
- Irie, H.; Horio, T.; Damiani, A.; Nakajima, T.Y.; Takenaka, H.; Kikuchi, M.; Khatri, P.; Yumimoto, K. Importance of Himawari-8 Aerosol Products for Energy Management System. Earozoru Kenkyu 2017, 32, 95–100. [Google Scholar]
- Daisaku, U. Aerosol Optical Depth product derived from Himawari-8 data for Asian dust monitoring. Meteorol. Satell. Cent. Tech. Note 2016, 16, 56–63. [Google Scholar]
- She, L.; Xue, Y.; Yang, X.; Guang, J.; Li, Y.; Che, Y.; Fan, C.; Xie, Y. Dust Detection and Intensity Estimation Using Himawari-8/AHI Observation. Remote Sens. 2018, 10, 490. [Google Scholar] [CrossRef]
- Yan, X.; Li, Z.Q.; Luo, N.N.; Shi, W.Z.; Zhao, W.J.; Yang, X.C.; Jin, J.N. A minimum albedo aerosol retrieval method for the new-generation geostationary meteorological satellite Himawari-8. Atmos. Res. 2018, 207, 14–27. [Google Scholar] [CrossRef]
- Zhang, M.; Ma, Y.Y.; Gong, W.; Liu, B.M.; Shi, Y.F.; Chen, Z.Y. Aerosol optical properties and radiative effects: Assessment of urban aerosols in central China using 10-year observations. Atmos. Environ. 2018, 182, 275–285. [Google Scholar] [CrossRef]
- Yang, F.; Wang, Y.; Tao, J.; Wang, Z.; Fan, M.; De Leeuw, G.; Chen, L. Preliminary Investigation of a New AHI Aerosol Optical Depth (AOD) Retrieval Algorithm and Evaluation with Multiple Source AOD Measurements in China. Remote Sens. 2018, 10, 748. [Google Scholar] [CrossRef]
- JAXA Earth Observation Research Center (EORC). JAXA Himawari Monitor Aerosol Products. Available online: https://www.eorc.jaxa.jp/ptree/documents/Himawari_Monitor_Aerosol_Product_v6.pdf (accessed on 17 April 2019).
- Qin, K.; Wang, L.; Wu, L.; Xu, J.; Rao, L.; Letu, H.; Shi, T.W.; Wang, R.F. A campaign for investigating aerosol optical properties during winter hazes over Shijiazhuang, China. Atmos. Res. 2017, 198, 113–122. [Google Scholar] [CrossRef]
- Qin, K.; Wang, L.; Xu, J.; Letu, H.; Zhang, K.; Li, D.; Zou, J.; Fan, W. Haze Optical Properties from Long-Term Ground-Based Remote Sensing over Beijing and Xuzhou, China. Remote Sens. 2018, 10, 518. [Google Scholar] [CrossRef]
- Sayer, A.M.; Hsu, N.C.; Bettenhausen, C.; Jeong, M.J. Validation and uncertainty estimates for MODIS Collection 6 “Deep Blue” aerosol data. J. Geophys. Res. Atmos. 2013, 118, 7864–7872. [Google Scholar] [CrossRef]
- Wong, M.S.; Shahzad, M.I.; Nichol, J.E.; Lee, K.H.; Chan, P.W. Validation of MODIS, MISR, OMI, and CALIPSO aerosol optical thickness using ground-based sunphotometers in Hong Kong. Int. J. Remote Sens. 2013, 34, 897–918. [Google Scholar] [CrossRef]
- Tao, M.H.; Chen, L.F.; Wang, Z.F.; Tao, J.H.; Che, H.Z.; Wang, X.H.; Wang, Y. Comparison and evaluation of the MODIS Collection 6 aerosol data in China. J. Geophys. Res. Atmos. 2015, 120, 6992–7005. [Google Scholar] [CrossRef]
- Bilal, M.; Nichol, J.E.; Nazeer, M. Validation of Aqua-MODIS C051 and C006 operational aerosol products using AERONET measurements over Pakistan. IEEE J. Sel. Top. Appl. Earth Obs. Remote Sens. 2016, 9, 2074–2080. [Google Scholar] [CrossRef]
- AERONET (Aerosol Robotic Network). Available online: http://aeronet.gsfc.nasa.gov (accessed on 1 August 2018).
- Wang, W.; Mao, F.; Du, L.; Pan, Z.; Gong, W.; Fang, S. Deriving Hourly PM2.5 Concentrations from Himawari-8 AODs over Beijing–Tianjin–Hebei in China. Remote Sens. 2017, 9, 858. [Google Scholar] [CrossRef]
- Zang, L.; Mao, F.Y.; Guo, J.P.; Gong, W.; Wang, W.; Pan, Z.X. Estimating hourly PM1 concentrations from Himawari-8 aerosol optical depth in China. Environ. Pollut. 2018, 241, 654–663. [Google Scholar] [CrossRef]
- Higurashi, A.; Nakajima, T. Development of a two-channel aerosol retrieval algorithm on a global scale using NOAA AVHRR. J. Atmos. Sci. 1999, 56, 924–941. [Google Scholar] [CrossRef]
- Fukuda, S.; Nakajima, T.; Takenaka, H.; Higurashi, A.; Kikuchi, N.; Nakajima, T.Y.; Ishida, H. New approaches to removing cloud shadows and evaluating the 380 nm surface reflectance for improved aerosol optical thickness retrievals from the GOSAT/TANSO-Cloud and Aerosol Imager. J. Geophys. Res. Atmos. 2013, 118, 13520–13531. [Google Scholar] [CrossRef]
- Ishida, H.; Nakajima, T.Y. Development of an unbiased cloud detection algorithm for a spaceborne multispectral imager. J. Geophys. Res. Atmos. 2009, 114. [Google Scholar] [CrossRef]
- Ishida, H.; Nakajima, T.Y.; Yokota, T.; Kikuchi, N.; Watanabe, H. Investigation of GOSAT TANSO-CAI cloud screening ability through an intersatellite comparison. J. Appl. Meteorol. Clim. 2011, 50, 1571–1586. [Google Scholar] [CrossRef]
- Kikuchi, M.; Murakami, H.; Suzuki, K.; Nagao, T.M.; Higurashi, A. Improved Hourly Estimates of Aerosol Optical Thickness Using Spatiotemporal Variability Derived from Himawari-8 Geostationary Satellite. IEEE Trans. Geosci. Remote Sens. 2018, 56, 3442–3455. [Google Scholar] [CrossRef]
- Dubovik, O.; Smirnov, A.; Holben, B.N.; King, M.D.; Kaufman, Y.J.; Eck, T.; Slutsker, I. Accuracy assessments of aerosol optical properties retrieved from Aerosol Robotic Network (AERONET) Sun and sky radiance measurements. J. Geophys. Res. Atmos. 2000, 105, 9791–9806. [Google Scholar] [CrossRef]
- Xiao, Q.Y.; Zhang, H.; Choi, M.; Li, S.S.; Kondragunta, S.; Kim, J.; Holben, B.; Levy, R.C.; Liu, Y. Valuation of VIIRS, GOCI, and MODIS Collection 6 AOD retrievals against ground sunphotometer measurements over East Asia. Atmos. Chem. Phys. Discuss. 2015, 16, 20709–20741. [Google Scholar] [CrossRef]
- Zhang, W.; Xu, H.; Zheng, F. Aerosol Optical Depth Retrieval over East Asia Using Himawari-8/AHI Data. Remote Sens. 2018, 10, 137. [Google Scholar] [CrossRef]
- Che, H.Z.; Qi, B.; Zhao, H.J.; Xiao, X.G.; Eck, T.; Goloub, P.; Dubovik, O.; Estellés, V.; Cuevas, E.; Blarel, L.; et al. Aerosol optical properties and direct radiative forcing based on measurements from the China Aerosol Remote Sensing Network (CARSNET) in eastern China. Atmos. Chem. Phys. 2018, 18, 405–425. [Google Scholar] [CrossRef]
- Li, Z.Q.; Xu, H.; Li, K.T.; Li, D.H.; Xie, Y.S.; Li, L.Q.; Zhang, Y.; Gu, X.F.; Zhao, W.; Tian, Q.J.; et al. Comprehensive study of optical, physical, chemical, and radiative properties of total columnar atmospheric aerosols over China: An overview of Sun–sky radiometer Observation Network (SONET) measurements. Bull. Am. Meteorol. Soc. 2018, 99, 739–755. [Google Scholar] [CrossRef]
- Xie, Y.S.; Li, Z.Q.; Li, D.H.; Xu, H.; Li, K.T. Aerosol Optical and Microphysical Properties of Four Typical Sites of SONET in China Based on Remote Sensing Measurements. Remote Sens. 2015, 7, 9928–9953. [Google Scholar] [CrossRef]
- Smirnov, A.B.; Holben, B.N.; Eck, T.F.; Dubovik, O.; Slutsker, I. Cloud-screening and quality control algorithms for the AERONET database. Remote Sens. Environ. 2000, 73, 337–349. [Google Scholar] [CrossRef]
- Choi, M.; Kim, J.; Lee, J.; Kim, M.; Je Park, Y.; Jeong, U.; Kim, W.; Holben, B.; Eck, T.F.; Lim, J.H.; et al. GOCI Yonsei Aerosol Retrieval (YAER) algorithm and validation during DRAGON-NE Asia 2012 campaign. Atmos. Meas. Tech. Discuss. 2015, 8, 9565. [Google Scholar] [CrossRef]
- Choi, M.; Kim, J.; Lee, J.; Kim, M.; Je Park, Y.; Holben, B.; Eck, T.; Li, Z.Q.; Song, C.H. GOCI Yonsei aerosol retrieval version 2 products: An improved algorithm and error analysis with uncertainty estimation from 5-year validation over East Asia. Atmos. Meas. Tech. 2018, 11, 385–408. [Google Scholar] [CrossRef]
- Shang, H.Z.; Chen, L.F.; Letu, H.S.; Zhao, M.; Li, S.S.; Bao, S.H. Development of a daytime cloud and haze detection algorithm for Himawari-8 satellite measurements over central and eastern China. J. Geophys. Res. 2017, 122, 3528–3543. [Google Scholar] [CrossRef]
- Letu, H.S.; Nagao, T.M.; Nakajima, T.Y.; Riedi, J.; Ishimoto, H.; Baran, A.J.; Shang, H.Z.; Sekiguchi, M.; Kikuchi, M. Ice Cloud Properties from Himawari-8/AHI Next-Generation Geostationary Satellite: Capability of the AHI to Monitor the DC Cloud Generation Process. IEEE Trans. Geosci. Remote Sens. 2018, 12, 1–11. [Google Scholar] [CrossRef]
- Letu, H.; Ishimoto, H.; Riedi, J.; Nakajima, T.Y.; -Labonnote, L.C.; Baran, A.J.; Nagao, T.M.; Sekiguchi, M. Investigation of ice particle habits to be used for ice cloud remote sensing for the GCOM-C satellite mission. Atmos. Chem. Phys. 2016, 16, 12287–12303. [Google Scholar] [CrossRef]
© 2019 by the authors. Licensee MDPI, Basel, Switzerland. This article is an open access article distributed under the terms and conditions of the Creative Commons Attribution (CC BY) license (http://creativecommons.org/licenses/by/4.0/).