Article

Atmospheric Response to Oceanic Cold Eddies West of Luzon in the Northern South China Sea

School of Atmospheric Sciences, Sun Yat-Sen University, Guangzhou 510275, China
*
Author to whom correspondence should be addressed.
Atmosphere 2019, 10(5), 255; https://doi.org/10.3390/atmos10050255
Submission received: 2 March 2019 / Revised: 27 April 2019 / Accepted: 3 May 2019 / Published: 8 May 2019
(This article belongs to the Special Issue Advancements in Mesoscale Weather Analysis and Prediction)

Abstract

:
Using the compositing method, two kinds of sea surface temperature (SST) anomalies associated with mesoscale ocean eddies and their effects on the atmosphere over the northern South China Sea were investigated. We focused on Luzon cold eddies (LCEs), which form during the winter monsoon and occur repeatedly to the west of Luzon Island, where a SST front exists. Using satellite and reanalysis data, 20 LCEs from 2000–2016 were classified into two types according to their impact on the atmosphere. One type consisted of cold SST anomalies within the eddy interior; subsequent turbulent heat flux and surface wind speed decreased over the cold core, presenting a monopole pattern. The second type comprised SST anomalies on either side of the eddy, which mostly propagated along the SST front. For this type of LCEs, cyclonic eddy currents acting on the SST front led to the SST anomalies. They produced a dipole, with surface wind deceleration and acceleration over negative and positive SST anomalies, respectively, on either side of the eddy’s flank. Dynamically, for both types of LCE, a vertical mixing mechanism appeared to be responsible for the wind anomalies. Moreover, anomalous vertical circulations developed over the LCEs that extended over the whole boundary layer and penetrated into the free atmosphere, leading to an anomalous convective rain rate. Quantitatively, the surface wind speed changed linearly with SST; atmospheric anomalies related to LCEs explained 5%–14% of the total daily variance.

Graphical Abstract

1. Introduction

Following recent advances in high-resolution (about 25 km) satellite-based observation of sea surface temperature (SST) and sea surface wind speed, increased attention has been paid to mesoscale (radii: 50–200 km) ocean eddies and their significant atmospheric impacts [1,2,3,4,5]. Atmospheric responses to mesoscale eddies in different regions have some features in common. One of the most prominent features is the positive linear relationship between SST and surface wind speed (or wind stress), which manifests as a direct force from the ocean to the atmosphere [5,6,7,8]. Previous research near the Gulf Stream had shown that surface wind speeds increase or decrease by about 10–15% over warm or cold-core ring SST, respectively [9]. Similar results have also been found in the Southern Ocean, where eddy-related SST anomaly is about 0.5 °C, and the consequent change in the surface wind speed can be up to 0.31 m s−1, which explains about 13% of the atmospheric variability [3,5]. However, as pointed out by Spall et al. [10] and Small et al. [11], eddies’ effects on the atmosphere in different regions also show unique features. For example, Chelton [12] suggested that eddies’ effects on the atmosphere over the Southern Ocean is restricted to the atmospheric boundary layer (ABL). However, in the Kuroshio Extension region, vertical velocity anomalies triggered by oceanic eddies can extend to the 800 hPa level, which indicates an influence beyond the ABL, as shown by Ma et al. [13]. Thus, although the question of penetration of the SST–wind coupling above the ABL has been addressed to some degree by a number of studies in different regions [13,14,15], it is still in part an open question.
Eddies’ effects on the atmosphere vary between seasons and regions because of the diversity in oceanic and atmospheric environments [16,17]. The northern South China Sea (NSCS) is an active eddy area [18,19,20] and the atmospheric responses to eddies within the region exhibit obvious seasonality [21]. This is mainly because the NSCS basin-scale SST decreases progressively from southeast to northwest, forming a strong SST front during the winter monsoon (Figure 1). Meanwhile, cyclonic ocean eddies typically occur to the west of Luzon and are mainly generated by a joint result of the winter monsoon and regional terrain [22,23,24]. As pointed out by Sun and Liu [25], cyclonic ocean eddies in the region could also be caused by oceanic instability processes from Kuroshio intrusion. Between these two mechanisms of eddy formation, wind stress west of Luzon Island is dominant, while the role of the Kuroshio intrusion is still unclear. As shown in Figure 1a, positive wind stress curl is significant in the eddy generation area, which can create strong Ekman upwelling in the ocean. Consequently, it is common that these eddies exhibit a structure with a cold core. Thus, these seasonal cyclonic eddies are often named Luzon cold eddies (LCEs) [26,27,28]. As a typical seasonal ocean eddy in the South China Sea (SCS), the formation and structure of LCEs have been discussed to date [29]; however, their impact on the local circulation is still unknown and therefore is the focus of this study.
Liu et al. [30] demonstrated how cyclonic and anticyclonic eddies in the SCS affect surface wind speed and other atmospheric variables; such effects were considered based on generalized descriptions of eddies. However, atmospheric responses for some persistent eddies (such as the LCEs) in the SCS are very complicated. The processes might be influenced by many factors, such as particular motions and dynamic characteristics of these eddies [31] or special background environments [32]. Moreover, recent studies have noticed that near-surface atmospheric wind can be influenced by the oceanic current associated with mesoscale eddies [33,34]. In the NSCS, Chow and Liu [35] recognized that with a large winter SST gradient, geostrophic currents between a pair of cyclonic and anticyclonic eddies could produce tongue-like SST anomalies and that significant wind speed anomalies might arise over them. Therefore, it could be conjectured that the eddy currents of individual LCEs might also produce tongue-like SST anomalies under the same oceanic conditions. In that situation, it is interesting to ascertain how that affects the atmosphere. Although atmospheric response to mesoscale eddies in the SCS have been discussed previously, most eddies represent transient phenomena and the study of a persistent eddy is rare. This study revisited 20 LCEs that successively appeared to the west of Luzon between 2000 and 2016, with an emphasis on their impacts on the atmosphere through different pathways. The primary objective of this study is to clarify the spatial pattern of SST anomalies induced by LCEs and to elucidate the response of atmospheric parameters to such anomalies. In addition, two main mechanisms of atmospheric responses to mesoscale eddies have been proposed [11]. The first arises from the vertical momentum fluxes that occur because of the modification of the atmospheric stability [36,37]. The second mechanism arises from the Laplacian of sea level pressure, which generates additional pressure gradient forces in regions with large SST gradients [11,38]. The key question is how SST anomalies associated with the LCEs affect the atmosphere and if the eddies’ impacts can penetrate above the ABL.
The remainder of this paper is arranged as follows. In Section 2, we describe the datasets employed in this study and methods used here to isolate eddy signals from the large-scale background. Section 3 presents atmospheric responses to different kinds of LCEs. The possible physical mechanism behind the effects of LCEs on the atmosphere is also described. Finally, our conclusions and a discussion are delivered in Section 4.

2. Data and Methods

2.1. Data

A census of LCEs was conducted using the Mesoscale Eddy Trajectory Atlas (version 4, Oregon State University, Corvallis, U.S.) provided by Archiving, Validation and Interpretation of Satellite Oceanographic data (AVISO). This dataset comprises the locations, radii, and amplitudes of eddies throughout the world at 1-d intervals; namely, if an eddy lasts for 90 days then there will be 90 “eddy records”. This eddy trajectory dataset was developed by Chelton and Schlax [39] using a “growing method” [40] for eddy identification based on daily sea surface height dataset.
To detect mesoscale features of the LCEs and their imprints on the atmosphere, six sets of gridded high-resolution satellite observations from 2000–2016 were used:
(1)
Delayed-time “allsat” product of altimetry sea level anomaly (SLA) and geostrophic velocity data on a 0.25° grid. The Ssalto/Duacs altimeter products were produced and distributed by the Copernicus Marine and Environment Monitoring Service (CMEMS) [41].
(2)
Optimally interpolated SST (OI_SST) product at 25-km resolution obtained from remote sensing systems [42].
(3)
Latent and sensible heat fluxes, ocean evaporation, and air temperature at 2 m height with 1° horizontal resolution, derived from the objectively analyzed air–sea fluxes (OA Flux) project of the Woods Hole Oceanographic Institution.
(4)
Blended ocean surface (10 m above the ocean surface) vector winds on a global 0.25° grid, distributed by the National Centers for Environmental Information of the National Oceanic and Atmospheric Administration [43,44].
(5)
Hourly rain rate dataset obtained from the Tropical Rainfall Measuring Mission (TRMM) 3b42 at a spatial resolution of 0.25° grid was used to describe the eddies’ impacts on the local precipitation [45].
(6)
Three-daily cloud liquid water average at 0.25° resolution from the TMI released by RSS (TMI v7.1) was also employed to verify the cloud response to the LCEs [46].
To understand the physical mechanism of the eddies’ influence on the atmosphere, the 6-hourly product for frictional velocity at 0.31° horizontal resolution from the National Centers for Environmental Prediction Climate Forecast System Reanalysis (CFSR) was employed [47]. In the meantime, the CFSR reanalysis datasets of convective rain rate (0.31° horizontal resolution), air temperature, and vertical velocity (0.5° horizontal resolution with 16 levels, from 1000 hPa to 500 hPa) were also used to determine the eddies’ influences on the vertical direction. Previous studies showed that the CFSR data is able to provide reliable information to describe features of atmospheric anomaly at the mesoscale [13,14,17,48]. It’s worth to note that the CFSR reanalysis data were not accessible after 2011, so analyses based on these data included 14 LCEs that formed during 2000–2010. The CFSR reanalysis data are available online [49].

2.2. Methods

First, all data fields were interpolated onto a consistent 0.25° by 0.25° grid for uniformity. The datasets, except for CFSR air temperatures were then filtered temporally and spatially in consideration that studies in the NSCS might be disturbed by other tropical turbulence systems and are very sensitive to the effects of the Asian monsoon. Meanwhile, the mean lifetime of an LCE is more than one month, which is longer than transient synoptic systems such as tropical storms and easterly waves. Thus, a three-week temporal low-pass (Butterworth) filter was applied to eliminate disturbances with weather-related timescales. In addition, the mean diameter of an LCE is much smaller than the basin-scale seasonal variation of SST or surface wind. Therefore, it was effective to use a two-dimensional spatial (Loess) filter [50] with a 4° half-width to extract eddy signals from the background fields. The half-width (about 440 km) of the spatial filter chose here was found reasonable, considering that the spatial scale of LCEs (with a mean radius of 110 km) and the spatial atmospheric response might be twice as large as the eddy.
Composite analyses were used to infer mean atmospheric manifestations of SST anomalies related to LCEs. Three steps were necessary to complete the composite maps: (1) based on the eddy trajectory dataset, very weak eddy records with amplitudes (SLA) <4 cm were eliminated. (2) prefiltered oceanic and atmospheric fields corresponding to each eddy record were interpolated into eddy-radius normalized coordinates (Figure 2) where anomaly fields were centered on the eddy core and scaled with a normalized axis length of twice the eddy radius (±2R of the x-axis and y-axis); (3) normalized anomaly fields for all eddy records were averaged and tested. In this way, our composite analyses moved with the LCEs, which highlighted their signatures within the ambient field.
Similar filtering methods and composite analyses have been applied in previous studies and their ability to highlight the influences of mesoscale eddies have been verified [3,5,30].

3. Atmospheric Responses to LCEs

3.1. Characteristics of the LCEs and Eddy-Related SST Anomalies

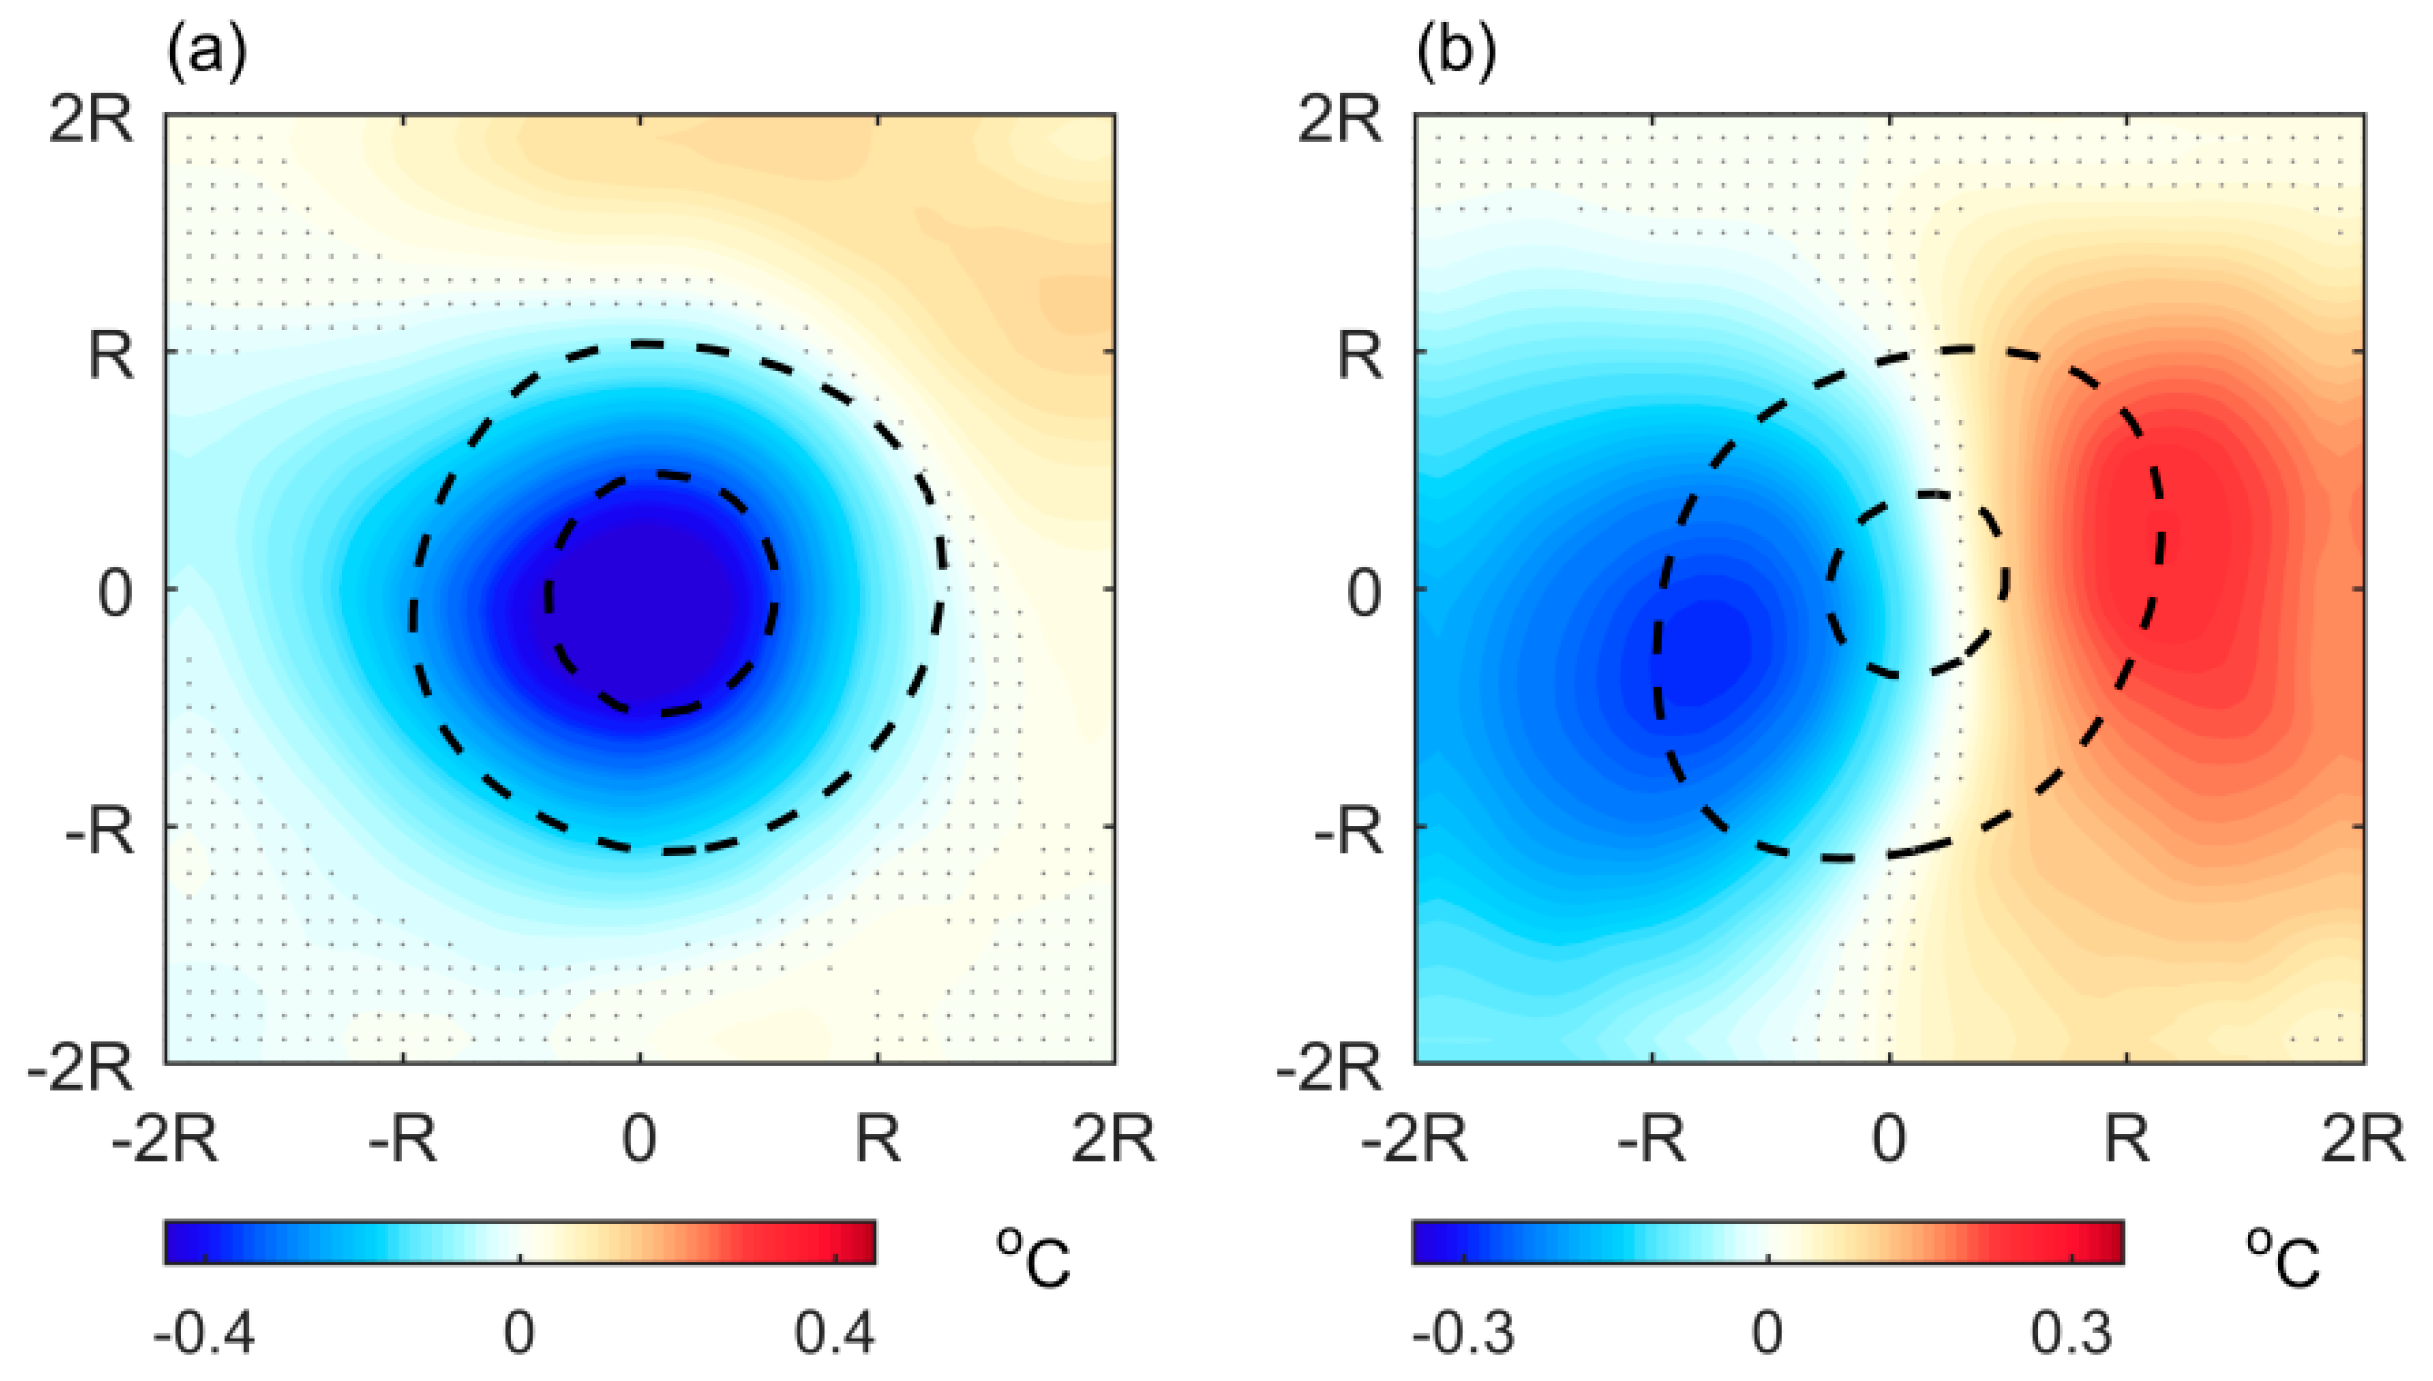
The LCEs are defined as cyclonic gyres that appear as closed contours of negative SLA generated off western Luzon during the Northern Hemisphere winter. Thus, cyclonic eddies that originated within 17°–20° N, 117°–120° E (dashed box in Figure 1a) were identified as LCEs in our study. Consequently, 20 LCEs with mean lifetimes of 85 days were identified from 2000–2016. At least one LCE was found in each year and two LCEs were identified in 2006, 2009, and 2016. In addition, the 20 LCEs comprised of 1685 eddy records, which averaged radii of 110 km, slightly below the total average value (150 km) of the SCS. Some LCEs were detected as early as October and some persisted until the beginning of May. However, most LCEs developed into a mature stage in December and persisted to the following January or February. During this period, the NSCS is controlled by the prevailing northeast monsoon and the 28 °C isotherm retreats southward of 16° N, which means the LCEs were located within the region of the strong SST front (Figure 1a). In the area west of Luzon, the climatological mean meridional SST gradient is about 0.56 °C 100 km−1 in winter, which is much greater than summer (about 0.07 °C 100 km−1). As shown in Figure 1b, the LCEs propagated westward or northwestward and more than half pass through the area in which the SST gradient was >0.36 °C 100 km−1. Meanwhile, the mean eddy current speed (averaged within the annular region from 0.5 R to 1 R) of all LCEs is about 0.25 m s−1 at the sea surface. Presumably, there could be considerable horizontal heat advection when eddies meet the SST front, which could modify the spatial pattern of SST anomalies around the eddies. Moreover, the mean amplitude, which is defined as the SLA average within the eddy core, is about 9 cm and more than 90% of the eddy records have amplitudes >4 cm. Overall, 1521 eddy records with amplitude >4 cm were considered in the following composite analyses so that unwanted noise from very weak eddy records was avoided (for more statistical characteristics of the eddies used in the composites, please see Supplementary Materials Text S1).
A composite analysis was performed on every required eddy record to obtain visual representation of the mean size and shape of each oceanic and atmospheric parameter. First, the effectiveness of our composite method was examined based on the composite results of the SLA. As expected, the composite ring-shaped SLA contours (Figure 2) matched well with the coordinates. After verifying the validity of this composite method, we traversed all 20 LCEs and checked their impacts on the SST field. The results revealed two distinct SST anomaly patterns related to the eddies and all LCEs were classified as one of two types: The central type (Figure 2a) and the peripheral type (Figure 2b). The central type included 12 LCE individuals with a common structure, i.e., an independent low SST center at the eddy core (Figure 2a). This monopole SST feature is related to upwelling within the cyclonic eddy center, which is driven chiefly by local positive wind stress curl. The central type SST anomaly composited from the 12 LCEs is similar to the holistic feature derived from all cyclonic eddies within the SCS (as shown in Liu et al. [30]). However, the mean SST anomaly for central type LCEs was about −0.24 °C and the maximum SST anomaly reached −0.5 °C, much higher than the overall performance within the SCS. Therefore, although LCEs are small in size, stronger surface wind stress west of Luzon enables them to have large SST anomalies. The peripheral type included eight LCEs that showed a dipole pattern of SST anomaly. As shown in Figure 2b, the dipole pattern is comprised of a cold SST patch (about −0.23 °C) on the western side of the eddy and a warm SST patch (about 0.21 °C) on the eastern side. This dipole pattern is formed when the LCEs meet the SST front to the west of Luzon. The anticlockwise eddy currents bring cold water from the north southward on the western side of the eddy edge and transport warm water northward on the eastern side. Hausmann and Czaja [51] suggested that the distinct eddy-associated SST anomalies are related to the relative eddy amplitude, i.e., whether the composite means are computed for more or less energetic regions. However, this theory does not seem to apply here because the mean eddy kinetic energy within the study area is consistent, as shown by Chen et al. [52]. Comparing the two types of LCE, we note the mean eddy current speeds of the two types were similar (about 0.25 m s−1); however, the mean heat advection of the eddy current (average of 0.5R to 1R) of the peripheral type LCEs (0.45 °C week−1) was stronger than the central type LCEs (0.37 °C week−1). Additionally, the mean maximum heat advection for peripheral type LCEs (0.81 °C week−1) was 64% larger than the central type LCEs (0.49 °C week−1). As the heat advection is defined by the dot product of the eddy current and SST gradient ( u g T ¯ , where u g is the eddy current vector and T ¯ is the mean SST gradient, as defined by Wang et al. [53]). Thus, it is expected that the difference in SST anomalies of the two types is mainly due to the strong SST gradient west of Luzon. This is also supported by Figure 1a,b, which shows that most of the peripheral type LCEs were generated further south than the central type LCEs and that they propagated in areas with much higher meridional SST gradients (0.28 °C 100 km−1 for central type LCEs and 0.42 °C 100 km−1 for peripheral type LCEs). The dipole structure of SST anomalies related to peripheral type LCEs was also reported by Gaube et al. [34]. They suggested that this SST advection signature of eddies is dominant in the global mean. According to their conclusions, the single cold-core structure for central type LCEs is more of an exception to the mean.

3.2. Eddy-Related Evaporation, Sea–Air Temperature Difference and Heat Fluxes Anomalies

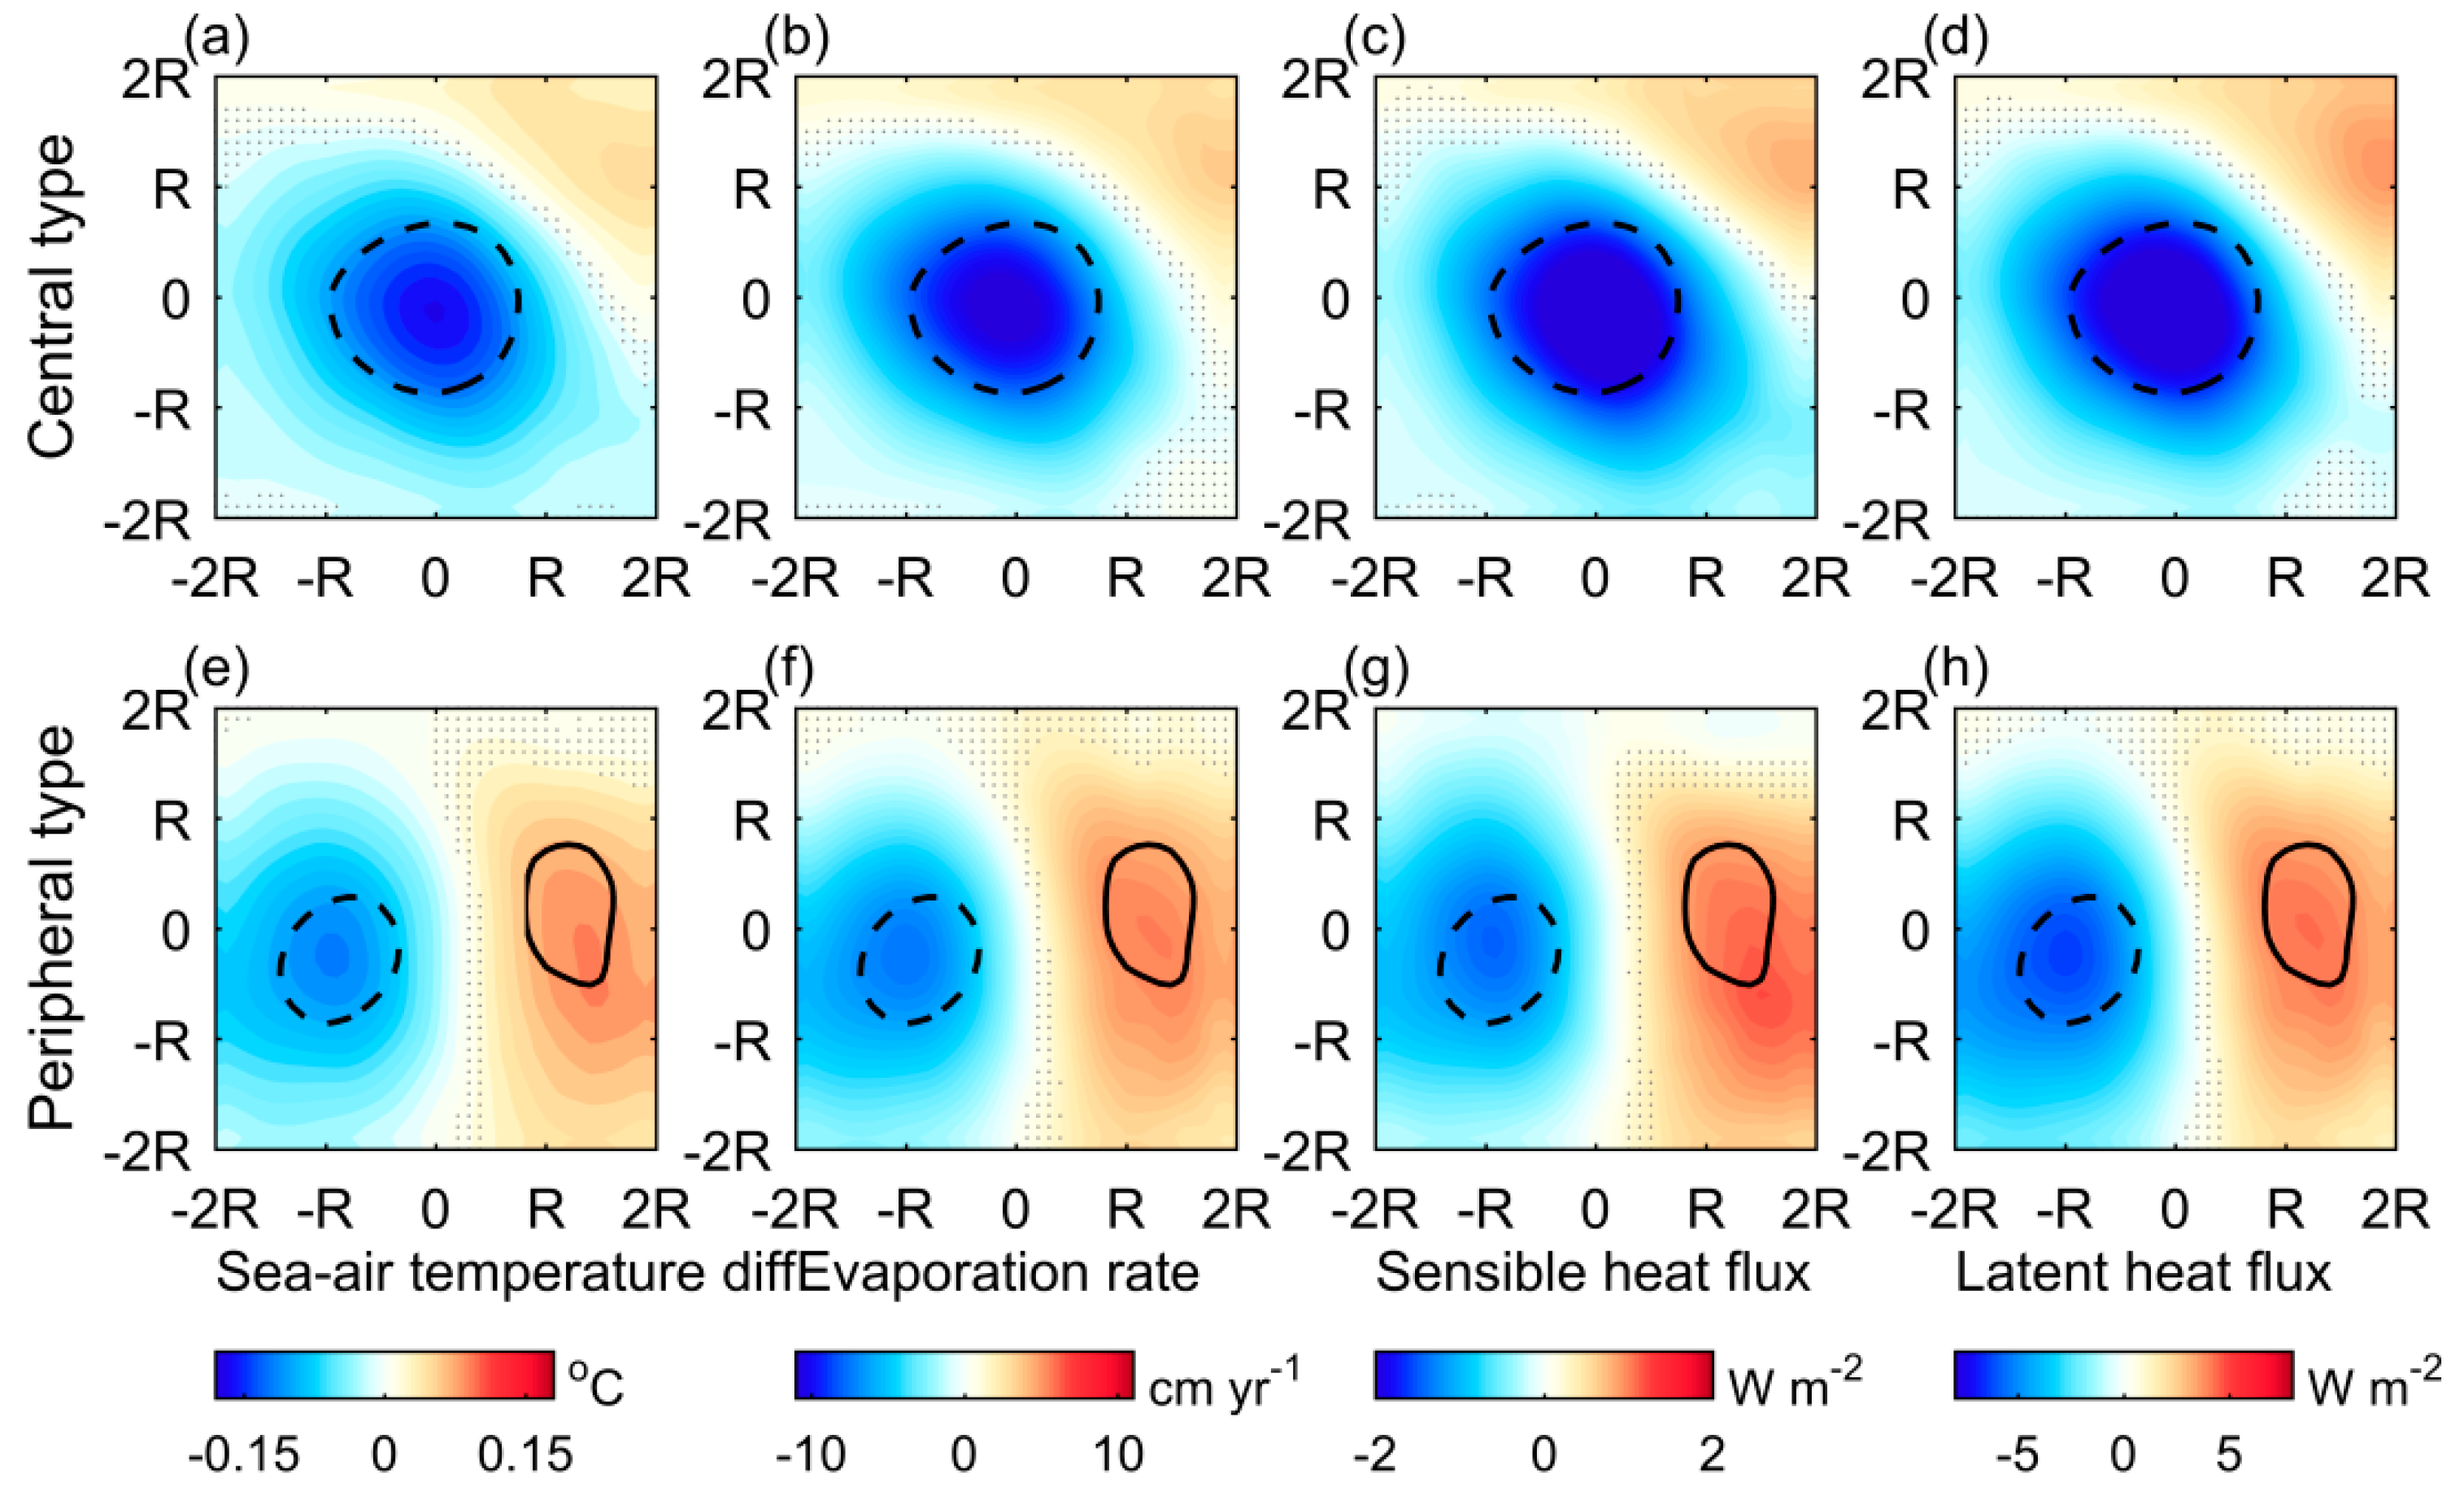
One of the anomalies identified at the air–sea interface in response to the SST anomalies of the LCEs was a difference in temperature between the ocean surface and the lower atmosphere. Eddy-related sea–air temperature differences, together with SST anomalies are shown in Figure 3a,e. In Figure 3a, the cold center related to the central type LCEs was paired with a negative sea–air temperature difference with a maximum of about 0.16 °C. For the peripheral type LCEs (Figure 3e), the temperature difference was positive on the eastern edge of the eddy core and negative on the western edge, in alignment with the dipole pattern in the SST anomaly field. Along with modifications in the thermal characteristics, the moisture characteristics also modified over the LCEs. As expected, two types of evaporation response were coincident with the SST anomalies for central (Figure 3b) and peripheral type (Figure 3f) LCEs.
The bulk expressions of heat fluxes are
Q S H = ρ c p c h U ( T s T a ) Q L H = ρ c e L e U ( q s q a )
where QSH is the sensible heat flux (SHF) and QLH is the latent heat flux (LHF), ρ is the density of air, c p is the specific heat capacity of air at constant pressure, c h and c e are the turbulent exchange coefficients for sensible and latent heat fluxes respectively. The latent heat of evaporation is denoted by Le and U is the wind speed. The temperature and specific humidity differences between the ocean surface and near surface atmosphere are denoted by ( T s T a ) and ( q s q a ) , respectively. It is conceivable that the SHF over the LCEs change because it is proportional to the sea–air temperature difference. On the other hand, the LHF is also strongly regulated by eddy-induced SST anomalies, as q a tends to be relatively constant over the ocean and q s can be written as:
q s = 0.98 q s a t T s
(where q s a t is the saturation humidity at Ts) which is only related to SST. Moreover, both water vapor and latent heat energy are released to the atmosphere by evaporation; and the LHF can be determined from evaporation:
Q L H = ρ w L e E v p
where ρ w is the density of sea water. Accordingly, it is reasonable that the SHF anomalies (Figure 3c,g) had the same spatial characteristics as the sea–air temperature differences, and the LHF anomalies (Figure 3d,h) were analogous to the evaporation anomalies. For central type LCEs, the ocean derives heat from the atmosphere, especially within the eddy interior. For peripheral type LCEs, both the anomalous SHF and LHF displayed a dipole pattern. A quantitative estimate of the heat fluxes for LCEs showed that the LHF anomaly was bigger than the SHF anomaly and the mean turbulent heat flux anomaly for central type LCEs is bigger (about 4 W m−2) than the peripheral type LCEs. Turbulent heat flux anomalies related to LCEs were confirmed by the higher resolution IFREMER and J-OFURO datasets; please see Supplementary Materials Text S2. Generally, distinct modifications of the thermodynamic characteristics of the ABL might result in a surface wind anomaly.

3.3. Eddy-Related Surface Wind Speed Anomalies

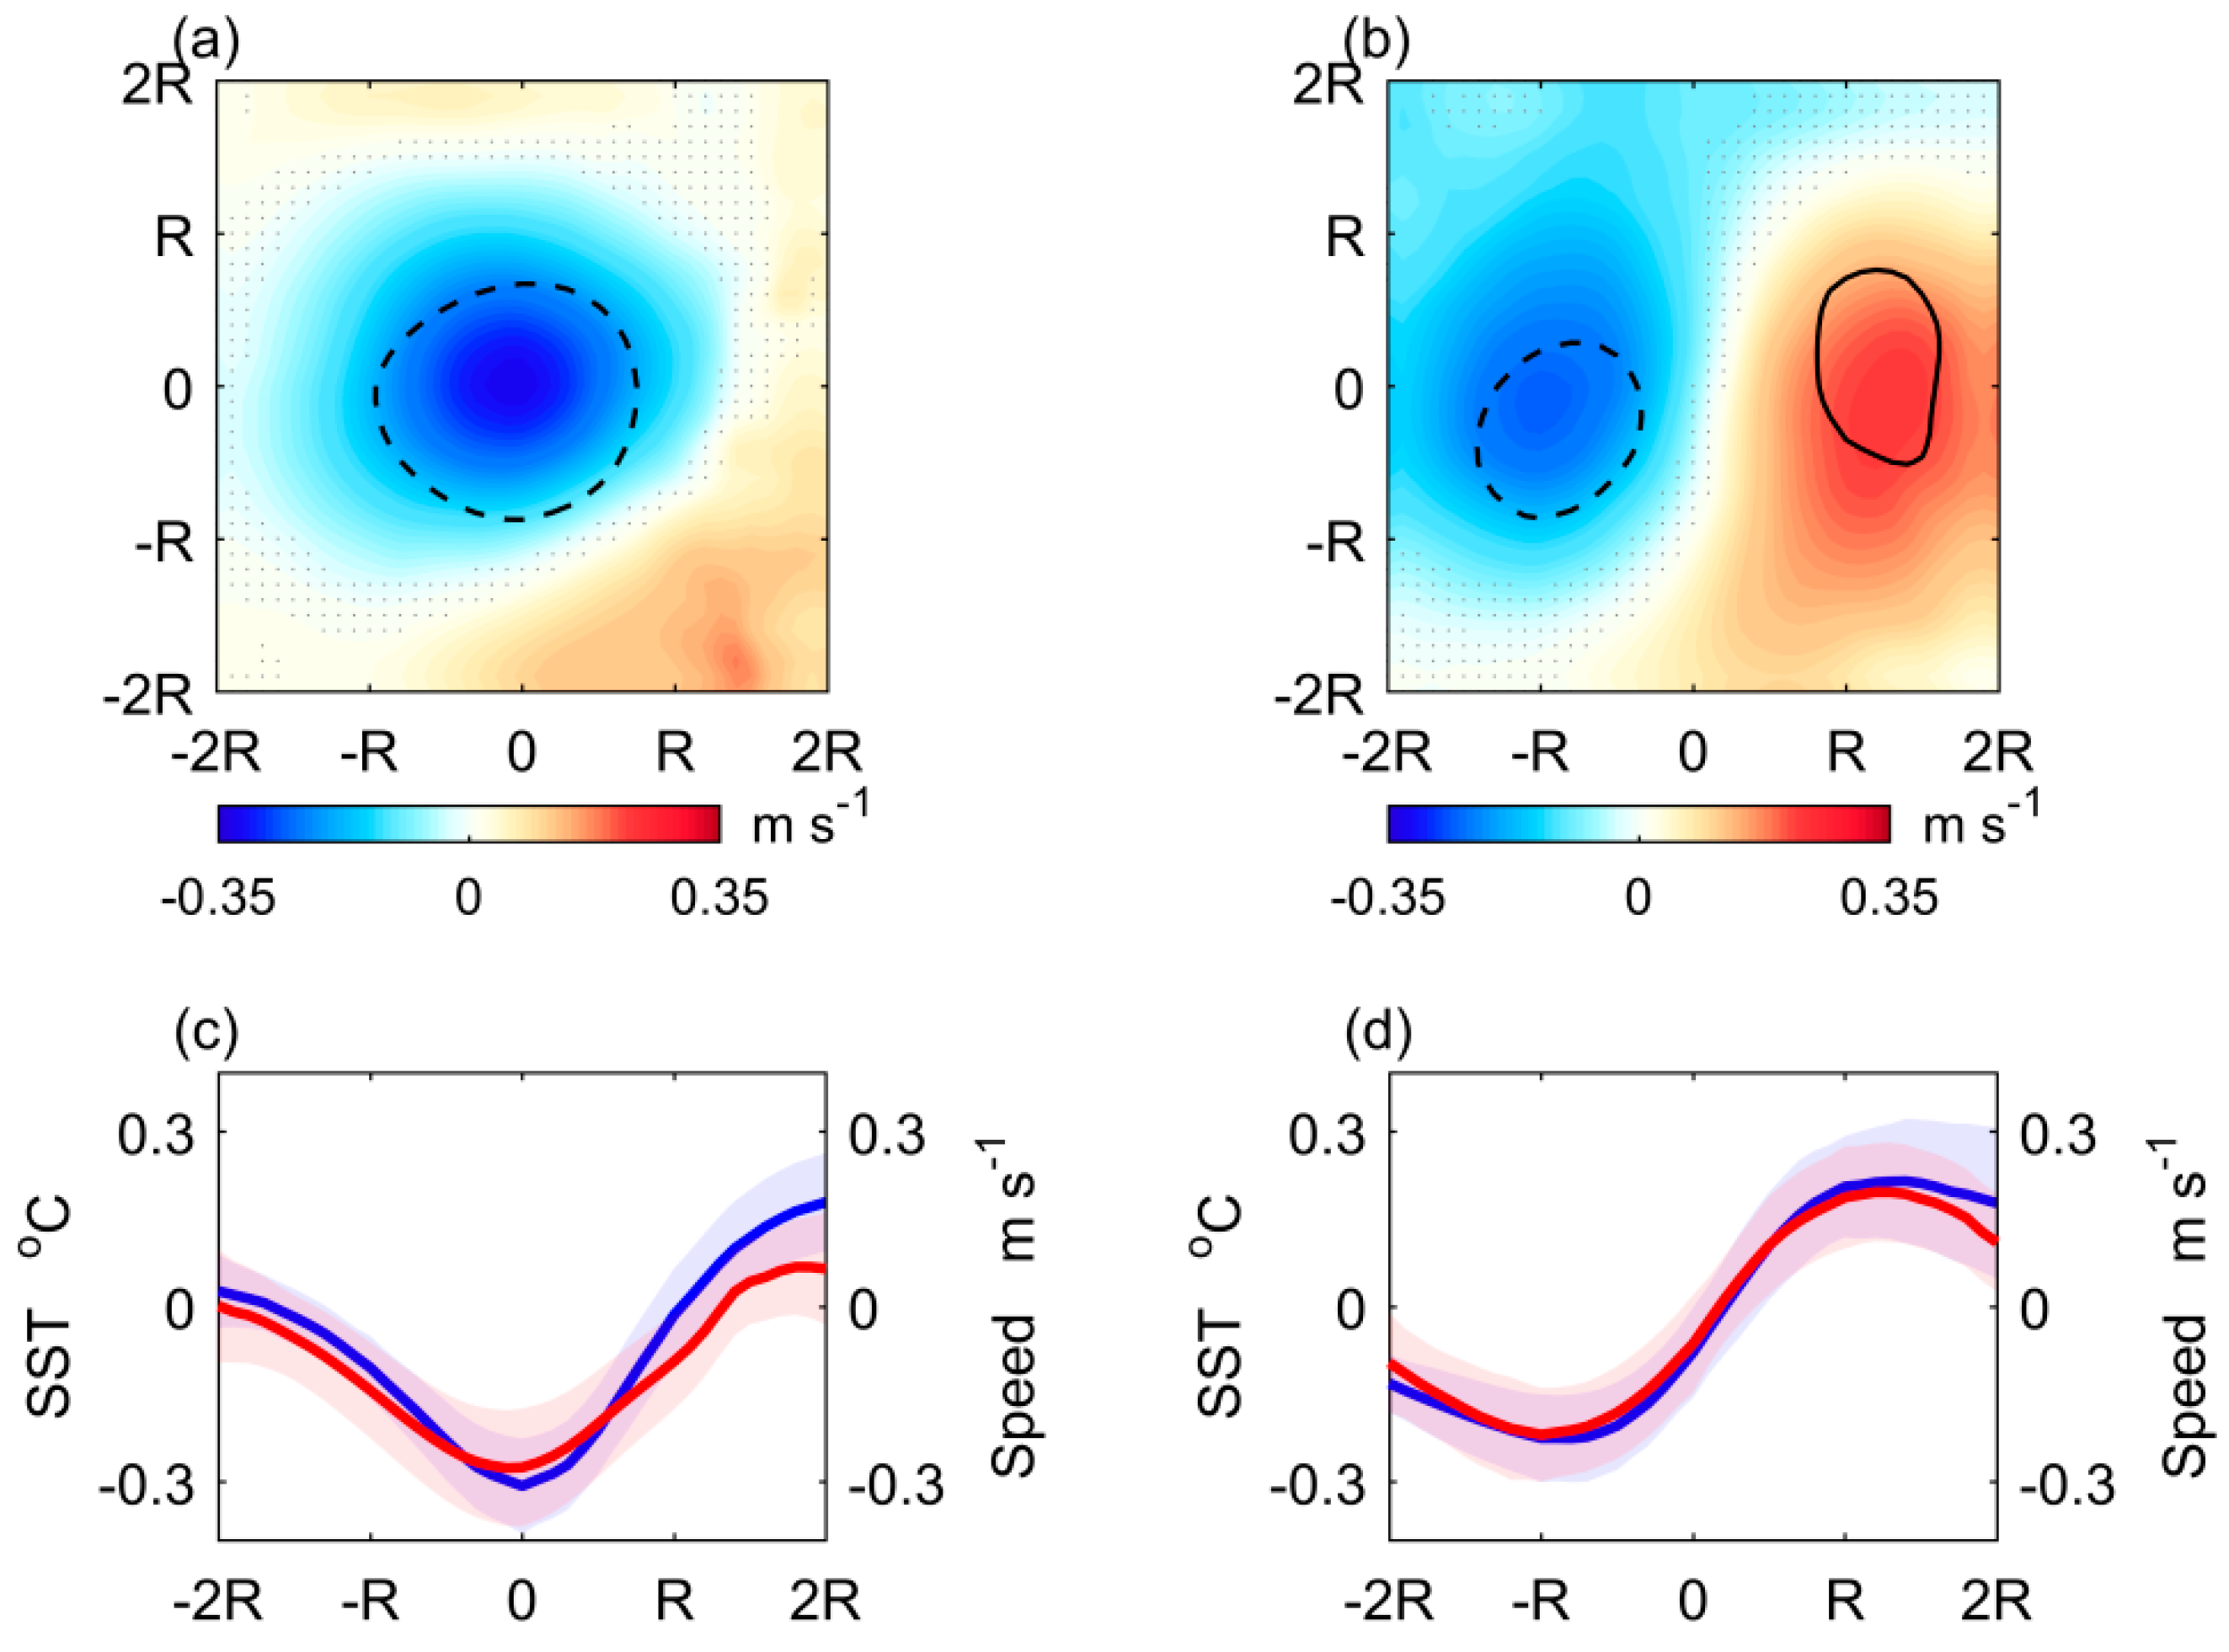
The positive relationship between SST and sea surface wind speed is the most distinctive feature of air–sea interactions on the weather timescale [35,54,55]. As shown in Figure 4, surface winds varied in accordance with eddy-related SST anomalies and a distinct separation was evident in the wind speed anomalies related to central and peripheral type LCEs. The composite wind anomaly for central type LCEs, presented in Figure 4a, displayed reasonable spatial agreement between the low wind speed center and closed contour of negative SST. For peripheral type LCEs, the low wind speed anomaly appeared to the west of the eddy center and the high wind speed anomaly was located to the east (Figure 4b), coincident with the dipole shape of the SST anomaly field. Although the spatial configuration of the wind response was different for the different types of LCE, the synchronous responses of wind to SST anomalies were identical for both types. It is obvious from Figure 4c,d that the meridional section across the eddy core matched very well with the wind speed and SST anomaly. For central (peripheral) type eddies, the section lines in Figure 4c (Figure 4d) appear unimodal (bimodal) and they peak at the eddy center (sides), consistent with the monopole (dipole) pattern of wind speed and SST anomaly fields. For both central and peripheral type LCEs, the maximum surface wind speed anomalies coincided with maximum SST anomalies and exhibited an in-phase relationship with equivalent magnitude.
Under the large-scale scenario, intensified winds might cool the ocean by increased evaporation and entrainment. Thus, if changes in ocean are dominated by the atmosphere an anti-phase relationship between surface wind speed and SST is expected [11]. On the contrary, as shown in Figure 3 and Figure 4, there is a positive correlation between SST anomaly and wind speed anomaly. Therefore, air-sea interaction at eddies exhibits in-phase relationship between SST and wind speed and the in-phase relationship indicates an ocean to atmosphere forcing [3,56]. For example, as pointed out by Hayes et al. [36] and Wallace et al. [37], the nearly in-phase character is a salient feature of the vertical mixing mechanism, which is used to explain the wind response to mesoscale SST anomalies. The vertical mixing mechanism suggests that eddy-induced cold SST anomalies might cool the near surface air and increase atmosphere stability in the ABL. As a result, turbulent mixing right above the eddy core is weakened and the vertical momentum transport is suppressed as well. Thus, this mechanism stresses modifications of atmosphere in the vertical direction and ultimately results in an in-phase relationship between wind speed and SST. According to the theory, the root cause of wind anomalies is the modification of atmospheric stability, which can be represented as anomalous sea–air temperature difference. As shown in Figure 3a,e, cold SST anomalies, whether in the eddy core or on the eddy edge, reduced the sea–air temperature difference, which increased atmospheric stability and, subsequently, weakened vertical mixing. Conversely, the sea–air temperature difference increased over the warm SST anomaly, atmospheric stability was weakened, and enhanced vertical transport of momentum might result in a high surface wind speed. In order to further illustrate physical process behind the wind speed responses, anomalies of frictional velocity for both types of LCE were also discussed. The frictional velocity ( u ) is defined as:
u = [ ( u ω ¯ ) 2 + ( v ω ¯ ) 2 ] 1 4
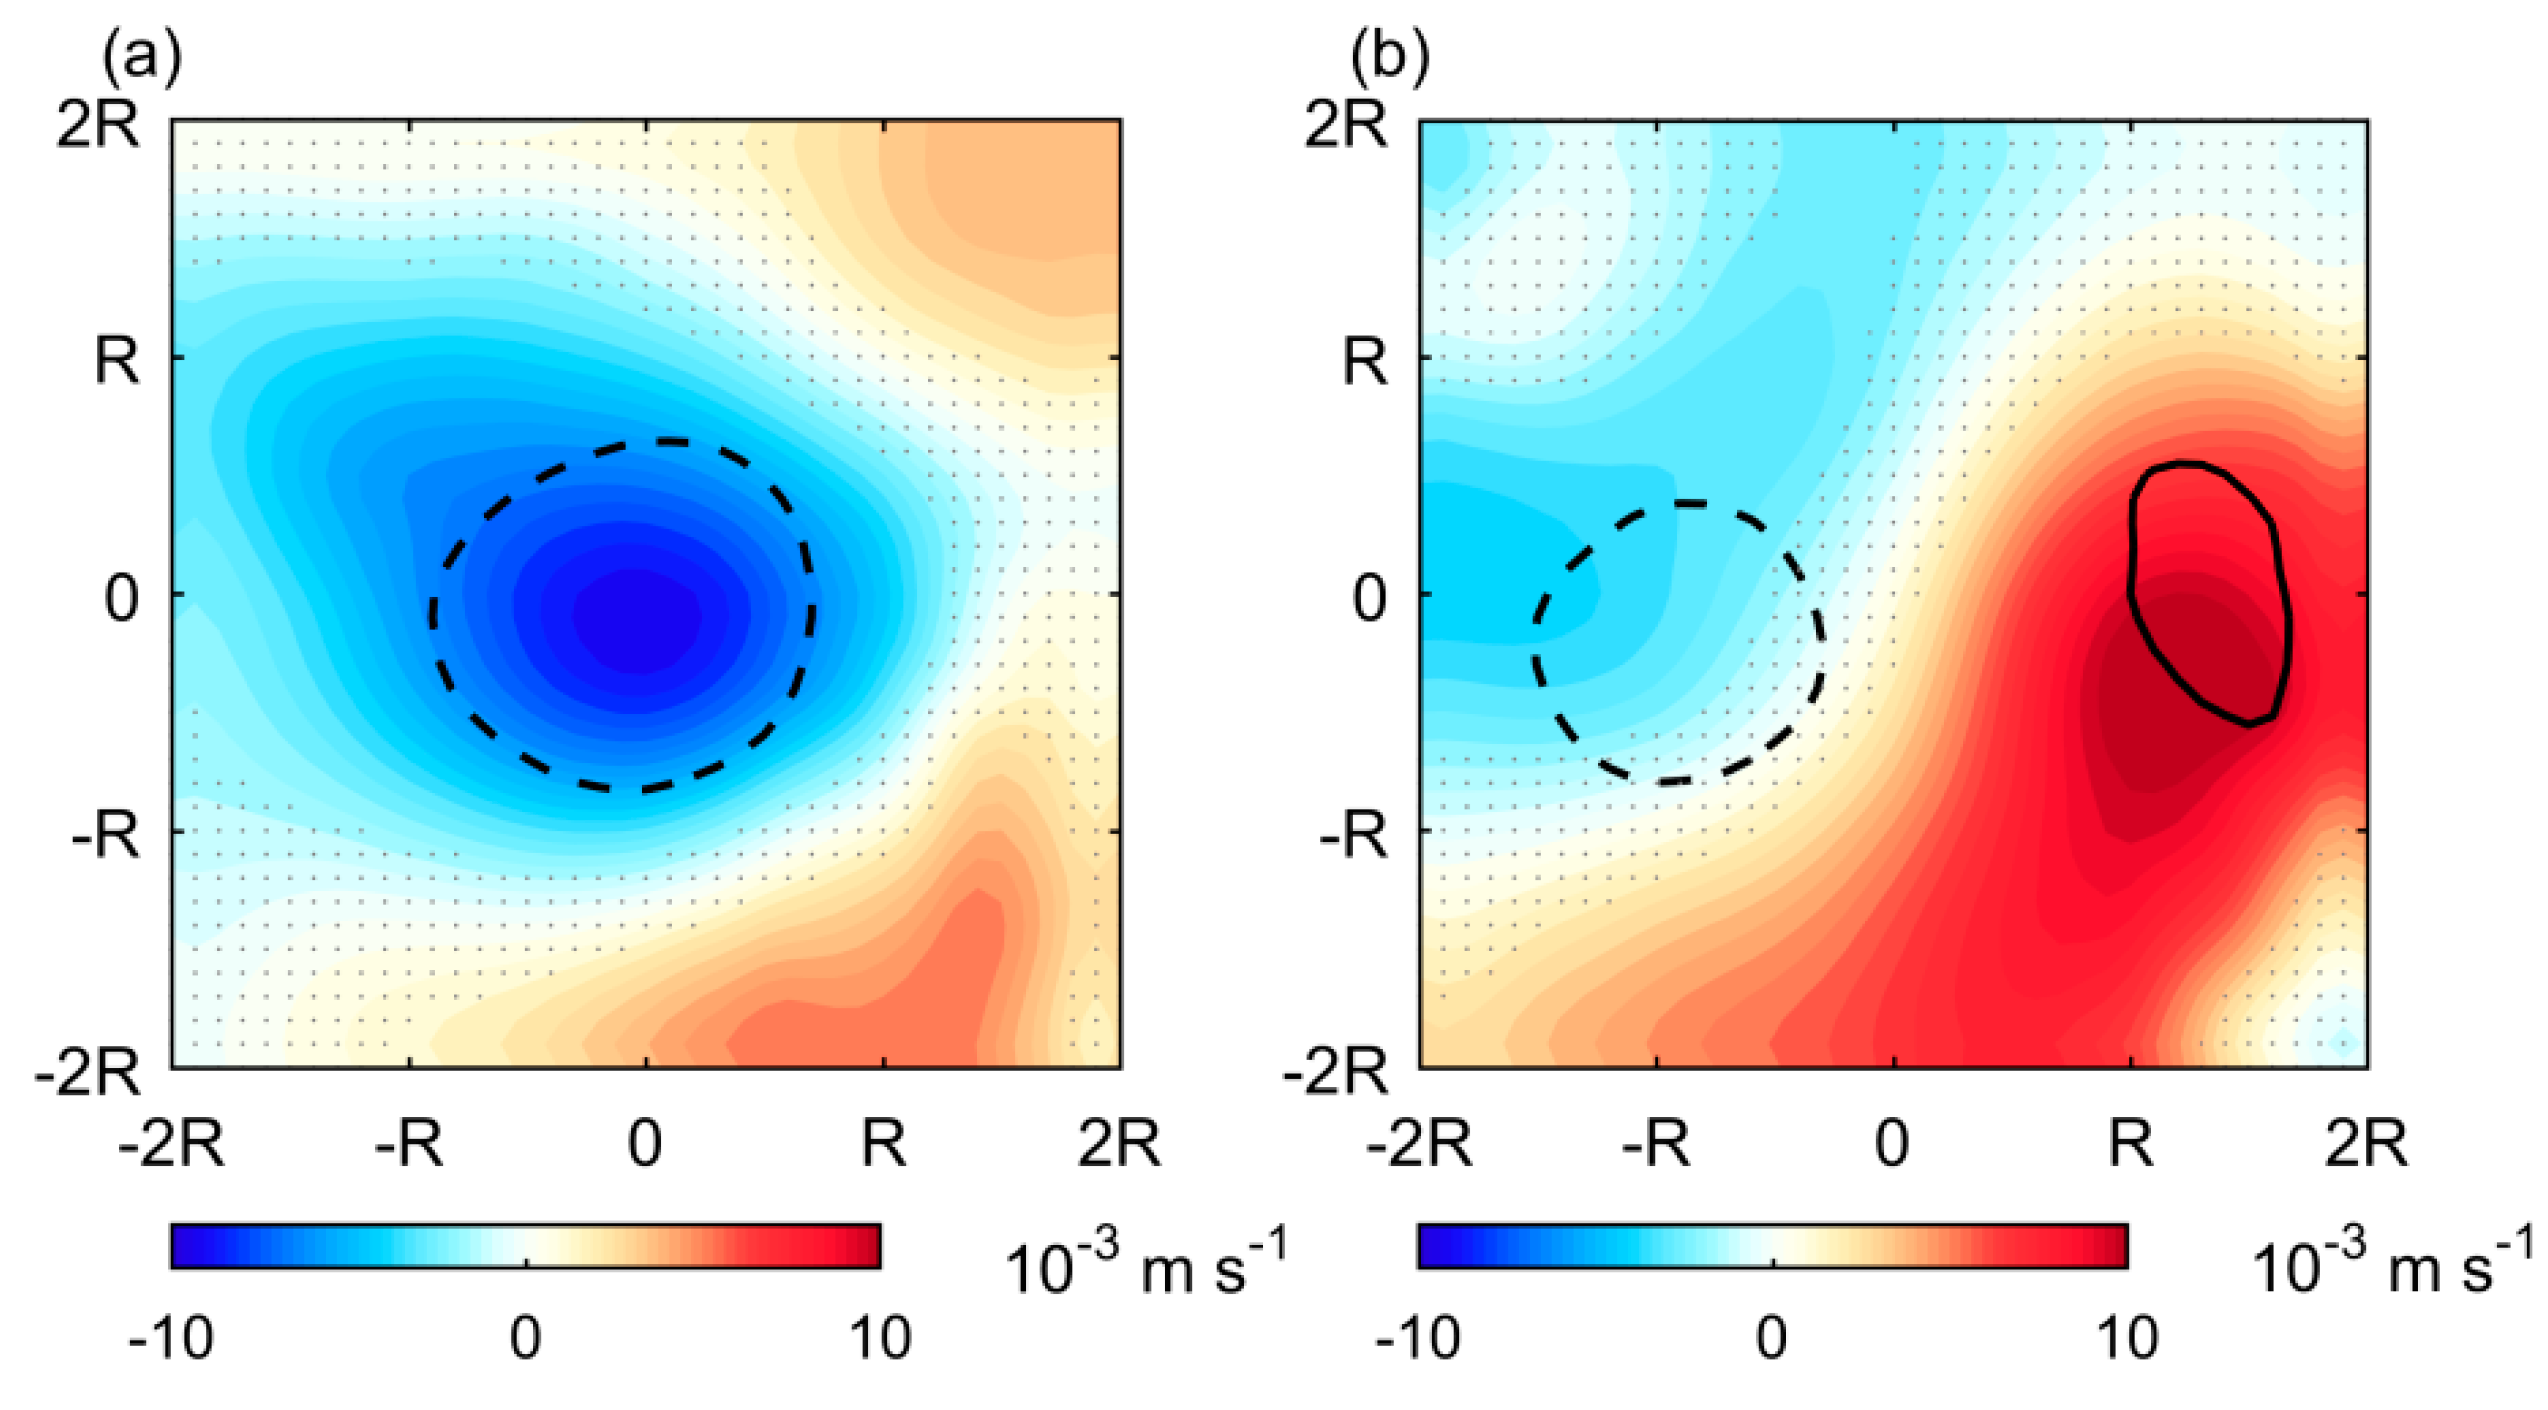
which mostly controls turbulent diffusivity within the ABL and may represent modifications of the vertical momentum fluxes ( ρ u ω ¯ and ρ v ω ¯ ), where u , v and ω are the fluctuating component of velocities. As shown in Figure 5a, for central type LCEs the mean frictional velocity anomaly within the eddy interior was negative, which indicates the vertical momentum flux is suppressed. Consequently, momentum from the upper layers of the atmosphere is not transported down to the surface effectively, which ultimately decelerates sea surface wind. For peripheral type LCEs (Figure 5b), the frictional velocity anomaly presented as a dipole pattern which suggests the vertical momentum flux intensified over the positive SST anomaly and weakened over the negative SST anomaly. Thus, turbulent mixing anomalies as a result of the modifications of atmospheric stability may account for surface wind speed anomalies for both kinds of LCEs. We also note that sea level pressure (SLP) anomalies associated with mesoscale eddies might also cause wind speed anomalies from additional pressure gradient forces, as pointed out by Lindzen and Nigam [38]. However, we found no statistically significant difference in sea level pressure anomalies in the LCE types (Supplementary Materials Text S3).

3.4. Eddy-Related Divergence, Vorticity and Vertical Velocity Anomalies

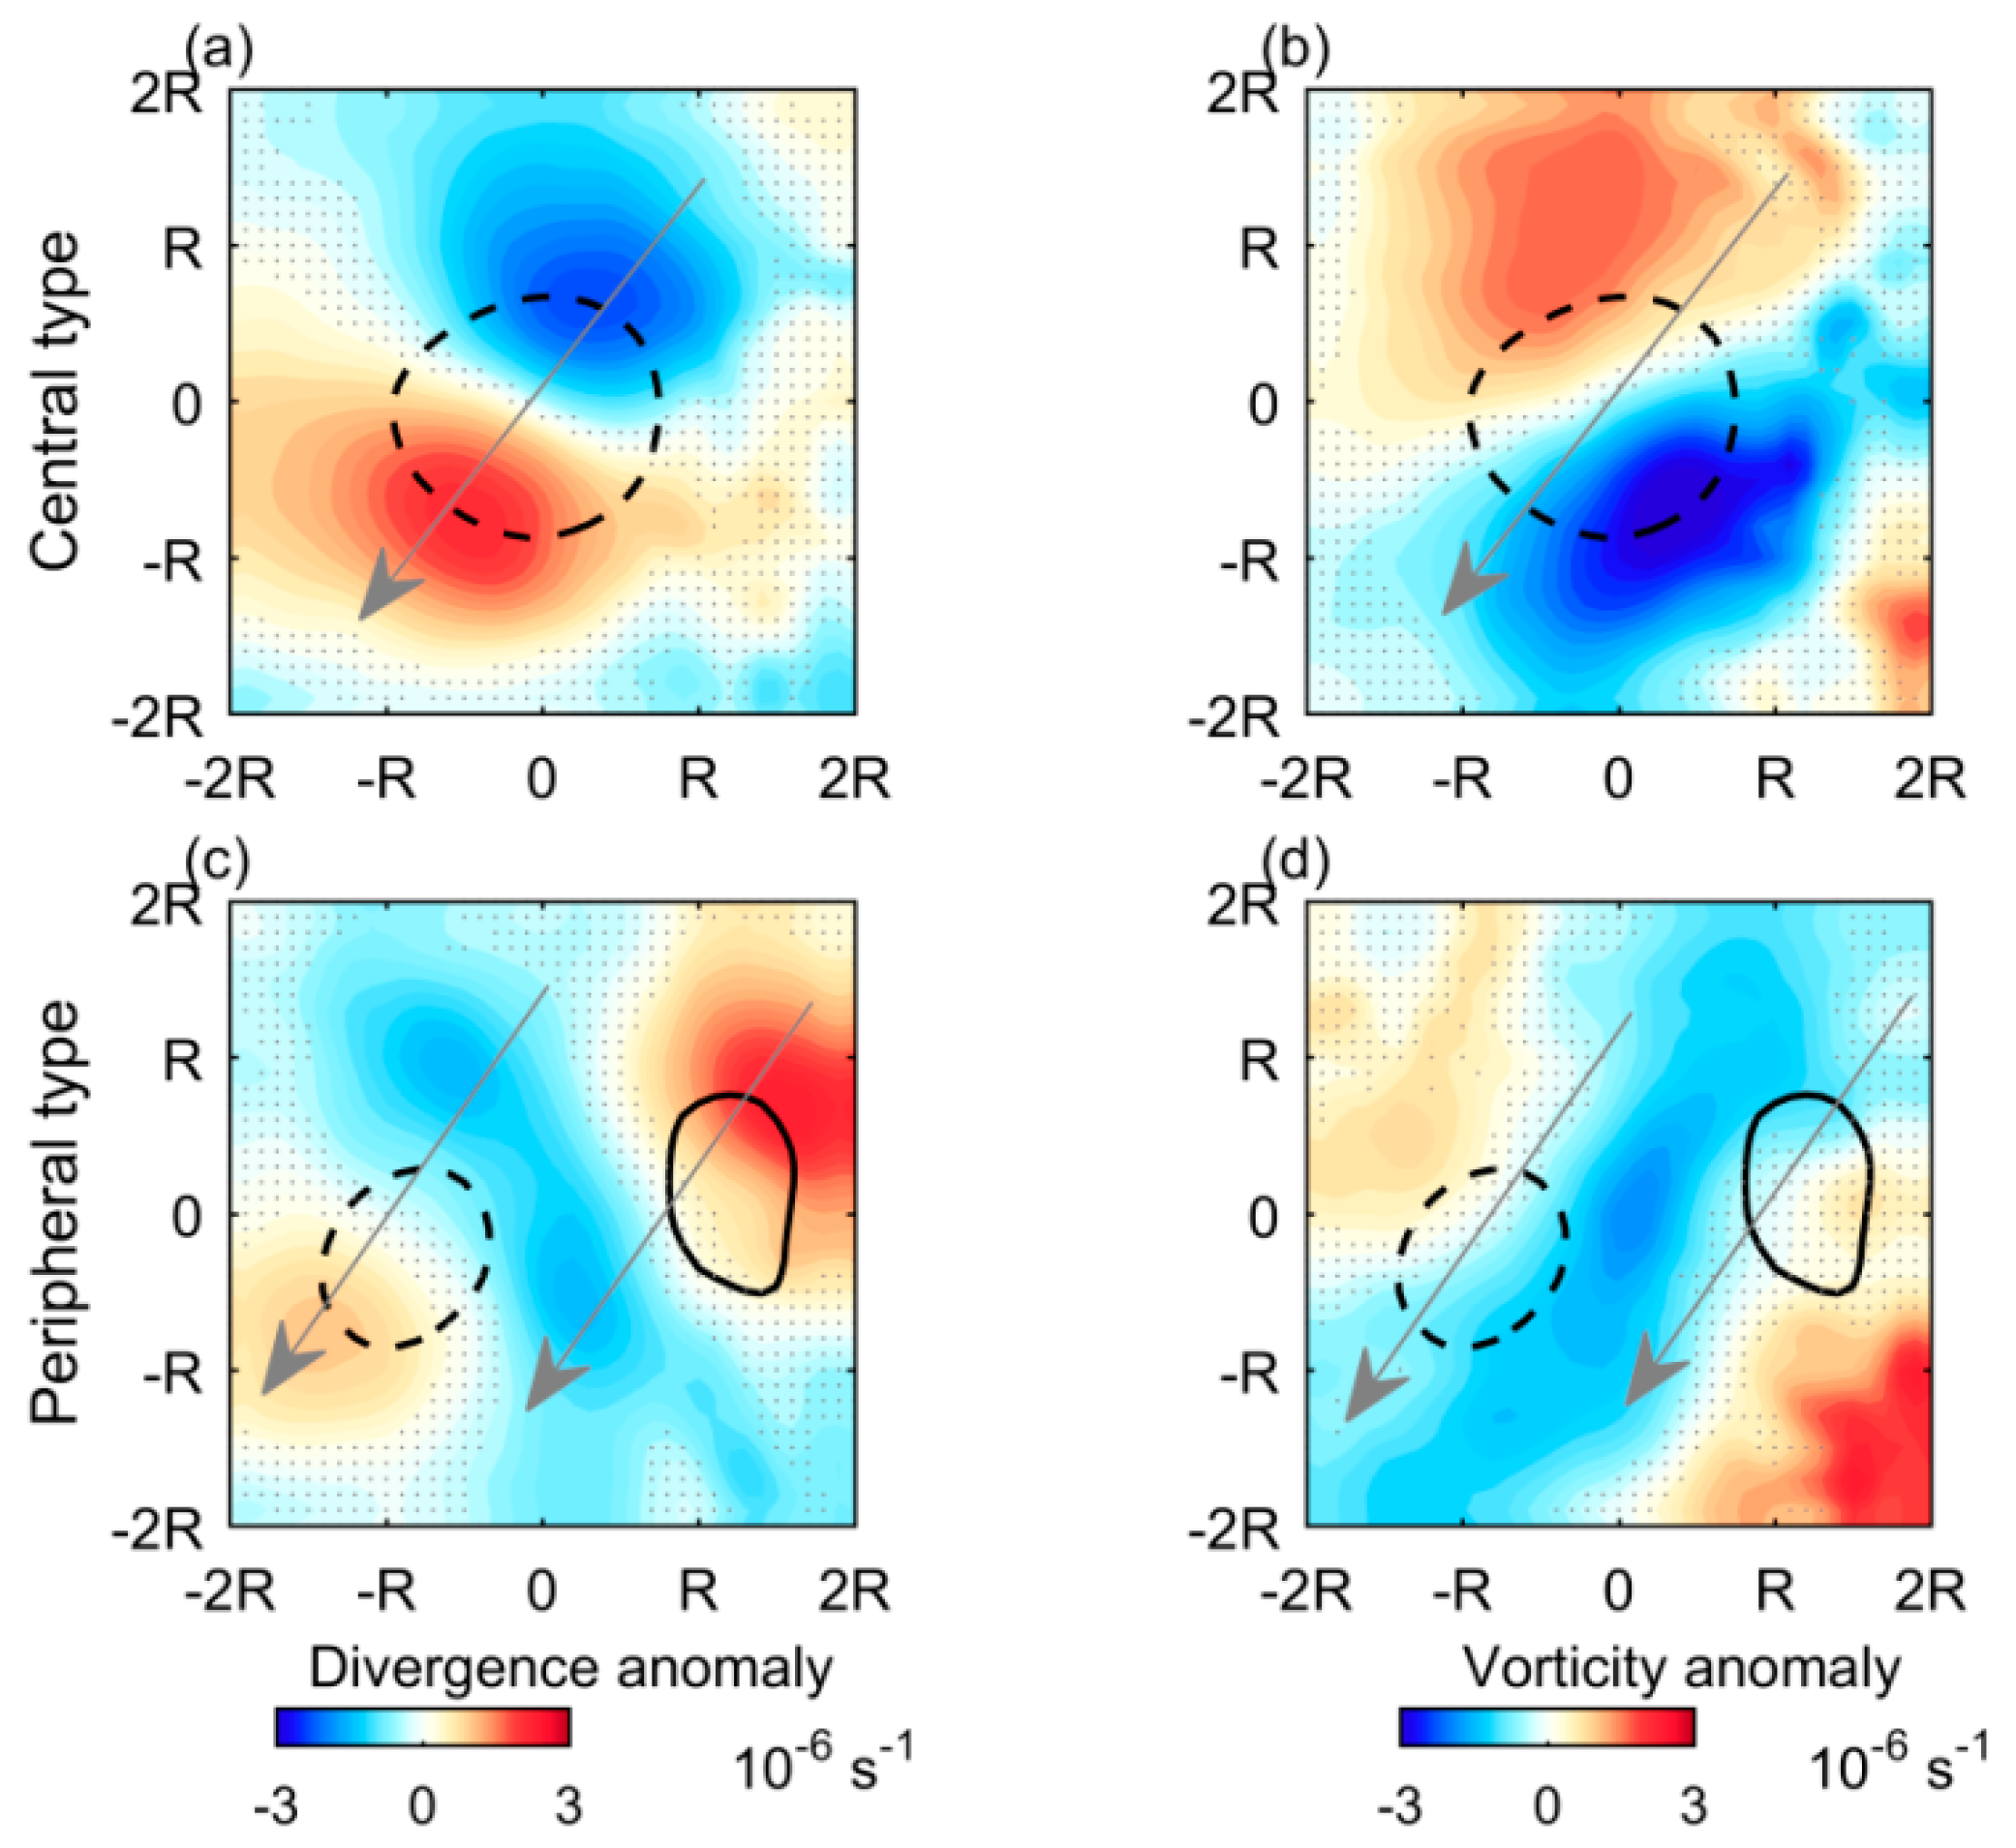
Horizontally, the effects of surface wind anomalies presented as a divergence anomaly to a downwind speed gradient and a vorticity anomaly to a crosswind speed gradient [1,3,13,55,57,58]. Under the large-scale northeast monsoon, divergence anomaly for central type LCEs was characterized by a dipole pattern. As shown in Figure 6a, an enhanced convergent center exists upstream of the cold water, which corresponds to deceleration when sea surface winds move through the eddy edge from outside to inside. In contrast, an enhanced divergent center occurs downstream of the cold water, because wind speed accelerates when the sea surface winds flow out of the eddy center. Vorticity anomalies for central type LCEs mainly mirrored the lateral variations in surface wind speed. Positive curl anomalies appear on the right side of the eddy and negative curl anomalies are present on the left side of the eddy (Figure 6b), which is a result of the prevailing northeast monsoon. The composite analyses for peripheral type LCEs (Figure 6c,d) suggested a similar dynamic process to the central type LCEs, but the spatial characteristic is more complex. Figure 6c shows, obvious convergent anomalies concentrated in a band over the eddy core (within ±R), which is sandwiched between two divergent centers. Vorticity anomalies for peripheral type LCEs (Figure 6d) are also sandwiched in the crosswind direction, induced by the surface crosswind speed gradient.
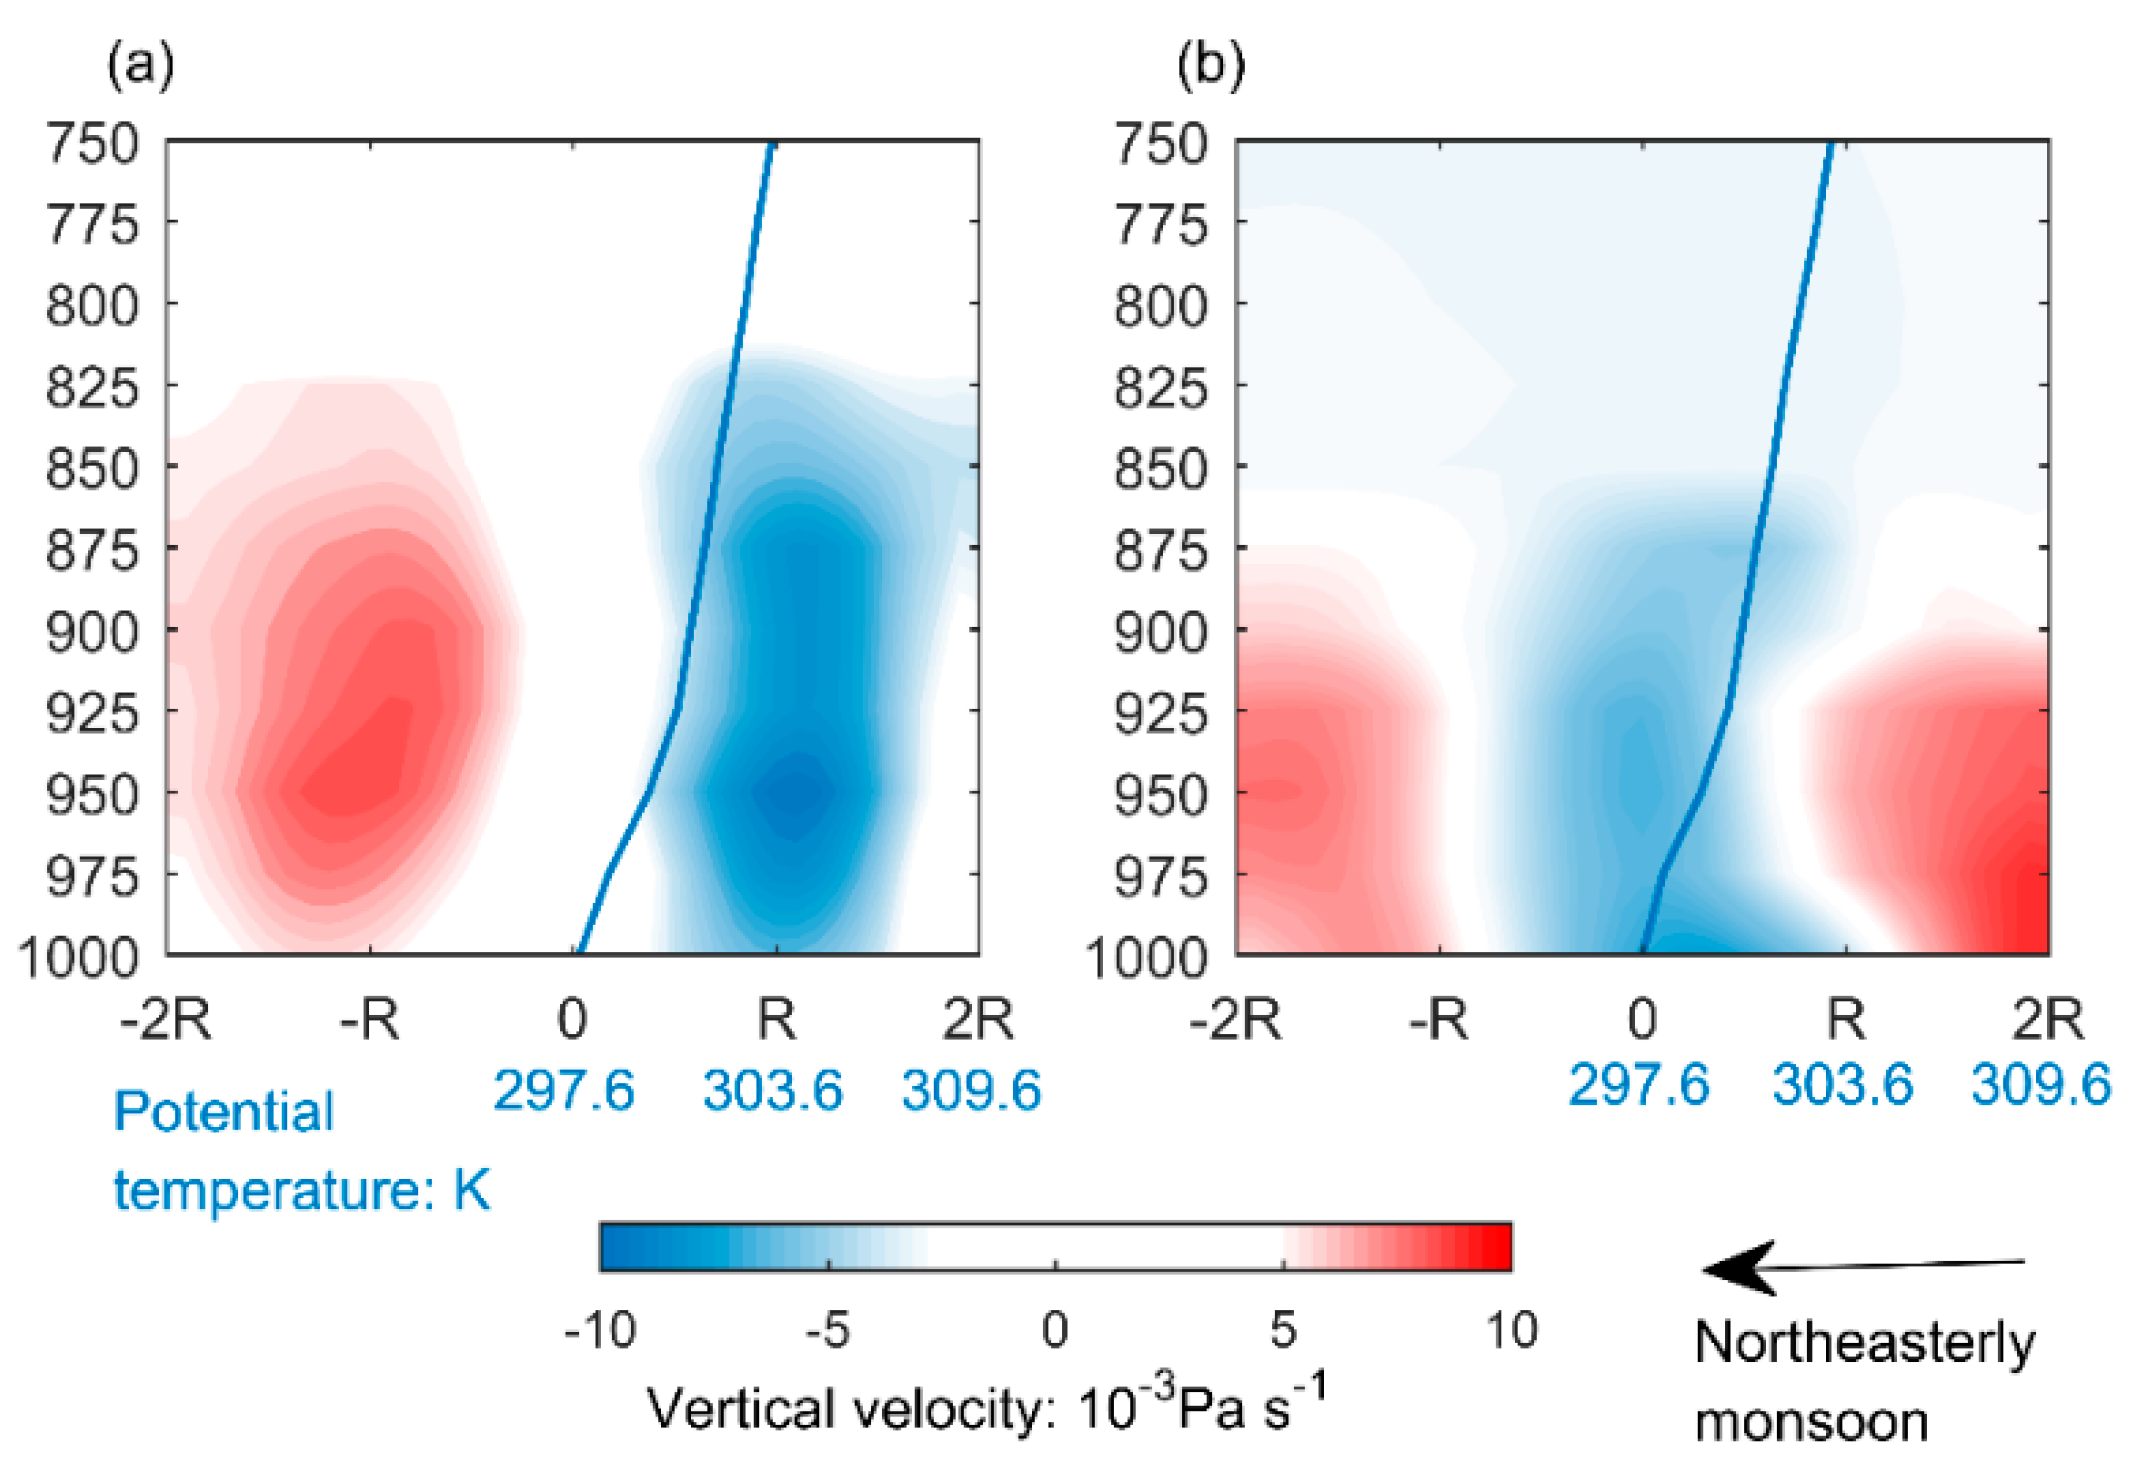
In the vertical direction, mesoscale eddies in the Kuroshio Extension have shown noticeable influence on the local circulation above the ABL [13,14]. For central type LCEs, Figure 7a shows that anomalous ascending (subsidence) appeared upstream (downstream) of the cold eddy; these are related to convergent (divergent) flow shown in Figure 6a. For peripheral type LCEs (Figure 7b), anomalous convergence developed within the eddy interior with enhanced upward motion, and anomalous divergence occurred on the edge of the eddy where downward vertical motions exist. Vertical profiles of potential temperature (Figure 7) depict a stable boundary layer over the area west of Luzon, and the planetary boundary layer height is about 925 hPa (less than 850 m). Thus, it is clear that anomalous vertical circulations associated with the central type LCEs in Figure 7a can extend over the whole boundary layer and penetrate into the free atmosphere as high as 850 hPa. Figure 7b shows that the mesoscale circulations over peripheral type LCEs is visible at a height of 875 hPa. Although the anomalous circulations found over peripheral type LCEs is lower than the central type LCEs, it can extend over the whole boundary layer as well.

3.5. Eddy-Related Cloud and Rain Rate Anomalies

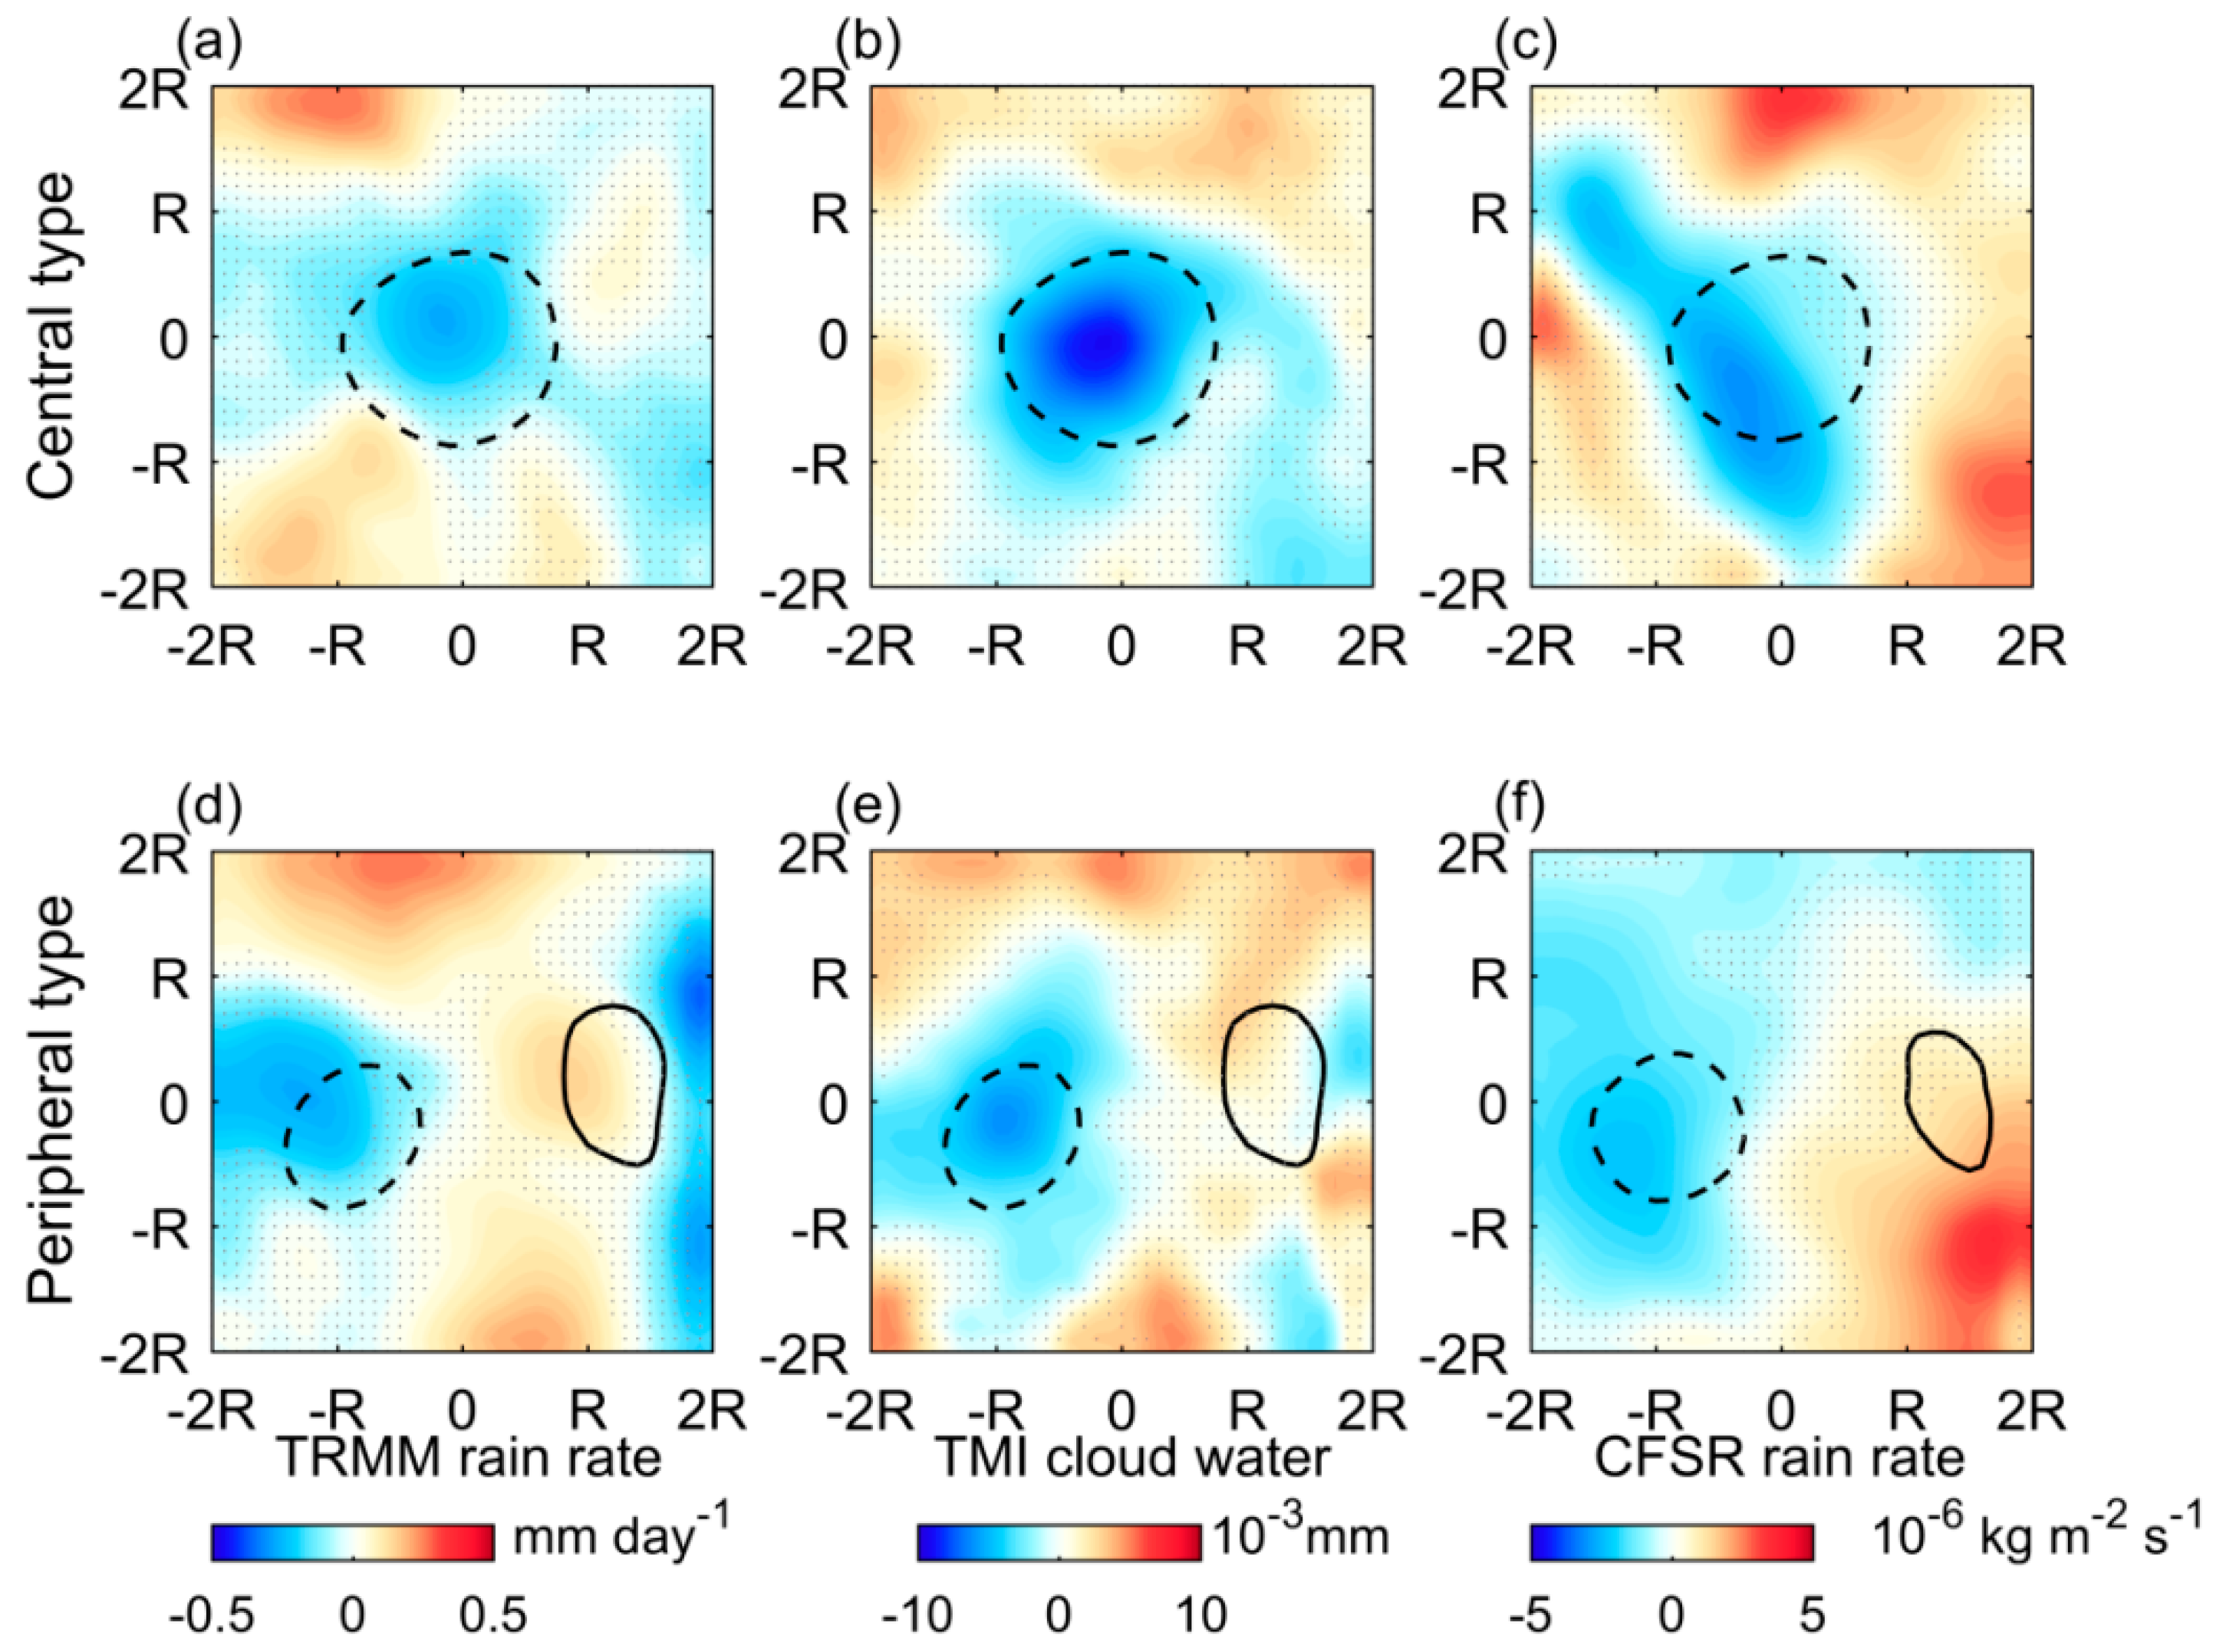
Cloud and precipitation anomalies also arise from eddy-related modifications of moisture supplies and vertical air motions. As shown in Figure 8a,d, the eddy-associated total rain rate anomalies were consistent with the SST structure of the two respective types: central-type eddies, characterized by a negative rain anomaly at the center of the eddy; and peripheral-type eddies, characterized by a negative anomaly on the eddy’s western flank and a positive anomaly on the eddy’s eastern flank. The total rain rate anomalies were nearly in-phase to SST anomalies, which points to a modification of the atmospheric stability associated with changes in turbulent heat fluxes and evaporations (as shown in Figure 3). Figure 8b,e show that eddies’ impacts on cloud liquid water were similar to the total rain rate anomalies. The convective rain rate data provided by the CFSR were applied to further illustrate atmospheric response to the LCEs outside the ABL. Comparing Figure 8c,f and Figure 8a,b, we note that the spatial patterns of eddy-related convective rain rate anomalies are similar to the total rain rate anomalies but with an obviously downstream phase shift. The local maximum convective rain rate anomalies arose on the sides of the eddy (Figure 8c,f), which were associated with the anomalous vertical motions (Figure 7) triggered by low-level wind divergence (Figure 6). For example, in the case of the central type LCEs, the anomalous divergence (Figure 6a) and downdraft (Figure 7a) at downstream of the eddy were collocated with the local minimum convective rain rate (Figure 8c). In contrast to the total rain rate, convective rain rate anomalies showed the impacts of dynamical adjustment on the local weather; further indicates that the LCEs’ impacts on the atmosphere are not limited to the surface, but outside the ABL (a schematic diagram is given in Supplementary Materials Text S4 to shown the thermodynamical and dynamical adjustment processes in eddy-related rain rate modification).

3.6. Quantitative Analyses on the Eddy-Related Atmospheric Anomalies

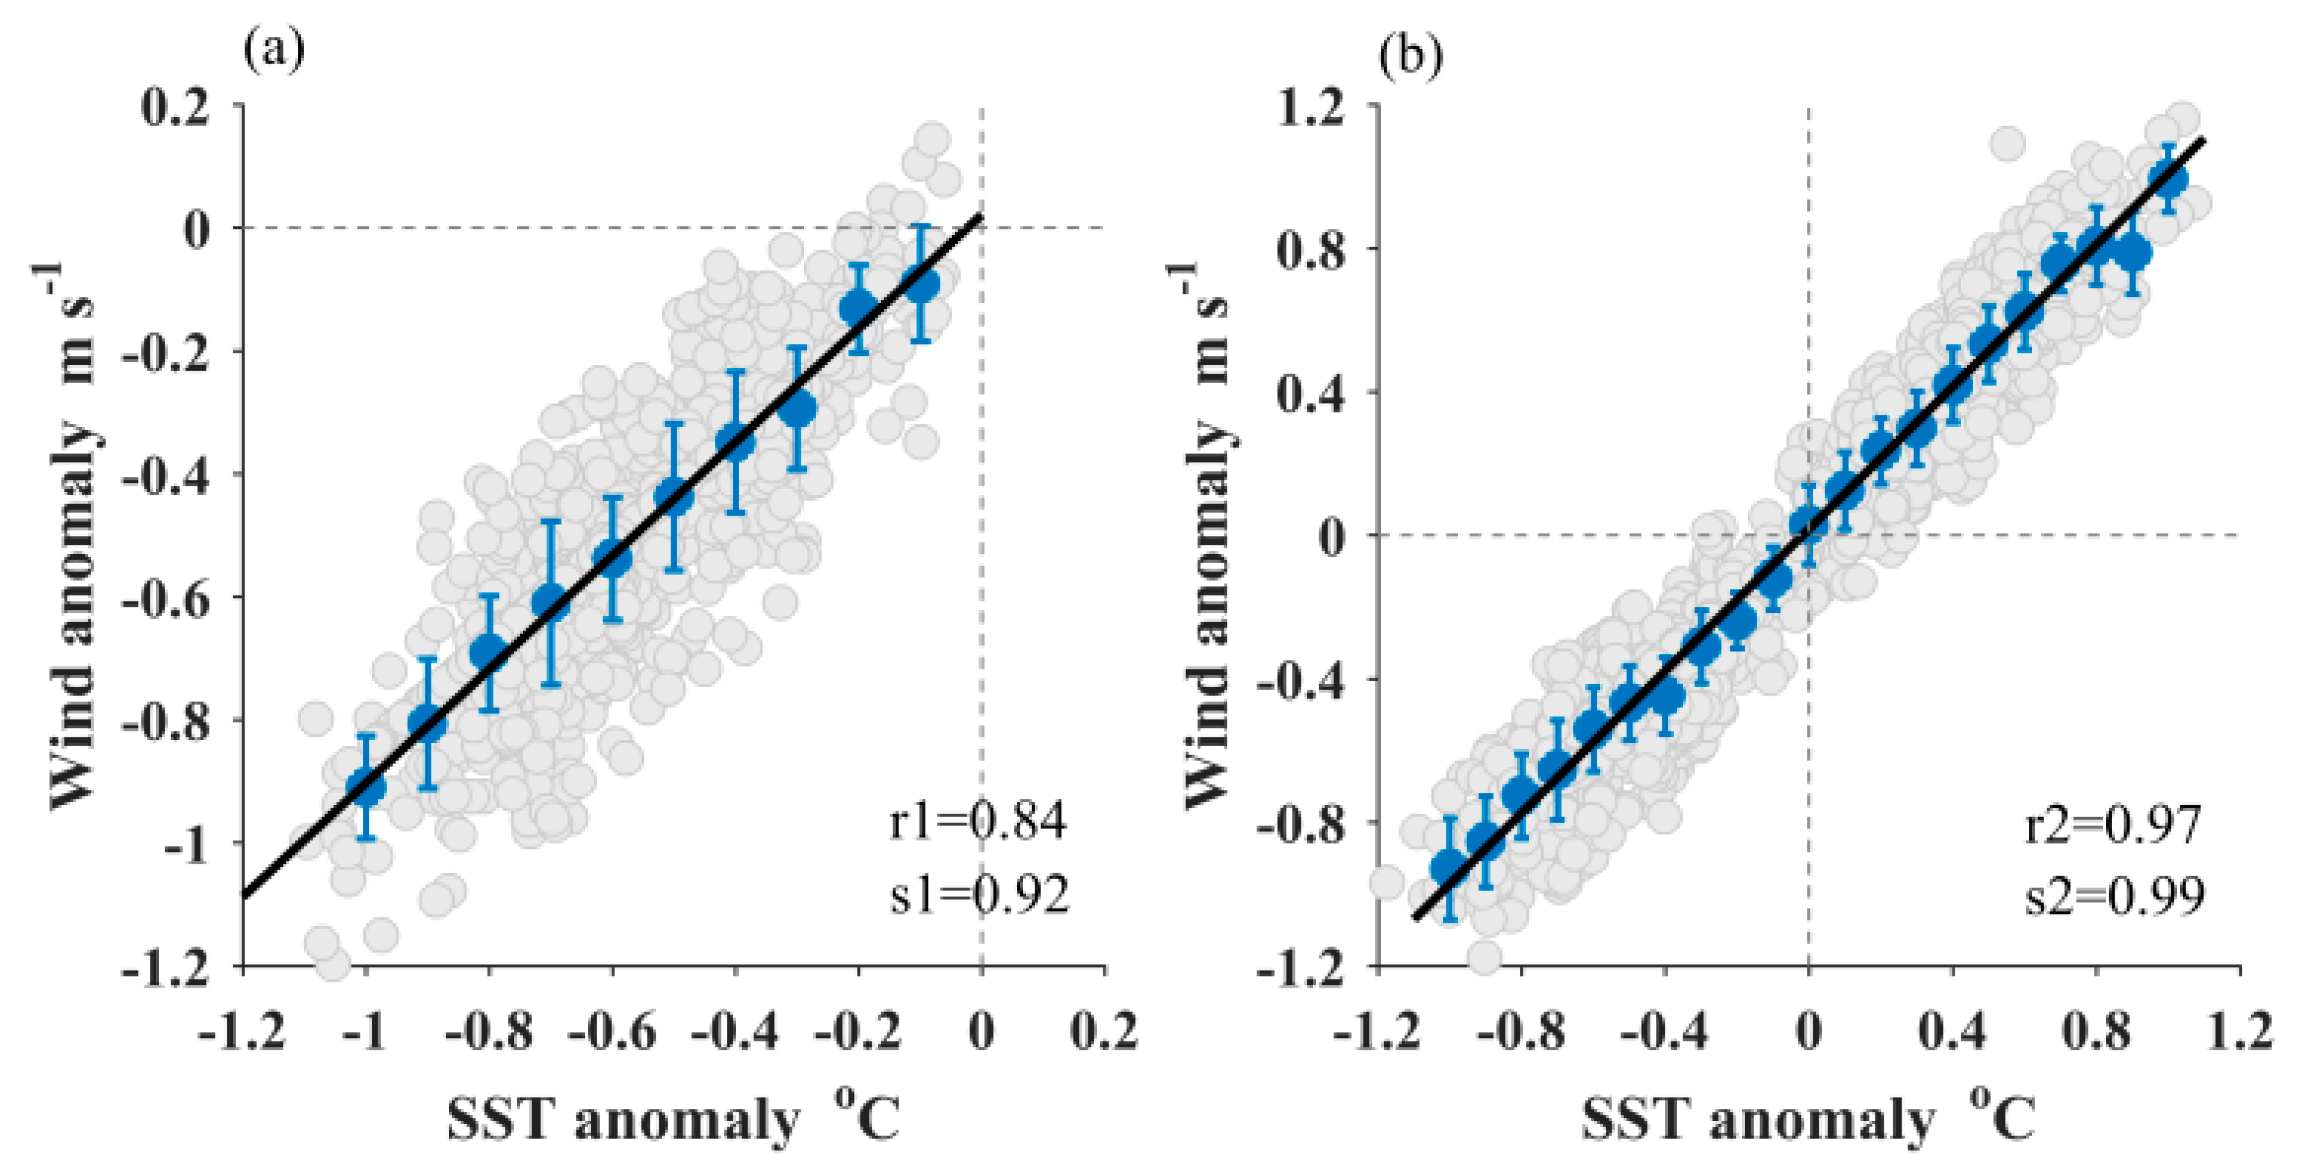
Quantitatively, the greater SST anomalies of the central type LCEs generated a mean wind anomaly (about −0.22 m s−1) larger than the peripheral type LCEs (about −0.2 and 0.17 m s−1). The eddy-related wind anomaly also appeared to scale with the SST anomaly (Figure 4c,d). This feature is more obvious in a one-to-one correlation between wind and SST anomalies in a scatter plot.
Unlike composite maps that represent the mean state of atmospheric responses, scatter plots show the daily wind response to SST anomalies for each eddy record. For central type LCEs (Figure 9a), surface wind variations had a strong positive correlation with SST anomalies. Both ranged mostly between −1.0 and −0.1 and exhibited a significant linear relationship. The synchronous changes in wind and SST were also apparent for peripheral type LCEs (Figure 9b). Wind anomalies were linearly proportional to warm and cold SST anomalies with a uniform regression coefficient of 0.99. Thus, although the origins and spatial patterns of SST anomalies for the two types of LCE are different, their linear effects on the surface wind are the same and they have similar coupling strength (linear regression coefficient). Overall, eddy-related SST anomalies might account for 10%–15% of the natural climatic variability of SST, and the subsequent SHF, LHF, evaporation rate, and wind speed anomalies might account for 7%–12%, 8%–14%, 5%–11%, and 5%–8% of the daily variance, respectively.

4. Conclusions and Discussion

Mesoscale ocean eddies are known to have substantial effects on the atmosphere in the South China Sea (SCS) [21,30]. However, it is uninformative to consider such effects based on generalized descriptions of eddies, given the marked seasonal and regional differences of the natural background. In this study, we focused on the cyclonic LCEs that cyclically occur to the west of Luzon during the winter monsoon. Based on high-resolution satellite observations and CFSR reanalysis datasets, more-refined analyses of the atmospheric responses were explored, and the major findings are summarized as follows.
First, we showed that in addition to eddy-related SST anomalies on Ekman pumping, SST perturbations induced by eddy currents play an important part in affecting the atmosphere. To explain this phenomenon, we note that the SST gradient is large to the west of Luzon during the winter, which produces a strong SST front. In this particular ocean environment, two vastly different SST anomalies are induced by LCEs. As a result, a total of 20 LCEs during 2000–2016 were divided into two types: central type LCEs and peripheral type LCEs. Anomalous SST fields for the central type LCEs revealed a monopole pattern, with cold water in the eddy center. For peripheral type LCEs, counterclockwise eddy currents met the SST front and resulted in anomalous heat advection; as a consequence, cold (warm) water was brought southward (northward) on the western (eastern) side of the eddy, forming a dipole pattern. Subsequently, heat fluxes and surface wind anomalies matched the SST structure of the two respective types. Quantitatively, 5–8% of the total daily variance of wind speed can be explained by the LCEs, and a robust linear relationship was found evident between SST and wind speed.
Second, in this study the vertical mixing mechanism that governs wind response to LCEs was examined. The nearly in-phase relationship between the wind and SST anomalies suggested that the vertical mixing mechanism is responsible for the wind anomalies. This mechanism was examined by composite maps of anomalous sea-air temperature difference, which indicated that the atmospheric stability within the ABL was modified by the LCEs. The vertical mixing mechanism was further illustrated by composite analyses on the frictional velocity fields. For central type LCEs, frictional velocity anomalies over the cold center were negative, indicating that the vertical momentum flux was suppressed over cold water. For peripheral type LCEs, frictional velocity anomalies presented as a dipole pattern which suggested that the vertical momentum flux is intensified over warm water and weakened over cold water. Thus, although the eddy-associated surface wind speed anomalies were different for the central type eddies and the peripheral type eddies, in both cases the surface wind responses had the same explanation.
Third, atmospheric responses outside the ABL according to the LCEs were verified. Eddy-related downwind and crosswind gradients of surface wind speed resulted in divergence and vorticity anomalies, respectively. Correspondingly, anomalous vertical motions arose over the LCEs. It is important to note that the anomalous vertical circulations could extend over the whole boundary layer and penetrate into the free atmosphere as high as 850 hPa. Moreover, convective-induced rain rate anomalies were coincident with the vertical velocity anomalies, which further indicated that the LCEs’ impact on the atmosphere was not limited to the surface, but outside the ABL.
This study was based on satellite observations and reanalysis data. For comparative purposes, additional case studies based on in situ observations will be conducted in the future. Moreover, further case studies with model simulations would be helpful to determine the causal relationship between atmospheric anomalies and LCEs and quantify the magnitudes of the contributions of eddies’ effects and other indirect feedback processes to the total atmospheric anomaly fields. In addition, as pointed out by Renaud et al. [59], ocean surface current may affect the atmosphere as well. However, the influence of the ocean surface vorticity associated with the LCEs on the near-surface atmospheric wind is not obvious (see Supplementary Materials Text S5). Eddy-induced atmospheric anomalies may also feedback to the LCEs. In Figure 6b, wind vorticity was positive (cyclonic) to the northwest of the central type LCEs and negative (anticyclonic) to the southeast. As a result, there will be upwelling and thus cooling on the northwest side of the eddy and the reverse on the southwestern side. This could cause the cold eddy to move northwestward, just as shown in Figure 1b. The potential mechanism for the movement of eddies is worth to be declared on the view of physical oceanography in the future.

Supplementary Materials

The following are available online at https://www.mdpi.com/2073-4433/10/5/255/s1. Figure S1: Histograms and cumulative probability (red line) of eddy radius (a) and amplitude (b) for 1521 eddy records that were used in the composite maps. Figure S2: As Figure 3c,g and Figure 3d,h, but based on IFREMER dataset. Composition of SHF anomalies and LHF anomalies based on 11 LECs during 2000 to 2009. Figure S3: As Figure 3c,g and Figure 3d,h, but based on J-OFURO dataset. Composition of SHF anomalies and LHF anomalies based on 17 LECs during 2000 to 2013. Figure S4: Same as Figure 5, but for sea level pressure (SLP) anomalies. Figure S5: Impact of Luzon cold eddies on the local rain rate. Schematic summarizing the impact of central type LCEs (left) and peripheral type LCEs (right) on the total rain rate and the convective rain rate. The total rain rate anomalies are close in phase to SST anomalies, which points to a modification of the atmospheric stability in combination with changes in turbulent heat fluxes and evaporations. The convective rain rate anomalies are 90° out of phase to SST anomalies, which points to a modification of vertical motion caused by anomalous surface wind divergence. Figure S6: Binned scatterplot of the curl of the ocean surface current against the curl of the atmospheric wind, including 1521 eddy records correspond to all 20 LCEs.

Author Contributions

Conceptualization, H.L. and W.L.; methodology, H.L. and S.C.; data curation, R.F. and Z.L.; writing—original draft preparation, H.L.; project administration, Y.W.; funding acquisition, W.L.

Funding

This work was supported by the National Natural Science Foundation of China (Grant Nos. 41675043 and 41375050).

Conflicts of Interest

The authors declare no conflict of interest.

References

  1. Chelton, D.B.; Xie, S.P. Coupled ocean-atmosphere interaction at oceanic mesoscales. Oceanography 2010, 23, 52–69. [Google Scholar] [CrossRef]
  2. Bourras, D.; Reverdin, G.; Giordani, H.; Caniaux, G. Response of the atmospheric boundary layer to a mesoscale oceanic eddy in the Northeast Atlantic. J. Geophys. Res. 2004, 109, D18114. [Google Scholar] [CrossRef]
  3. Frenger, I.; Gruber, N.; Knutti, R.; Münnich, M. Imprint of Southern Ocean eddies on winds, clouds and rainfall. Nat. Geosci. 2013, 6, 608–612. [Google Scholar] [CrossRef]
  4. Putrasahan, D.A.; Miller, A.J.; Seo, H. Isolating mesoscale coupled ocean–atmosphere interactions in the Kuroshio Extension region. Dyn. Atmos. Oceans. 2013, 63, 60–78. [Google Scholar] [CrossRef]
  5. Byrne, D.; Papritz, L.; Frenger, I.; Münnich, M.; Gruber, N. Atmospheric response to mesoscale sea surface temperature anomalies: Assessment of mechanisms and coupling strength in a high-resolution coupled model over the South Atlantic. J. Atmos. Sci. 2015, 72, 1872–1890. [Google Scholar] [CrossRef]
  6. Nonaka, M.; Xie, S.P. Covariations of sea surface temperature and wind over the Kuroshio and its extension: Evidence for ocean-to-atmosphere feedback. J. Clim. 2003, 16, 1404–1413. [Google Scholar] [CrossRef]
  7. Chelton, D.B. Satellite measurements reveal persistent small-scale features in ocean winds. Science 2004, 303, 978–983. [Google Scholar] [CrossRef]
  8. O’Neill, L.W. Wind speed and stability effects on coupling between surface wind stress and SST observed from buoys and satellite. J. Climate. 2012, 2, 1544–1569. [Google Scholar] [CrossRef]
  9. Park, K.A.; Cornillon, P.; Codiga, D.L. Modification of surface winds near ocean fronts: Effects of Gulf Stream rings on scatterometer (QuikSCAT, NSCAT) wind observations. J. Geophys. Res. 2006, 111. [Google Scholar] [CrossRef] [Green Version]
  10. Spall, M.A. Midlatitude wind stress–sea surface temperature coupling in the vicinity of oceanic fronts. J. Clim. 2007, 20, 3785–3801. [Google Scholar] [CrossRef]
  11. Small, R.J.; deSzoeke, S.P.; Xie, S.P.; O’Neill, L.; Seo, H.; Song, Q.; Cornillon, P.; Spall, M.; Minobe, S. Air-sea interaction over ocean fronts and eddies. Dyn. Atmos. Oceans. 2008, 45, 274–319. [Google Scholar] [CrossRef]
  12. Chelton, D. Ocean-atmosphere coupling: Mesoscale eddy effects. Nat. Geosci. 2013, 6, 594–595. [Google Scholar] [CrossRef]
  13. Ma, J.; Xu, H.M.; Dong, C.M.; Lin, P.F.; Liu, Y. Atmospheric responses to oceanic eddies in the Kuroshio Extension region. J. Geophys. Res. 2015, 120, 6313–6330. [Google Scholar] [CrossRef] [Green Version]
  14. Chen, L.J.; Jia, Y.L.; Liu, Q.Y. Oceanic eddy-driven atmospheric secondary circulation in the winter Kuroshio Extension region. J. Oceanogr. 2017, 73, 295–307. [Google Scholar] [CrossRef]
  15. Wang, Y.H.; Liu, W.T. Observational evidence of frontal-scale atmospheric responses to Kuroshio extension variability. J. Clim. 2015, 28, 9459–9472. [Google Scholar] [CrossRef]
  16. Leyba, I.M.; Saraceno, M.; Solman, S.A. Air-sea heat fluxes associated to mesoscale eddies in the southwestern Atlantic Ocean and their dependence on different regional conditions. Clim. Dyn. 2016, 49, 2491–2501. [Google Scholar] [CrossRef]
  17. Ma, J.; Xu, H.M.; Dong, C.M. Seasonal variations in atmospheric responses to oceanic eddies in the Kuroshio Extension. Tellus A. Dyn. Meteorol. Oceanogr. 2016, 68. [Google Scholar] [CrossRef]
  18. Wang, G.H.; Su, J.L.; Chu, P.C. Mesoscale eddies in the South China Sea observed with altimeter data. Geophys. Res. Lett. 2003, 30, 2121. [Google Scholar] [CrossRef]
  19. Zhang, Z.; Tian, J.; Qiu, B.; Zhao, W.; Chang, P.; Wu, D.X.; Wan, X.Q. Observed 3D structure, generation, and dissipation of oceanic mesoscale eddies in the South China Sea. Sci. Rep. 2016, 6, 24349. [Google Scholar] [CrossRef] [PubMed]
  20. Zhuang, W.; Du, Y.; Wang, D.X.; Xie, Q.; Xie, S.P. Pathways of mesoscale variability in the South China Sea. Chin. J. Oceanol. Limnol. 2010, 28, 1055–1067. [Google Scholar] [CrossRef] [Green Version]
  21. Sun, S.W.; Fang, Y.; Liu, B.C.; Tana. Coupling between SST and wind speed over mesoscale eddies in the South China Sea. Ocean Dyn. 2016, 66, 1467–1474. [Google Scholar] [CrossRef]
  22. Yang, H.; Liu, Q. Forced Rossby wave in the northern South China Sea. Deep Sea Res. Part I 2003, 50, 917–926. [Google Scholar] [CrossRef]
  23. Wang, G.; Chen, D.; Su, J. Winter eddy genesis in the eastern South China Sea due to orographic wind jets. J. Phys. Oceanogr. 2008, 38, 726–732. [Google Scholar] [CrossRef]
  24. Metzger, E.J. Upper ocean sensitivity to wind forcing in the South China Sea. J. Oceanogr. 2003, 59, 783–798. [Google Scholar] [CrossRef]
  25. Sun, C.X.; Liu, Q.Y. Double eddy structure of the winter Luzon cold eddy based on satellite altimeter data. J. Trop. Oceanogr. 2011, 30, 9–15. [Google Scholar]
  26. Qu, T. Upper-layer circulation in the South China Sea. J. Phys. Oceanogr. 2000, 30, 1450–1460. [Google Scholar] [CrossRef]
  27. Chu, P.C.; Fan, C. Low salinity, cool-core cyclonic eddy detected northwest of Luzon during the South China Sea monsoon experiment (scsmex) in July 1998. J. Oceanogr. 2001, 57, 549–563. [Google Scholar] [CrossRef]
  28. Shaw, P.T.; Chao, S.Y.; Liu, K.K.; Pai, S.C.; Liu, C.T. Winter upwelling off Luzon in the northeastern South China Sea. J. Geophys. Res. 1996, 101, 16435–16448. [Google Scholar] [CrossRef]
  29. He, Y.; Cai, S.; Wang, D.; He, J. A model study of Luzon cold eddies in the northern South China Sea. Deep Sea Res. Part I. 2015, 97, 107–123. [Google Scholar] [CrossRef] [Green Version]
  30. Liu, H.; Li, W.; Chen, S.; Fang, R.; Li, Z. Atmospheric response to mesoscale ocean eddies over the South China Sea. Adv. Atmos. Sci. 2018, 35, 1189–1204. [Google Scholar] [CrossRef]
  31. Du, Y.Y.; Wu, D.; Liang, F.Y.; Yi, J.W.; Mo, Y.; He, Z.G.; Pei, T. Major migration corridors of mesoscale ocean eddies in the South China Sea from 1992 to 2012. J. Mar. Syst. 2016, 158, 173–181. [Google Scholar] [CrossRef] [Green Version]
  32. Chen, G.; Gan, J.; Xie, Q.; Chu, X.; Wang, D.; Hou, Y. Eddy heat and salt transports in the South China Sea and their seasonal modulations. J. Geophys. Res. 2012. [Google Scholar] [CrossRef]
  33. Abel, R.; Böning, C.W.; Greatbatch, R.J.; Hewitt, H.T.; Roberts, M.J. Feedback of mesoscale ocean currents on atmospheric winds in high-resolution coupled models and implications for the forcing of ocean-only models. Ocean Sci. Discuss. 2017, 1–22. [Google Scholar] [CrossRef] [Green Version]
  34. Gaube, P.; Chelton, D.B.; Samelson, R.M.; Schlax, M.G.; O’Neill, L.W. Satellite observations of mesoscale eddy-induced Ekman pumping. J. Phys. Oceanogr. 2015, 45, 104–132. [Google Scholar] [CrossRef]
  35. Chow, C.H.; Liu, Q.Y. Eddy effects on sea surface temperature and sea surface wind in the continental slope region of the northern South China Sea. Geophys. Res. Lett. 2012, 39, L02601. [Google Scholar] [CrossRef]
  36. Hayes, S.P.; McPhaden, M.J.; Wallace, J.M. The influence of sea-surface temperature on surface wind in the eastern equatorial Pacific: Weekly to monthly variability. J. Clim. 1989, 2, 1500–1506. [Google Scholar] [CrossRef]
  37. Wallace, J.M.; Mitchell, T.P.; Deser, C. The influence of sea-surface temperature on surface wind in the eastern equatorial Pacific: Seasonal and interannual variability. J. Clim. 1989, 2, 1492–1499. [Google Scholar] [CrossRef]
  38. Lindzen, R.S.; Nigam, S. On the role of sea surface temperature gradients in forcing low-level winds and convergence in the tropics. J. Atmos. Sci. 1987, 44, 2418–2436. [Google Scholar] [CrossRef]
  39. Mesoscale Eddies in Altimeter Observations of SSH. Available online: http://wombat.coas.oregonstate.edu/eddies/ (accessed on 4 October 2018).
  40. Williams, S.; Petersen, M.; Bremer, P.T.; Hecht, M.; Pascucci, V.; Ahrens, J.; Hlawitschka, M.; Hamann, B. Adaptive extraction and quantification of geophysical vortices. IEEE T. Vis. Comput. Gr. 2011, 17, 2088–2095. [Google Scholar] [CrossRef]
  41. Aviso global sea surface height products. Available online: https://www.aviso.altimetry.fr/en/data/products/sea-surface-height-products/global.html (accessed on 25 November 2018).
  42. The optimally interpolated SST (OI_SST) product. Available online: http://data.remss.com/SST/daily/ (accessed on 25 November 2018).
  43. Zhang, H.M.; Bates, J.J.; Reynolds, R.W. Assessment of composite global sampling: Sea surface wind speed. Geophys. Res. Lett. 2006, 33, L17714. [Google Scholar] [CrossRef]
  44. Blended Ocean Surface Vector Winds Distributed by the National Centers for Environmental Information of the NOAA. Available online: http://www.ncdc.noaa.gov/data-access/marineocean-data/blended-global/blended-sea-winds (accessed on 2 October 2018).
  45. Rain Rate Dataset Obtained from TRMM 3b42. Available online: https://doi.org/10.5067/TRMM/TMPA/3H/7 (accessed on 26 November 2018).
  46. Three-day Mean Cloud Liquid Water Dataset from the TMI Released by RSS (TMI v7.1). Available online: http://www.remss.com (accessed on 25 November 2018).
  47. Saha, S.; Moorthi, S.; Pan, H.L.; Wu, X.; Wang, J.; Nadiga, S.; Tripp, P.; Kistler, R.; Woollen, J.; Behringer, D.; et al. The NCEP climate forecast system reanalysis. Bull. Am. Meteorol. Soc. 2010, 91, 1015–1057. [Google Scholar] [CrossRef]
  48. Wen, C.; Xue, Y.; Kumar, A. Ocean-atmosphere characteristics of tropical instability waves simulated in the NCEP Climate Forecast System Reanalysis. J. Clim. 2012, 25, 6409–6425. [Google Scholar] [CrossRef]
  49. The CFSR Reanalysis Data. Available online: https://rda.ucar.edu/datasets/ds093.0/ (accessed on 24 August 2018).
  50. Cleveland, W.S. Robust locally weighted regression and smoothing scatterplots. J. Am. Stat. Assoc. 1979, 74, 829–836. [Google Scholar] [CrossRef]
  51. Hausmann, U.; Czaja, A. The observed signature of mesoscale eddies in sea surface temperature and the associated heat transport. Deep Sea Res. 2012, 70, 60–72. [Google Scholar] [CrossRef]
  52. Chen, G.; Hou, Y.; Chu, X.; Qi, P.; Hu, P. The variability of eddy kinetic energy in the South China Sea deduced from satellite altimeter data. Chin. J. Oceanol. Limnol. 2009, 27, 943–954. [Google Scholar] [CrossRef]
  53. Wang, C.; Wang, W.; Wang, D.; Wang, Q. Interannual variability of the South China Sea associated with El Nino. J. Geophys. Res. 2006, 111, C0323. [Google Scholar] [CrossRef]
  54. Song, Q.; Chelton, D.B.; Esbensen, S.K.; Thum, N.; O’Neill, L.W. Coupling between sea surface temperature and low-level winds in mesoscale numerical models. J. Clim. 2009, 22, 146–164. [Google Scholar] [CrossRef]
  55. O’Neill, L.W.; Chelton, D.B.; Esbensen, S.K. The effects of SST-induced surface wind speed and direction gradients on midlatitude surface vorticity and divergence. J. Clim. 2010, 23, 255–281. [Google Scholar] [CrossRef]
  56. Xu, Q.Q.; Xu, H.M.; Ma, J. Air-sea relationship associated with mesoscale oceanic eddies over the subtropical North Pacific in summer. Chin. J. Atmos. Sci. 2001, 42, 1191–1207. (In Chinese) [Google Scholar]
  57. O’Neill, L.W.; Chelton, D.B.; Esbensen, S.K. Observations of SST-induced perturbations of the wind stress field over the Southern Ocean on seasonal timescales. J. Clim. 2003, 16, 2340–2354. [Google Scholar] [CrossRef]
  58. Lambaerts, J.; Lapeyre, G.; Plougonven, R.; Klein, P. Atmospheric response to sea surface temperature mesoscale structures. J. Geophys. Res. 2013, 118, 9611–9621. [Google Scholar] [CrossRef] [Green Version]
  59. Renault, L.; Molemaker, M.J.; Mcwilliams, J.C.; Shchepetkin, A.; Florian, L.; Chelton, D.; Illig, S.; Hall, A. Modulation of wind-work by oceanic current interaction with the atmosphere. J. Phys. Oceanogr. 2016, 46, 1685–1704. [Google Scholar] [CrossRef]
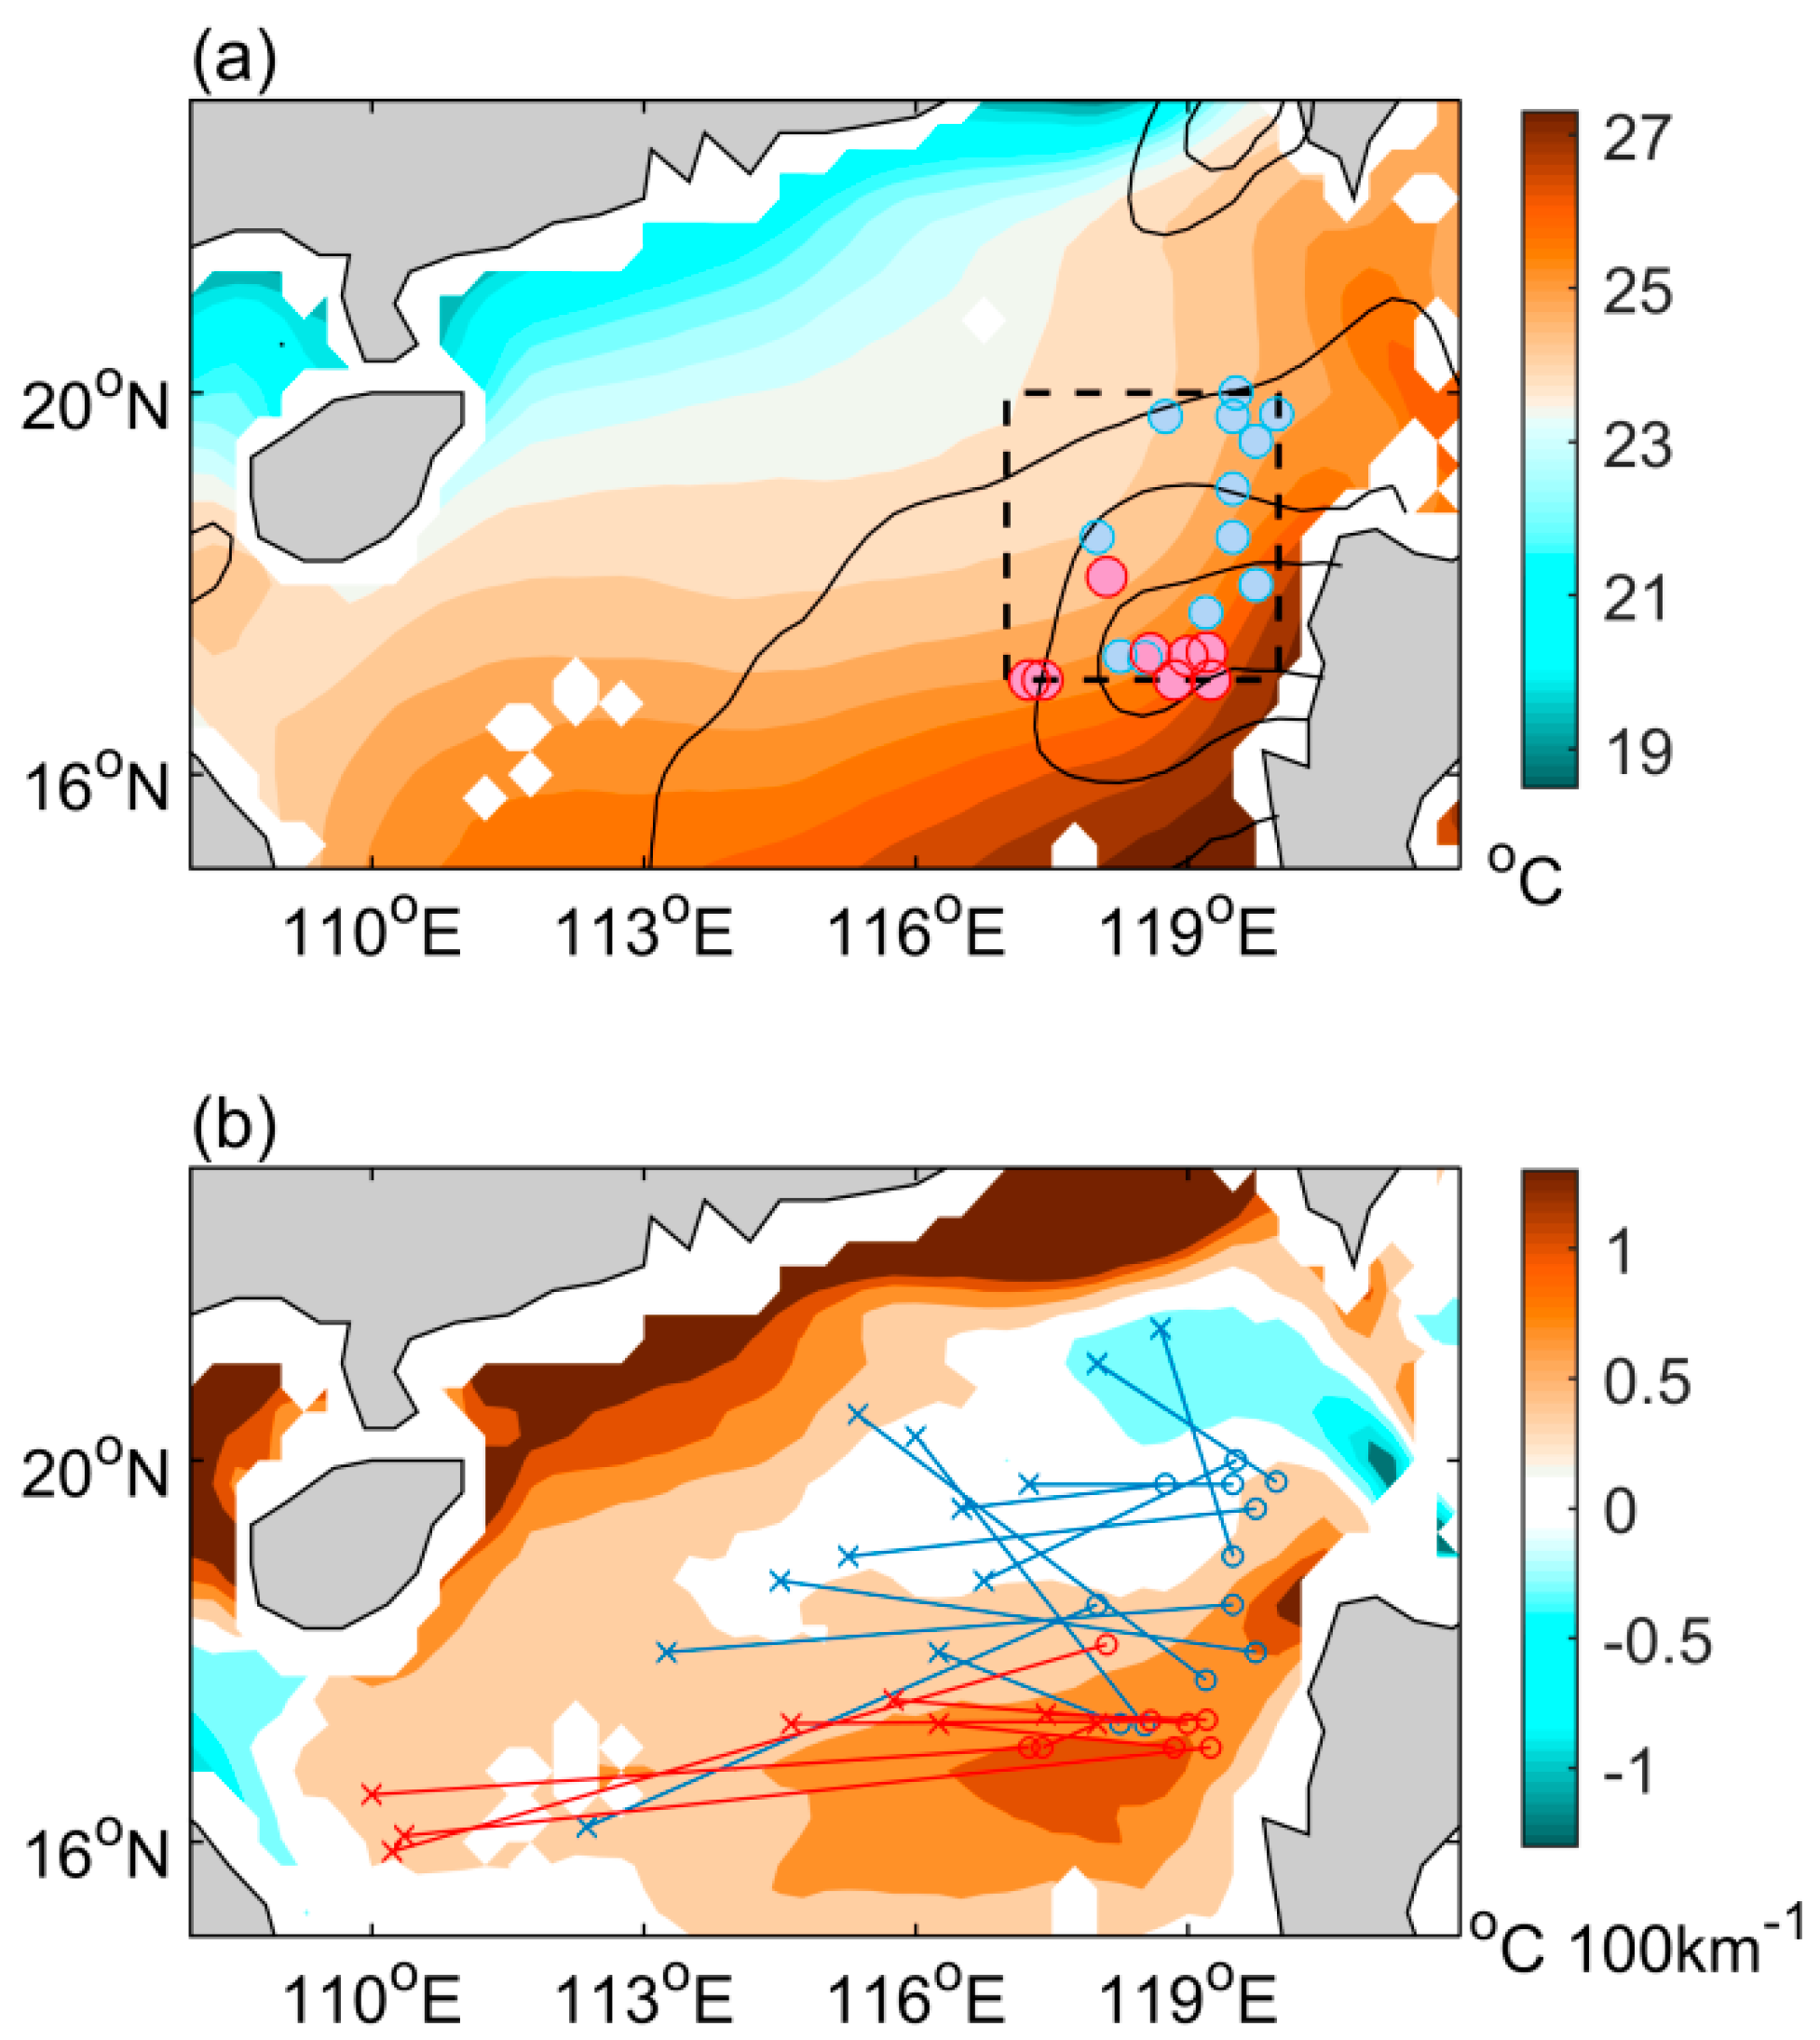
Figure 1. Dec–Jan–Feb climatology of (a) sea surface temperature (SST) (colors: °C) along with positive wind stress curl (contours: 2 × 10⁻⁷ N m−3 contour interval; outermost contour for 2 × 10⁻⁷ N m−3) and (b) meridional SST gradient (colors: °C 100 km−1) in the north South China Sea, averaged for 2000–2016. The rectangular box in (a) denotes the eddy generation region and the circles mark the Luzon cold eddy (LCE) points of origin (blue circles: central type LCEs, red circles: peripheral type LCEs). Solid lines in (b) denote the tracks of the LCEs, starting at a circle and ending at a cross (blue lines: central type LCEs, red lines: peripheral type LCEs).
Atmosphere 10 00255 g001
Figure 2. Composition of sea level anomaly (SLA) (contours: isolines of −6 and −12 cm) together with SST anomalies (colors: °C) for (a) central type LCEs and (b) peripheral type LCEs. Overall, 1521 eddy records with amplitude >4 cm were used in the composite maps, which correspond to 12 central type LCEs (comprising 840 eddy records) and 8 peripheral type LCEs (comprising 681 eddy records). Averaged anomaly fields were measured in eddy-radius normalized coordinates. The x-axis represents the normalized distance between the eddy center and twice the eddy radius (2R) from west (−2R) to east (2R). The y-axis represents the distance from north (2R) to south (−2R). Areas without dots are significantly different from zero at the 99% confidence level based on a t-test.
Atmosphere 10 00255 g002
Figure 3. Composition of SST anomalies (contours: dashed lines for −0.23 °C, solid lines for 0.23 °C) together with (a,e) sea–air temperature difference anomalies (SST minus air temperature at 2-m height, colors: °C), (b,f) evaporation rate anomalies (colors: cm year−1), (c,g) sensible heat flux anomalies (colors: W m−2; positive upward), and (d,h) latent heat flux anomalies (colors: W m−2; positive upward): (a–d) central type LCEs; (e–h) peripheral type LCEs. Areas without dots are significantly different from zero at the 99% confidence level based on a t-test.
Atmosphere 10 00255 g003
Figure 4. Composition of surface wind speed anomalies (colors: m s−1) for (a) central type LCEs and (b) peripheral type LCEs together with SST anomalies (contours: dashed lines for −0.23 °C, solid lines for 0.23 °C). (c,d) Zonal section of composite SST (blue lines) and wind (red lines) anomalies across an eddy core (meridional average between −0.5R and 0.5R) for (c) central type LCEs and (d) peripheral type LCEs, with ±1 standard deviation of the mean (shading). Areas without dots in (a) and (b) are significantly different from zero at the 99% confidence level based on a t-test.
Atmosphere 10 00255 g004
Figure 5. Composition of Climate Forecast System Reanalysis (CFSR) frictional velocity anomalies for (a) central type LCEs and (b) peripheral type LCEs together with SST anomalies (contours: dashed lines for −0.23 °C, solid lines for 0.23 °C). A total of 14 LECs from 2000–2010 (comprising 568 eddy records for central type LCEs and 431 eddy records for peripheral type LCEs) are included.
Atmosphere 10 00255 g005
Figure 6. Composition of (a,c) divergence anomalies (colors: 10−6 s−1) and (b,d) vorticity anomalies (colors: 10−6 s−1) for (a,b) central type LCEs; (c,d) peripheral type LCEs. Gray arrows denote the prevailing northeasterly monsoon. Areas without dots are significantly different from zero at the 99% confidence level based on a t-test.
Atmosphere 10 00255 g006
Figure 7. Cross section of composite CFSR vertical velocity anomalies (colors: 10−3 Pa s−1) along the ambient northeasterly monsoon (gray arrow in Figure 6a) for (a) central type LCEs and (b) peripheral type LCEs. Vertical profiles of potential temperature at the eddy centers are also plotted (blue lines: K). All values shown are significantly different from zero at the 99% confidence level based on a t-test.
Atmosphere 10 00255 g007
Figure 8. Composition of (a,d) Tropical Rainfall Measuring Mission (TRMM) rain rate anomalies (colors: mm day−1), (b,e) TMI cloud liquid water content (colors: 10−3 mm) and (c,f) CFSR convective rain rate (colors: 10−6 kg m−2 s−1) together with SST anomalies (contours: °C); (a–c) for central type LCEs; (d–f) for peripheral type LCEs. Note that the 20 LCEs studied during 2000–2016 (comprising 840 eddy records for central type LCEs and 681 eddy records for peripheral type LCEs) are included in (a,b,d,e); 14 LCEs during 2000–2010 (comprising 568 eddy records for central type LCEs and 431 eddy records for peripheral type LCEs) are included in (c,f). Areas without dots are significantly different from zero at the 99% confidence level based on a t-test.
Atmosphere 10 00255 g008
Figure 9. Scatterplots of prefiltered daily mean surface wind speed anomaly (m s−1) versus SST anomaly (°C) for (a) central type LCEs (840 eddy records used in Figure 2a) and (b) peripheral type LCEs (681 eddy records used in Figure 2b). Wind anomalies binned into 0.1 °C SST intervals (blue dots) with error bars of ±1 standard deviation. Straight lines were derived by least squares fitted to the unbinned individuals. The correlation coefficients (r1, r2) and coupling strengths (s1 and s2, implied by the slope of the straight lines) between SST and wind anomalies are annotated in each panel. All correlation and regression coefficients shown are significant at the 99% confidence level, on the basis of a t-test and a F-test, respectively.
Atmosphere 10 00255 g009